Endurance Specialty Holdings Ltd
Endurance Specialty — Q4 2008 Earnings Presentation
32 slides from Endurance Specialty's earnings presentation, Feb 17, 2009
Slide 1: Endurance Specialty Holdings Ltd. 4th Quarter 2008
Endurance Specialty Holdings Ltd. 4th Quarter 2008
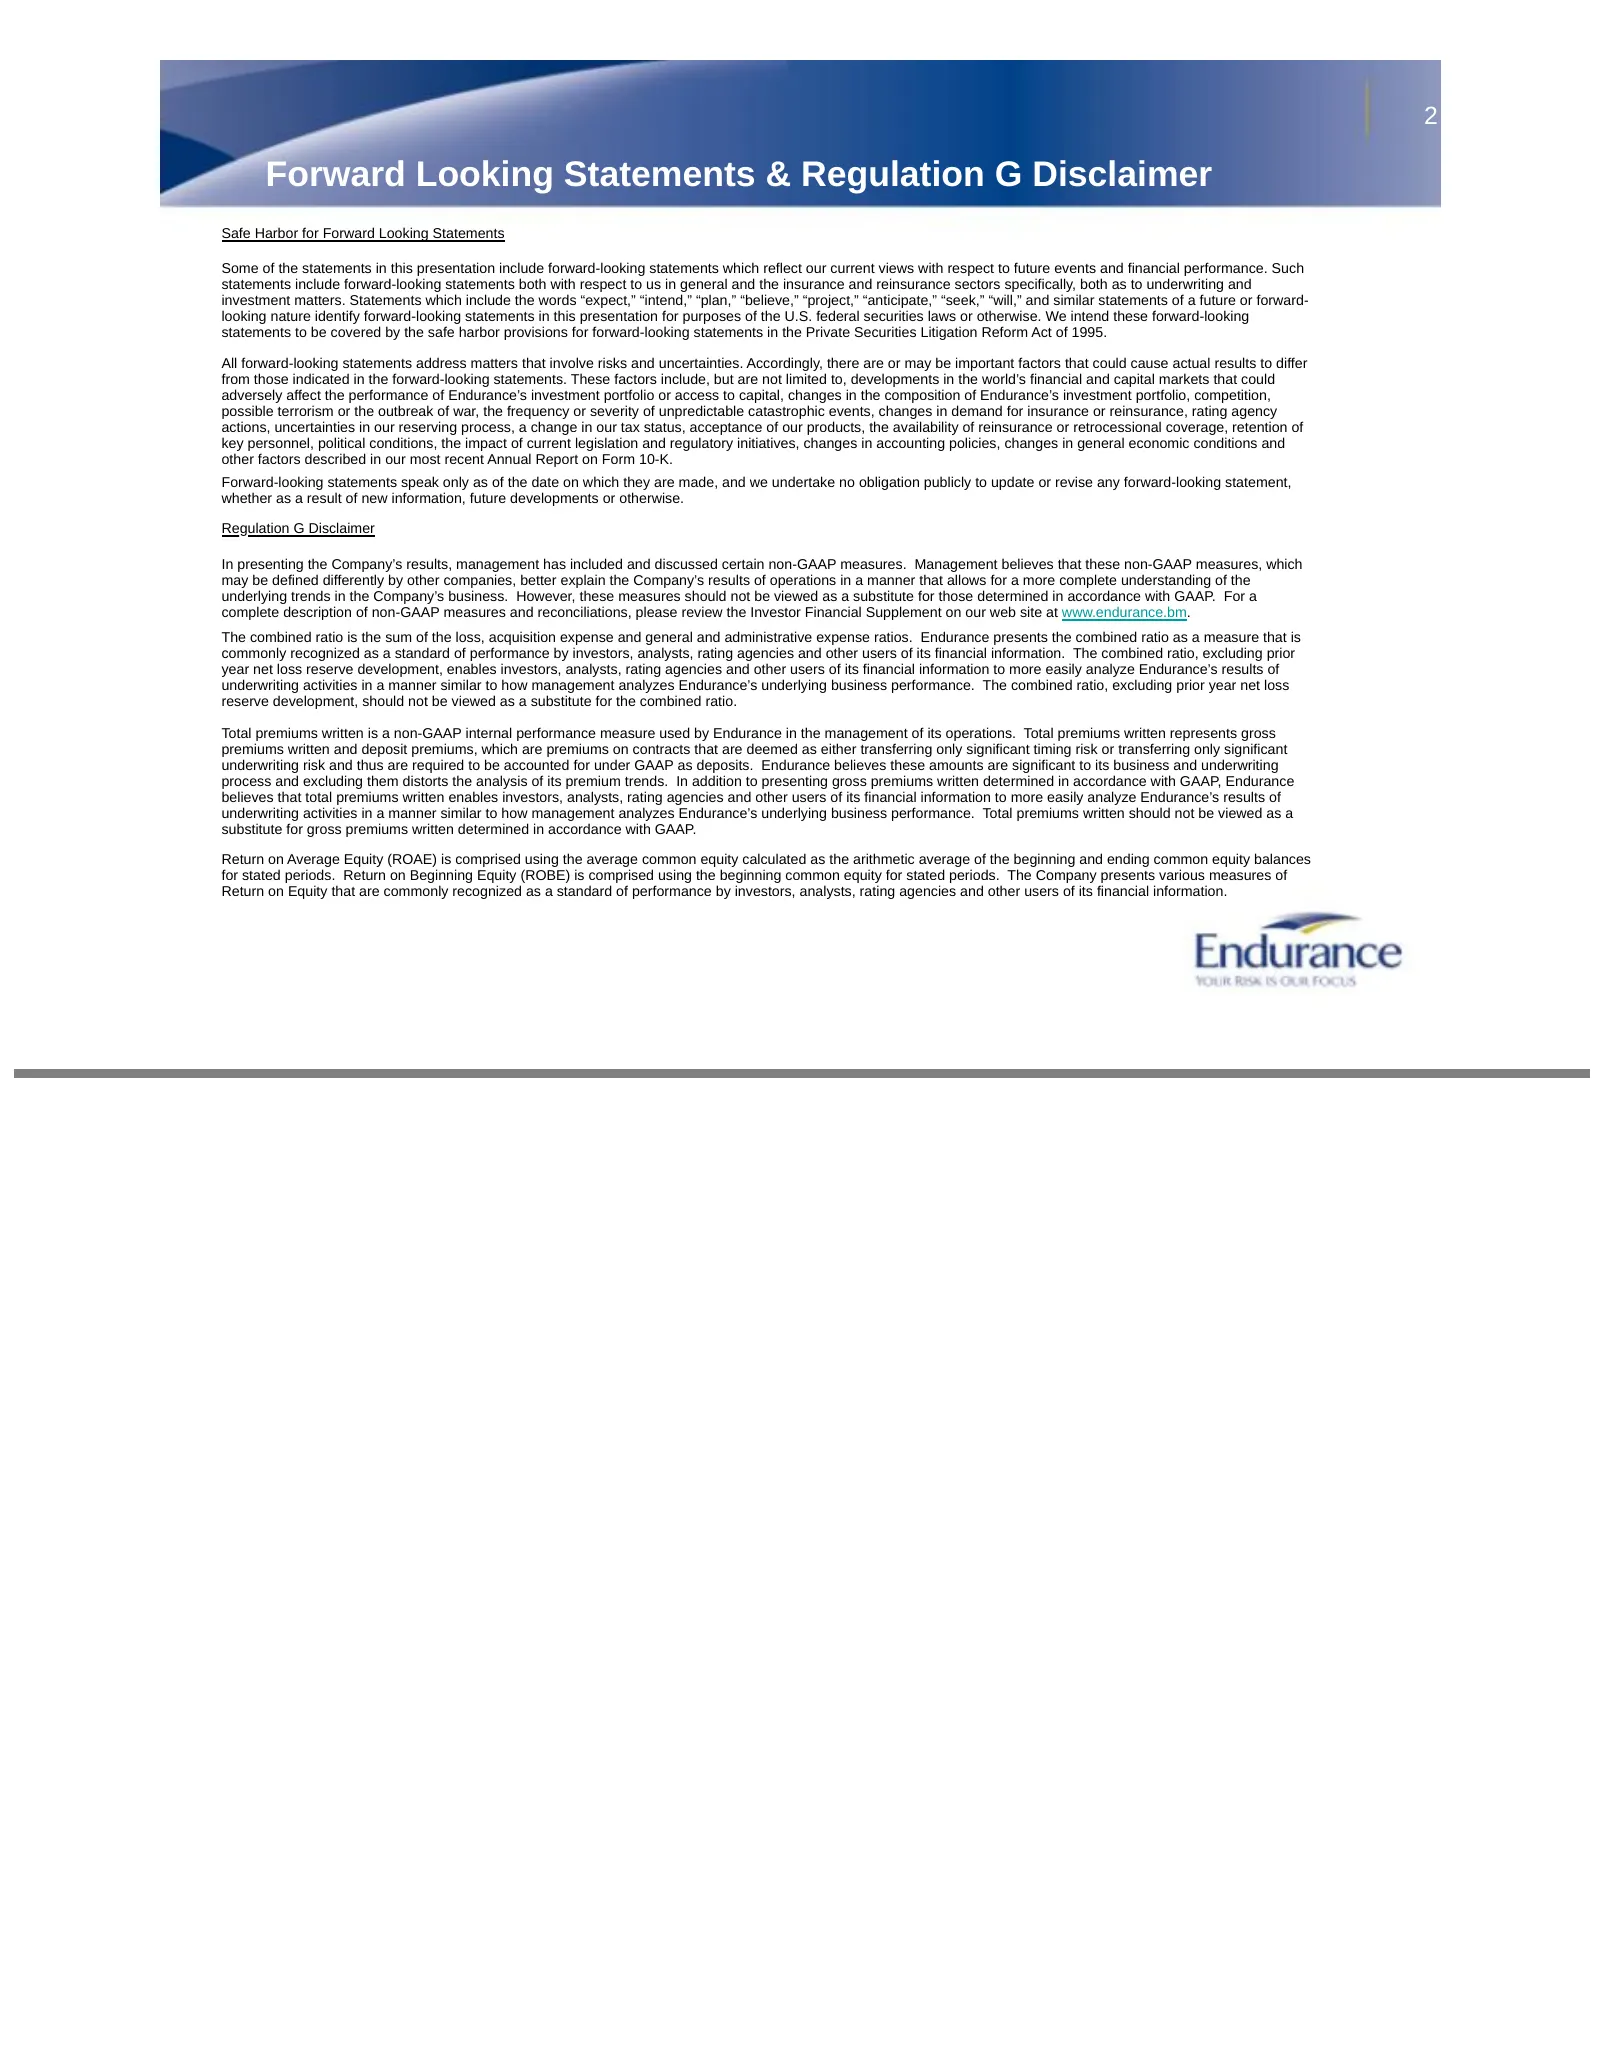
Slide 2: Forward Looking Statements & Regulation G Disclaimer
2 Forward Looking Statements & Regulation G Disclaimer Safe Harbor for Forward Looking Statements Some of the statements in this presentation include forward-looking statements which reflect our current views with respect to future events and financial performance. Such statements include forward-lo
Slide 3: Agenda
3 Agenda 1. Endurance Overview 2. Financial Strength Summary 3. Review of Financial Results 4. Appendix
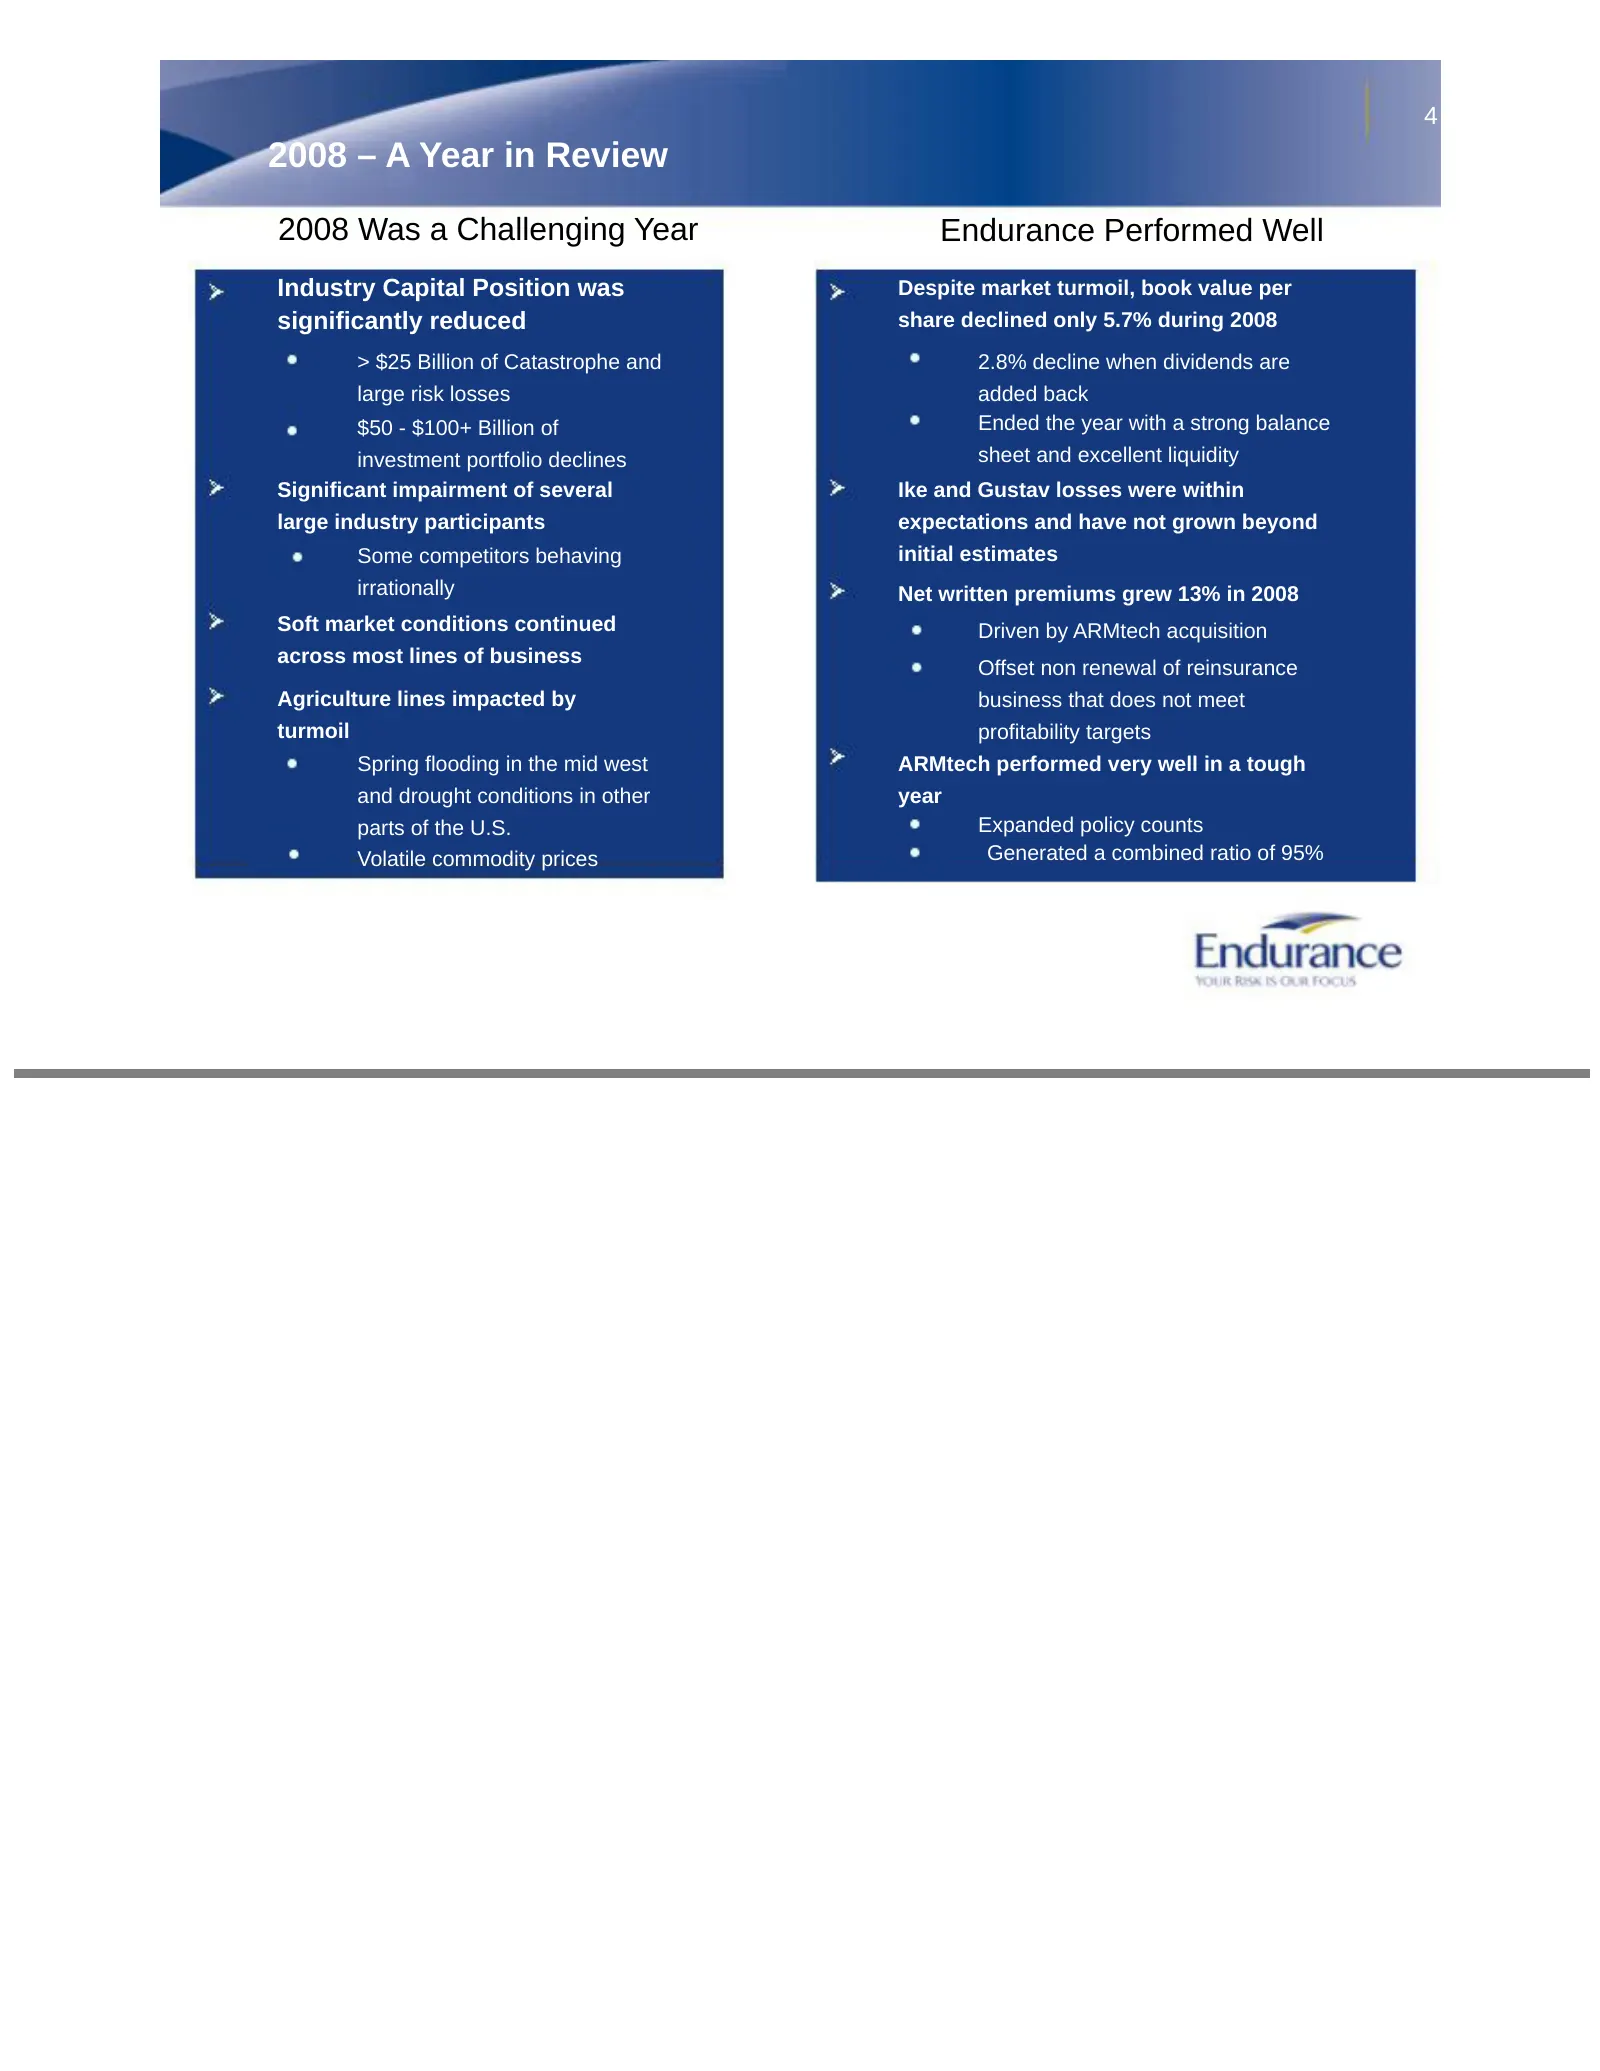
Slide 4: 2008 – A Year in Review
4 2008 – A Year in Review 2008 Was a Challenging Year Endurance Performed Well Industry Capital Position was Despite market turmoil, book value per significantly reduced share declined only 5.7% during 2008 > $25 Billion of Catastrophe and 2.8% decline when dividends are large risk losses added back
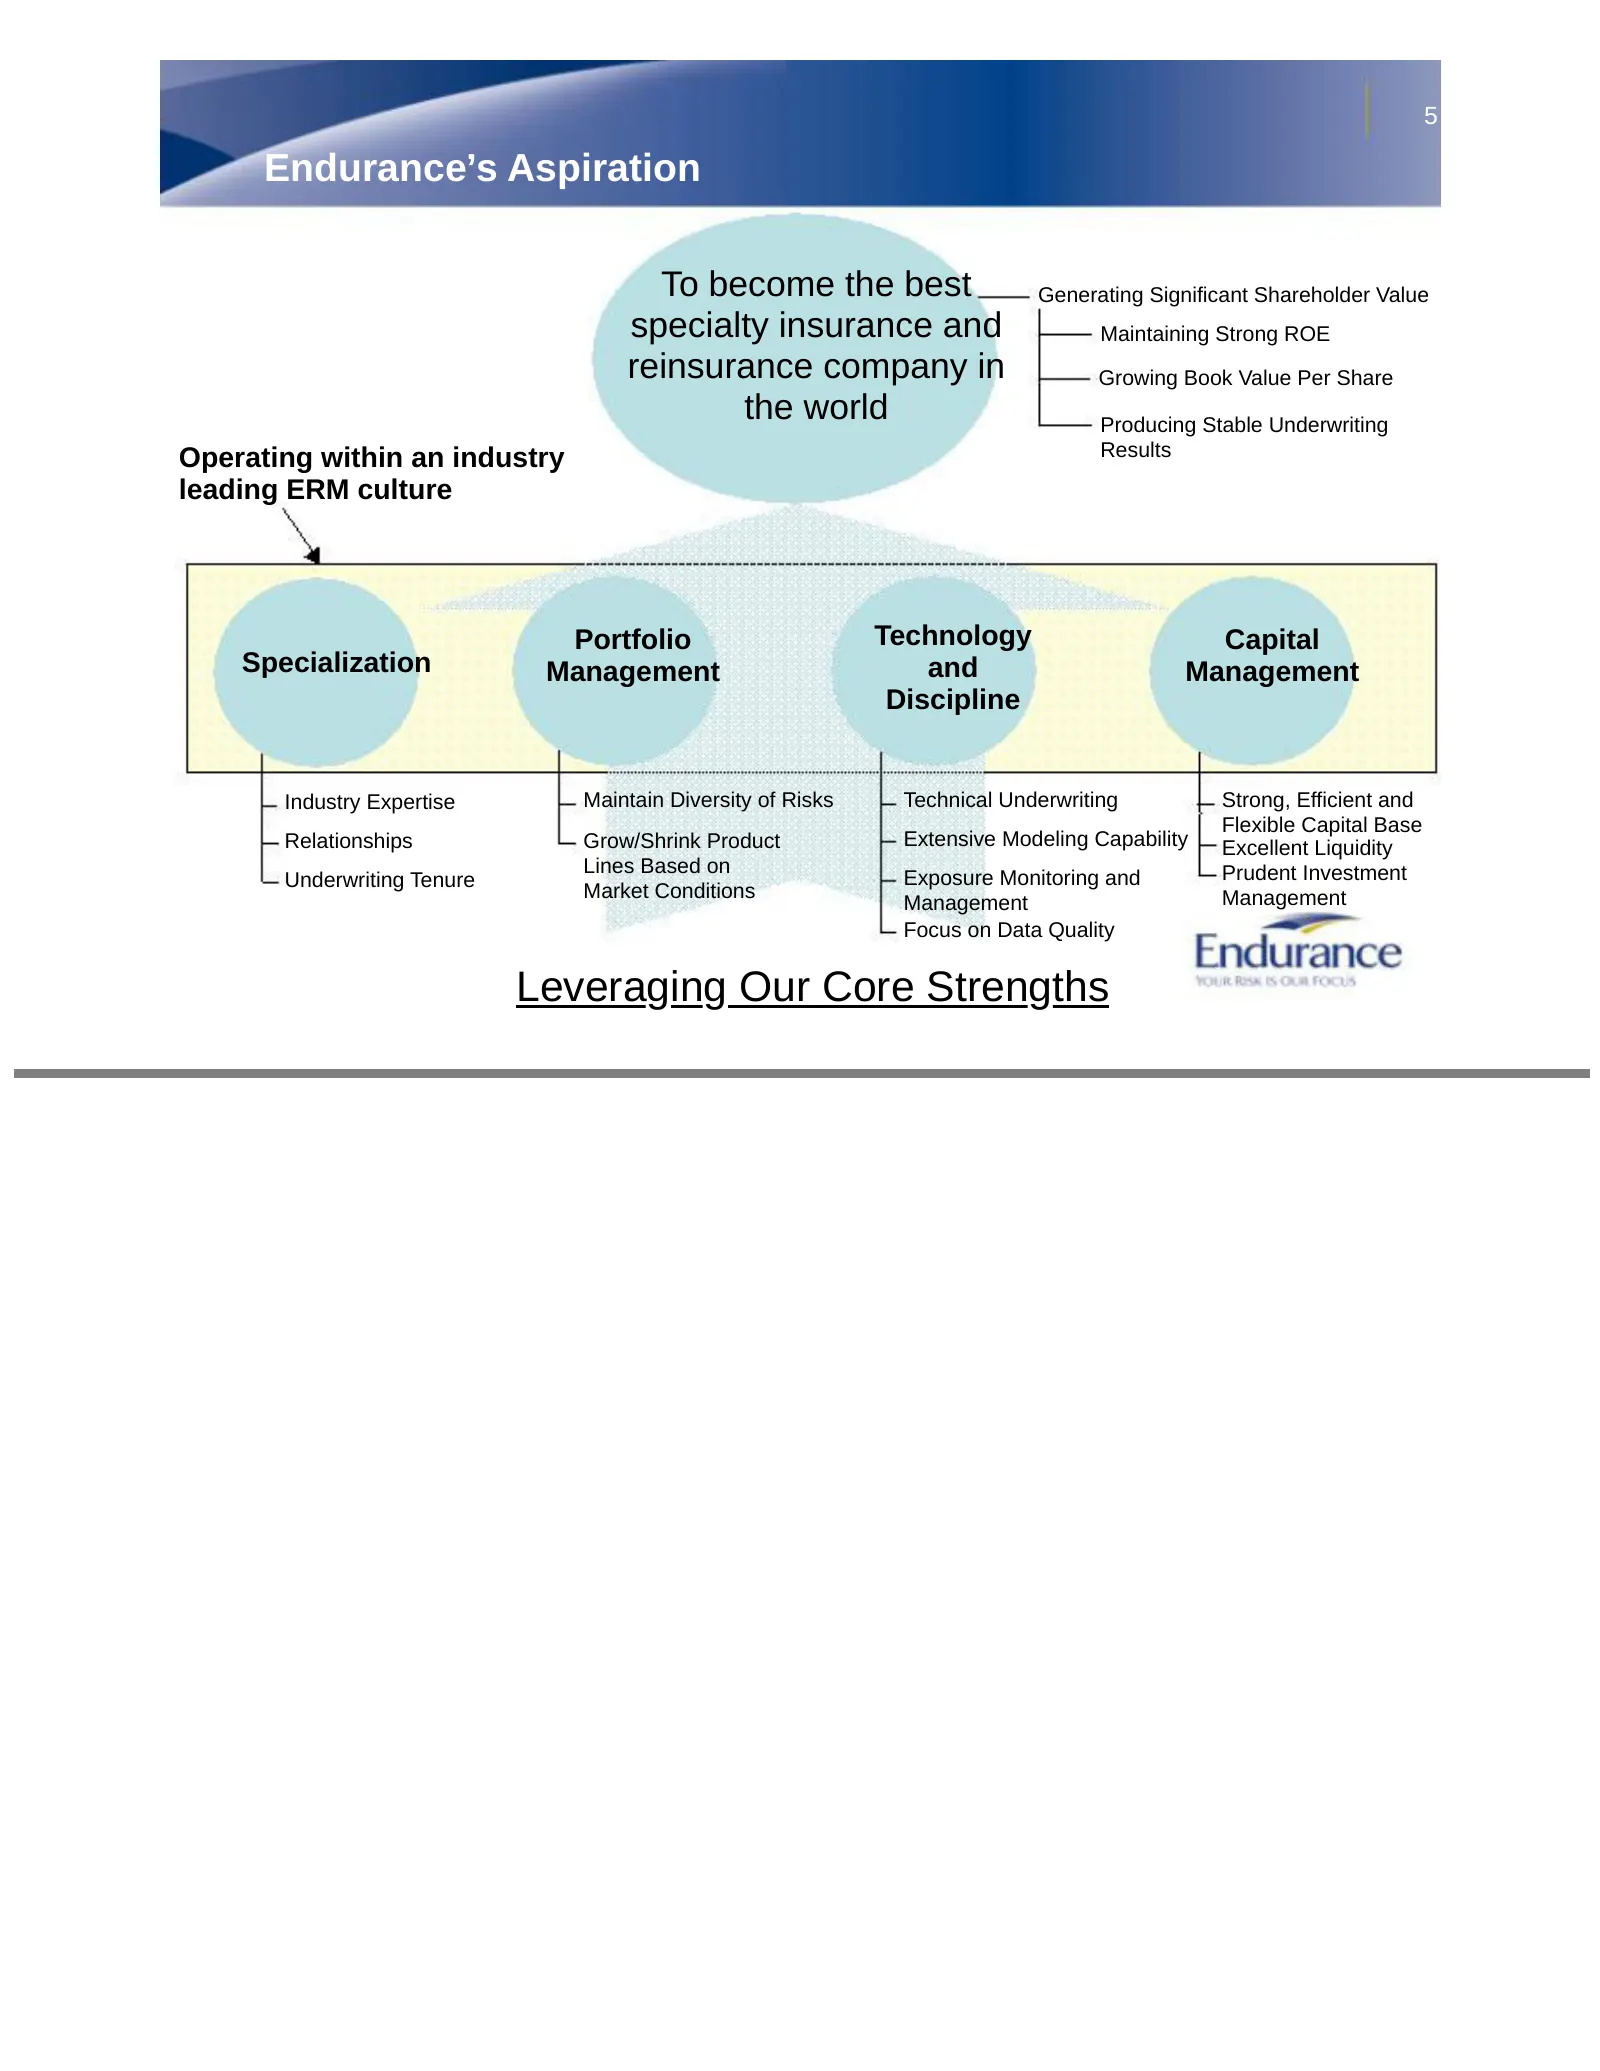
Slide 5: Endurance's Aspiration
5 Endurance’s Aspiration To become the best Generating Significant Shareholder Value specialty insurance and Maintaining Strong ROE reinsurance company in Growing Book Value Per Share the world Producing Stable Underwriting Operating within an industry Results leading ERM culture Portfolio Technolog
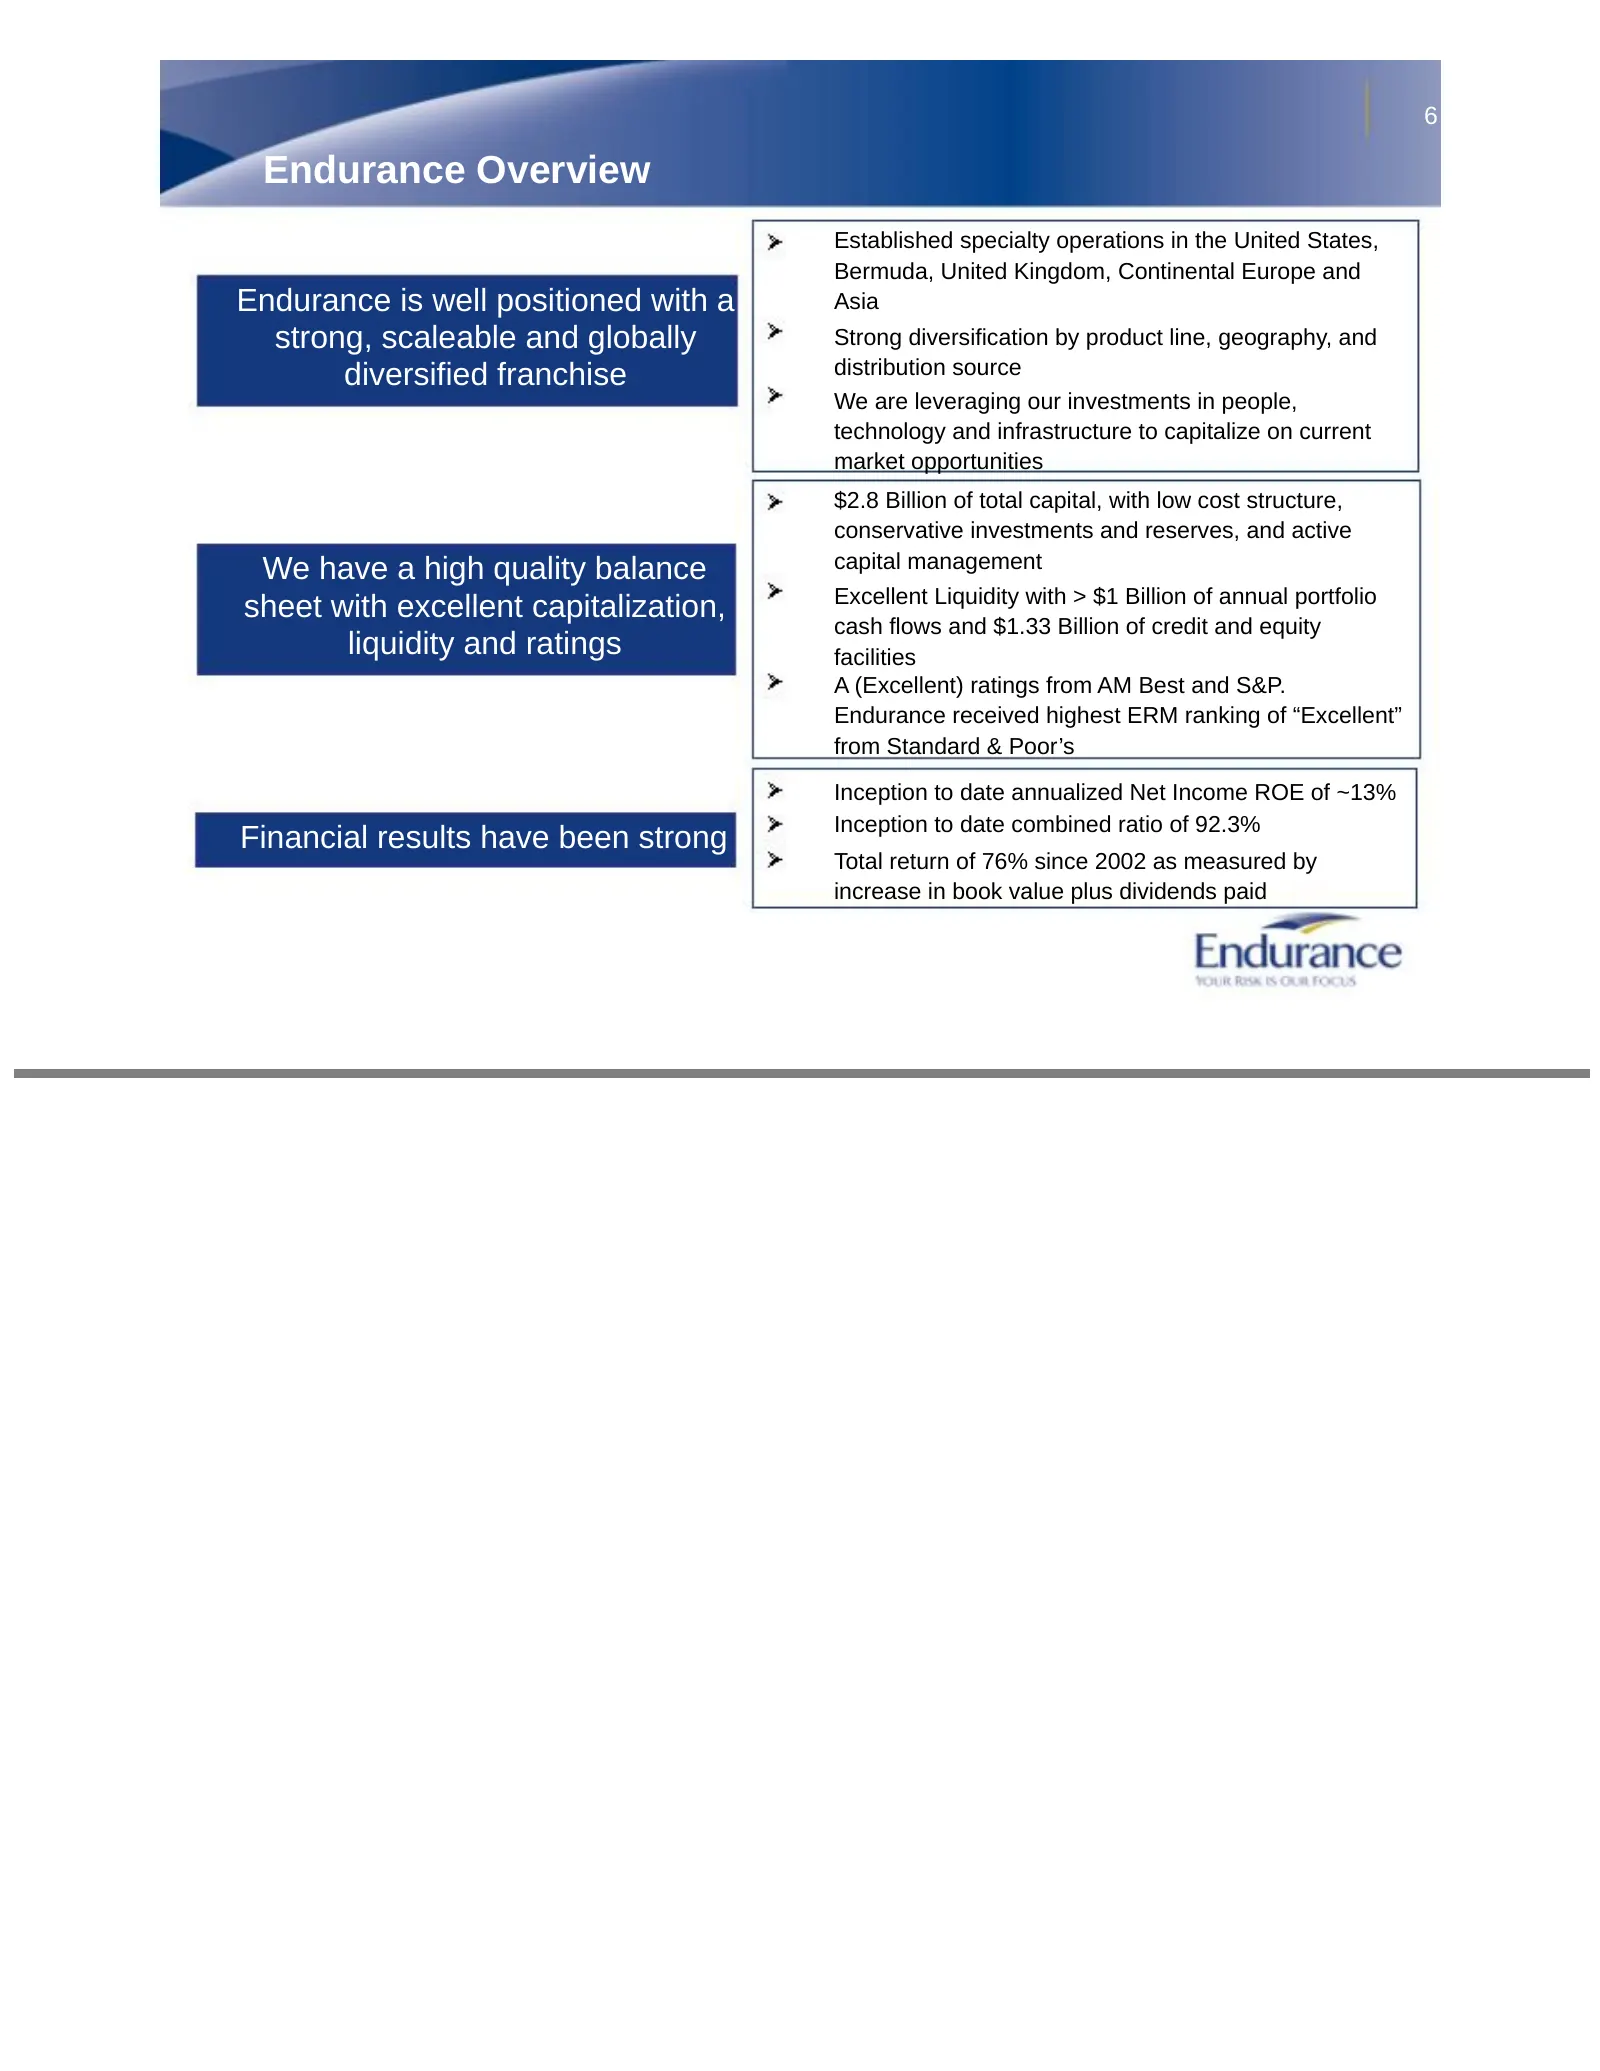
Slide 6: Endurance Overview
6 Endurance Overview Established specialty operations in the United States, Bermuda, United Kingdom, Continental Europe and Endurance is well positioned with a Asia strong, scaleable and globally Strong diversification by product line, geography, and diversified franchise distribution source We are
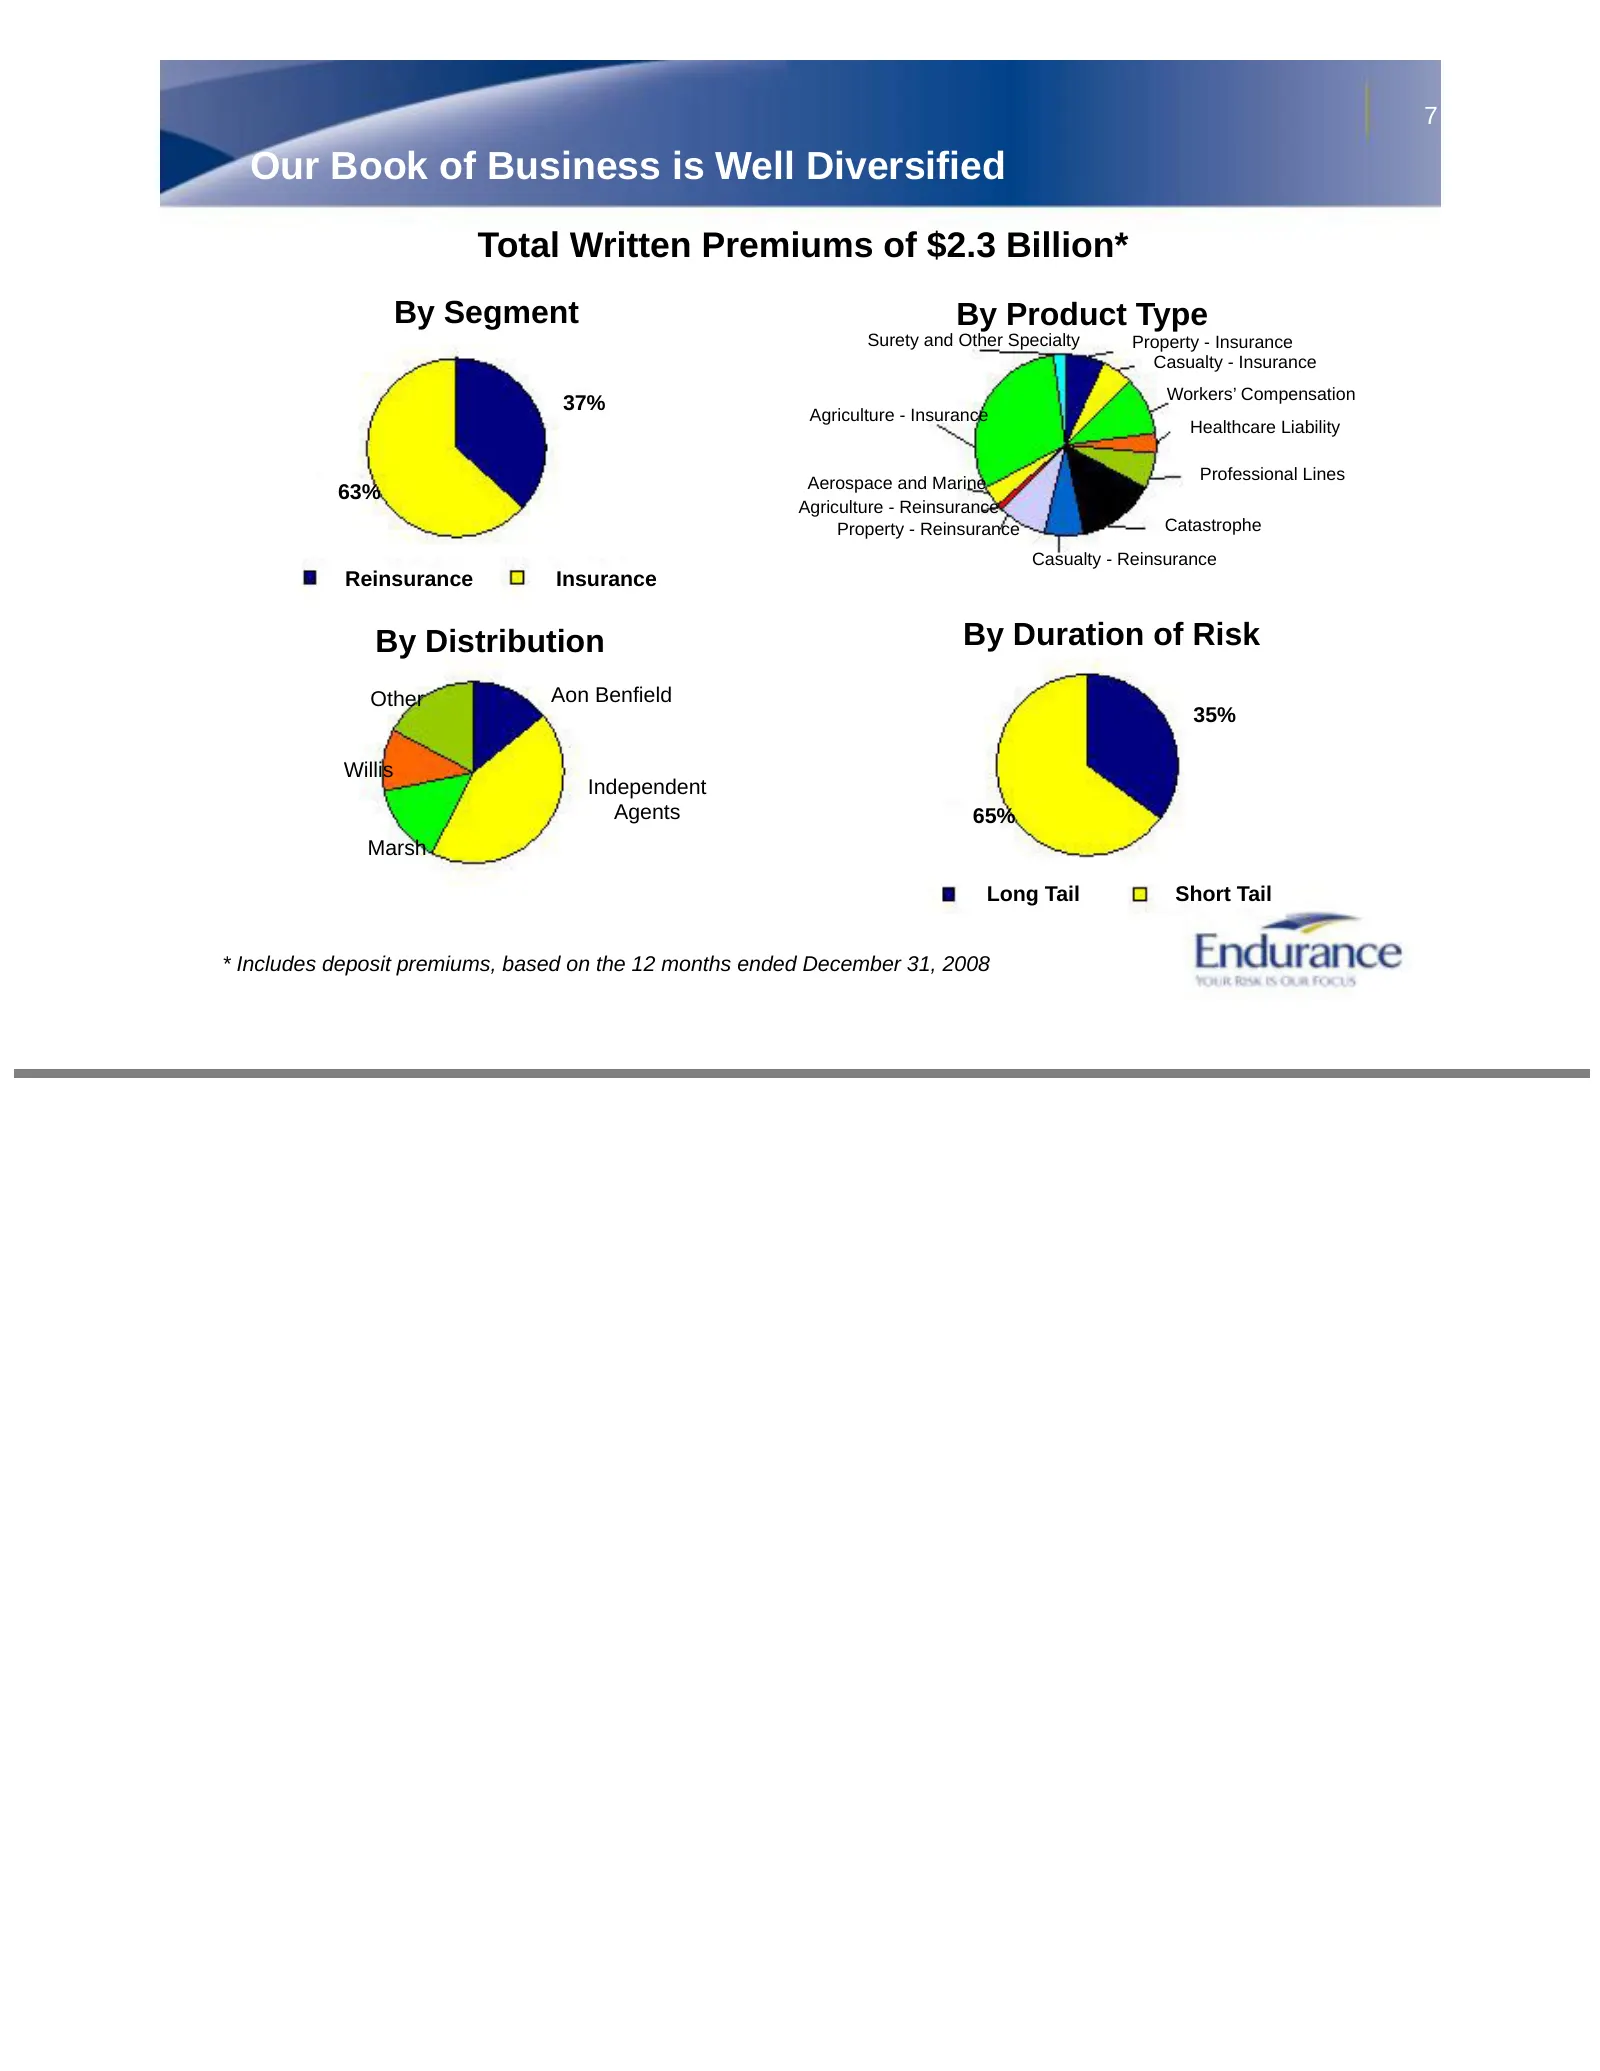
Slide 7: Our Book of Business is Well Diversified
7 Our Book of Business is Well Diversified Total Written Premiums of $2.3 Billion* By Segment By Product Type Surety and Other Specialty Property - Insurance Casualty - Insurance Workers’ Compensation 37% Agriculture - Insurance Healthcare Liability Professional Lines Aerospace and Marine 63% Agricu
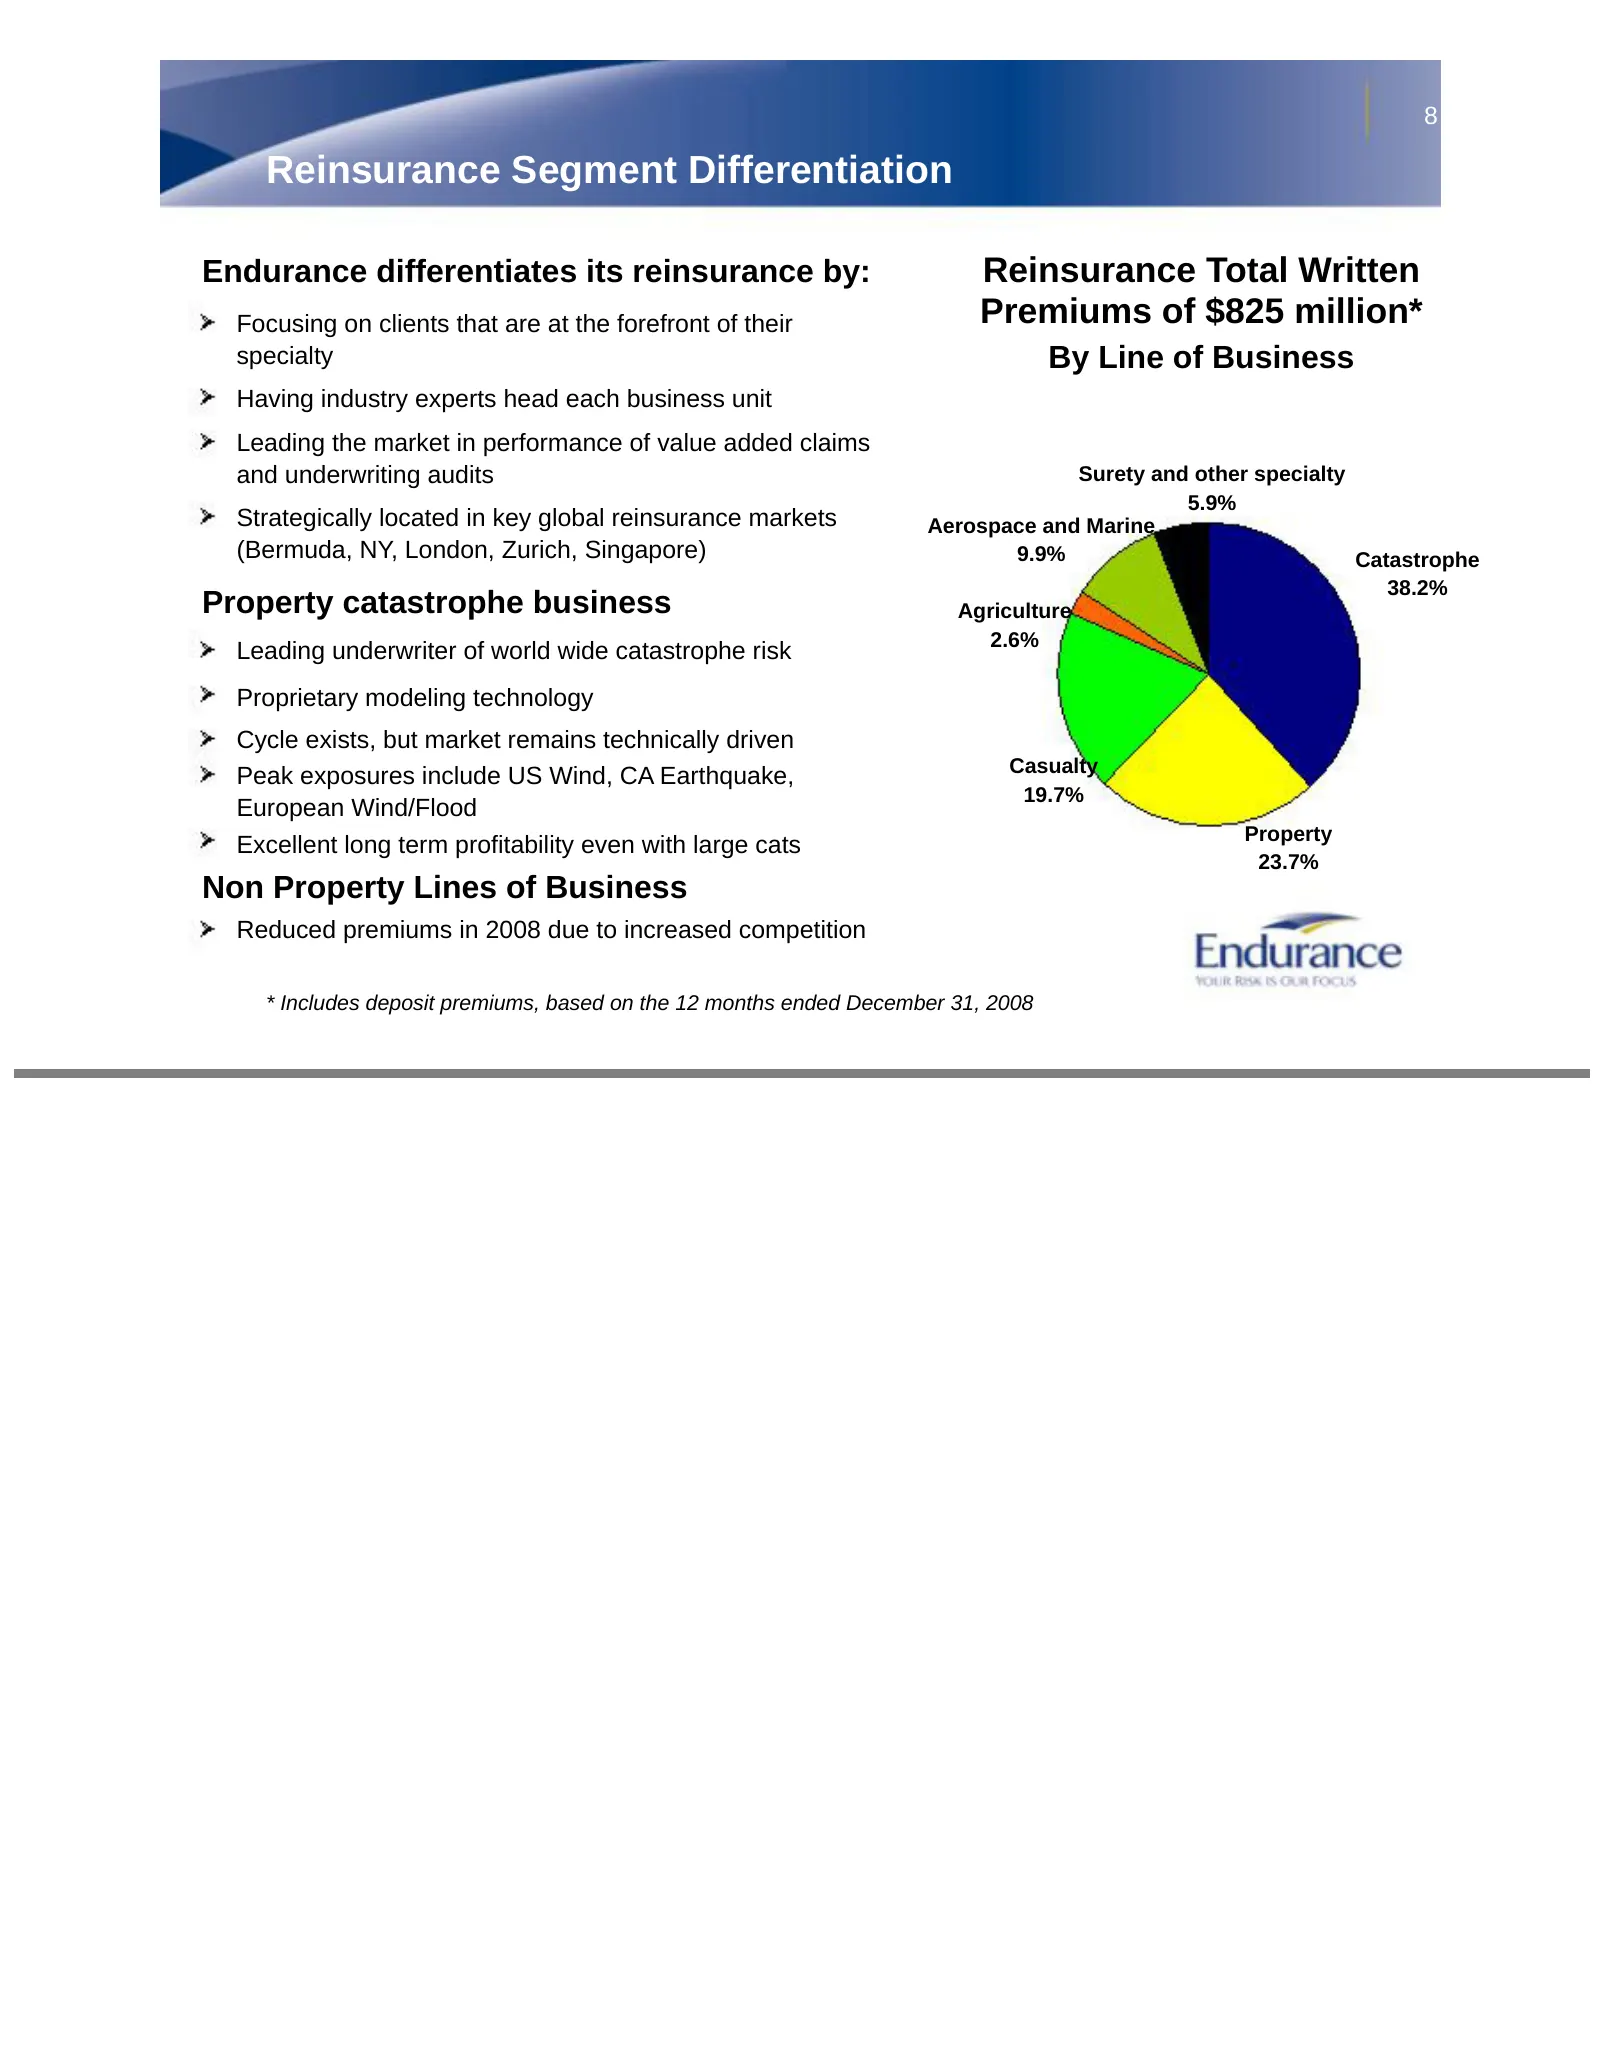
Slide 8: Reinsurance Segment Differentiation
8 Reinsurance Segment Differentiation Endurance differentiates its reinsurance by: Reinsurance Total Written Focusing on clients that are at the forefront of their Premiums of $825 million* specialty By Line of Business Having industry experts head each business unit Leading the market in performanc
Slide 9: Insurance Segment Differentiation
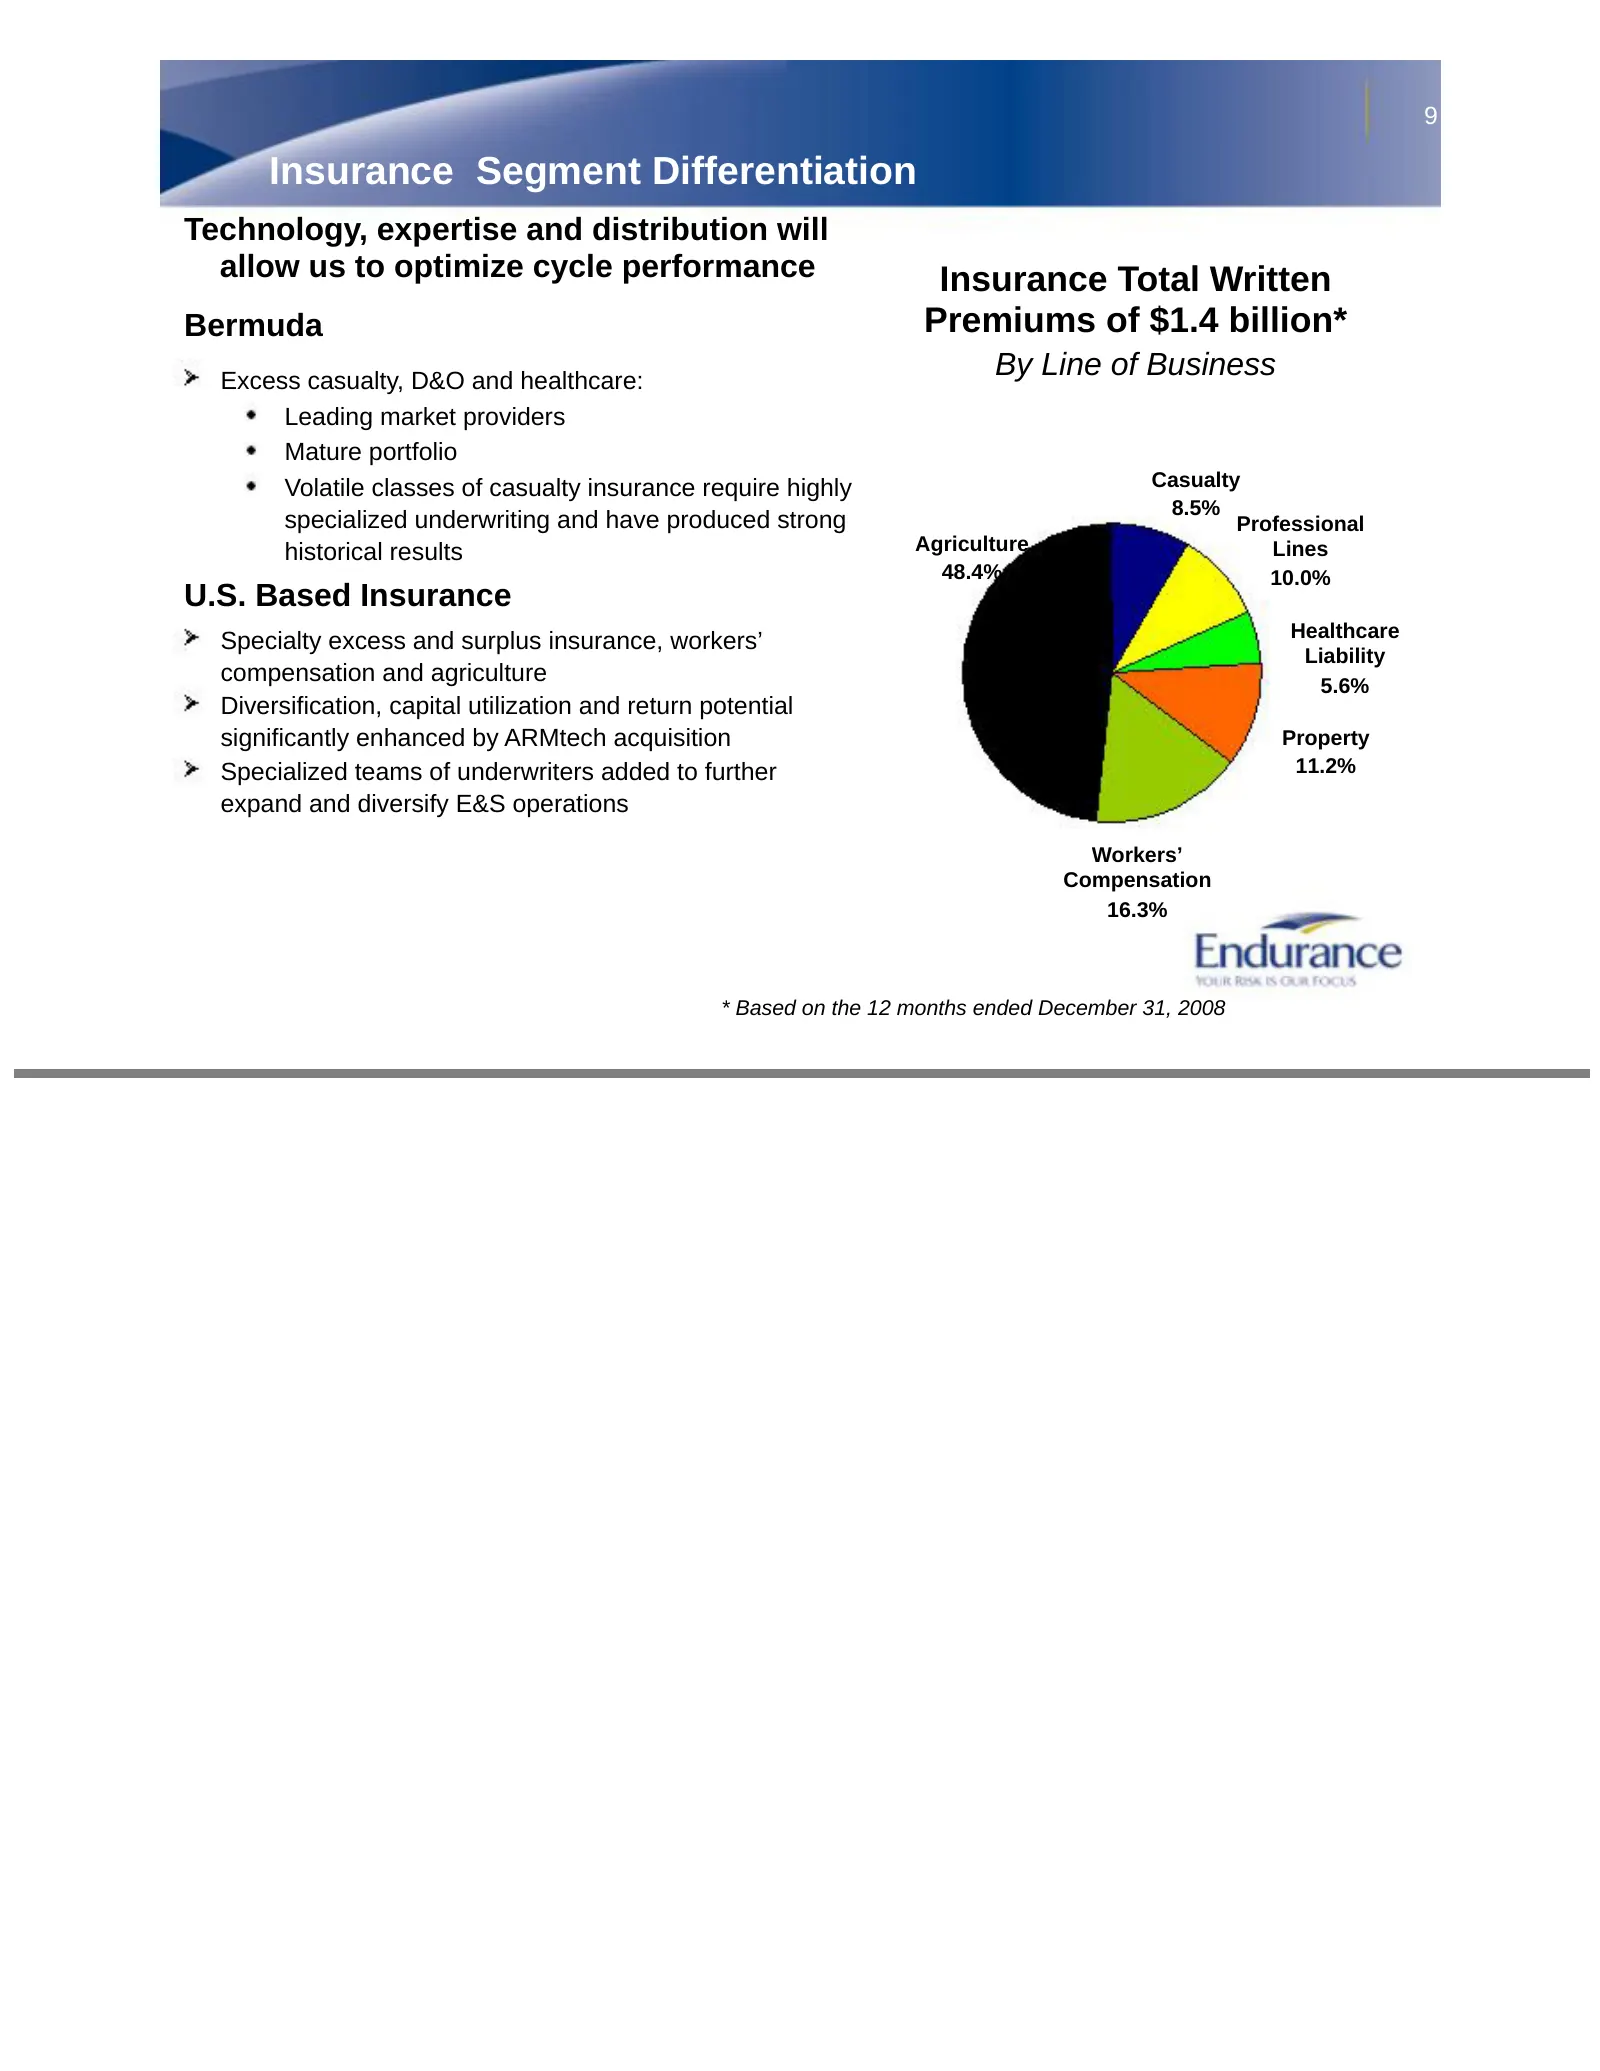
9 Insurance Segment Differentiation Technology, expertise and distribution will allow us to optimize cycle performance Insurance Total Written Bermuda Premiums of $1.4 billion* Excess casualty, D&O and healthcare: By Line of Business Leading market providers Mature portfolio Volatile classes of casu
Slide 10: Industry Leading Risk Management and Transparency
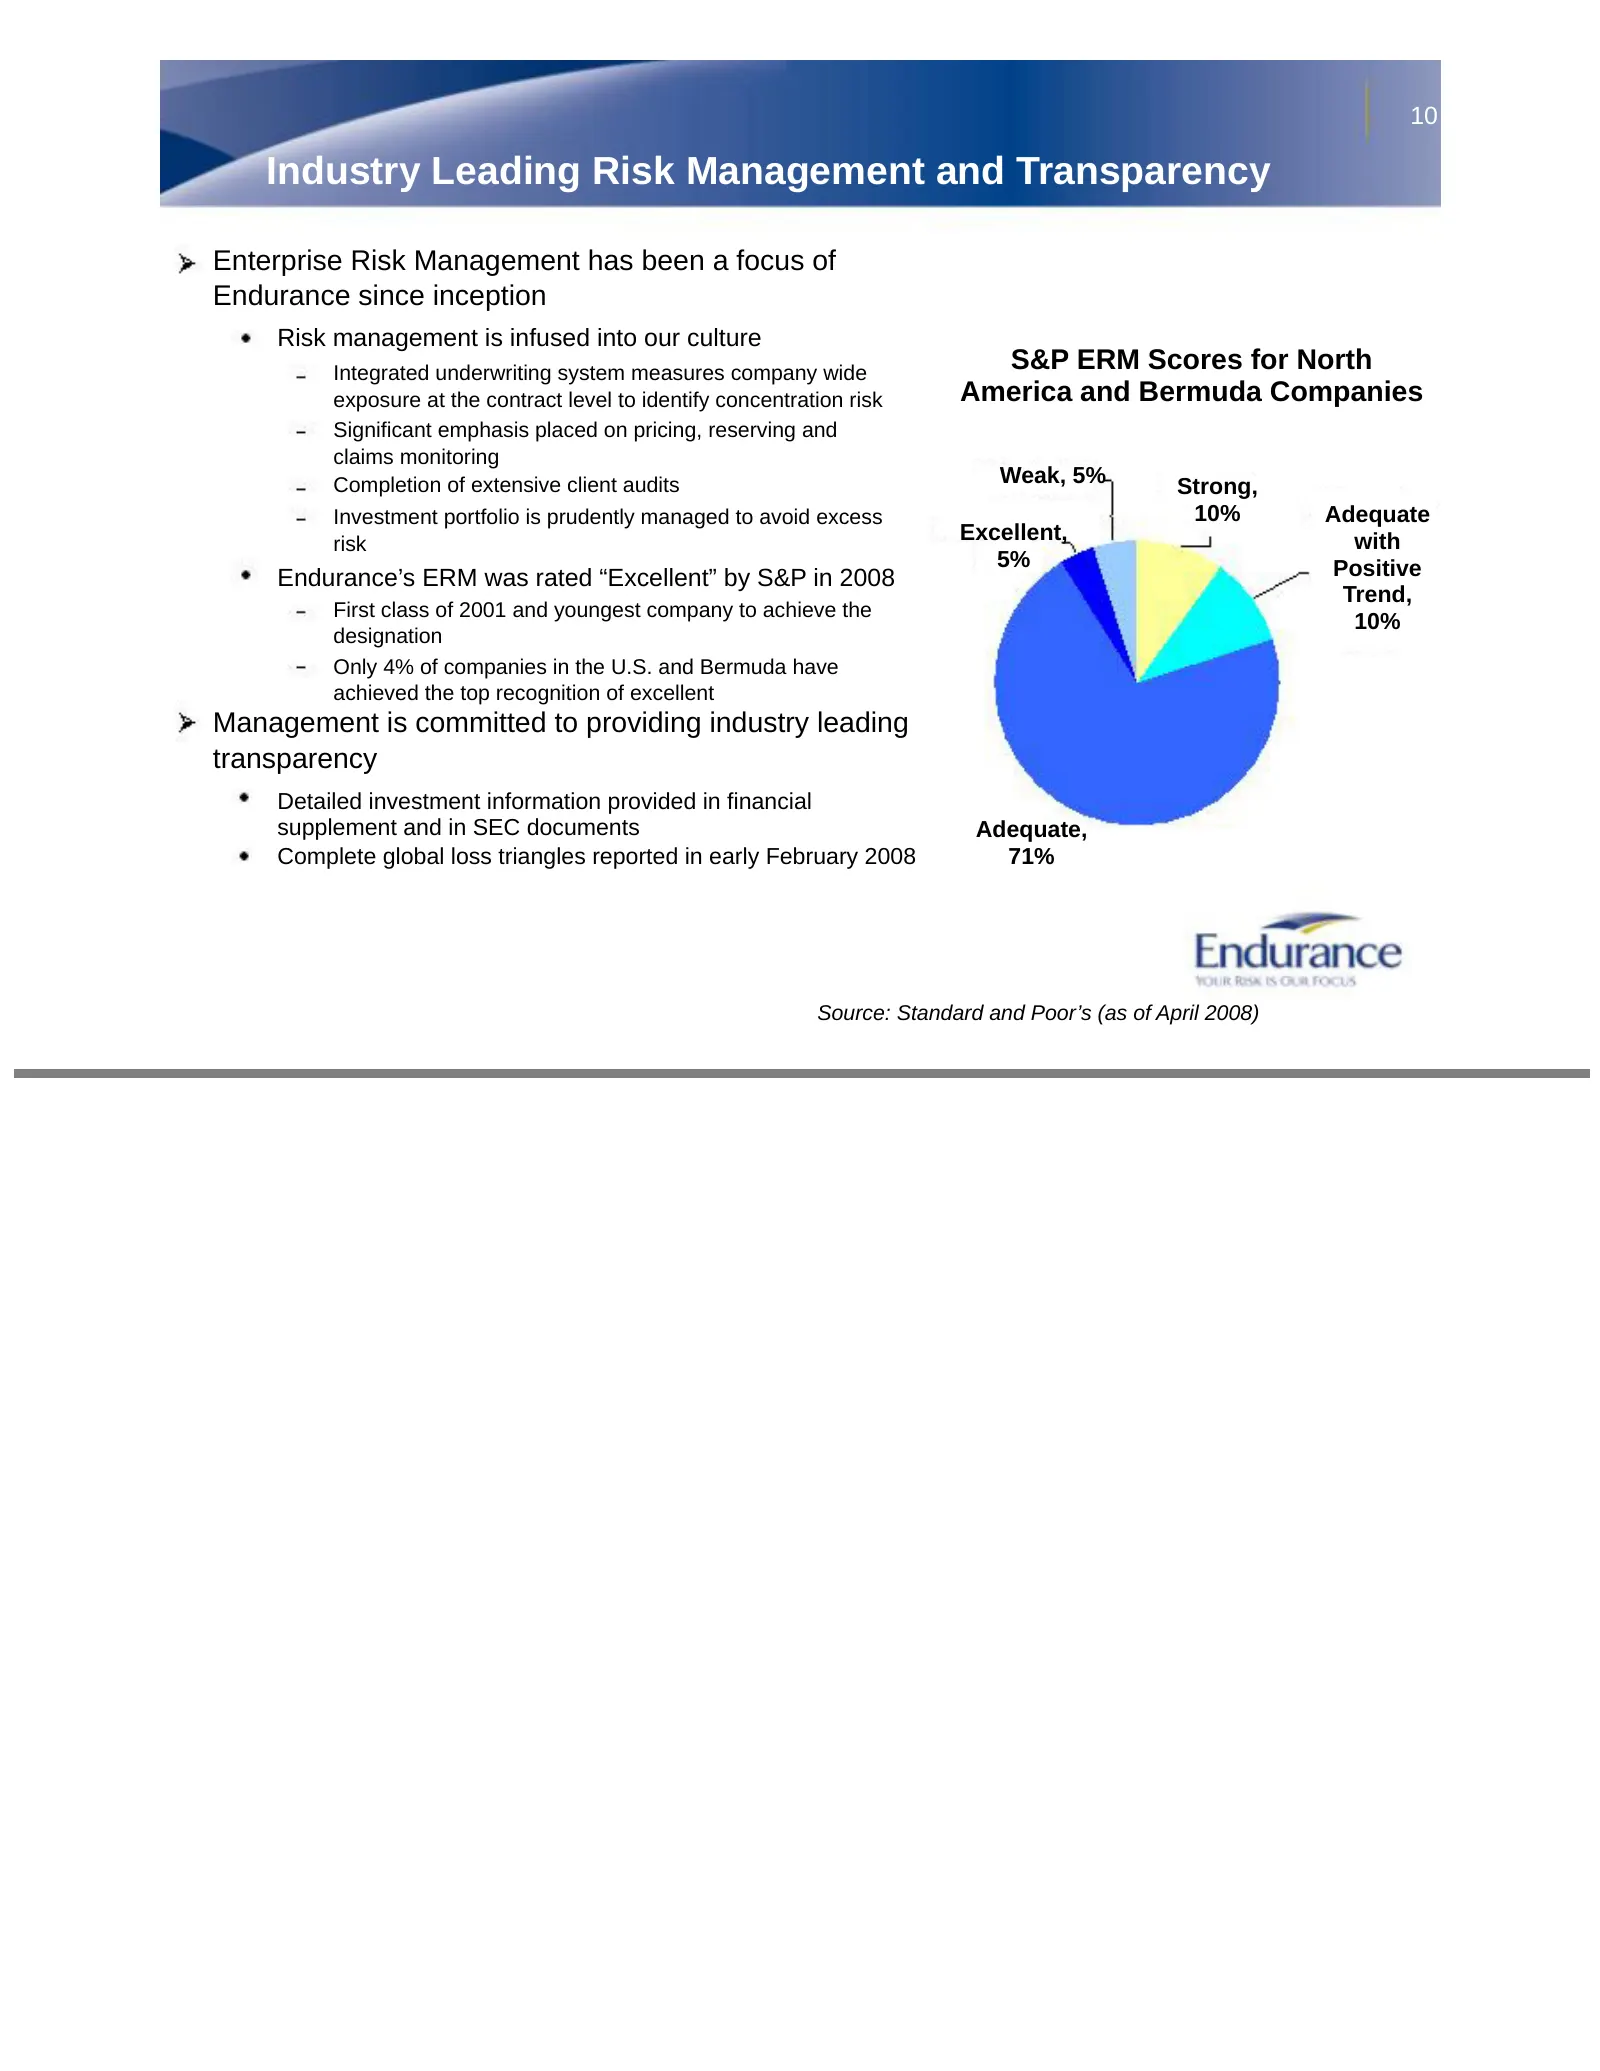
10 Industry Leading Risk Management and Transparency Enterprise Risk Management has been a focus of Endurance since inception Risk management is infused into our culture Integrated underwriting system measures company wide S&P ERM Scores for North exposure at the contract level to identify concentra
Slide 11: Portfolio Management: A Case Study
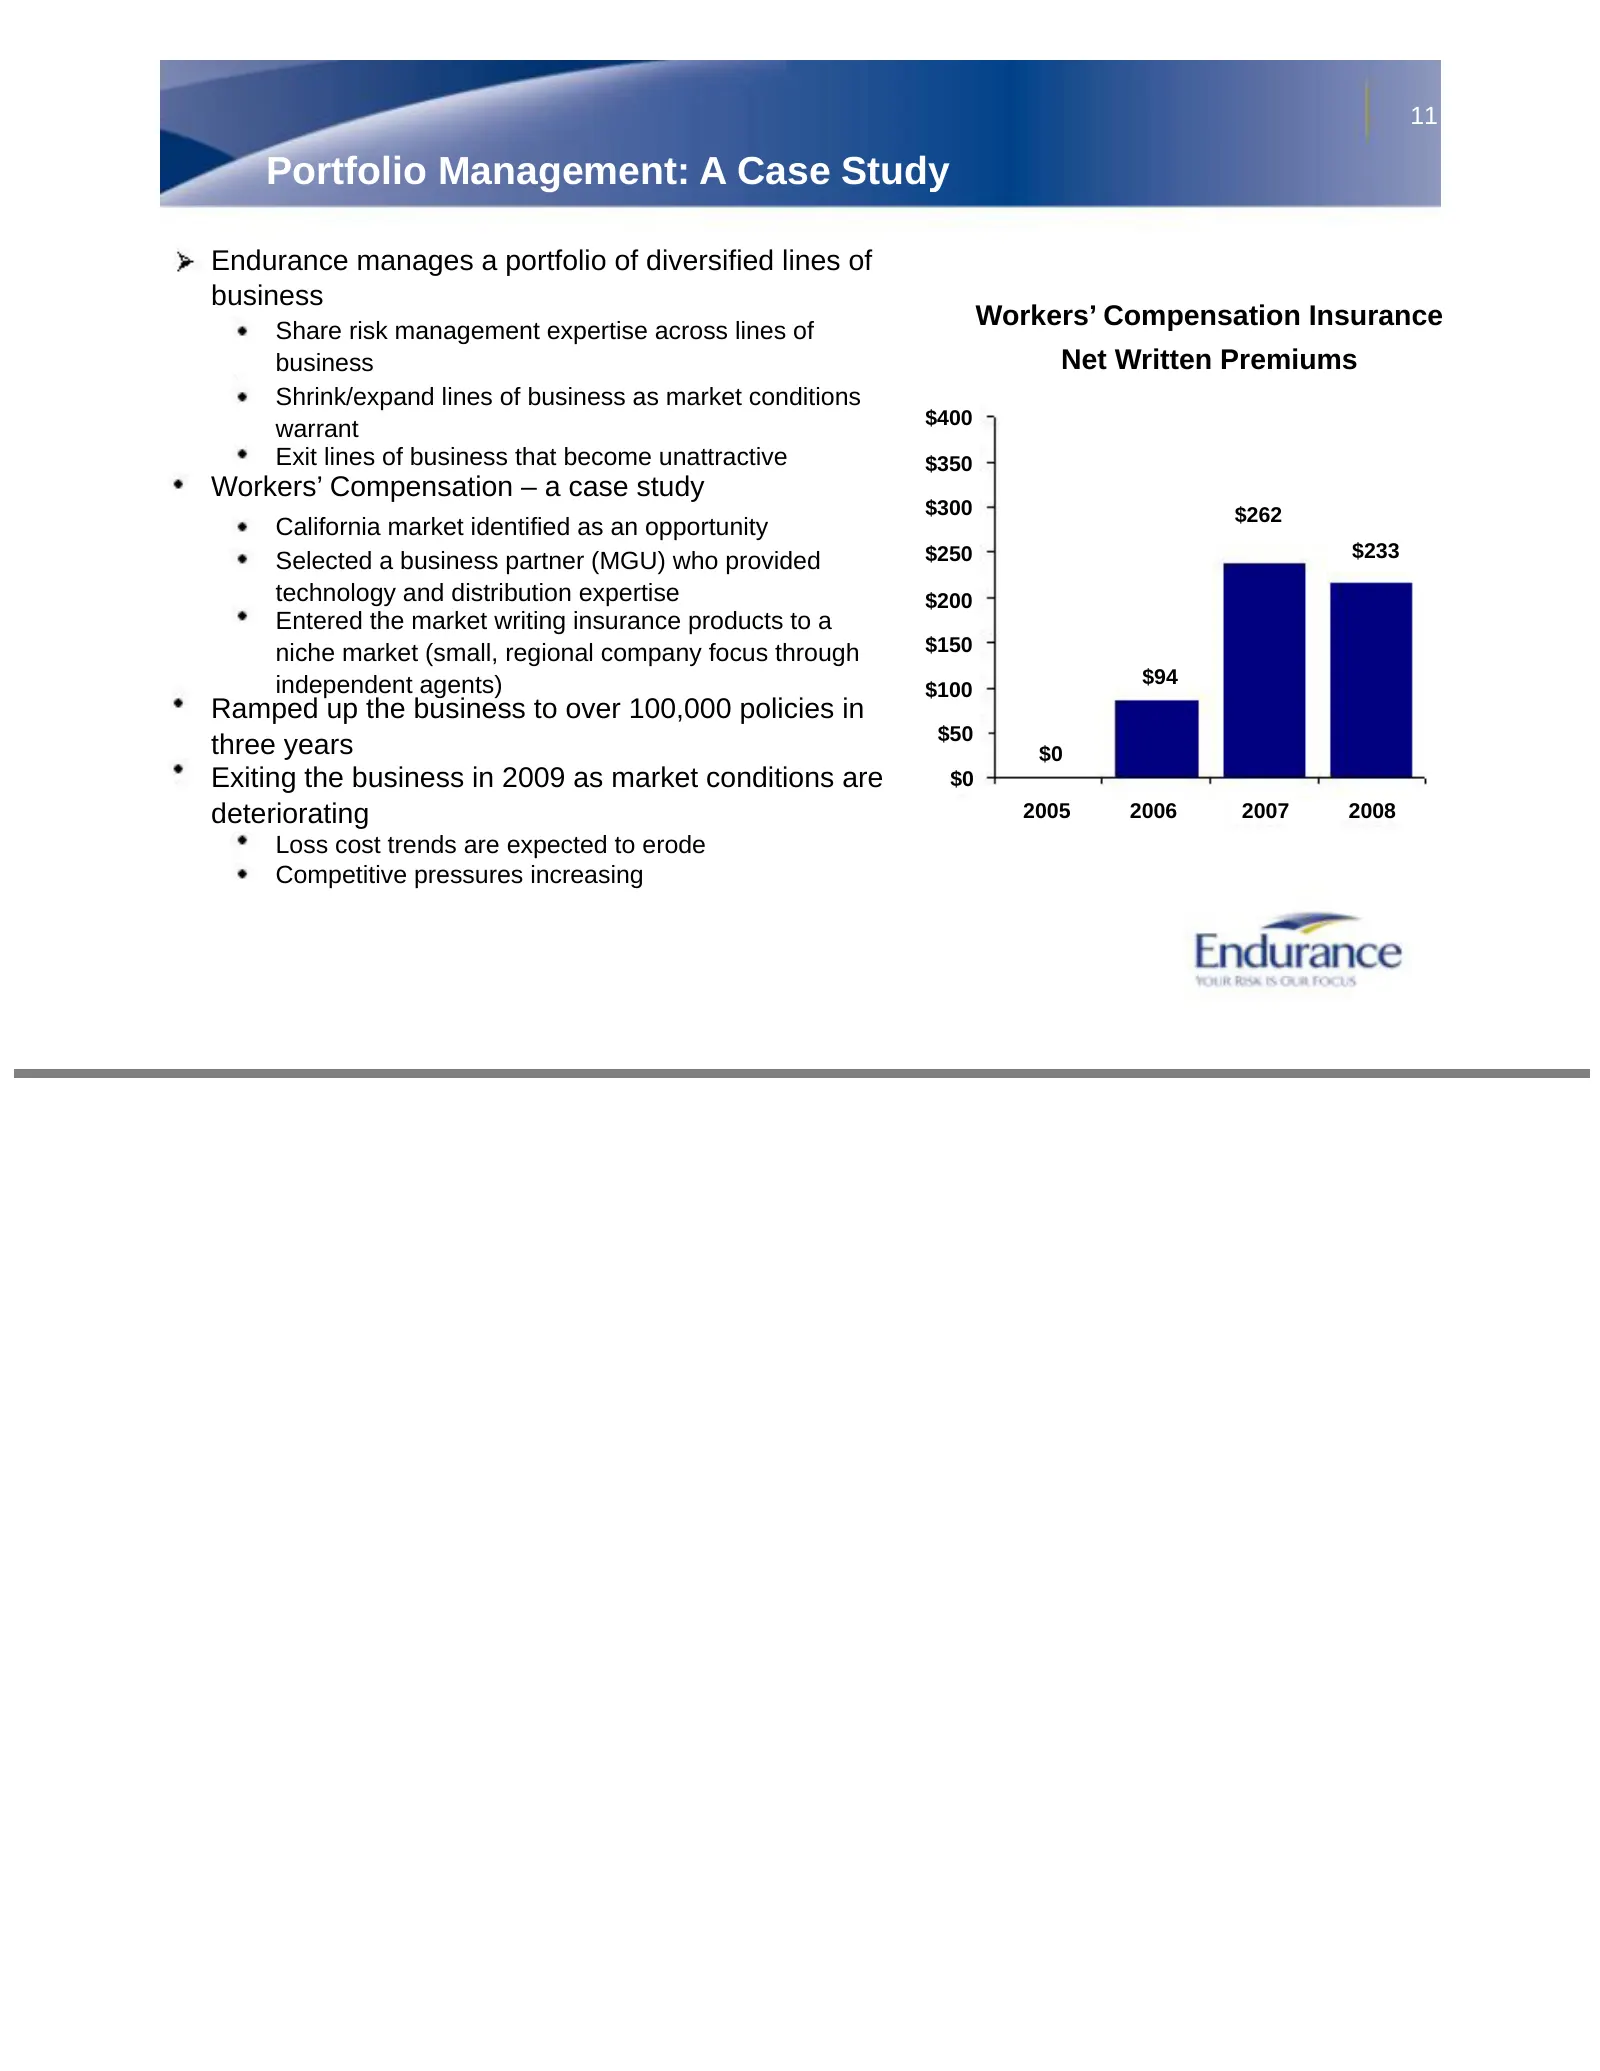
11 Portfolio Management: A Case Study Endurance manages a portfolio of diversified lines of business Workers’ Compensation Insurance Share risk management expertise across lines of business Net Written Premiums Shrink/expand lines of business as market conditions $400 warrant Exit lines of business
Slide 12: Agenda
12 Agenda 1 Endurance Overview 2 Financial Strength Summary 3 Review of Financial Results 4 Appendix
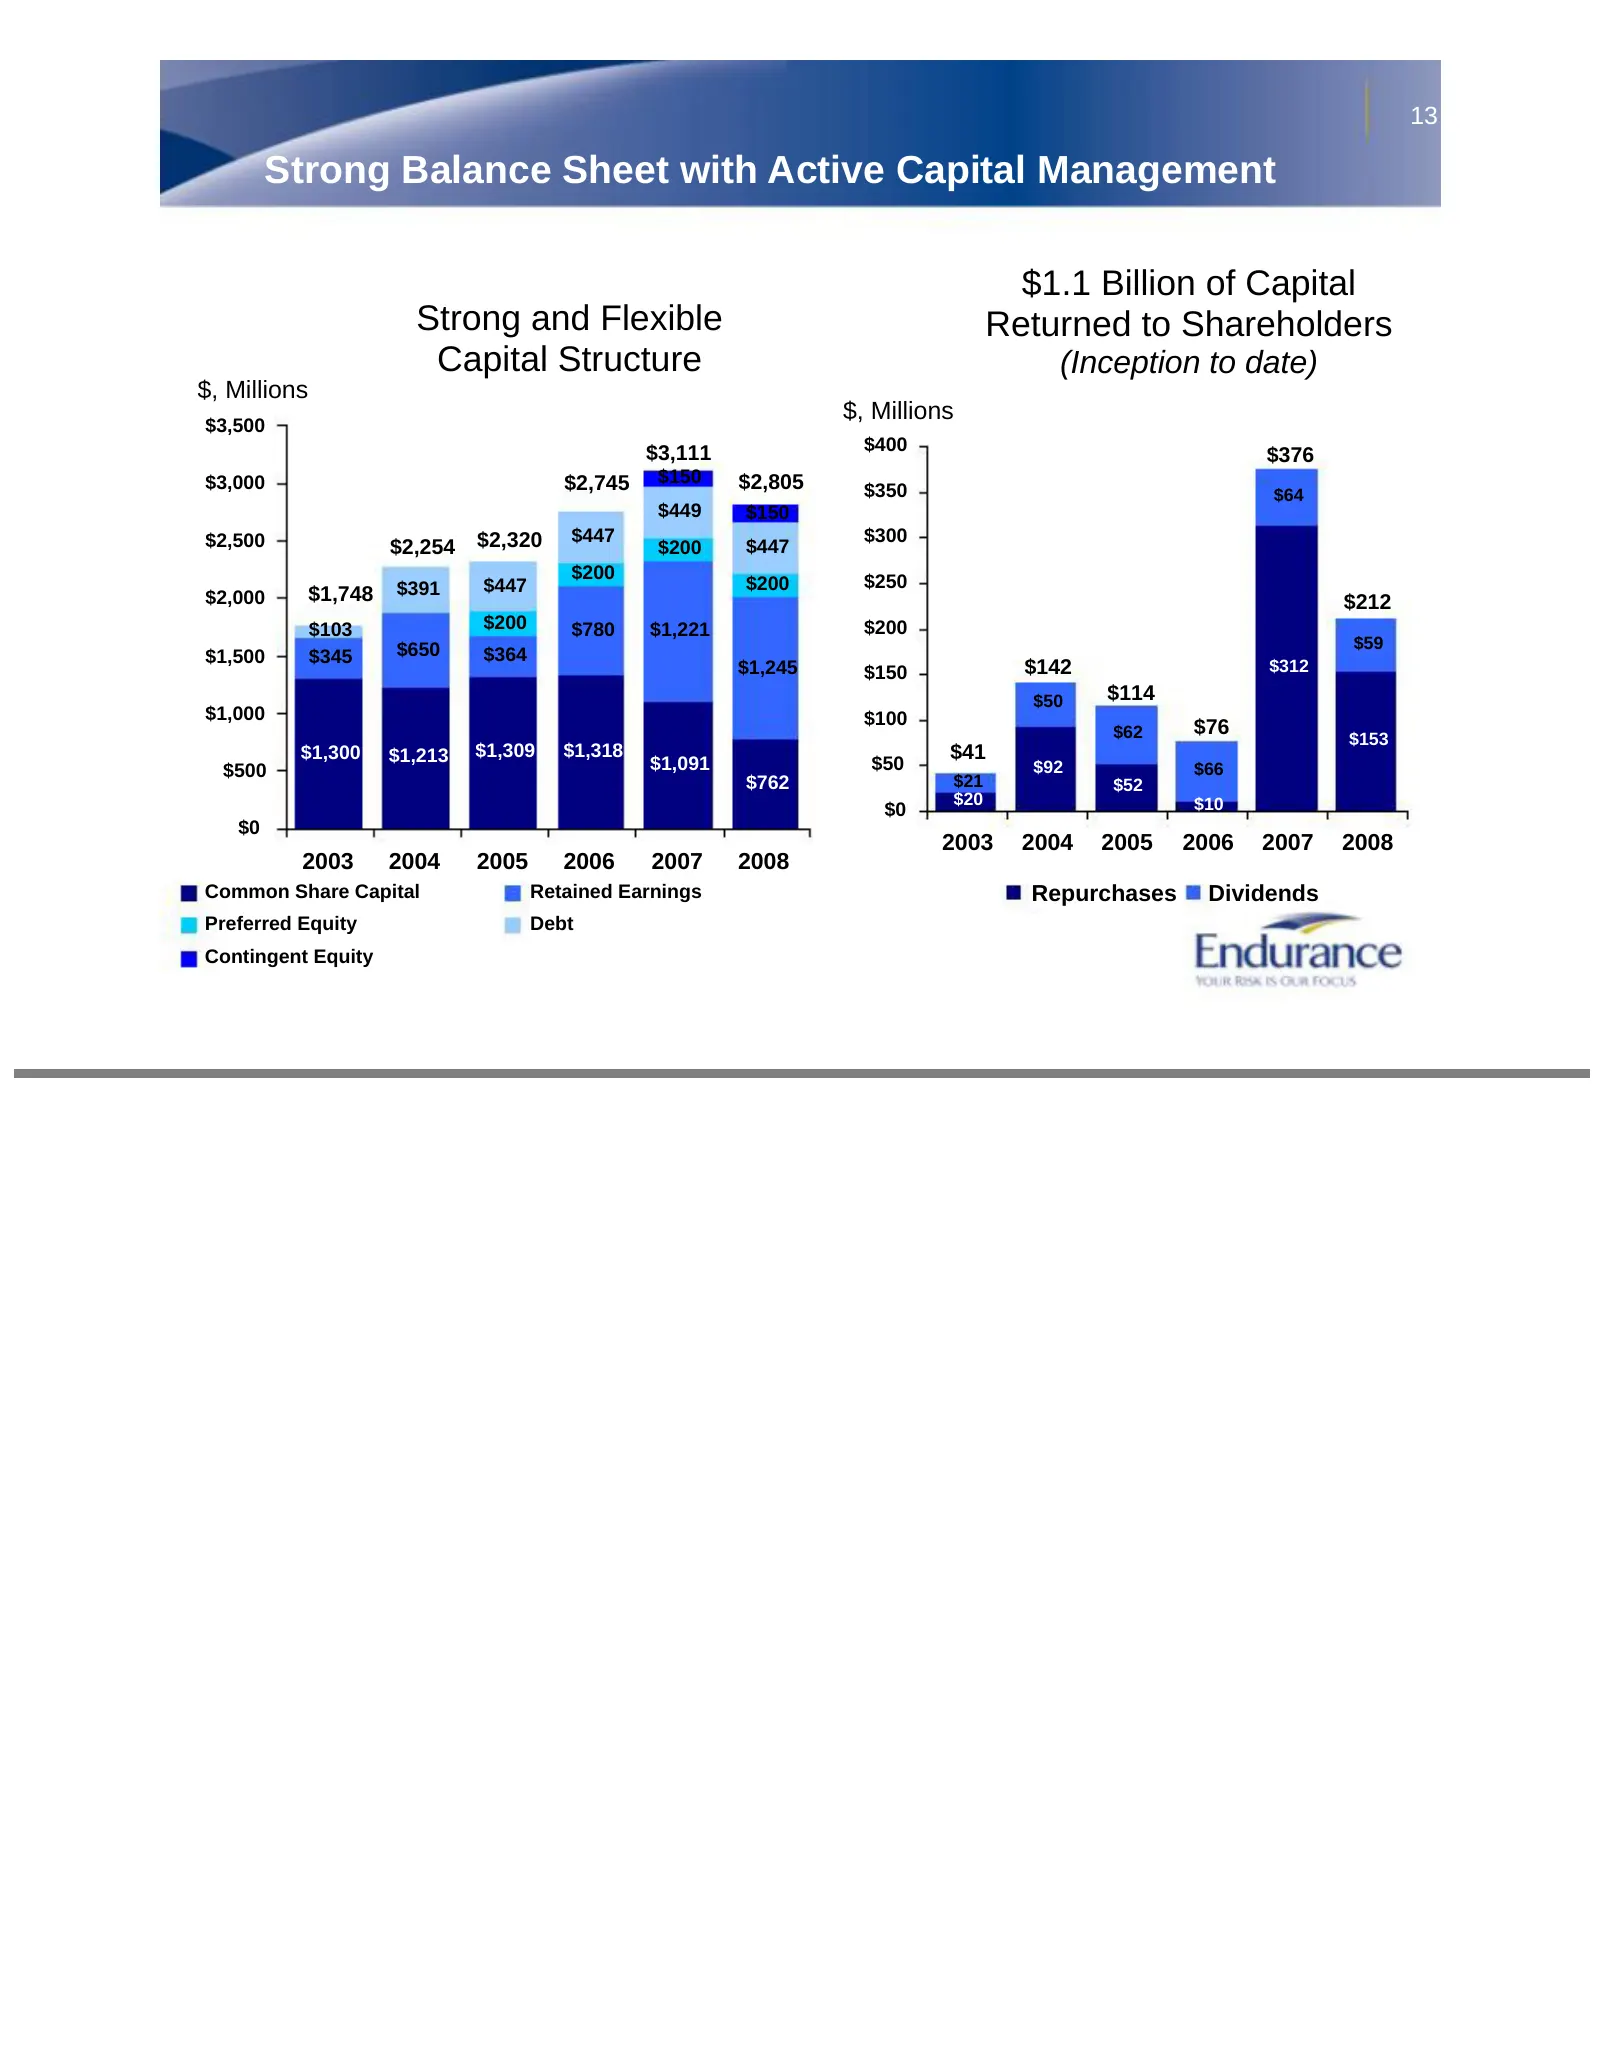
Slide 13: Strong Balance Sheet with Active Capital Management
13 Strong Balance Sheet with Active Capital Management $1.1 Billion of Capital Strong and Flexible Returned to Shareholders Capital Structure (Inception to date) $, Millions $, Millions $3,500 $3,111 $400 $376 $3,000 $2,745 $150 $2,805 $350 $64 $449 $150 $2,500 $2,320 $447 $300 $2,254 $200 $447 $200
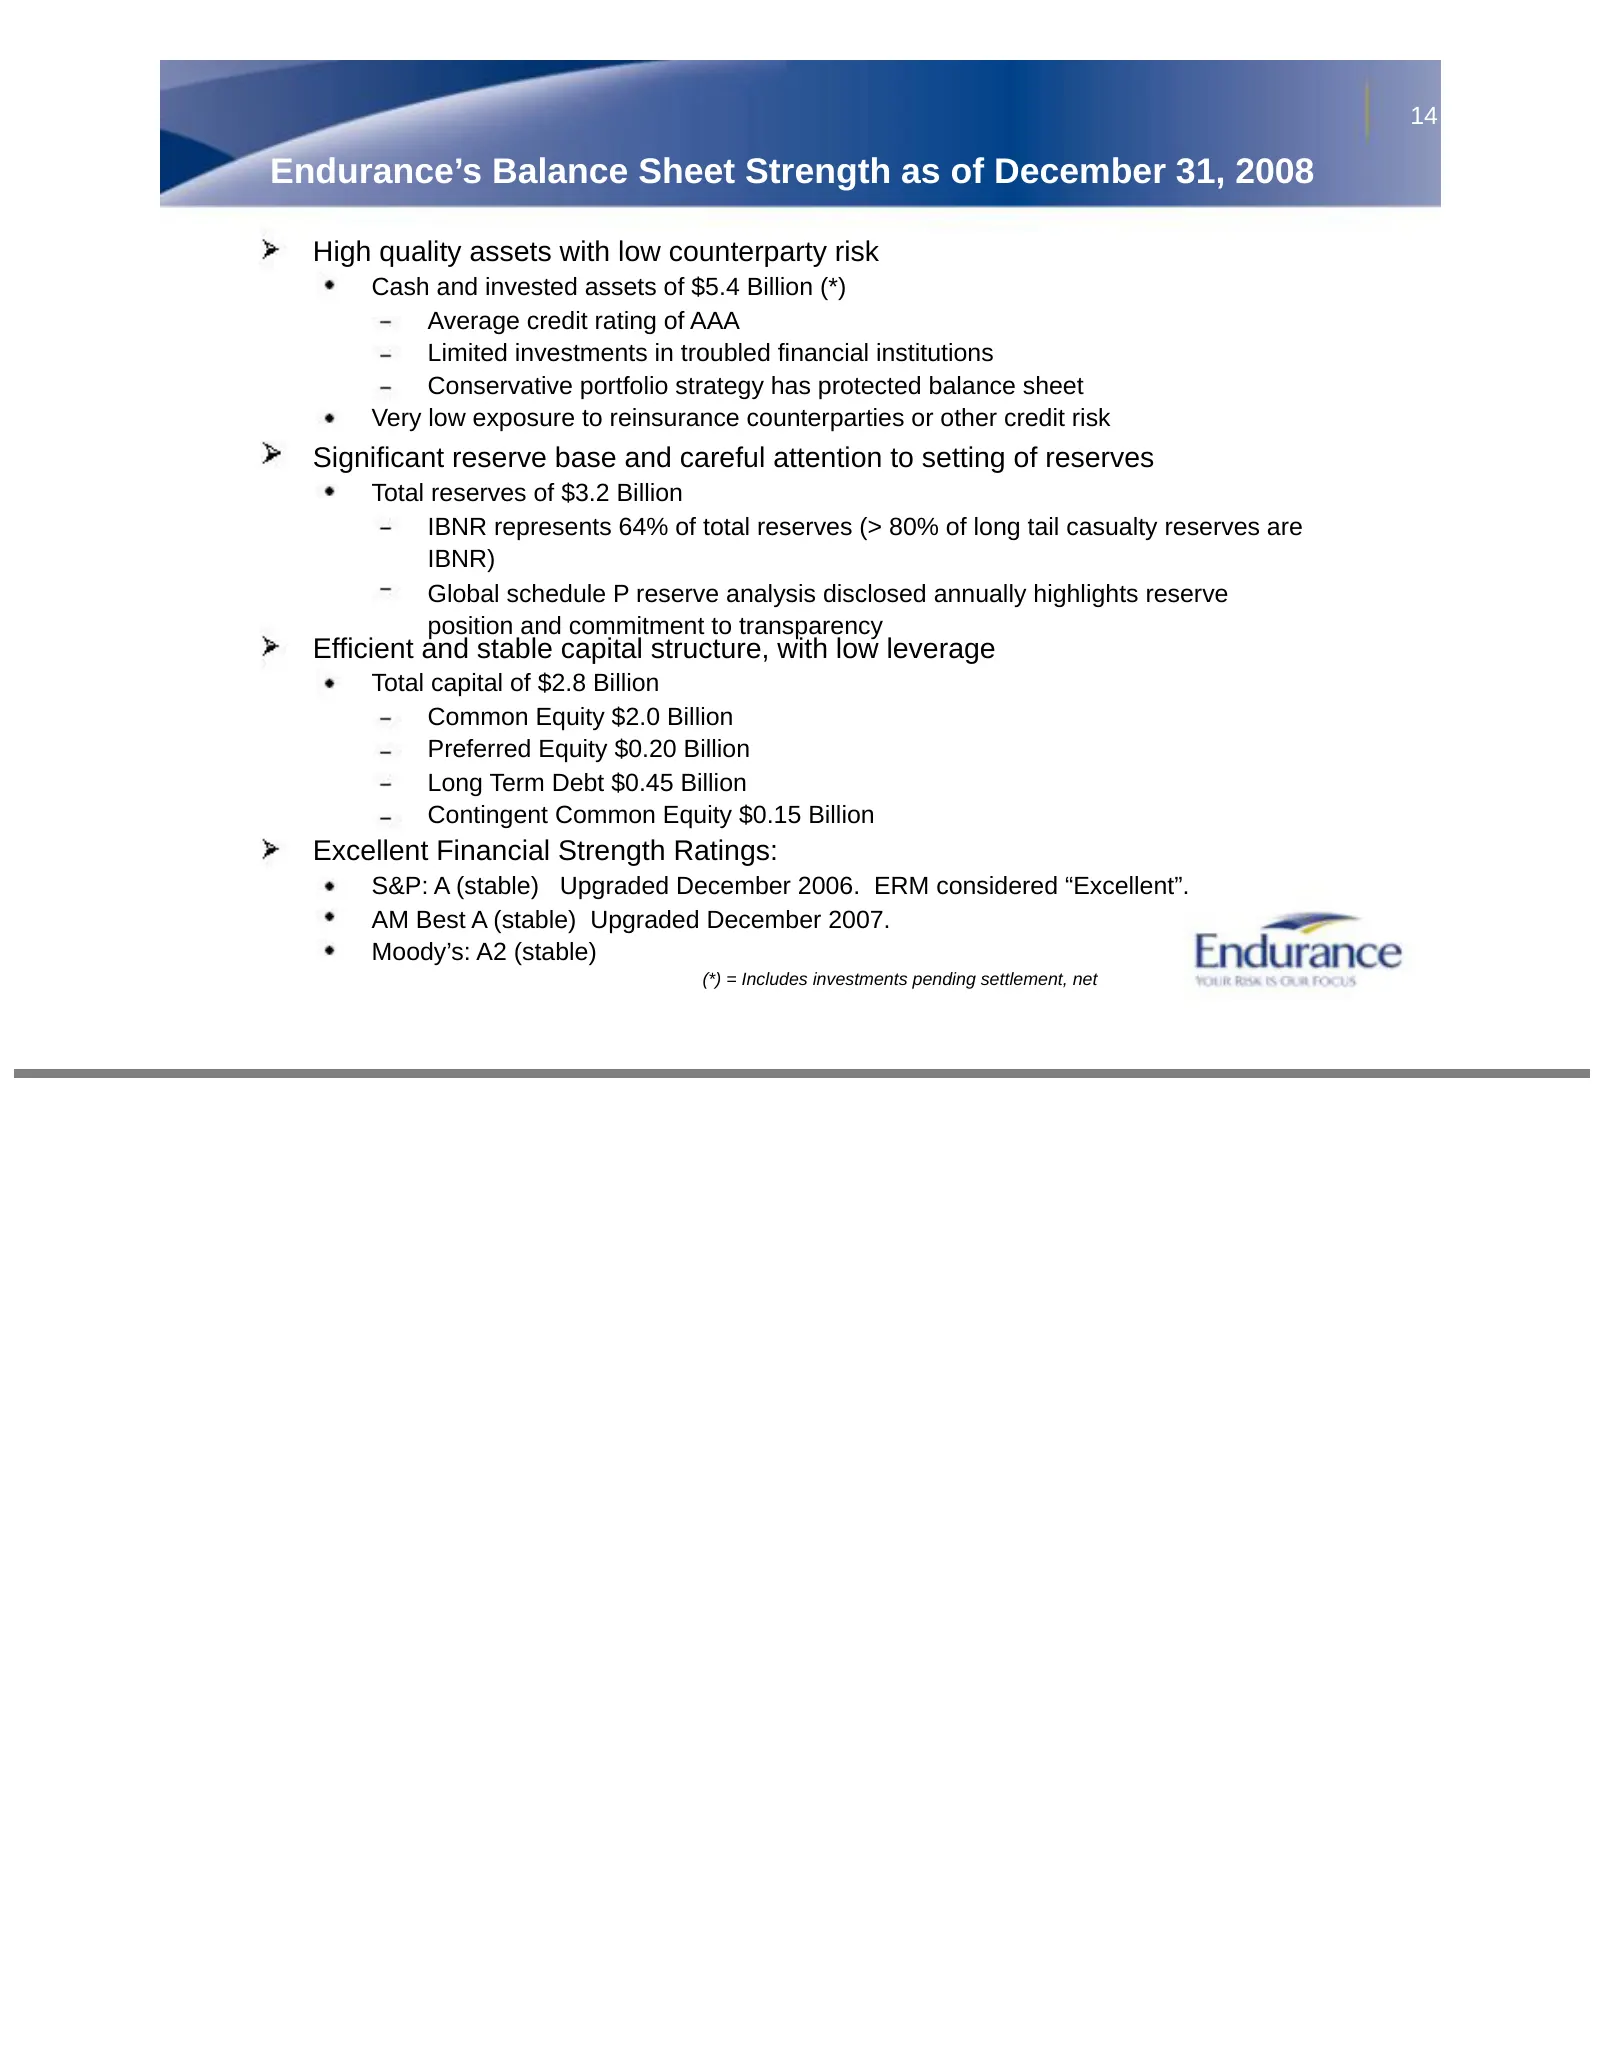
Slide 14: Endurance's Balance Sheet Strength as of December 31, 2008
14 Endurance’s Balance Sheet Strength as of December 31, 2008 High quality assets with low counterparty risk Cash and invested assets of $5.4 Billion (*) Average credit rating of AAA Limited investments in troubled financial institutions Conservative portfolio strategy has protected balance sheet Ve
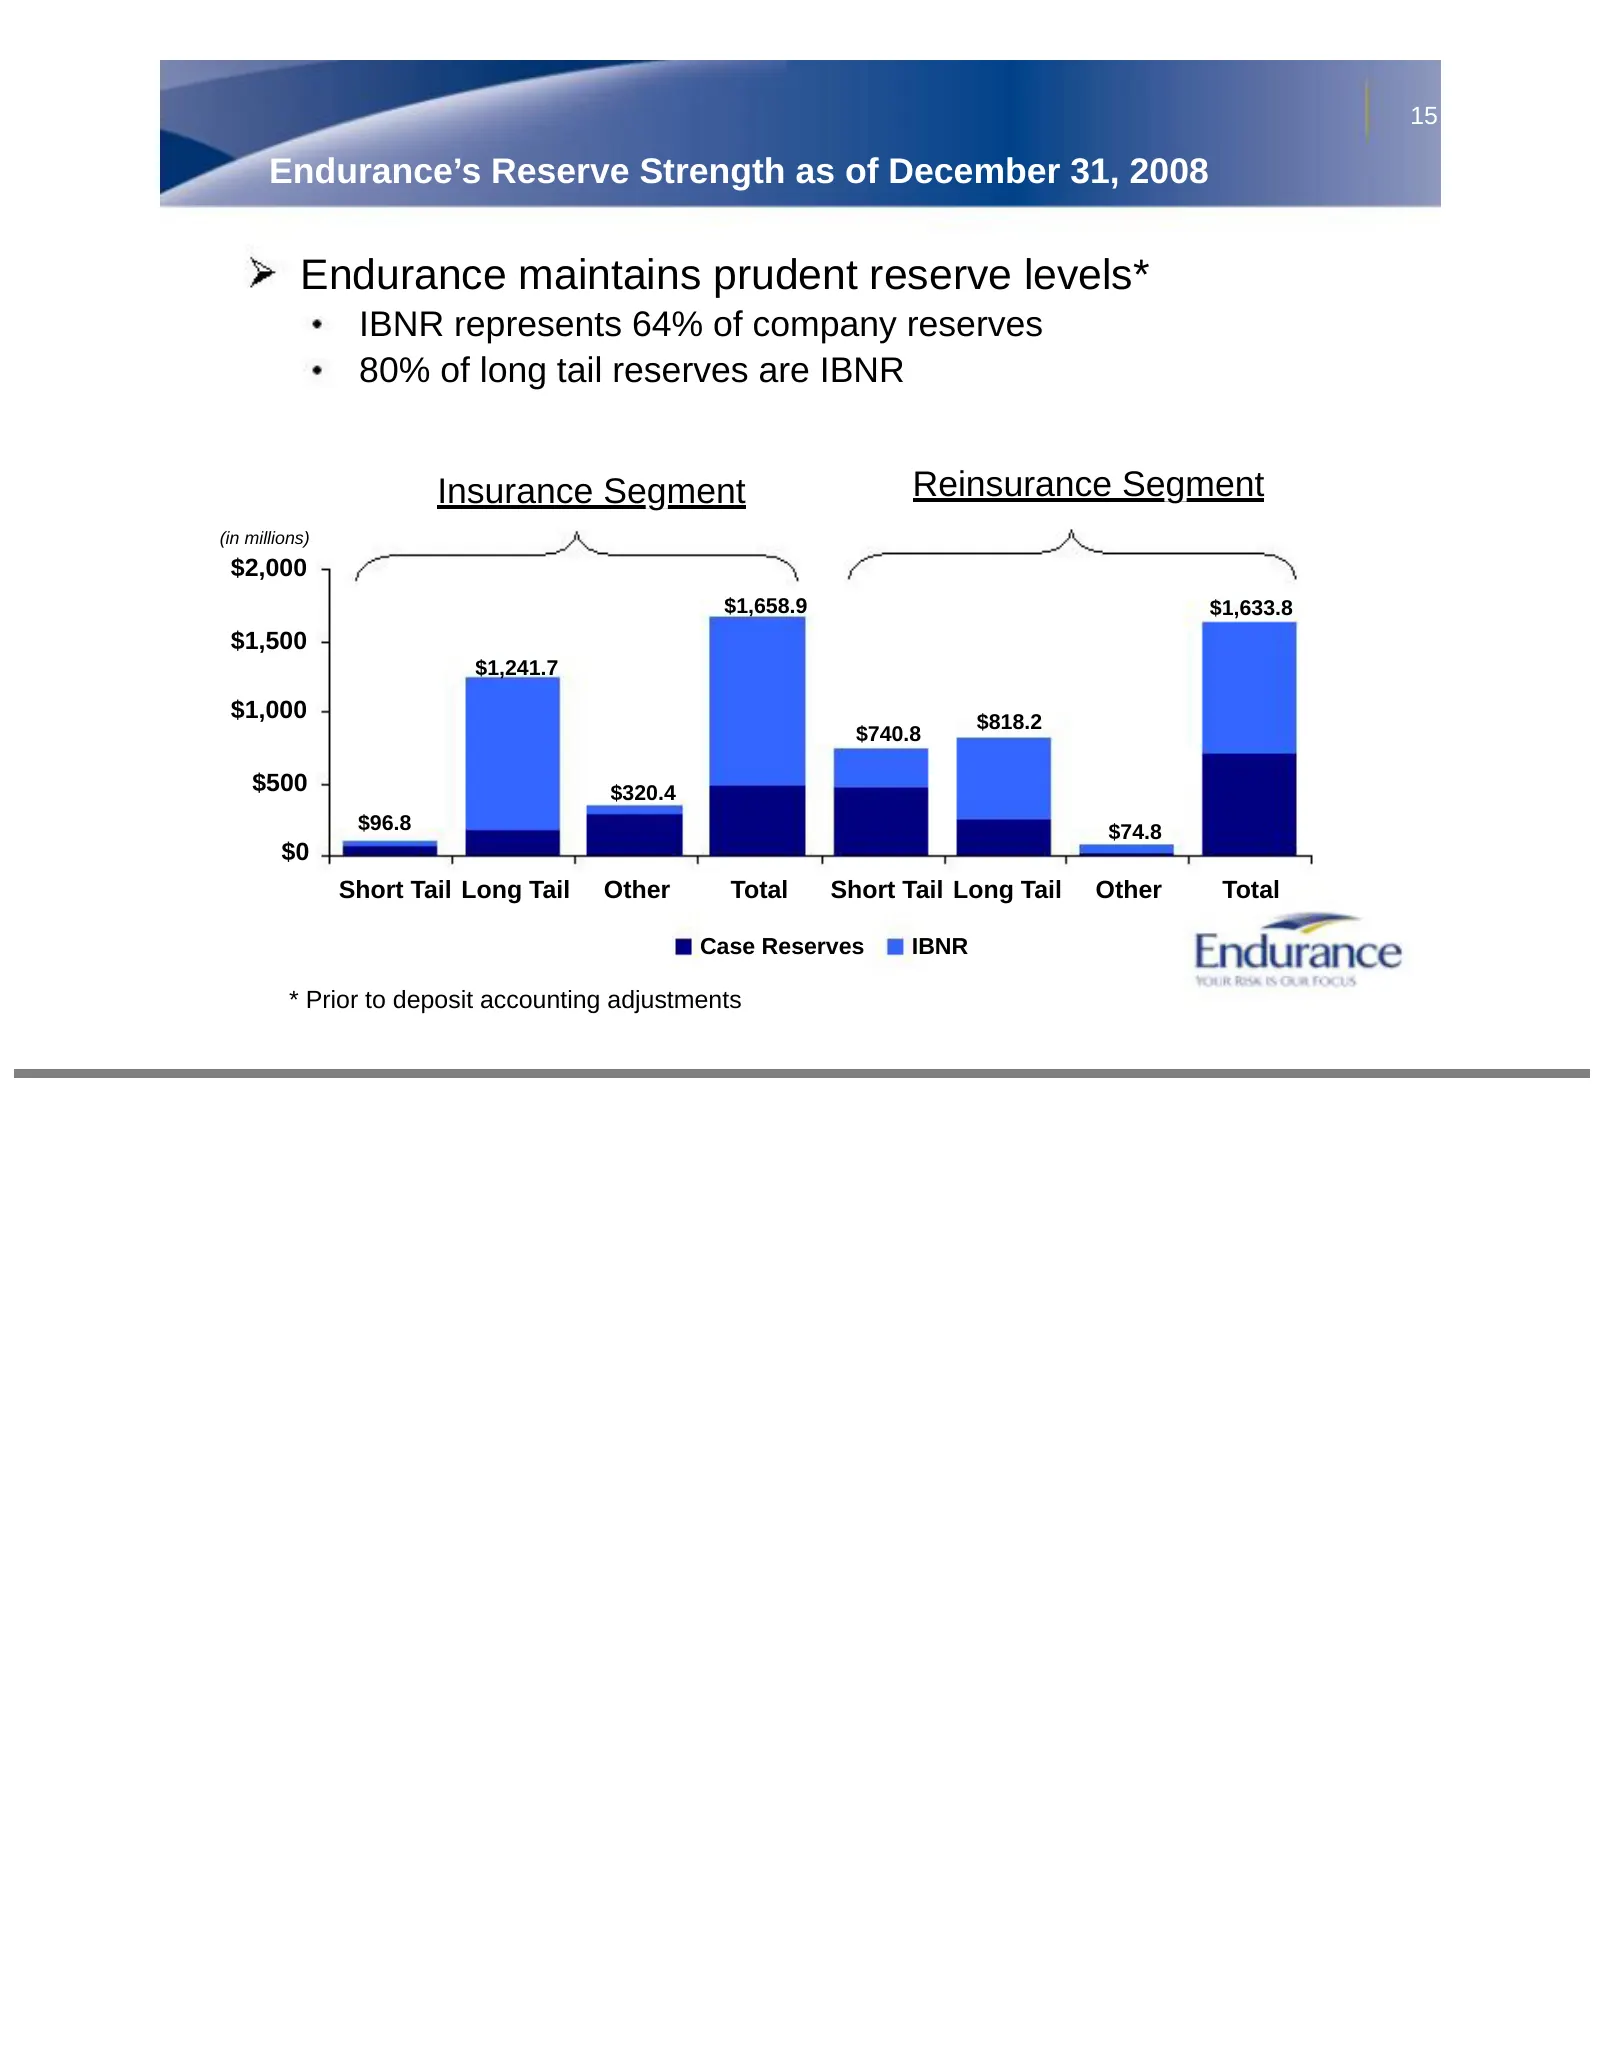
Slide 15: Endurance's Reserve Strength as of December 31, 2008
15 Endurance’s Reserve Strength as of December 31, 2008 Endurance maintains prudent reserve levels* IBNR represents 64% of company reserves 80% of long tail reserves are IBNR Insurance Segment Reinsurance Segment (in millions) $2,000 $1,658.9 $1,633.8 $1,500 $1,241.7 $1,000 $818.2 $740.8 $500 $320.4
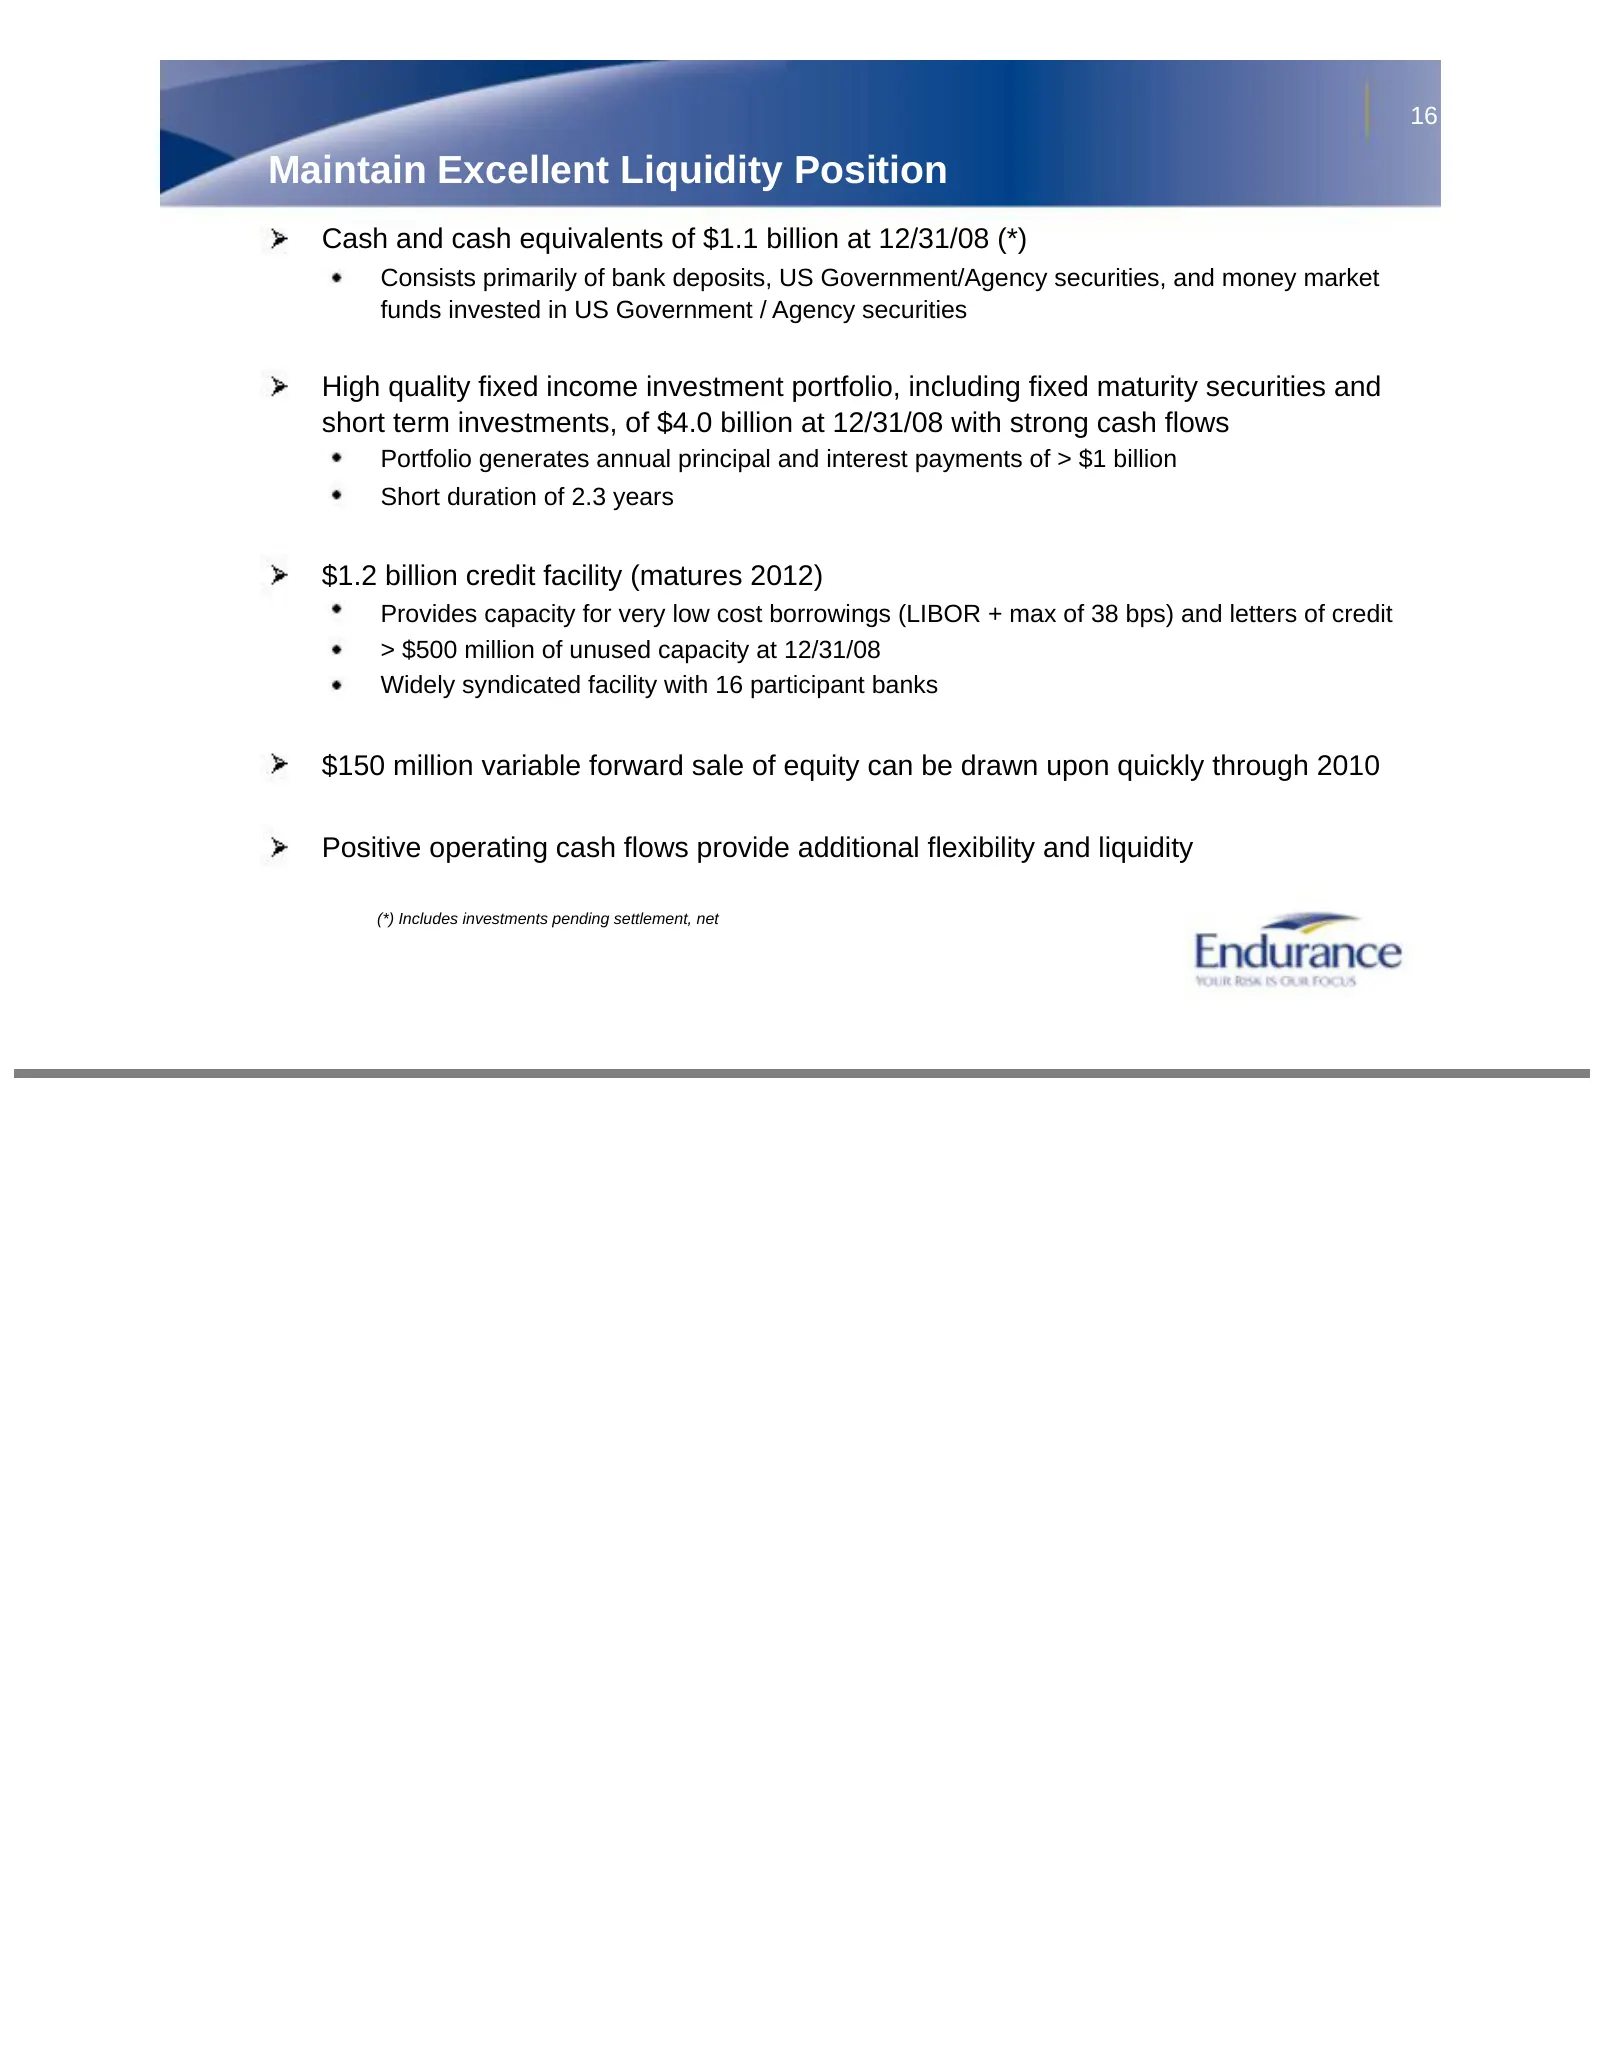
Slide 16: Maintain Excellent Liquidity Position
16 Maintain Excellent Liquidity Position Cash and cash equivalents of $1.1 billion at 12/31/08 (*) Consists primarily of bank deposits, US Government/Agency securities, and money market funds invested in US Government / Agency securities High quality fixed income investment portfolio, including fixe
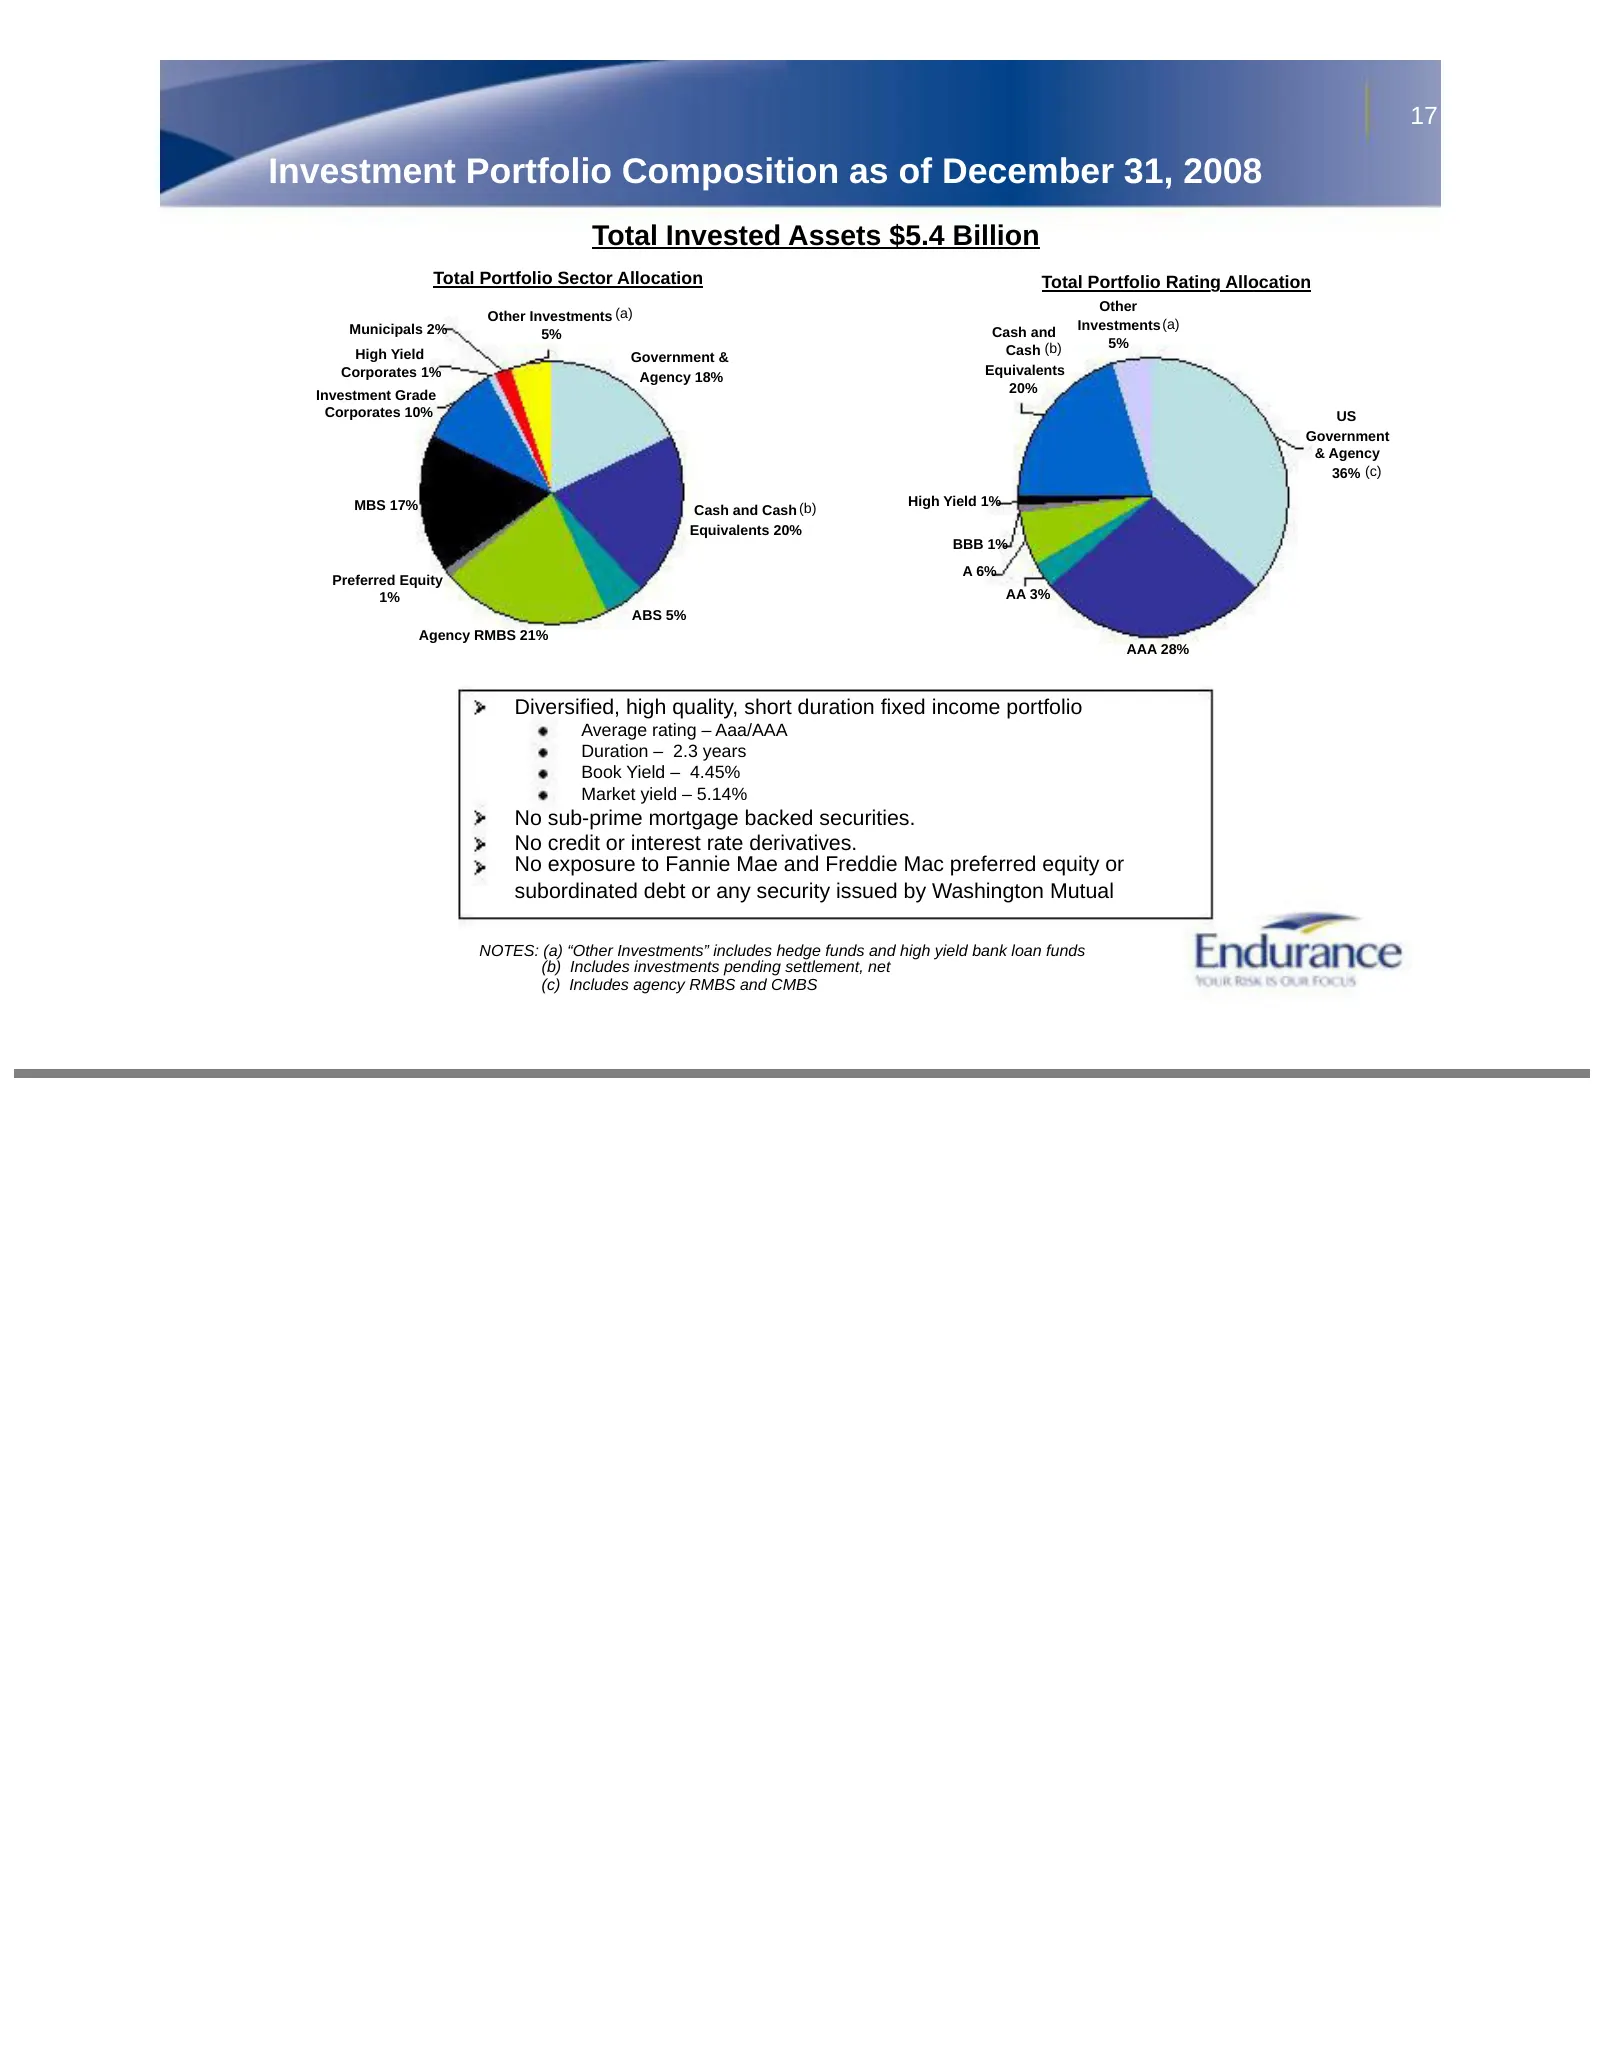
Slide 17: Investment Portfolio Composition as of December 31, 2008
17 Investment Portfolio Composition as of December 31, 2008 Total Invested Assets $5.4 Billion Total Portfolio Sector Allocation Total Portfolio Rating Allocation Other Other Investments (a) Municipals 2% Cash and Investments (a) 5% 5% High Yield Government & Cash (b) Corporates 1% Agency 18% Equiva
Slide 18: Agenda
18 Agenda 1 Endurance Overview 2 Financial Strength Summary 3 Review of Financial Results 4 Appendix
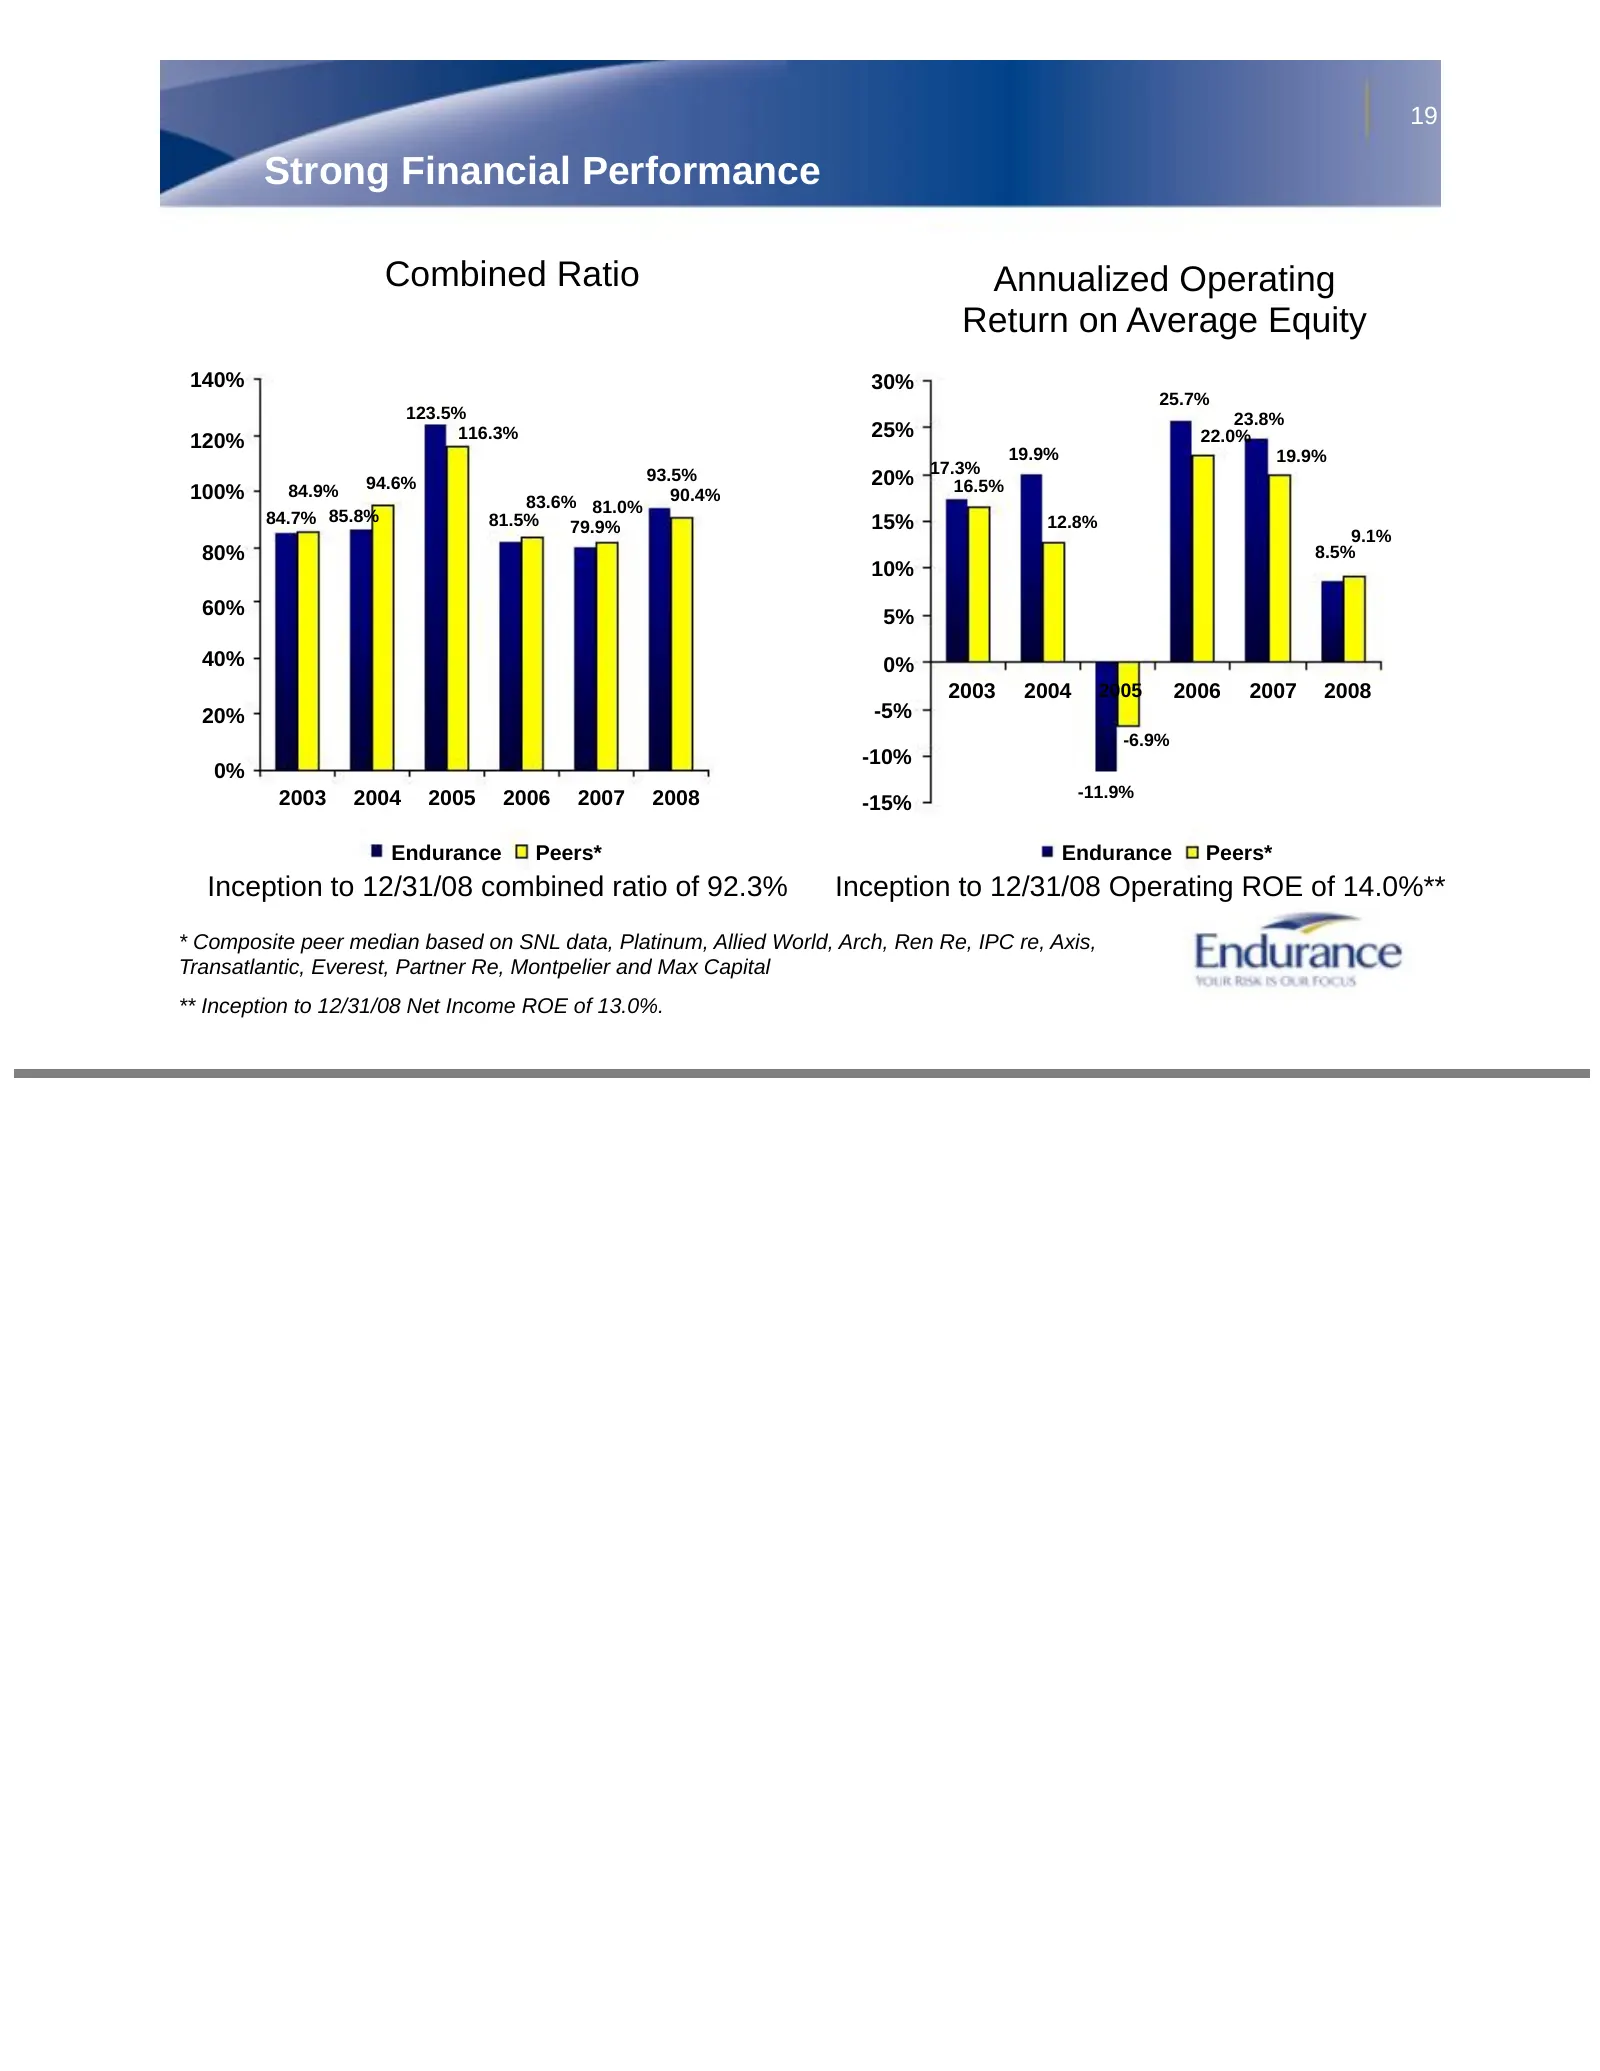
Slide 19: Strong Financial Performance
19 Strong Financial Performance Combined Ratio Annualized Operating Return on Average Equity 140% 30% 25.7% 123.5% 23.8% 120% 116.3% 25% 22.0% 19.9% 19.9% 94.6% 93.5% 20% 17.3% 16.5% 100% 84.9% 83.6% 81.0% 90.4% 84.7% 85.8% 81.5% 15% 12.8% 79.9% 9.1% 80% 8.5% 10% 60% 5% 40% 0% 2003 2004 2005 2006 20
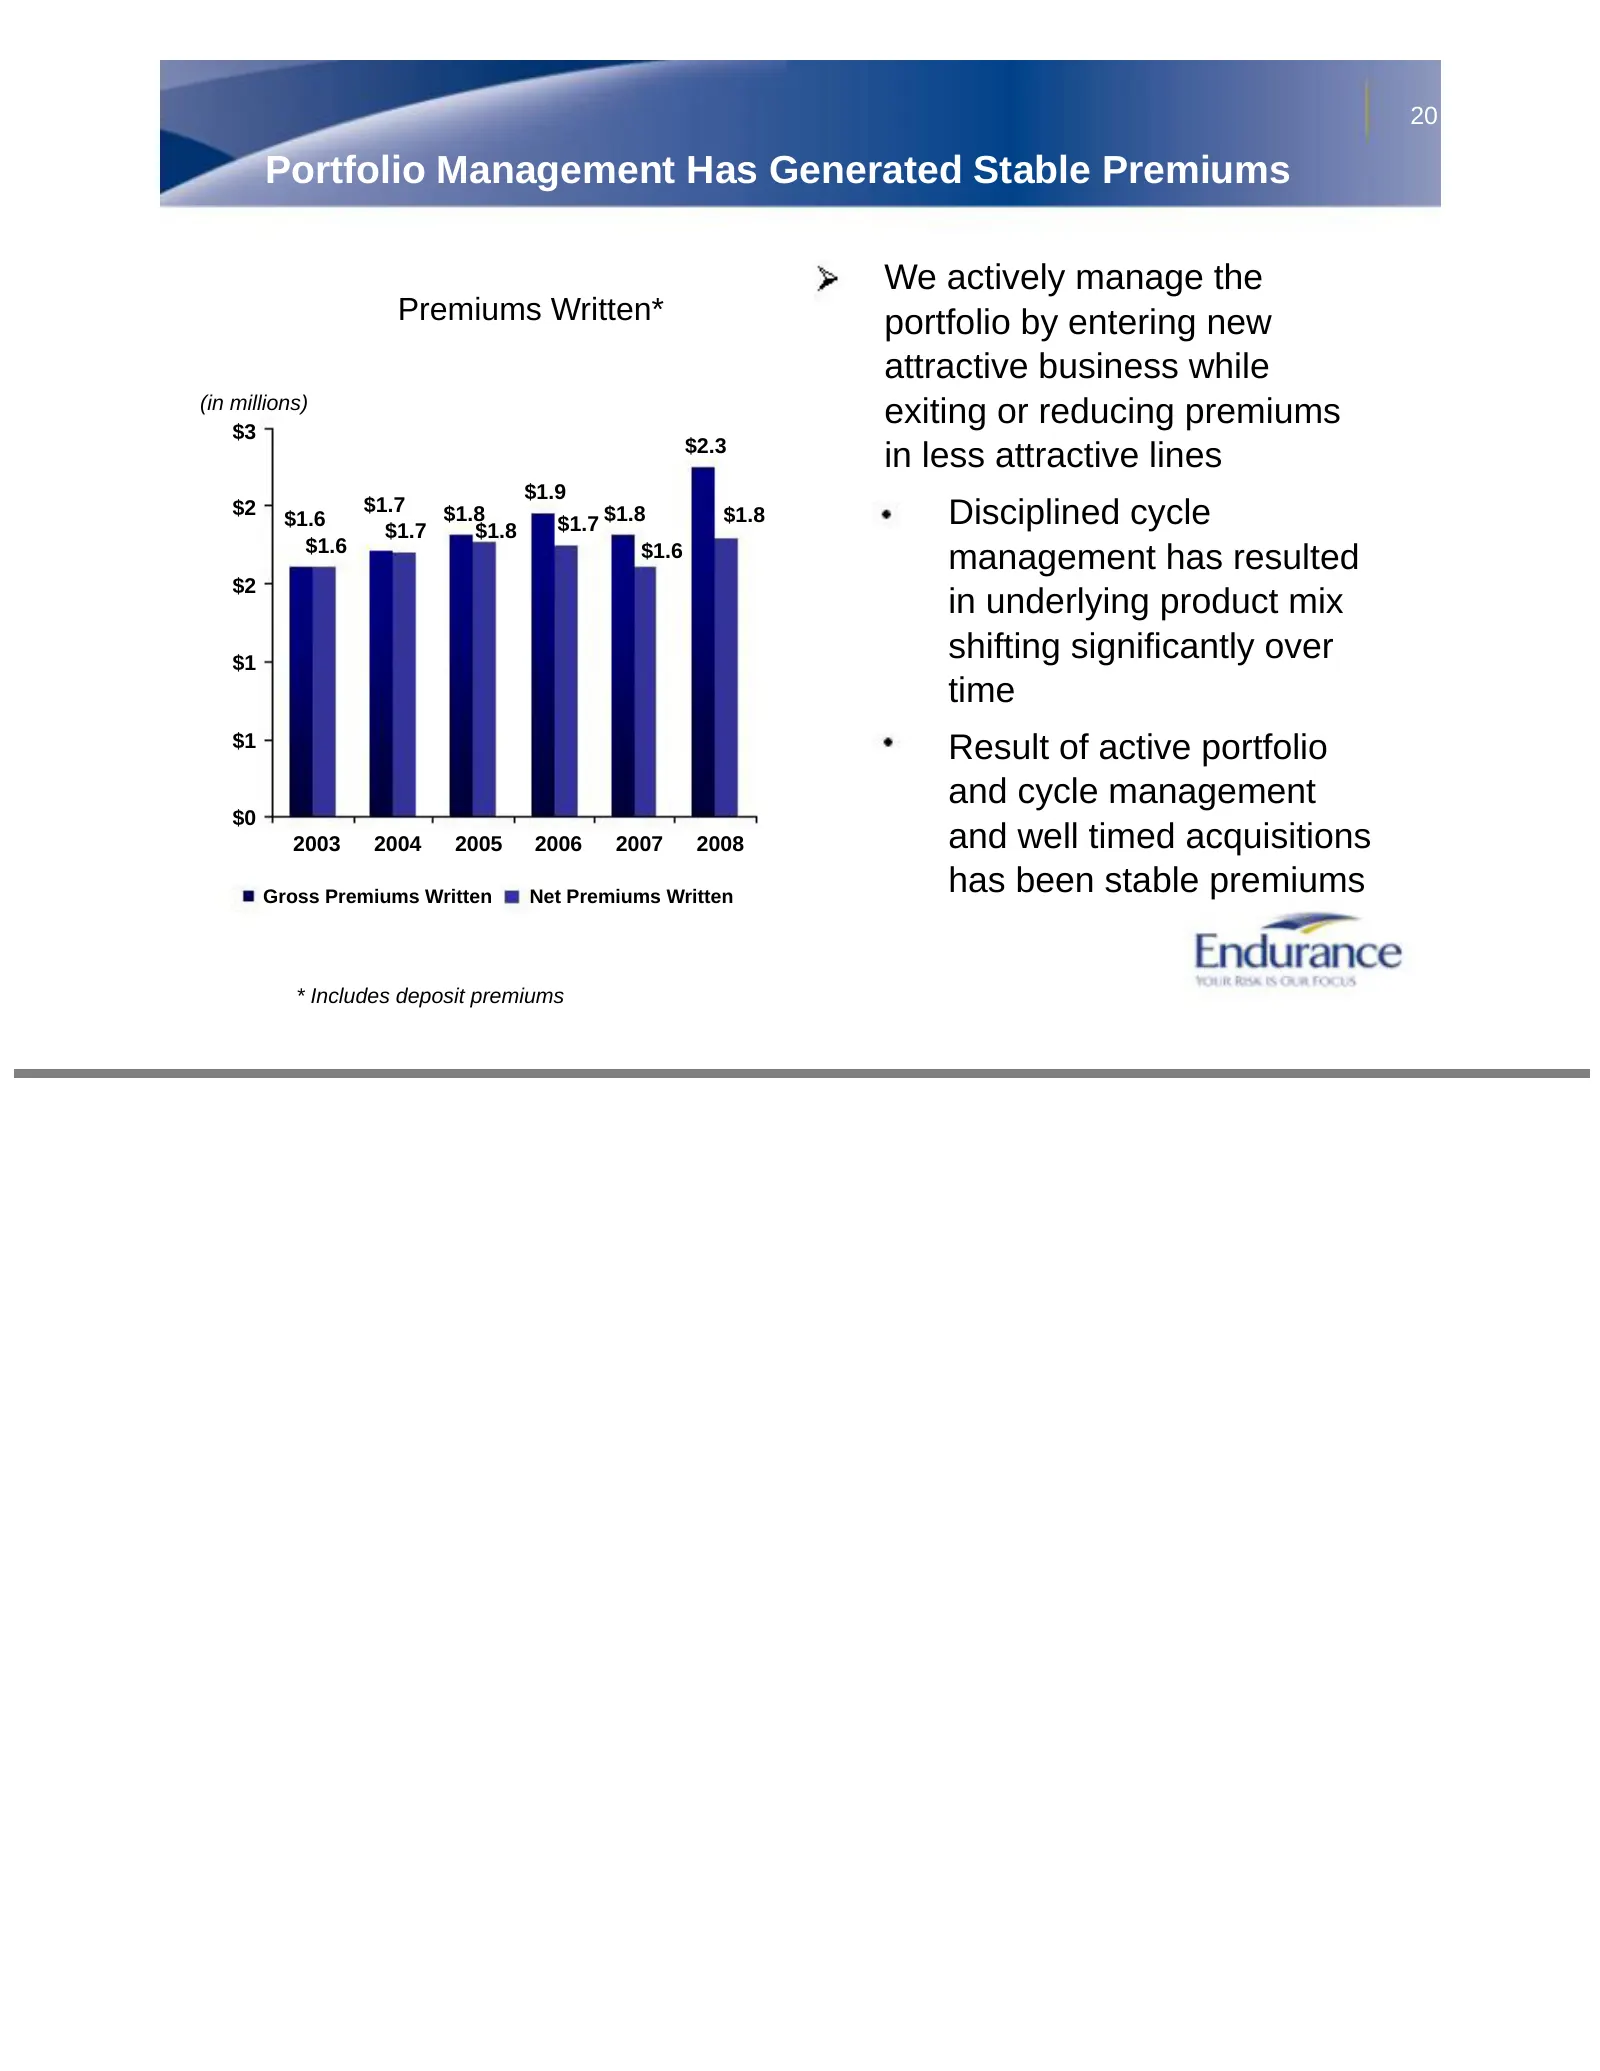
Slide 20: Portfolio Management Has Generated Stable Premiums
20 Portfolio Management Has Generated Stable Premiums We actively manage the Premiums Written* portfolio by entering new attractive business while (in millions) $3 exiting or reducing premiums $2.3 in less attractive lines $1.9 $2 $1.6 $1.7 $1.7 $1.8 $1.8 $1.7 $1.8 $1.8 Disciplined cycle $1.6 $1.6 m
Slide 21: Underwriting Has Been Strong
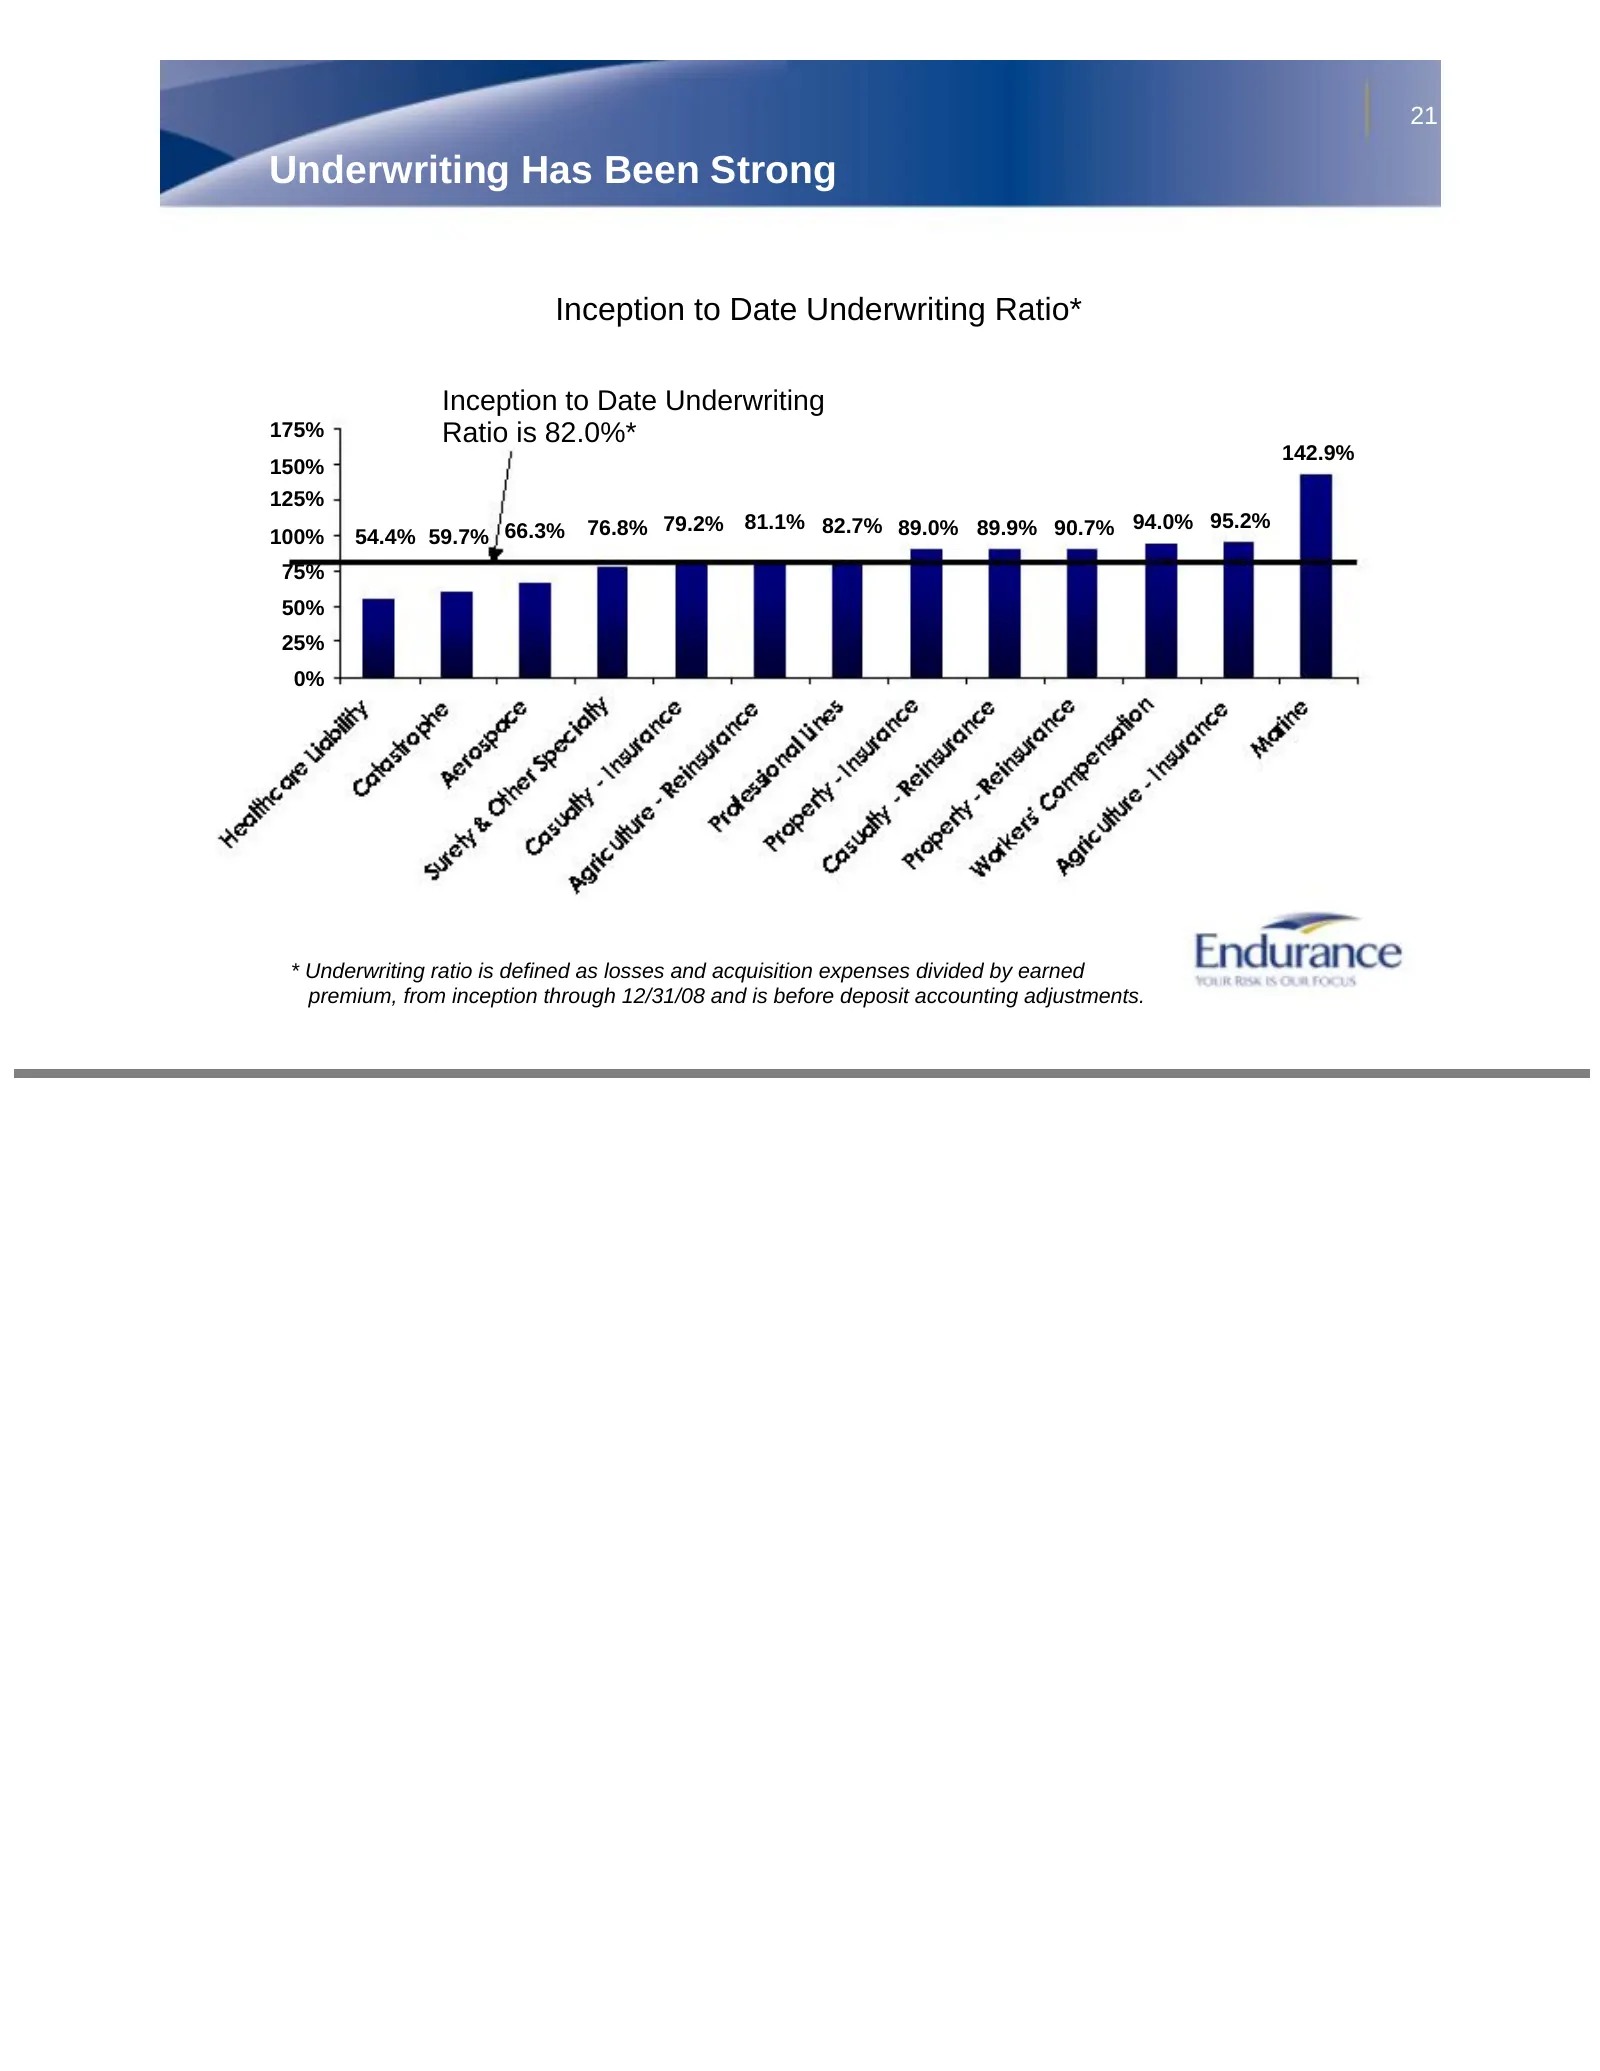
21 Underwriting Has Been Strong Inception to Date Underwriting Ratio* Inception to Date Underwriting 175% Ratio is 82.0%* 142.9% 150% 125% 100% 54.4% 59.7% 66.3% 76.8% 79.2% 81.1% 82.7% 89.0% 89.9% 90.7% 94.0% 95.2% 75% 50% 25% 0% * Underwriting ratio is defined as losses and acquisition expenses di
Slide 22: Delivering Shareholder Value
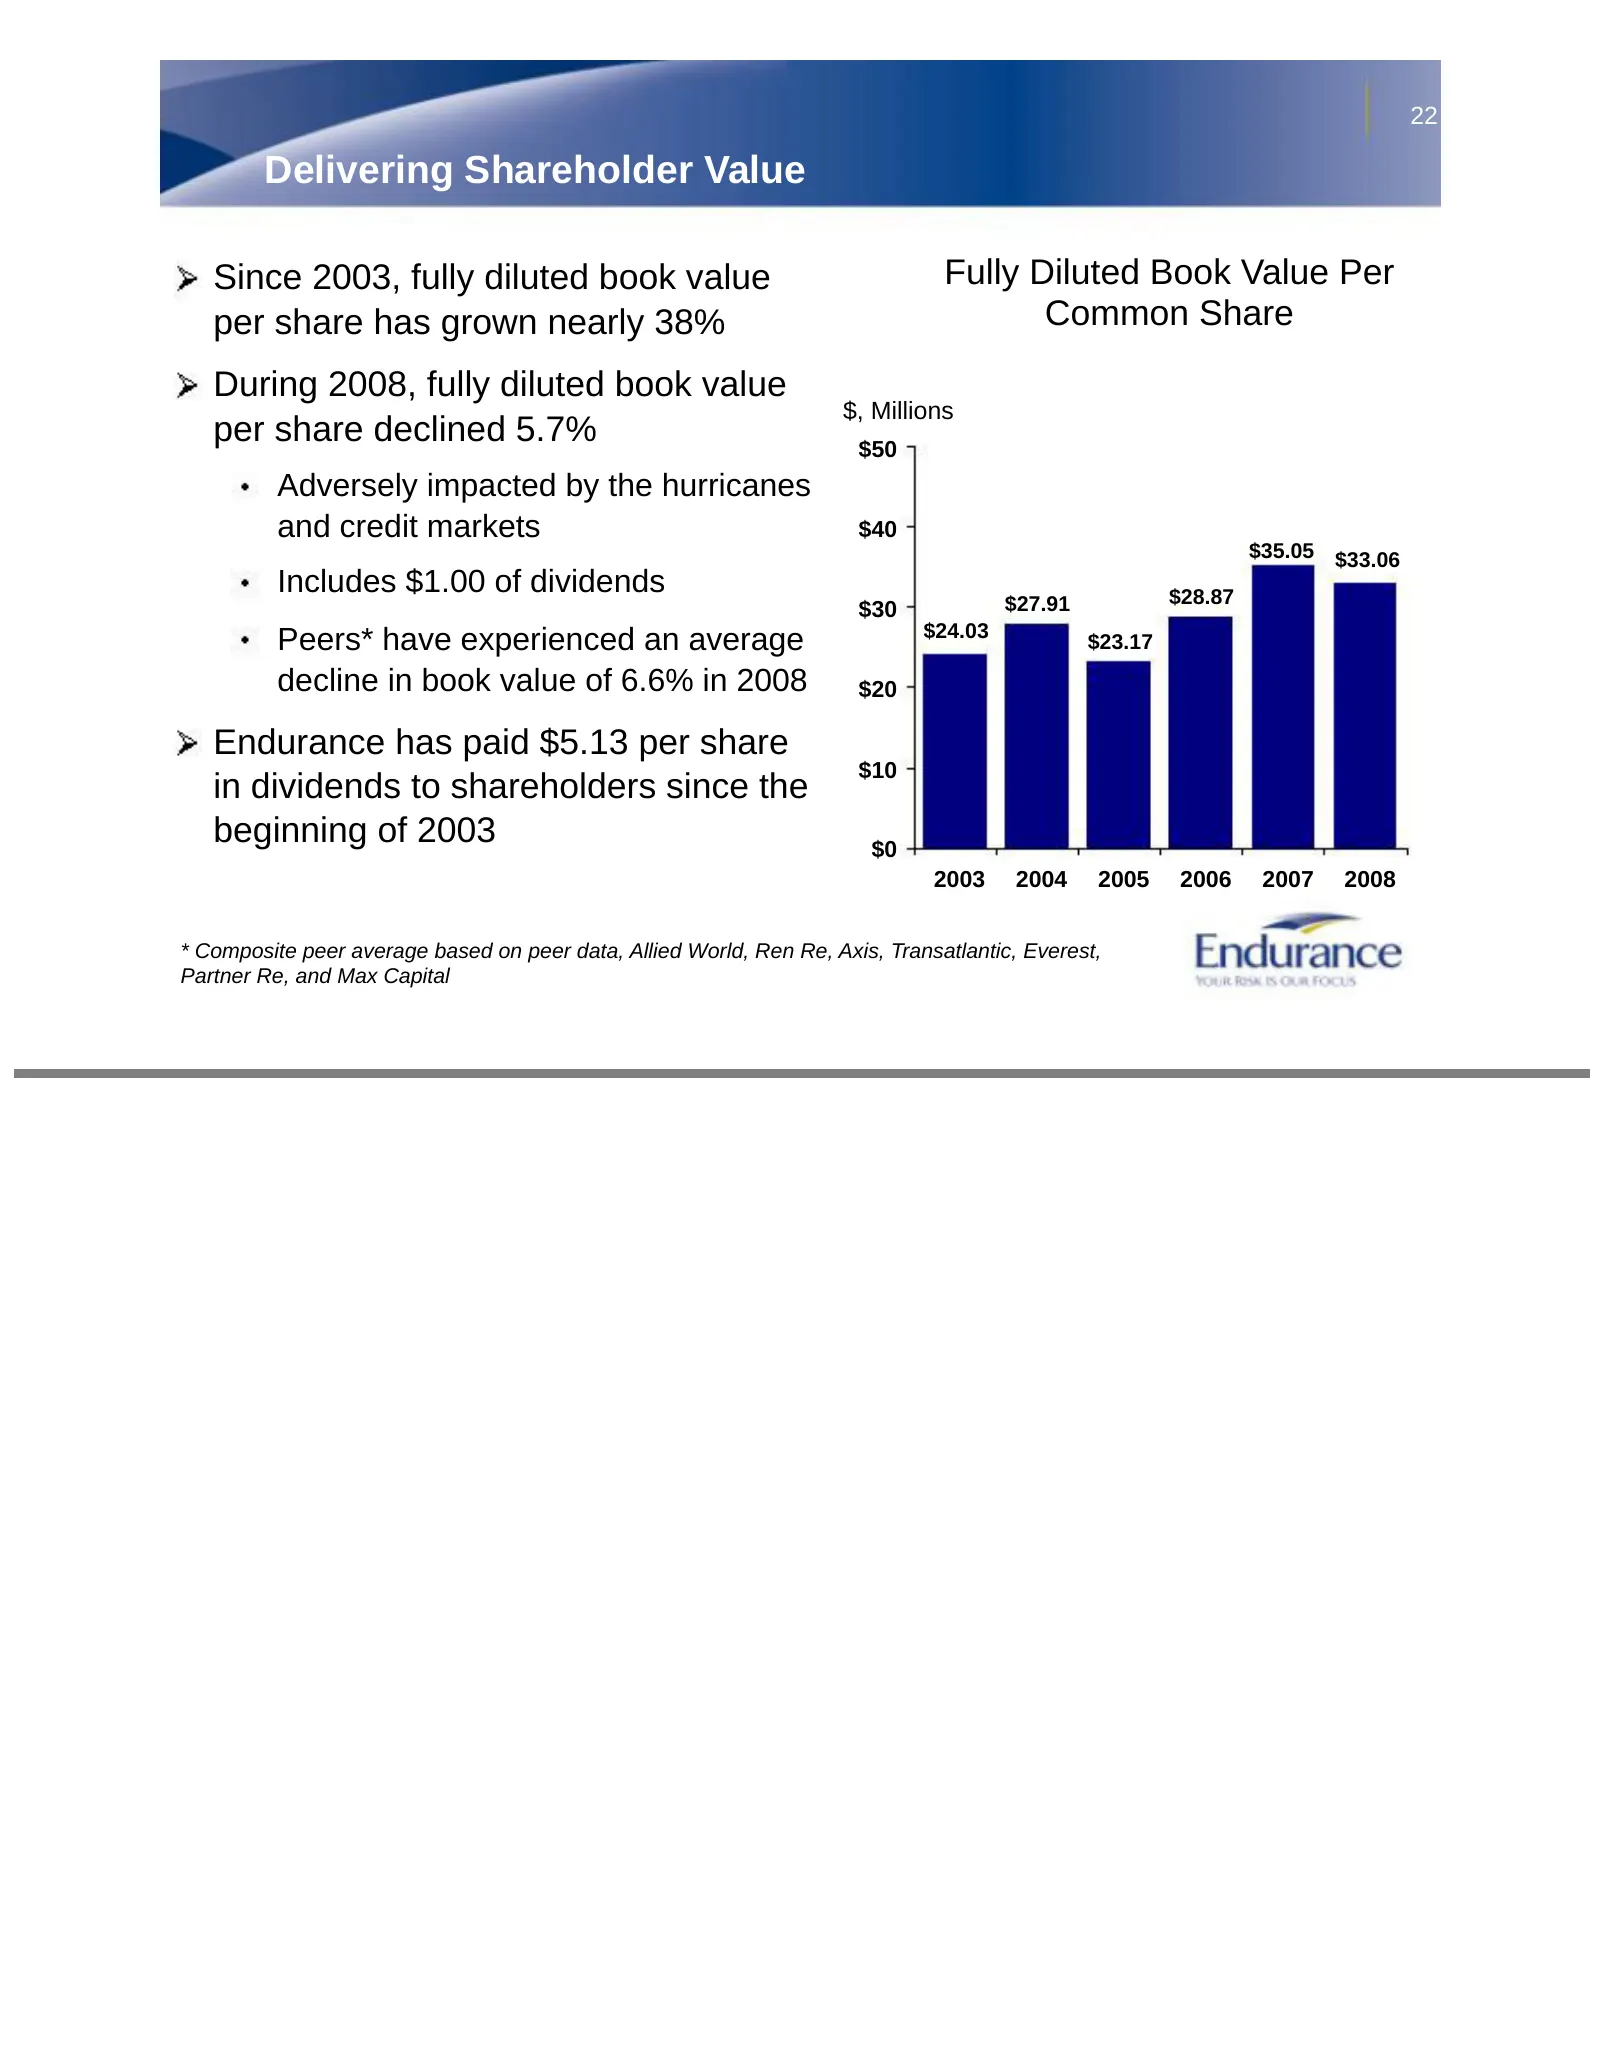
22 Delivering Shareholder Value Since 2003, fully diluted book value Fully Diluted Book Value Per per share has grown nearly 38% Common Share During 2008, fully diluted book value $, Millions per share declined 5.7% $50 Adversely impacted by the hurricanes and credit markets $40 $35.05 $33.06 Includ
Slide 23: Conclusion
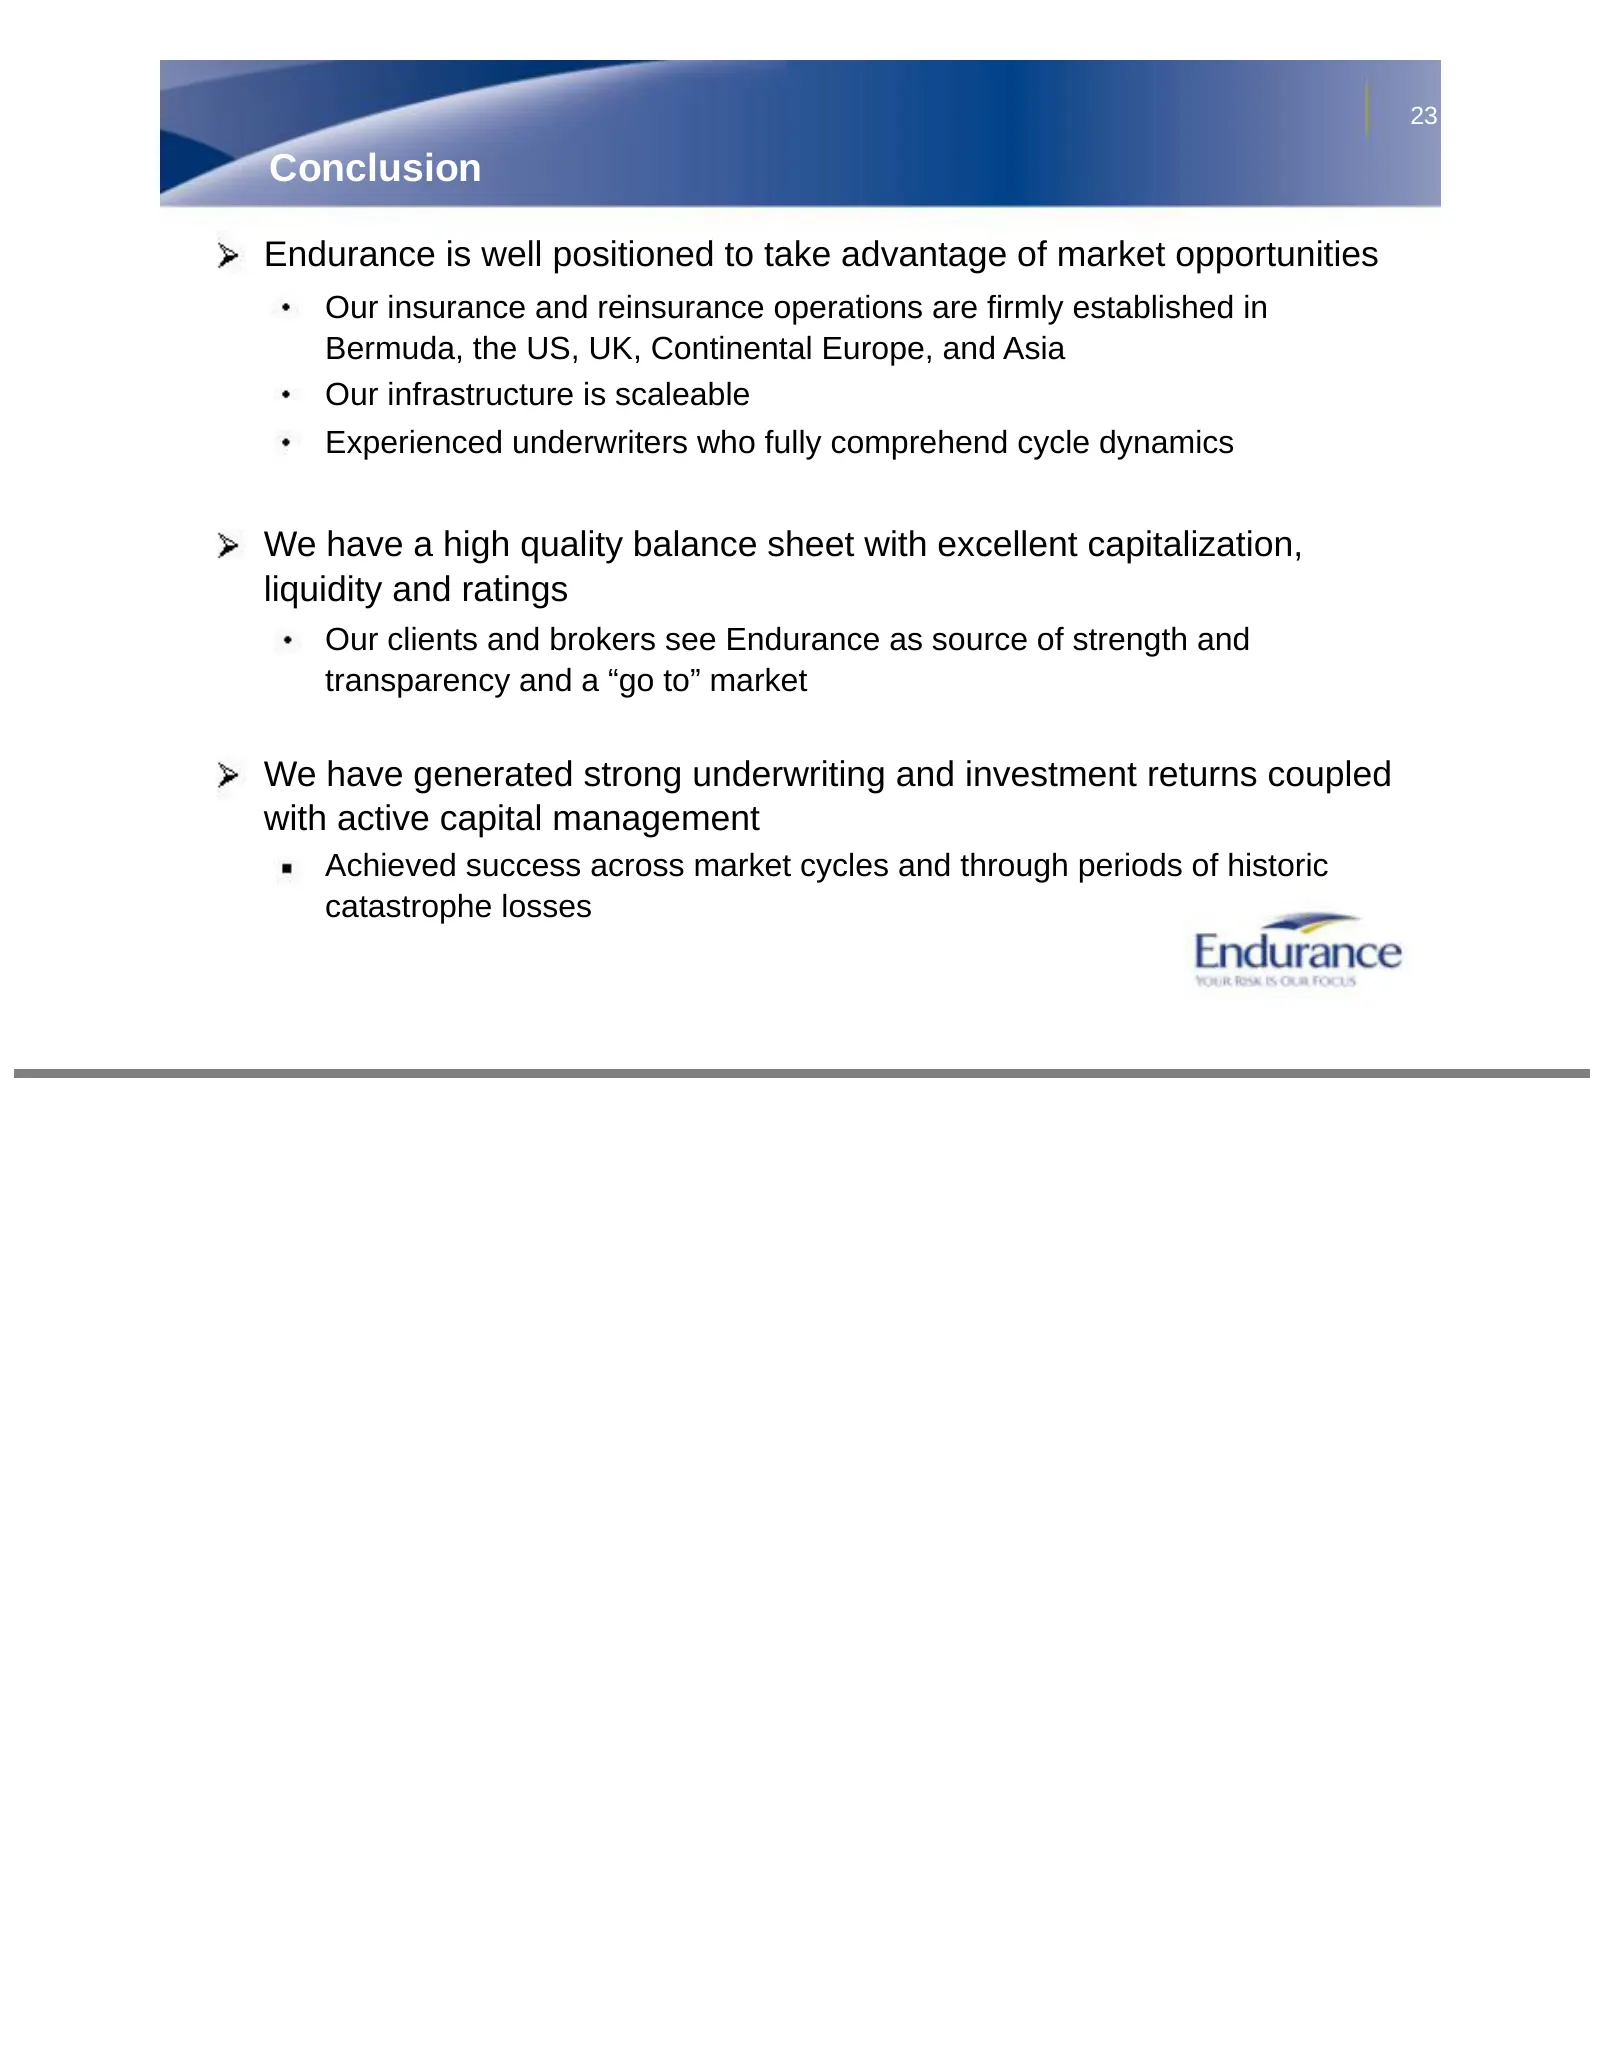
23 Conclusion Endurance is well positioned to take advantage of market opportunities Our insurance and reinsurance operations are firmly established in Bermuda, the US, UK, Continental Europe, and Asia Our infrastructure is scaleable Experienced underwriters who fully comprehend cycle dynamics We ha
Slide 24: Agenda
24 Agenda 1 Endurance Overview 2 Financial Strength Summary 3 Review of Financial Results 4 Appendix
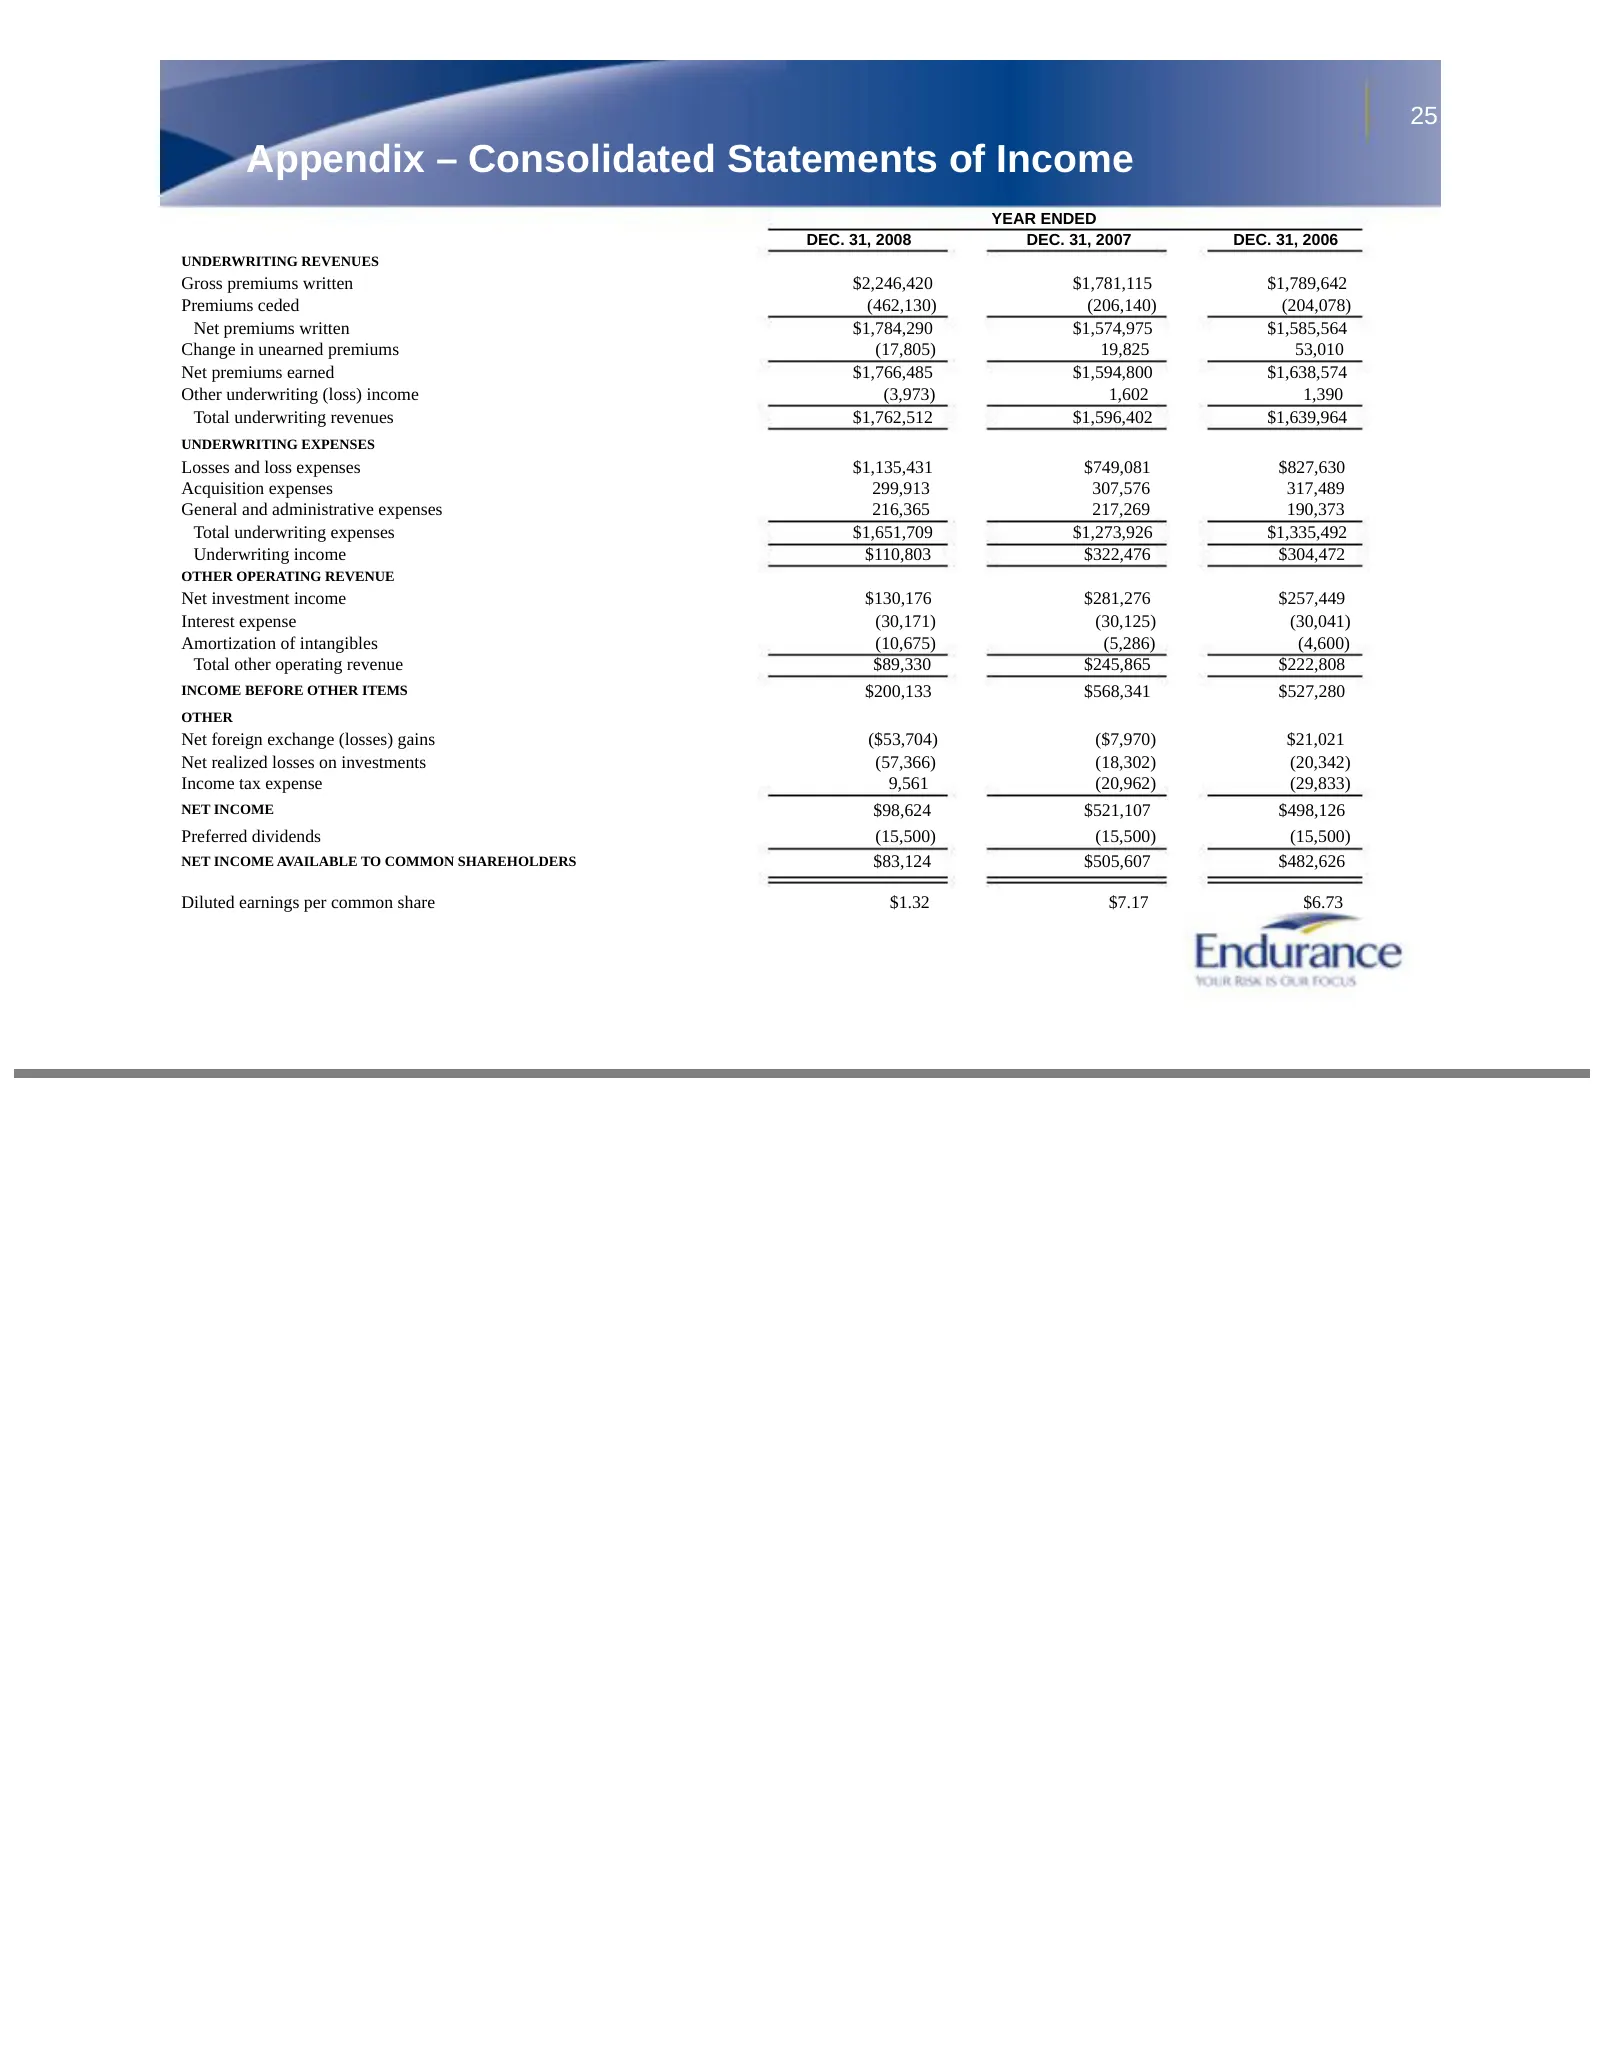
Slide 25: Appendix – Consolidated Statements of Income
25 Appendix – Consolidated Statements of Income YEAR ENDED DEC. 31, 2008 DEC. 31, 2007 DEC. 31, 2006 UNDERWRITING REVENUES Gross premiums written $2,246,420 $1,781,115 $1,789,642 Premiums ceded (462,130) (206,140) (204,078) Net premiums written $1,784,290 $1,574,975 $1,585,564 Change in unearned pre
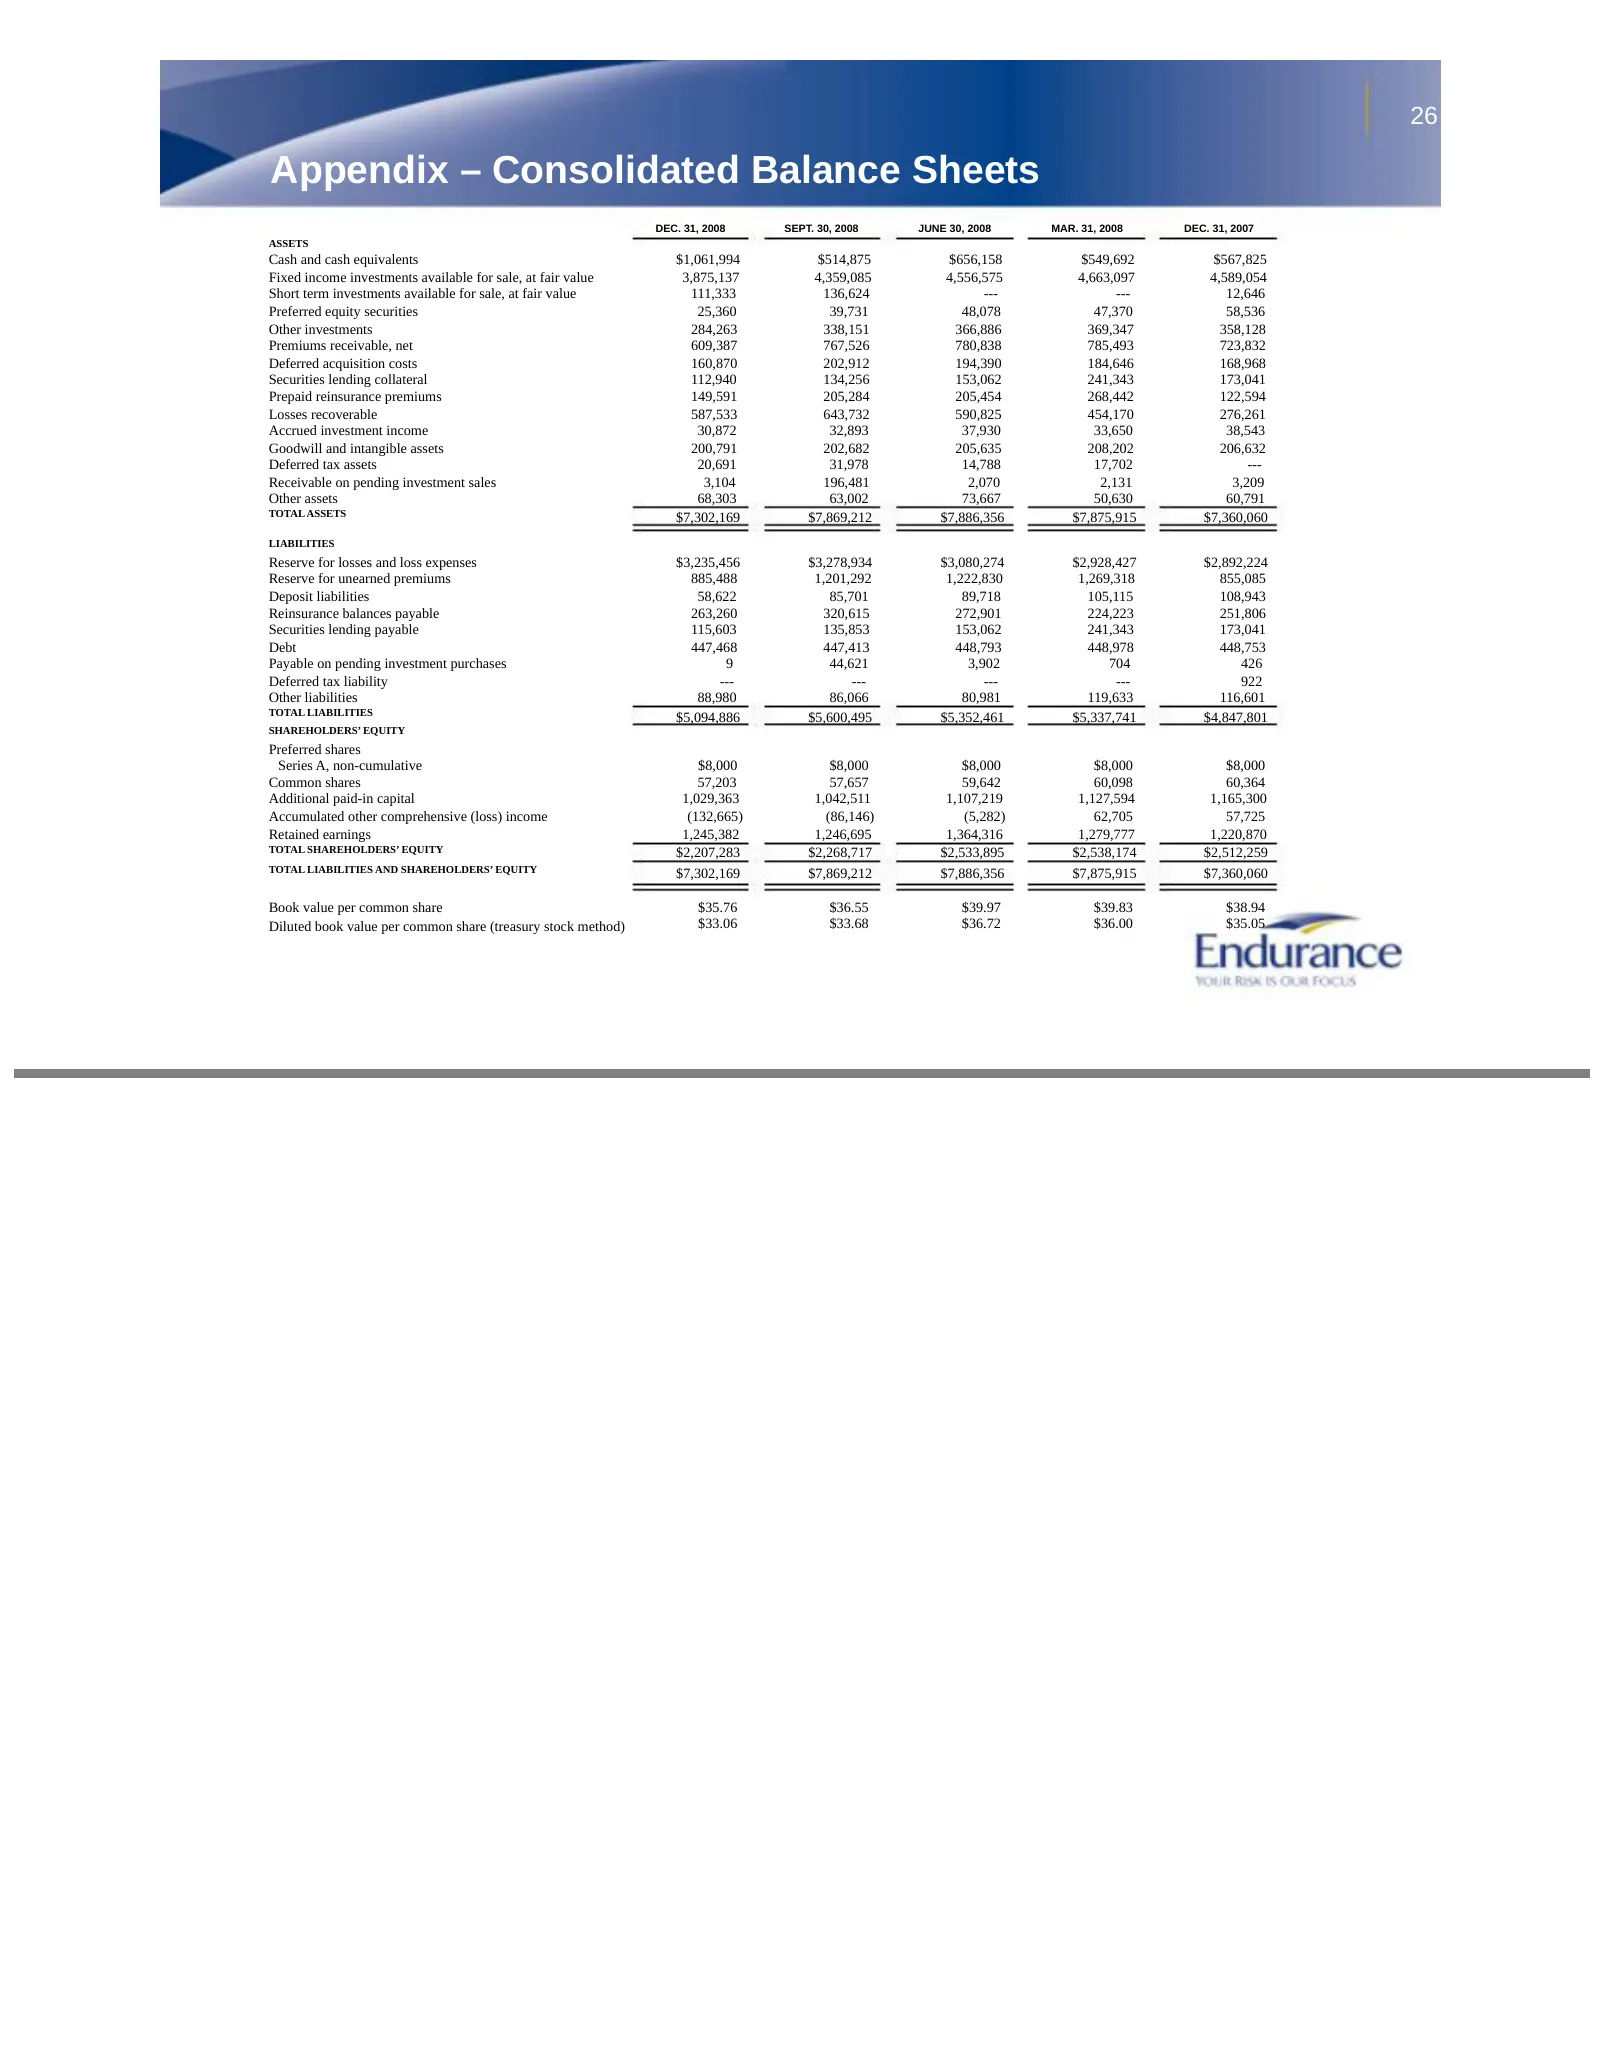
Slide 26: Appendix – Consolidated Balance Sheets
26 Appendix – Consolidated Balance Sheets DEC. 31, 2008 SEPT. 30, 2008 JUNE 30, 2008 MAR. 31, 2008 DEC. 31, 2007 ASSETS Cash and cash equivalents $1,061,994 $514,875 $656,158 $549,692 $567,825 Fixed income investments available for sale, at fair value 3,875,137 4,359,085 4,556,575 4,663,097 4,589,05
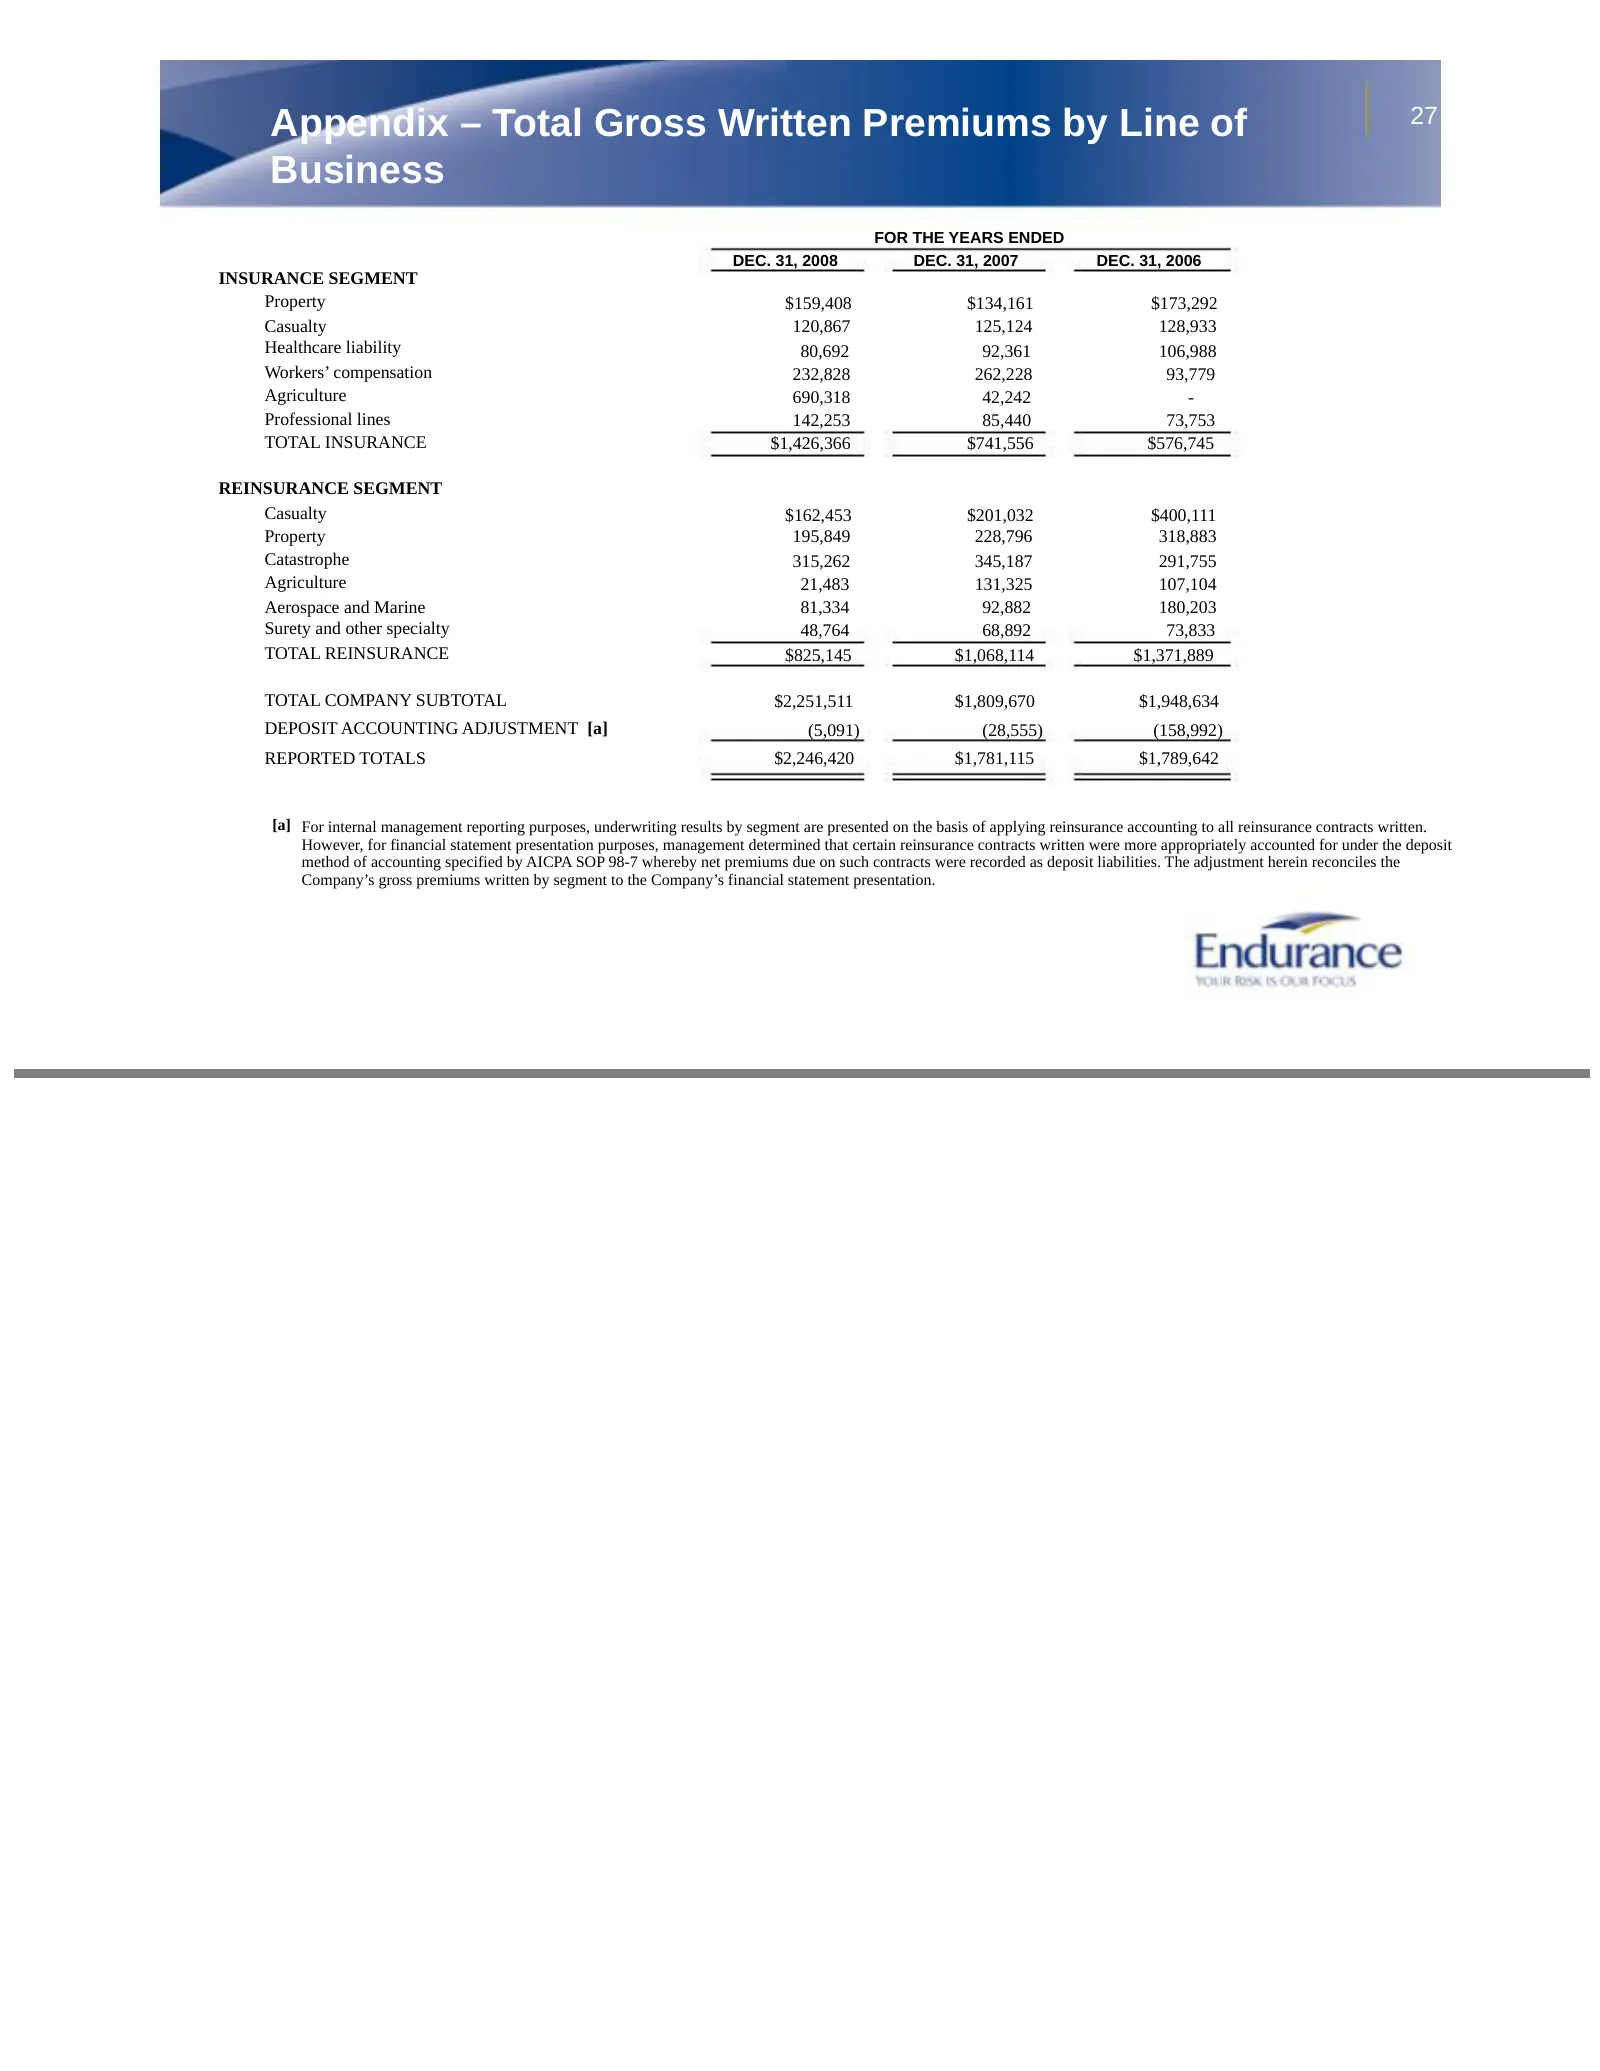
Slide 27: Appendix – Total Gross Written Premiums by Line of Business
Appendix – Total Gross Written Premiums by Line of 27 Business FOR THE YEARS ENDED DEC. 31, 2008 DEC. 31, 2007 DEC. 31, 2006 INSURANCE SEGMENT Property $159,408 $134,161 $173,292 Casualty 120,867 125,124 128,933 Healthcare liability 80,692 92,361 106,988 Workers’ compensation 232,828 262,228 93,779
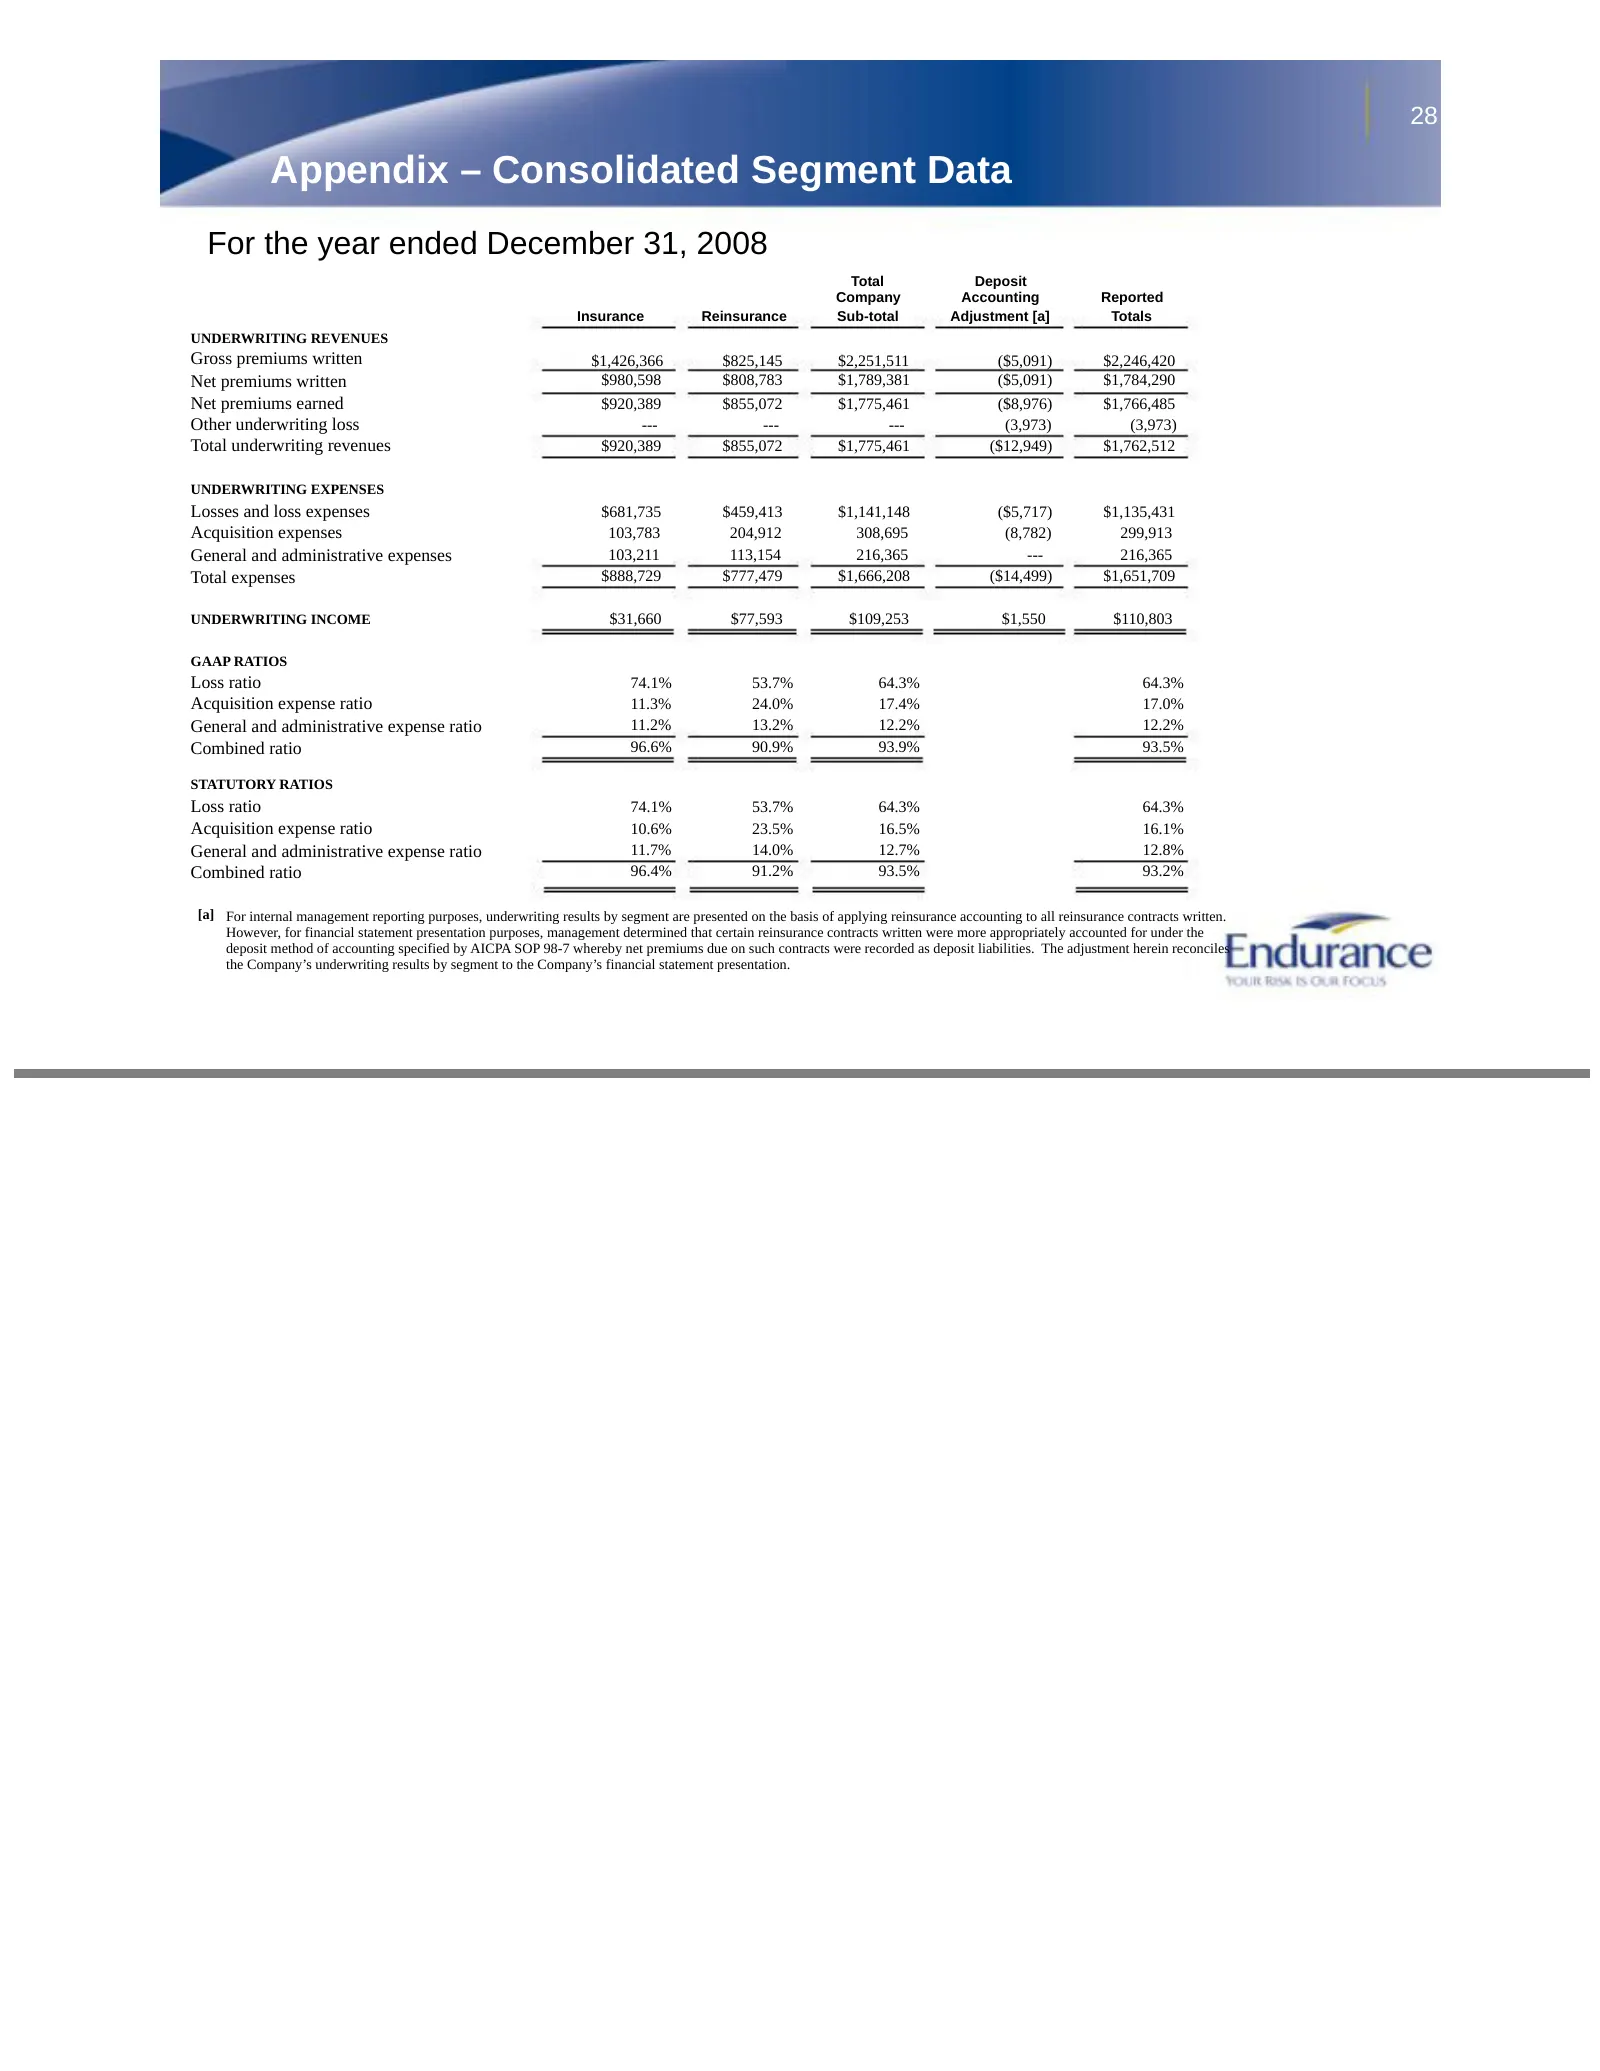
Slide 28: Appendix – Consolidated Segment Data
28 Appendix – Consolidated Segment Data For the year ended December 31, 2008 Total Deposit Company Accounting Reported Insurance Reinsurance Sub-total Adjustment [a] Totals UNDERWRITING REVENUES Gross premiums written $1,426,366 $825,145 $2,251,511 ($5,091) $2,246,420 Net premiums written $980,598 $
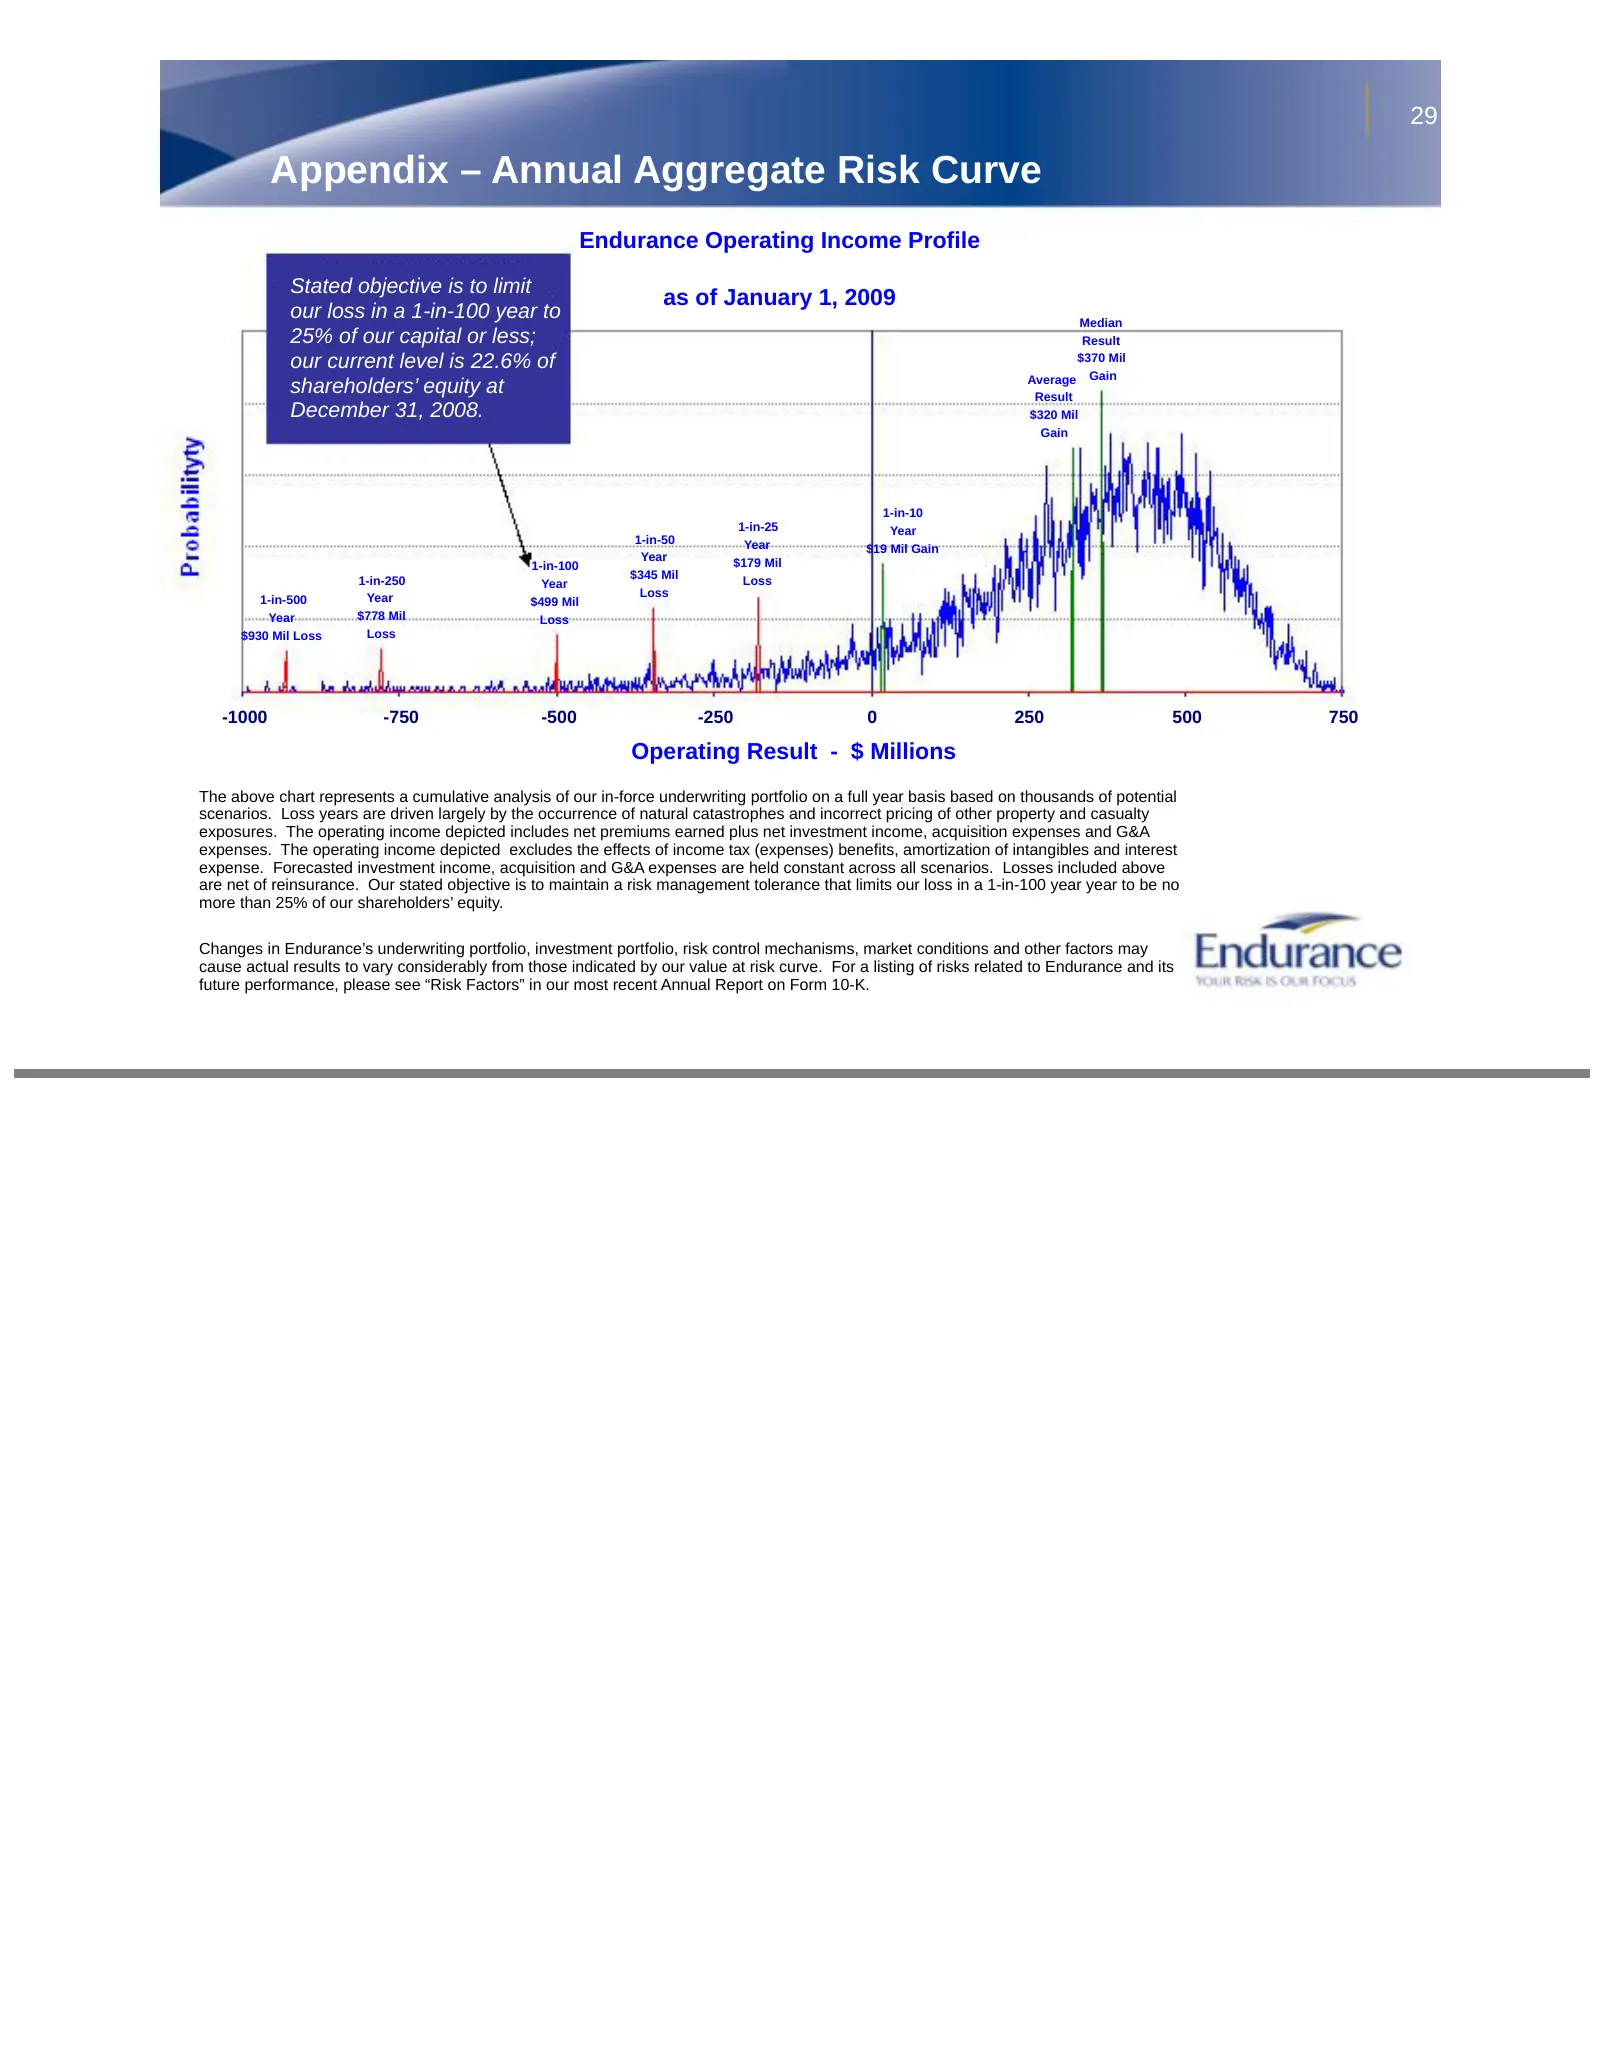
Slide 29: Appendix – Annual Aggregate Risk Curve
29 Appendix – Annual Aggregate Risk Curve Endurance Operating Income Profile Stated objective is to limit as of January 1, 2009 our loss in a 1-in-100 year to Median 25% of our capital or less; Result our current level is 22.6% of $370 Mil Average Gain shareholders’ equity at Result December 31, 200
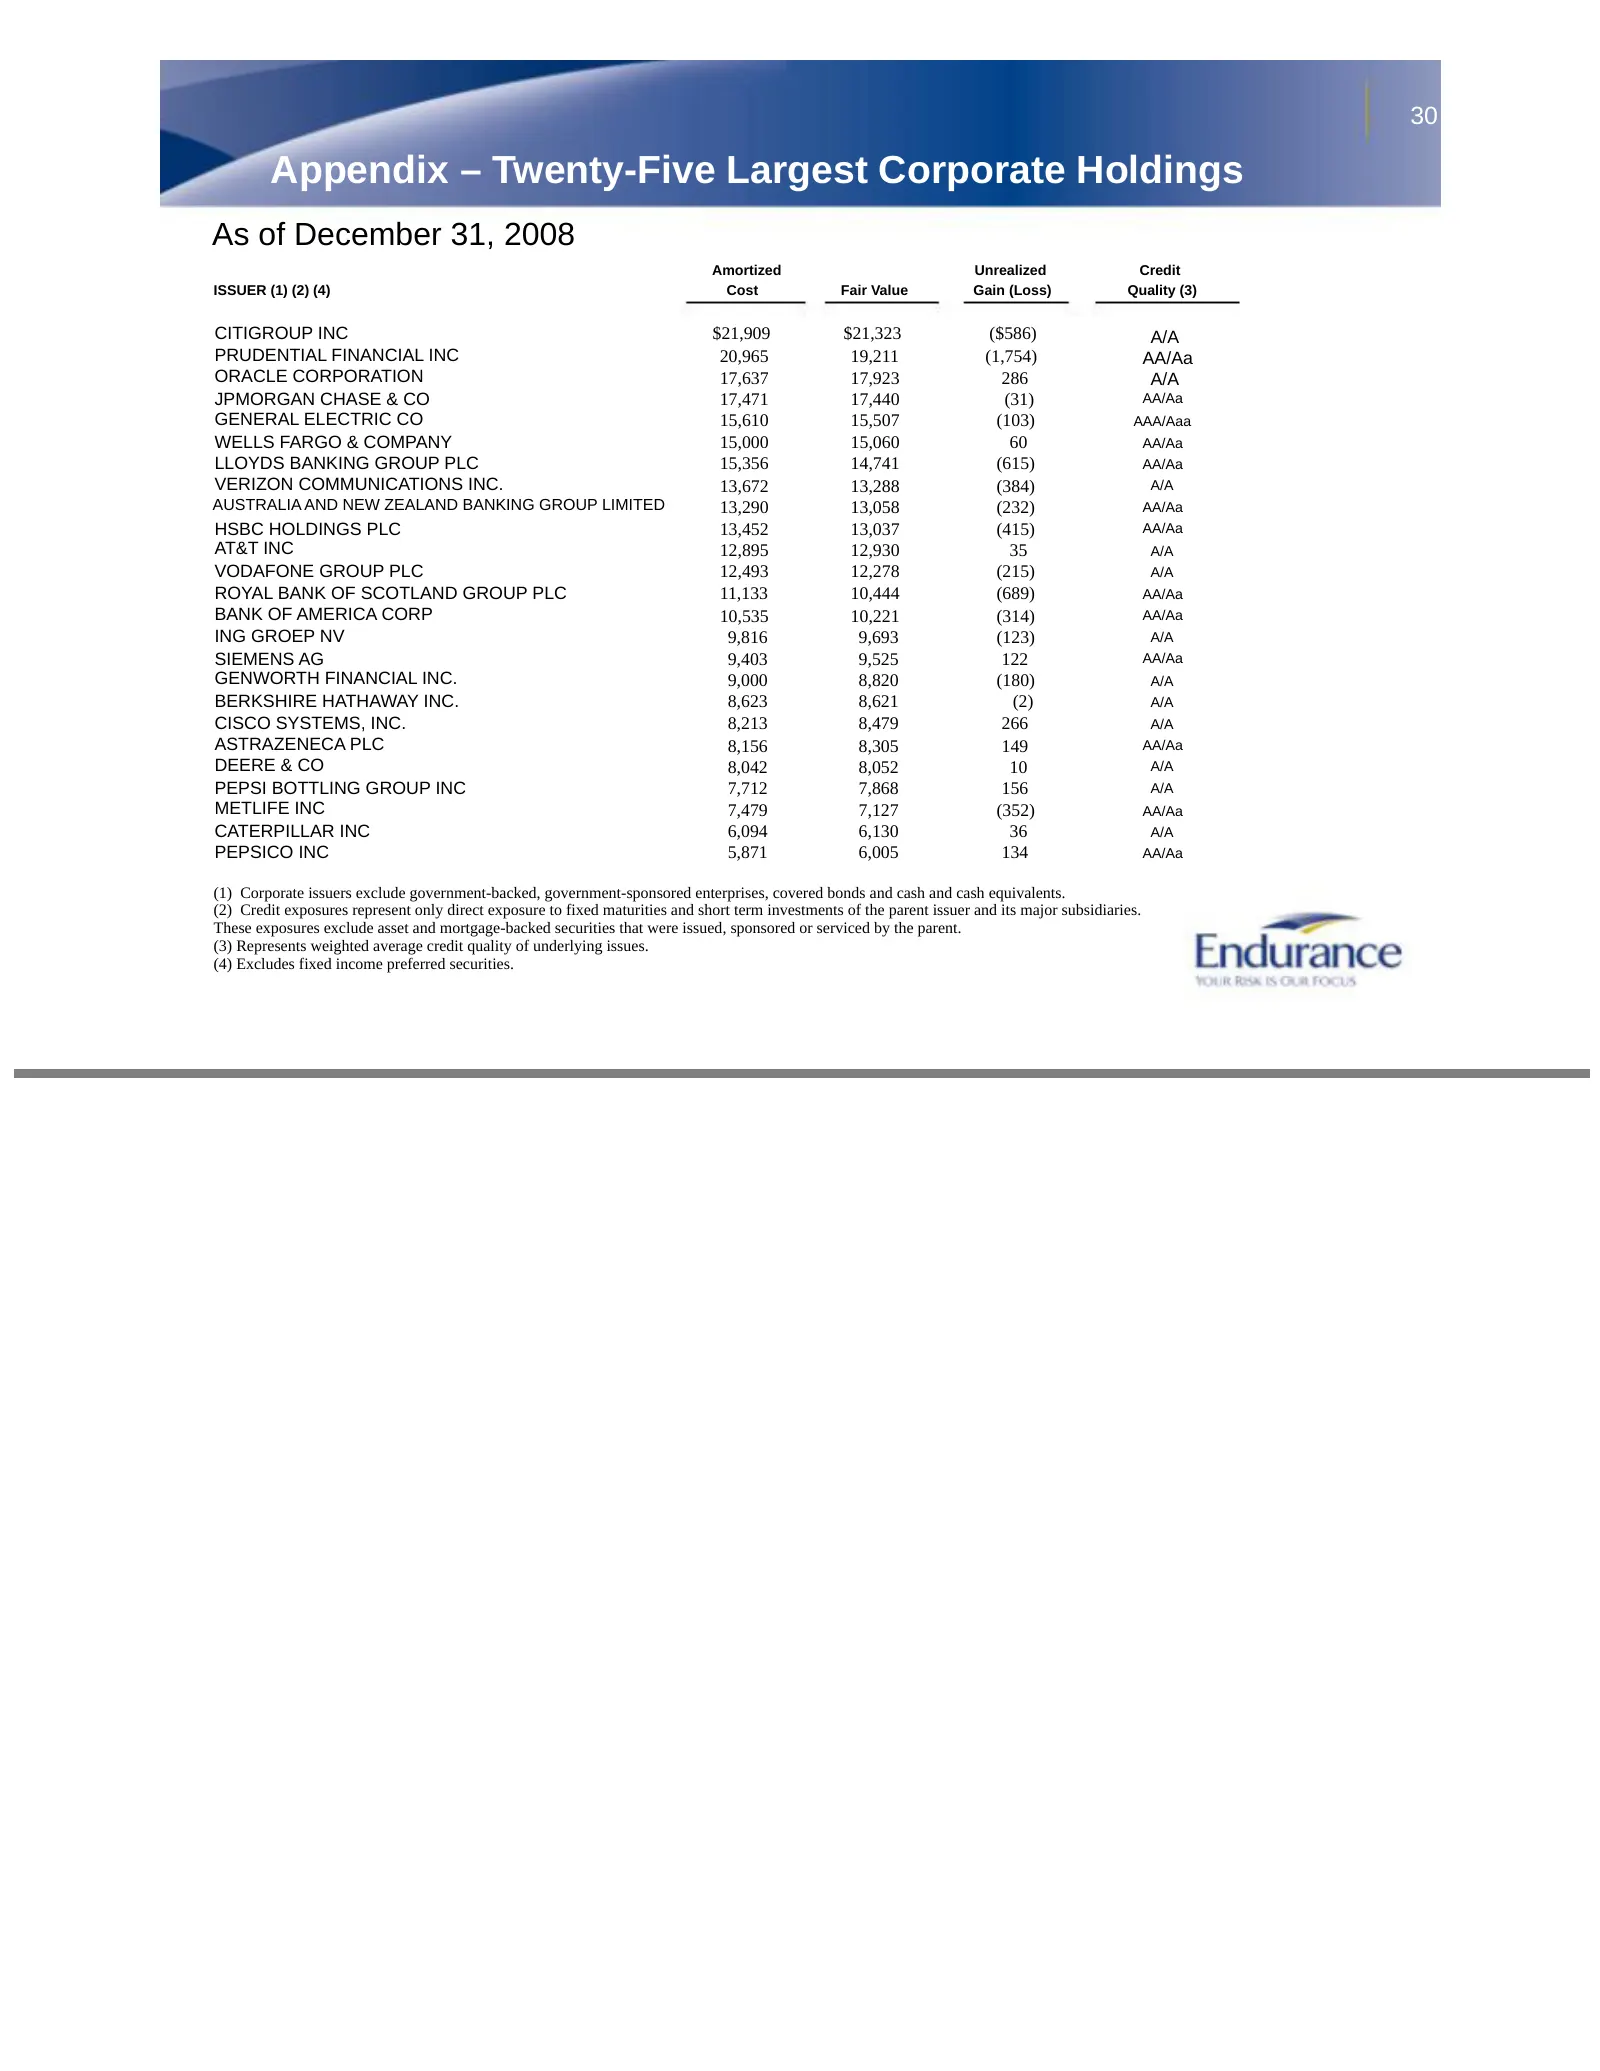
Slide 30: Appendix – Twenty-Five Largest Corporate Holdings
30 Appendix – Twenty-Five Largest Corporate Holdings As of December 31, 2008 Amortized Unrealized Credit ISSUER (1) (2) (4) Cost Fair Value Gain (Loss) Quality (3) CITIGROUP INC $21,909 $21,323 ($586) A/A PRUDENTIAL FINANCIAL INC 20,965 19,211 (1,754) AA/Aa ORACLE CORPORATION 17,637 17,923 286 A/A J
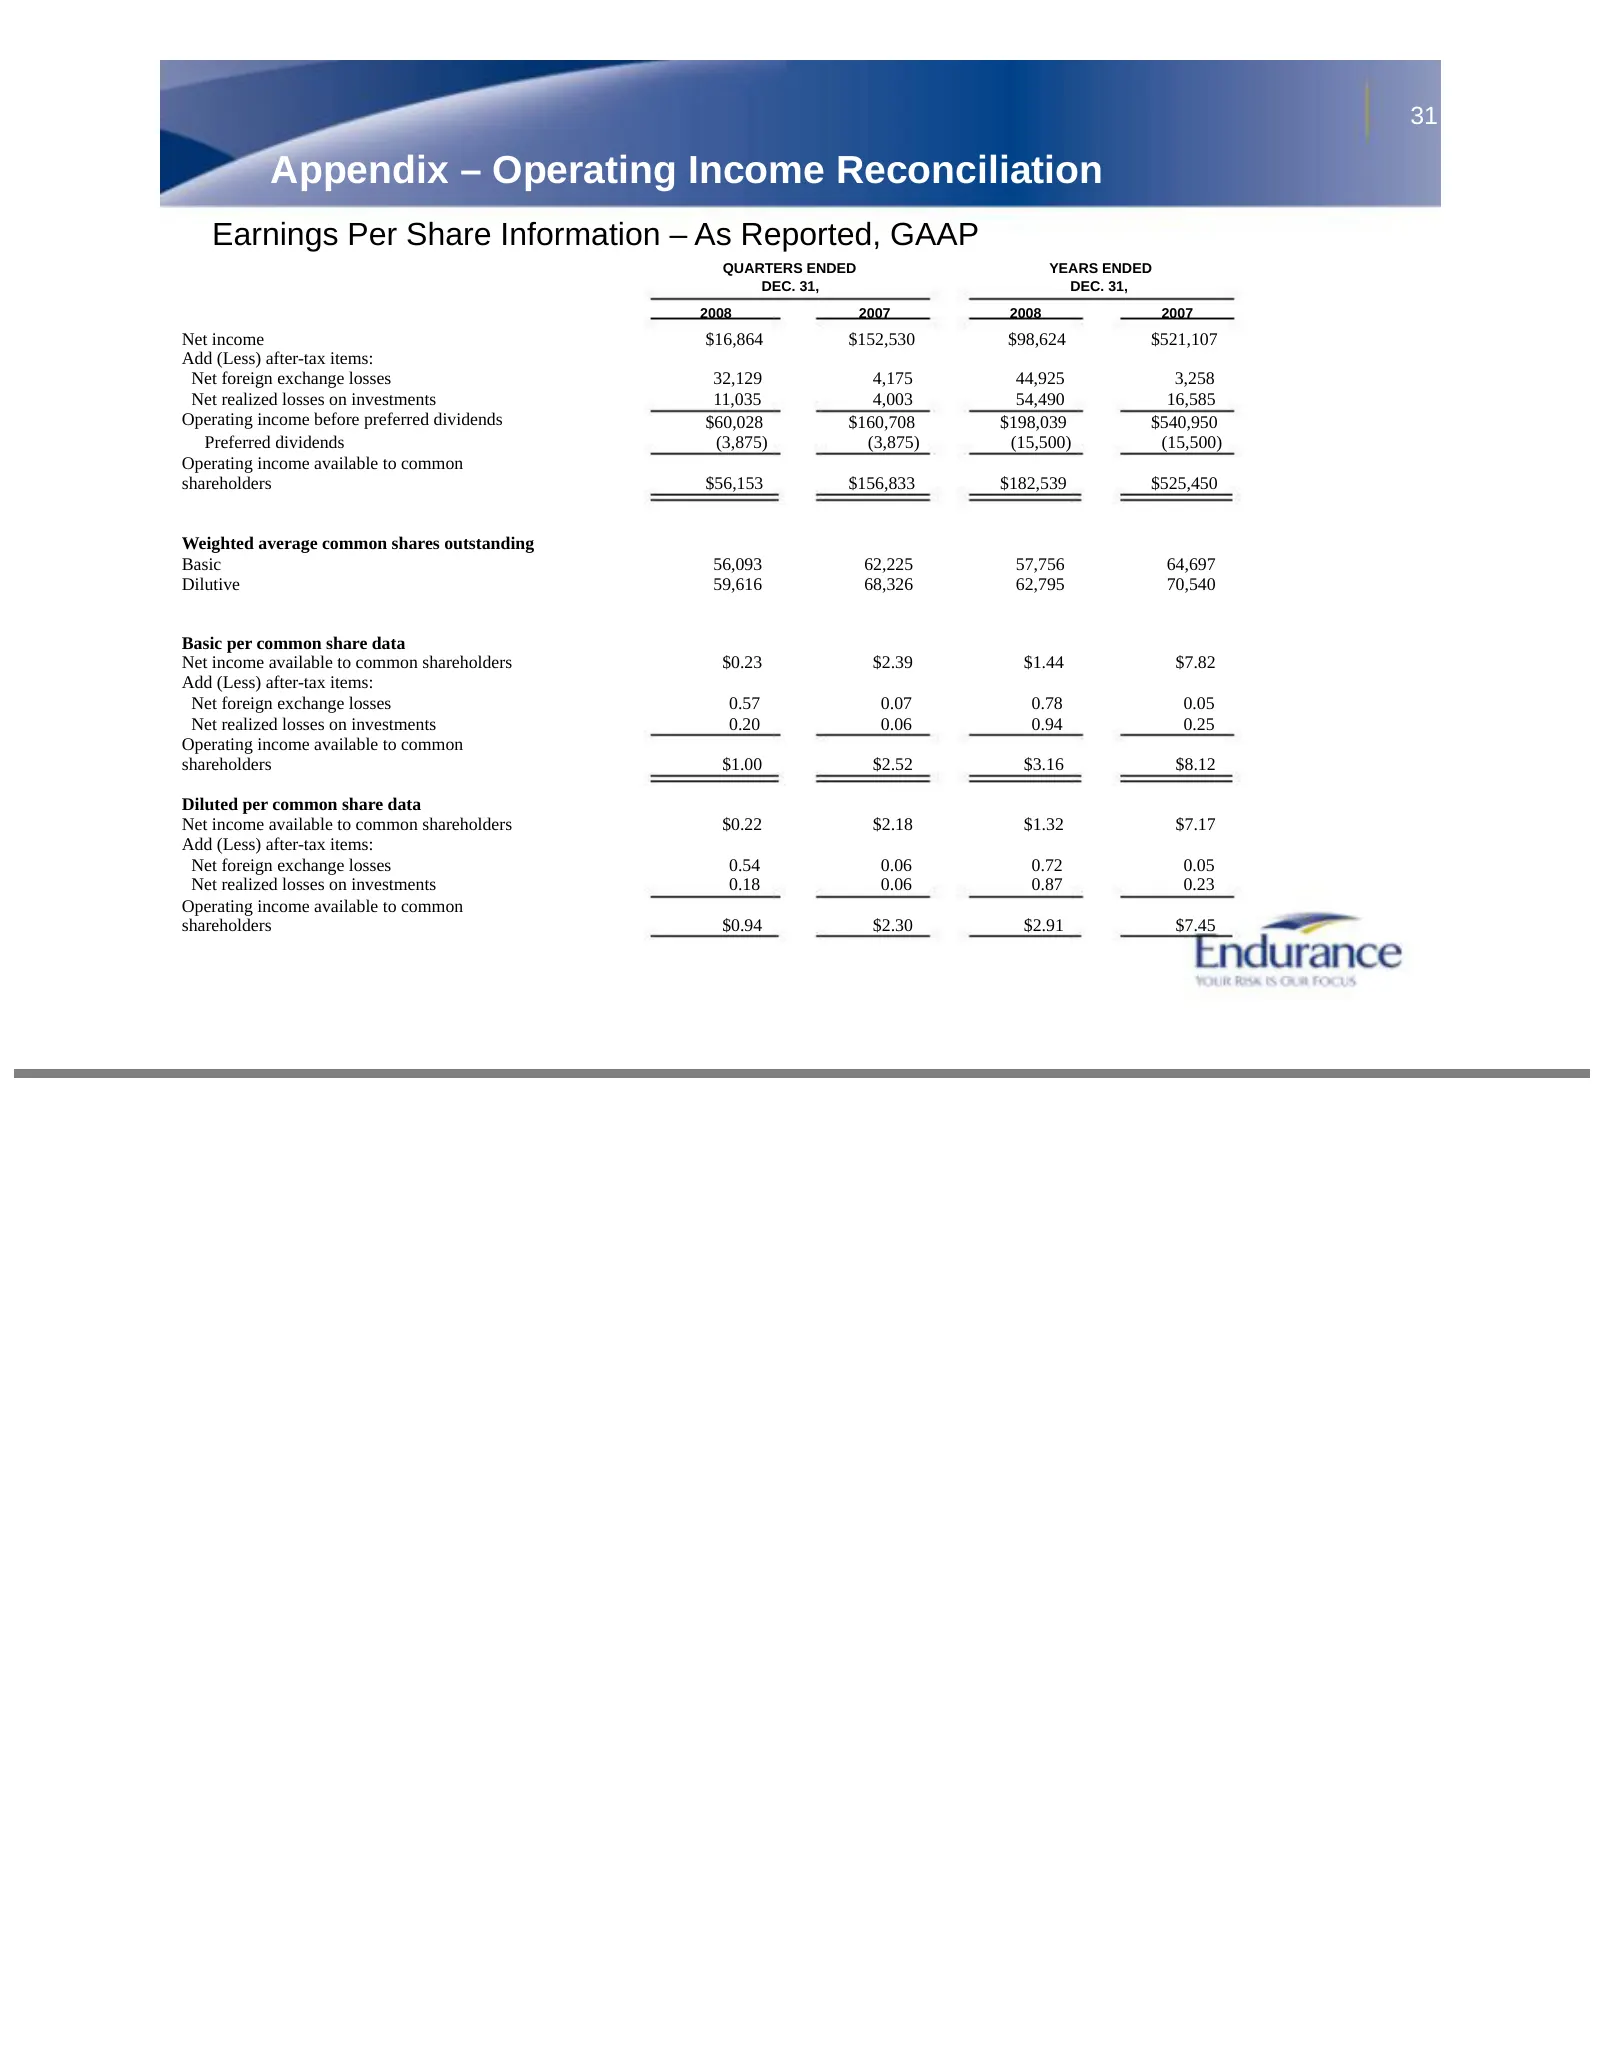
Slide 31: Appendix – Operating Income Reconciliation
31 Appendix – Operating Income Reconciliation Earnings Per Share Information – As Reported, GAAP QUARTERS ENDED YEARS ENDED DEC. 31, DEC. 31, 2008 2007 2008 2007 Net income $16,864 $152,530 $98,624 $521,107 Add (Less) after-tax items: Net foreign exchange losses 32,129 4,175 44,925 3,258 Net realize
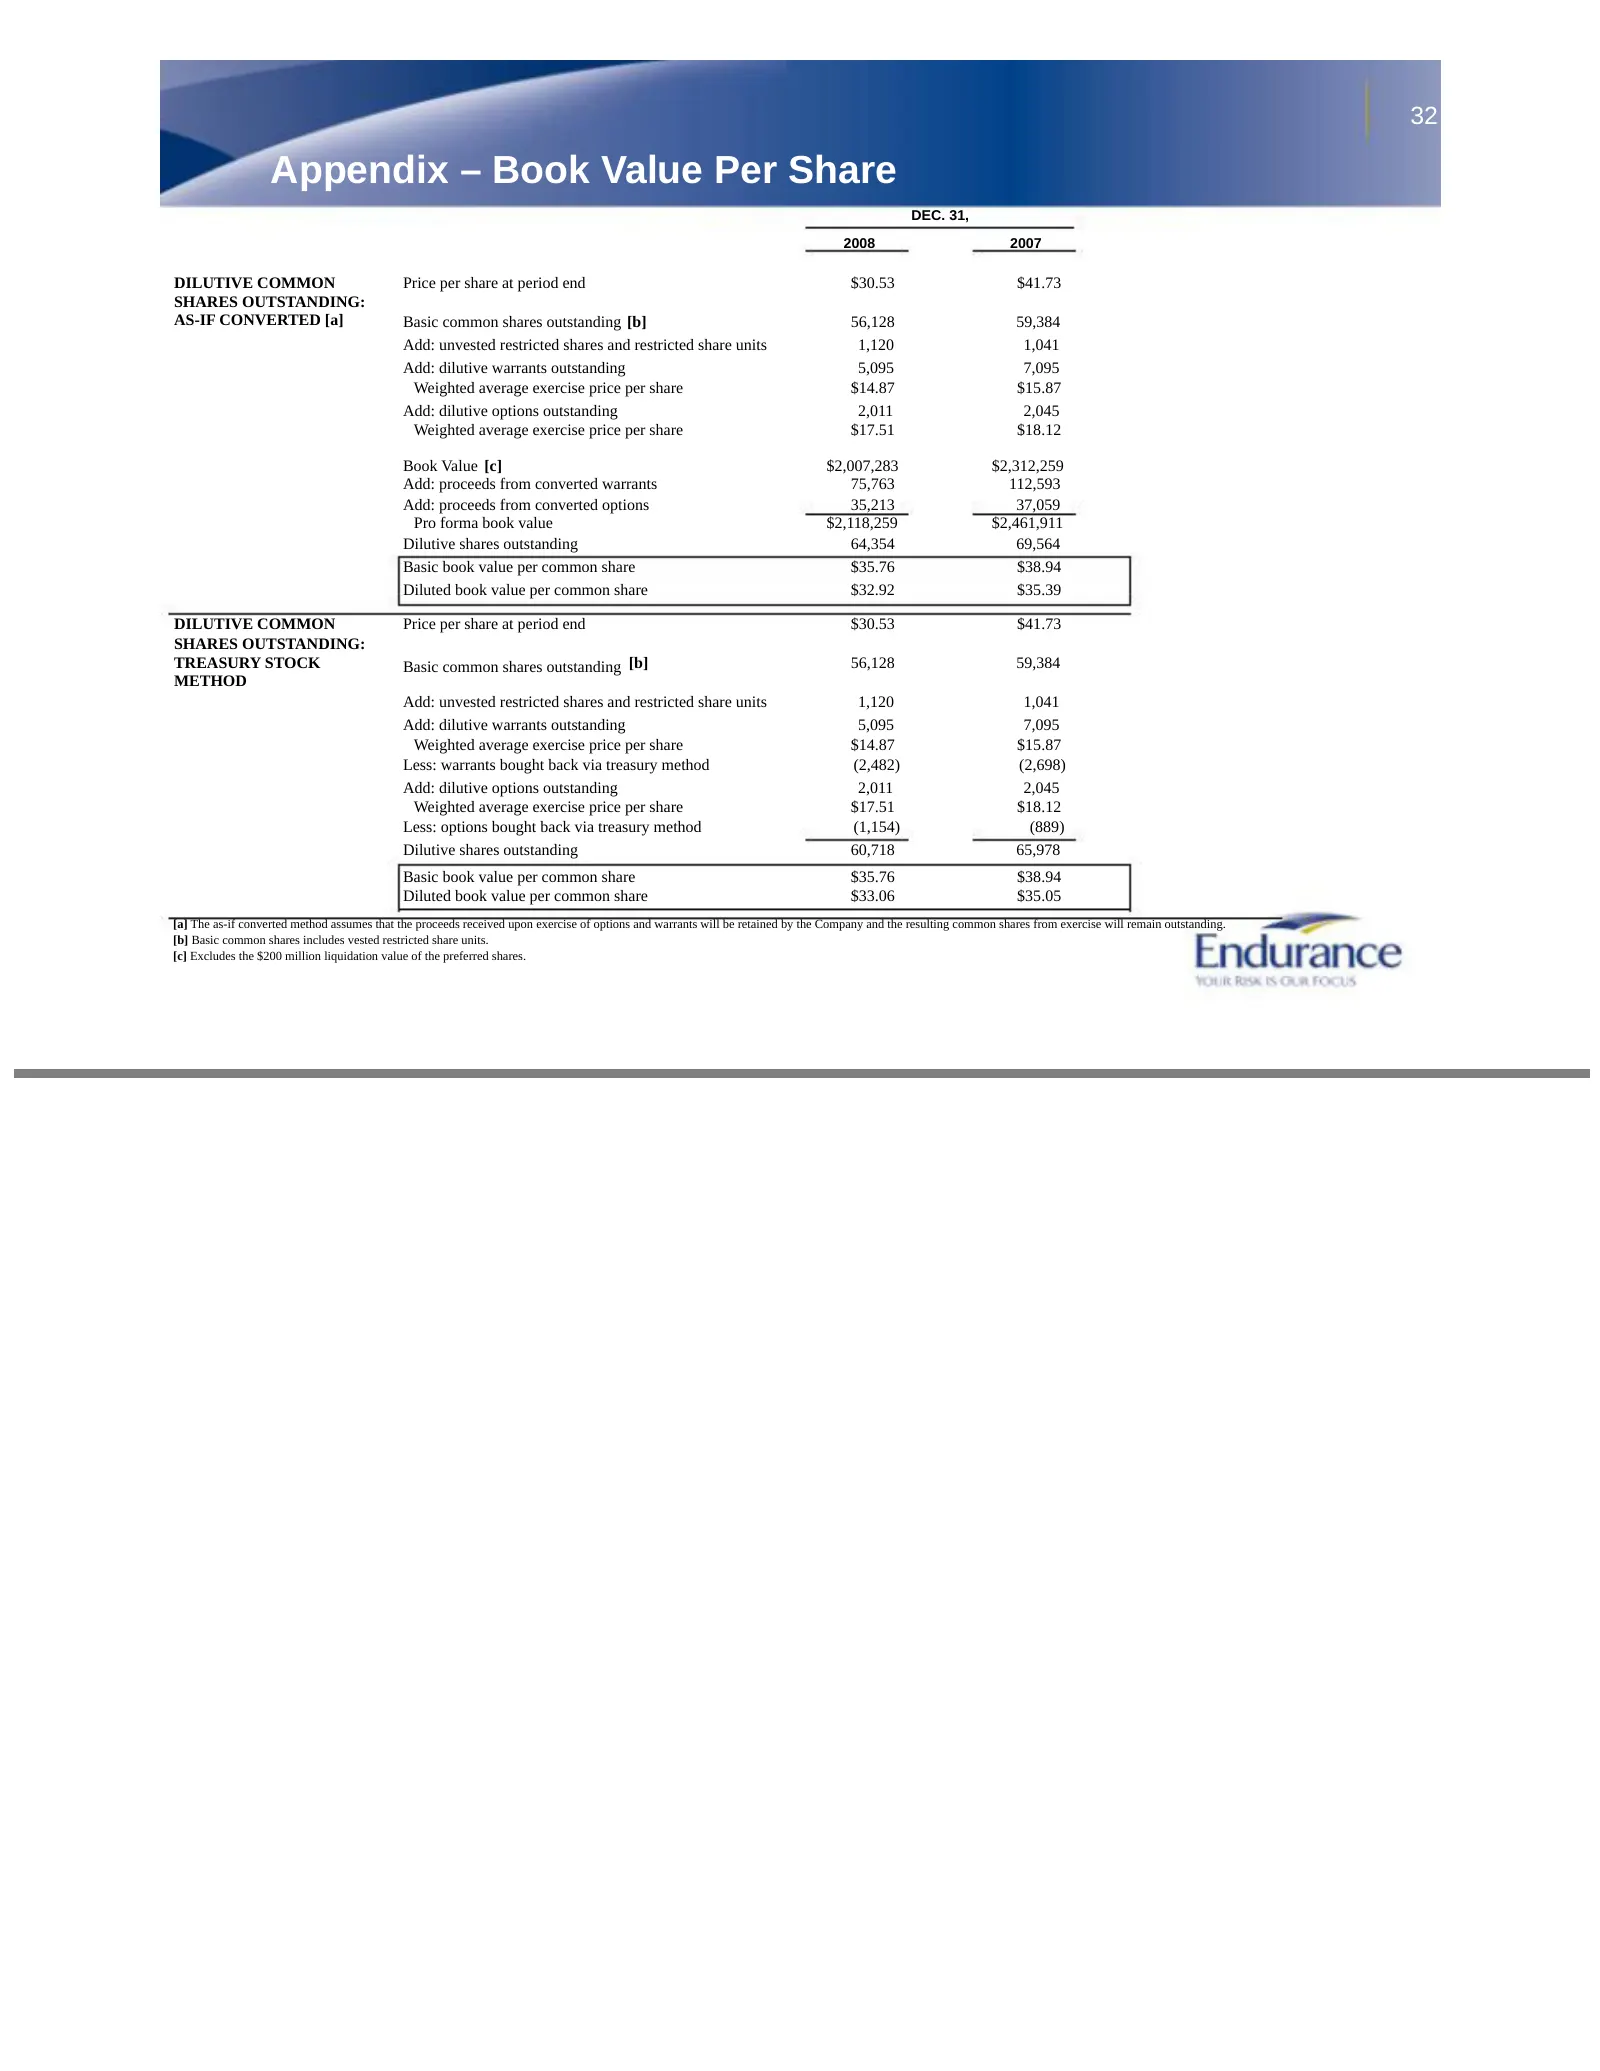
Slide 32: Appendix – Book Value Per Share
32 Appendix – Book Value Per Share DEC. 31, 2008 2007 DILUTIVE COMMON Price per share at period end $30.53 $41.73 SHARES OUTSTANDING: AS-IF CONVERTED [a] Basic common shares outstanding [b] 56,128 59,384 Add: unvested restricted shares and restricted share units 1,120 1,041 Add: dilutive warrants ou
Source: SEC EDGAR · 8-K filed Feb 17, 2009
More decks from Endurance Specialty Holdings Ltd
 Merger or Acquisition (October 2016)17 slides · Oct 12, 2016
 Investor Presentation (August 2016)29 slides · Aug 9, 2016
 Investor Presentation (May 2016)28 slides · May 10, 2016
 Investor Presentation (February 2016)29 slides · Feb 9, 2016
 Investor Presentation (February 2015)28 slides · Feb 11, 2015
 Merger or Acquisition (April 2014)22 slides · Apr 14, 2014