Quinenco S.A. · BCS:QUINENCO
Quinenco — H1 2026 Earnings Presentation
36 slides from Quinenco's earnings presentation, Sep 29, 2026
Slide 1: 1H 2026 Earnings Presentation
1H 2026 Earnings Presentation September 29, 2026
Slide 2: Disclaimer
DISCLAIMER This presentation includes information on Quiñenco S.A. and related companies. Said information is summarized and does not intend to be complete, nor should it be considered as advice for potential investors. No representation or warranty, express or implied, is made as to the accuracy, o
Slide 3: Quiñenco Overview, 1H 2026 Results, Conclusions
• QUIÑENCO OVERVIEW • 1H 2026 RESULTS • CONCLUSIONS 3
Slide 4: 1H 2026 Results & Highlights
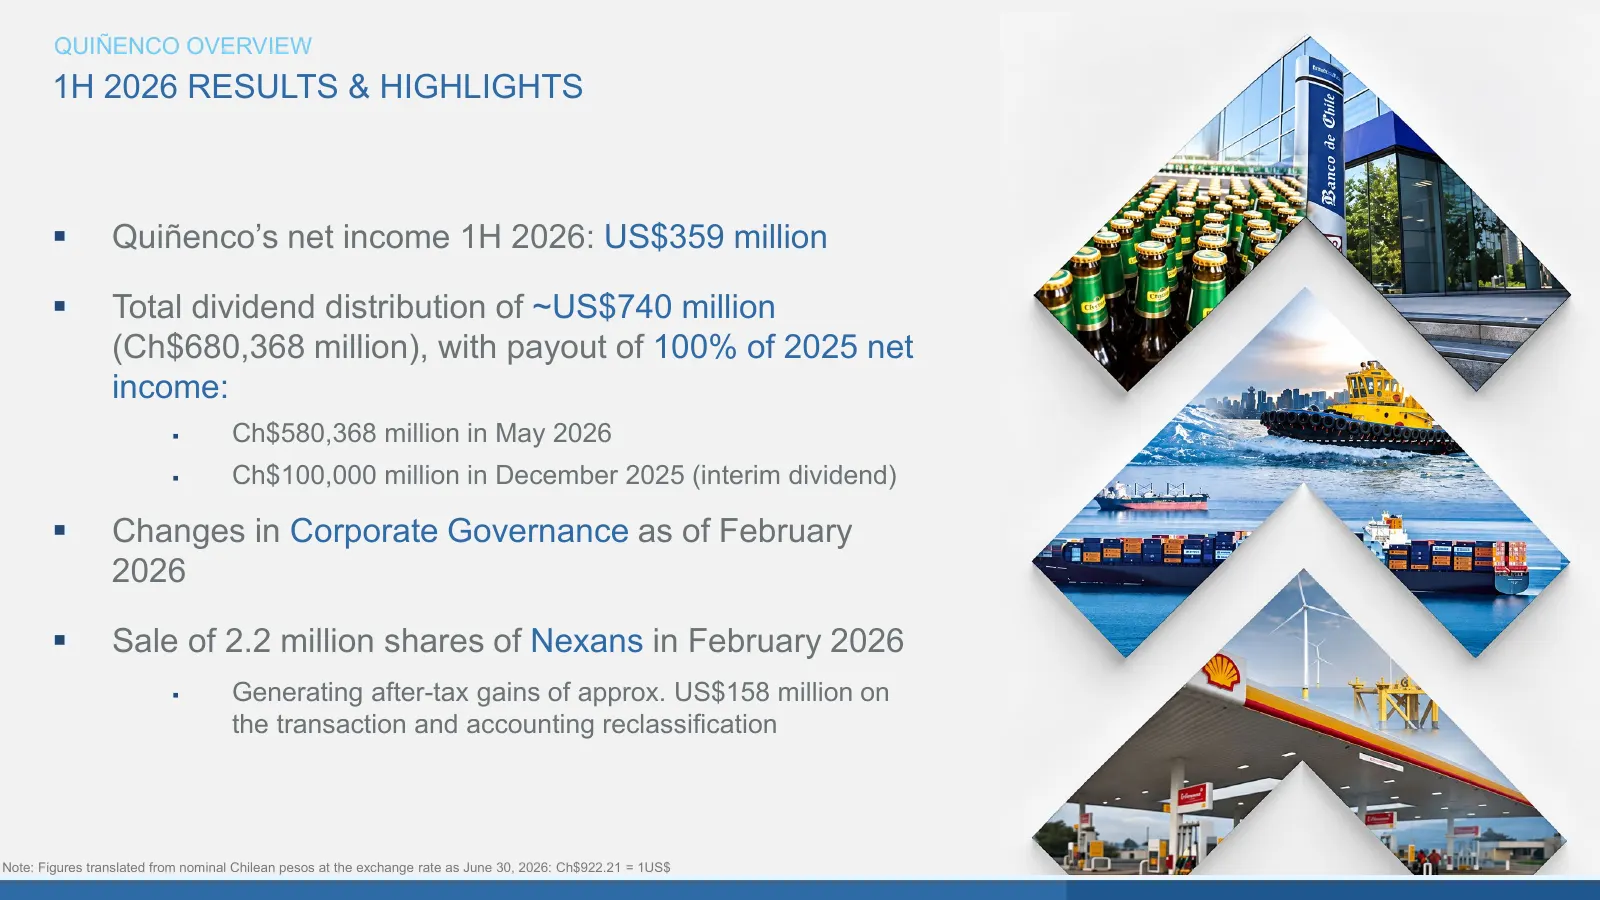
QUIÑENCO OVERVIEW 1H 2026 RESULTS & HIGHLIGHTS Quiñenco’s net income 1H 2026: US$359 million Total dividend distribution of ~US$740 million (Ch$680,368 million), with payout of 100% of 2025 net income: Ch$580,368 million in May 2026 Ch$100,000 million in December 2025 (interim dividend) Ch
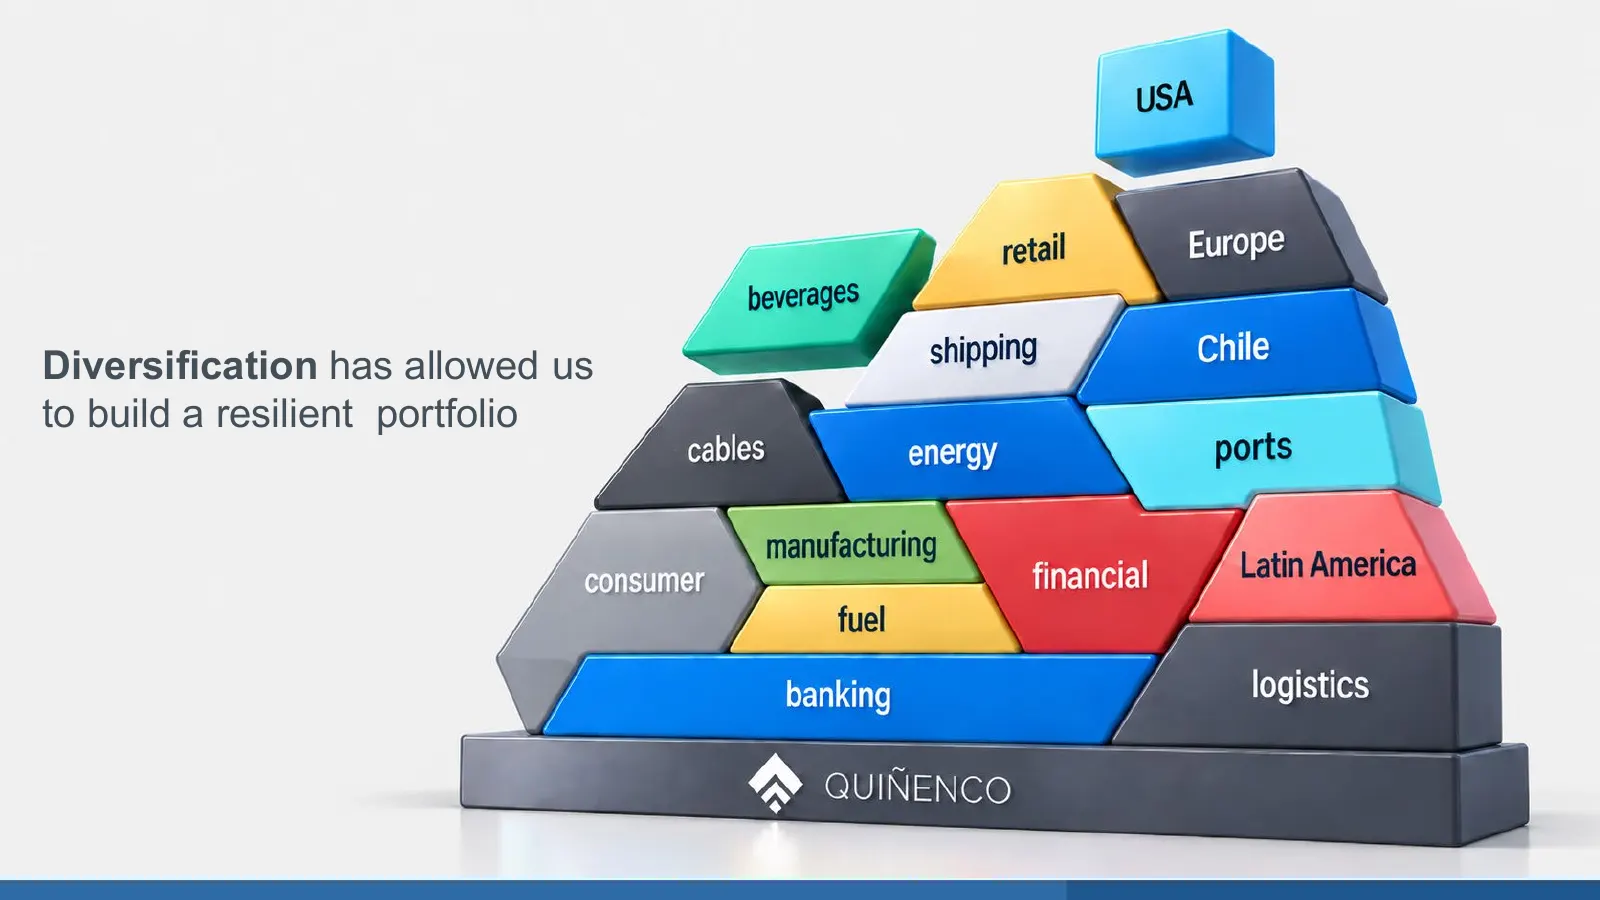
Slide 5: Diversification has allowed us to build a resilient portfolio
Diversification has allowed us to build a resilient portfolio
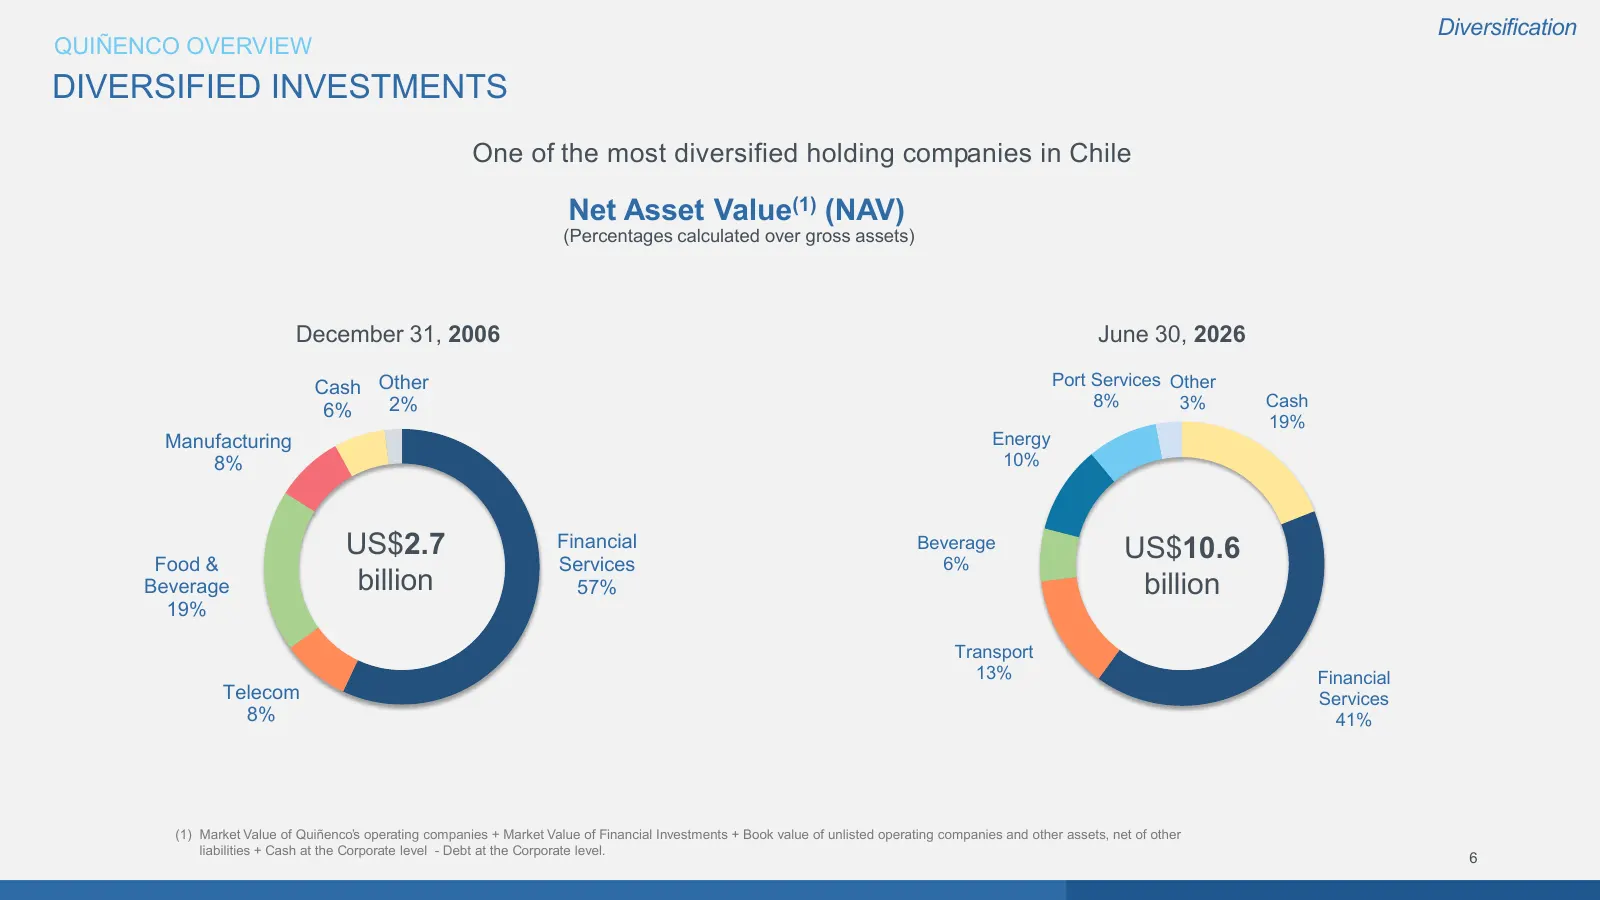
Slide 6: Diversified Investments: Net Asset Value
Diversification QUIÑENCO OVERVIEW DIVERSIFIED INVESTMENTS One of the most diversified holding companies in Chile Net Asset Value(1) (NAV) (Percentages calculated over gross assets) December 31, 2006 June 30, 2026 Cash Other Port Services Other 2% 8% 3% Cash 6% 19% Manufacturing Energy 8% 10% US$2.7
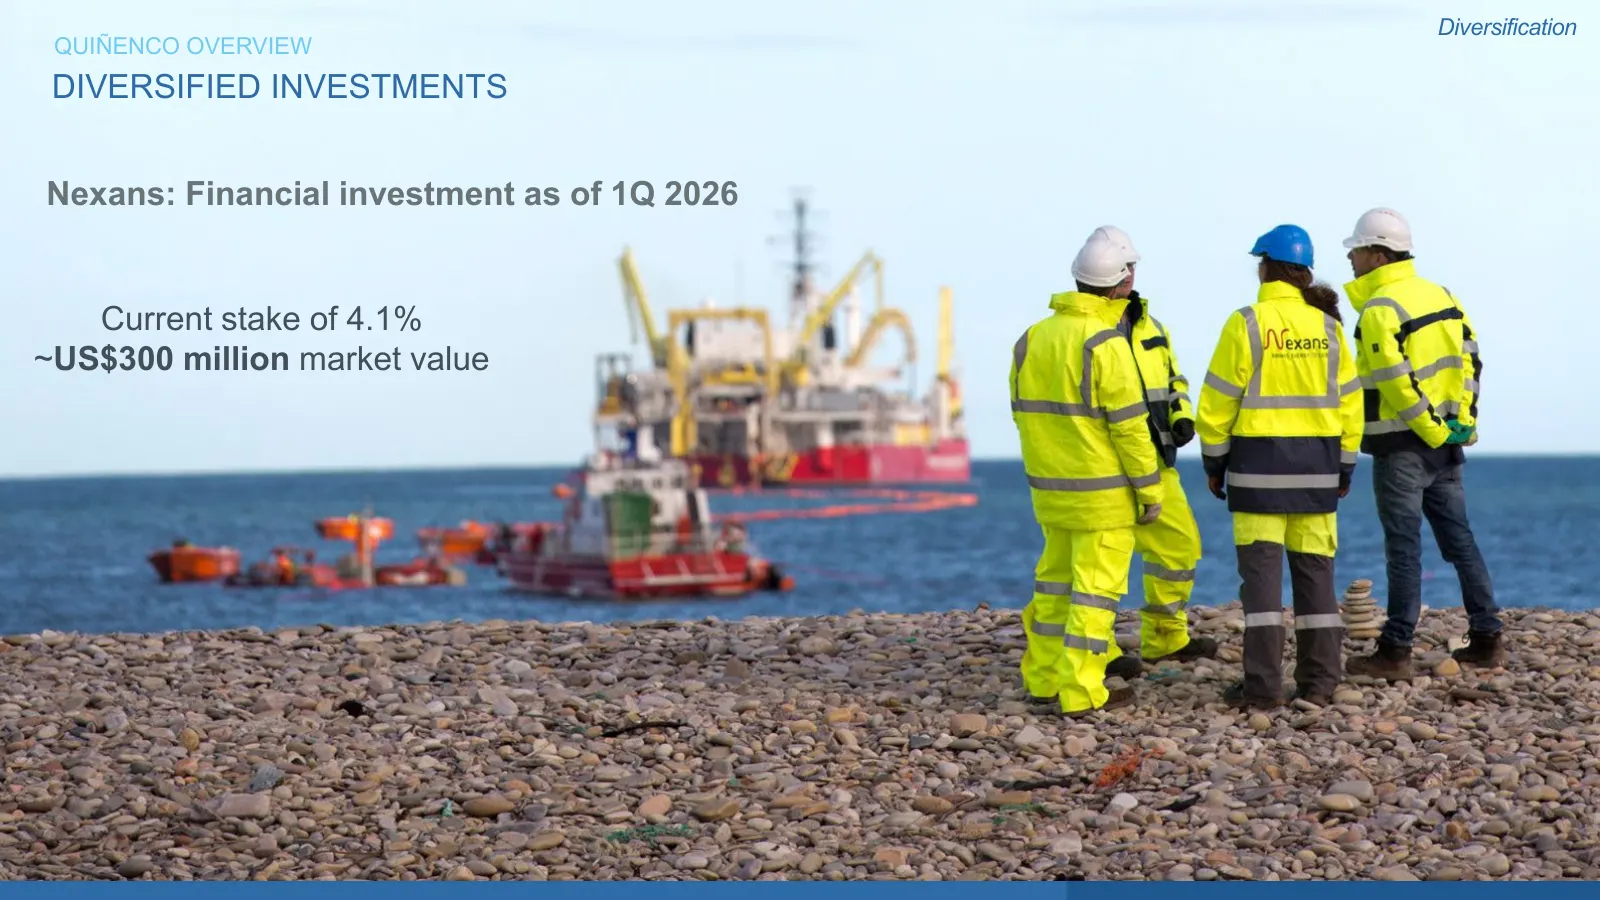
Slide 7: Nexans: Financial investment as of 1Q 2026
Diversification QUIÑENCO OVERVIEW DIVERSIFIED INVESTMENTS Nexans: Financial investment as of 1Q 2026 Current stake of 4.1% ~US$300 million market value
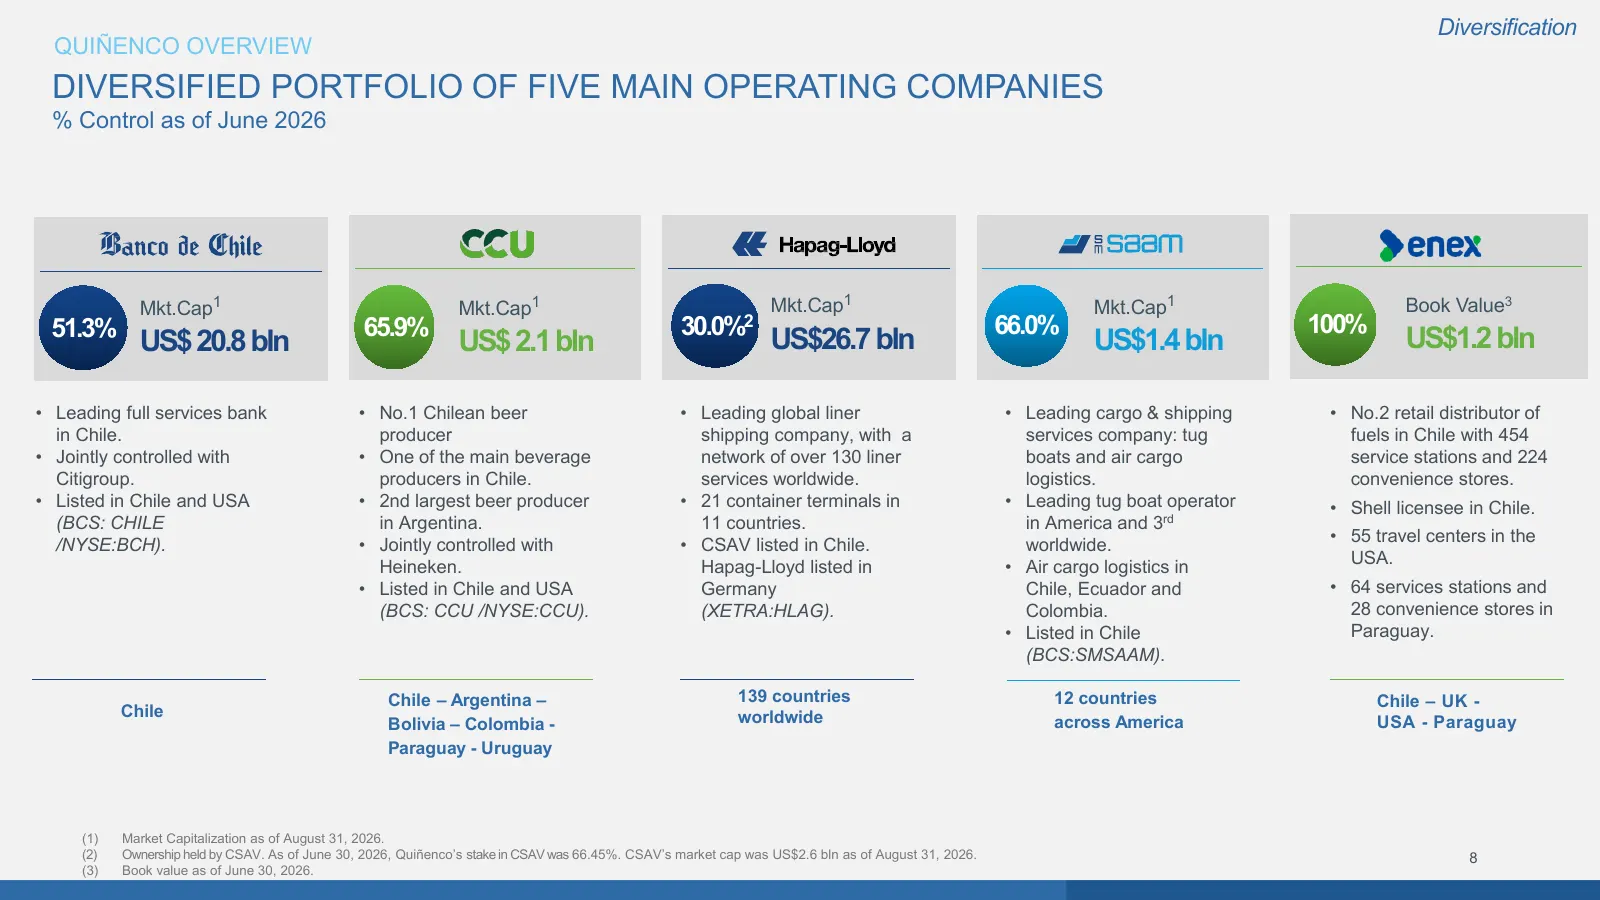
Slide 8: Diversified Portfolio of Five Main Operating Companies
Diversification QUIÑENCO OVERVIEW DIVERSIFIED PORTFOLIO OF FIVE MAIN OPERATING COMPANIES % Control as of June 2026 Mkt.Cap1 Mkt.Cap1 Mkt.Cap1 Mkt.Cap1 Book Value3 51.3% 65.9% 30.0%2 66.0% 100% US$ 20.8 bln US$ 2.1 bln US$26.7 bln US$1.4 bln US$1.2 bln • Leading full services bank • No.1 Chilean beer
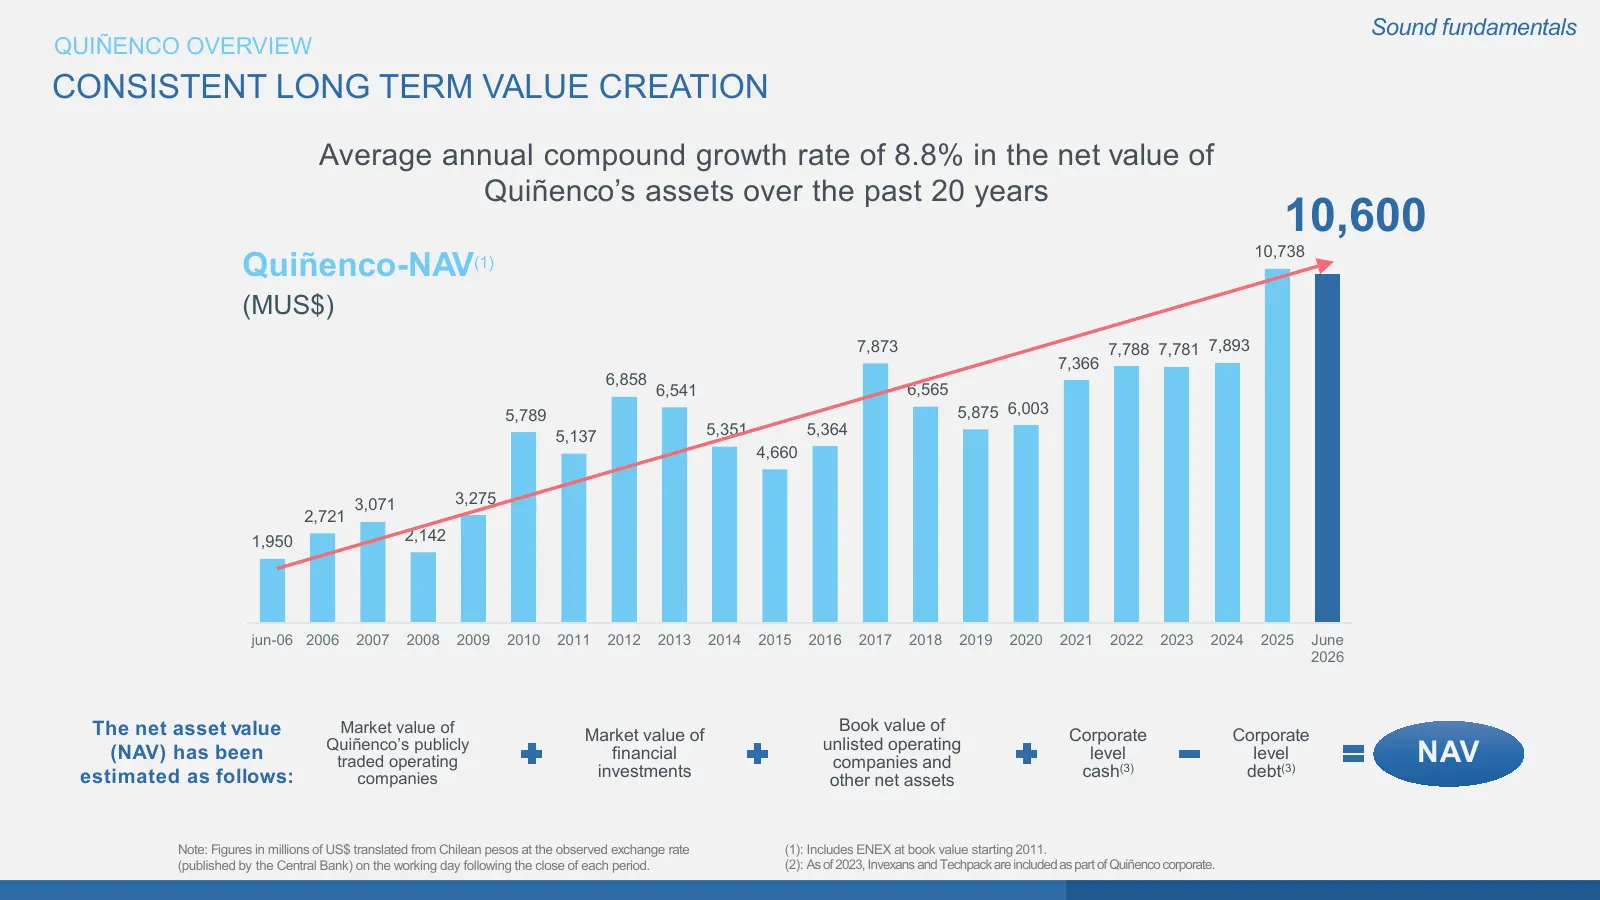
Slide 9: Consistent Long Term Value Creation
Sound fundamentals QUIÑENCO OVERVIEW CONSISTENT LONG TERM VALUE CREATION Average annual compound growth rate of 8.8% in the net value of Quiñenco’s assets over the past 20 years 10,600 10,738 Quiñenco-NAV(1) (MUS$) 7,873 7,788 7,781 7,893 7,366 6,858 6,541 6,565 5,789 5,875 6,003 5,137 5,351 5,364 4
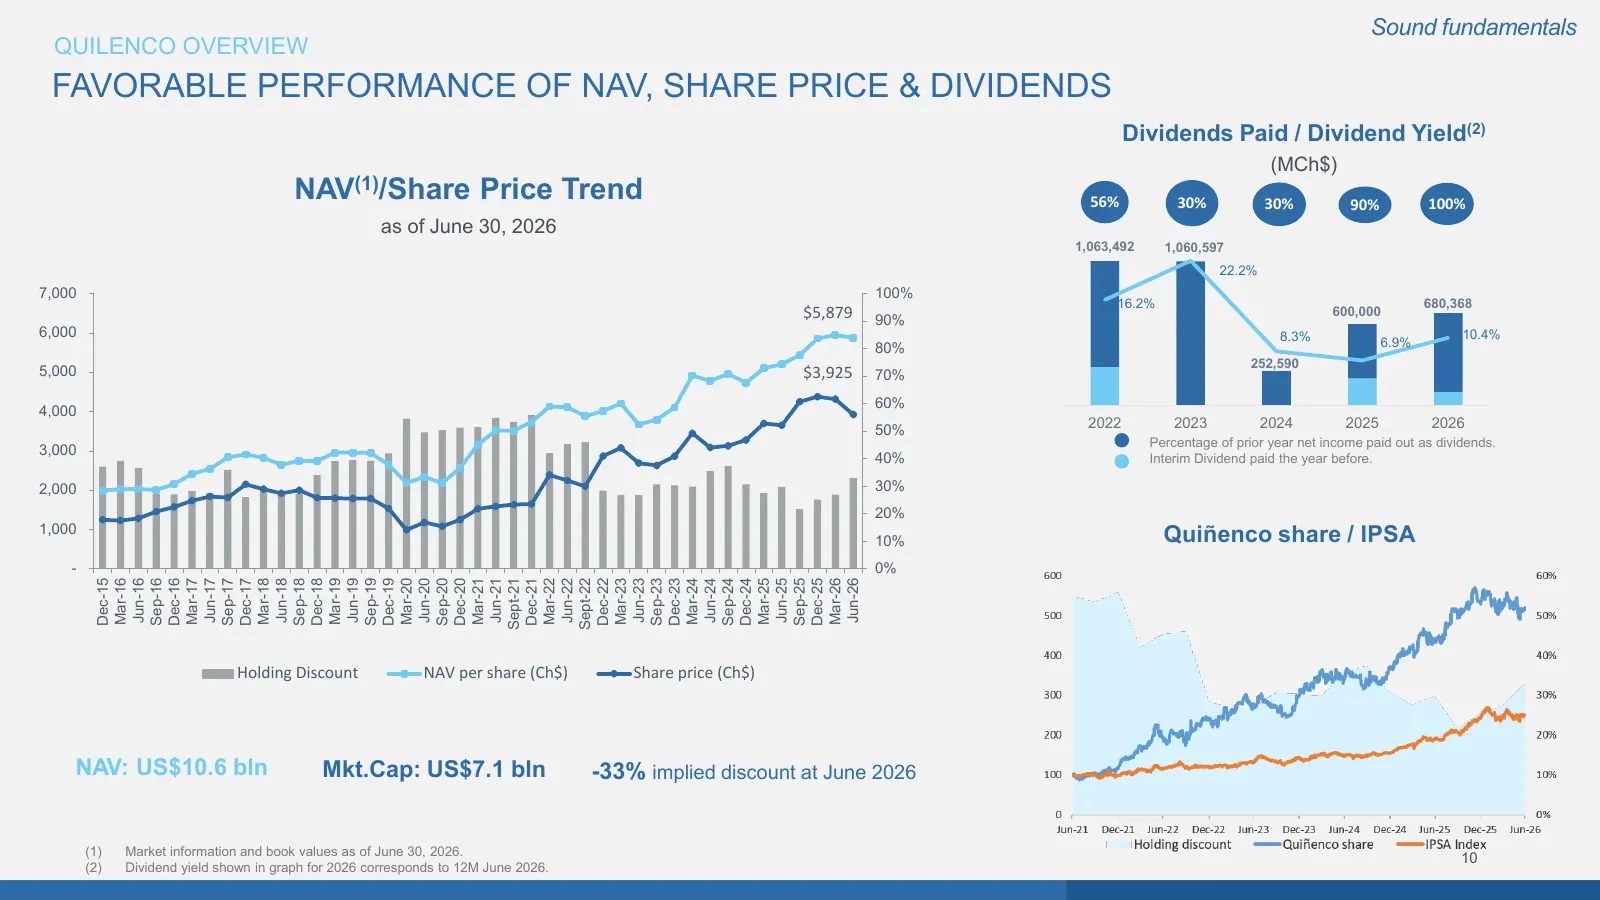
Slide 10: Favorable Performance of NAV, Share Price & Dividends
Sound fundamentals QUILENCO OVERVIEW FAVORABLE PERFORMANCE OF NAV, SHARE PRICE & DIVIDENDS Dividends Paid / Dividend Yield(2) (MCh$) NAV(1)/Share Price Trend 56% 30% 30% 90% 100% as of June 30, 2026 1,200,000 1,063,492 1,060,597 25% 1,000,000 22.2% 20% 7,000 100% 800,000 16.2% 680,368 15% $5,879 90%
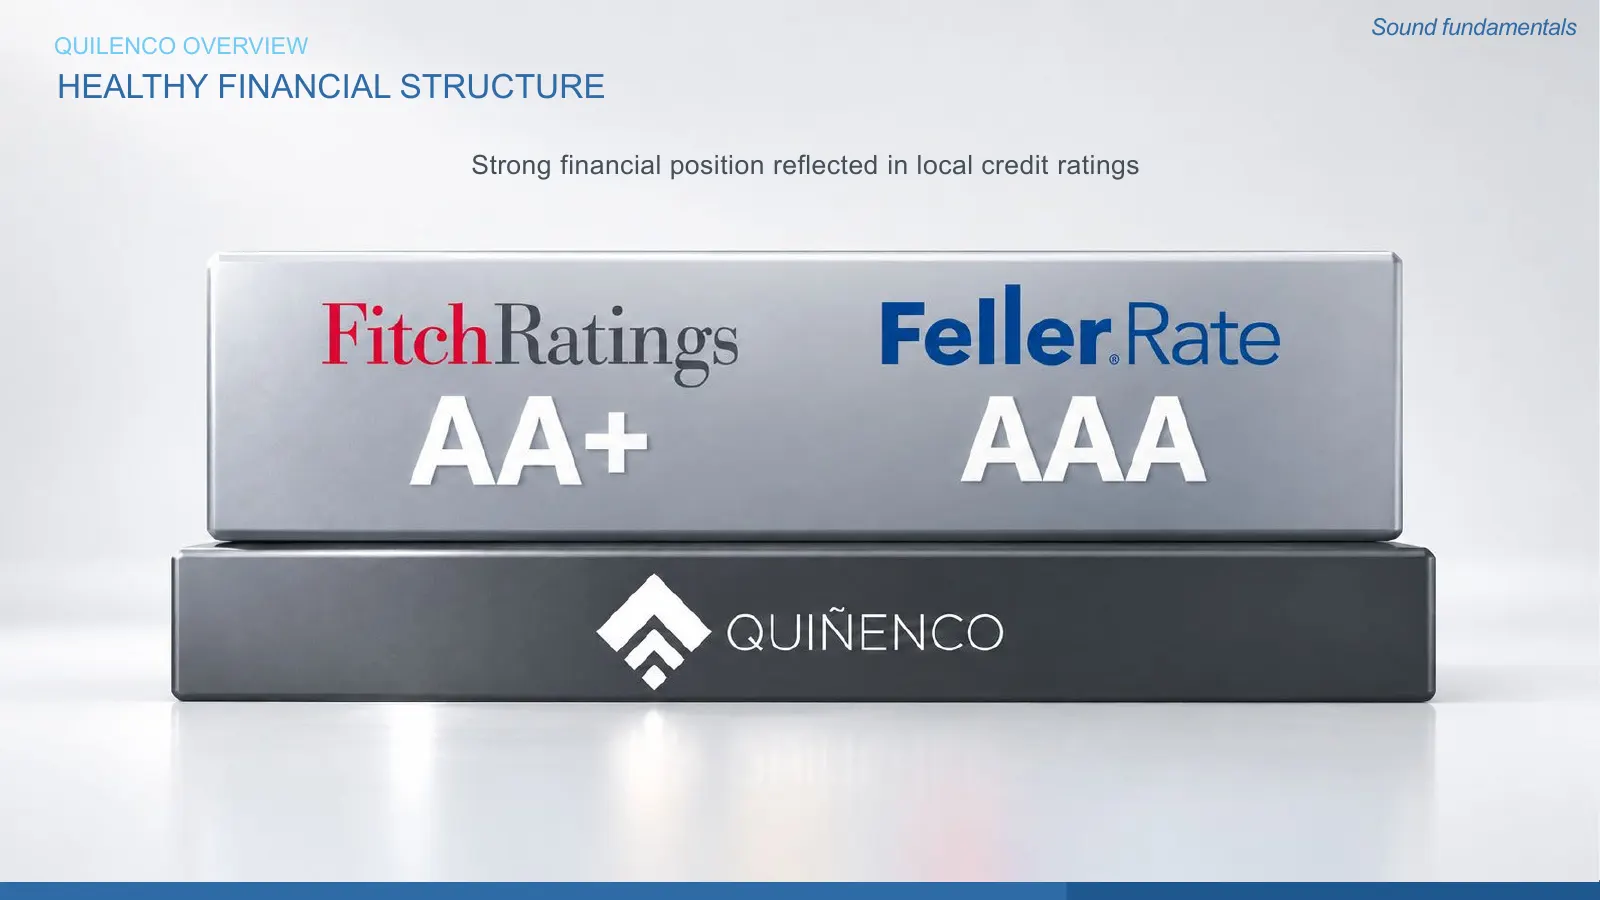
Slide 11: Healthy Financial Structure
Sound fundamentals QUILENCO OVERVIEW HEALTHY FINANCIAL STRUCTURE Strong financial position reflected in local credit ratings
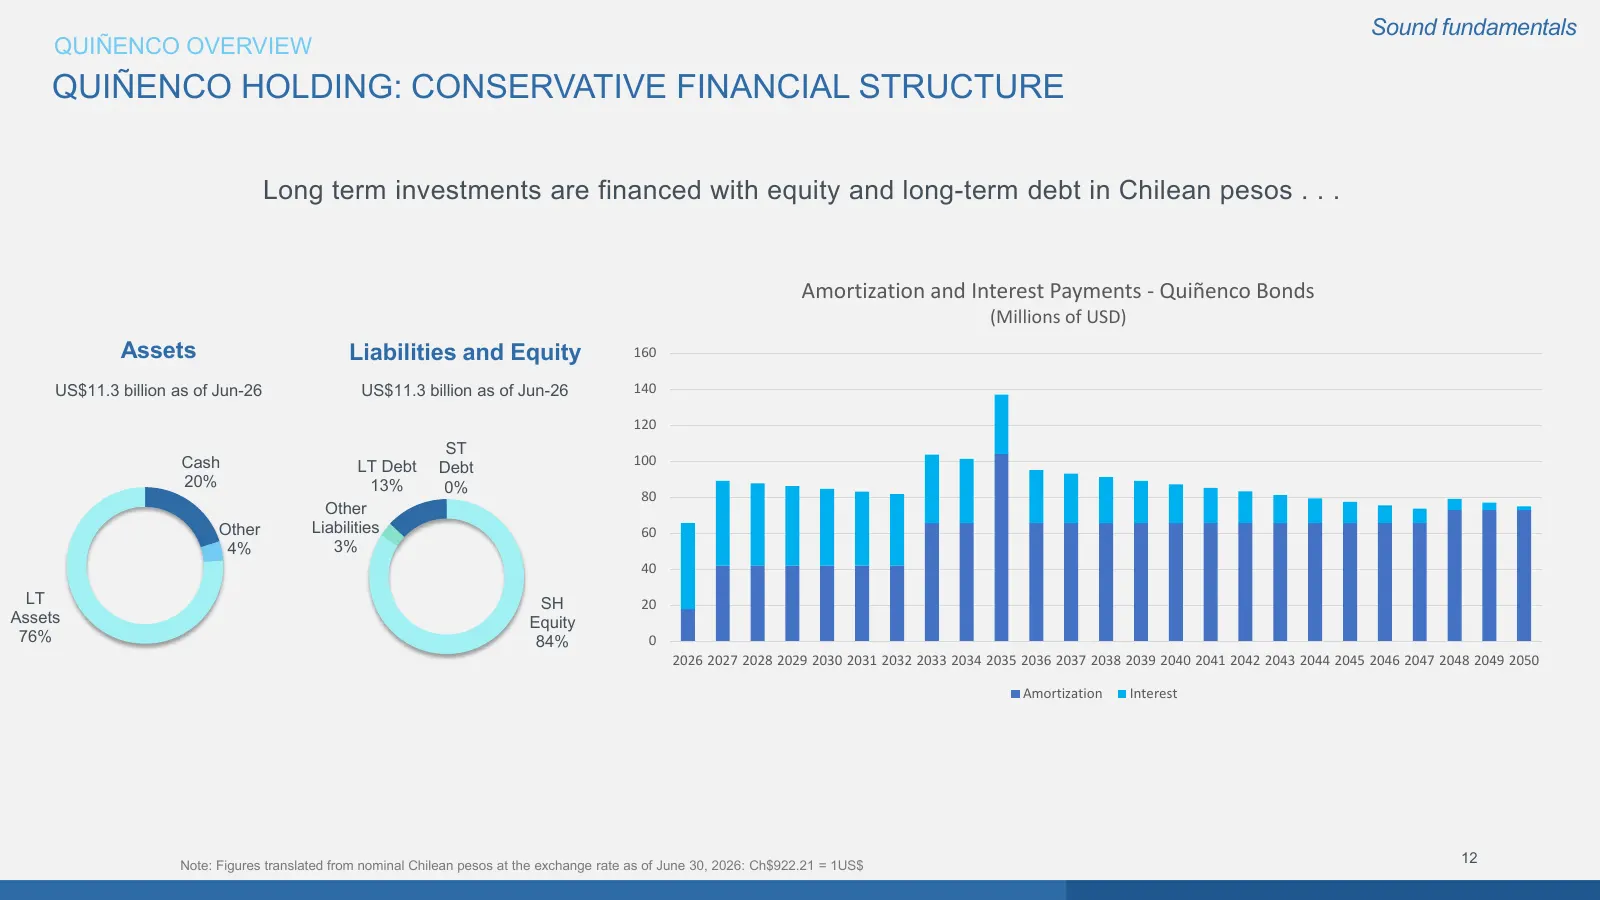
Slide 12: Quiñenco Holding: Conservative Financial Structure
Sound fundamentals QUIÑENCO OVERVIEW QUIÑENCO HOLDING: CONSERVATIVE FINANCIAL STRUCTURE Long term investments are financed with equity and long-term debt in Chilean pesos . . . Amortization and Interest Payments - Quiñenco Bonds (Millions of USD) Assets Liabilities and Equity 160 US$11.3 billion as
Slide 13: Low Financial Corporate Debt
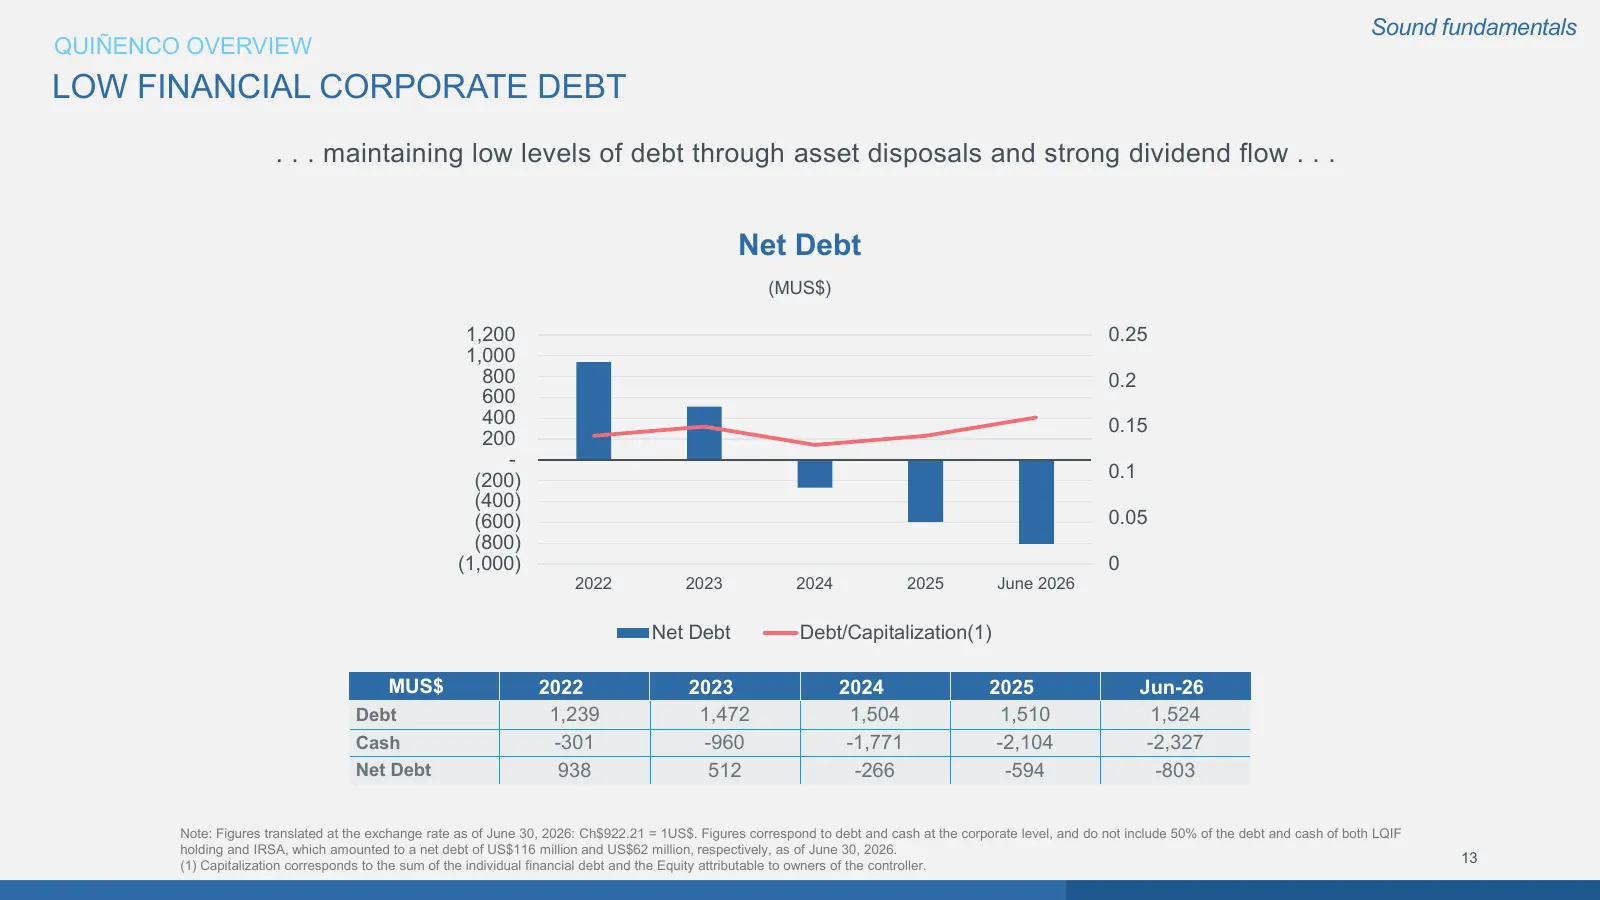
Sound fundamentals QUIÑENCO OVERVIEW LOW FINANCIAL CORPORATE DEBT . . . maintaining low levels of debt through asset disposals and strong dividend flow . . . Net Debt (MUS$) 1,200 0.25 1,000 800 0.2 600 400 0.15 200 - (200) 0.1 (400) (600) 0.05 (800) (1,000) 0 2022 2023 2024 2025 June 2026 Net Debt
Slide 14: Diversified and Healthy Dividend Cashflow
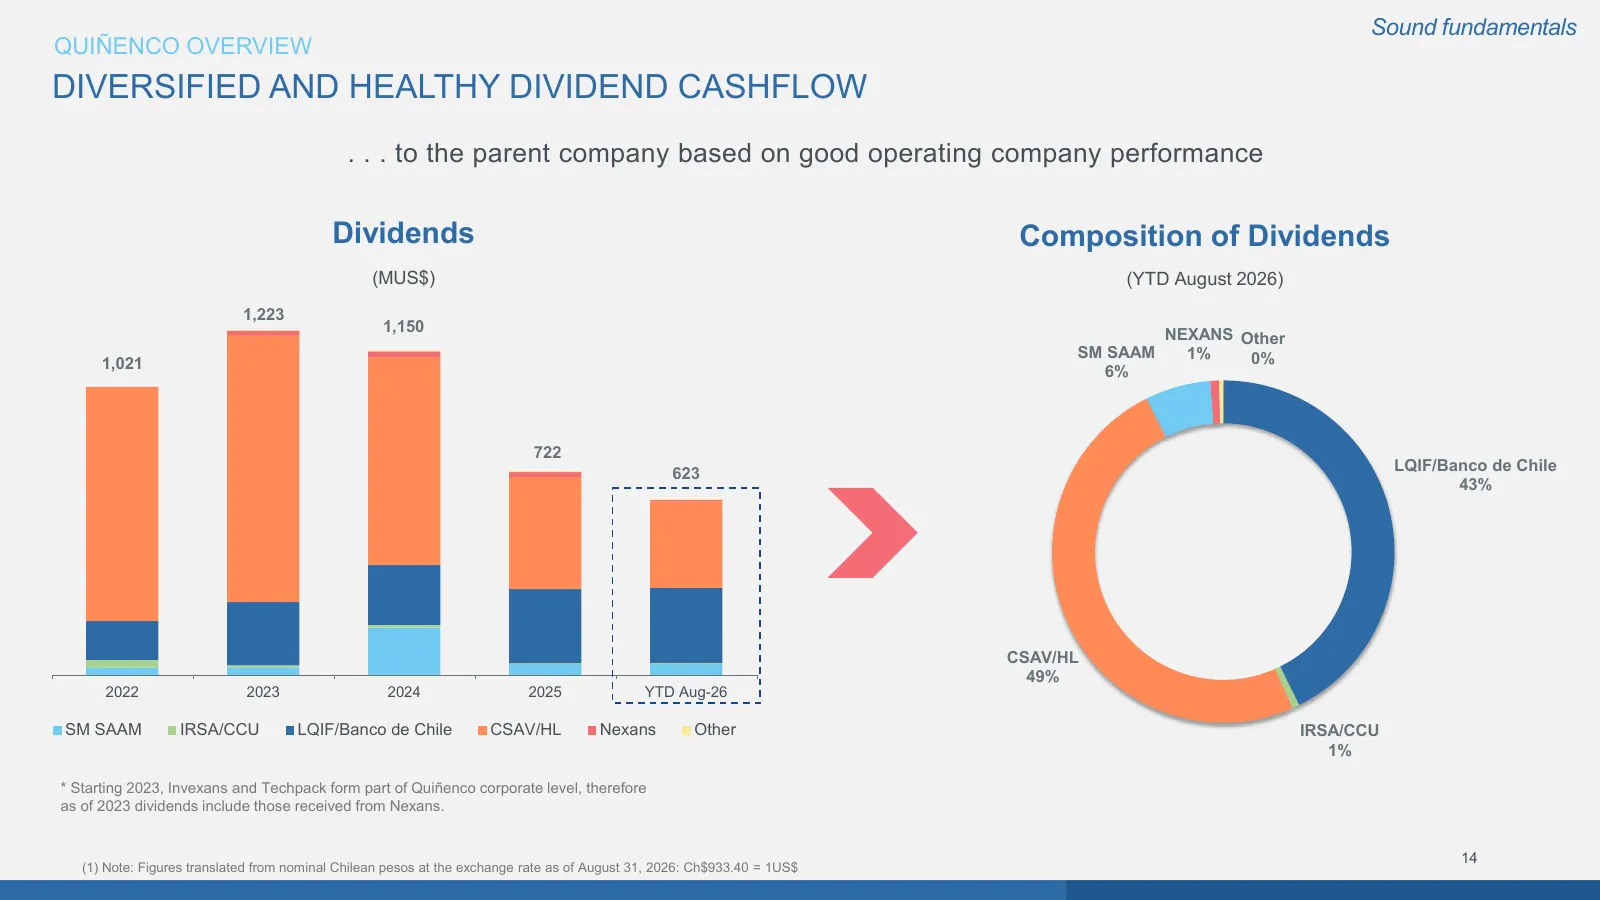
Sound fundamentals QUIÑENCO OVERVIEW DIVERSIFIED AND HEALTHY DIVIDEND CASHFLOW . . . to the parent company based on good operating company performance Dividends Composition of Dividends (MUS$) (YTD August 2026) 1,223 1,150 NEXANS Other SM SAAM 1% 0% 1,021 6% 722 LQIF/Banco de Chile 623 43% CSAV/HL 4
Slide 15: First Class Board and Management
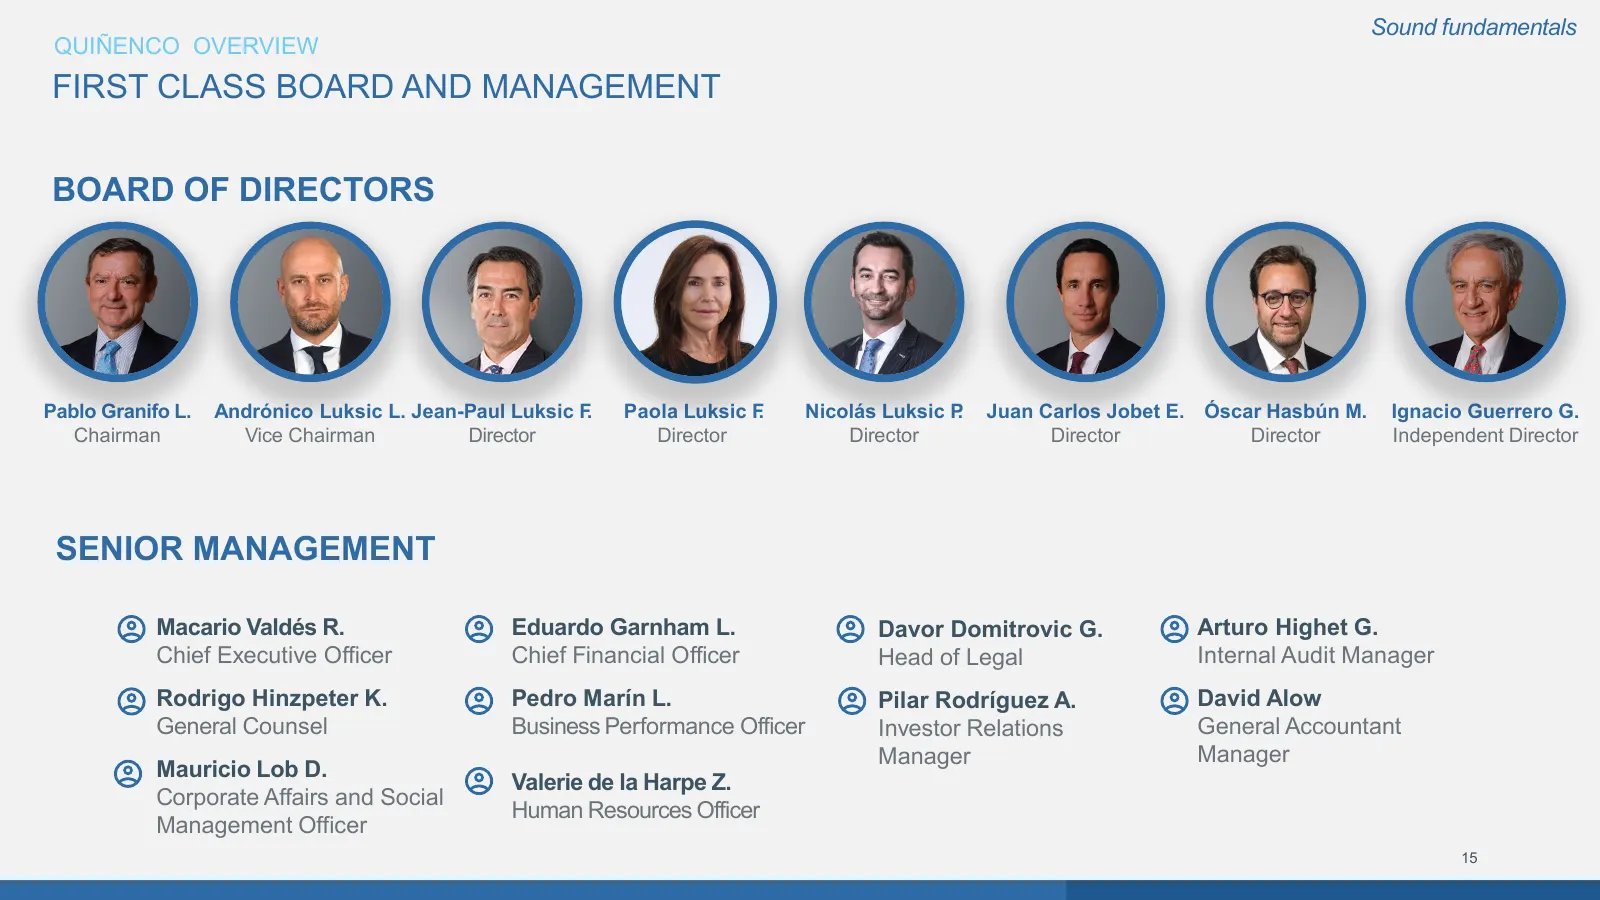
Sound fundamentals QUIÑENCO OVERVIEW FIRST CLASS BOARD AND MANAGEMENT BOARD OF DIRECTORS Pablo Granifo L. Andrónico Luksic L. Jean-Paul Luksic F. Paola Luksic F. Nicolás Luksic P. Juan Carlos Jobet E. Óscar Hasbún M. Ignacio Guerrero G. Chairman Vice Chairman Director Director Director Director Dire
Slide 16: Agile and Flexible Organization
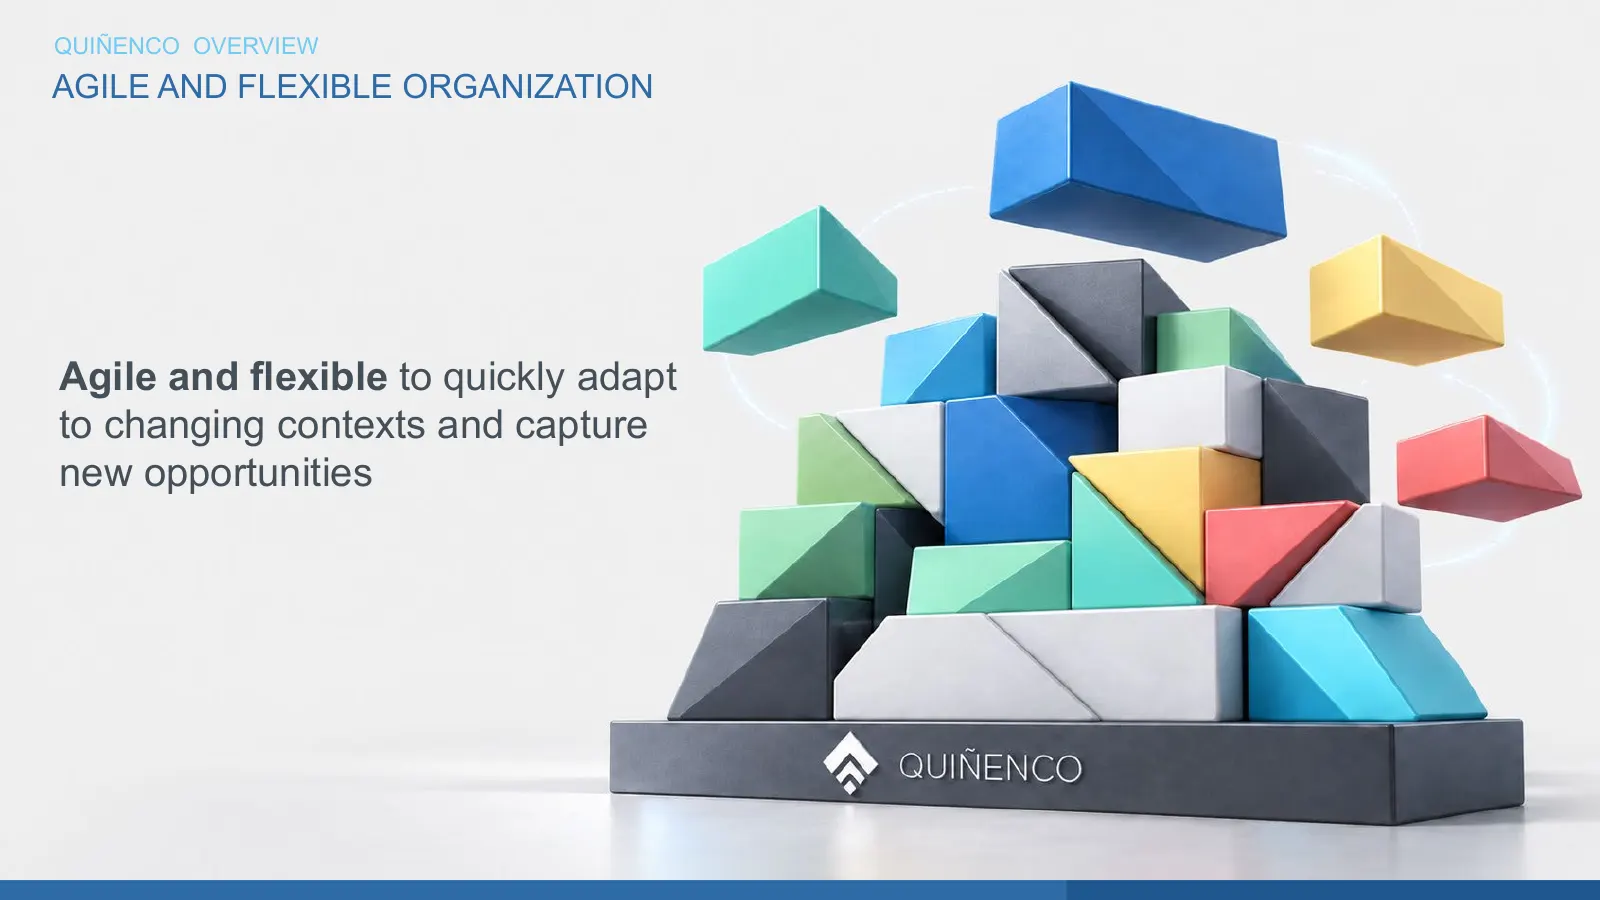
QUIÑENCO OVERVIEW AGILE AND FLEXIBLE ORGANIZATION Agile and flexible to quickly adapt to changing contexts and capture new opportunities
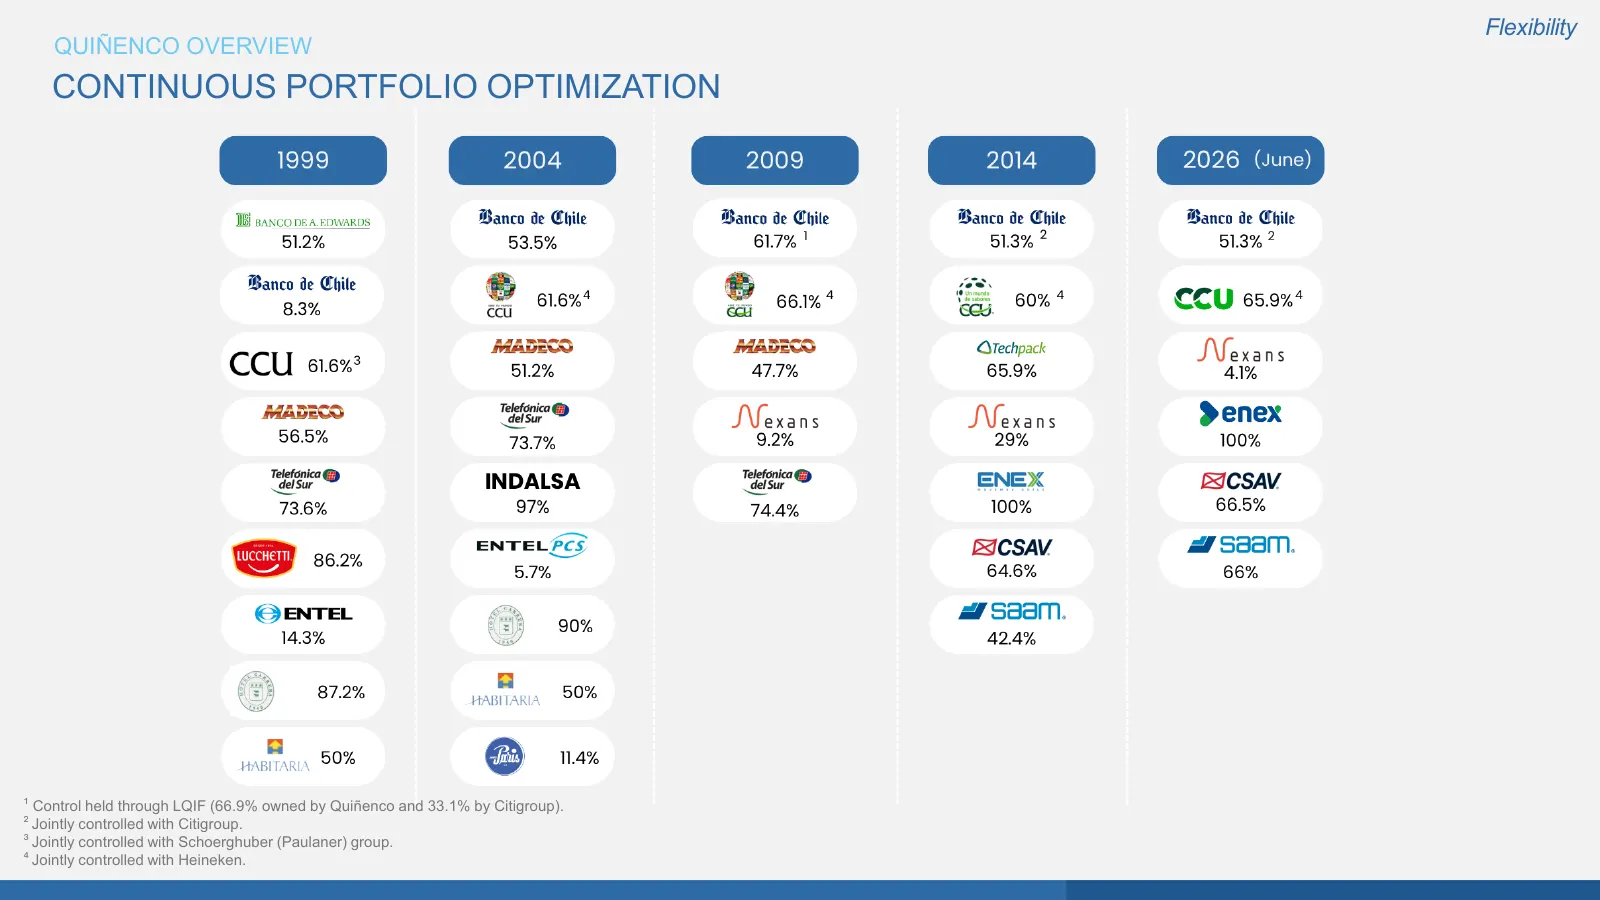
Slide 17: Continuous Portfolio Optimization
Flexibility QUIÑENCO OVERVIEW CONTINUOUS PORTFOLIO OPTIMIZATION ¹ Control held through LQIF (66.9% owned by Quiñenco and 33.1% by Citigroup). ² Jointly controlled with Citigroup. ³ Jointly controlled with Schoerghuber (Paulaner) group. ⁴ Jointly controlled with Heineken.
Slide 18: Investment Criteria
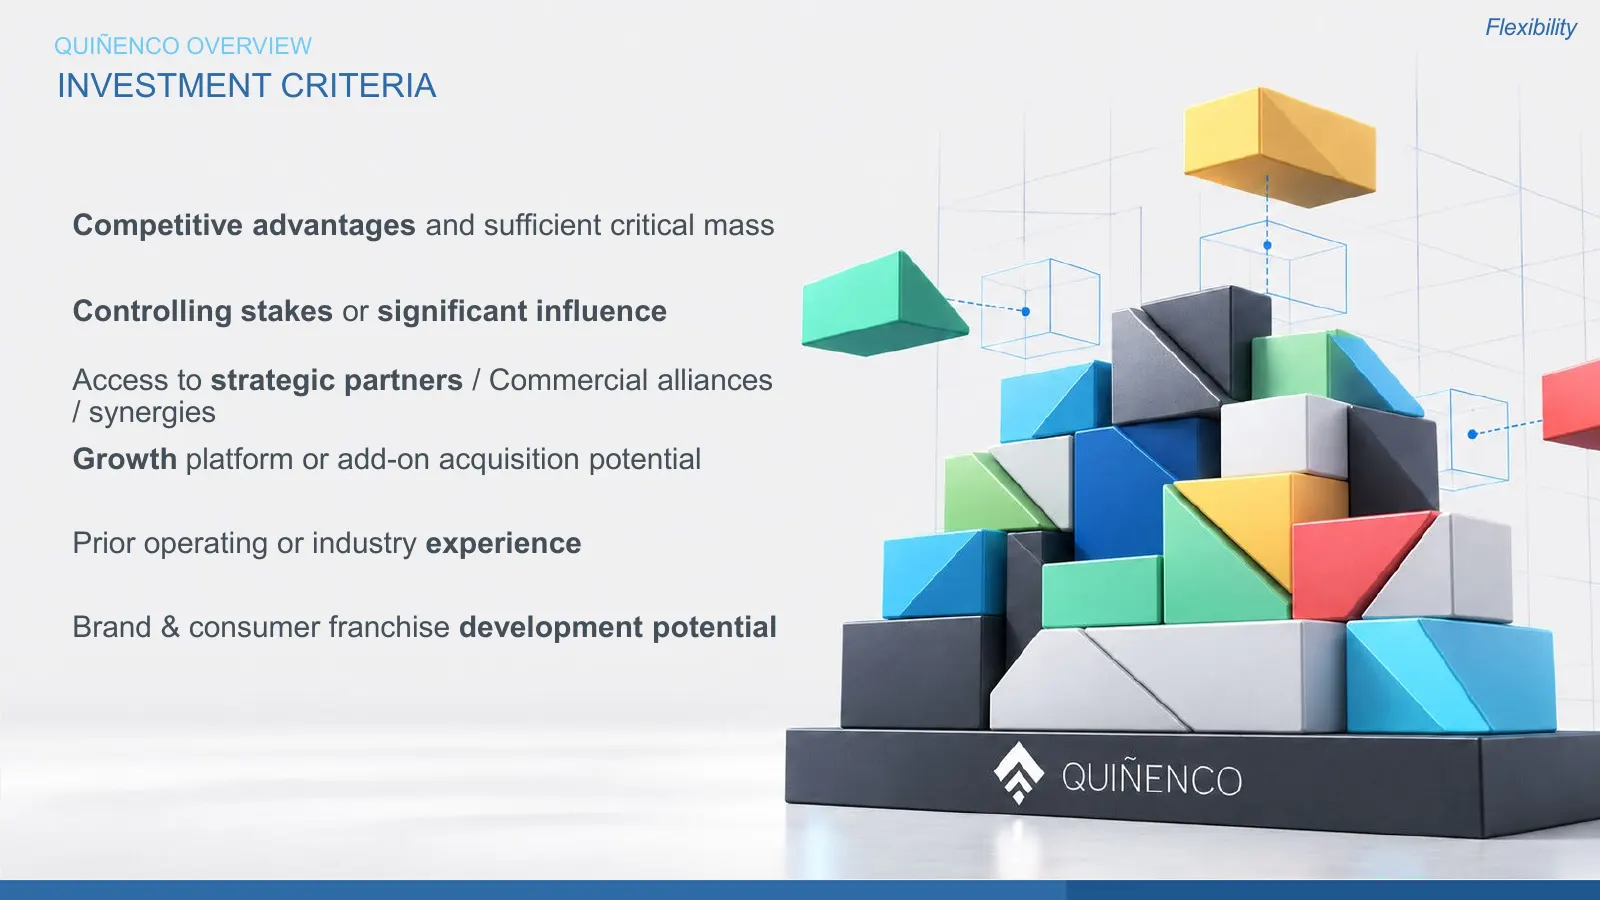
Flexibility QUIÑENCO OVERVIEW INVESTMENT CRITERIA Competitive advantages and sufficient critical mass Controlling stakes or significant influence Access to strategic partners / Commercial alliances / synergies Growth platform or add-on acquisition potential Prior operating or industry experience Bra
Slide 19: Quiñenco Overview, 1H 2026 Results, Conclusions
• QUIÑENCO OVERVIEW • 1H 2026 RESULTS • CONCLUSIONS 19
Slide 20: Sound Results
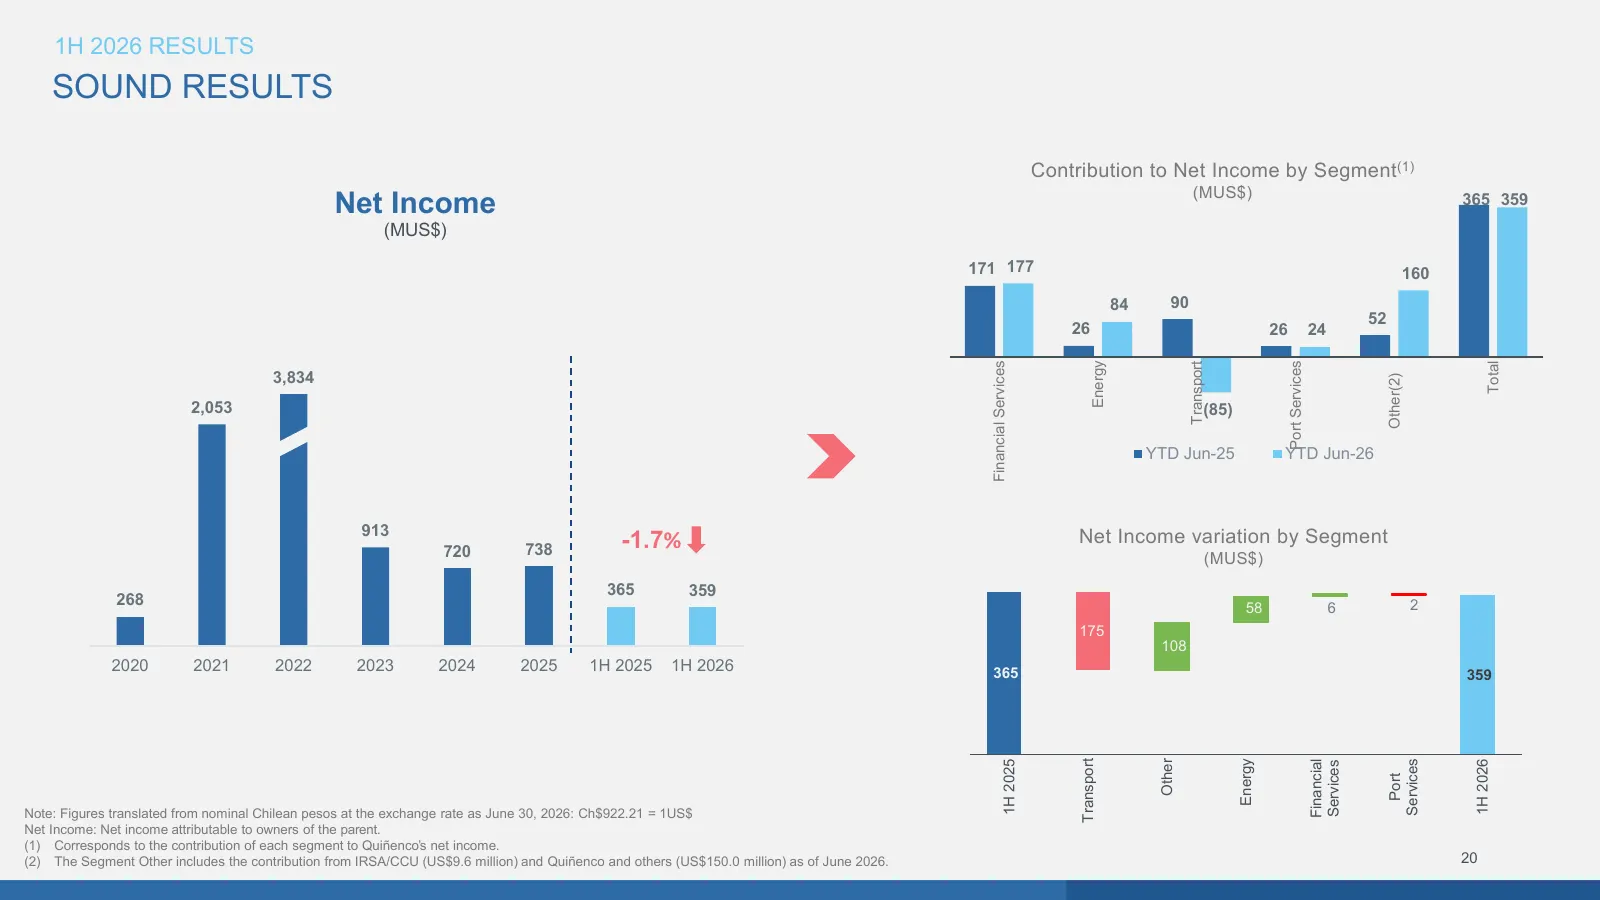
1H 2026 RESULTS SOUND RESULTS Contribution to Net Income by Segment(1) (MUS$) Net Income 365 359 (MUS$) 171 177 160 84 90 52 26 26 24 Financial Services Energy Transport Total Port Services 3,834 Other(2) 2,053 (85) YTD Jun-25 YTD Jun-26 913 Net Income variation by Segment 720 738 -1.7% (MUS$) 365 3
Slide 21: Overview of Operating Companies
1H 2026 RESULTS OVERVIEW OF OPERATING COMPANIES
Slide 22: Overview of Operating Companies
1H 2026 RESULTS OVERVIEW OF OPERATING COMPANIES
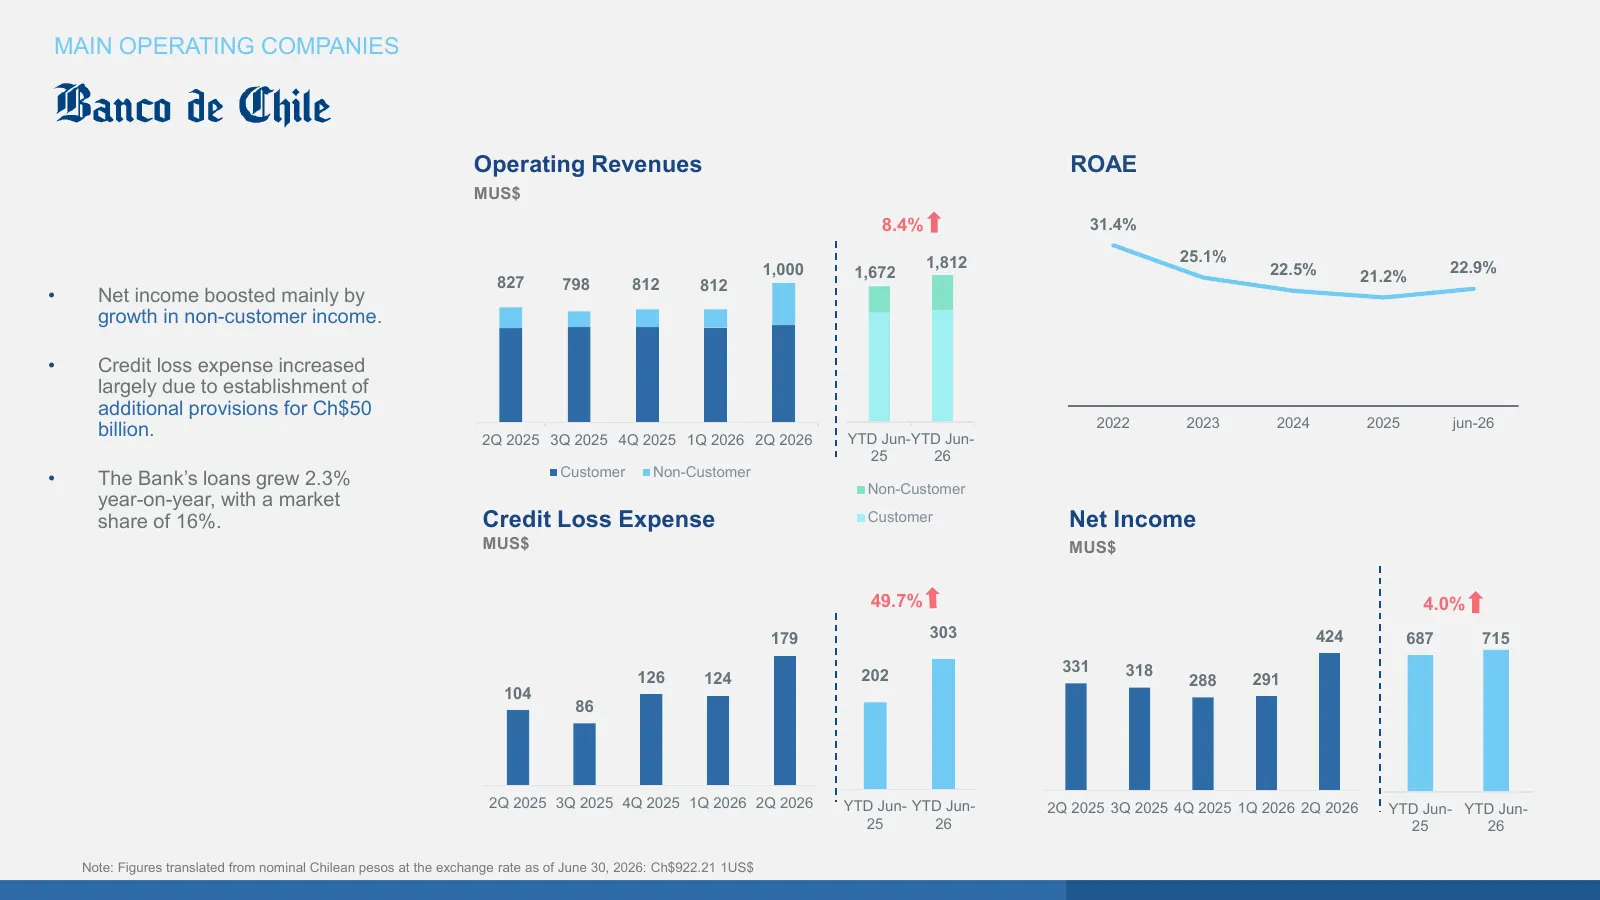
Slide 23: Main Operating Companies: Banking
MAIN OPERATING COMPANIES Operating Revenues ROAE MUS$ 8.4% 31.4% 1,812 25.1% 1,000 1,672 22.5% 22.9% 827 798 21.2% 812 812 • Net income boosted mainly by growth in non-customer income. • Credit loss expense increased largely due to establishment of additional provisions for Ch$50 2022 2023 2024 2025
Slide 24: Overview of Operating Companies
1H 2026 RESULTS OVERVIEW OF OPERATING COMPANIES
Slide 25: Main Operating Companies: Beverages
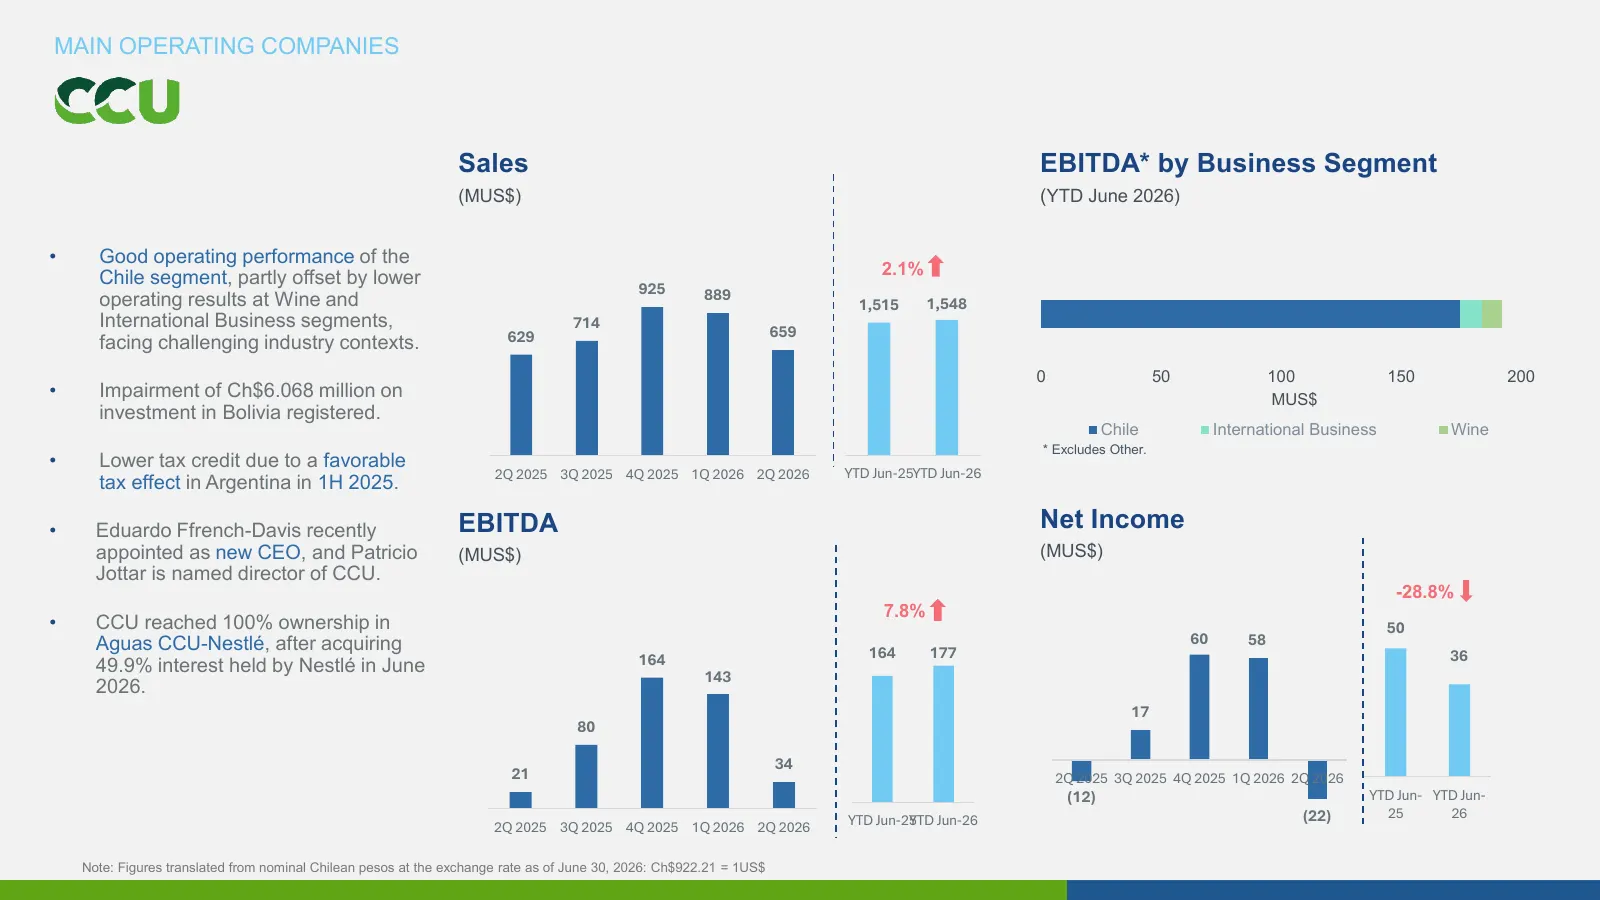
MAIN OPERATING COMPANIES Sales EBITDA* by Business Segment (MUS$) (YTD June 2026) • Good operating performance of the Chile segment, partly offset by lower 2.1% 925 889 operating results at Wine and 1,515 1,548 International Business segments, 714 659 facing challenging industry contexts. 629 0 50 1
Slide 26: Overview of Operating Companies
1H 2026 RESULTS OVERVIEW OF OPERATING COMPANIES
Slide 27: Main Operating Companies: Shipping Investment
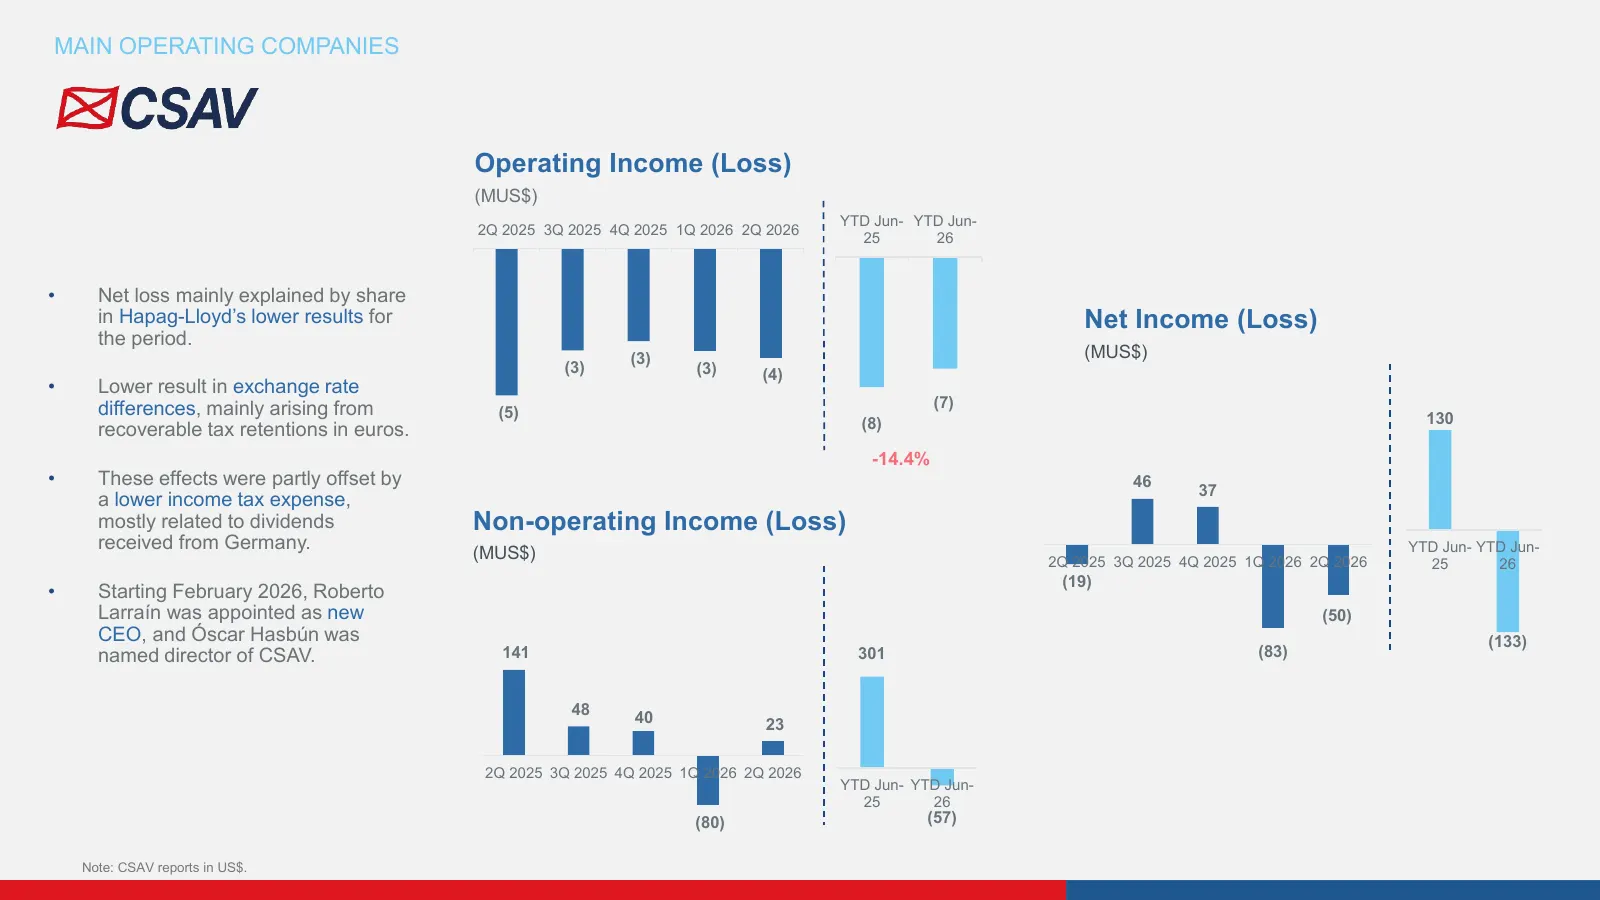
MAIN OPERATING COMPANIES Operating Income (Loss) (MUS$) YTD Jun- YTD Jun- 2Q 2025 3Q 2025 4Q 2025 1Q 2026 2Q 2026 25 26 • Net loss mainly explained by share in Hapag-Lloyd’s lower results for Net Income (Loss) the period. (3) (MUS$) (3) (3) (4) • Lower result in exchange rate differences, mainly ari
Slide 28: Main Operating Companies: Liner Shipping
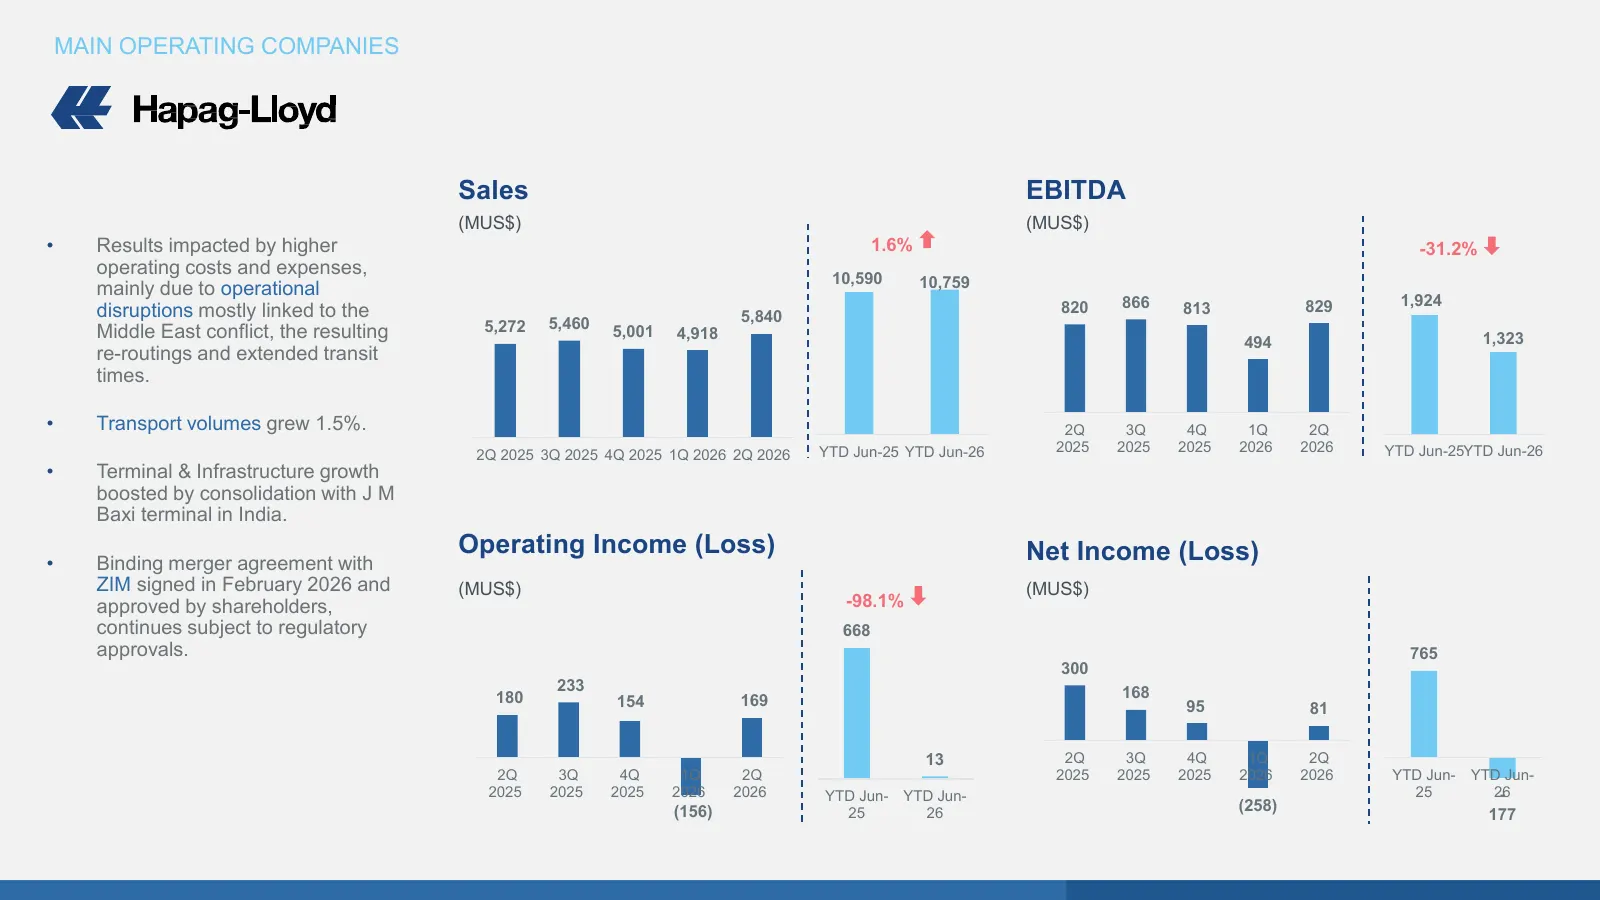
MAIN OPERATING COMPANIES Sales EBITDA (MUS$) (MUS$) • Results impacted by higher 1.6% -31.2% operating costs and expenses, 10,590 10,759 mainly due to operational 820 866 813 829 1,924 disruptions mostly linked to the 5,840 5,272 5,460 Middle East conflict, the resulting 5,001 4,918 494 1,323 re-rou
Slide 29: Overview of Operating Companies
1H 2026 RESULTS OVERVIEW OF OPERATING COMPANIES
Slide 30: Main Operating Companies: Energy
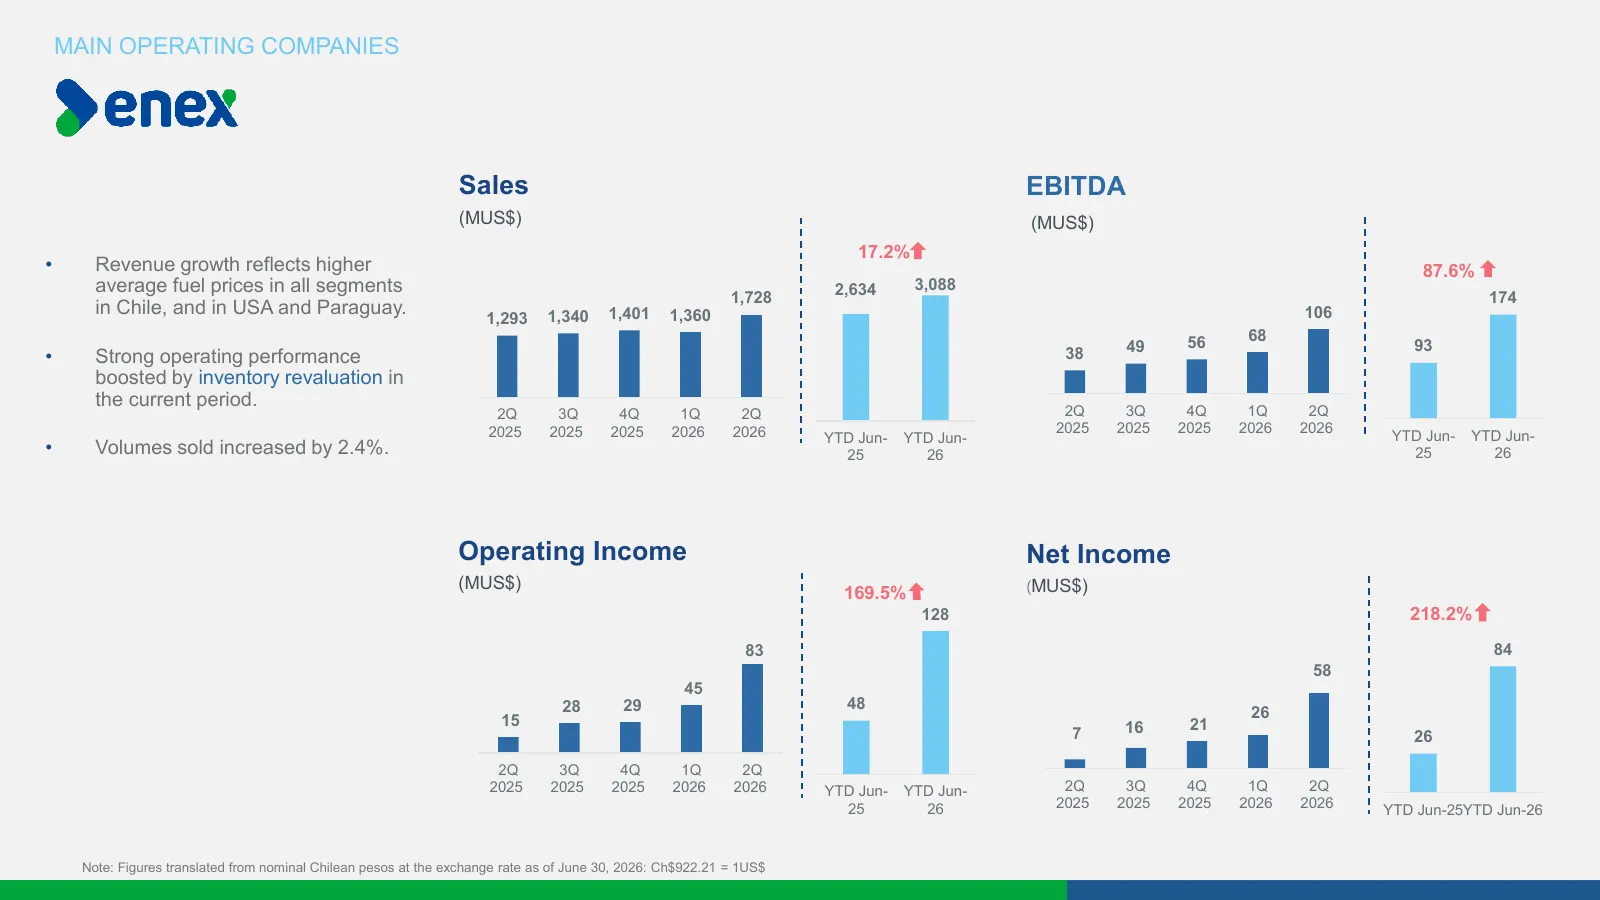
MAIN OPERATING COMPANIES Sales EBITDA (MUS$) (MUS$) 17.2% • Revenue growth reflects higher 87.6% average fuel prices in all segments 2,634 3,088 1,728 174 in Chile, and in USA and Paraguay. 1,293 1,340 1,401 1,360 106 56 68 38 49 93 • Strong operating performance boosted by inventory revaluation in
Slide 31: Overview of Operating Companies
1H 2026 RESULTS OVERVIEW OF OPERATING COMPANIES
Slide 32: Main Operating Companies: Port Services
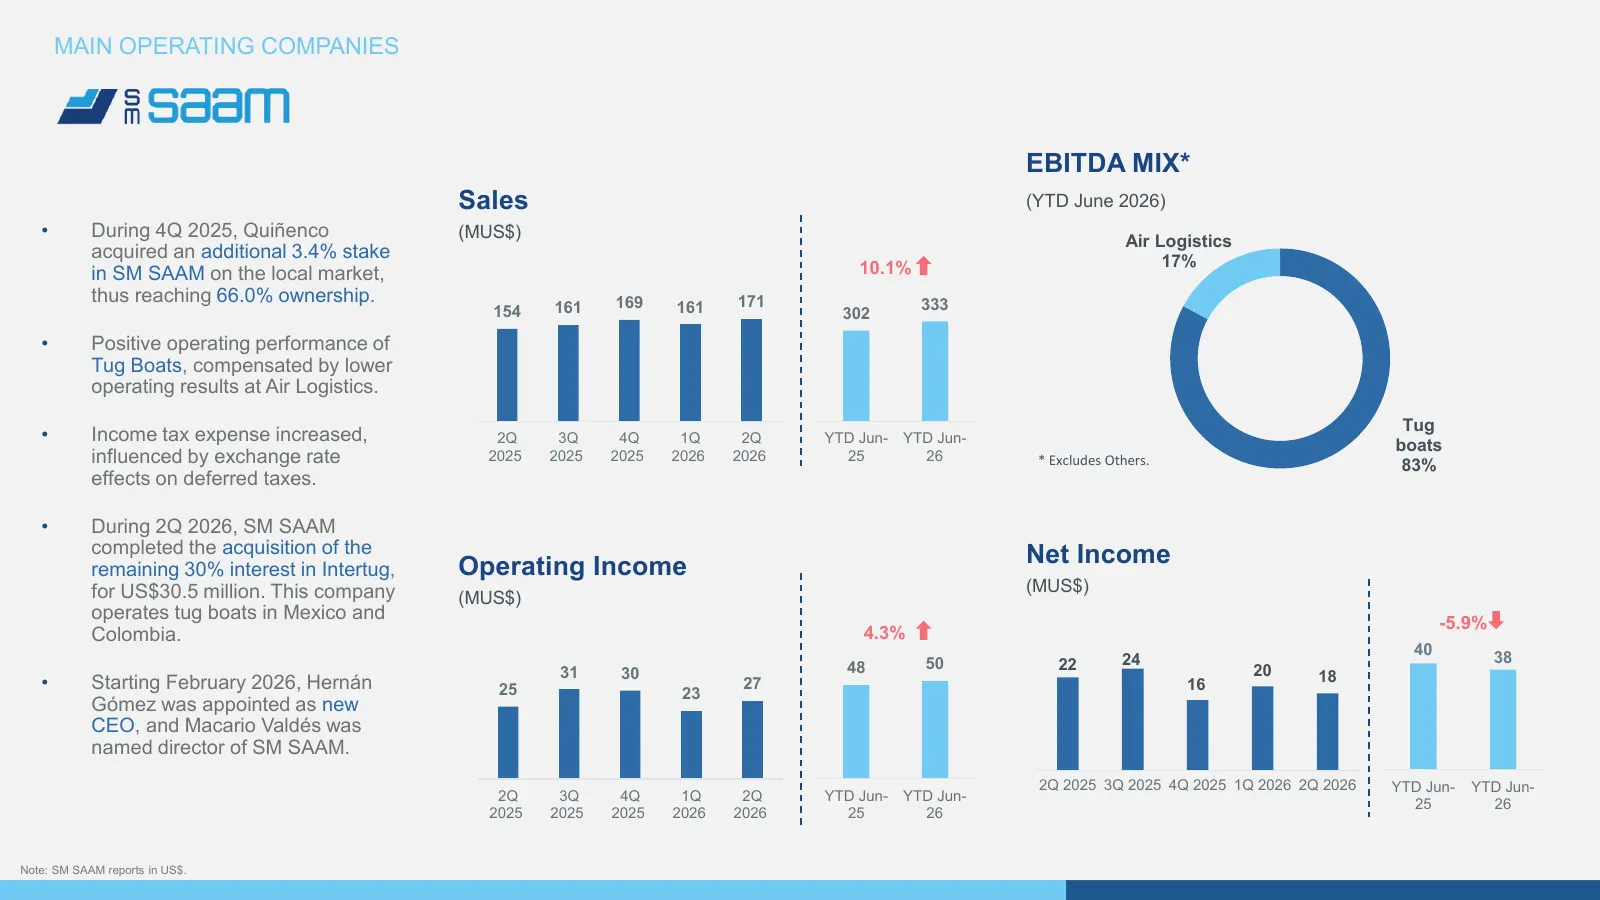
MAIN OPERATING COMPANIES EBITDA MIX* Sales (YTD June 2026) • During 4Q 2025, Quiñenco (MUS$) Air Logistics acquired an additional 3.4% stake 17% in SM SAAM on the local market, 10.1% thus reaching 66.0% ownership. 169 171 333 154 161 161 302 • Positive operating performance of Tug Boats, compensated
Slide 33: Quiñenco Overview, 1H 2026 Results, Conclusions
• QUIÑENCO OVERVIEW • 1H 2026 RESULTS • CONCLUSIONS 33
Slide 34: Conclusions: Context and Outlook
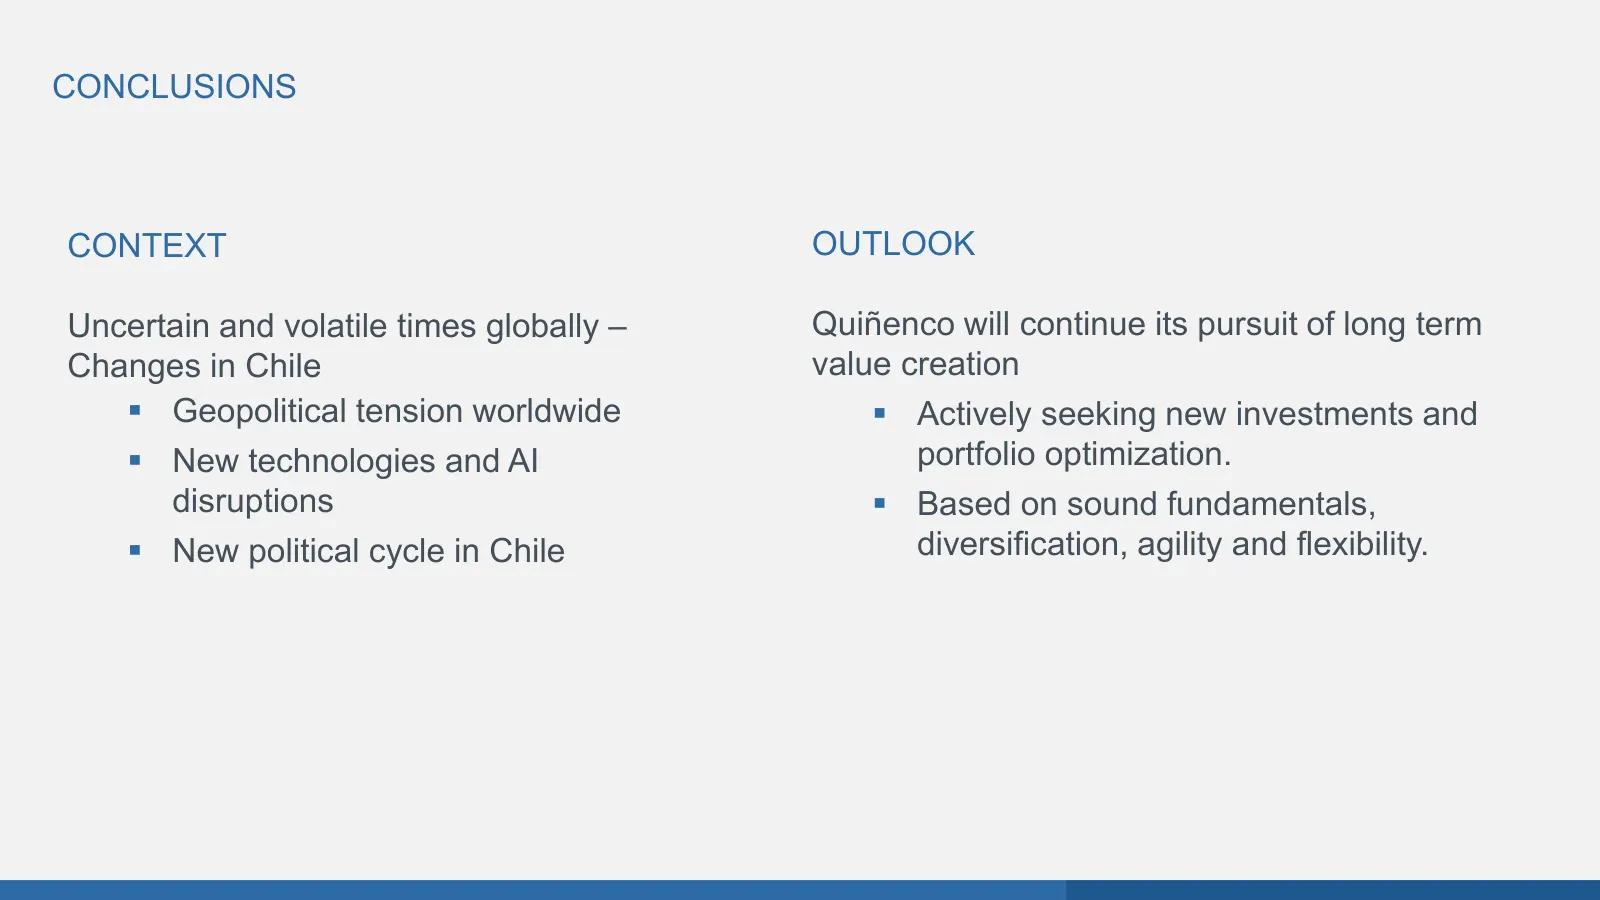
CONCLUSIONS CONTEXT OUTLOOK Uncertain and volatile times globally – Quiñenco will continue its pursuit of long term Changes in Chile value creation Geopolitical tension worldwide Actively seeking new investments and New technologies and AI portfolio optimization. disruptions Based on sound f
Slide 35: Q&A Session
4S ha QUINENCO Q&A SESSION 35
Slide 36: Thank You for Your Attention
THANK YOU FOR YOUR ATTENTION 36
Source: company website
More decks from Quinenco S.A.
 Investor Presentation (October 2026)46 slides · October 2026
 Investor Presentation (June 2026)44 slides · June 2026
 FY2025 Earnings Presentation37 slides · Apr 9, 2026
 Investor Presentation (February 2026)47 slides · February 2026
 Investor Presentation (October 2025)48 slides · October 2025
 Investor Presentation (September 2025)48 slides · September 2025