MidWestOne Financial Group Inc
MidWestOne Financial — Debt Investor Presentation (July 2020)
50 slides from MidWestOne Financial's debt investor presentation, Jul 29, 2020
Slide 1: Subordinated Notes Offering Investor Presentation
Subordinated Notes Offering Investor Presentation July 8, 2020
Slide 2: Disclaimer
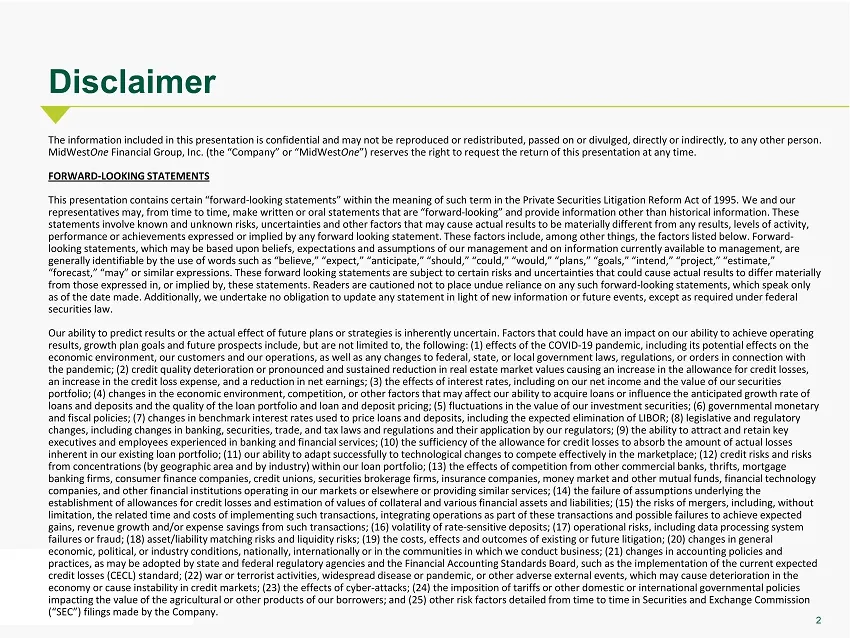
2 Disclaimer The information included in this presentation is confidential and may not be reproduced or redistributed, passed on or divulg ed, directly or indirectly, to any other person. MidWest One Financial Group, Inc. (the “Company” or “MidWest One ”) reserves the right to request the return of
Slide 3: Disclaimer
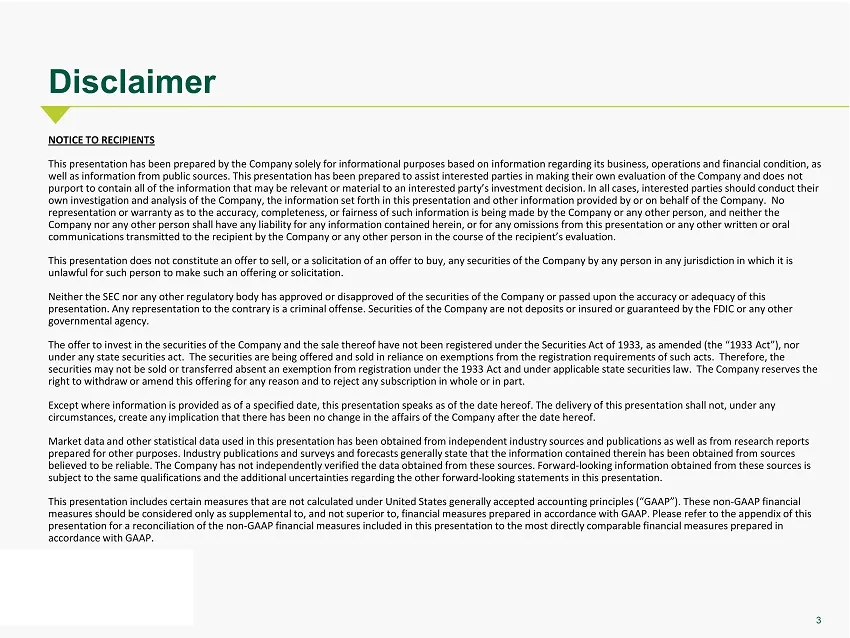
3 Disclaimer NOTICE TO RECIPIENTS This presentation has been prepared by the Company solely for informational purposes based on information regarding its business, ope rations and financial condition, as well as information from public sources. This presentation has been prepared to assist intereste
Slide 4: Potential Terms of Proposed Offering
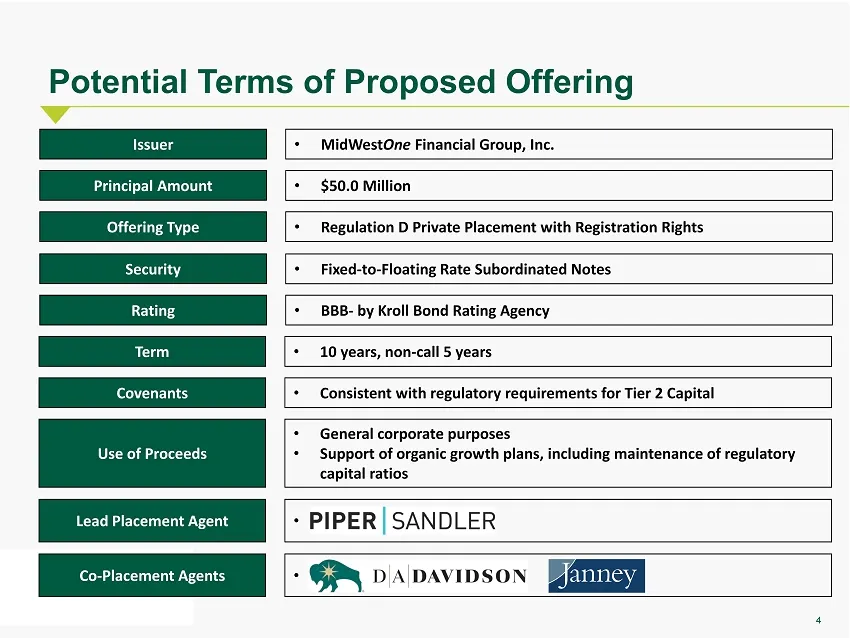
4 Potential Terms of Proposed Offering Issuer • MidWest One Financial Group, Inc. Principal Amount • $50.0 Million Offering Type • Regulation D Private Placement with Registration Rights Security • Fixed - to - Floating Rate Subordinated Notes Rating • BBB - by Kroll Bond Rating Agency Term • 10 yea
Slide 5: Company Profile
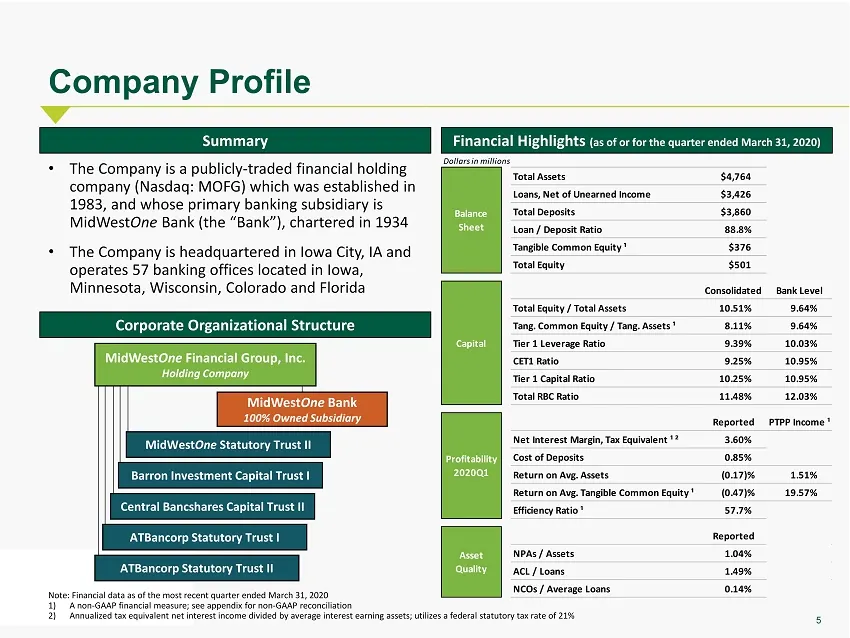
5 Company Profile • The Company is a publicly - traded financial holding company (Nasdaq: MOFG) which was established in 1983, and whose primary banking subsidiary is MidWest One Bank (the “Bank”), chartered in 1934 • The Company is headquartered in Iowa City, IA and operates 57 banking offices loca
Slide 6: Branch Franchise
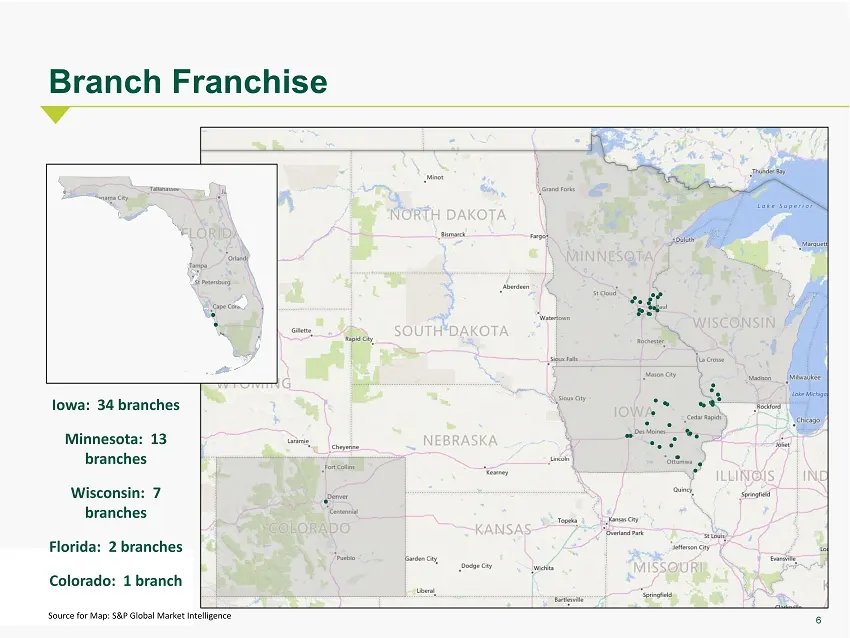
6 Source for Map: S&P Global Market Intelligence Branch Franchise Iowa: 34 branches Minnesota: 13 branches Wisconsin: 7 branches Florida: 2 branches Colorado: 1 branch
Slide 7: Corporate Strategy
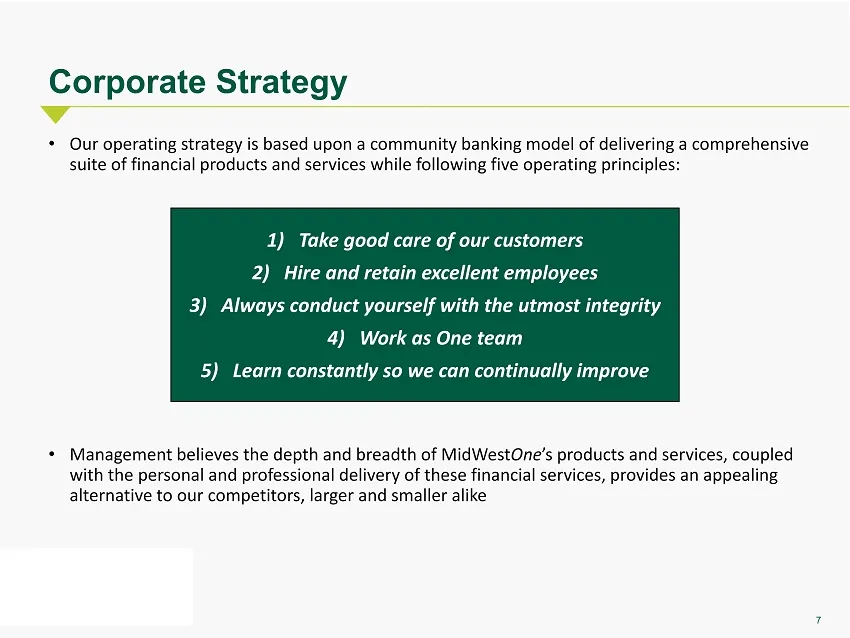
7 • Our operating strategy is based upon a community banking model of delivering a comprehensive suite of financial products and services while following five operating principles: • Management believes the depth and breadth of MidWest One ’s products and services, coupled with the personal and prof
Slide 8: Business Line Overview
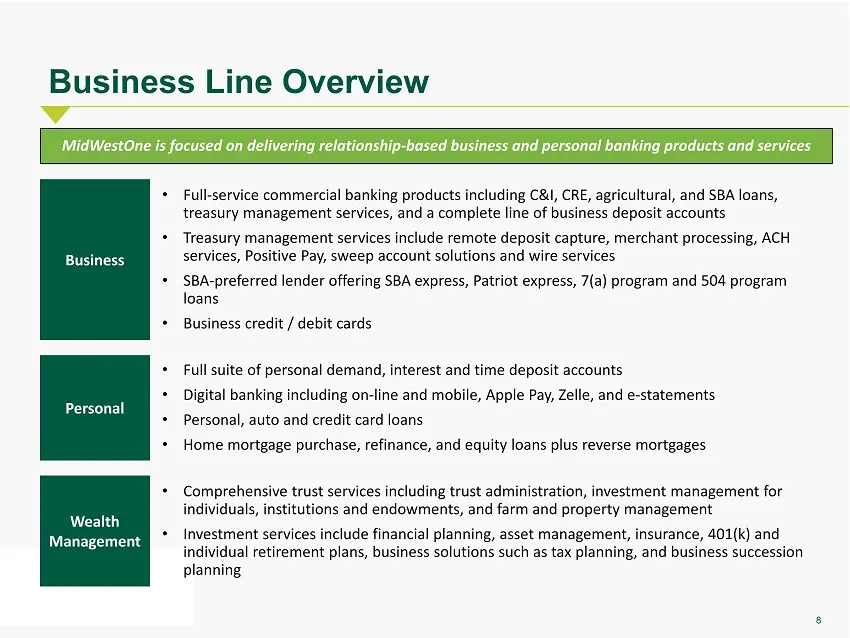
8 Business • Full - service commercial banking products including C&I, CRE, agricultural, and SBA loans, treasury management services, and a complete line of business deposit accounts • Treasury management services include remote deposit capture, merchant processing, ACH services, Positive Pay, swee
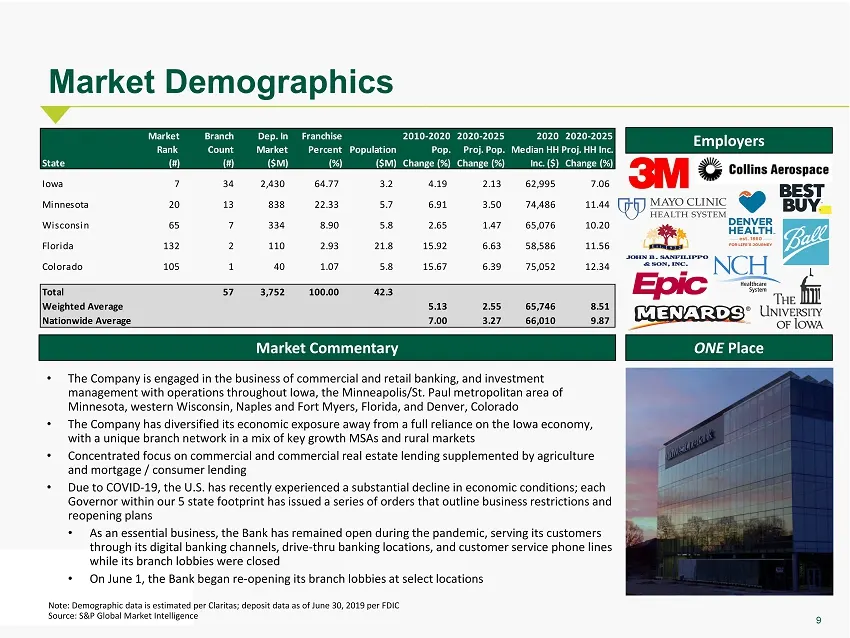
Slide 9: Market Demographics
9 Market Demographics Note: Demographic data is estimated per Claritas; deposit data as of June 30, 2019 per FDIC Source: S&P Global Market Intelligence • The Company is engaged in the business of commercial and retail banking, and investment management with operations throughout Iowa, the Minneapol
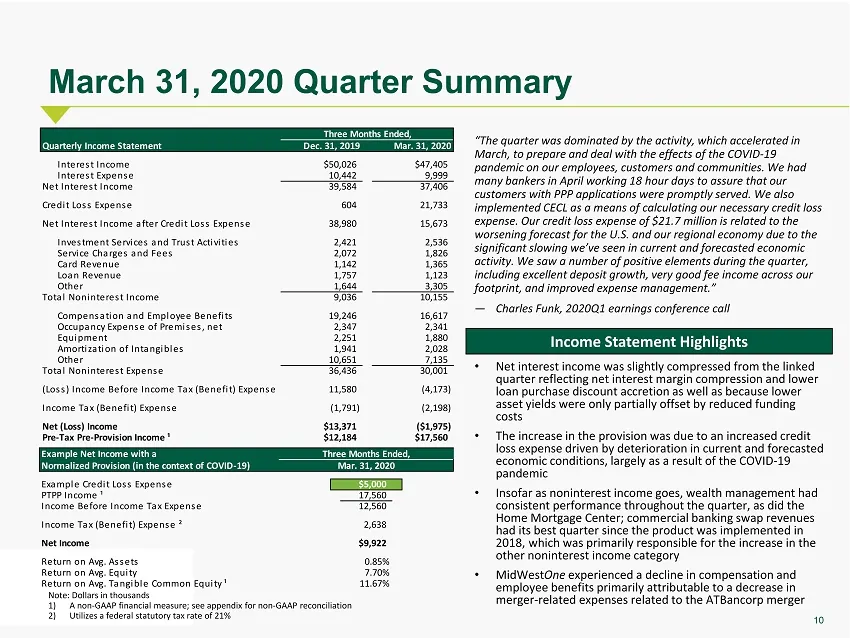
Slide 10: March 31, 2020 Quarter Summary
10 March 31, 2020 Quarter Summary “ The quarter was dominated by the activity, which accelerated in March, to prepare and deal with the effects of the COVID - 19 pandemic on our employees, customers and communities. We had many bankers in April working 18 hour days to assure that our customers with
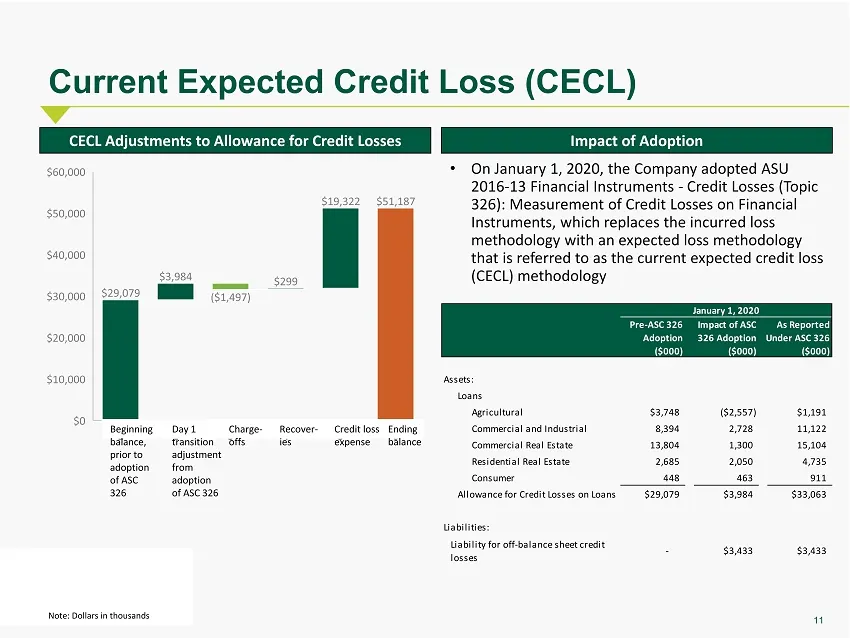
Slide 11: Current Expected Credit Loss (CECL)
11 Current Expected Credit Loss (CECL) Note: Dollars in thousands CECL Adjustments to Allowance for Credit Losses Impact of Adoption • On January 1, 2020, the Company adopted ASU 2016 - 13 Financial Instruments - Credit Losses (Topic 326): Measurement of Credit Losses on Financial Instruments, which
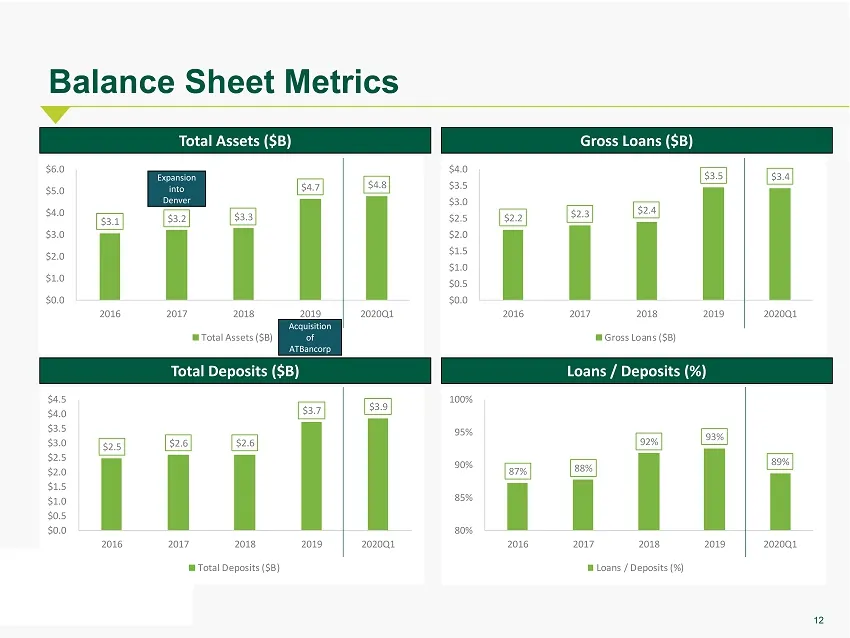
Slide 12: Balance Sheet Metrics
12 Balance Sheet Metrics Total Assets ($B) Gross Loans ($B) Total Deposits ($B) Loans / Deposits (%) $2.2 $2.3 $2.4 $3.5 $3.4 $0.0 $0.5 $1.0 $1.5 $2.0 $2.5 $3.0 $3.5 $4.0 2016 2017 2018 2019 2020Q1 Gross Loans ($B) $2.5 $2.6 $2.6 $3.7 $3.9 $0.0 $0.5 $1.0 $1.5 $2.0 $2.5 $3.0 $3.5 $4.0 $4.5 2016 2017
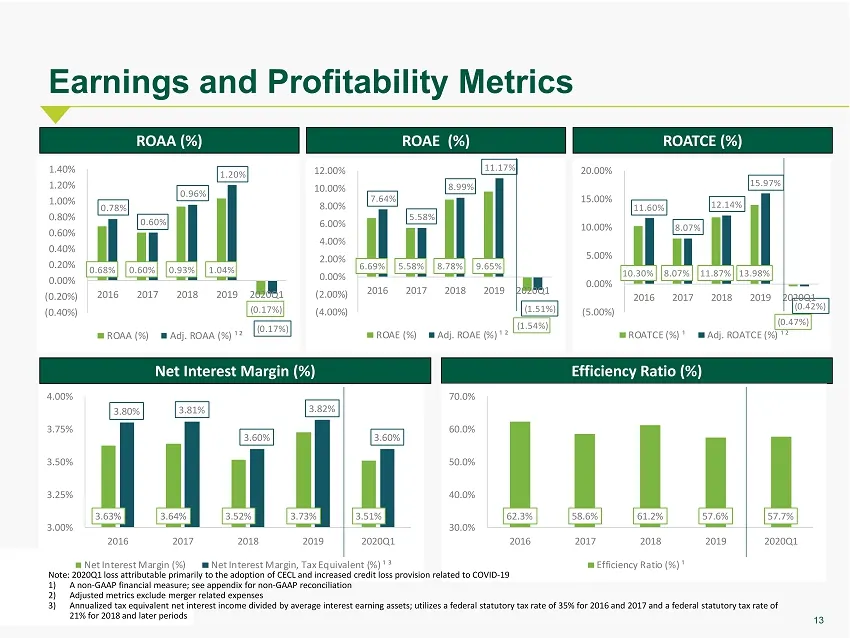
Slide 13: Earnings and Profitability Metrics
13 3.63% 3.64% 3.52% 3.73% 3.51% 3.80% 3.81% 3.60% 3.82% 3.60% 3.00% 3.25% 3.50% 3.75% 4.00% 2016 2017 2018 2019 2020Q1 Net Interest Margin (%) Net Interest Margin, Tax Equivalent (%) ¹ ³ 10.30% 8.07% 11.87% 13.98% (0.47%) 11.60% 8.07% 12.14% 15.97% (0.42%) (5.00%) 0.00% 5.00% 10.00% 15.00% 20.00% 2
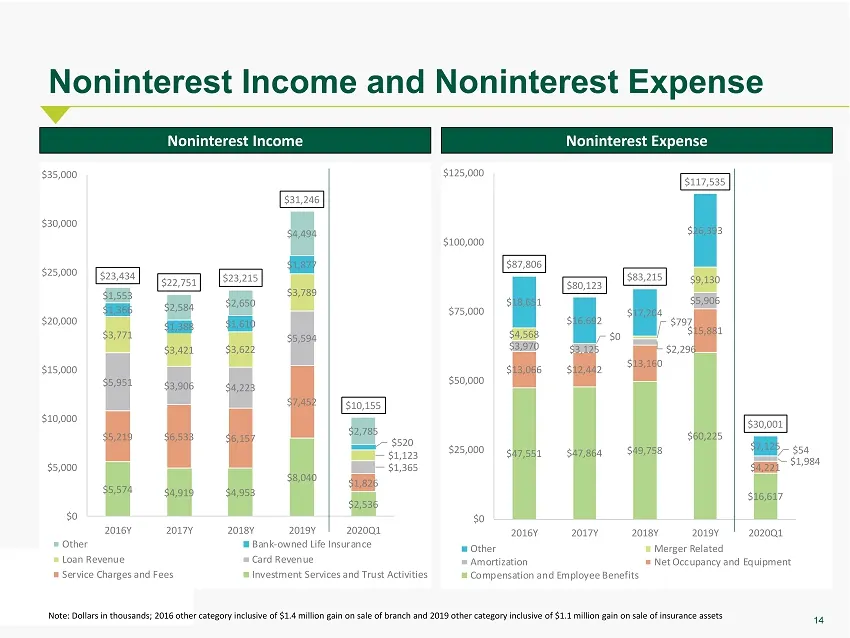
Slide 14: Noninterest Income and Noninterest Expense
14 $47,551 $47,864 $49,758 $60,225 $16,617 $13,066 $12,442 $13,160 $15,881 $4,221 $3,970 $3,125 $2,296 $5,906 $1,984 $4,568 $0 $797 $9,130 $54 $18,651 $16,692 $17,204 $26,393 $7,125 $87,806 $80,123 $83,215 $117,535 $30,001 $0 $25,000 $50,000 $75,000 $100,000 $125,000 2016Y 2017Y 2018Y 2019Y 2020Q1 O
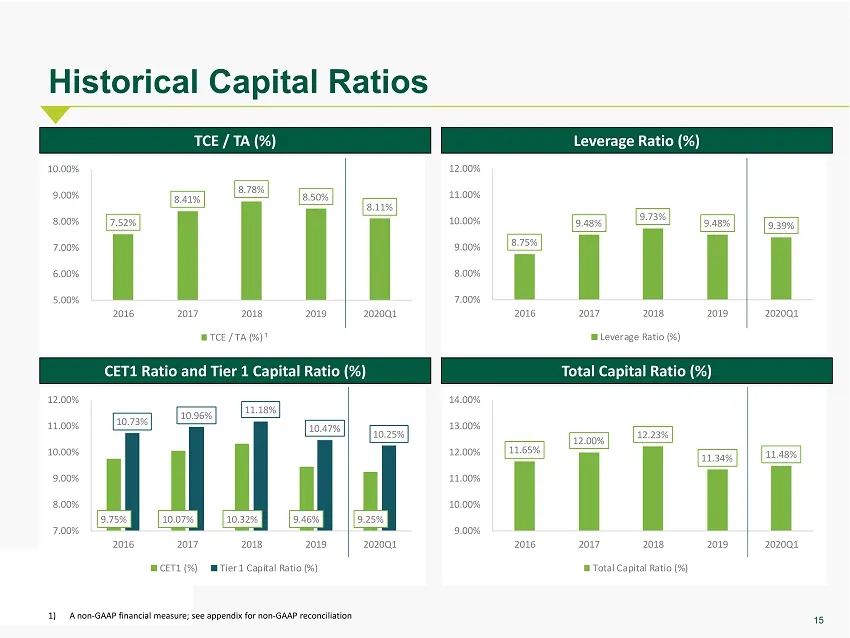
Slide 15: Historical Capital Ratios
15 Historical Capital Ratios 1) A non - GAAP financial measure; see appendix for non - GAAP reconciliation TCE / TA (%) Leverage Ratio (%) CET1 Ratio and Tier 1 Capital Ratio (%) Total Capital Ratio (%) 9.75% 10.07% 10.32% 9.46% 9.25% 10.73% 10.96% 11.18% 10.47% 10.25% 7.00% 8.00% 9.00% 10.00% 11.00
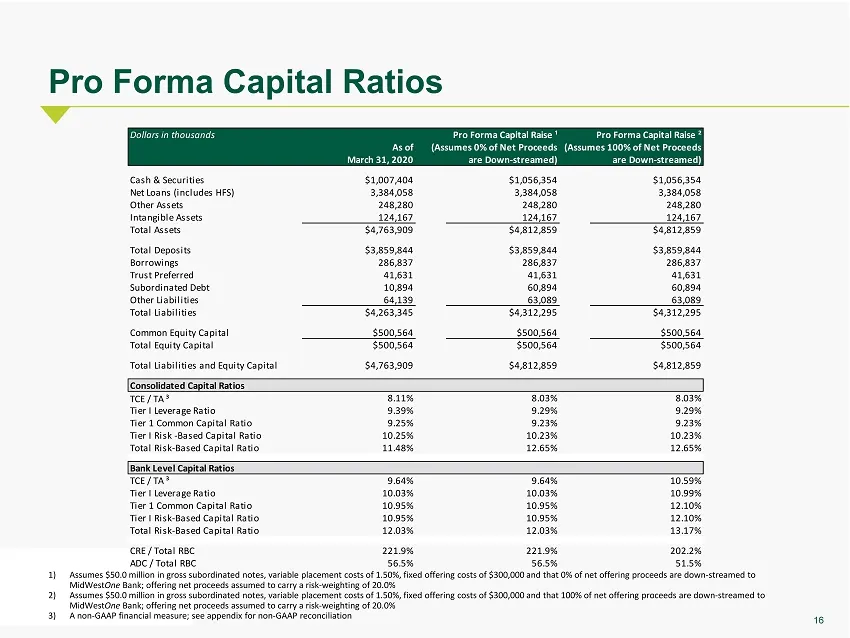
Slide 16: Pro Forma Capital Ratios
16 Pro Forma Capital Ratios 1) Assumes $50.0 million in gross subordinated notes, variable placement costs of 1.50%, fixed offering costs of $300,000 and that 0% of net o ffe ring proceeds are down - streamed to MidWest One Bank; offering net proceeds assumed to carry a risk - weighting of 20.0% 2)
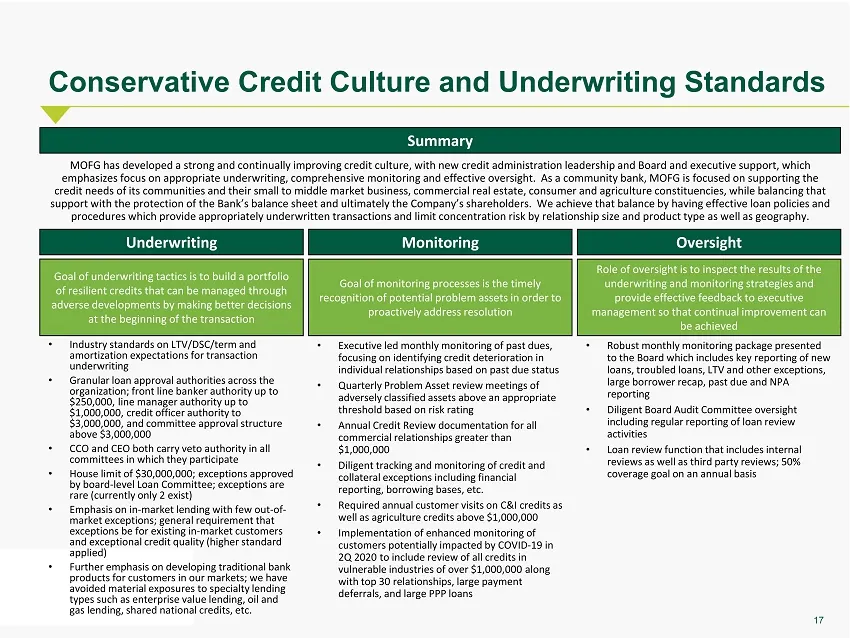
Slide 17: Conservative Credit Culture and Underwriting Standards
17 Conservative Credit Culture and Underwriting Standards Summary Underwriting Oversight MOFG has developed a strong and continually improving credit culture, with new credit administration leadership and Board and ex ecutive support, which emphasizes focus on appropriate underwriting, comprehensive
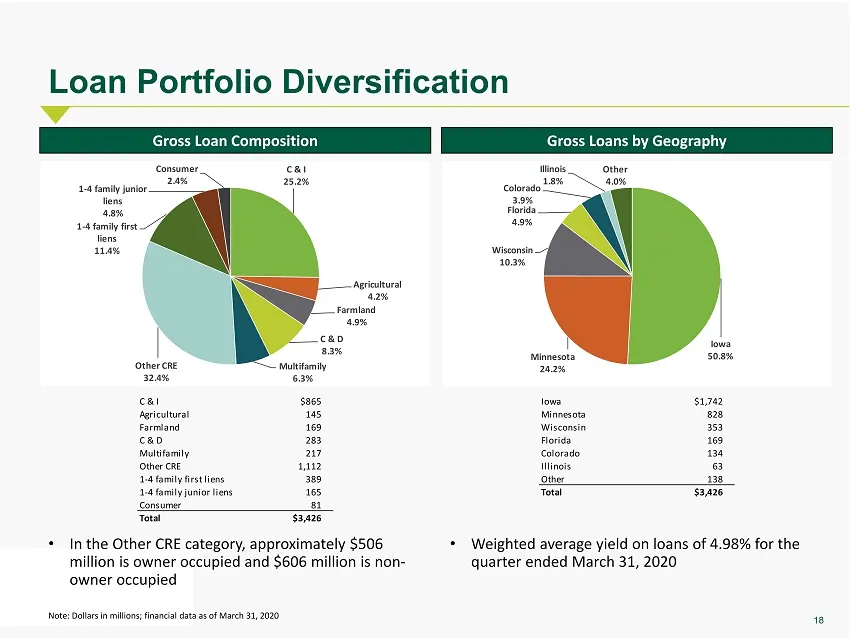
Slide 18: Loan Portfolio Diversification
18 Loan Portfolio Diversification Note: Dollars in millions; financial data as of March 31, 2020 C & I $865 Agricultural 145 Farmland 169 C & D 283 Multifamily 217 Other CRE 1,112 1-4 family first liens 389 1-4 family junior liens 165 Consumer 81 Total $3,426 C & I 25.2% Agricultural 4.2% Farmland 4
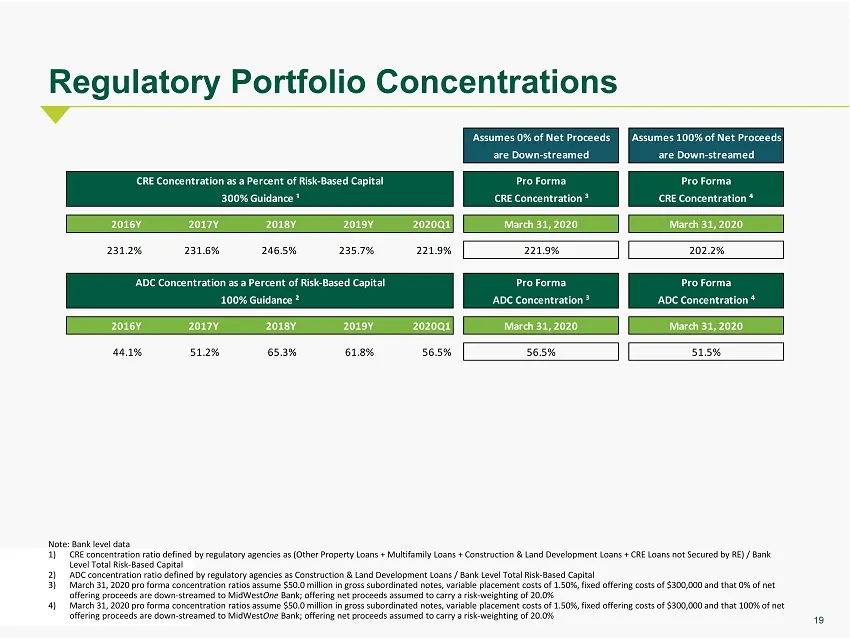
Slide 19: Regulatory Portfolio Concentrations
19 Regulatory Portfolio Concentrations Note: Bank level data 1) CRE concentration ratio defined by regulatory agencies as (Other Property Loans + Multifamily Loans + Construction & Land Develop men t Loans + CRE Loans not Secured by RE) / Bank Level Total Risk - Based Capital 2) ADC concentration ra
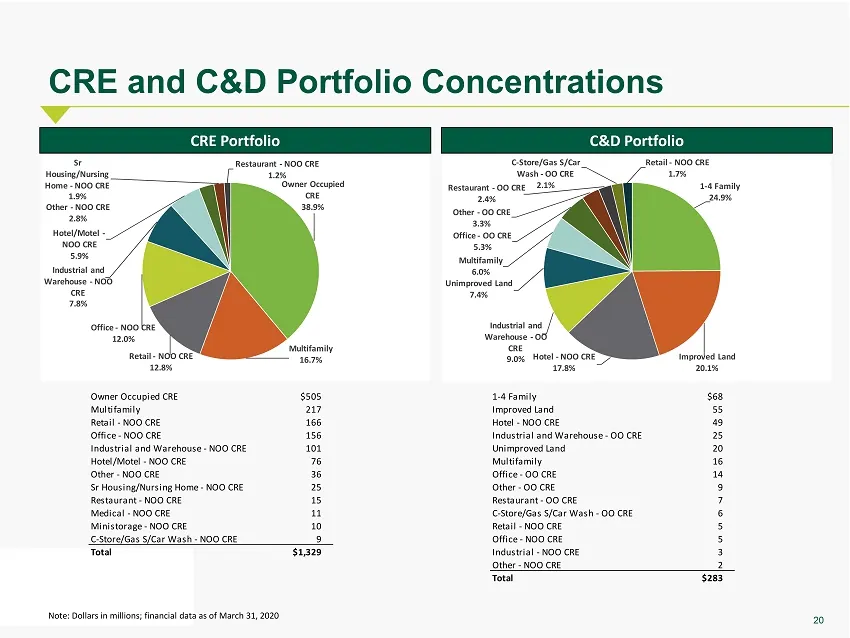
Slide 20: CRE and C&D Portfolio Concentrations
20 CRE and C&D Portfolio Concentrations Note: Dollars in millions; financial data as of March 31, 2020 CRE Portfolio C&D Portfolio Owner Occupied CRE $505 Multifamily 217 Retail - NOO CRE 166 Office - NOO CRE 156 Industrial and Warehouse - NOO CRE 101 Hotel/Motel - NOO CRE 76 Other - NOO CRE 36 Sr H
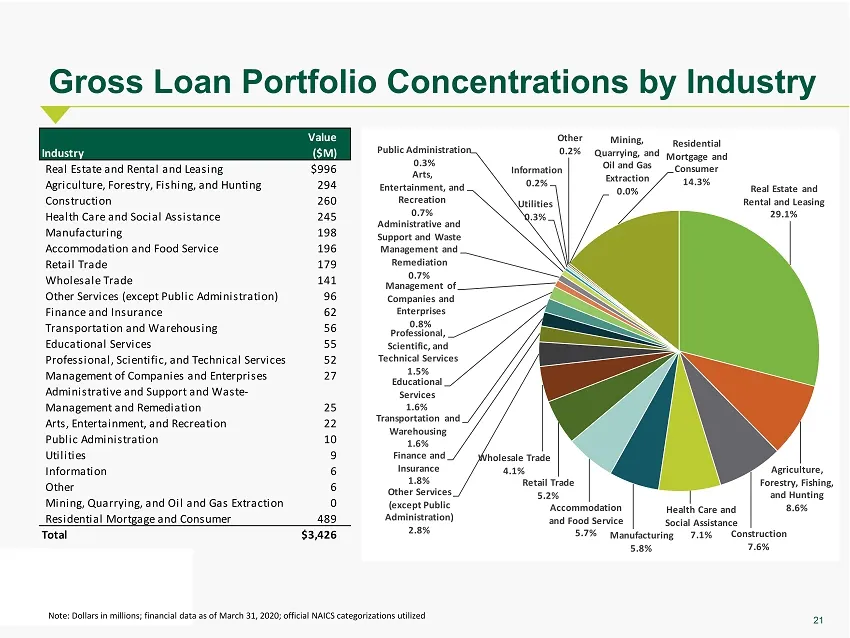
Slide 21: Gross Loan Portfolio Concentrations by Industry
21 Gross Loan Portfolio Concentrations by Industry Value Industry ($M) Real Estate and Rental and Leasing $996 Agriculture, Forestry, Fishing, and Hunting 294 Construction 260 Health Care and Social Assistance 245 Manufacturing 198 Accommodation and Food Service 196 Retail Trade 179 Wholesale Trade
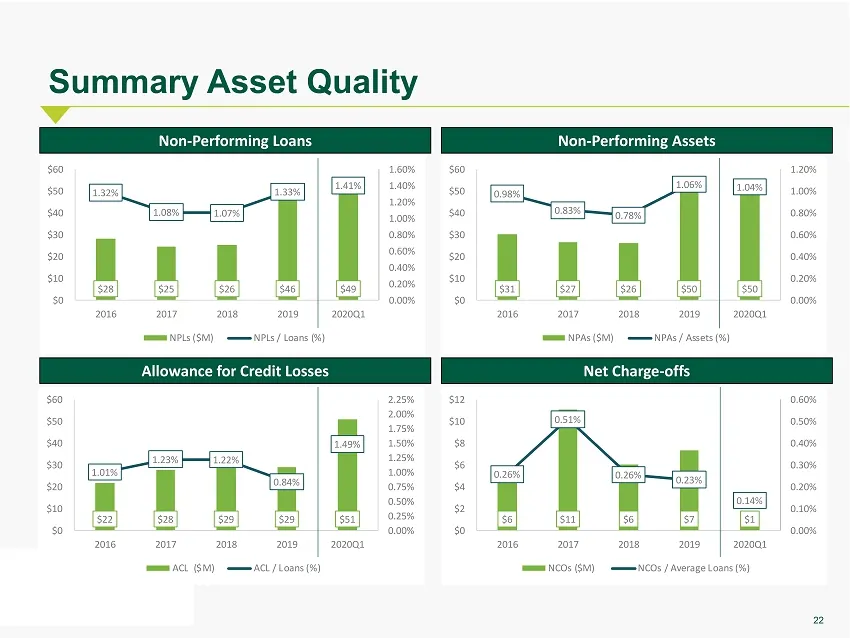
Slide 22: Summary Asset Quality
22 Summary Asset Quality Non - Performing Loans Non - Performing Assets Allowance for Credit Losses Net Charge - offs $6 $11 $6 $7 $1 0.26% 0.51% 0.26% 0.23% 0.14% 0.00% 0.10% 0.20% 0.30% 0.40% 0.50% 0.60% $0 $2 $4 $6 $8 $10 $12 2016 2017 2018 2019 2020Q1 NCOs ($M) NCOs / Average Loans (%) $22 $28 $
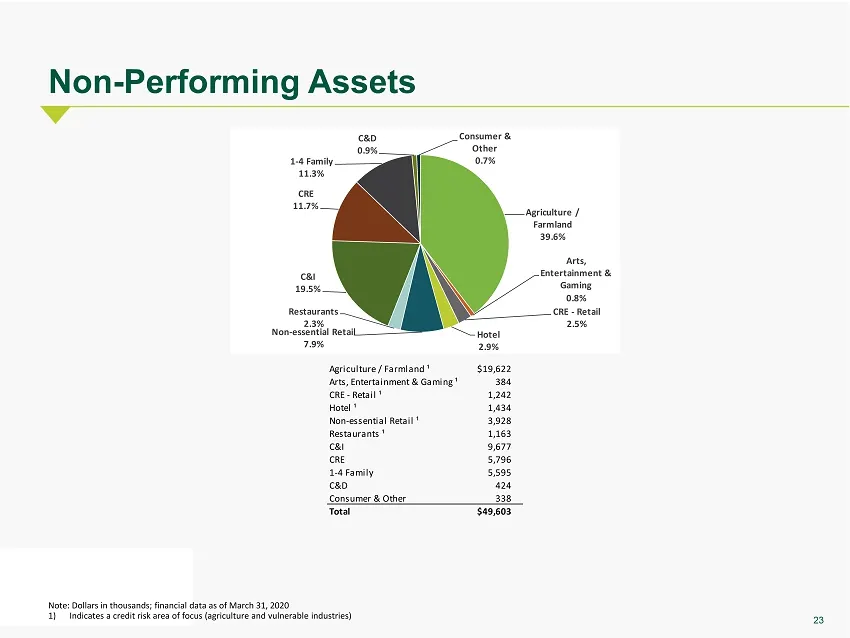
Slide 23: Non-Performing Assets
23 Non - Performing Assets Note: Dollars in thousands; financial data as of March 31, 2020 1) Indicates a credit risk area of focus (agriculture and vulnerable industries) Agriculture / Farmland ¹ $19,622 Arts, Entertainment & Gaming ¹ 384 CRE - Retail ¹ 1,242 Hotel ¹ 1,434 Non-essential Retail ¹ 3,
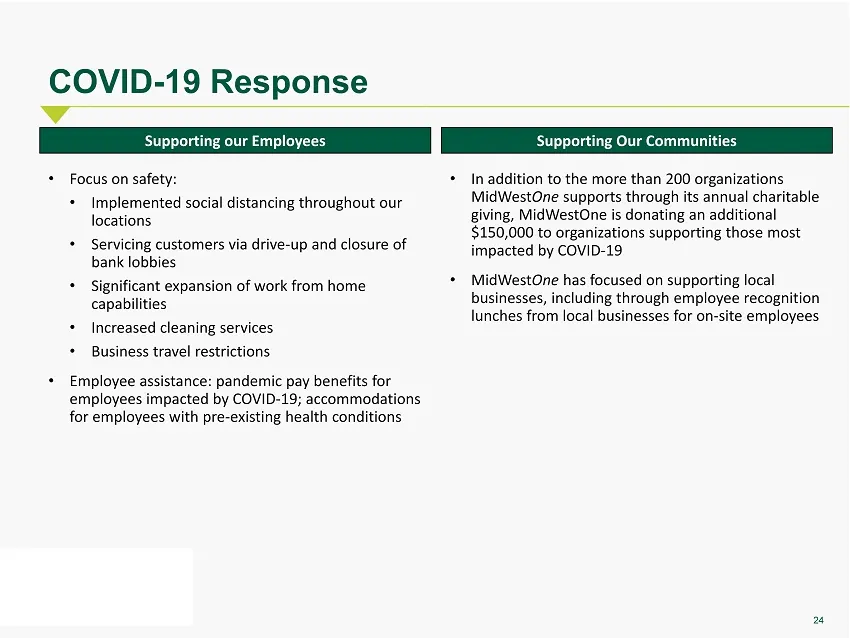
Slide 24: COVID-Response
24 COVID - 19 Response • Focus on safety: • Implemented social distancing throughout our locations • S ervicing customers via drive - up and closure of bank lobbies • S ignificant expansion of work from home capabilities • I ncreased cleaning services • Business travel restrictions • Employee assist
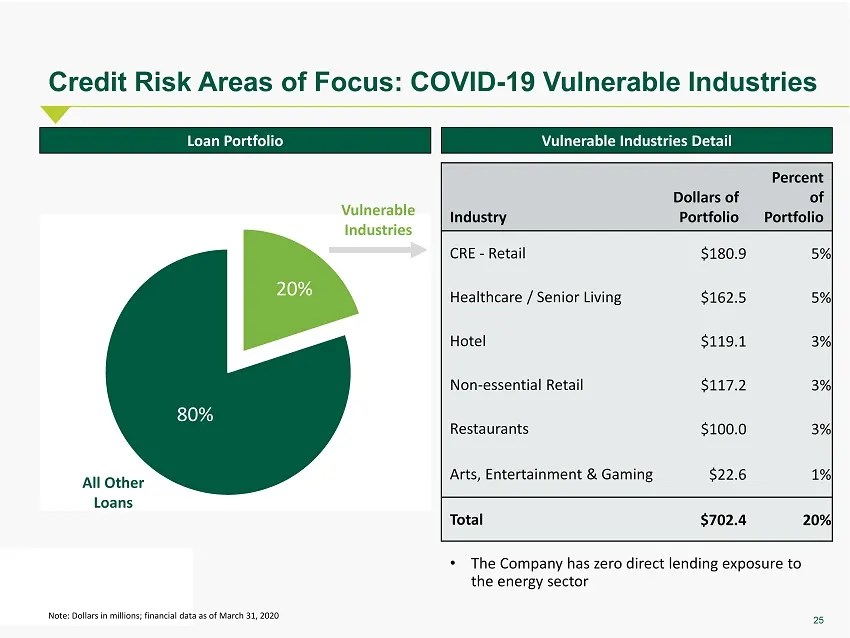
Slide 25: Credit Risk Areas of Focus: COVID-Vulnerable Industries
25 Credit Risk Areas of Focus: COVID - 19 Vulnerable Industries Industry Dollars of Portfolio Percent of Portfolio CRE - Retail $180.9 5% Healthcare / Senior Living $162.5 5% Hotel $119.1 3% Non - essential Retail $117.2 3% Restaurants $100.0 3% Arts, Entertainment & Gaming $22.6 1% Total $702.4 20%
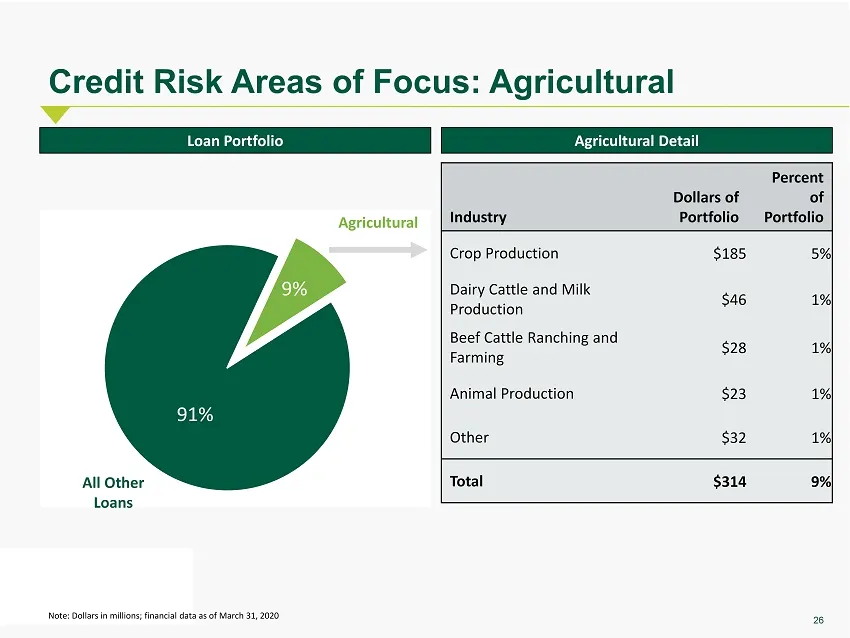
Slide 26: Credit Risk Areas of Focus: Agricultural Industry
26 Credit Risk Areas of Focus: Agricultural Industry Dollars of Portfolio Percent of Portfolio Crop Production $185 5% Dairy Cattle and Milk Production $46 1% Beef Cattle Ranching and Farming $28 1% Animal Production $23 1% Other $32 1% Total $314 9% Note: Dollars in millions; financial data as of M
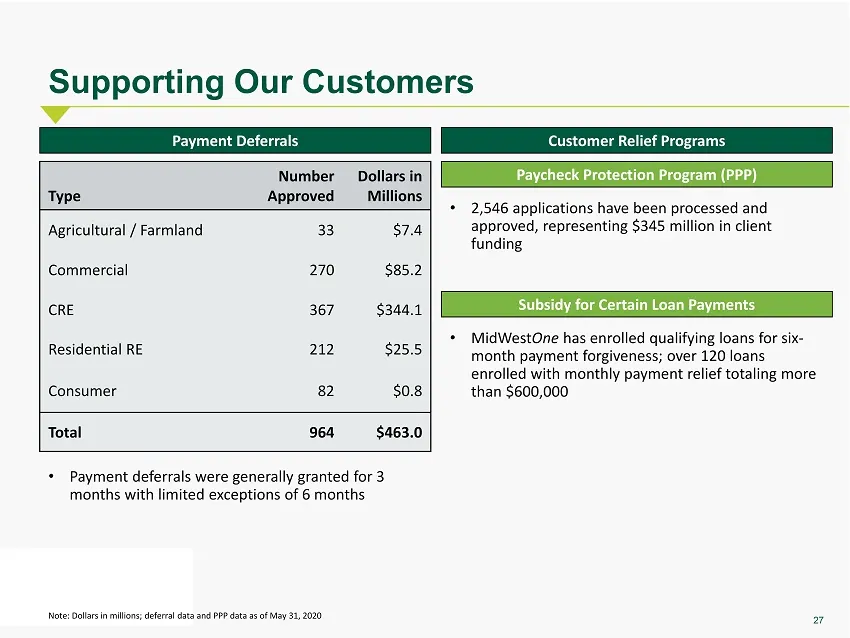
Slide 27: Supporting Our Customers
27 Supporting Our Customers • 2,546 applications have been processed and approved, representing $ 345 million in client funding Type Number Approved Dollars in Millions Agricultural / Farmland 33 $7.4 Commercial 270 $85.2 CRE 367 $344.1 Residential RE 212 $25.5 Consumer 82 $ 0.8 Total 964 $463.0 Pay
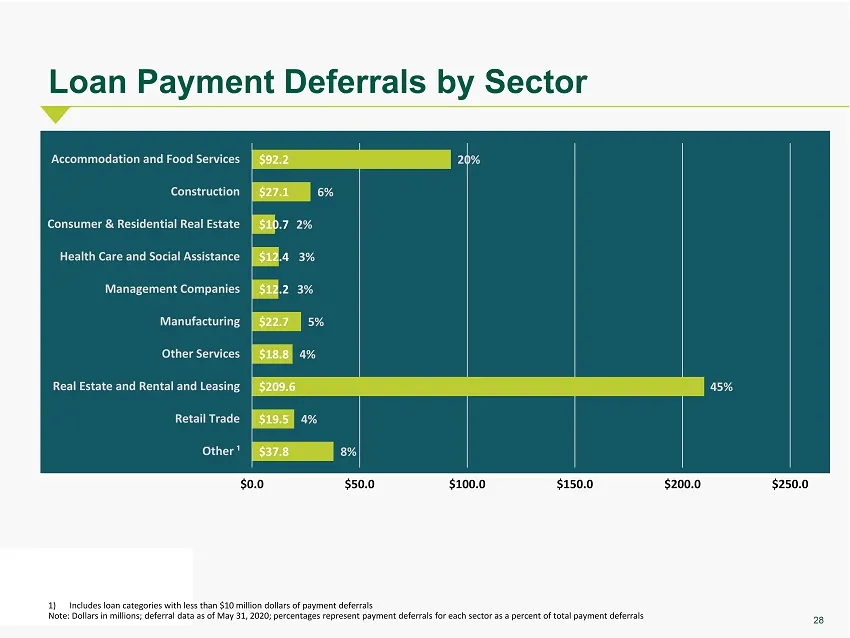
Slide 28: Loan Payment Deferrals by Sector
28 Loan Payment Deferrals by Sector 1) Includes loan categories with less than $10 million dollars of payment deferrals Note: Dollars in millions; deferral data as of May 31, 2020; percentages represent payment deferrals for each sector as a percent of total payment deferrals $37.8 $19.5 $209.6 $18.
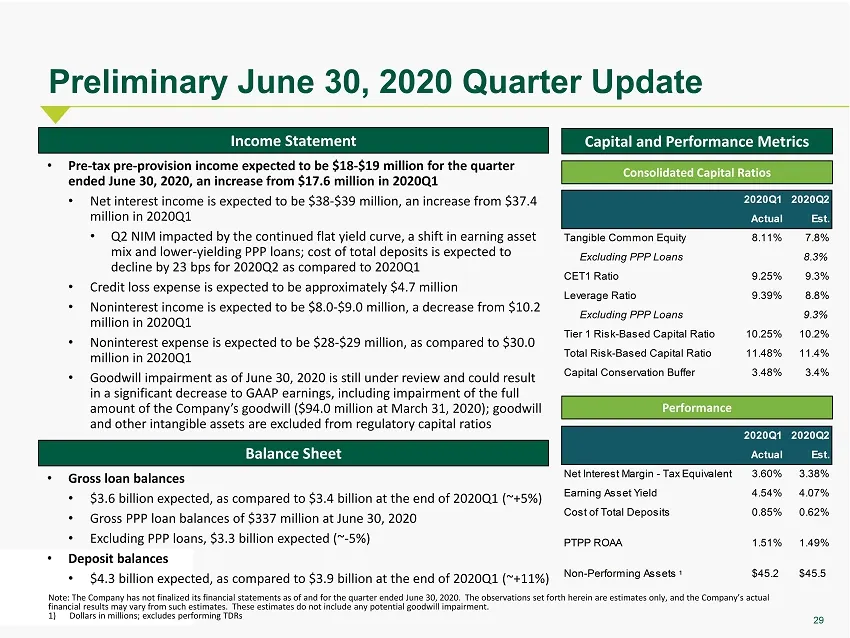
Slide 29: Preliminary June 30, 2020 Quarter Update
29 Note: The Company has not finalized its financial statements as of and for the quarter ended June 30, 2020. The observations set f ort h herein are estimates only, and the Company’s actual financial results may vary from such estimates. These estimates do not include any potential goodwill impair
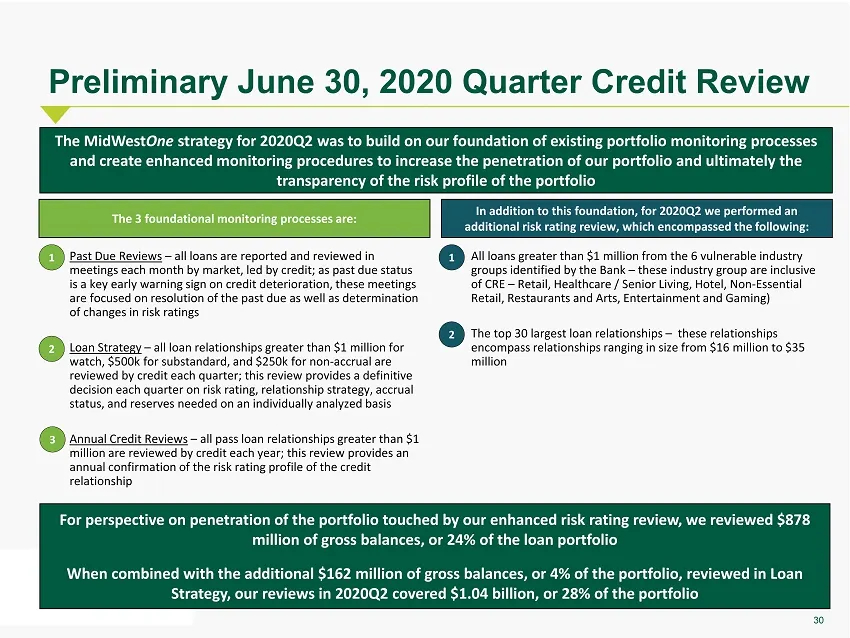
Slide 30: Preliminary June 30, 2020 Quarter Credit Review
30 Preliminary June 30, 2020 Quarter Credit Review The MidWest One strategy for 2020Q2 was to build on our foundation of existing portfolio monitoring processes and create enhanced monitoring procedures to increase the penetration of our portfolio and ultimately the transparency of the risk profile
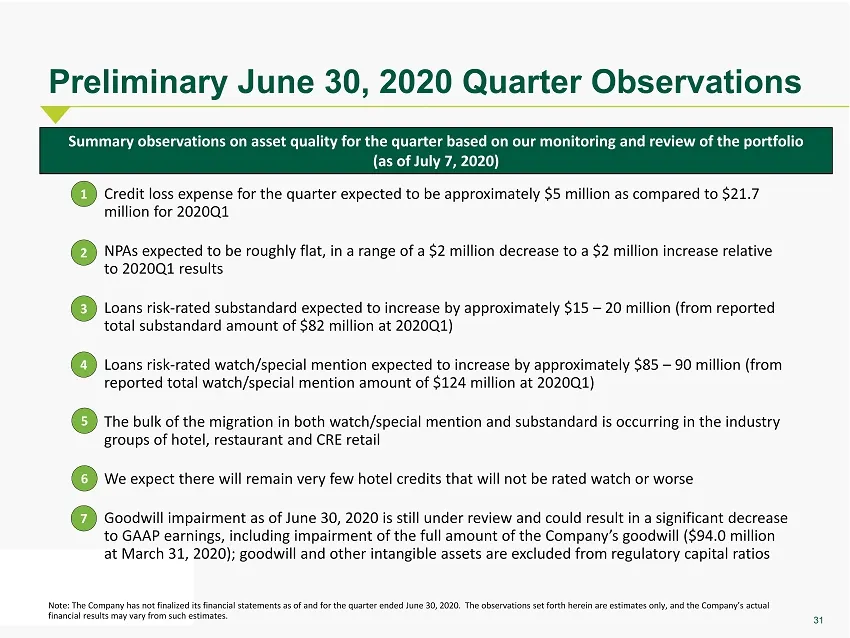
Slide 31: Preliminary June 30, 2020 Quarter Observations
31 Preliminary June 30, 2020 Quarter Observations Summary observations on asset quality for the quarter based on our monitoring and review of the portfolio (as of July 7, 2020) • Credit loss expense for the quarter expected to be approximately $ 5 million as compared to $21.7 million for 2020Q1 • NP
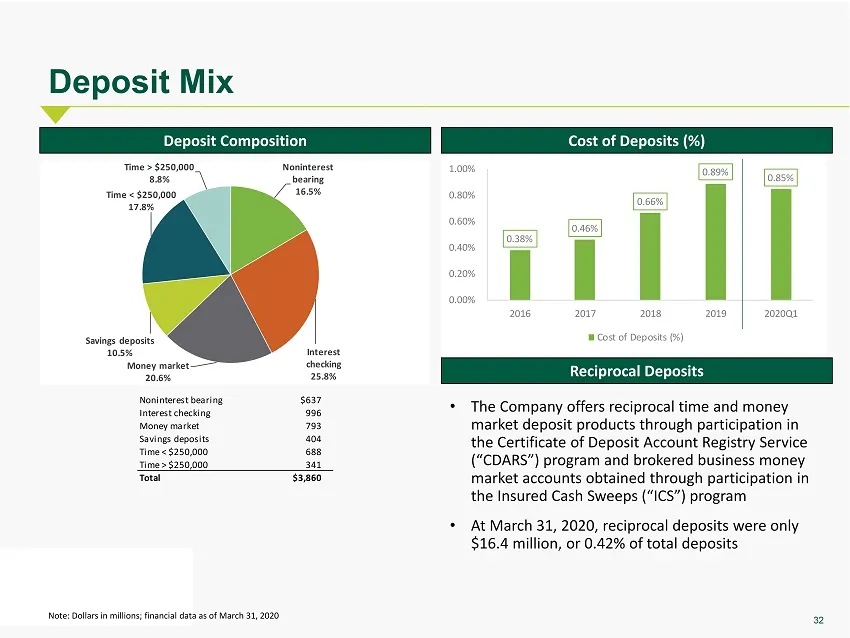
Slide 32: Deposit Mix
32 Deposit Mix Note: Dollars in millions; financial data as of March 31, 2020 Deposit Composition Cost of Deposits (%) Reciprocal Deposits Noninterest bearing $637 Interest checking 996 Money market 793 Savings deposits 404 Time < $250,000 688 Time > $250,000 341 Total $3,860 Noninterest bearing 16.
Slide 33: Securities Portfolio
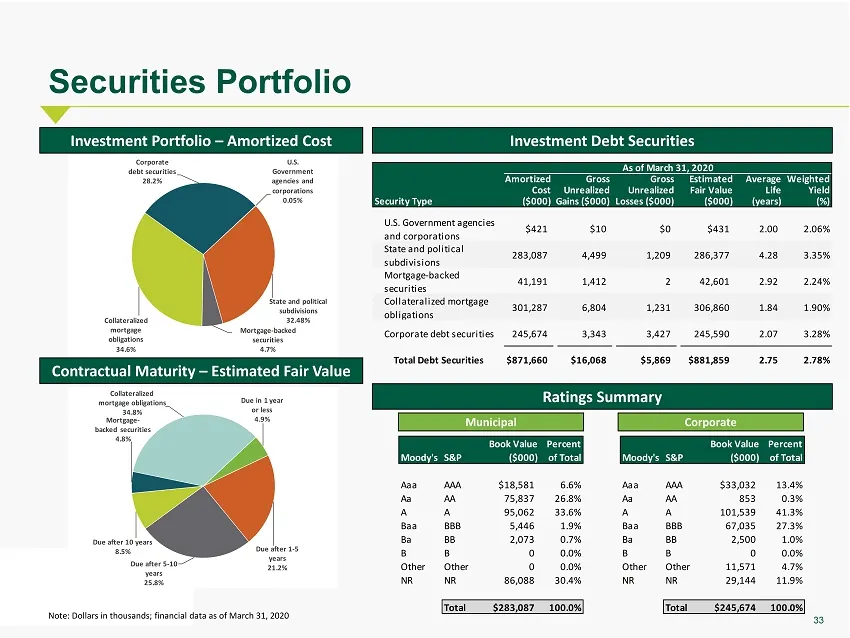
33 Securities Portfolio Investment Portfolio – Amortized Cost Investment Debt Securities Note: Dollars in thousands; financial data as of March 31, 2020 U.S. Government agencies and corporations 0.05% State and political subdivisions 32.48% Mortgage - backed securities 4.7% Collateralized mortgage o
Slide 34: Liquidity Detail
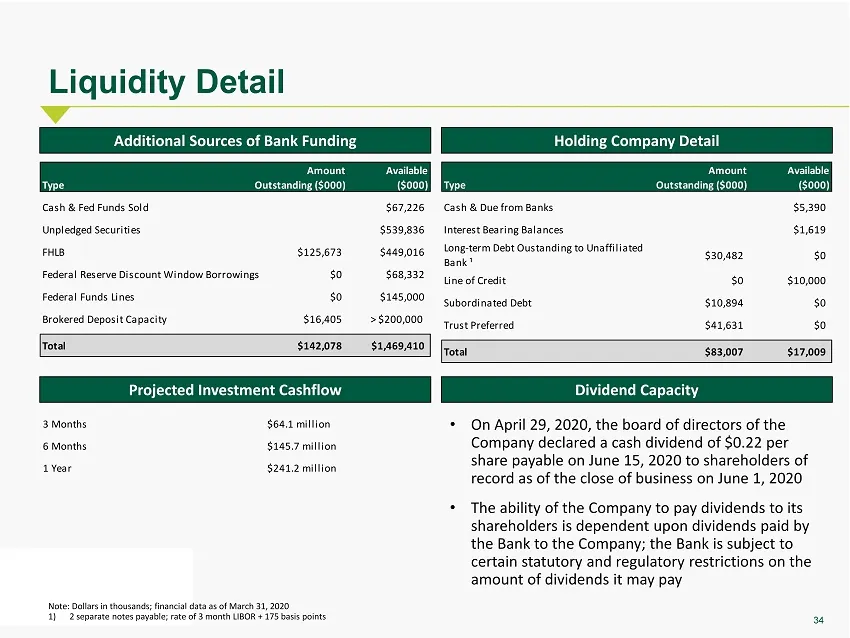
34 Liquidity Detail Note: Dollars in thousands; financial data as of March 31, 2020 1) 2 separate notes payable; rate of 3 month LIBOR + 175 basis points Additional Sources of Bank Funding Holding Company Detail Dividend Capacity Amount Available Type Outstanding ($000) ($000) $5,390 $1,619 $30,482
Slide 35: Historical and Pro Forma Double Leverage and Interest Coverage
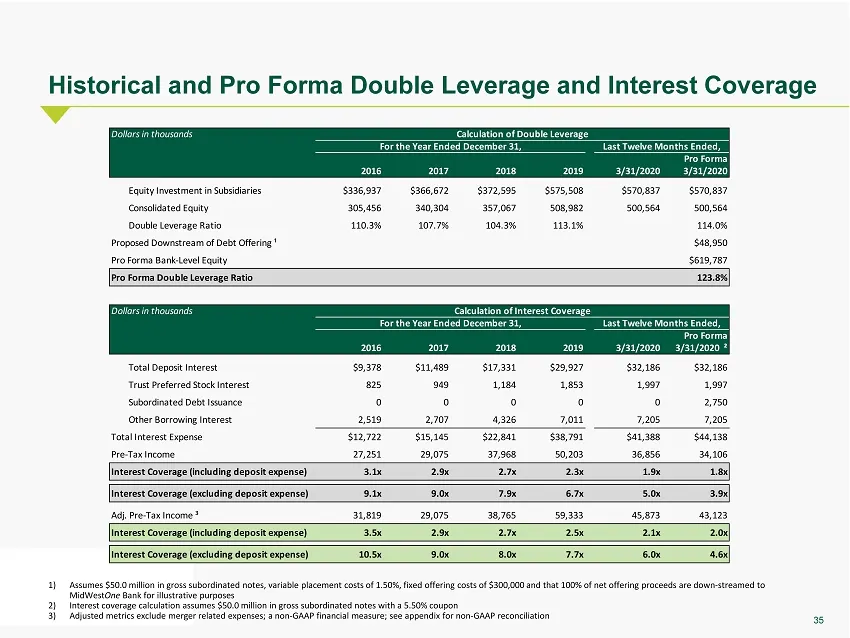
35 Historical and Pro Forma Double Leverage and Interest Coverage 1) Assumes $50.0 million in gross subordinated notes, variable placement costs of 1.50%, fixed offering costs of $300,000 and that 100% of net of fering proceeds are down - streamed to MidWest One Bank for illustrative purposes 2) Int
Slide 36: Summary
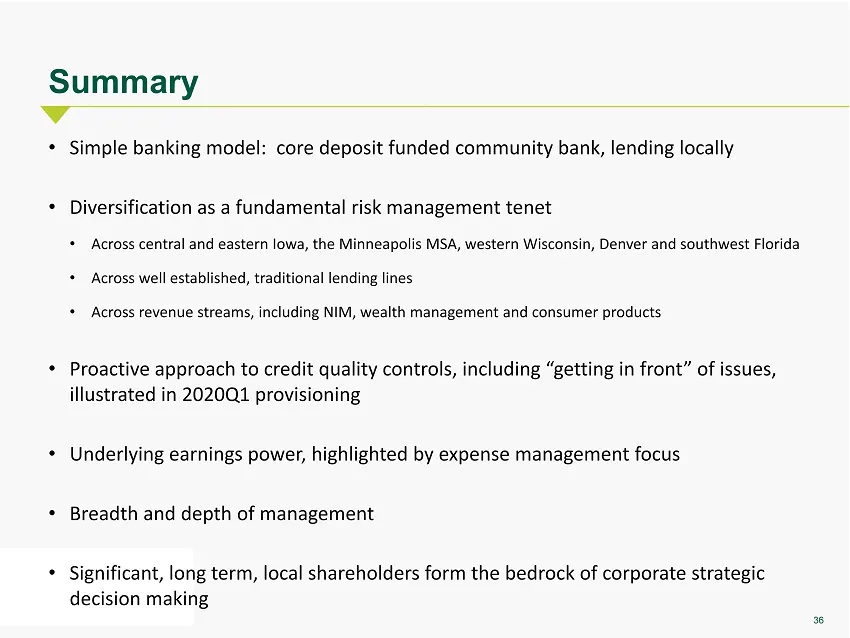
36 Summary • Simple banking model: core deposit funded community bank, lending locally • Diversification as a fundamental risk management tenet • A cross central and eastern Iowa, the Minneapolis MSA, western Wisconsin, Denver and southwest Florida • Across well established, traditional lending line
Slide 37: Appendix
Appendix
Slide 38: Corporate History
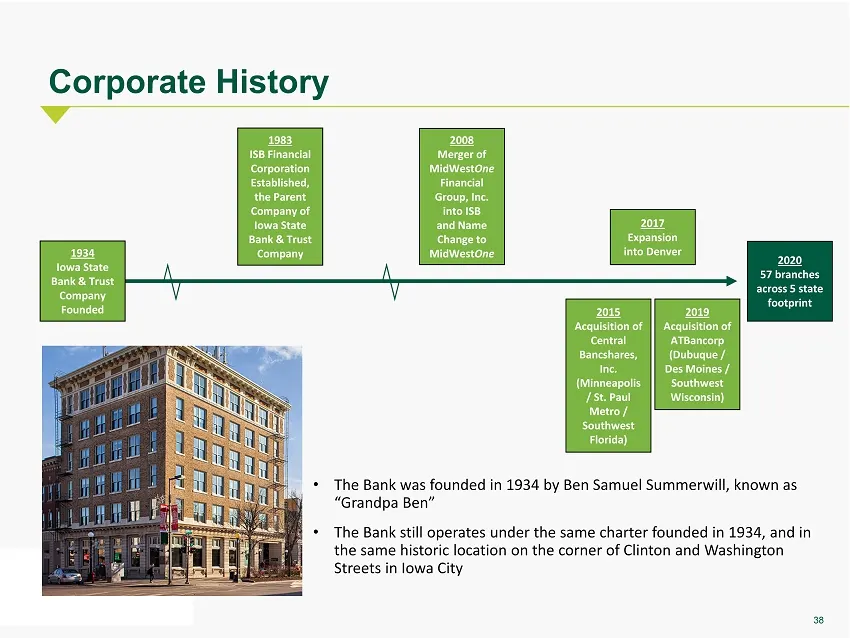
38 Corporate History 1983 ISB Financial Corporation Established, the Parent Company of Iowa State Bank & Trust Company 2008 Merger of MidWest One Financial Group, Inc . into ISB and Name Change to MidWest One 1934 Iowa State Bank & Trust Company Founded 2019 Acquisition of ATBancorp (Dubuque / Des M
Slide 39: Managerial Organizational Structure
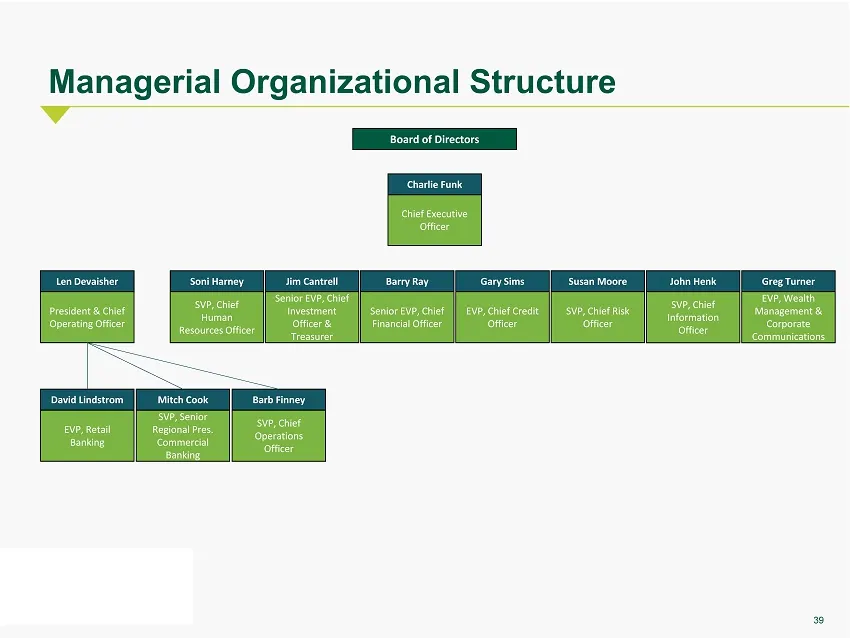
39 Managerial Organizational Structure President & Chief Operating Officer EVP, Chief Credit Officer Senior EVP, Chief Financial Officer Senior EVP, Chief Investment Officer & Treasurer SVP, Chief Risk Officer SVP, Senior Regional Pres. Commercial Banking Len Devaisher Gary Sims Barry Ray Jim Cantre
Slide 40: Management Biographies
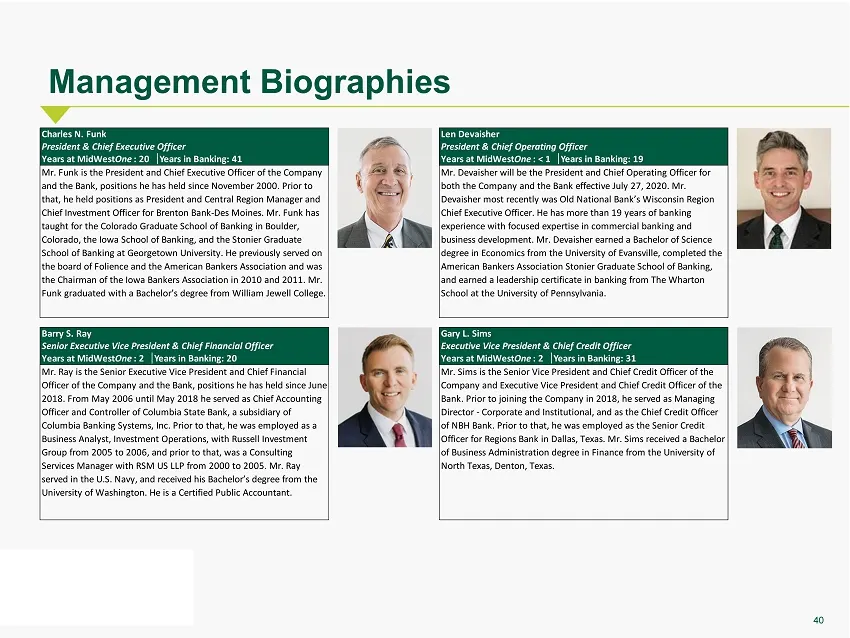
40 Management Biographies Charles N. Funk Len Devaisher President & Chief Executive Officer President & Chief Operating Officer Years at MidWestOne: 20 │ Years in Banking: 41 Years at MidWestOne: < 1 │ Years in Banking: 19 Barry S. Ray Gary L. Sims Senior Executive Vice President & Chief Financial O
Slide 41: Management Biographies (cont.)
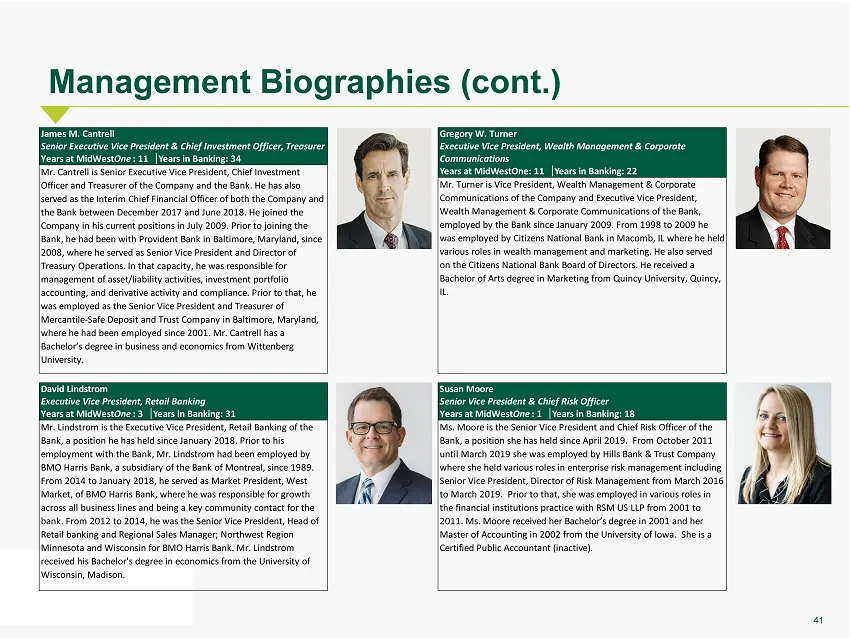
41 Management Biographies (cont.) James M. Cantrell Gregory W. Turner Senior Executive Vice President & Chief Investment Officer, Treasurer Executive Vice President, Wealth Management & Corporate Years at MidWestOne: 11 │ Years in Banking: 34 Communications Years at MidWestOne: 11 │ Years in Banking
Slide 42: Summary of A/L Position
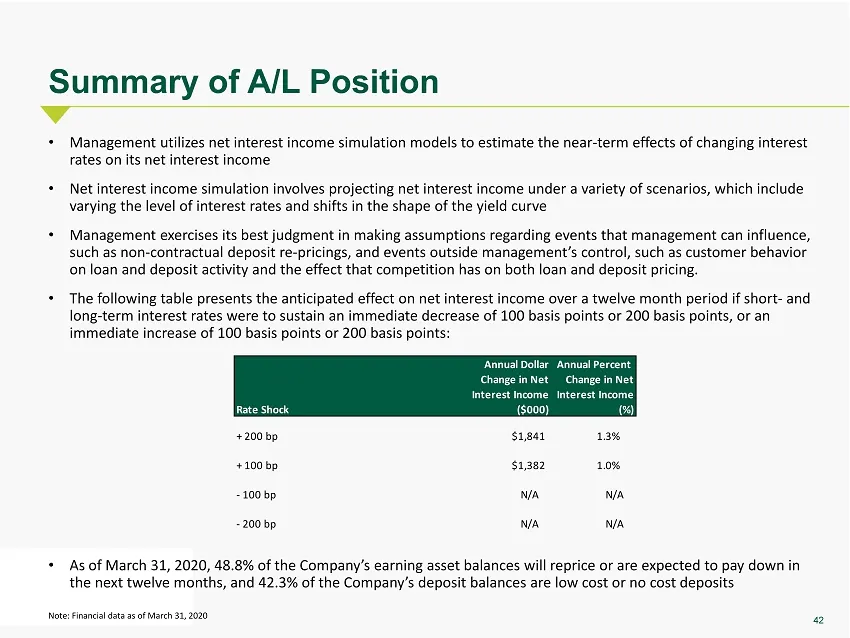
42 Summary of A/L Position • Management utilizes net interest income simulation models to estimate the near - term effects of changing interest rates on its net interest income • Net interest income simulation involves projecting net interest income under a variety of scenarios, which include varyin
Slide 43: Risk Ratings
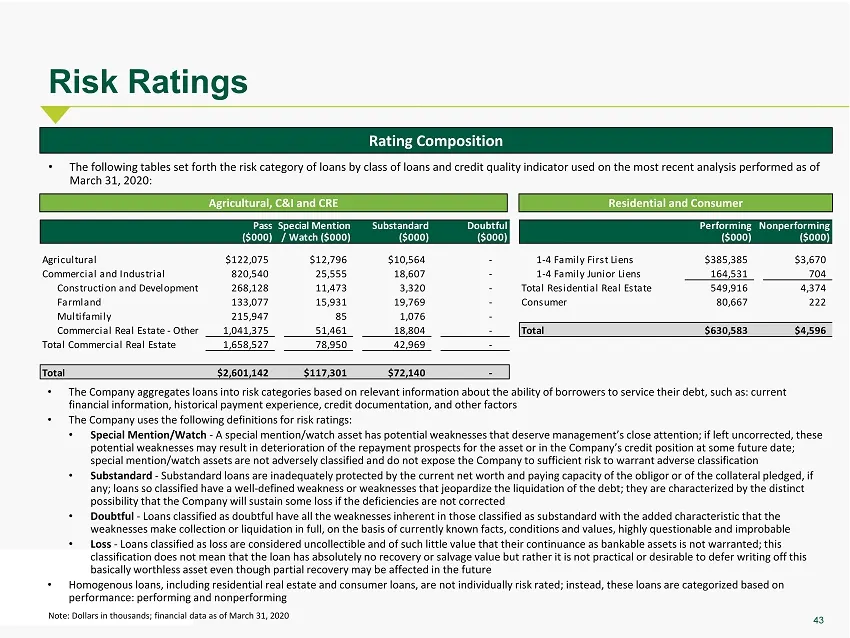
43 Risk Ratings Note: Dollars in thousands; financial data as of March 31, 2020 Rating Composition • The Company aggregates loans into risk categories based on relevant information about the ability of borrowers to service the ir debt , such as: current financial information, historical payment expe
Slide 44: Summary Financial Table
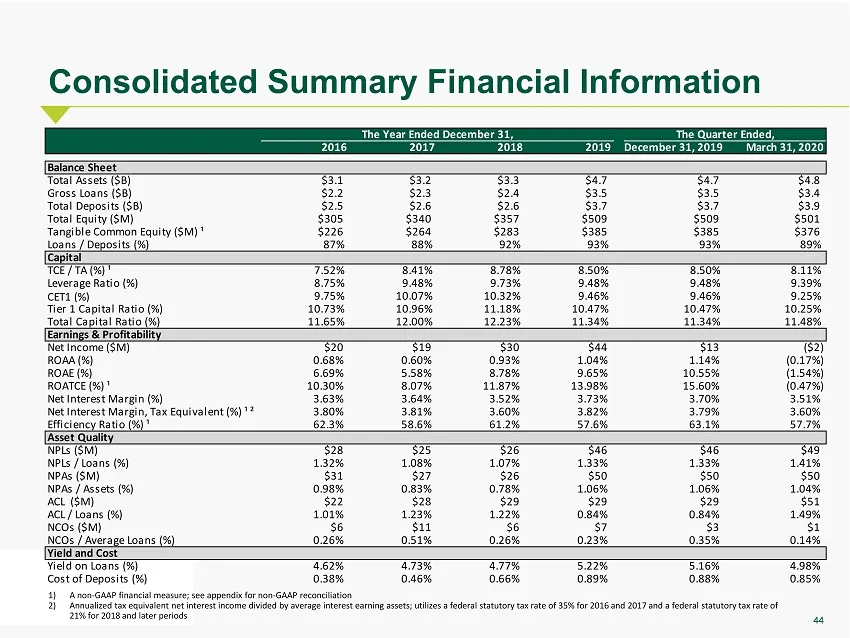
44 2016 2017 2018 2019 December 31, 2019 March 31, 2020 Balance Sheet Total Assets ($B) $3.1 $3.2 $3.3 $4.7 $4.7 $4.8 Gross Loans ($B) $2.2 $2.3 $2.4 $3.5 $3.5 $3.4 Total Deposits ($B) $2.5 $2.6 $2.6 $3.7 $3.7 $3.9 Total Equity ($M) $305 $340 $357 $509 $509 $501 Tangible Common Equity ($M) ¹ $226 $2
Slide 45: Non-GAAP Reconciliations
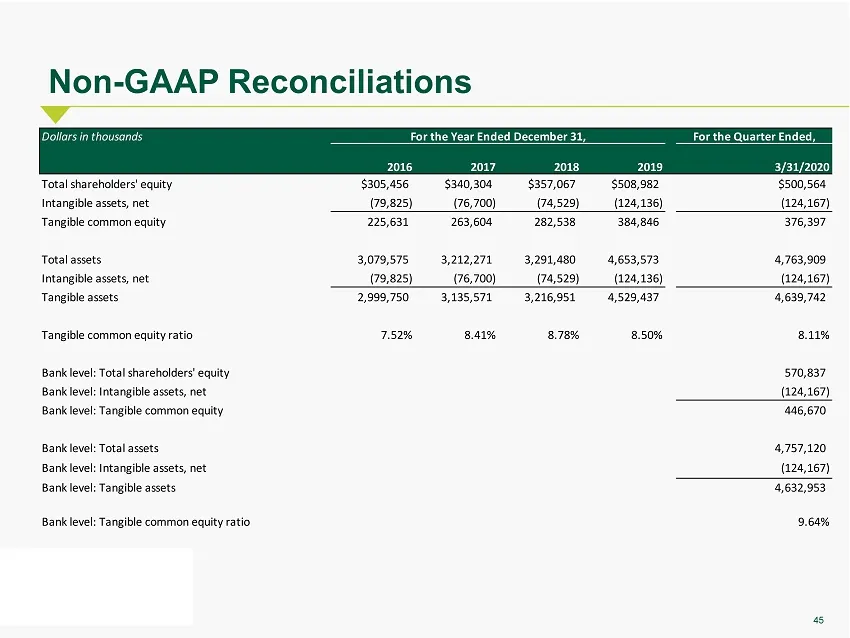
45 Non - GAAP Reconciliations Dollars in thousands For the Year Ended December 31, For the Quarter Ended, 2016 2017 2018 2019 3/31/2020 Total shareholders' equity $305,456 $340,304 $357,067 $508,982 $500,564 Intangible assets, net (79,825) (76,700) (74,529) (124,136) (124,167) Tangible common equity
Slide 46: Non-GAAP Reconciliations (cont.)
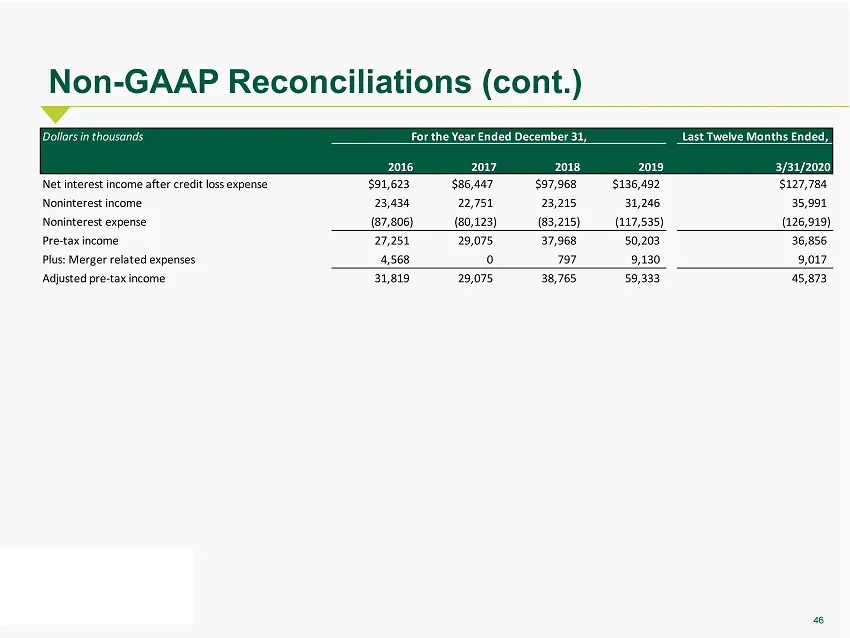
46 Non - GAAP Reconciliations (cont.) Dollars in thousands For the Year Ended December 31, Last Twelve Months Ended, 2016 2017 2018 2019 3/31/2020 Net interest income after credit loss expense $91,623 $86,447 $97,968 $136,492 $127,784 Noninterest income 23,434 22,751 23,215 31,246 35,991 Noninterest
Slide 47: Non-GAAP Reconciliations (cont.)
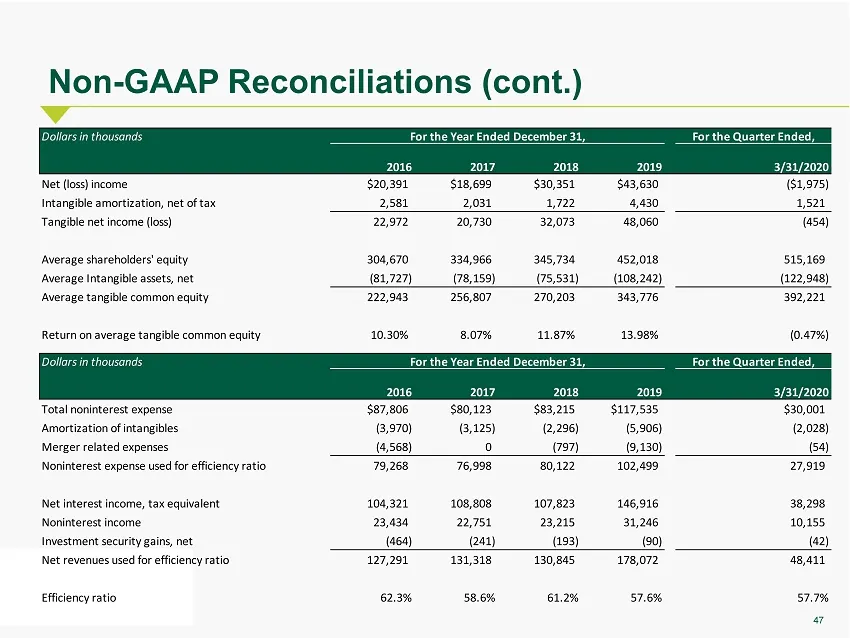
47 Non - GAAP Reconciliations (cont.) Dollars in thousands For the Year Ended December 31, For the Quarter Ended, 2016 2017 2018 2019 3/31/2020 Net (loss) income $20,391 $18,699 $30,351 $43,630 ($1,975) Intangible amortization, net of tax 2,581 2,031 1,722 4,430 1,521 Tangible net income (loss) 22,9
Slide 48: Non-GAAP Reconciliations (cont.)
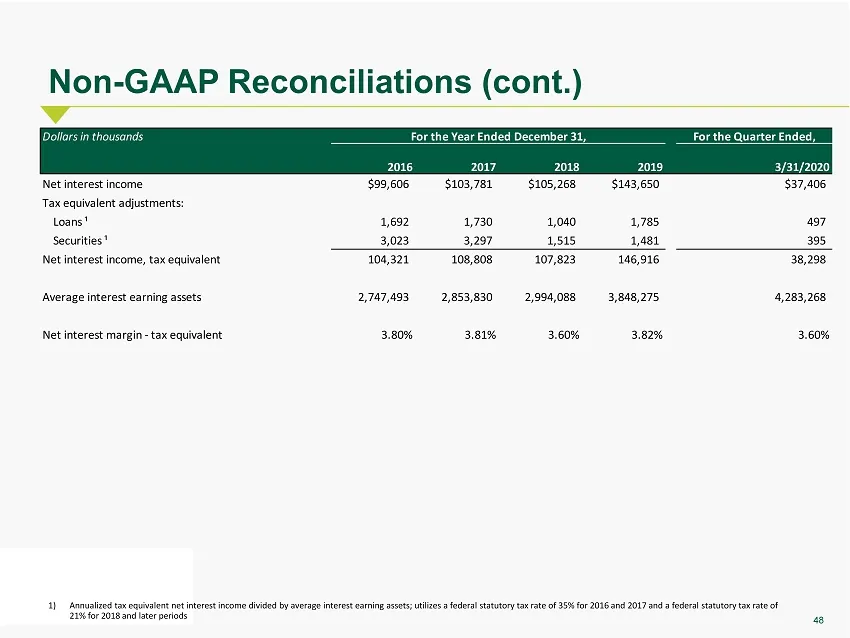
48 Non - GAAP Reconciliations (cont.) 1) Annualized tax equivalent net interest income divided by average interest earning assets ; utilizes a federal statutory tax rate of 35% for 2016 and 2017 and a federal statutory tax rate of 21% for 2018 and later periods Dollars in thousands For the Year Ende
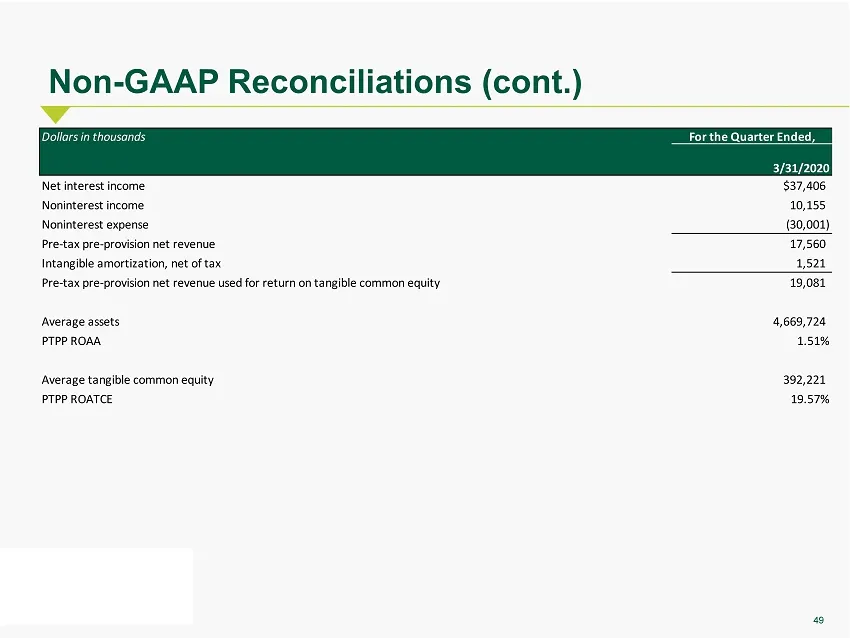
Slide 49: Non-GAAP Reconciliations (cont.)
49 Non - GAAP Reconciliations (cont.) Dollars in thousands For the Quarter Ended, 3/31/2020 Net interest income $37,406 Noninterest income 10,155 Noninterest expense (30,001) Pre-tax pre-provision net revenue 17,560 Intangible amortization, net of tax 1,521 Pre-tax pre-provision net revenue used for
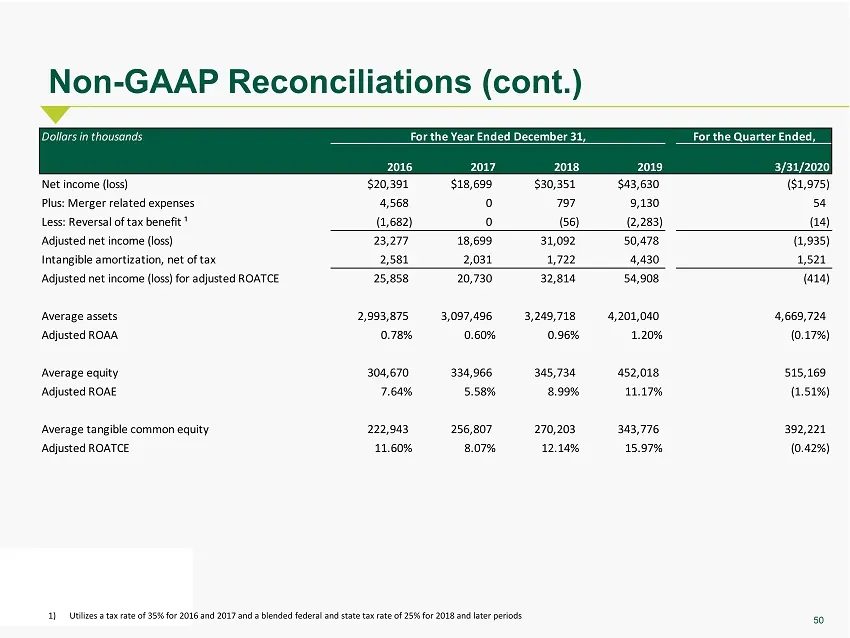
Slide 50: Non-GAAP Reconciliations (cont.)
50 Non - GAAP Reconciliations (cont.) 1) Utilizes a tax rate of 35% for 2016 and 2017 and a blended federal and state tax rate of 25% for 2018 and later periods Dollars in thousands For the Year Ended December 31, For the Quarter Ended, 2016 2017 2018 2019 3/31/2020 Net income (loss) $20,391 $18,699
Source: SEC EDGAR · 8-K filed Jul 29, 2020
More decks from MidWestOne Financial Group Inc
 Q3 2025 Earnings Presentation18 slides · Oct 23, 2025
 Merger or Acquisition (October 2025)20 slides · Oct 23, 2025
 Q2 2025 Earnings Presentation32 slides · Jul 25, 2025
 Q2 2025 Earnings Presentation18 slides · Jul 25, 2025
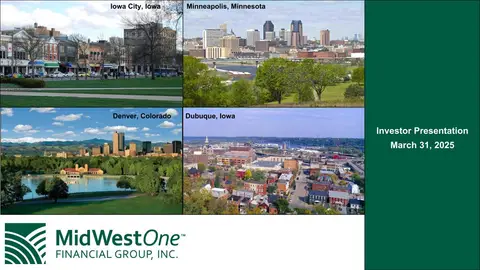 Investor Presentation (April 2025)31 slides · Apr 28, 2025
 Q1 2025 Earnings Presentation17 slides · Apr 25, 2025