Equatorial S.A. · BMFBOVESPA:EQTL3
Equatorial — Equatorial Energia — Non-Deal Roadshow (June 2006)
35 slides from Equatorial's roadshow presentation, June 2006

Slide 1: Non-Deal Roadshow June 2006
Non-Deal Roadshow June 2006 Hosted by Bear, Stearns 1
Slide 2: Agenda
Agenda Company Overview Successful Turnaround at CEMAR Growth Opportunities 1Q06 Financial and Operating Results Performance at the BOVESPA Summary 2
Slide 3: Agenda
Agenda Company Overview Successful Turnaround at CEMAR Growth Opportunities 1Q06 Financial and Operating Results Performance at the BOVESPA Summary 3
Slide 4: Corporate Structure
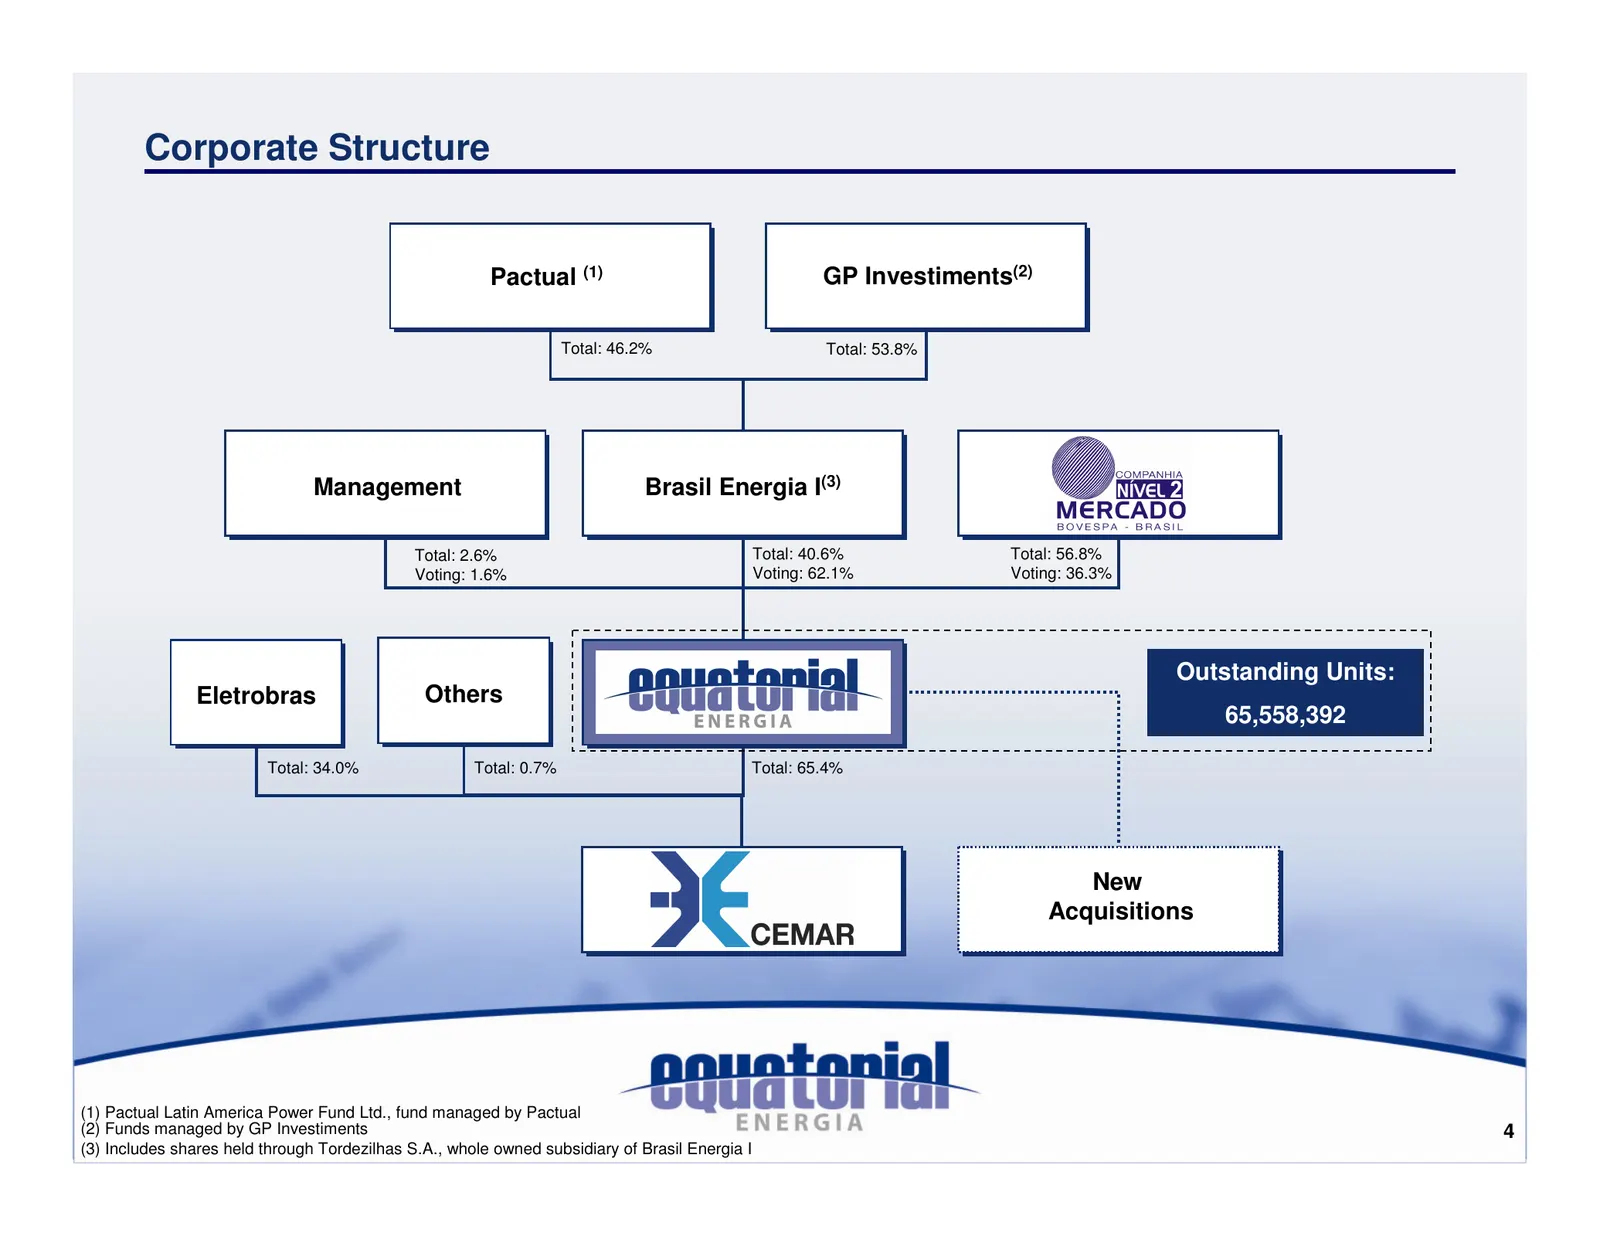
Corporate Structure Pactual (1) GP Investiments(2) Total: 46.2% Total: 53.8% Management Brasil Energia I(3) Total: 2.6% Total: 40.6% Total: 56.8% Voting: 1.6% Voting: 62.1% Voting: 36.3% Outstanding Units: Eletrobras Others 65,558,392 Total: 34.0% Total: 0.7% Total: 65.4% New Acquisitions (1) Pactua
Slide 5: Equatorial Target Markets and Cemar Concession Area
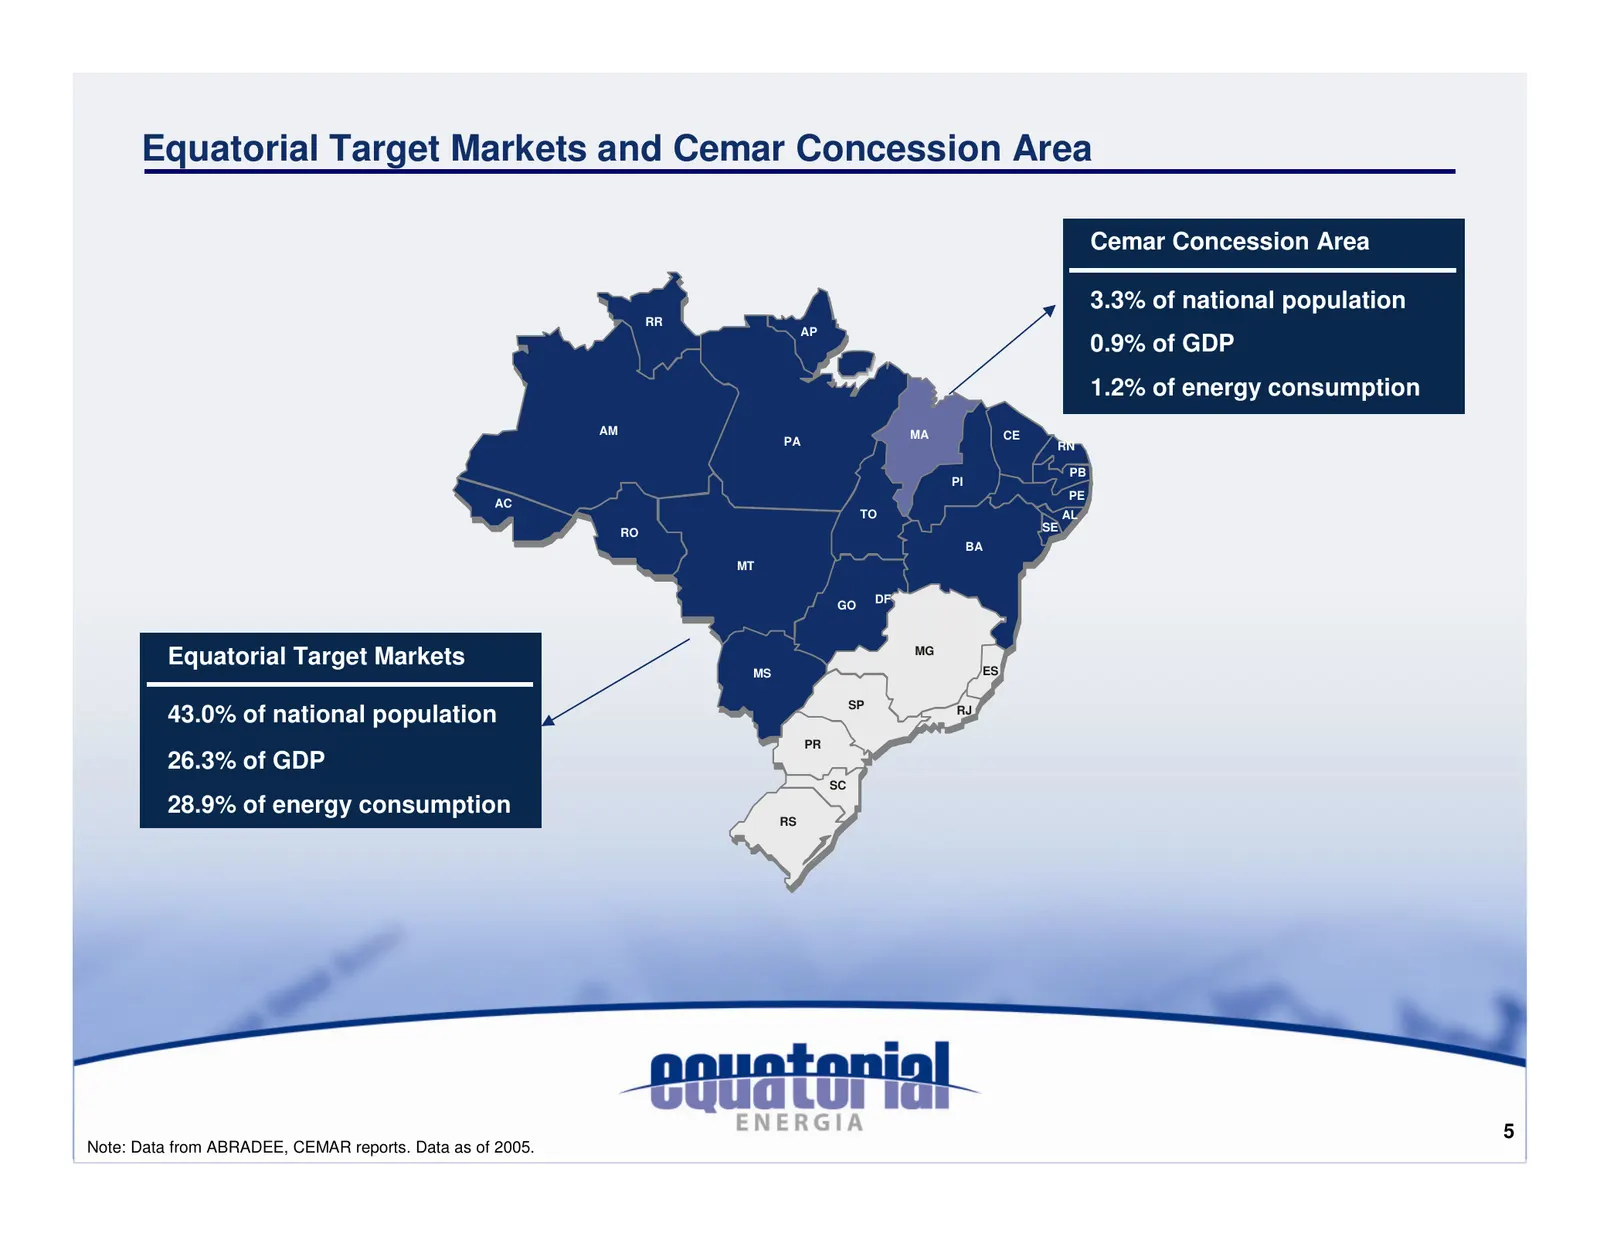
Equatorial Target Markets and Cemar Concession Area Cemar Concession Area 3.3% of national population RR AP 0.9% of GDP 1.2% of energy consumption AM MA CE PA RN PB PI PE AC TO AL RO SE BA MT GO DF Equatorial Target Markets MG ES MS SP 43.0% of national population RJ PR 26.3% of GDP SC 28.9% of ener
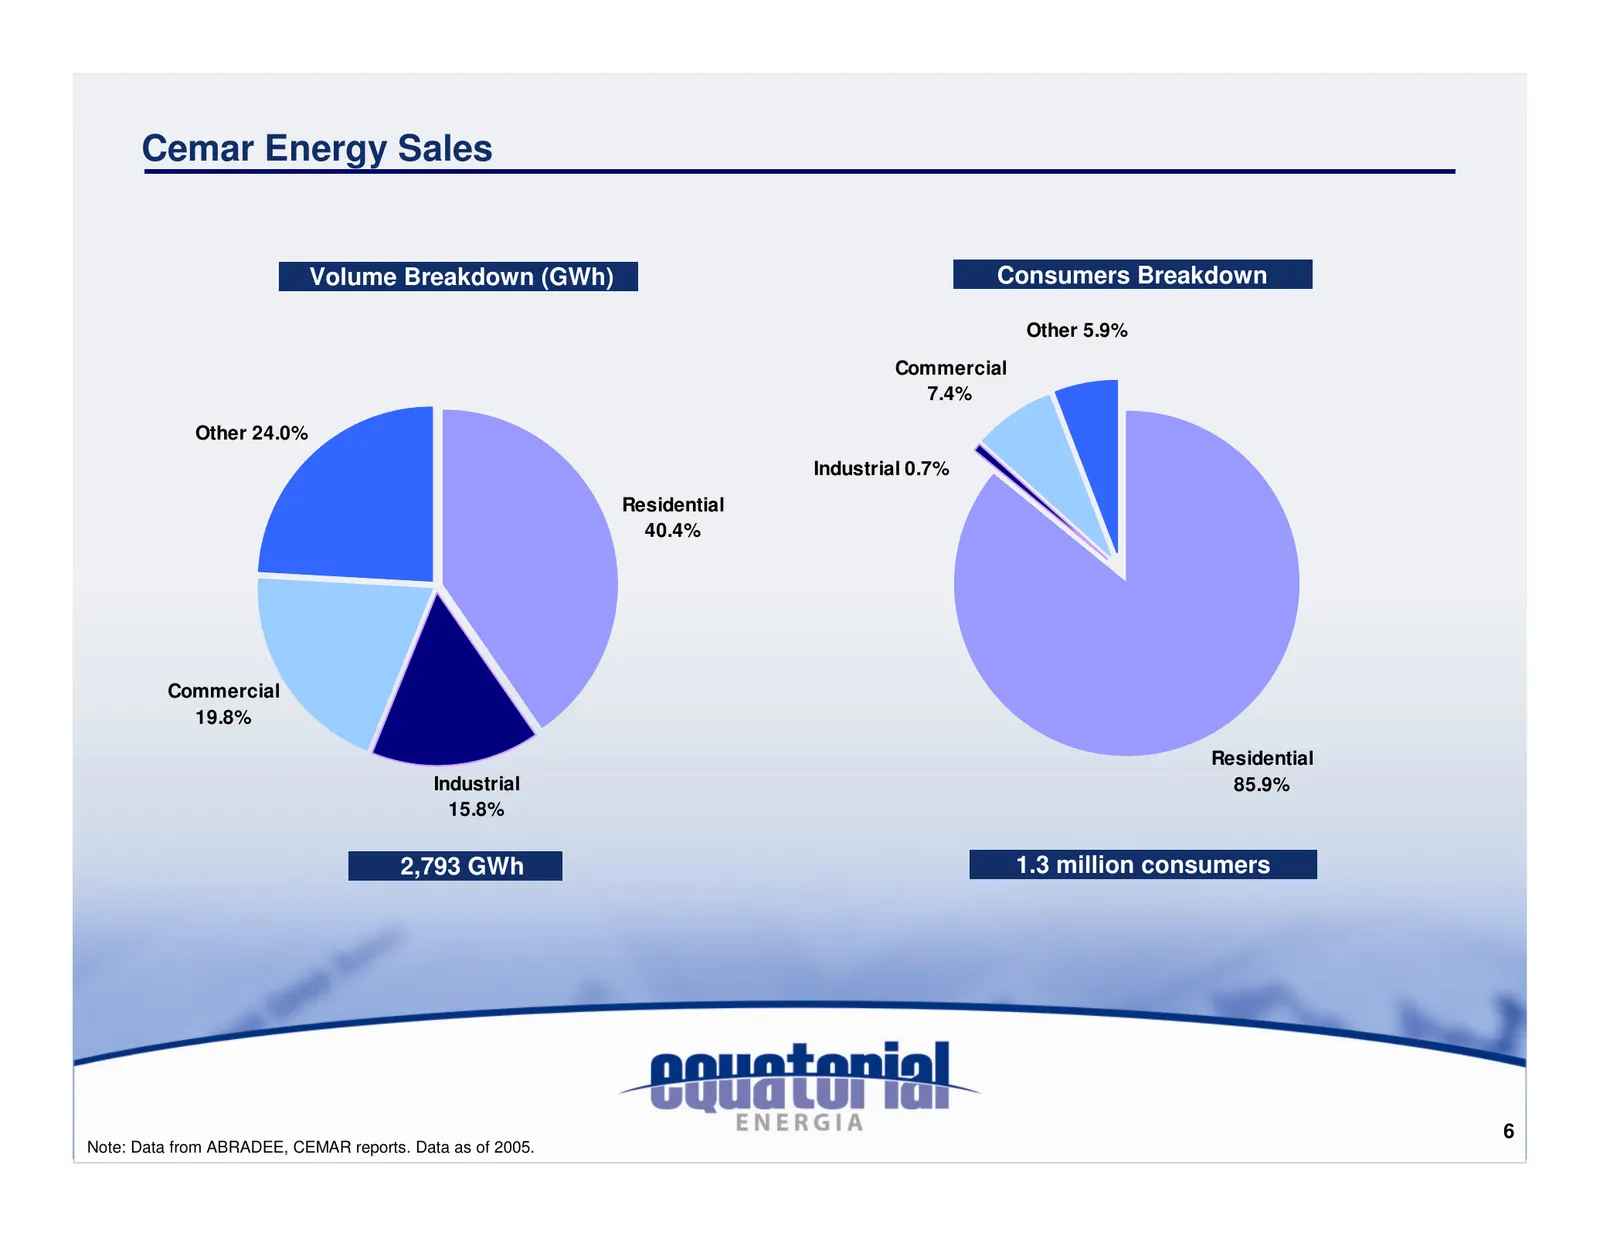
Slide 6: Cemar Energy Sales
Cemar Energy Sales Volume Breakdown (GWh) Consumers Breakdown Other 5.9% Commercial 7.4% Other 24.0% Industrial 0.7% Residential 40.4% Commercial 19.8% Residential Industrial 85.9% 15.8% 2,793 GWh 1.3 million consumers 6 Note: Data from ABRADEE, CEMAR reports. Data as of 2005.
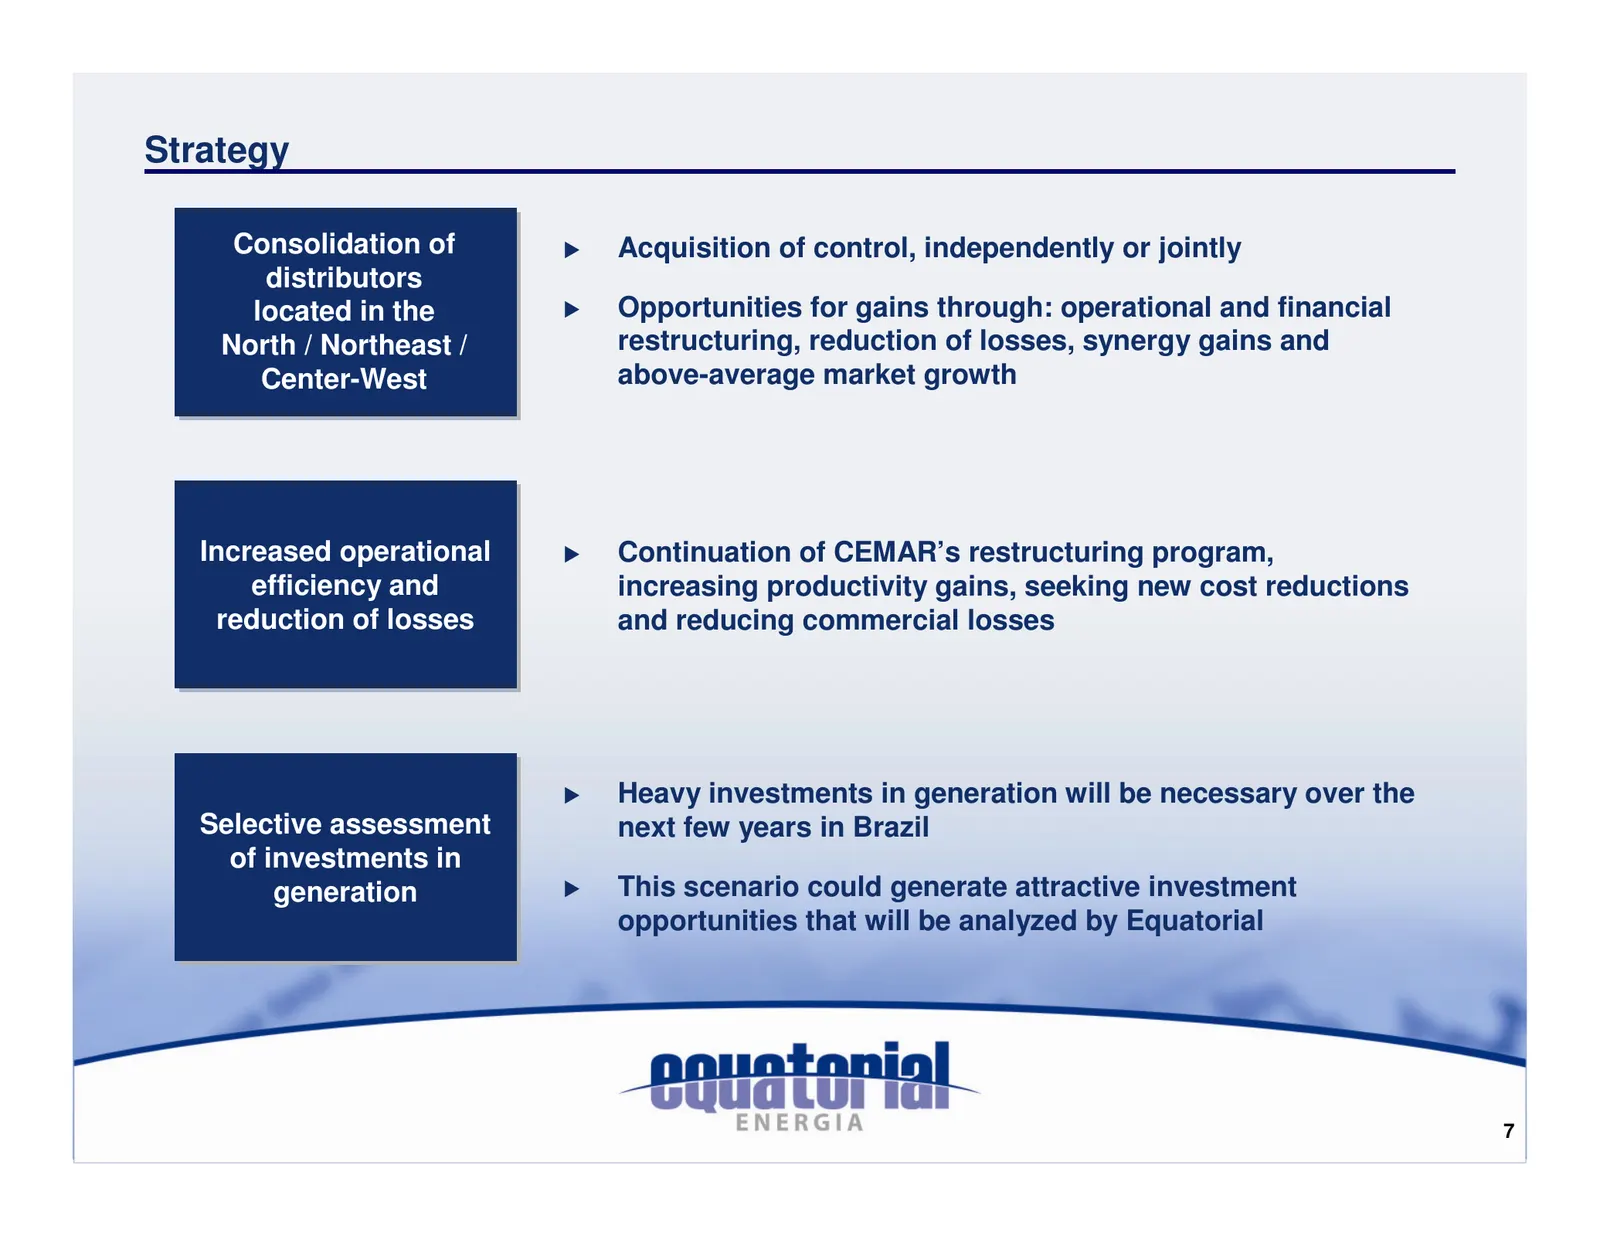
Slide 7: Strategy
Strategy Consolidation of Acquisition of control, independently or jointly distributors located in the Opportunities for gains through: operational and financial North / Northeast / restructuring, reduction of losses, synergy gains and Center-West above-average market growth Increased operational Co
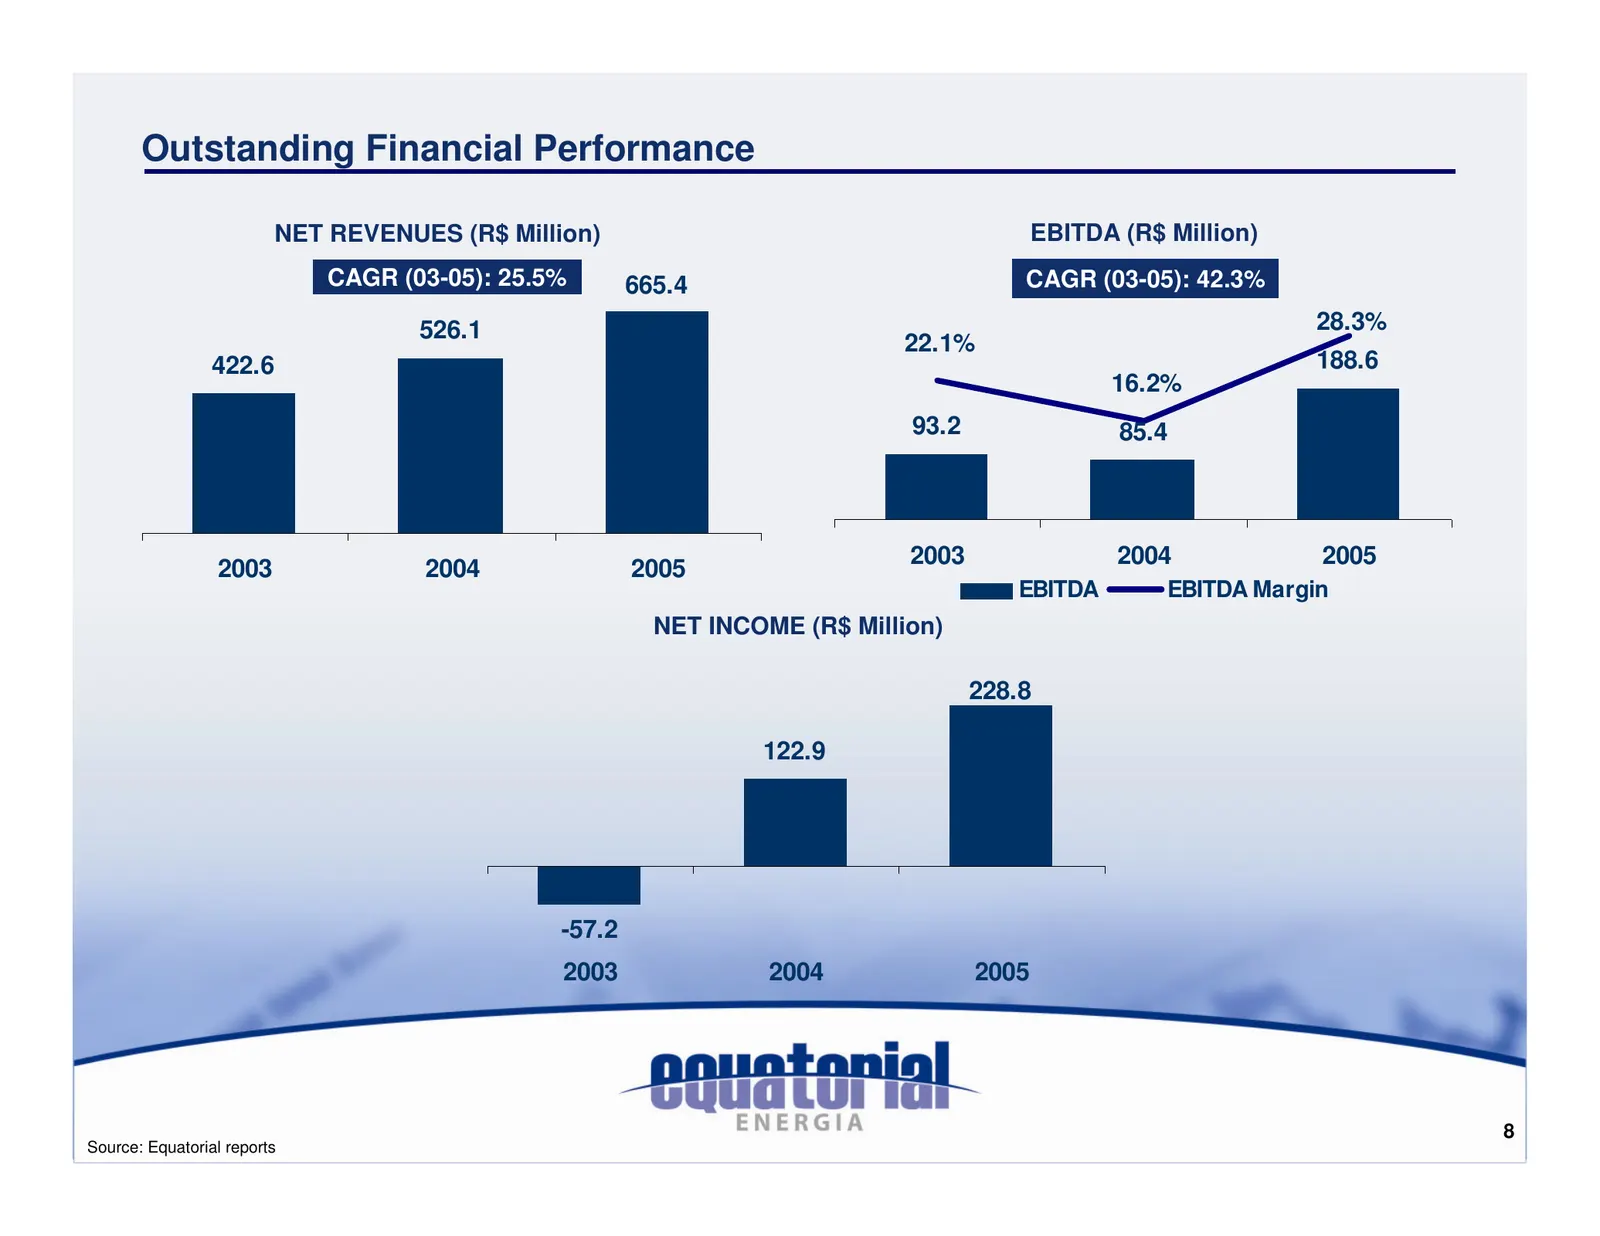
Slide 8: Outstanding Financial Performance
Outstanding Financial Performance NET REVENUES (R$ Million) EBITDA (R$ Million) CAGR (03-05): 25.5% 665.4 CAGR (03-05): 42.3% 526.1 28.3% 22.1% 422.6 188.6 16.2% 93.2 85.4 2003 2004 2005 2003 2004 2005 EBITDA EBITDA Margin NET INCOME (R$ Million) 228.8 122.9 -57.2 2003 2004 2005 8 Source: Equatorial
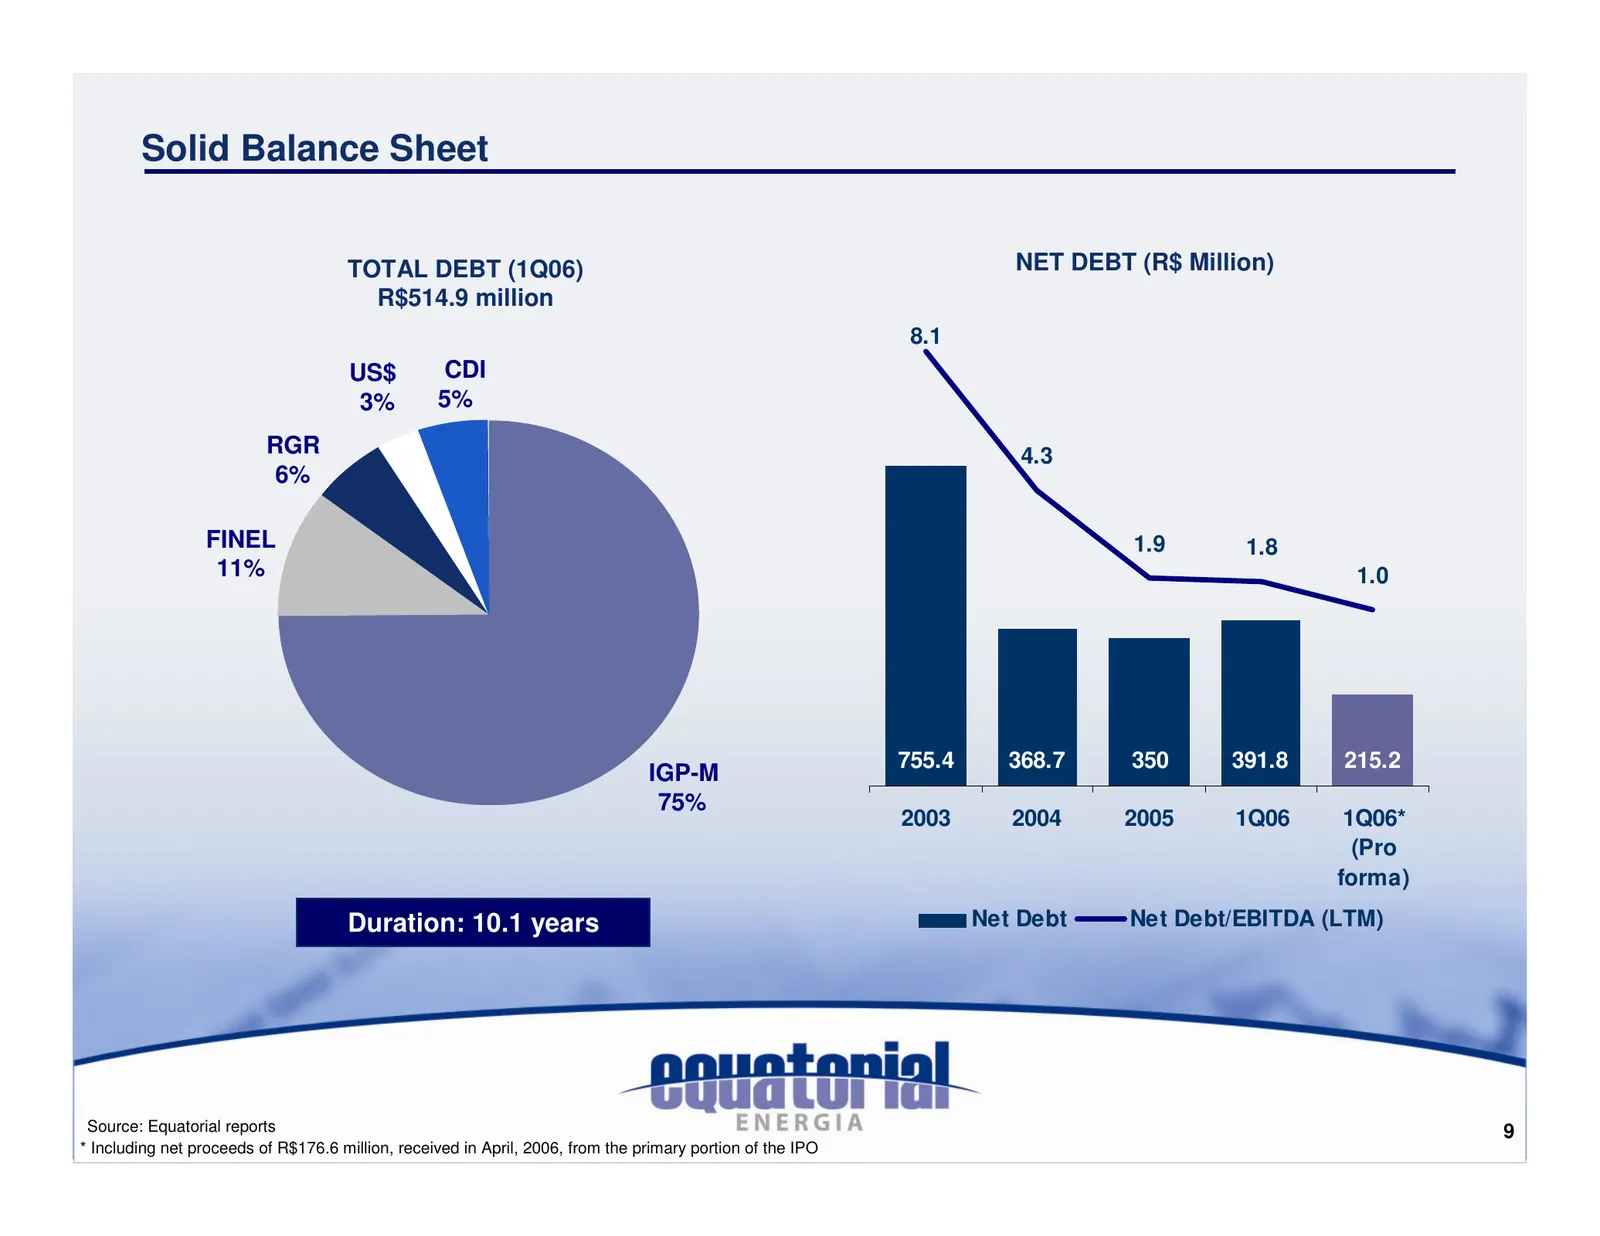
Slide 9: Solid Balance Sheet
Solid Balance Sheet TOTAL DEBT (1Q06) NET DEBT (R$ Million) R$514.9 million 8.1 US$ CDI 3% 5% RGR 4.3 6% FINEL 1.9 1.8 11% 1.0 755.4 368.7 350 391.8 215.2 IGP-M 75% 2003 2004 2005 1Q06 1Q06* (Pro forma) Duration: 10.1 years Net Debt Net Debt/EBITDA (LTM) Source: Equatorial reports 9 * Including net
Slide 10: Strengths
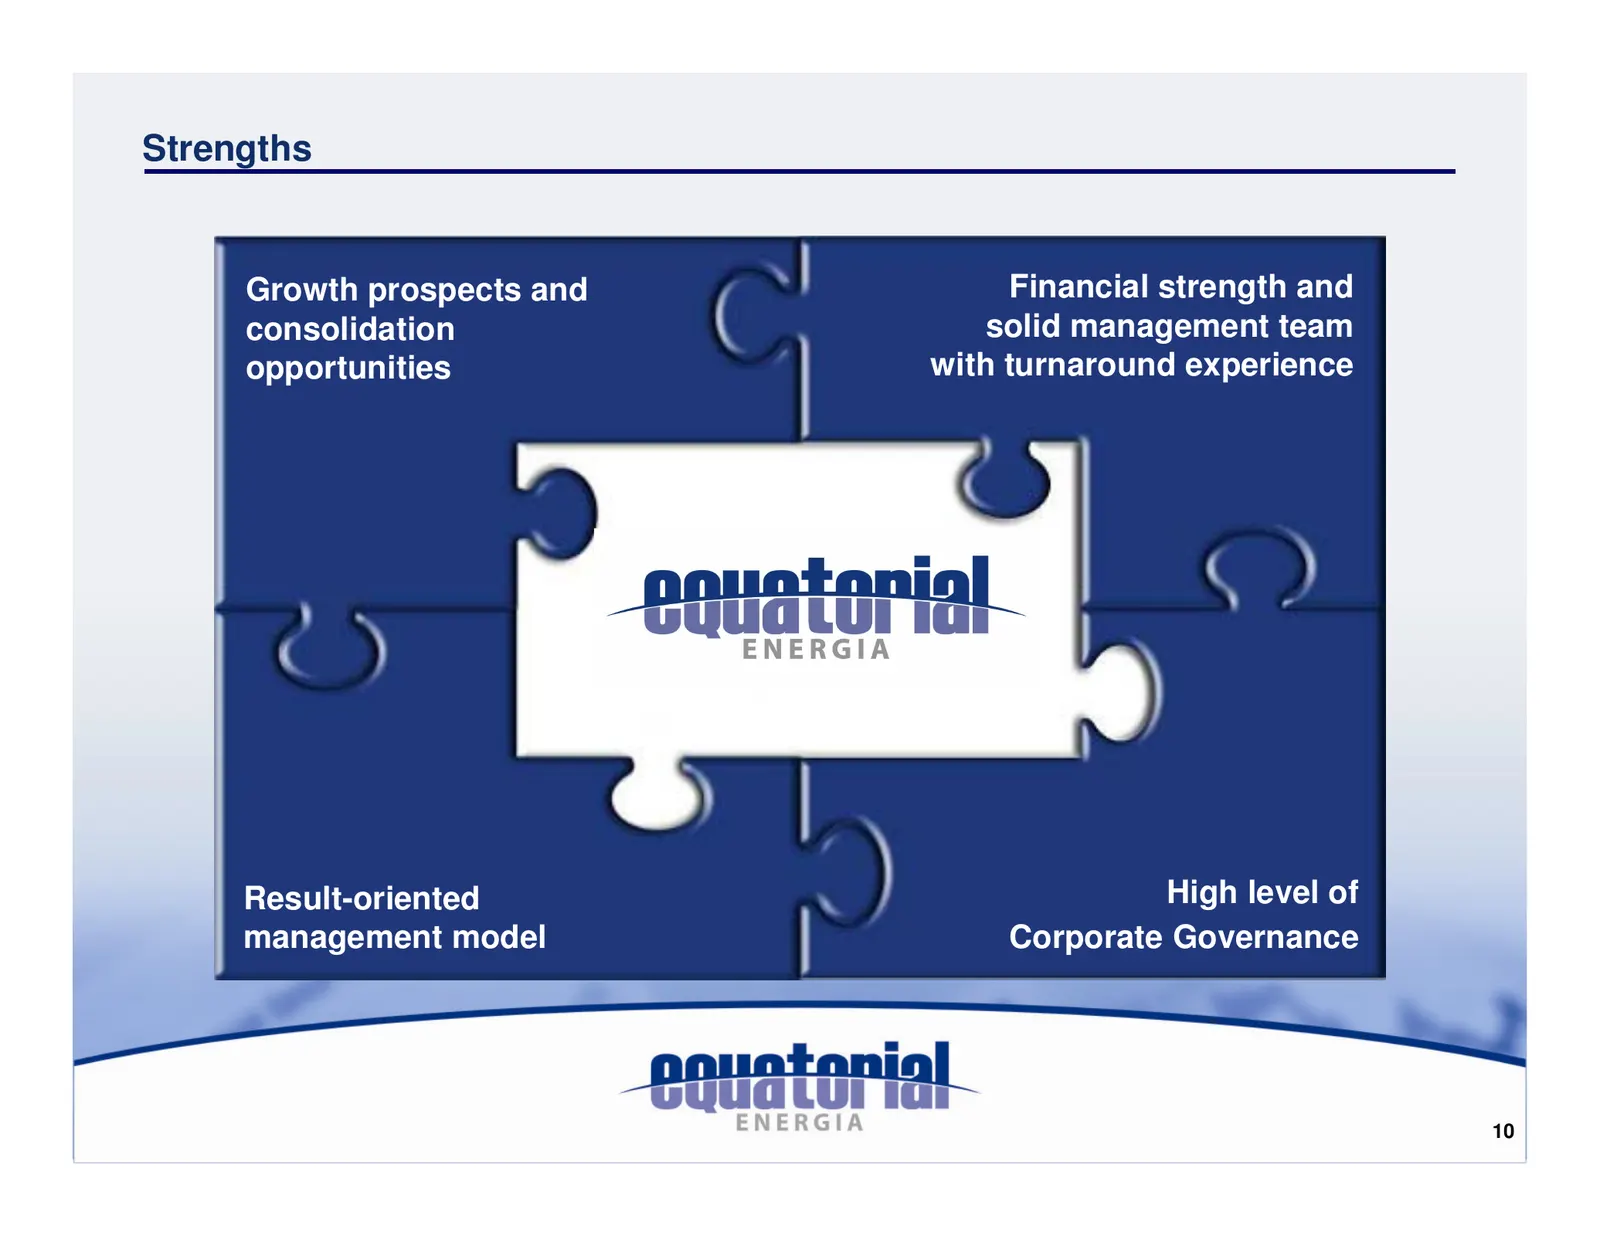
Strengths Growth prospects and Financial strength and consolidation solid management team opportunities with turnaround experience Result-oriented High level of management model Corporate Governance 10
Slide 11: Agenda
Agenda Company Overview Successful Turnaround at CEMAR Growth Opportunities 1Q06 Financial and Operating Results Performance at the BOVESPA Summary 11
Slide 12: CEMAR Financial Restructuring
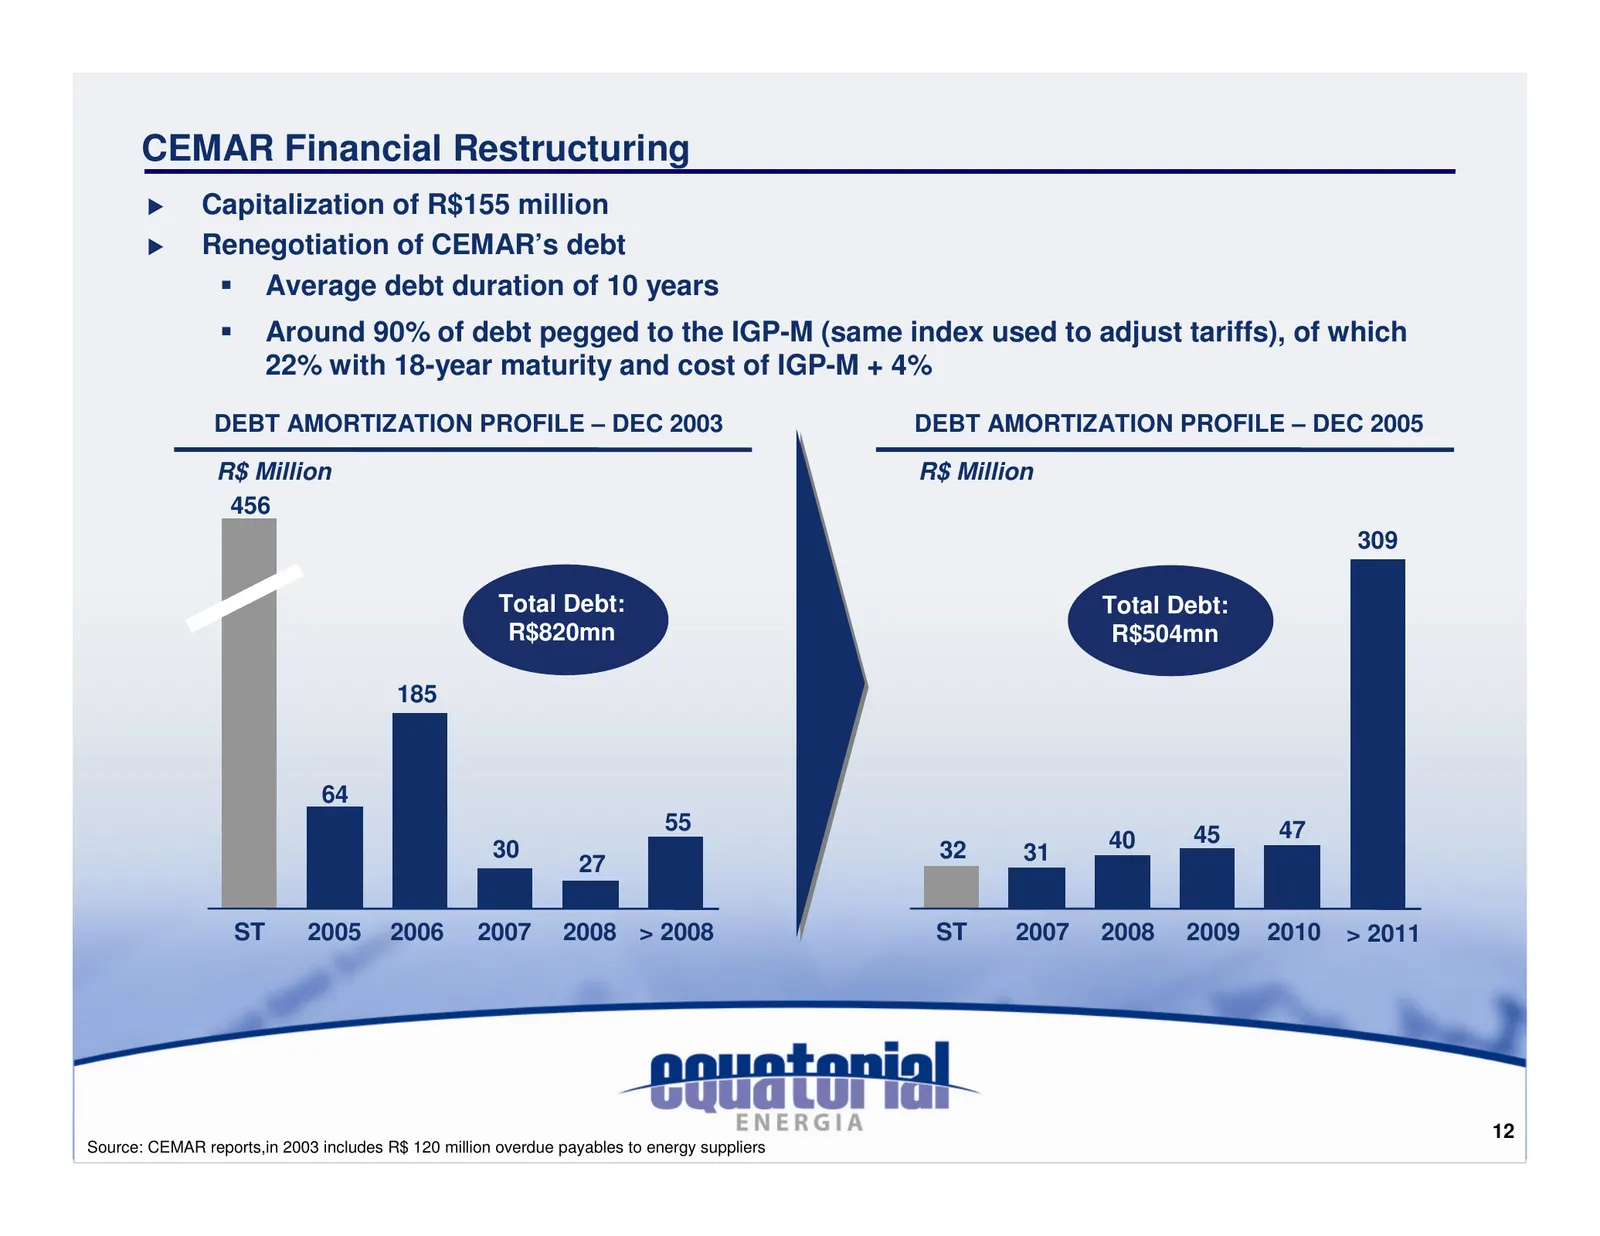
CEMAR Financial Restructuring Capitalization of R$155 million Renegotiation of CEMAR’s debt Average debt duration of 10 years Around 90% of debt pegged to the IGP-M (same index used to adjust tariffs), of which 22% with 18-year maturity and cost of IGP-M + 4% DEBT AMORTIZATION PROFILE – DEC 2003 DEB
Slide 13: CEMAR Operational Restructuring
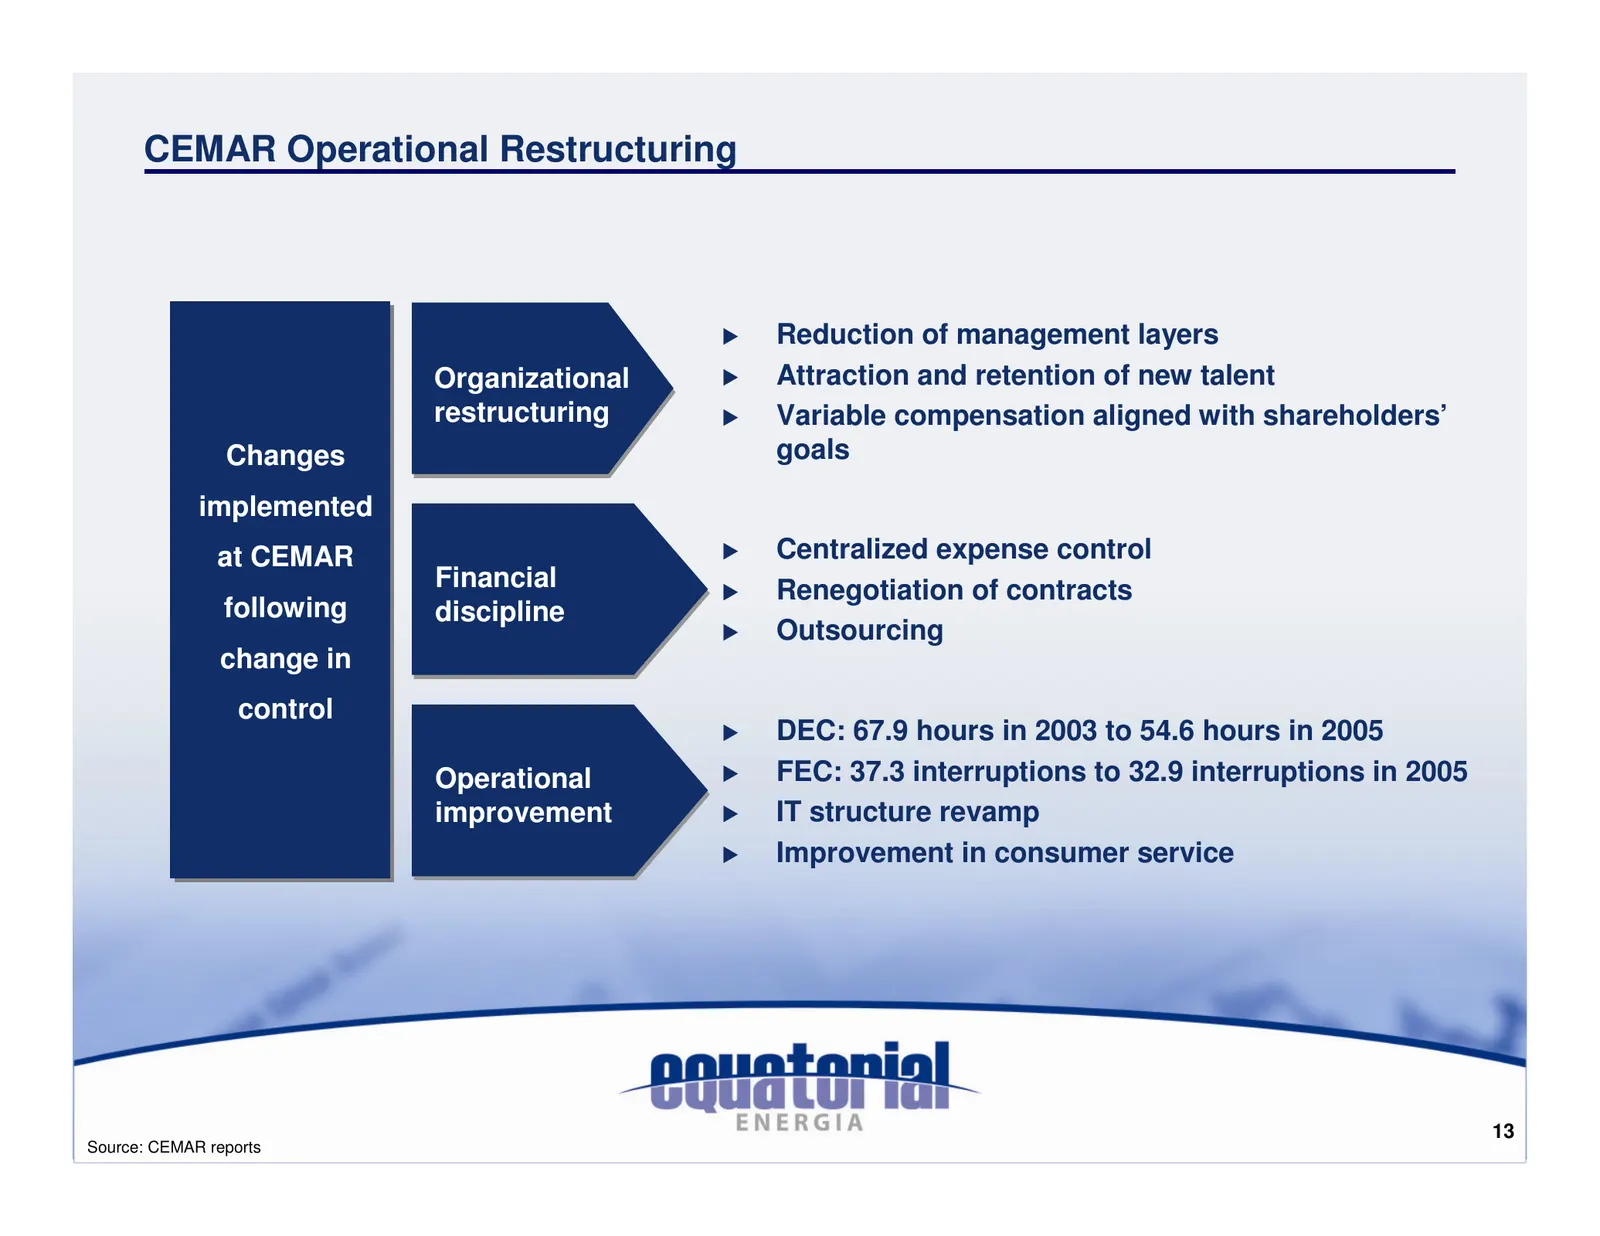
CEMAR Operational Restructuring Reduction of management layers Organizational Attraction and retention of new talent restructuring Variable compensation aligned with shareholders’ Changes goals implemented at CEMAR Centralized expense control Financial Renegotiation of contracts following discipline
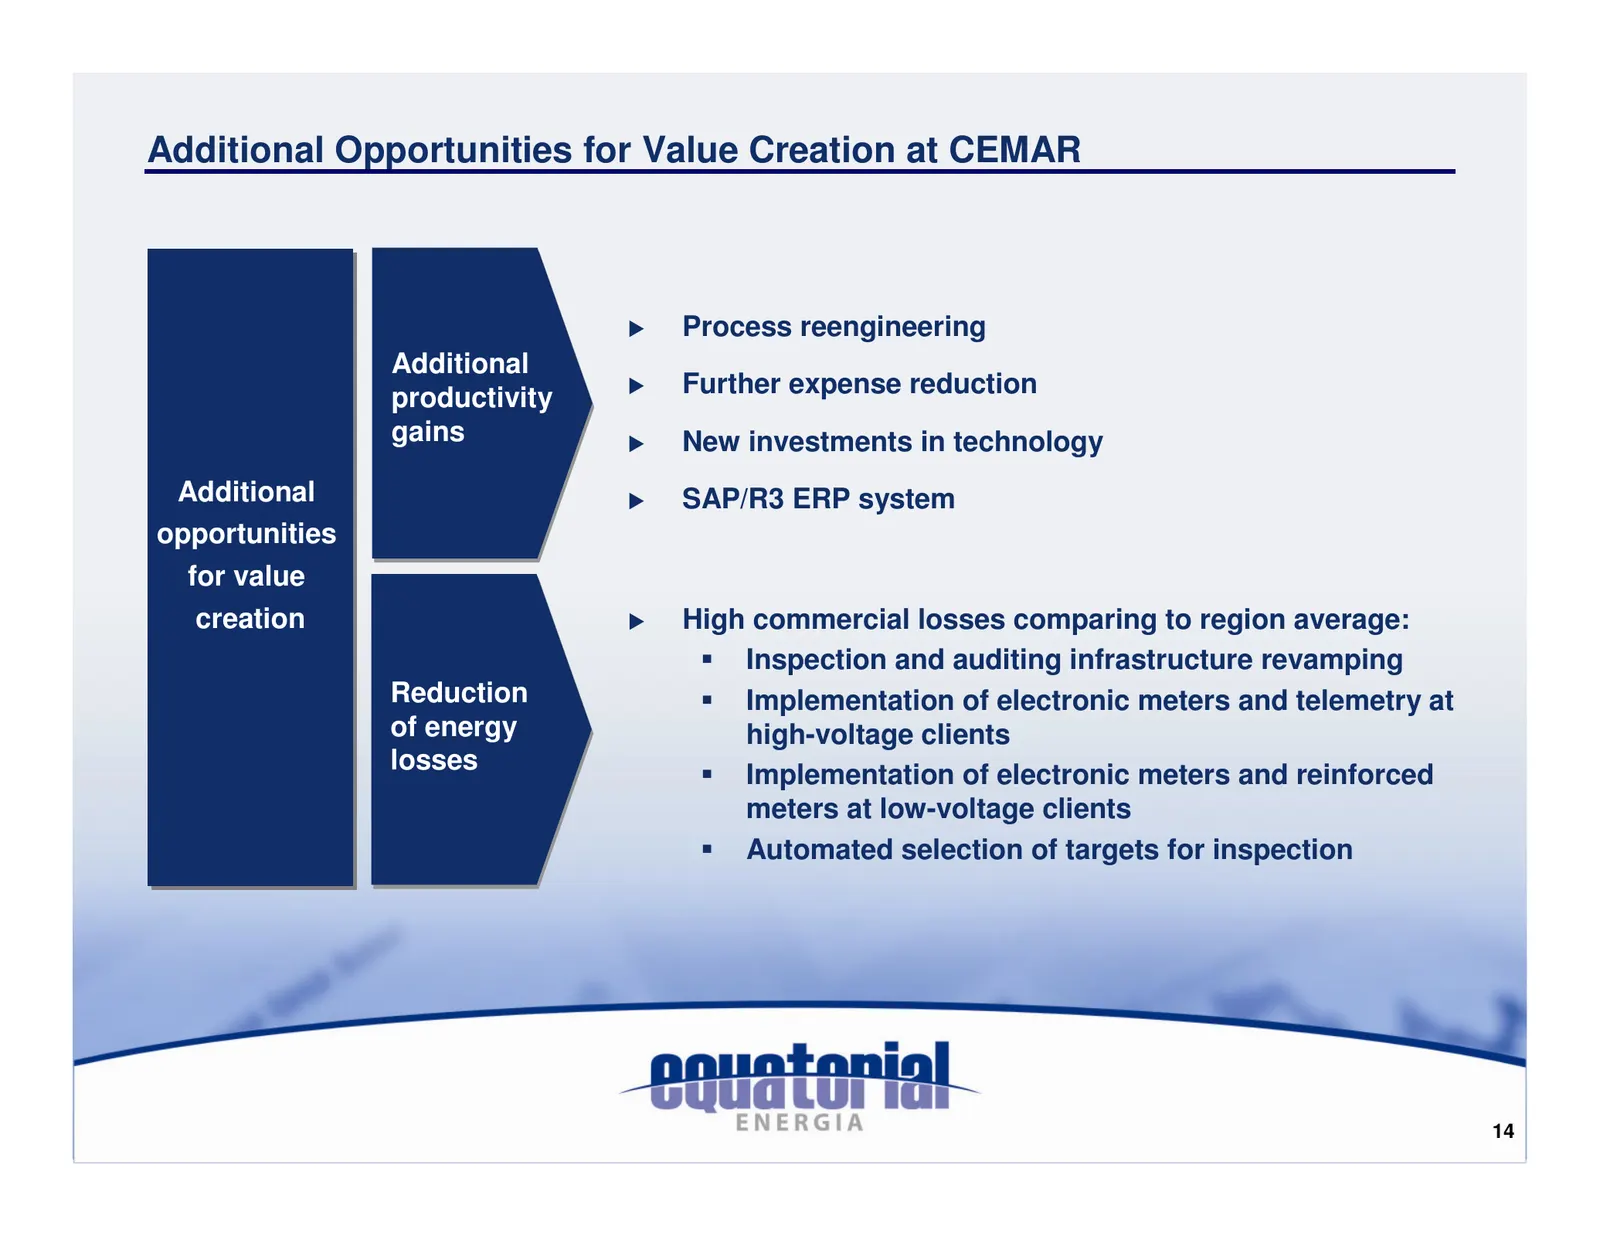
Slide 14: Additional Opportunities for Value Creation at CEMAR
Additional Opportunities for Value Creation at CEMAR Process reengineering Additional Additional productivity Further expense reduction opportunities gains New investments in technology for Additional SAP/R3 ERP system value opportunities creation for value creation High commercial losses comparing
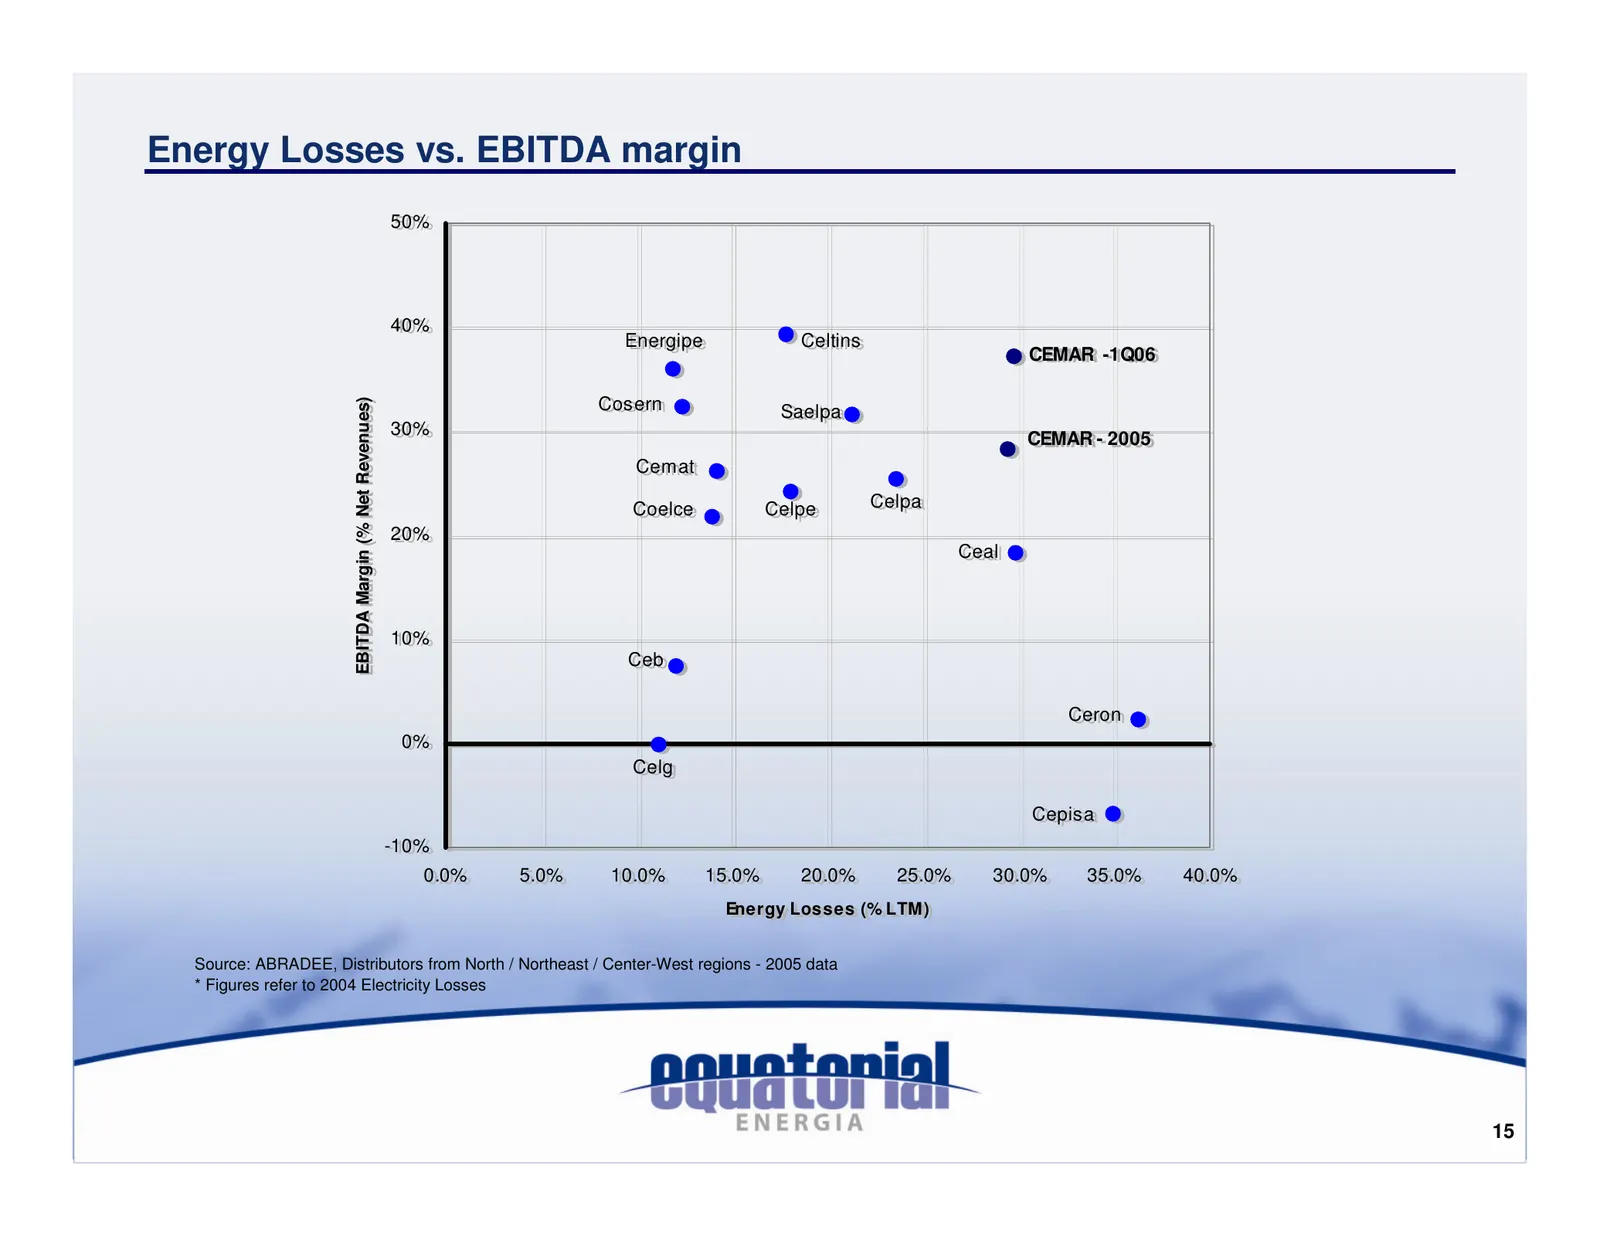
Slide 15: Energy Losses vs. EBITDA margin
Energy Losses vs. EBITDA margin 50% 50% 40% 40% Energipe Energipe Celtins Celtins CEMAR CEMAR -1Q06 -1Q06 Cosern Cosern Revenues) Net Revenues) Saelpa Saelpa 30% 30% CEMAR CEMAR-- 2005 2005 Cemat Cemat Celpa Celpa (% Net Coelce Coelce Celpe Celpe 20% Margin (% 20% Ceal Ceal EBITDA Margin EBITDA 10%
Slide 16: Agenda
Agenda Company Overview Successful Turnaround at CEMAR Growth Opportunities 1Q06 Financial and Operating Results Performance at the BOVESPA Summary 16
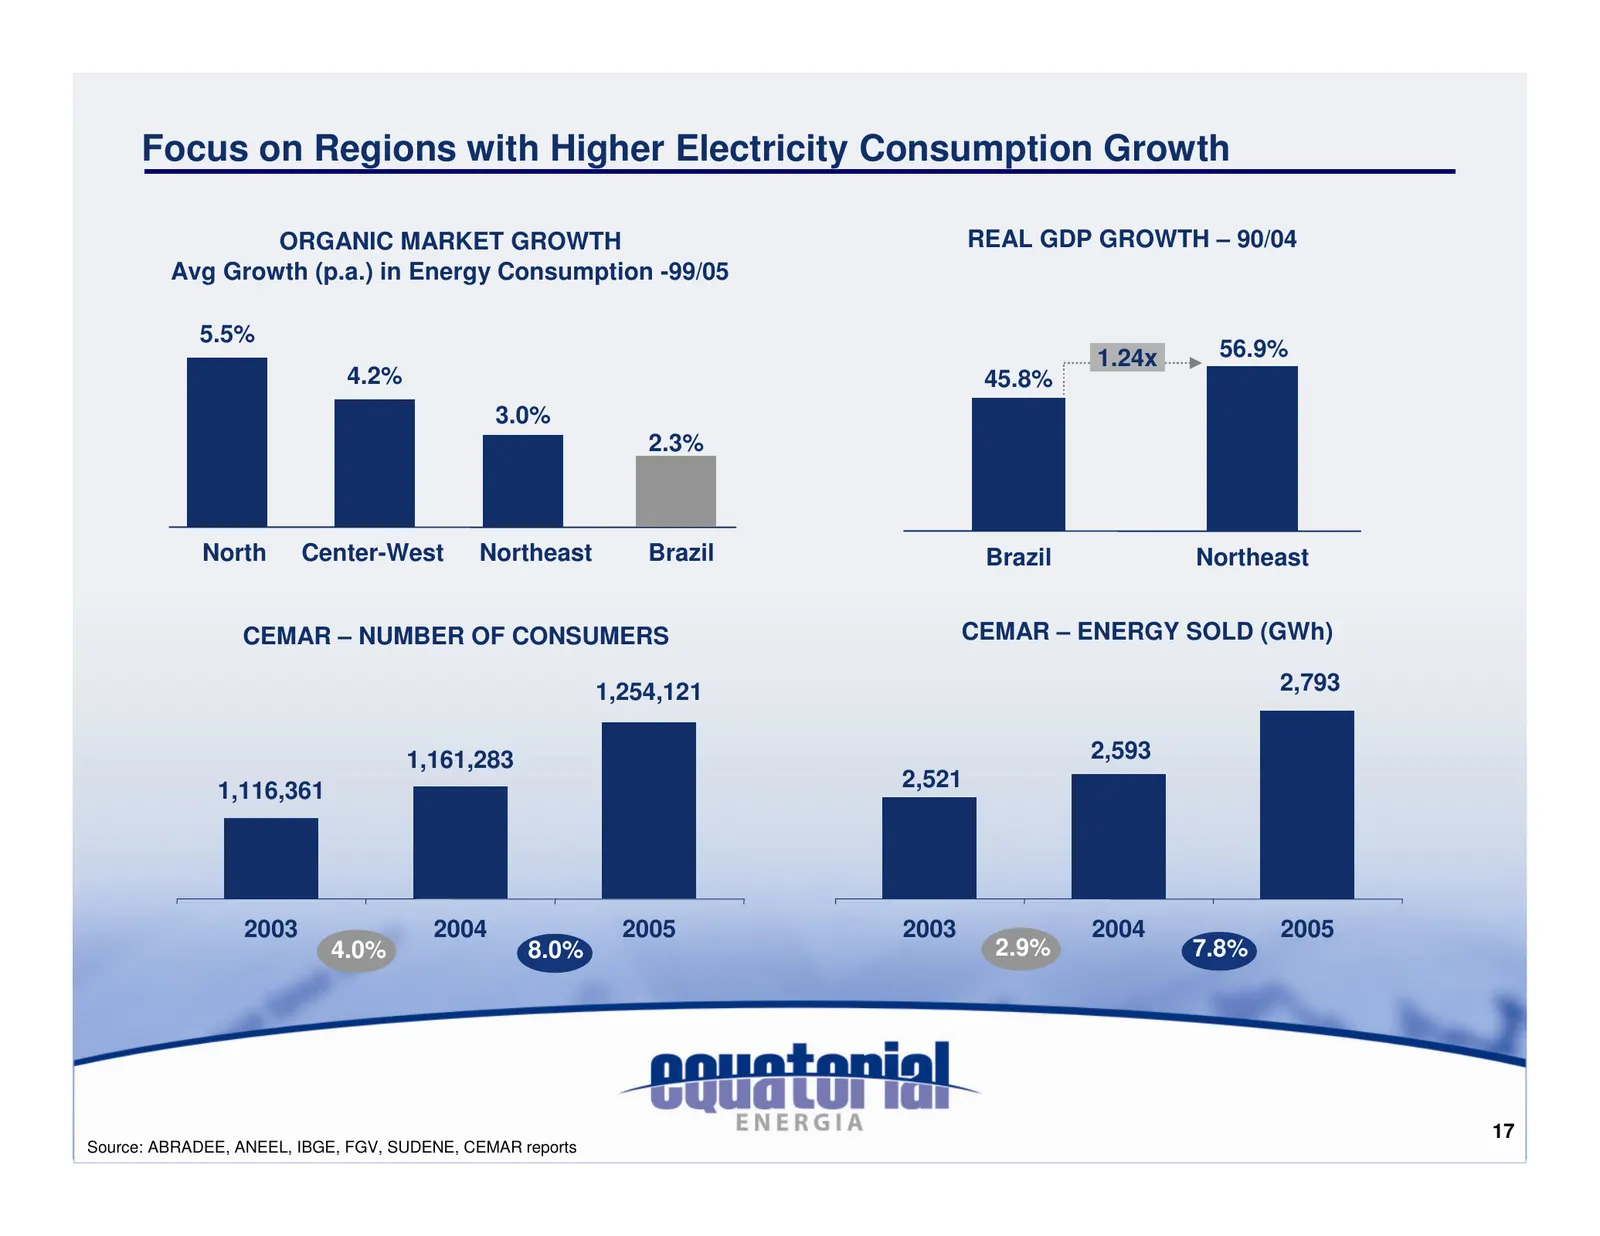
Slide 17: Focus on Regions with Higher Electricity Consumption Growth
Focus on Regions with Higher Electricity Consumption Growth ORGANIC MARKET GROWTH REAL GDP GROWTH – 90/04 Avg Growth (p.a.) in Energy Consumption -99/05 5.5% 1.24x 56.9% 4.2% 45.8% 3.0% 2.3% North Center-West Northeast Brazil Brazil Northeast CEMAR – NUMBER OF CONSUMERS CEMAR – ENERGY SOLD (GWh) 1,2
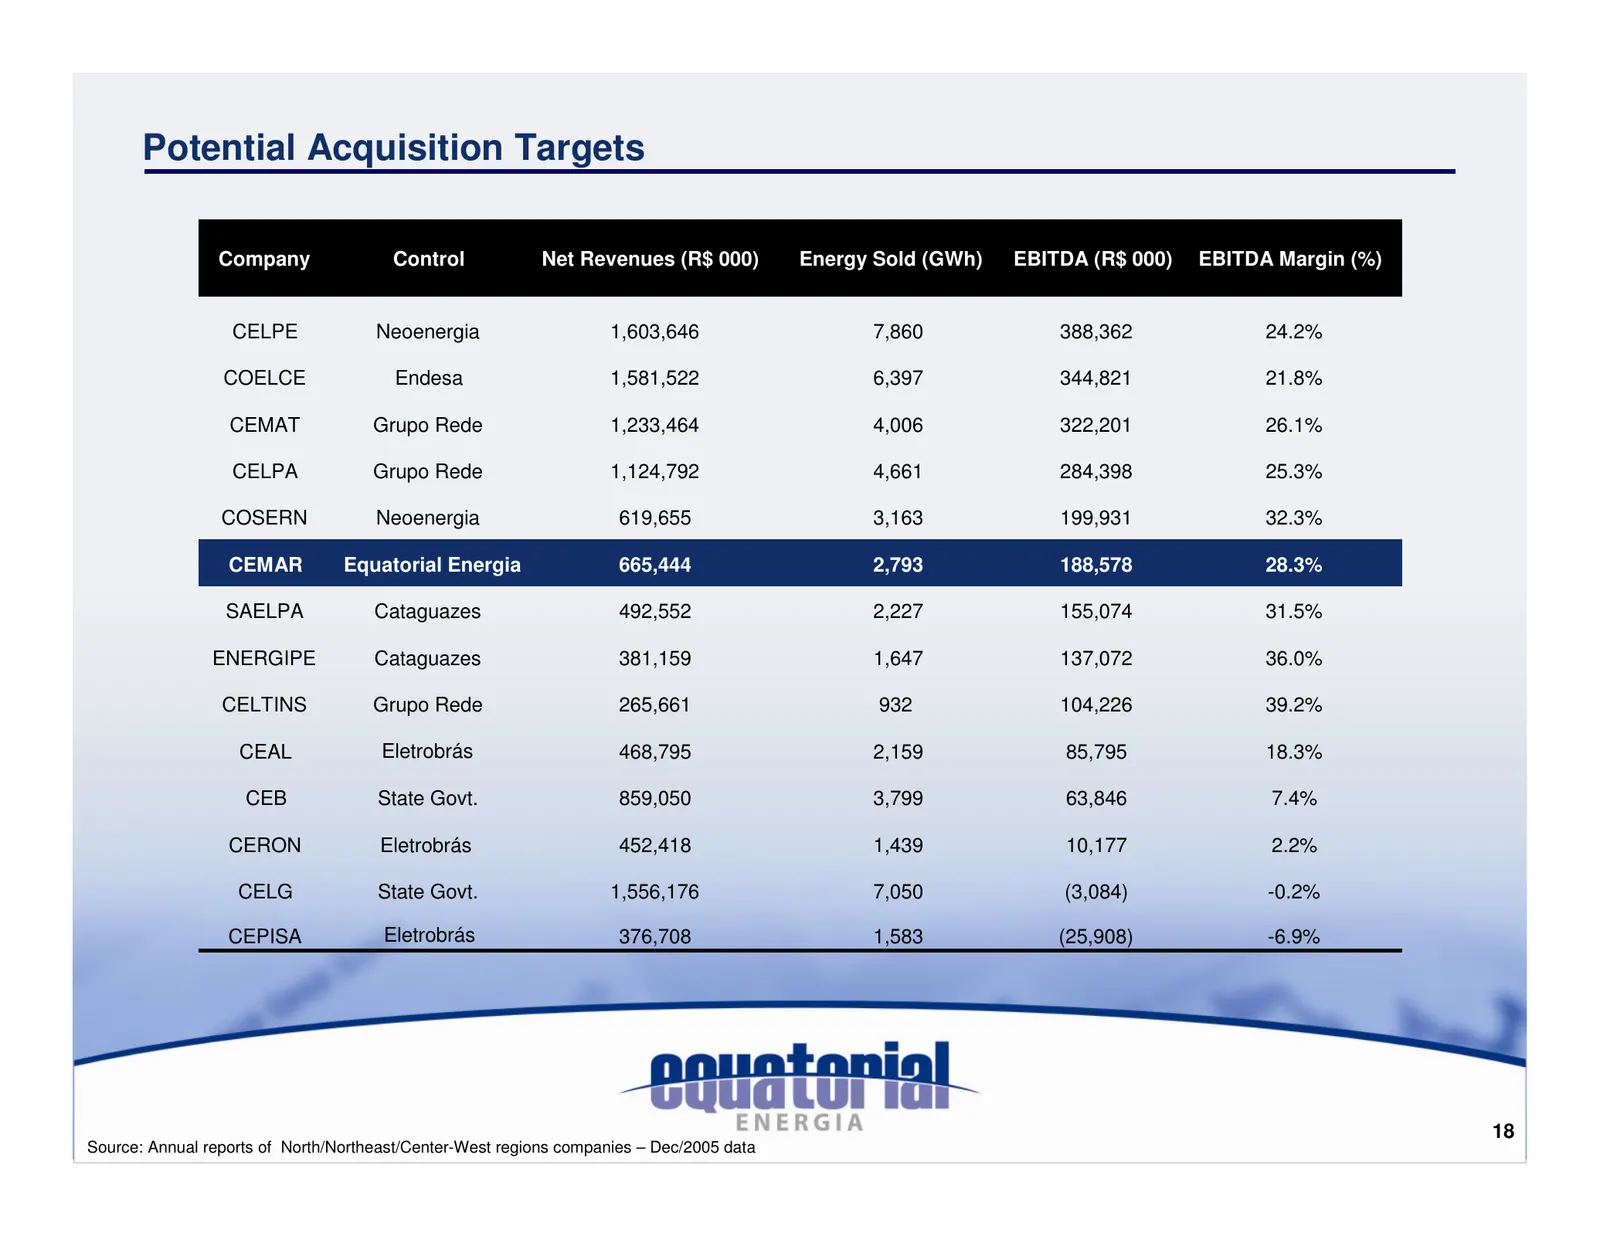
Slide 18: Potential Acquisition Targets
Potential Acquisition Targets Company Control Net Revenues (R$ 000) Energy Sold (GWh) EBITDA (R$ 000) EBITDA Margin (%) CELPE Neoenergia 1,603,646 7,860 388,362 24.2% COELCE Endesa 1,581,522 6,397 344,821 21.8% CEMAT Grupo Rede 1,233,464 4,006 322,201 26.1% CELPA Grupo Rede 1,124,792 4,661 284,398 2
Slide 19: Agenda
Agenda Company Overview Successful Turnaround at CEMAR Growth Opportunities 1Q06 Financial and Operating Results Performance at the BOVESPA Summary 19
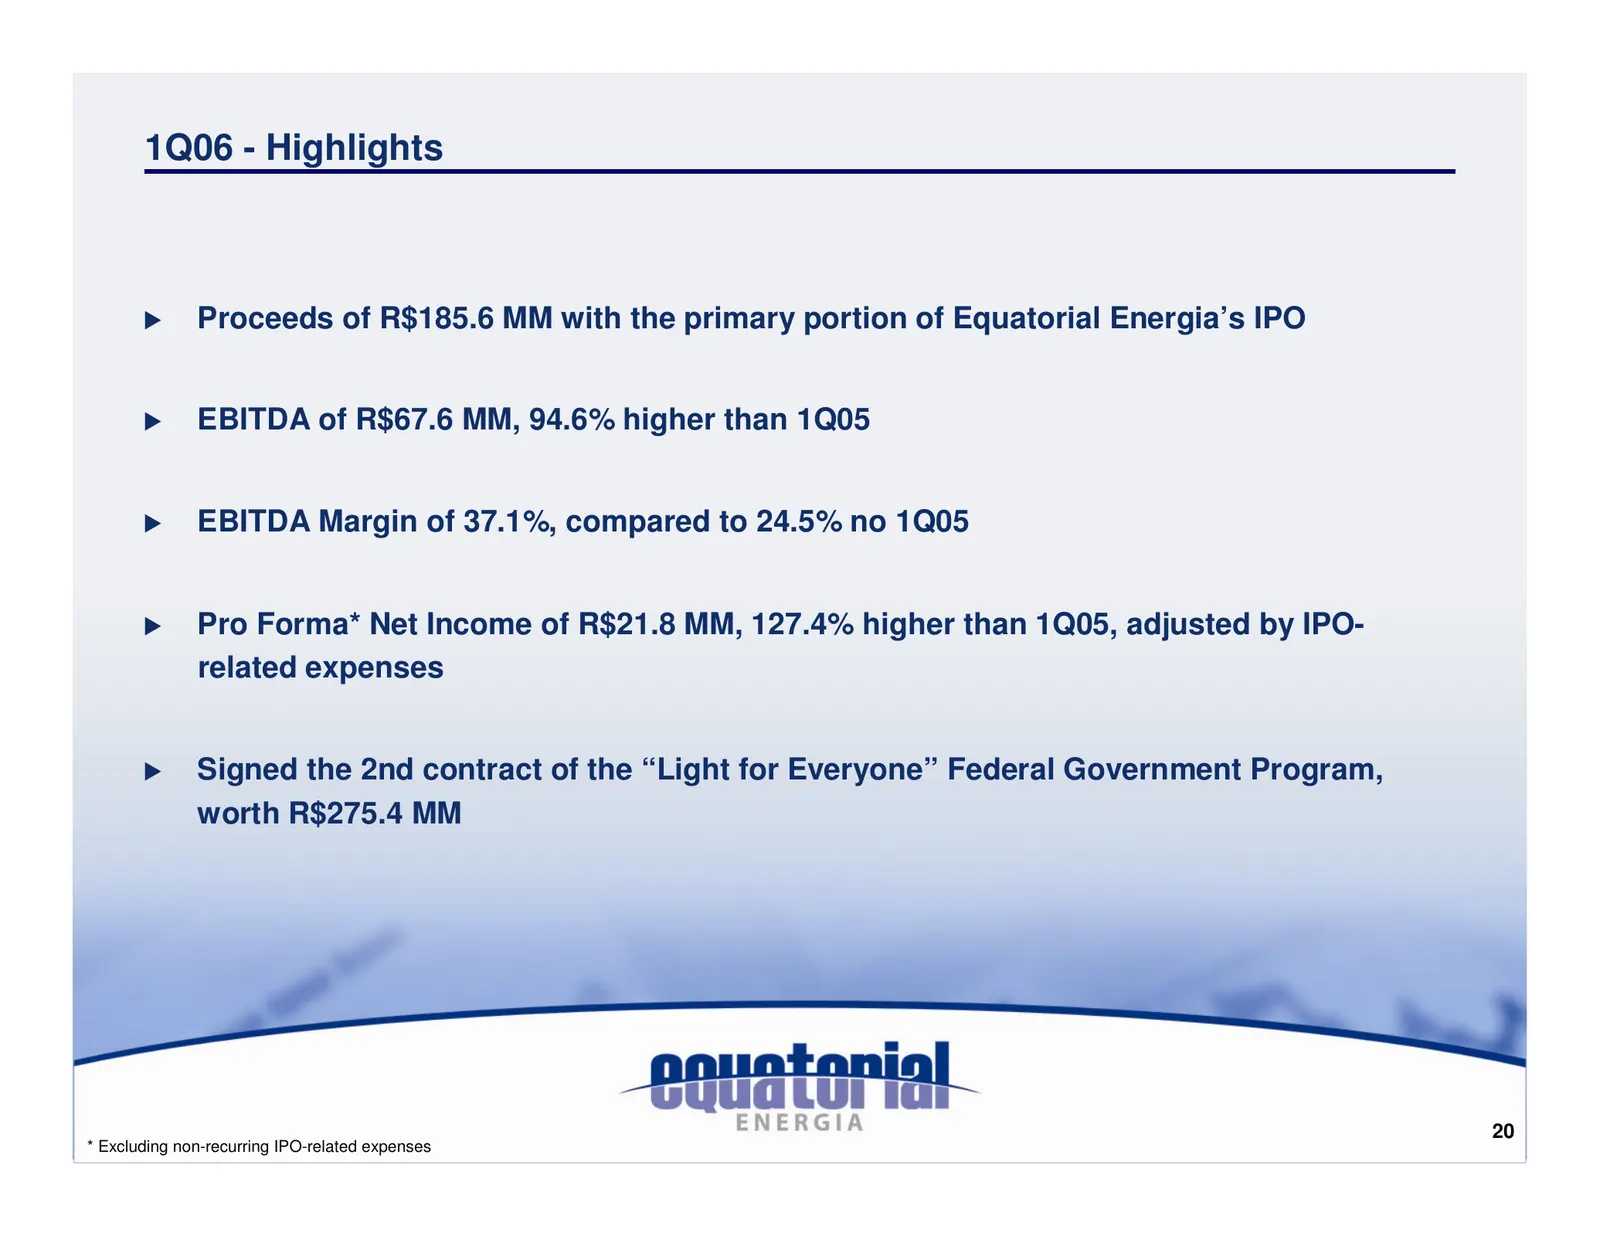
Slide 20: 1Q06 - Highlights
1Q06 - Highlights Proceeds of R$185.6 MM with the primary portion of Equatorial Energia’s IPO EBITDA of R$67.6 MM, 94.6% higher than 1Q05 EBITDA Margin of 37.1%, compared to 24.5% no 1Q05 Pro Forma* Net Income of R$21.8 MM, 127.4% higher than 1Q05, adjusted by IPO- related expenses Signed the 2nd co
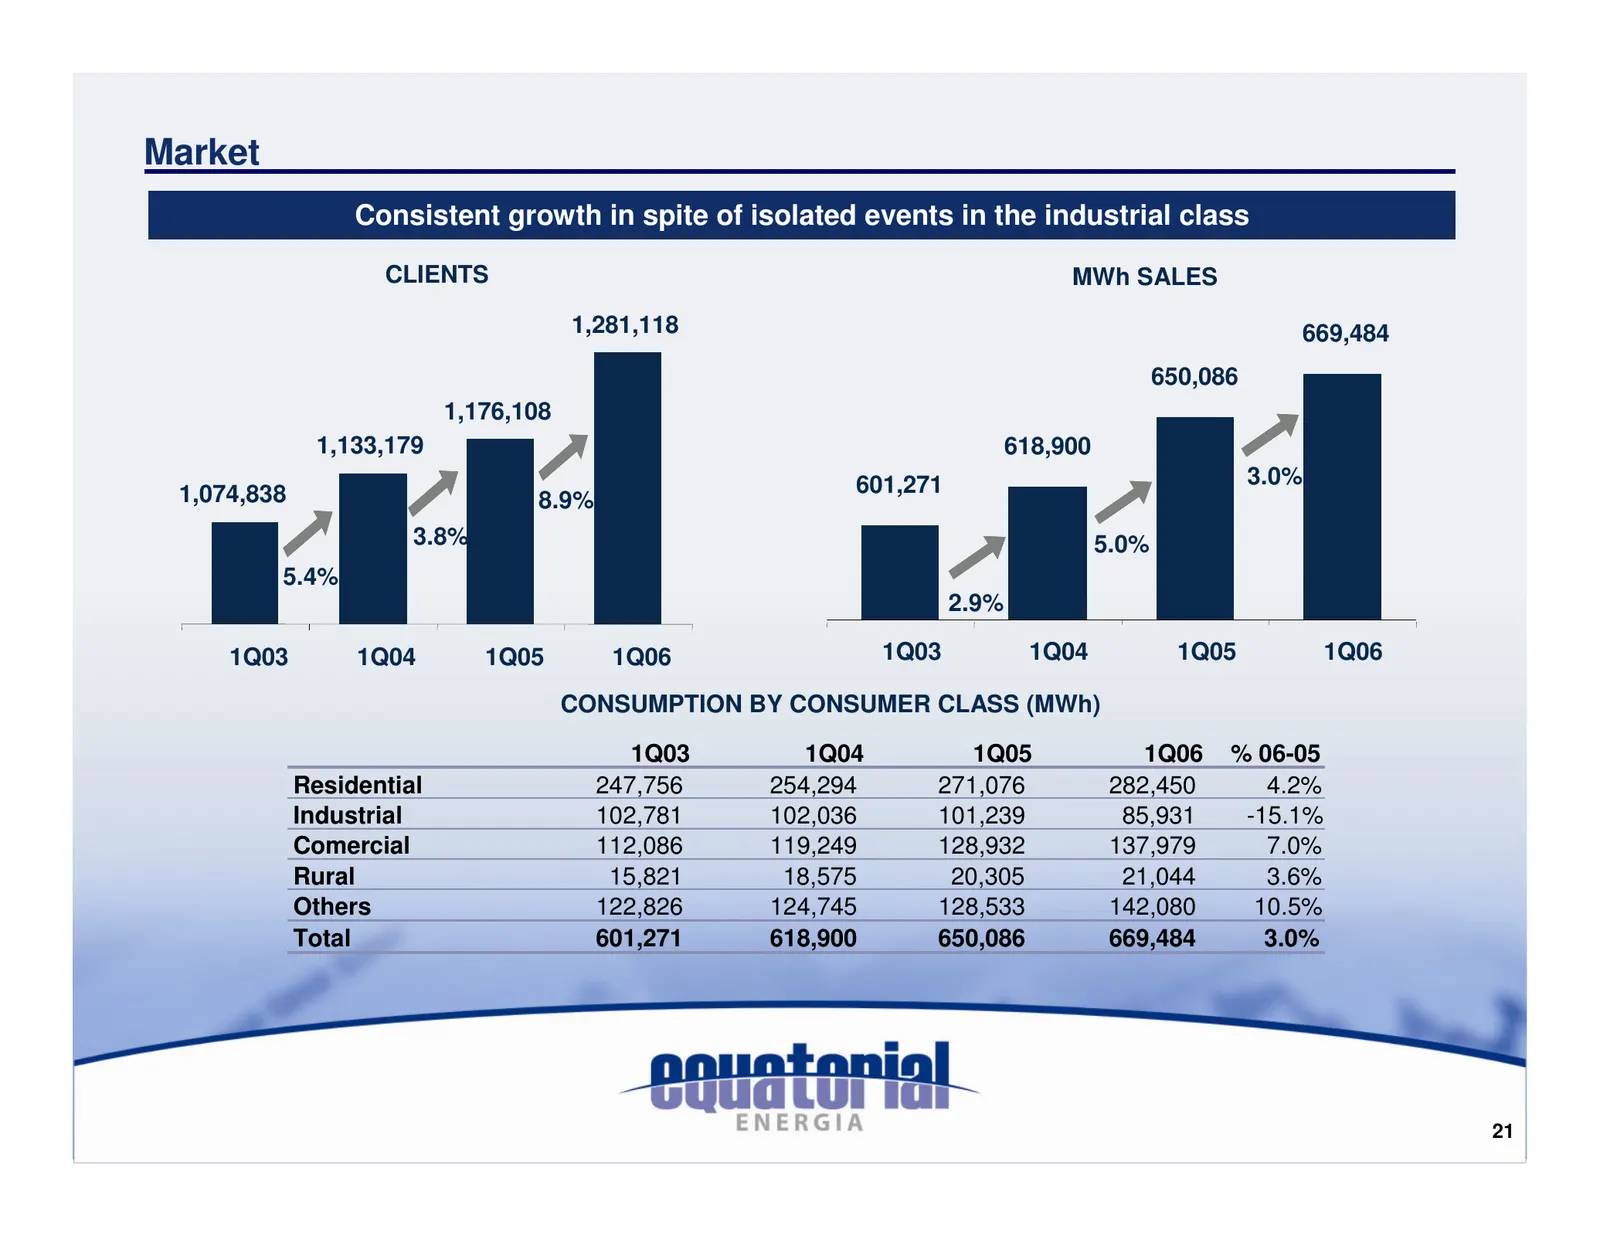
Slide 21: Market
Market Consistent growth in spite of isolated events in the industrial class CLIENTS MWh SALES 1,281,118 669,484 650,086 1,176,108 1,133,179 618,900 601,271 3.0% 1,074,838 8.9% 3.8% 5.0% 5.4% 2.9% 1Q03 1Q04 1Q05 1Q06 1Q03 1Q04 1Q05 1Q06 CONSUMPTION BY CONSUMER CLASS (MWh) 1Q03 1Q04 1Q05 1Q06 % 06-05
Slide 22: Net Revenues
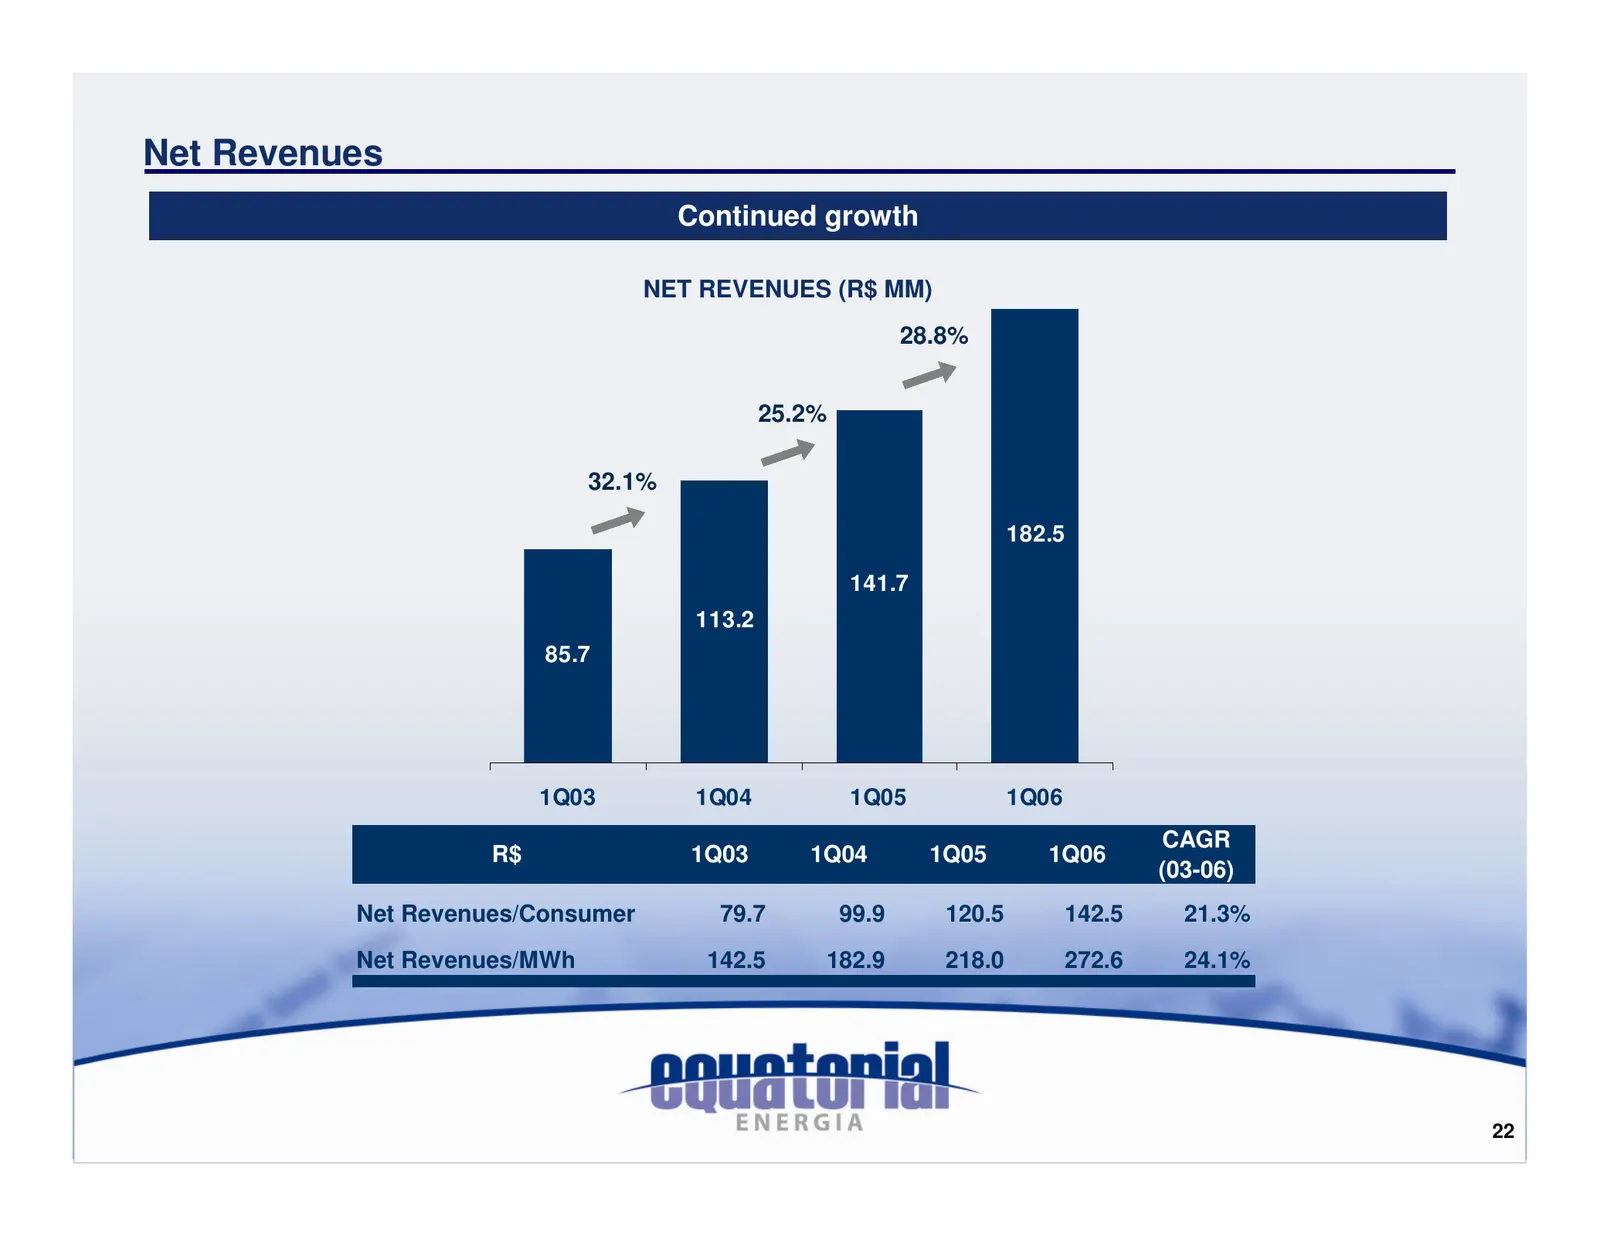
Net Revenues Continued growth NET REVENUES (R$ MM) 28.8% 25.2% 32.1% 182.5 141.7 113.2 85.7 1Q03 1Q04 1Q05 1Q06 CAGR R$ 1Q03 1Q04 1Q05 1Q06 (03-06) Net Revenues/Consumer 79.7 99.9 120.5 142.5 21.3% Net Revenues/MWh 142.5 182.9 218.0 272.6 24.1% 22
Slide 23: Manageable Expenses
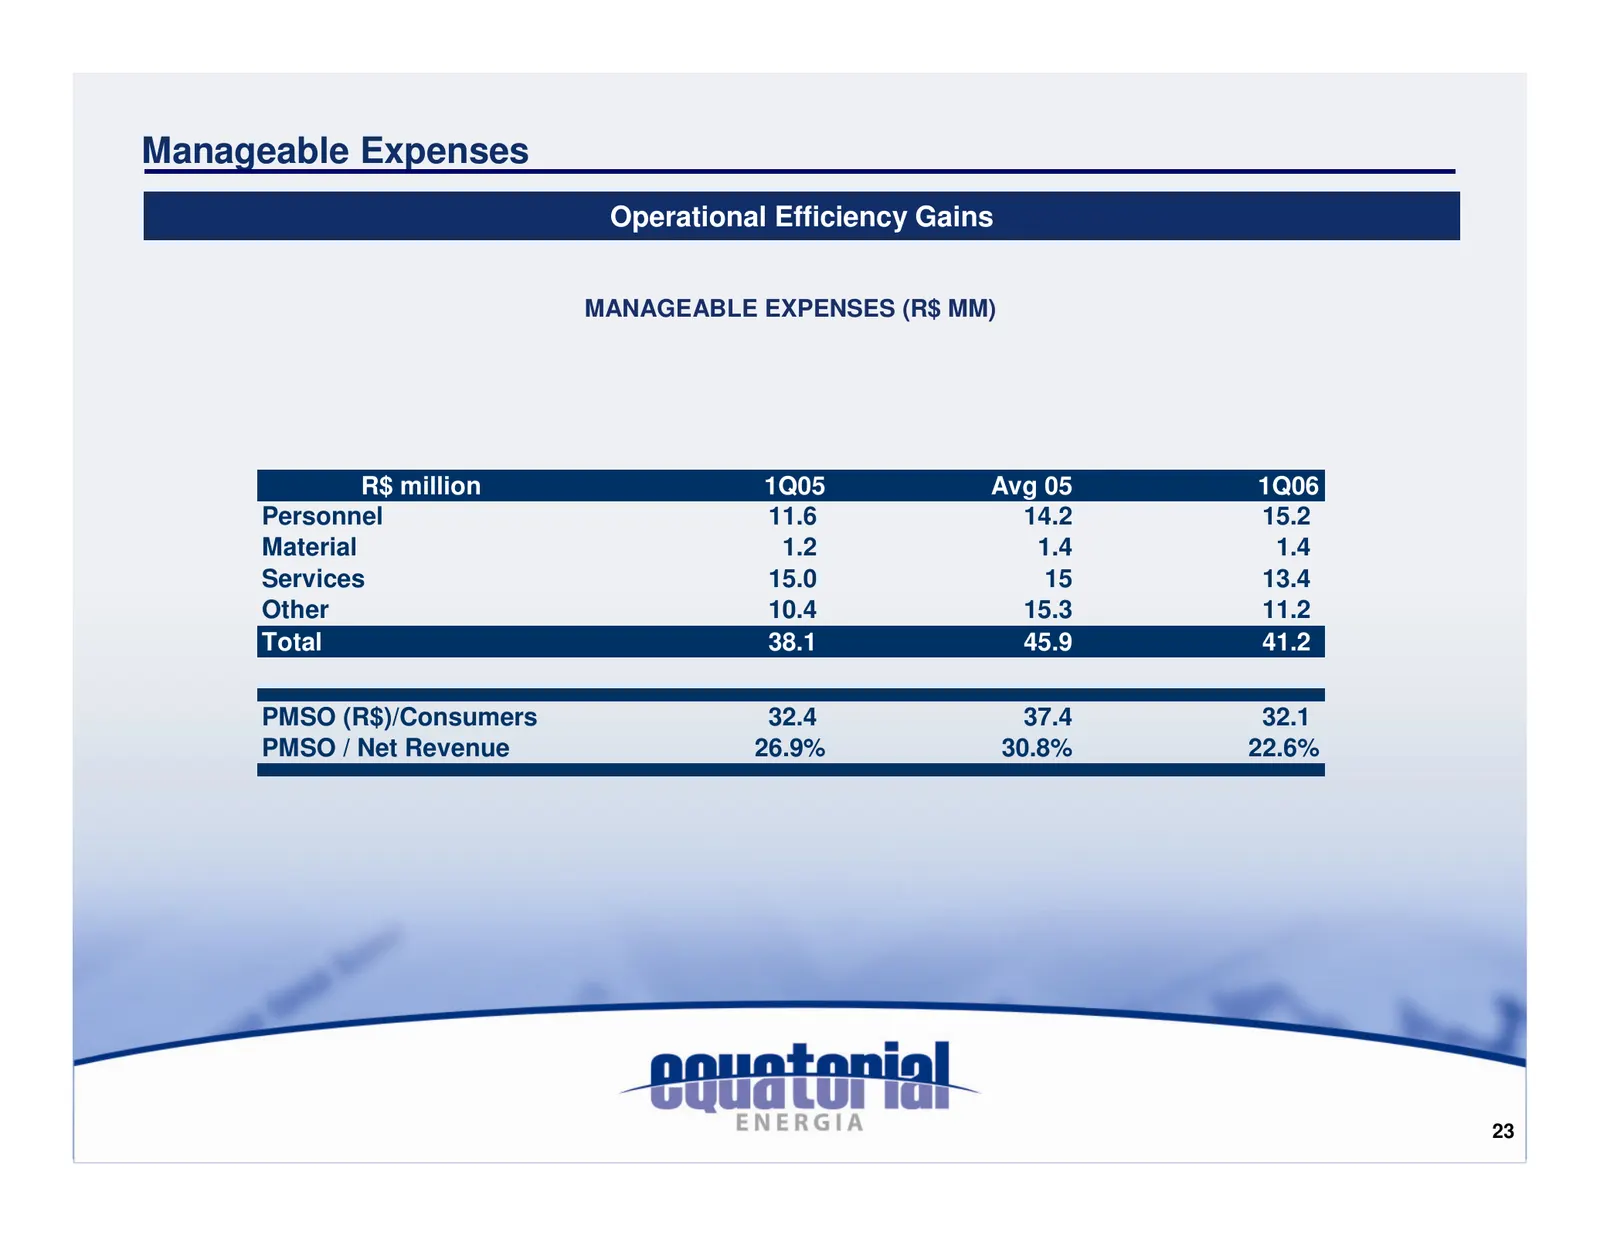
Manageable Expenses Operational Efficiency Gains MANAGEABLE EXPENSES (R$ MM) R$ million 1Q05 Avg 05 1Q06 Personnel 11.6 14.2 15.2 Material 1.2 1.4 1.4 Services 15.0 15 13.4 Other 10.4 15.3 11.2 Total 38.1 45.9 41.2 PMSO (R$)/Consumers 32.4 37.4 32.1 PMSO / Net Revenue 26.9% 30.8% 22.6% 23
Slide 24: Quarterly EBITDA
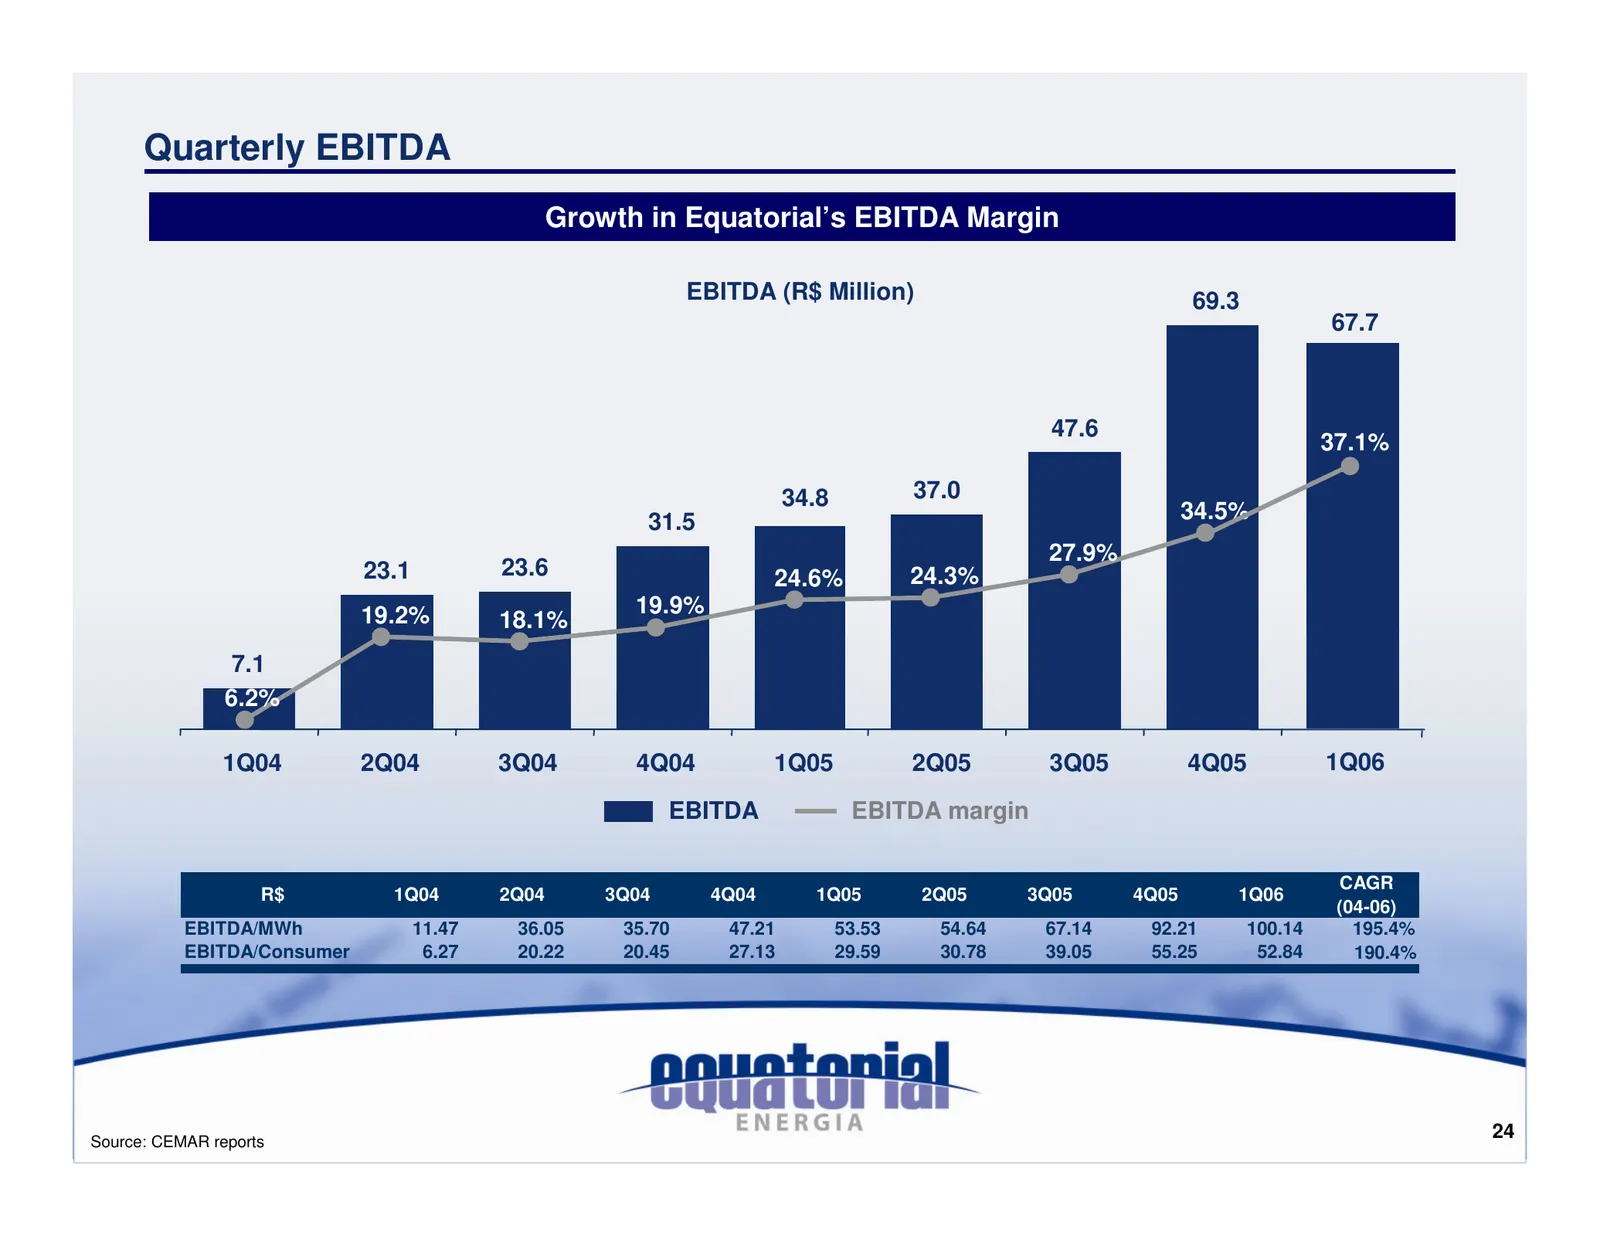
Quarterly EBITDA Growth in Equatorial’s EBITDA Margin EBITDA (R$ Million) 69.3 67.7 47.6 37.1% 34.8 37.0 31.5 34.5% 27.9% 23.1 23.6 24.6% 24.3% 19.2% 19.9% 18.1% 7.1 6.2% 1Q04 2Q04 3Q04 4Q04 1Q05 2Q05 3Q05 4Q05 1Q06 EBITDA EBITDA margin CAGR R$ 1Q04 2Q04 3Q04 4Q04 1Q05 2Q05 3Q05 4Q05 1Q06 (04-06) EB
Slide 25: EBITDA Margin vs. Electricity Growth
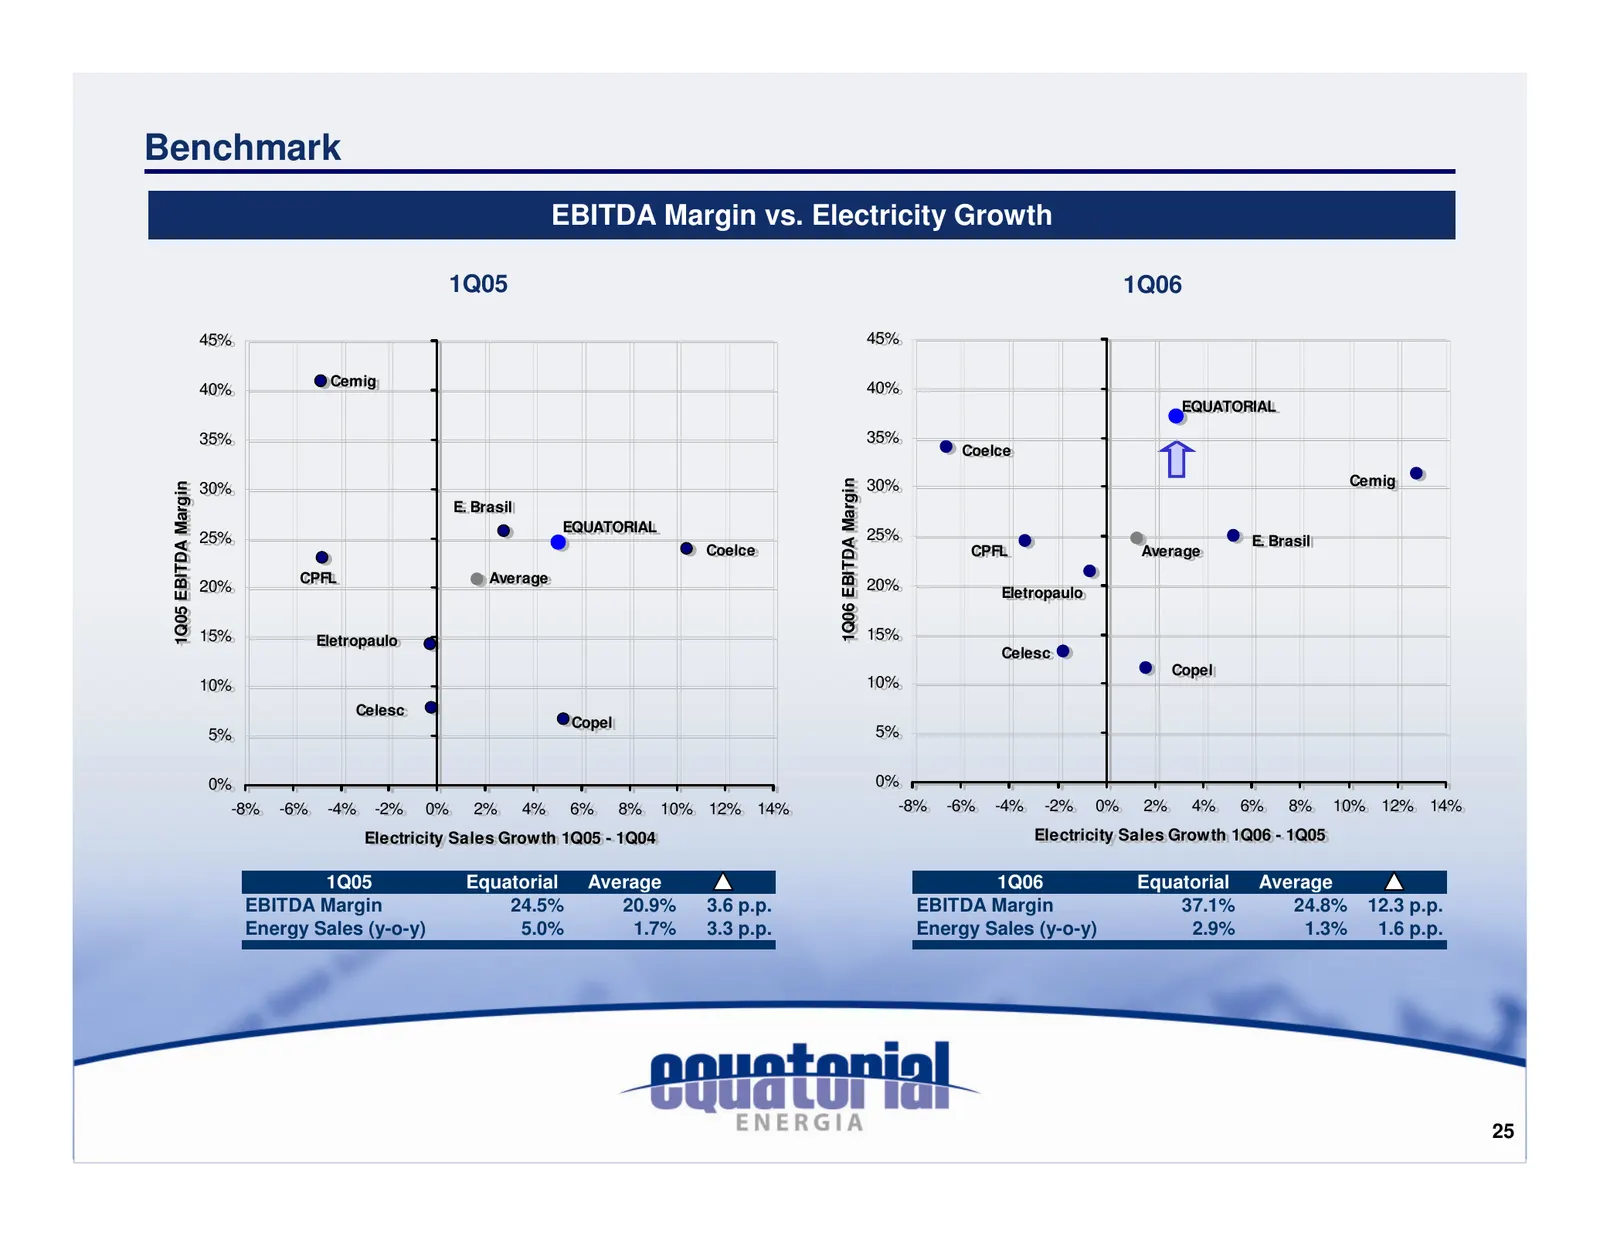
Benchmark EBITDA Margin vs. Electricity Growth 1Q05 1Q06 45% 45% 45% 45% Cemig Cemig 40% 40% 40% 40% EQUATORIAL EQUATORIAL 35% 35% 35% 35% Coelce Coelce 30% 30% Cemig Cemig Margin 30% EBITDA Margin 30% Margin EBITDA Margin E. E.Brasil Brasil EQUATORIAL EQUATORIAL 25% 25% 25% 25% E. E.Brasil Brasil 1
Slide 26: Net Income
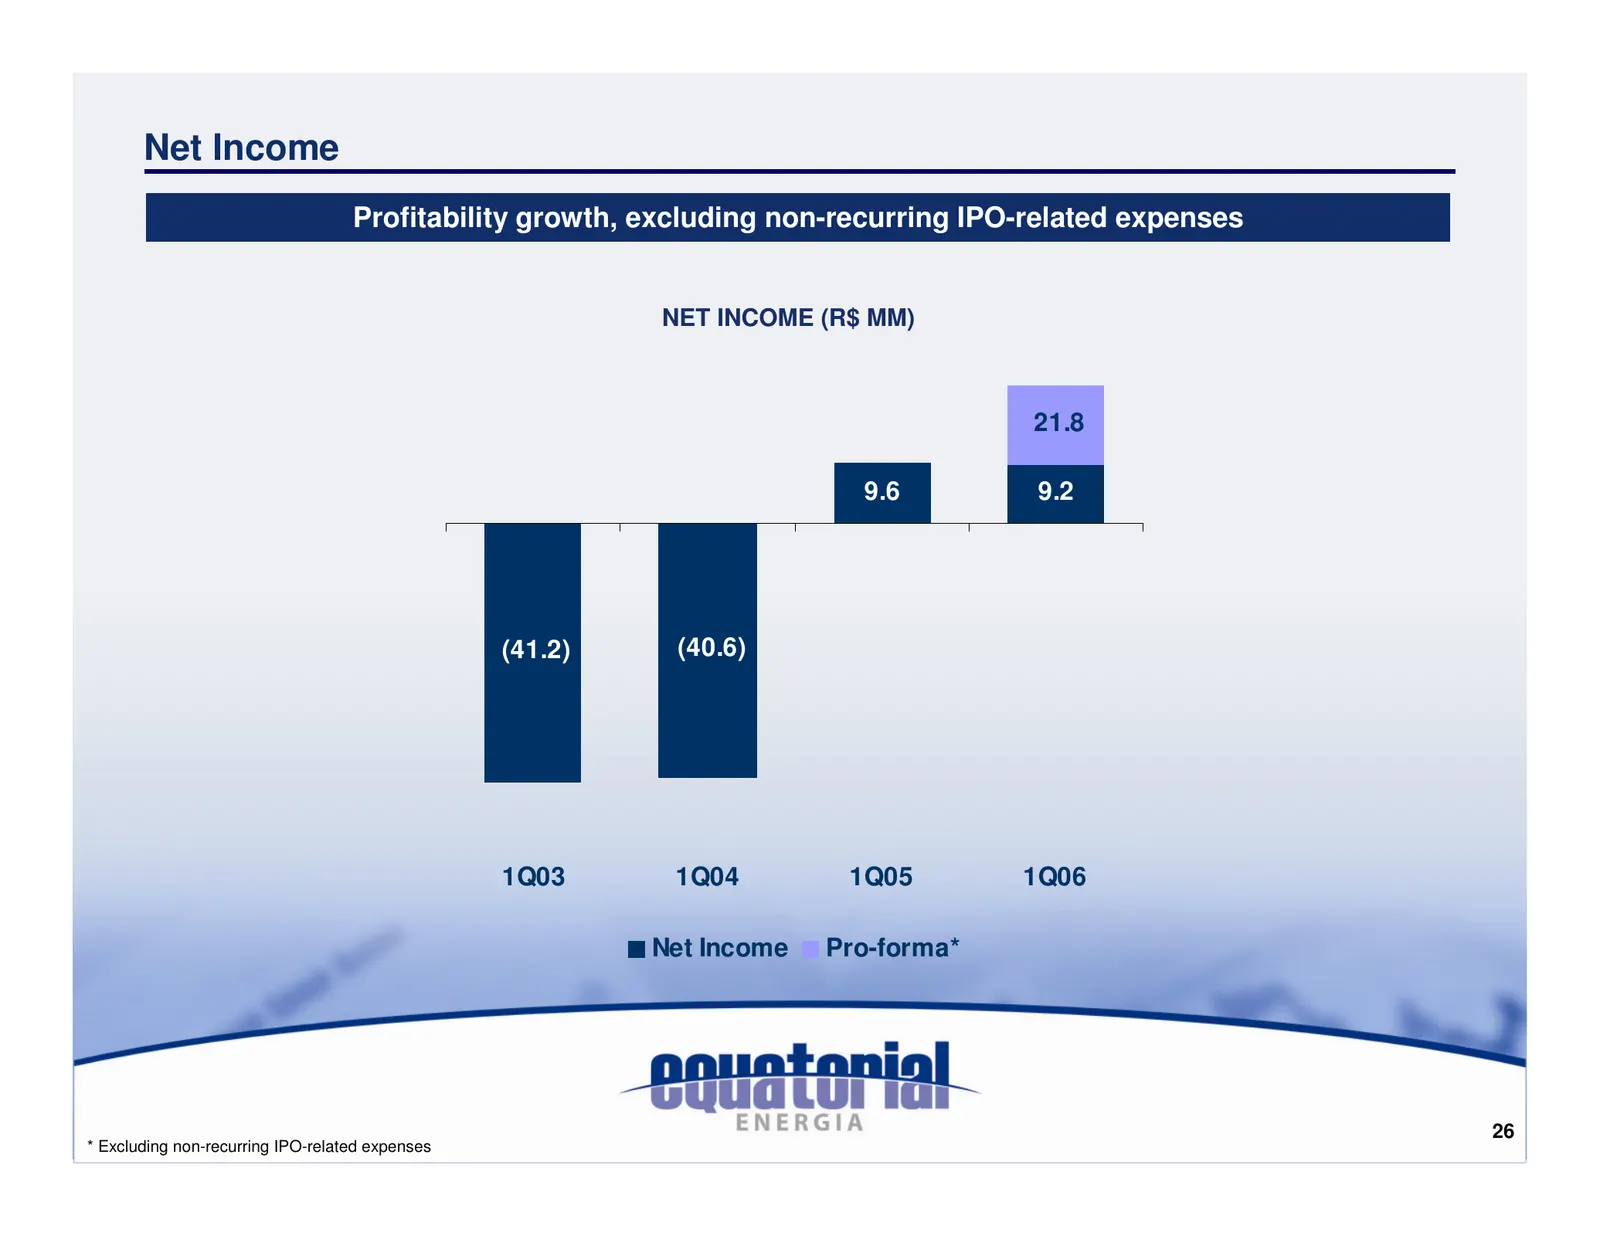
Net Income Profitability growth, excluding non-recurring IPO-related expenses NET INCOME (R$ MM) 21.8 9.6 9.2 (41.2) (40.6) 1Q03 1Q04 1Q05 1Q06 Net Income Pro-forma* 26 * Excluding non-recurring IPO-related expenses
Slide 27: Net Debt
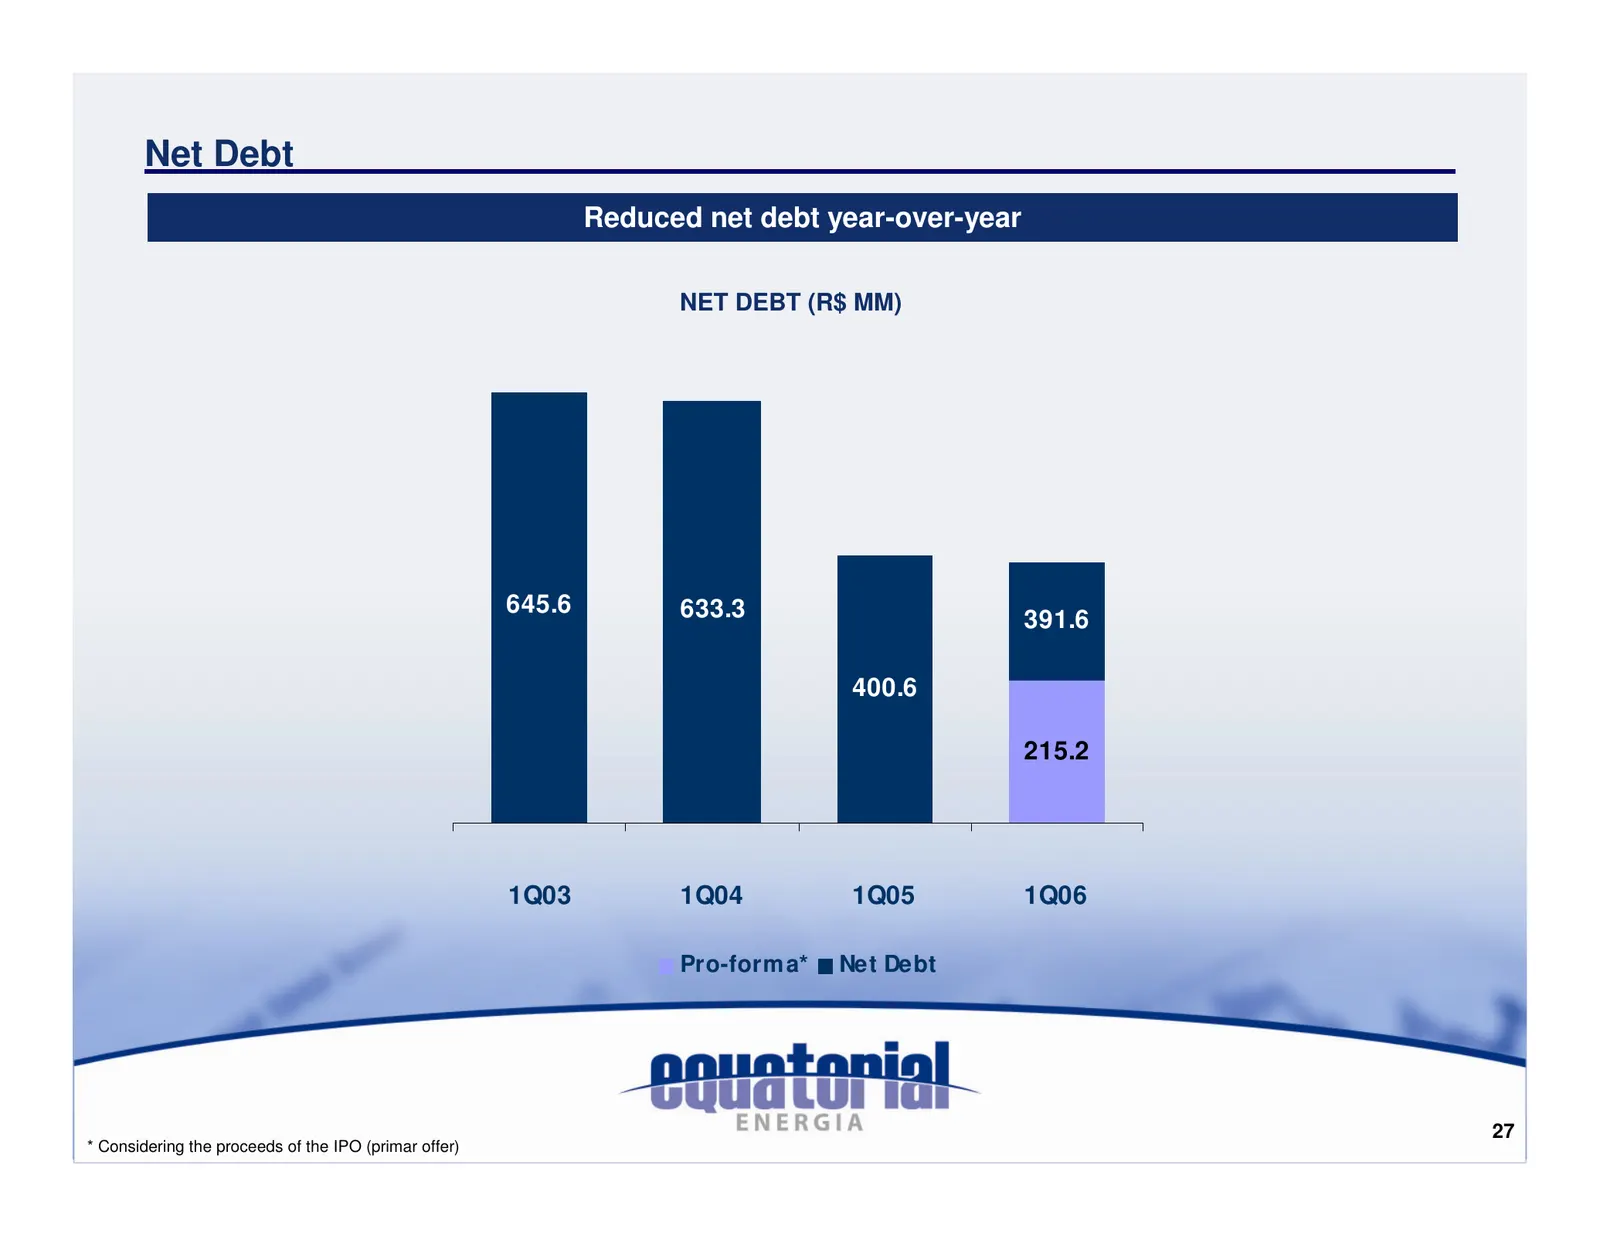
Net Debt Reduced net debt year-over-year NET DEBT (R$ MM) 645.6 633.3 391.6 400.6 215.2 1Q03 1Q04 1Q05 1Q06 Pro-form a* Net Debt 27 * Considering the proceeds of the IPO (primar offer)
Slide 28: CAPEX
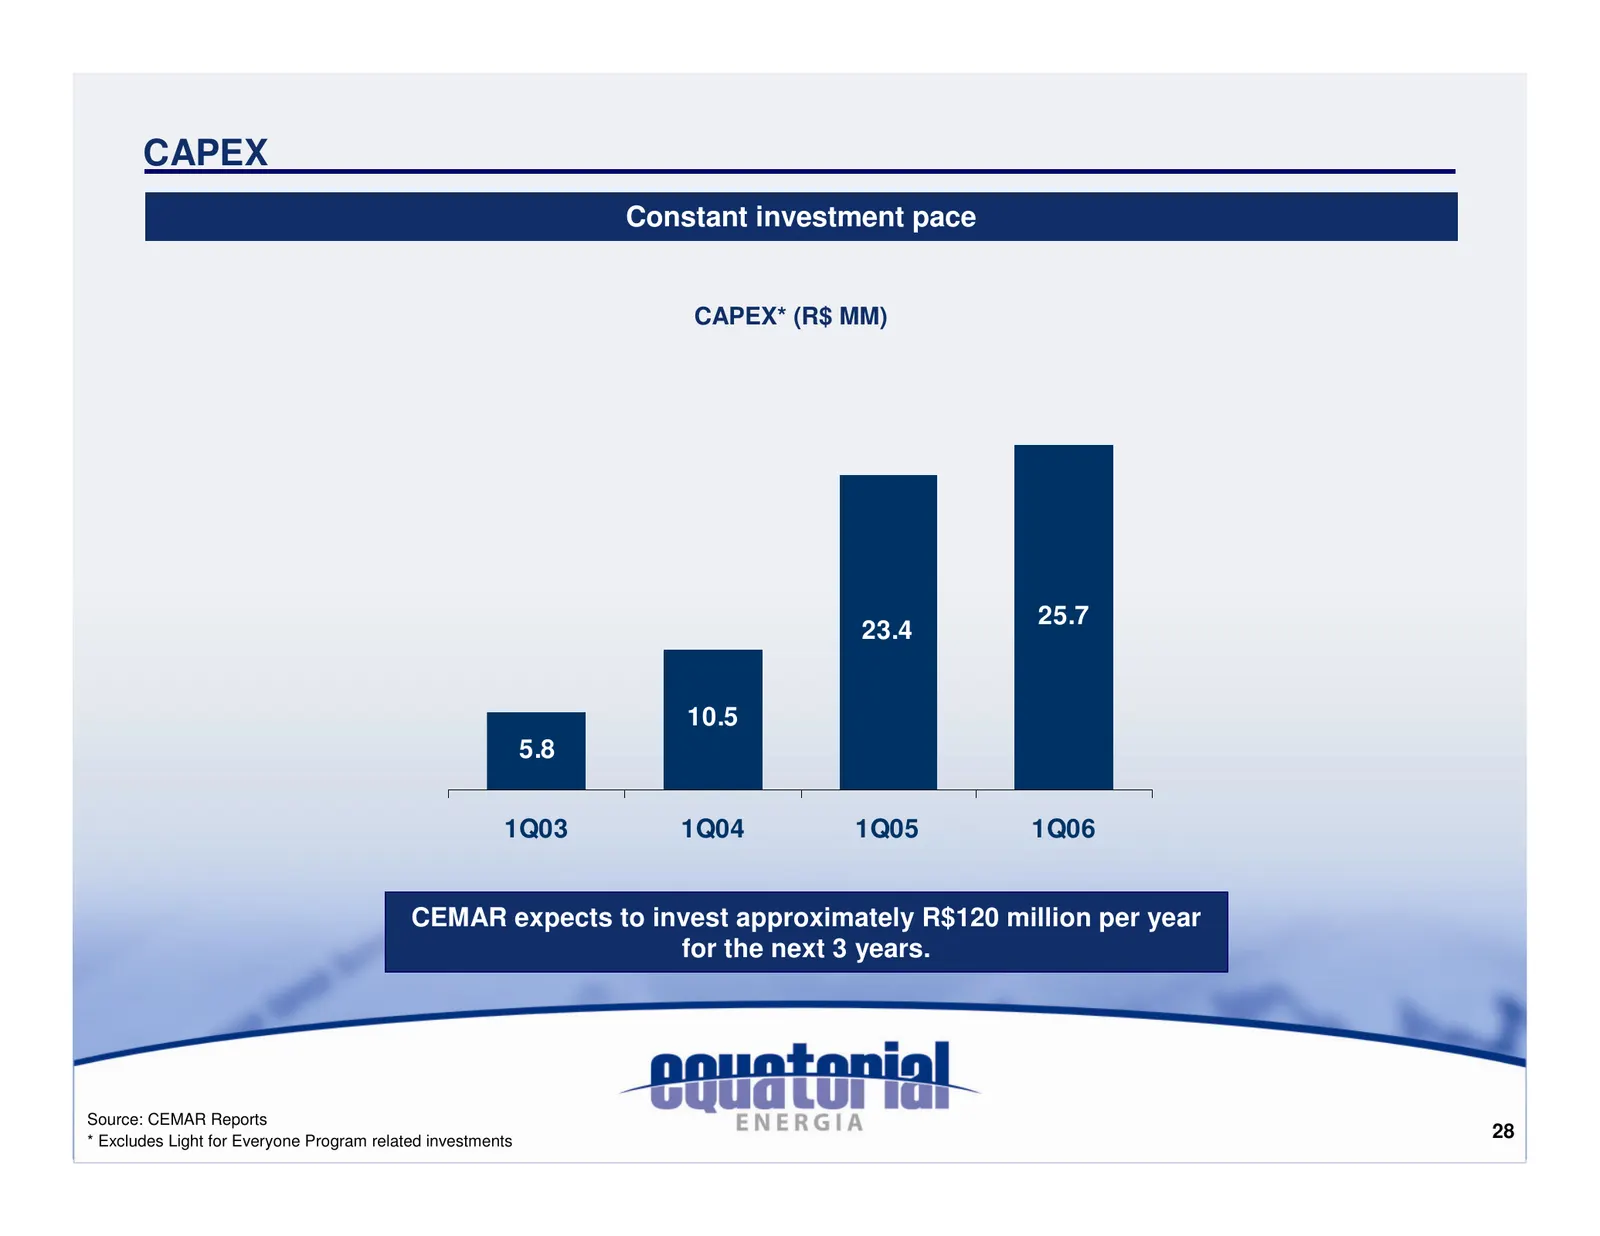
CAPEX Constant investment pace CAPEX* (R$ MM) 25.7 23.4 10.5 5.8 1Q03 1Q04 1Q05 1Q06 CEMAR expects to invest approximately R$120 million per year for the next 3 years. Source: CEMAR Reports * Excludes Light for Everyone Program related investments 28
Slide 29: Light for Everyone Program
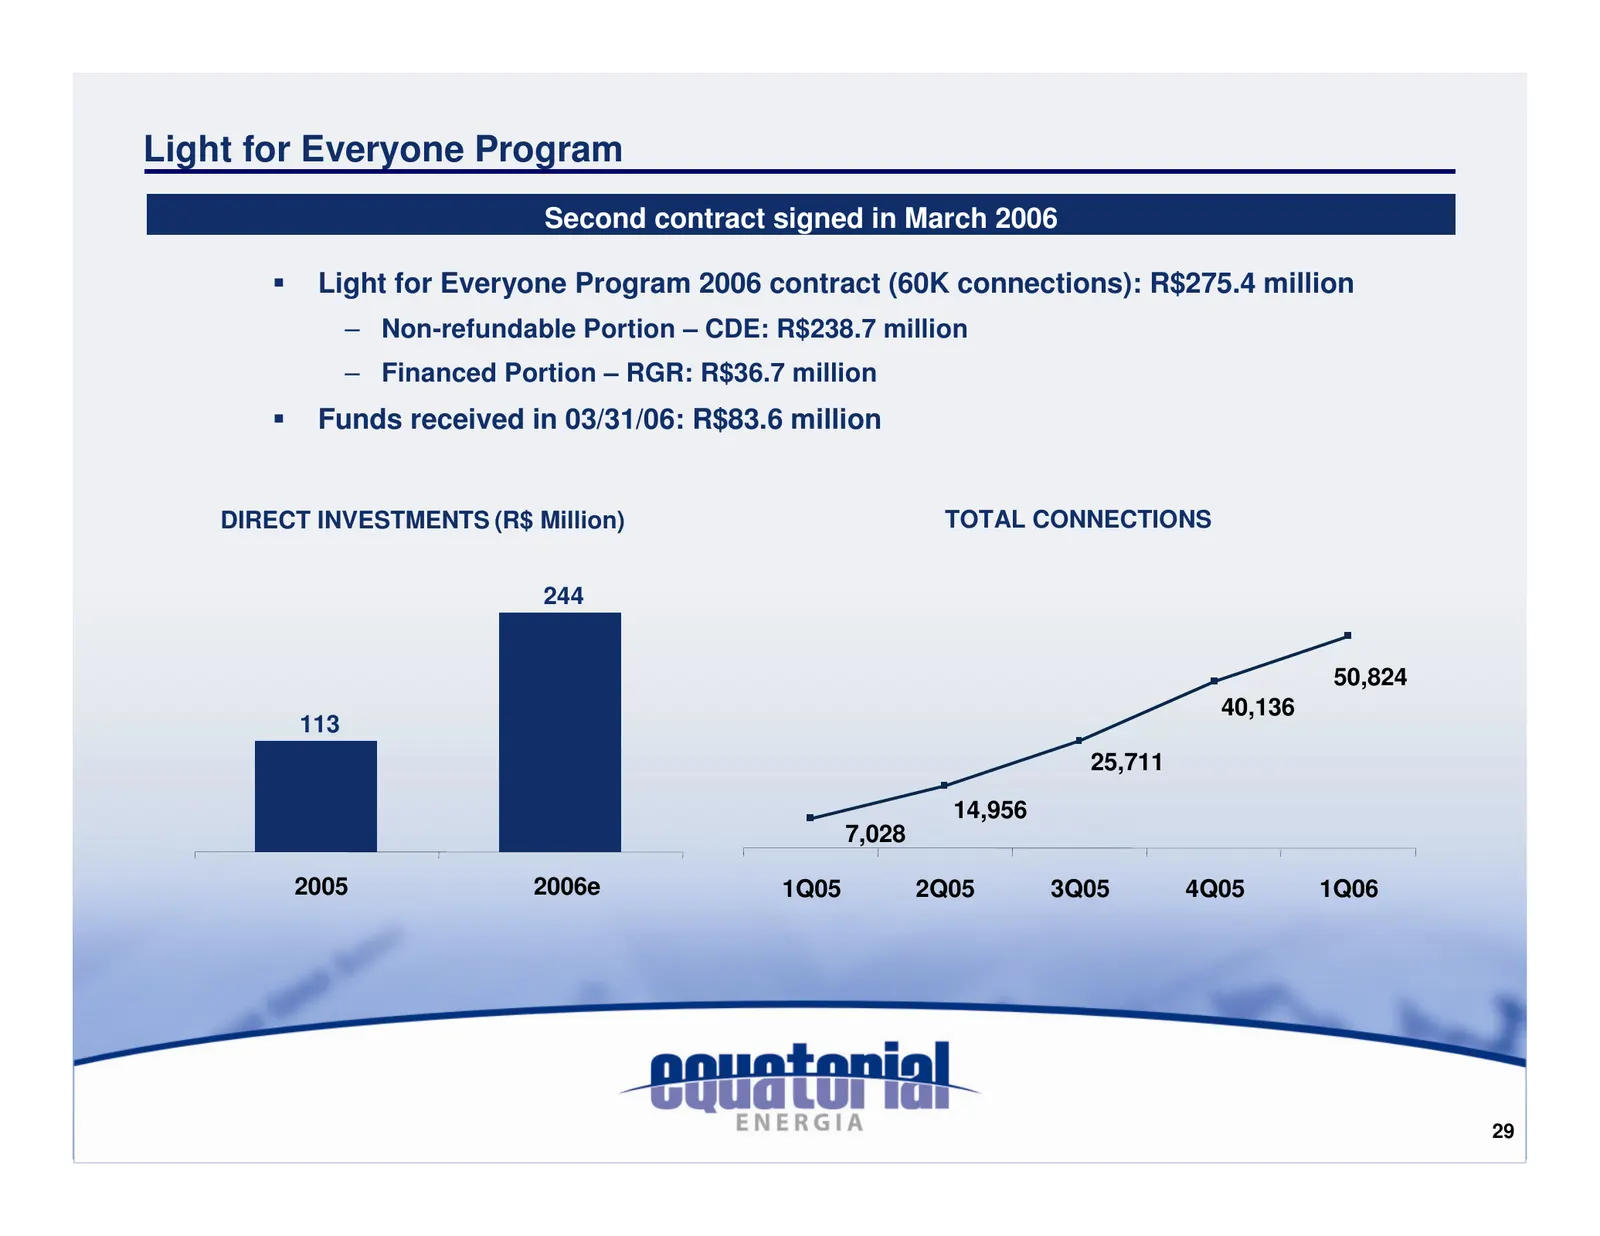
Light for Everyone Program Second contract signed in March 2006 Light for Everyone Program 2006 contract (60K connections): R$275.4 million – Non-refundable Portion – CDE: R$238.7 million – Financed Portion – RGR: R$36.7 million Funds received in 03/31/06: R$83.6 million DIRECT INVESTMENTS (R$ Milli
Slide 30: Agenda
Agenda Company Overview Successful Turnaround at CEMAR Growth Opportunities 1Q06 Financial and Operating Results Performance at the BOVESPA Summary 30
Slide 31: Price Evolution
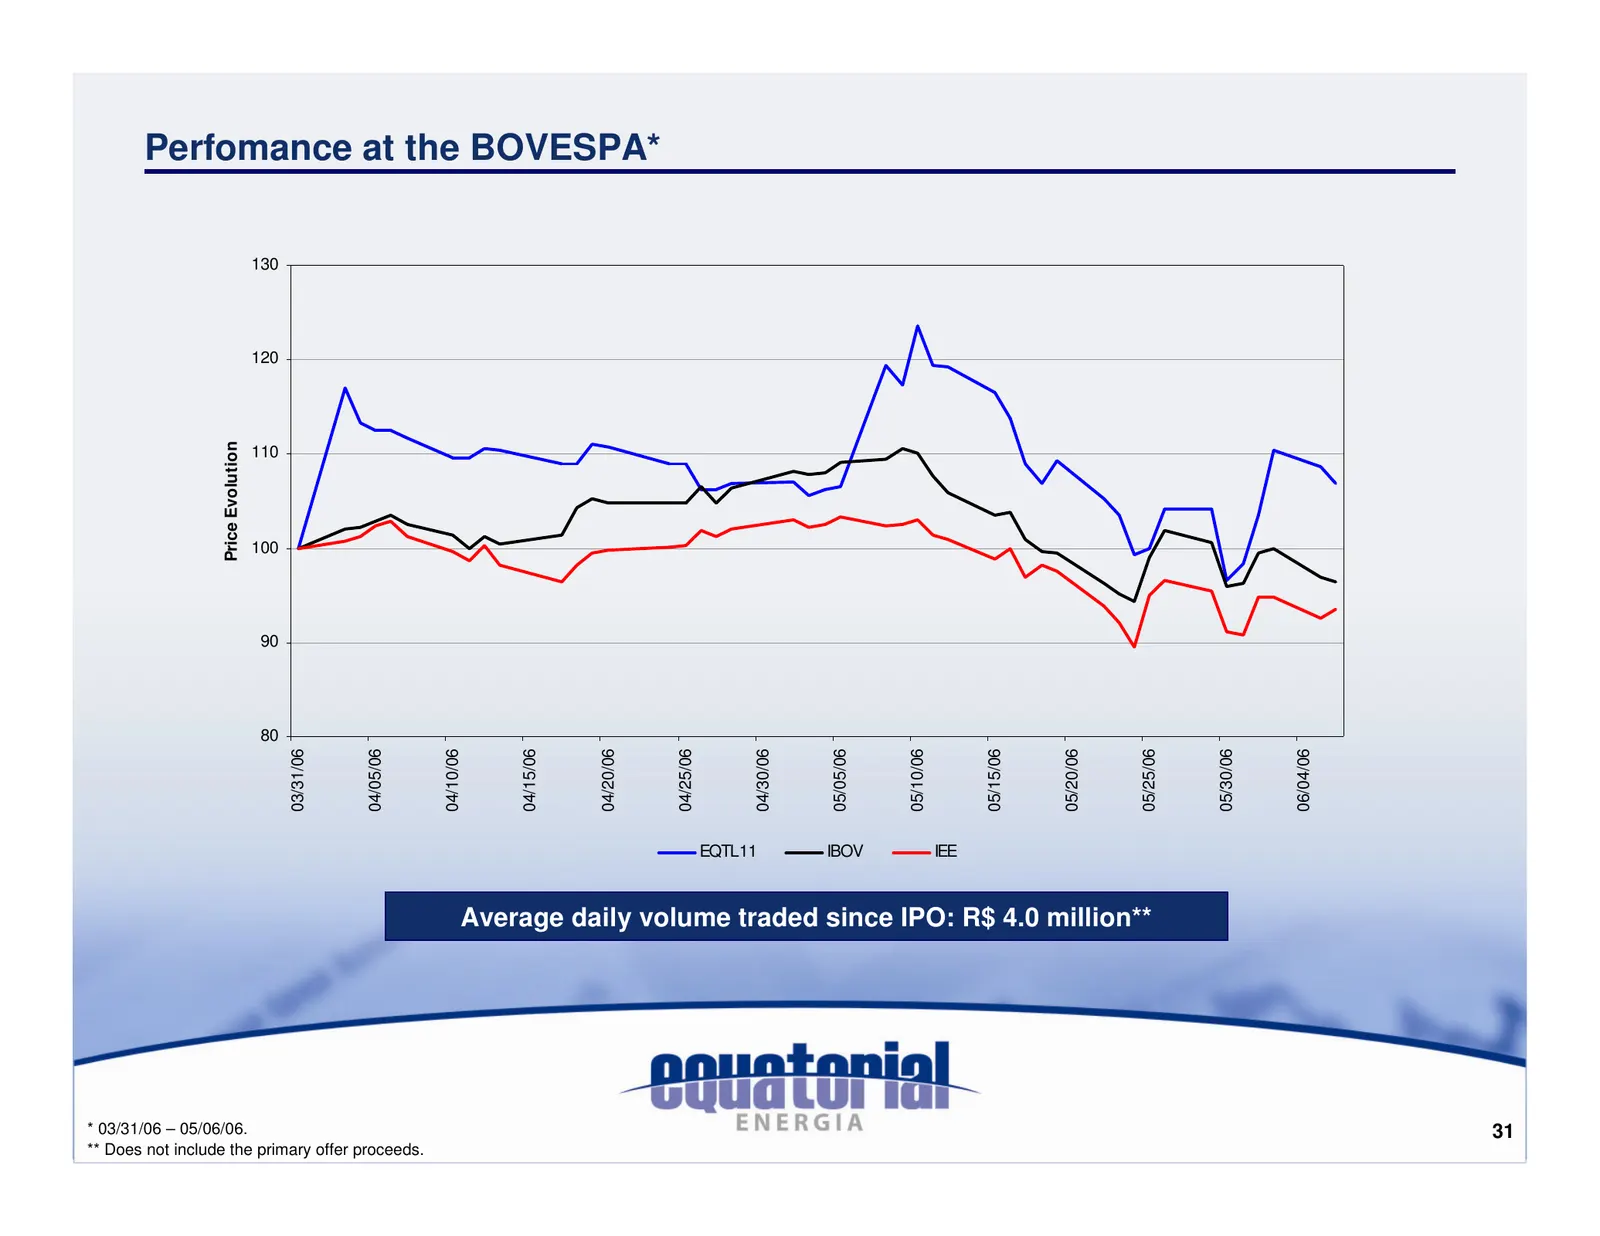
Perfomance at the BOVESPA* 130 120 Price Evolution 110 100 90 80 03/31/06 04/05/06 04/10/06 04/15/06 04/20/06 04/25/06 04/30/06 05/05/06 05/10/06 05/15/06 05/20/06 05/25/06 05/30/06 06/04/06 EQTL11 IBOV IEE Average daily volume traded since IPO: R$ 4.0 million** * 03/31/06 – 05/06/06. 31 ** Does not
Slide 32: Agenda
Agenda Company Overview Successful Turnaround at CEMAR Growth Opportunities 1Q06 Financial and Operating Results Performance at the BOVESPA Summary 32
Slide 33: Summary
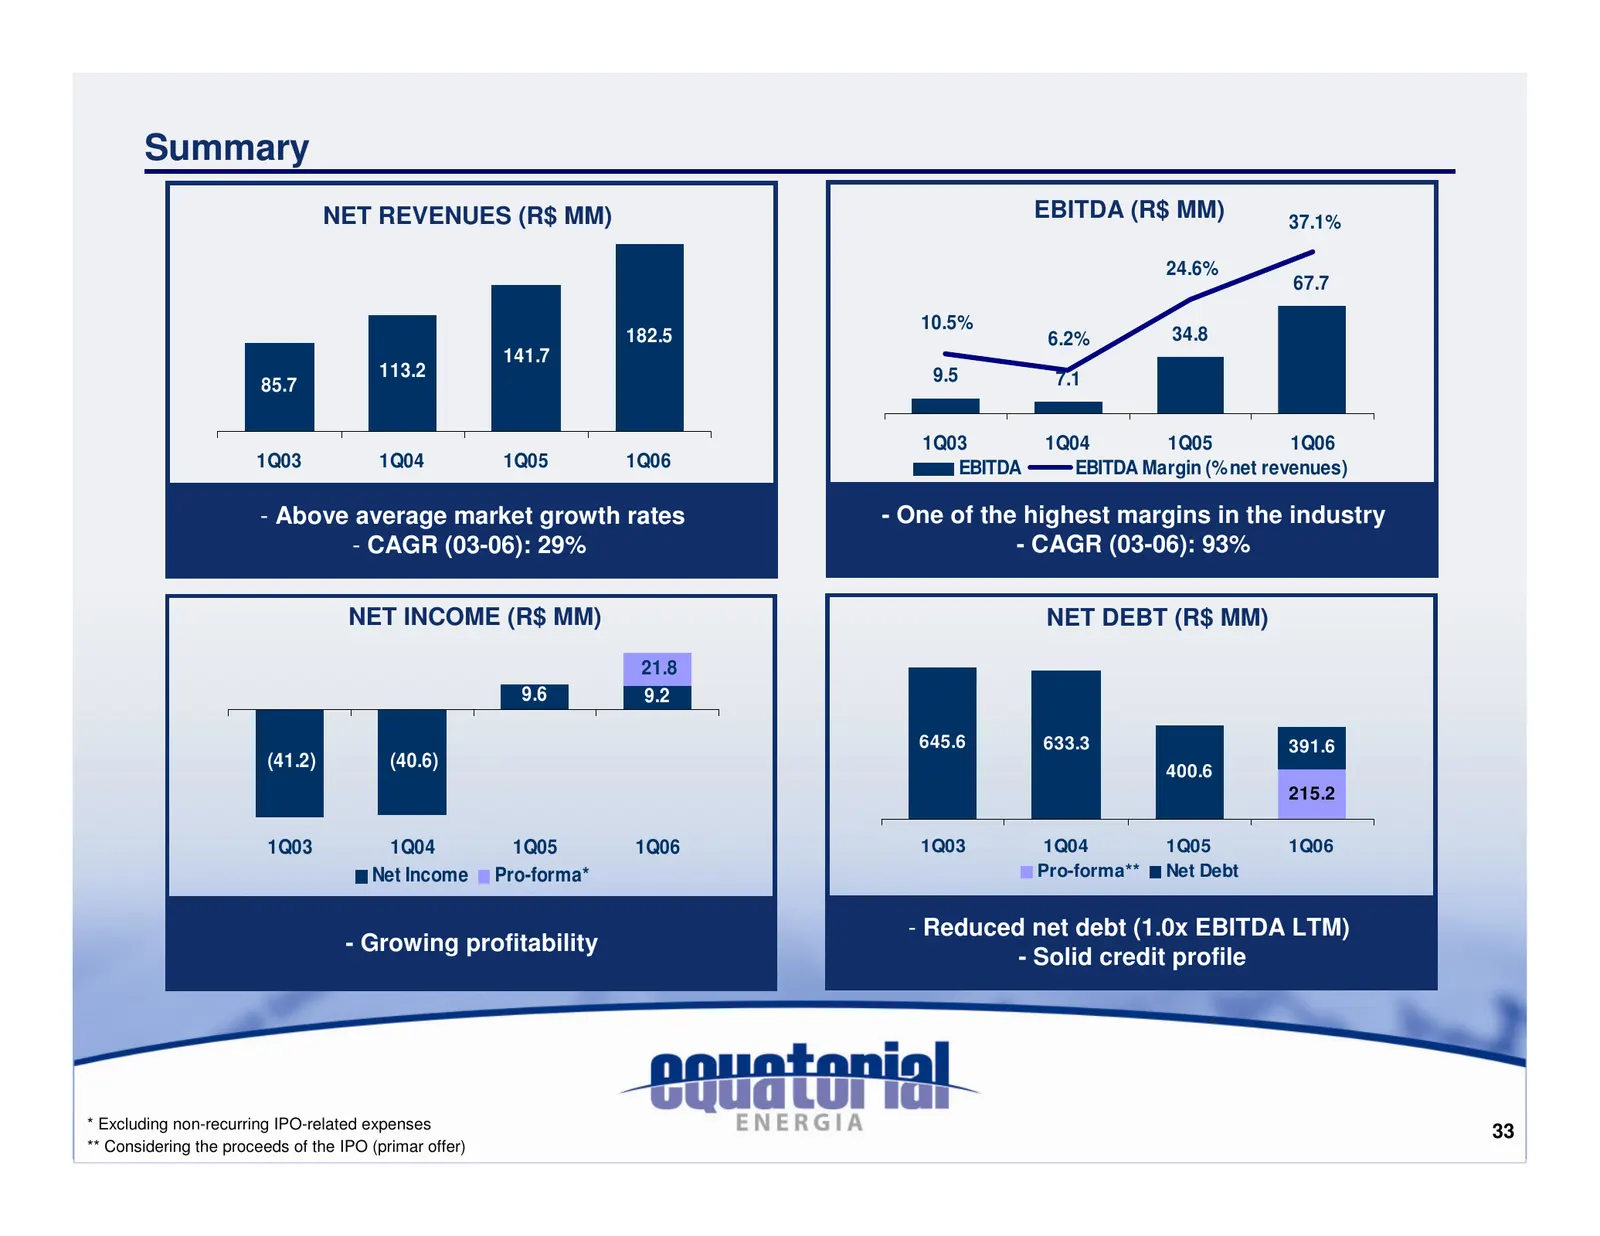
Summary NET REVENUES (R$ MM) EBITDA (R$ MM) 37.1% 24.6% 67.7 10.5% 182.5 6.2% 34.8 141.7 113.2 9.5 7.1 85.7 1Q03 1Q04 1Q05 1Q06 1Q03 1Q04 1Q05 1Q06 EBITDA EBITDA Margin (% net revenues) - Above average market growth rates - One of the highest margins in the industry - CAGR (03-06): 29% - CAGR (03-06
Slide 34: Contact
Contact Phone: + 55 98 3217 2245 E-mail: ri@equatorialenergia.com.br Website: www.equatorialenergia.com.br/ri/ 34
Slide 35: Disclaimer
Disclaimer The following material is a presentation of the general information on EQUATORIAL ENERGIA S/A (EQUATORIAL) as of the present date. It consists of summarized information and makes no attempt to be complete, and should not be considered by potential investors as an investment recommendation
Source: Internet Archive copy of ri.equatorialenergia.com.br
More decks from Equatorial S.A.
 Q2 2026 Earnings Presentation12 slides · Aug 13, 2026
 Q1 2026 Earnings Presentation11 slides · May 14, 2026
 Q4 2025 Earnings Presentation14 slides · Mar 26, 2026
 Q3 2025 Earnings Presentation13 slides · Nov 13, 2025
 Q2 2025 Earnings Presentation11 slides · Aug 14, 2025
 Q1 2025 Earnings Presentation14 slides · May 15, 2025