Astec Industries, Inc. · NASDAQ:ASTE
Astec Industries — Investor Presentation (2018)
23 slides from Astec Industries's investor presentation, 2018

Slide 1: Safety, Quality, Productivity
SAFETY, QUALITY, PRODUCTIVITY
Slide 2: Safe Harbor
Safe 2 Harbor This presentation and discussion may contain forward-looking statements regarding the future performance of the Company, including representations about the Company's future financial performance, market conditions, the long-term growth prospects of the Company and its markets, opportu
Slide 3: Mission Statement & Core Values
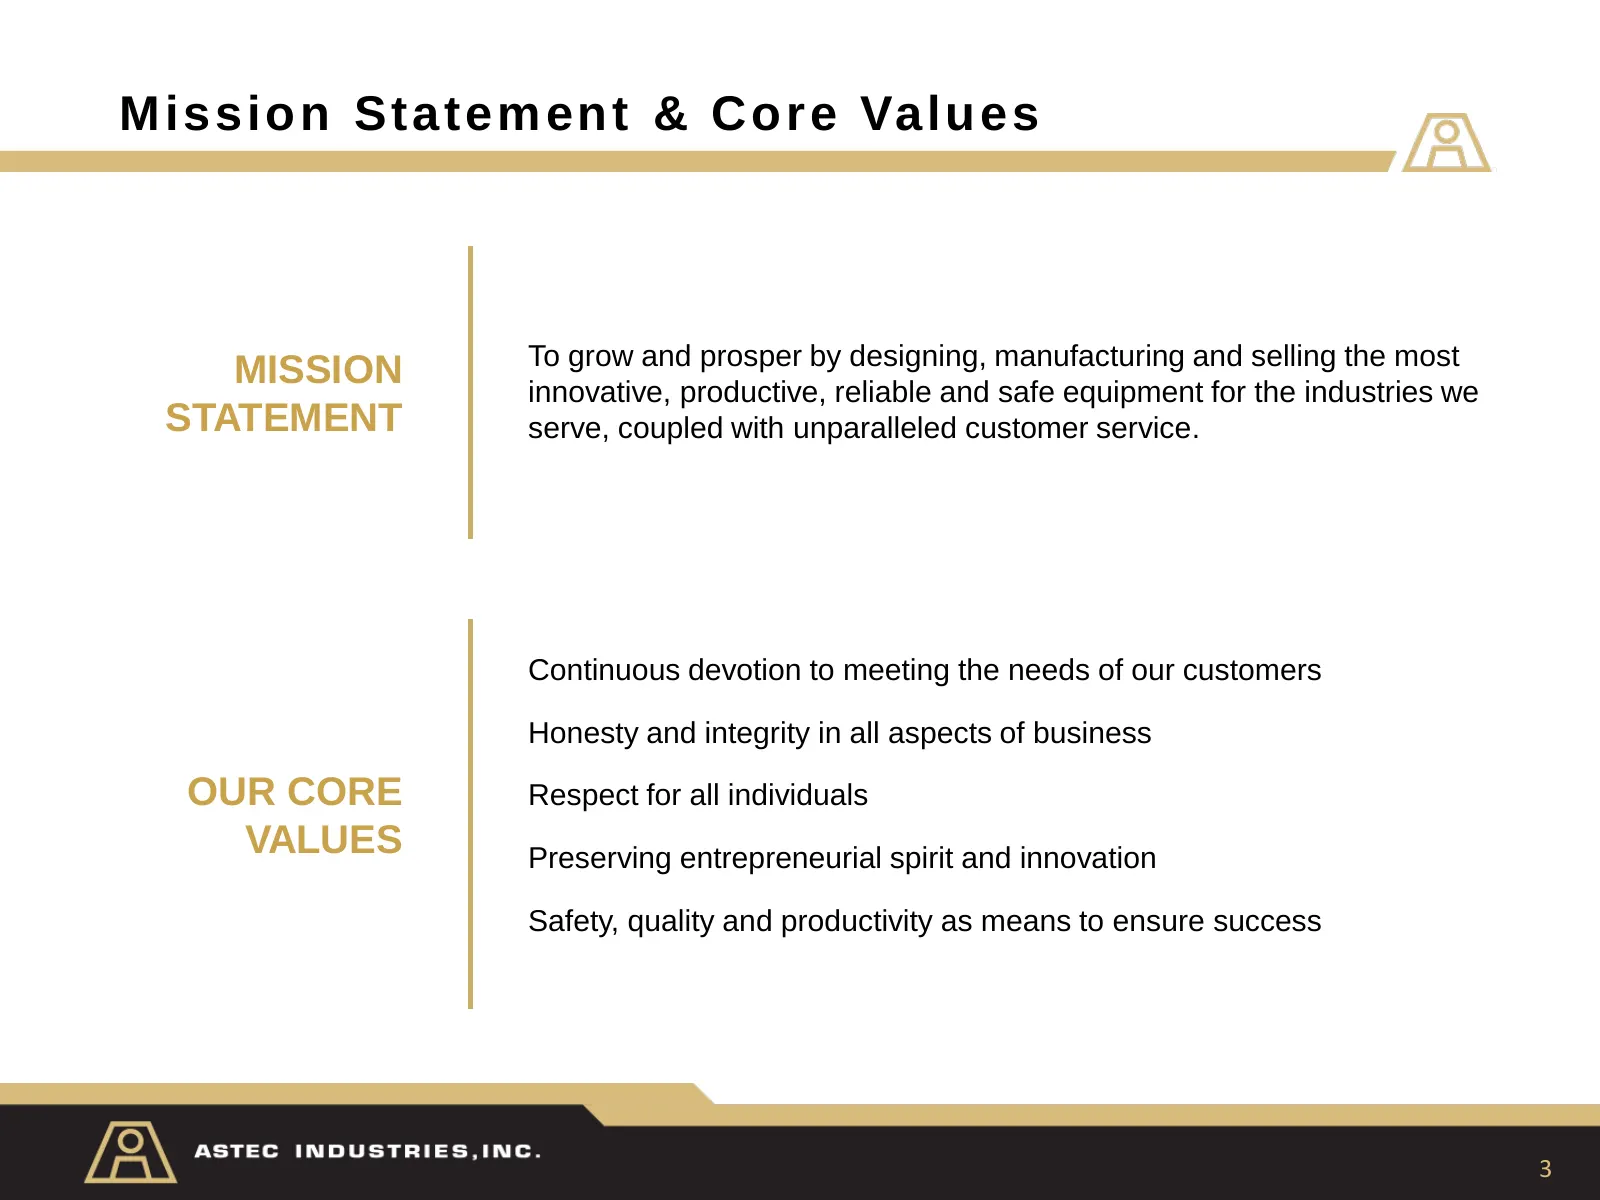
Mission Statement & Core Values To grow and prosper by designing, manufacturing and selling the most MISSION innovative, productive, reliable and safe equipment for the industries we STATEMENT serve, coupled with unparalleled customer service. Continuous devotion to meeting the needs of our customer
Slide 4: Who We Are
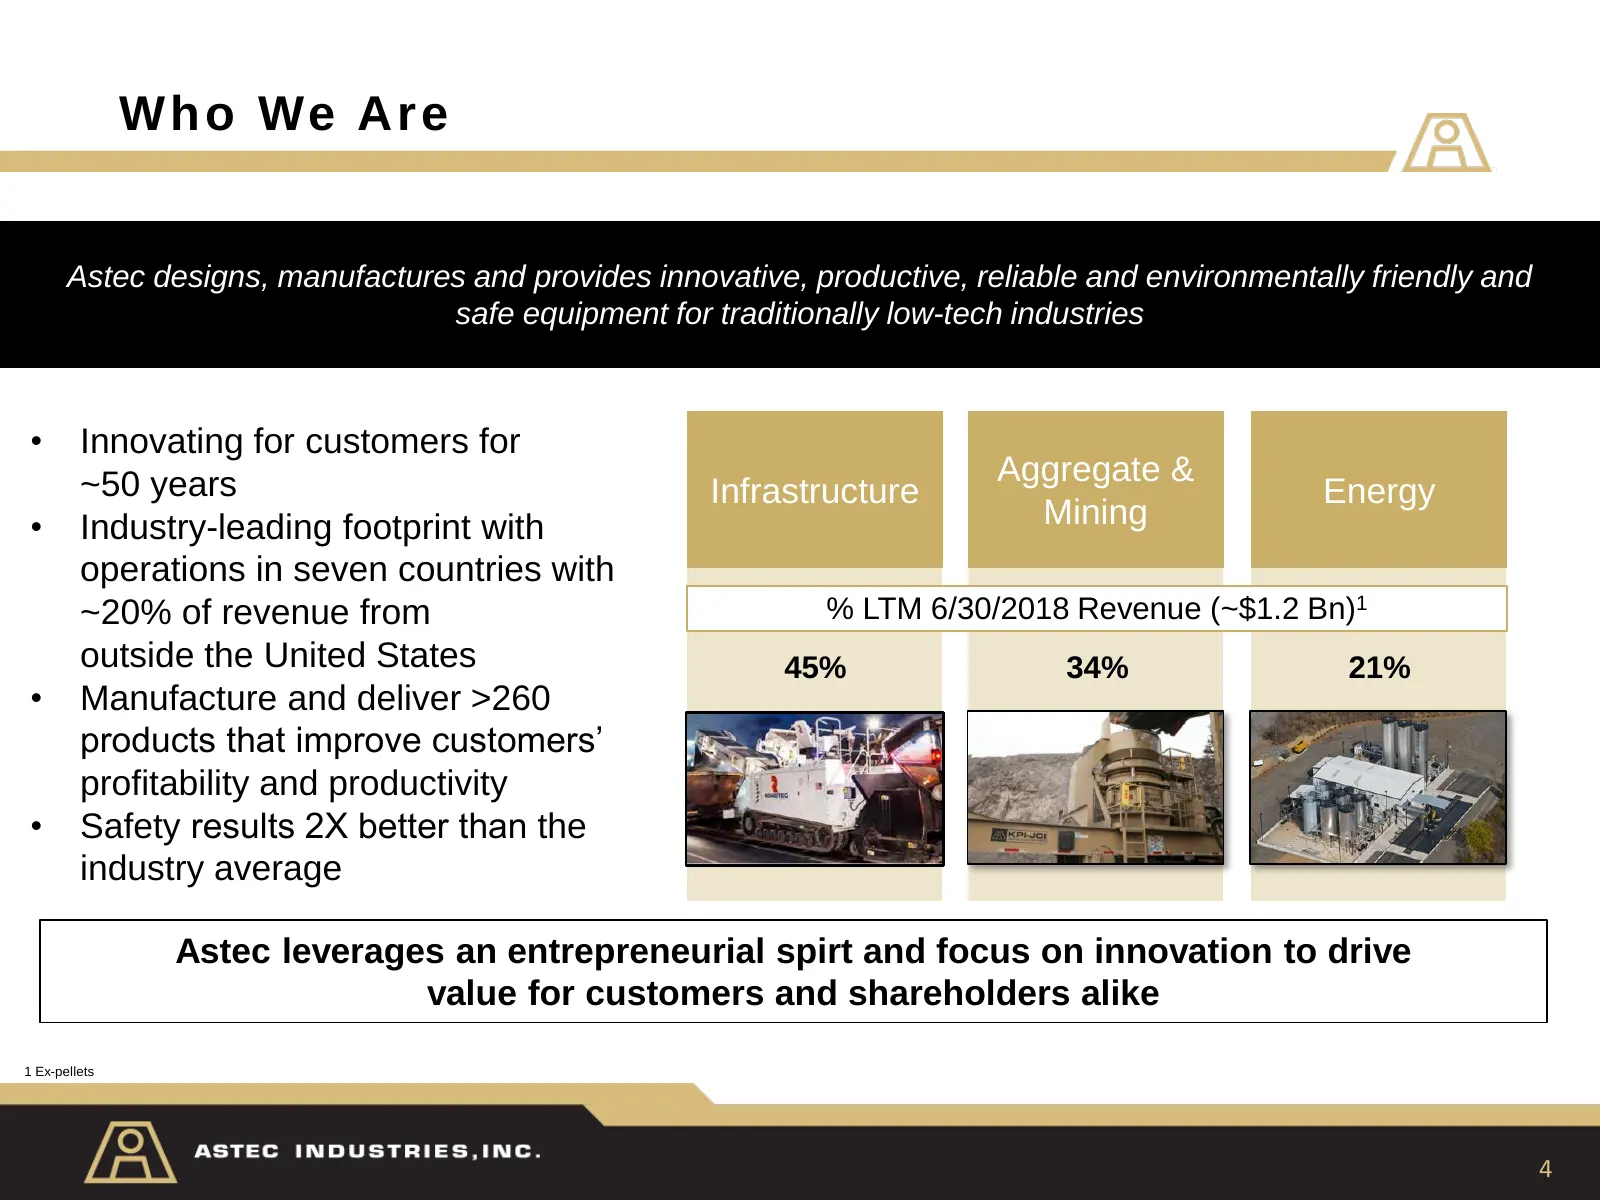
Who We Are Astec designs, manufactures and provides innovative, productive, reliable and environmentally friendly and safe equipment for traditionally low-tech industries • Innovating for customers for ~50 years Aggregate & Infrastructure Energy • Industry-leading footprint with Mining operations in
Slide 5: A Compelling Investment Opportunity
A Compellin g Investment Opport u ni t y • Leadership positions in attractive niche markets • Operate in industries with favorable market dynamics benefitting from population growth, urbanization and aging infrastructure • Industry-leading reputation for innovation, high-quality products and superio
Slide 6: Attractive End Market Trends
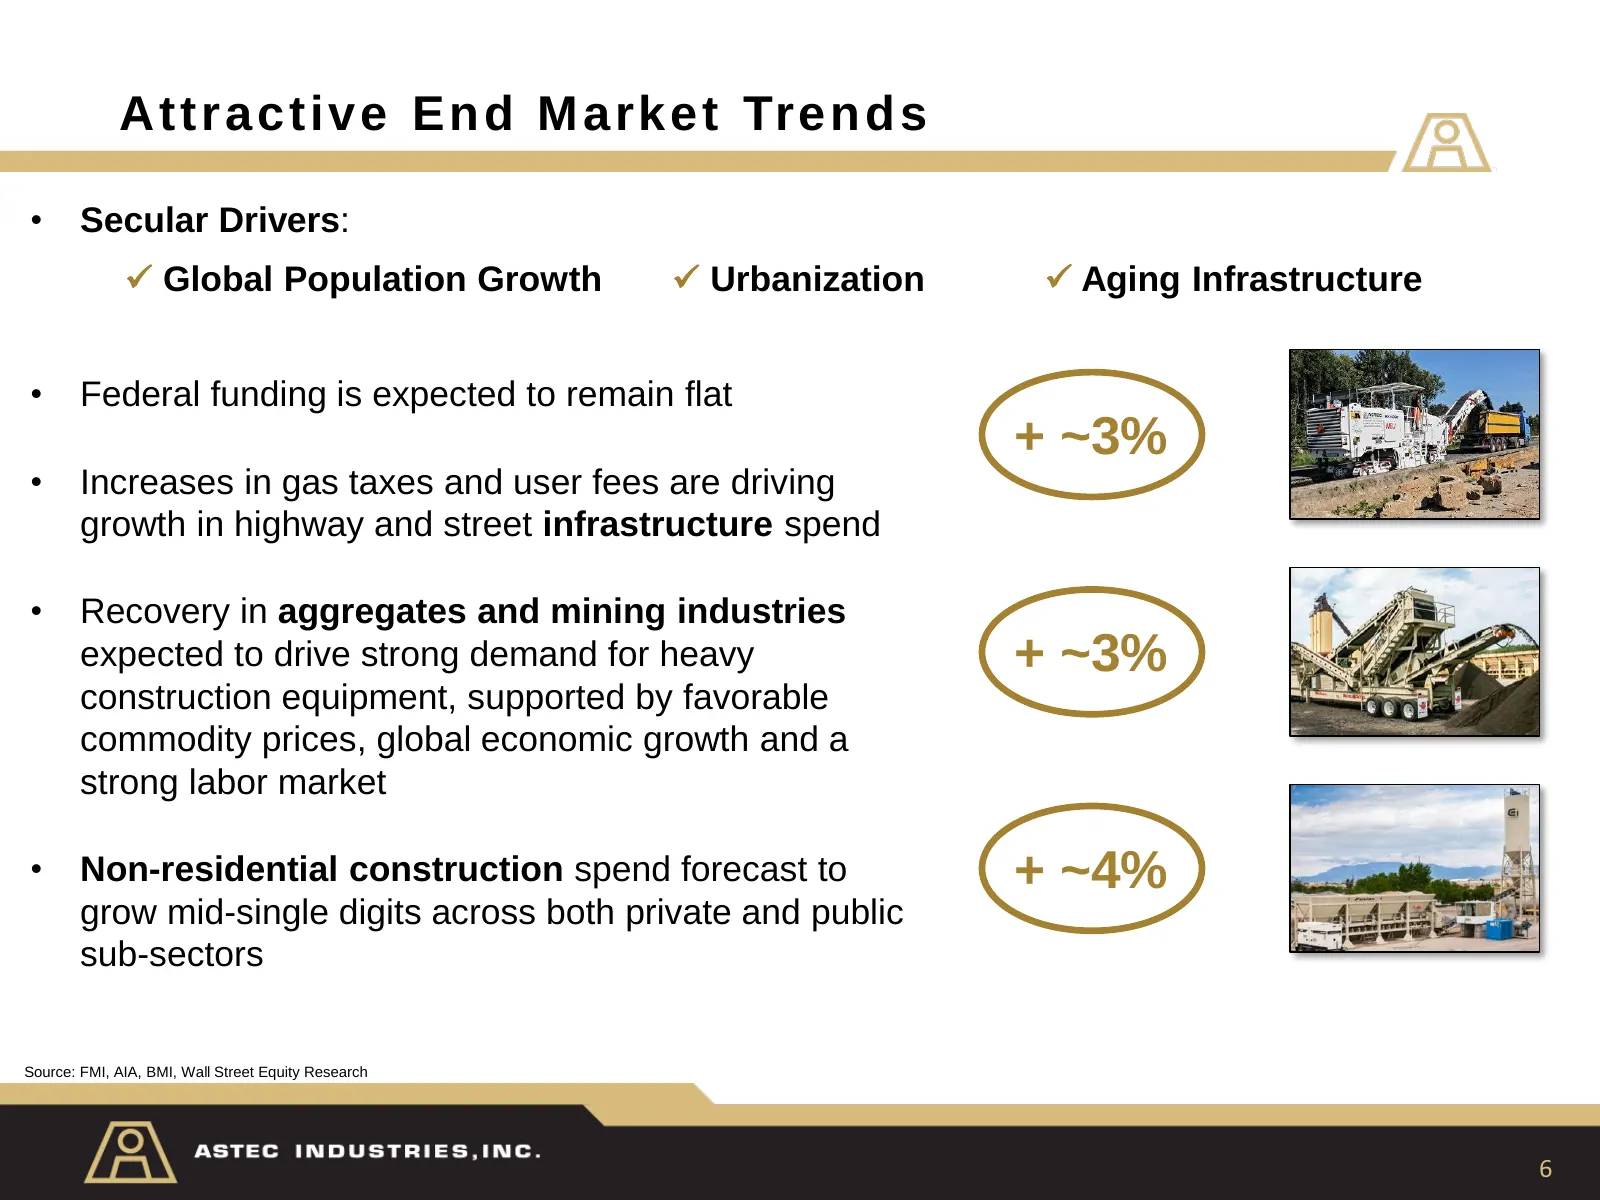
Attractive End Market Trends • Secular Drivers: Global Population Growth Urbanization Aging Infrastructure • Federal funding is expected to remain flat + ~3% • Increases in gas taxes and user fees are driving growth in highway and street infrastructure spend • Recovery in aggregates and mining
Slide 7: Strategy to Drive Revenue and Earnings Growth
Strateg y to Drive Revenue and Earnings Grow th Continue to strengthen core business by investing in organic growth Increase company-wide profitability through initiatives to increase gross margin and by maintaining discipline on overhead costs Carry on a tradition of innovation (82 R&D produc
Slide 8: Infrastructure
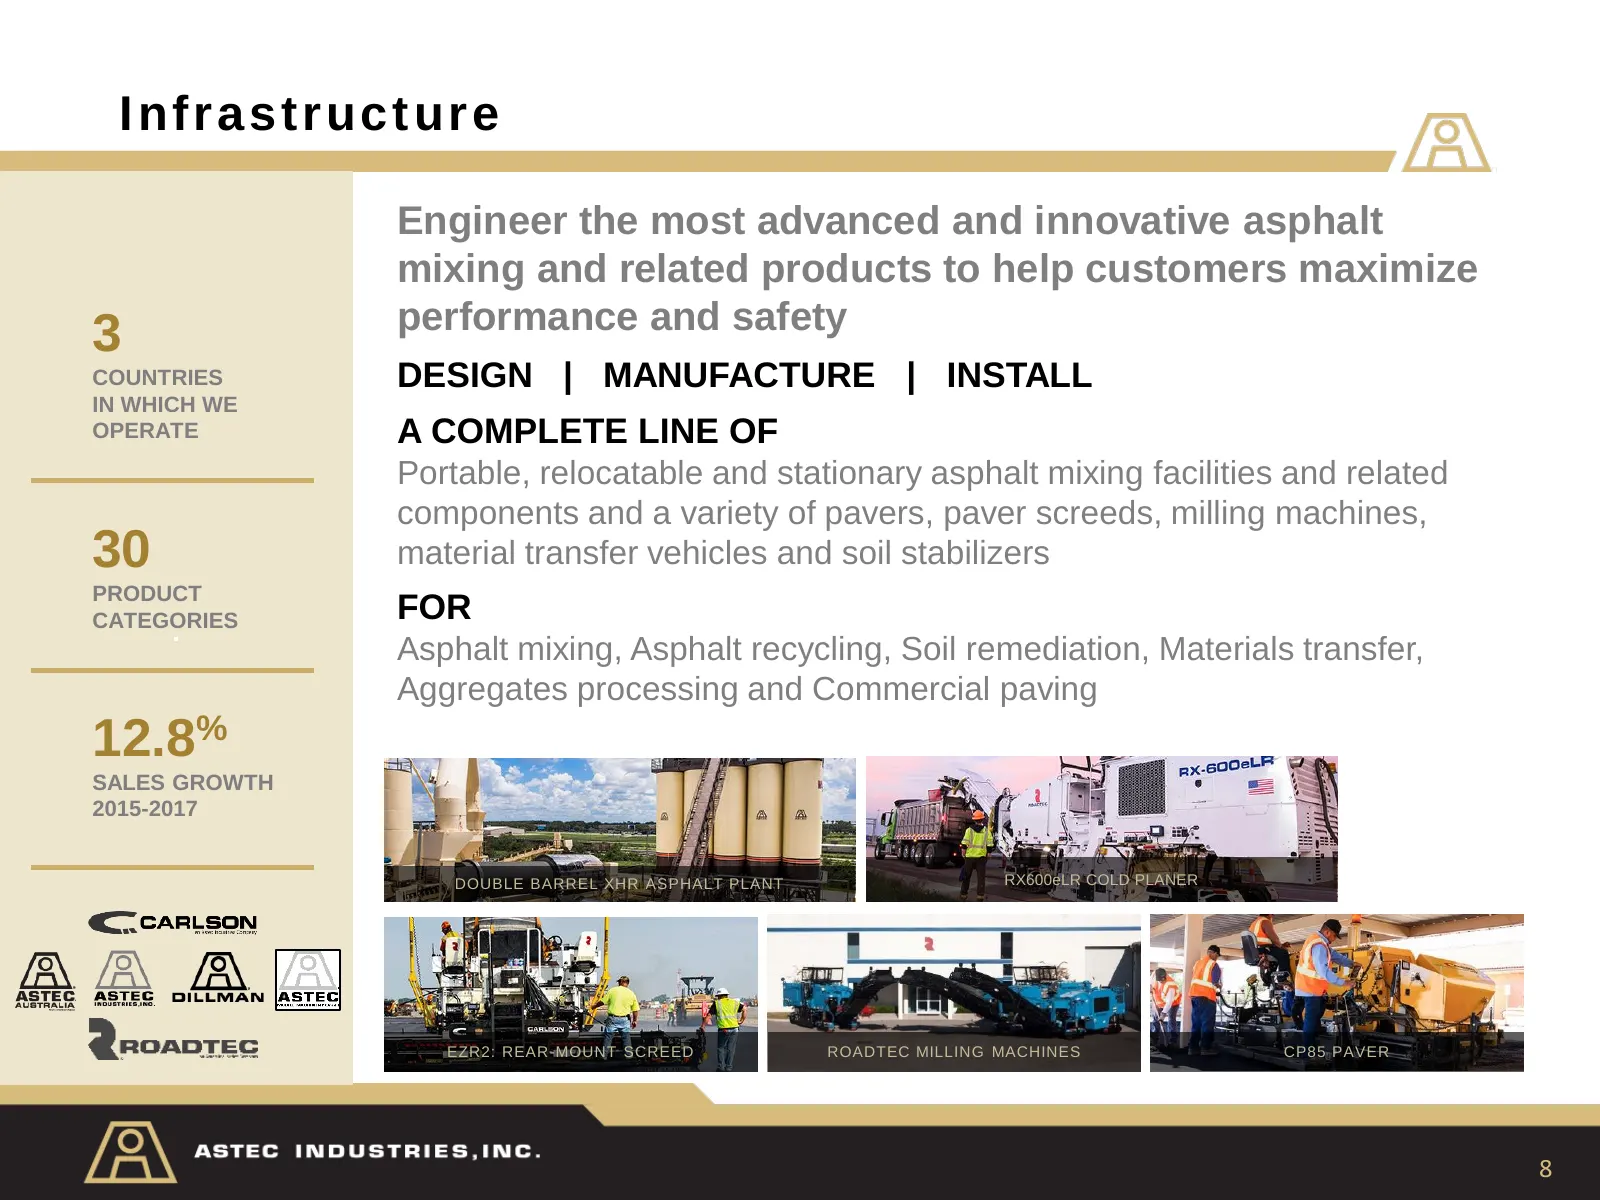
Infrastruc t ure Engineer the most advanced and innovative asphalt mixing and related products to help customers maximize performance and safety 3 COUNTRIES DESIGN | MANUFACTURE | INSTALL IN WHICH WE OPERATE A COMPLETE LINE OF Portable, relocatable and stationary asphalt mixing facilities and relate
Slide 9: Aggregate & Mining
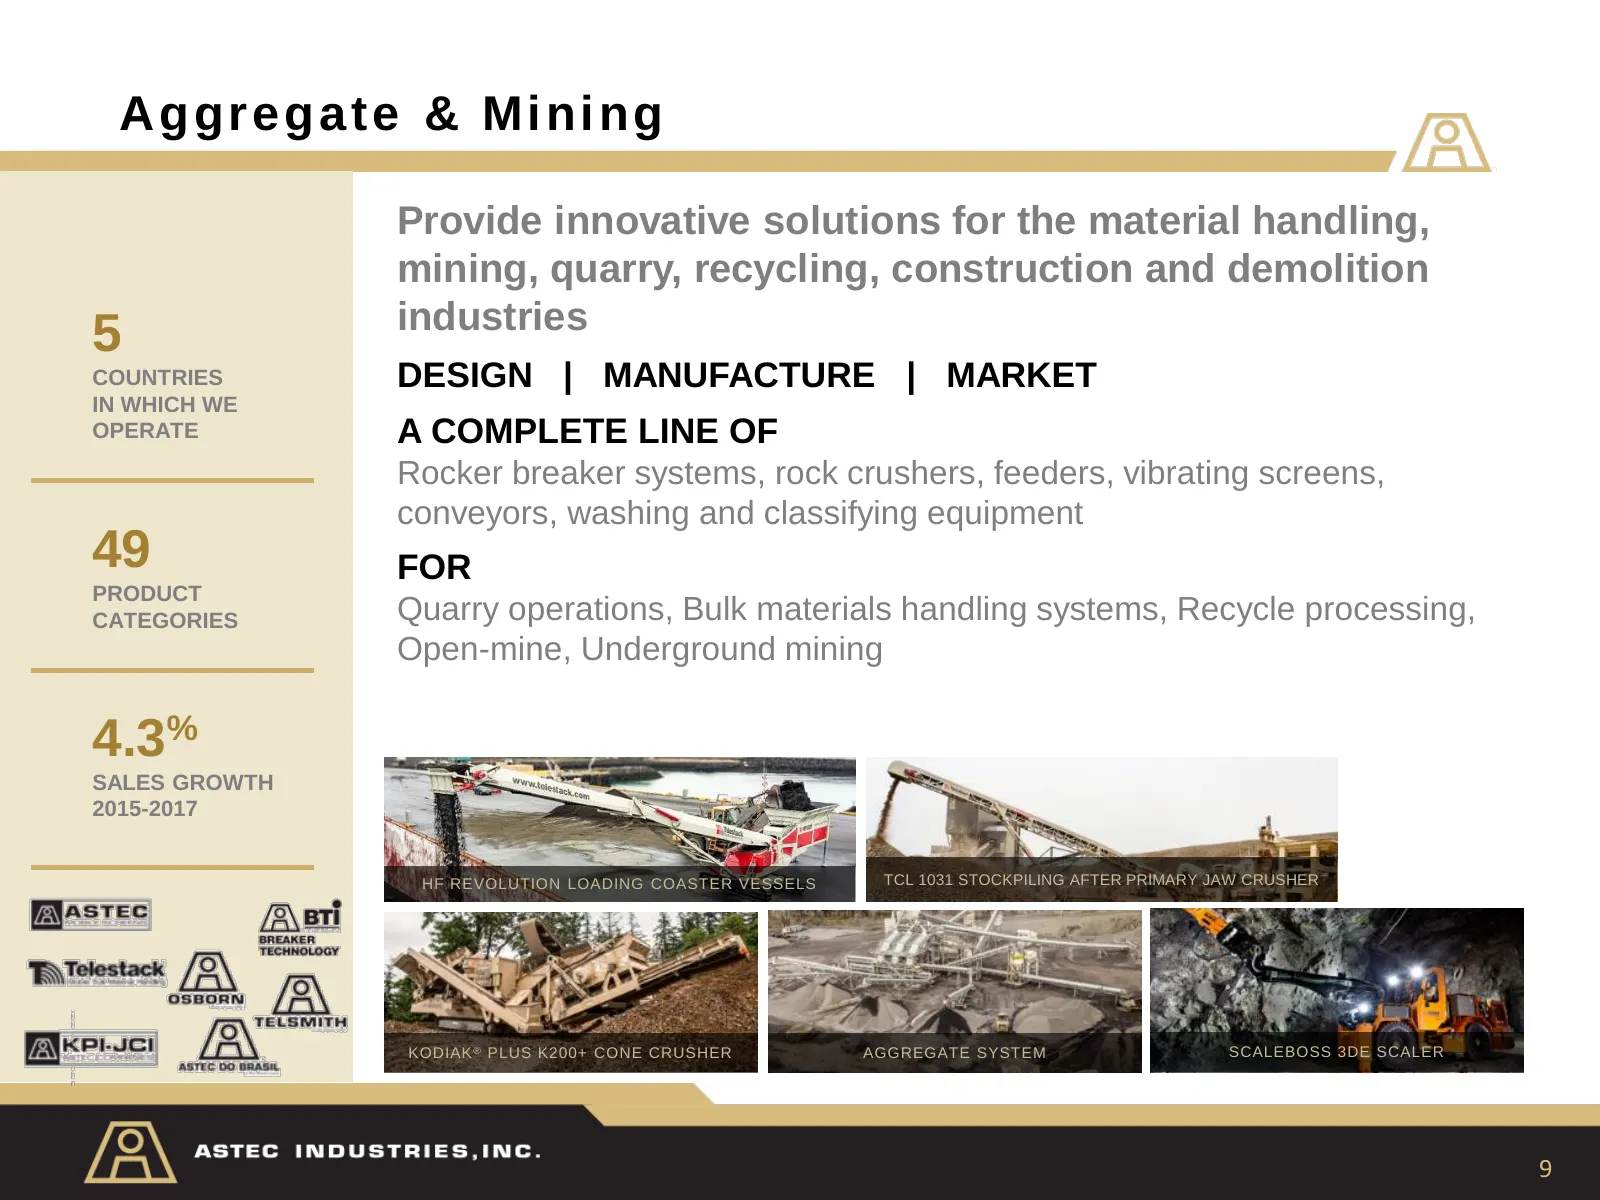
Aggregate & Mining Provide innovative solutions for the material handling, mining, quarry, recycling, construction and demolition industries 5 COUNTRIES DESIGN | MANUFACTURE | MARKET IN WHICH WE OPERATE A COMPLETE LINE OF Rocker breaker systems, rock crushers, feeders, vibrating screens, conveyors,
Slide 10: Energy
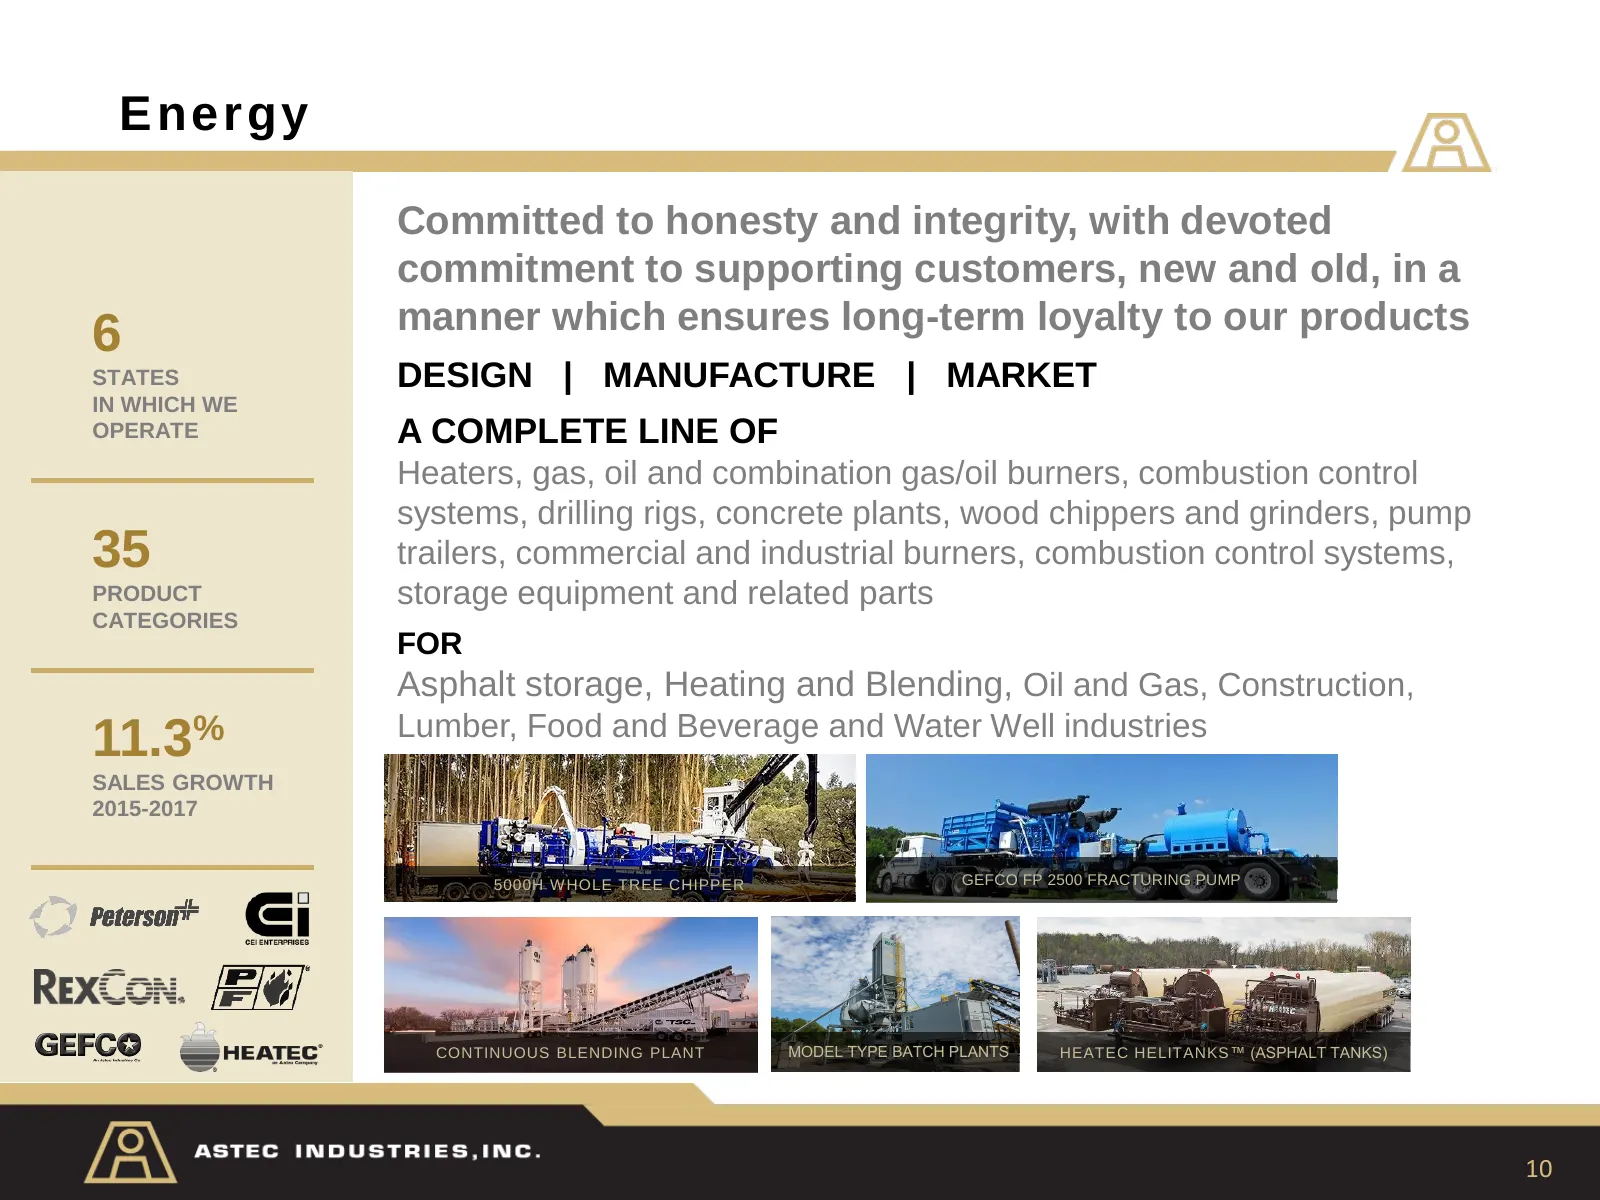
Energy Committed to honesty and integrity, with devoted commitment to supporting customers, new and old, in a manner which ensures long-term loyalty to our products 6 STATES DESIGN | MANUFACTURE | MARKET IN WHICH WE OPERATE A COMPLETE LINE OF Heaters, gas, oil and combination gas/oil burners, combus
Slide 11: Delivering on Our Commitment to Enhance Shareholder Value
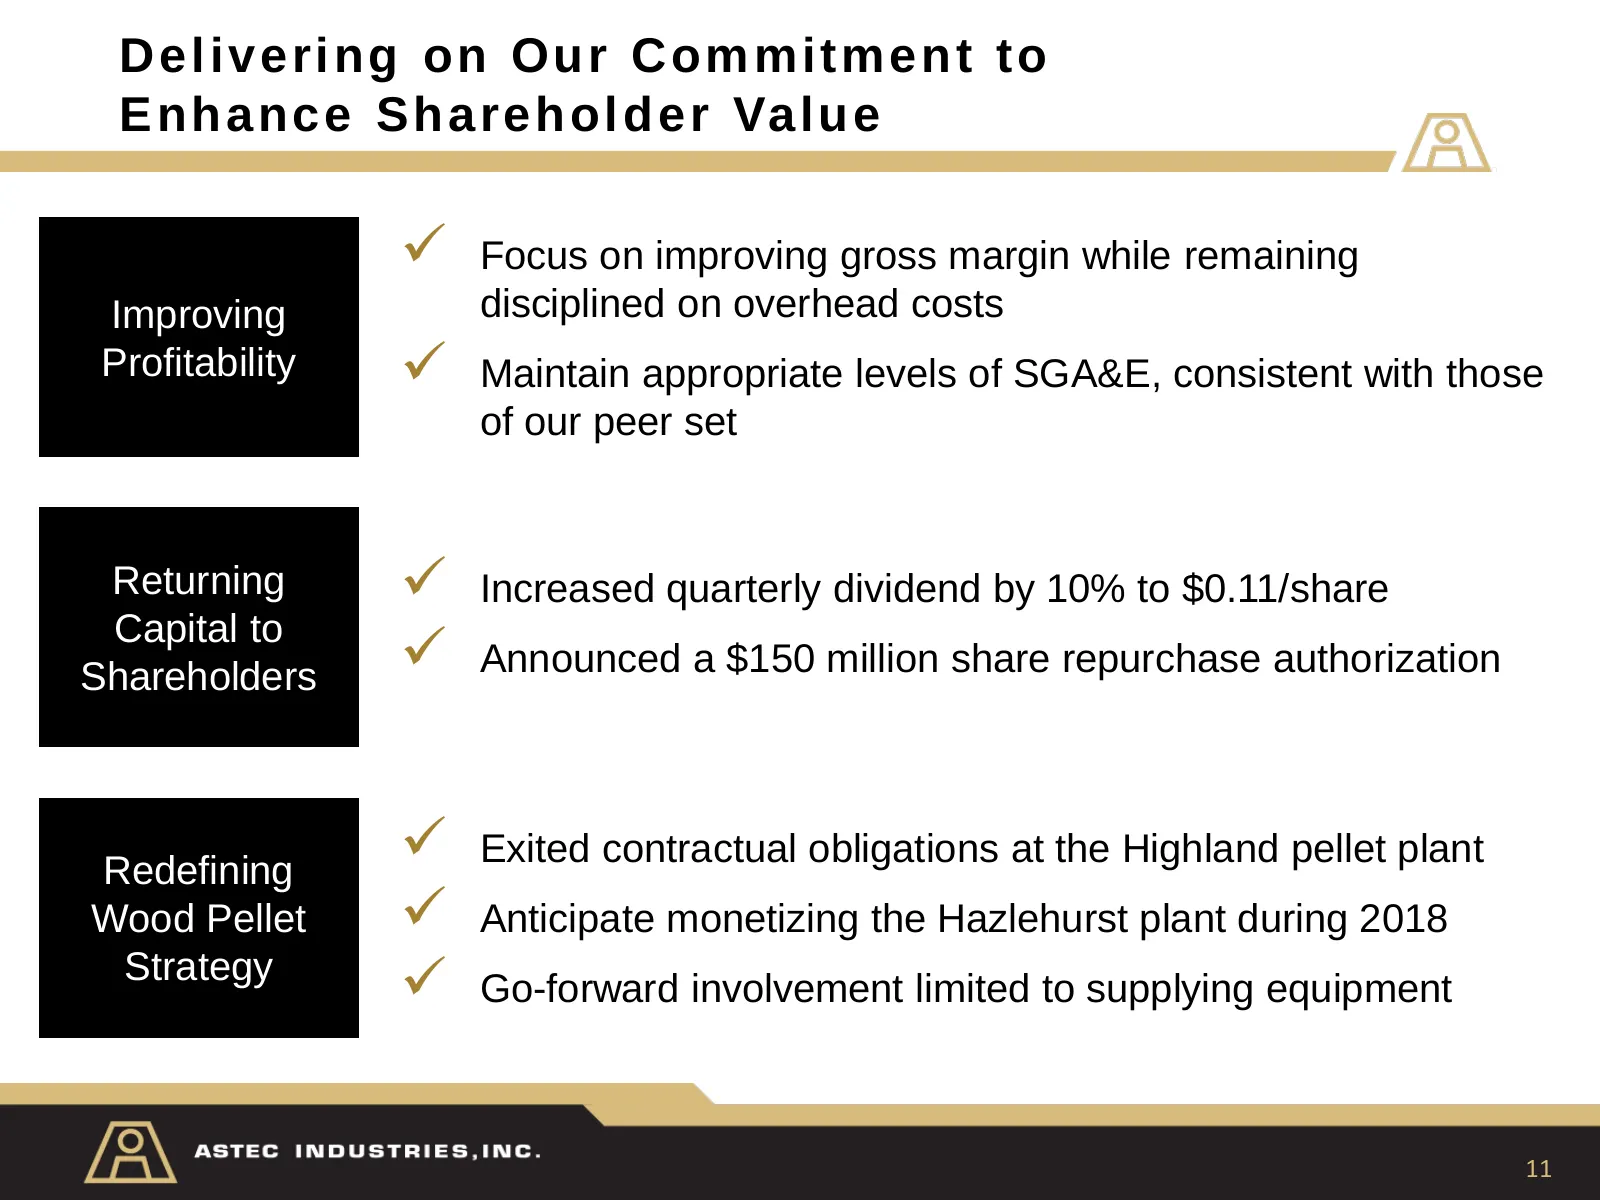
Delivering on Our Commitment to Enhance Sharehold er Value Focus on improving gross margin while remaining Improving disciplined on overhead costs Profitability Maintain appropriate levels of SGA&E, consistent with those of our peer set Returning Increased quarterly dividend by 10% to $0.11/sh
Slide 12: We are Actively Improving our Procurement Function
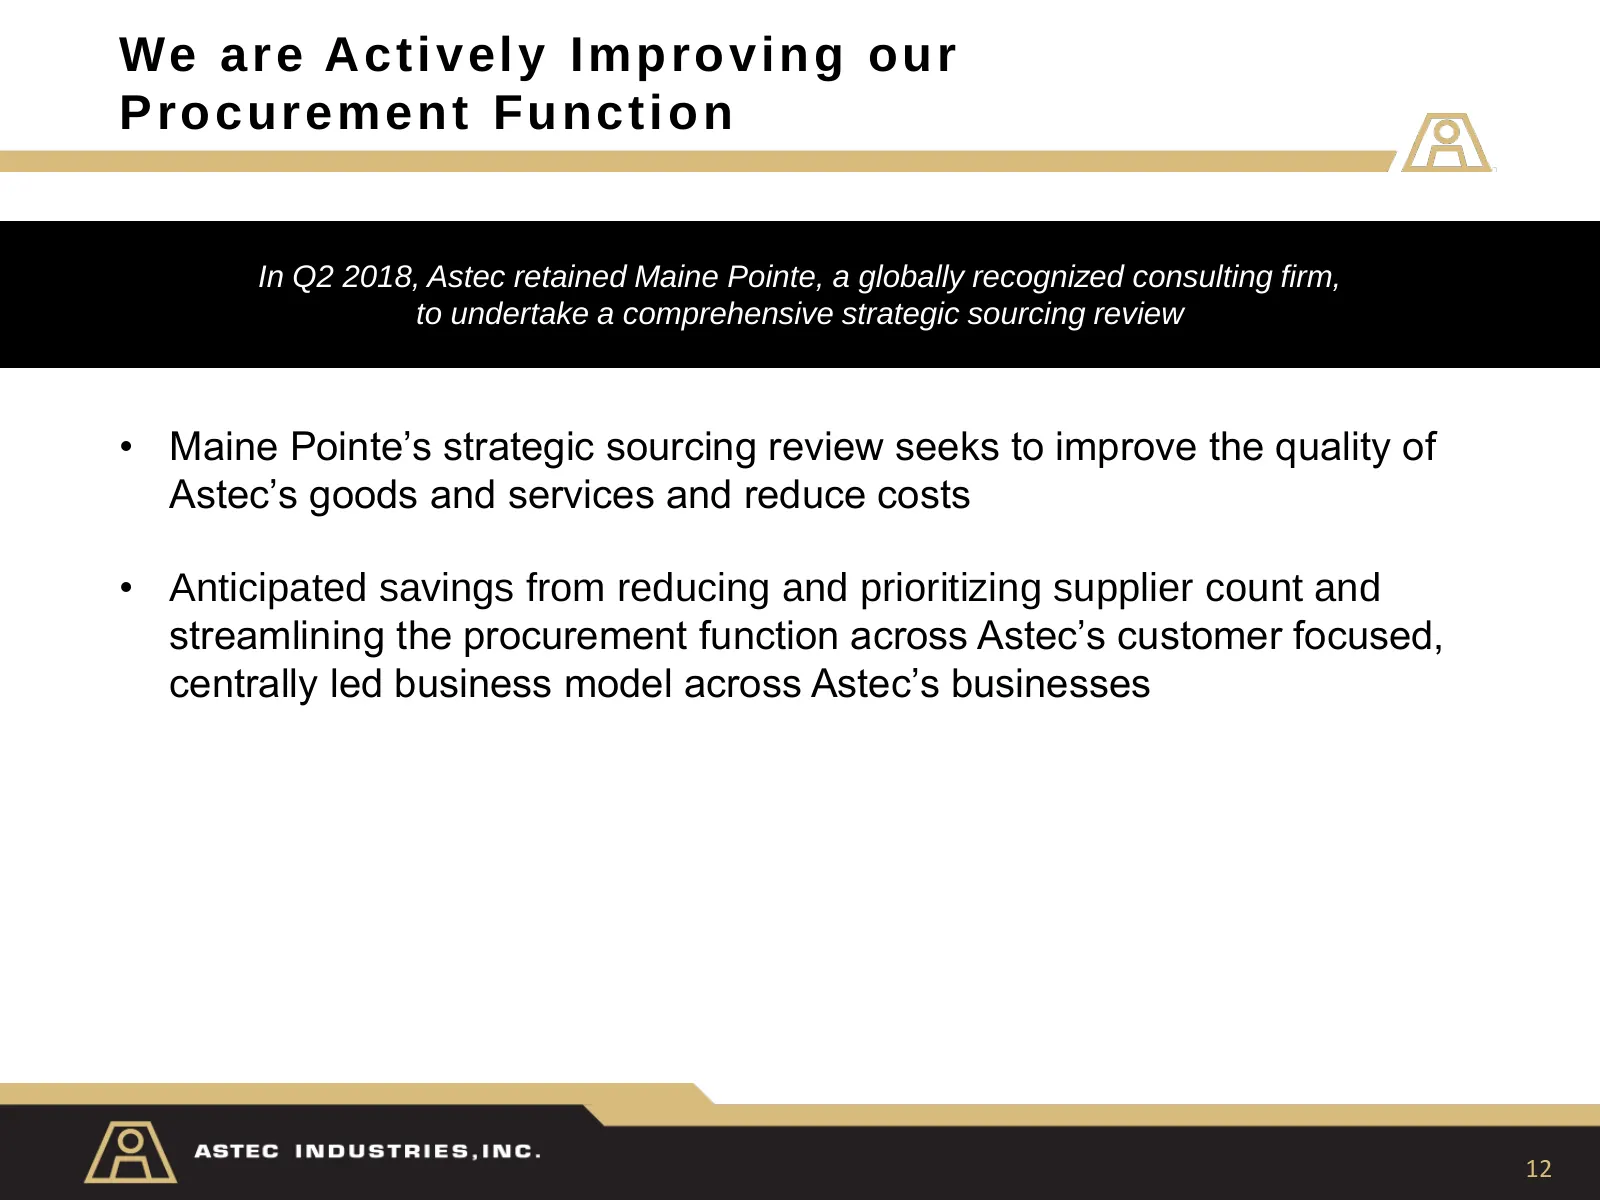
We are Activel y Improving our Procurement Functio n In Q2 2018, Astec retained Maine Pointe, a globally recognized consulting firm, to undertake a comprehensive strategic sourcing review • Maine Pointe’s strategic sourcing review seeks to improve the quality of Astec’s goods and services and reduce
Slide 13: Recurring, High-Margin Parts Sales
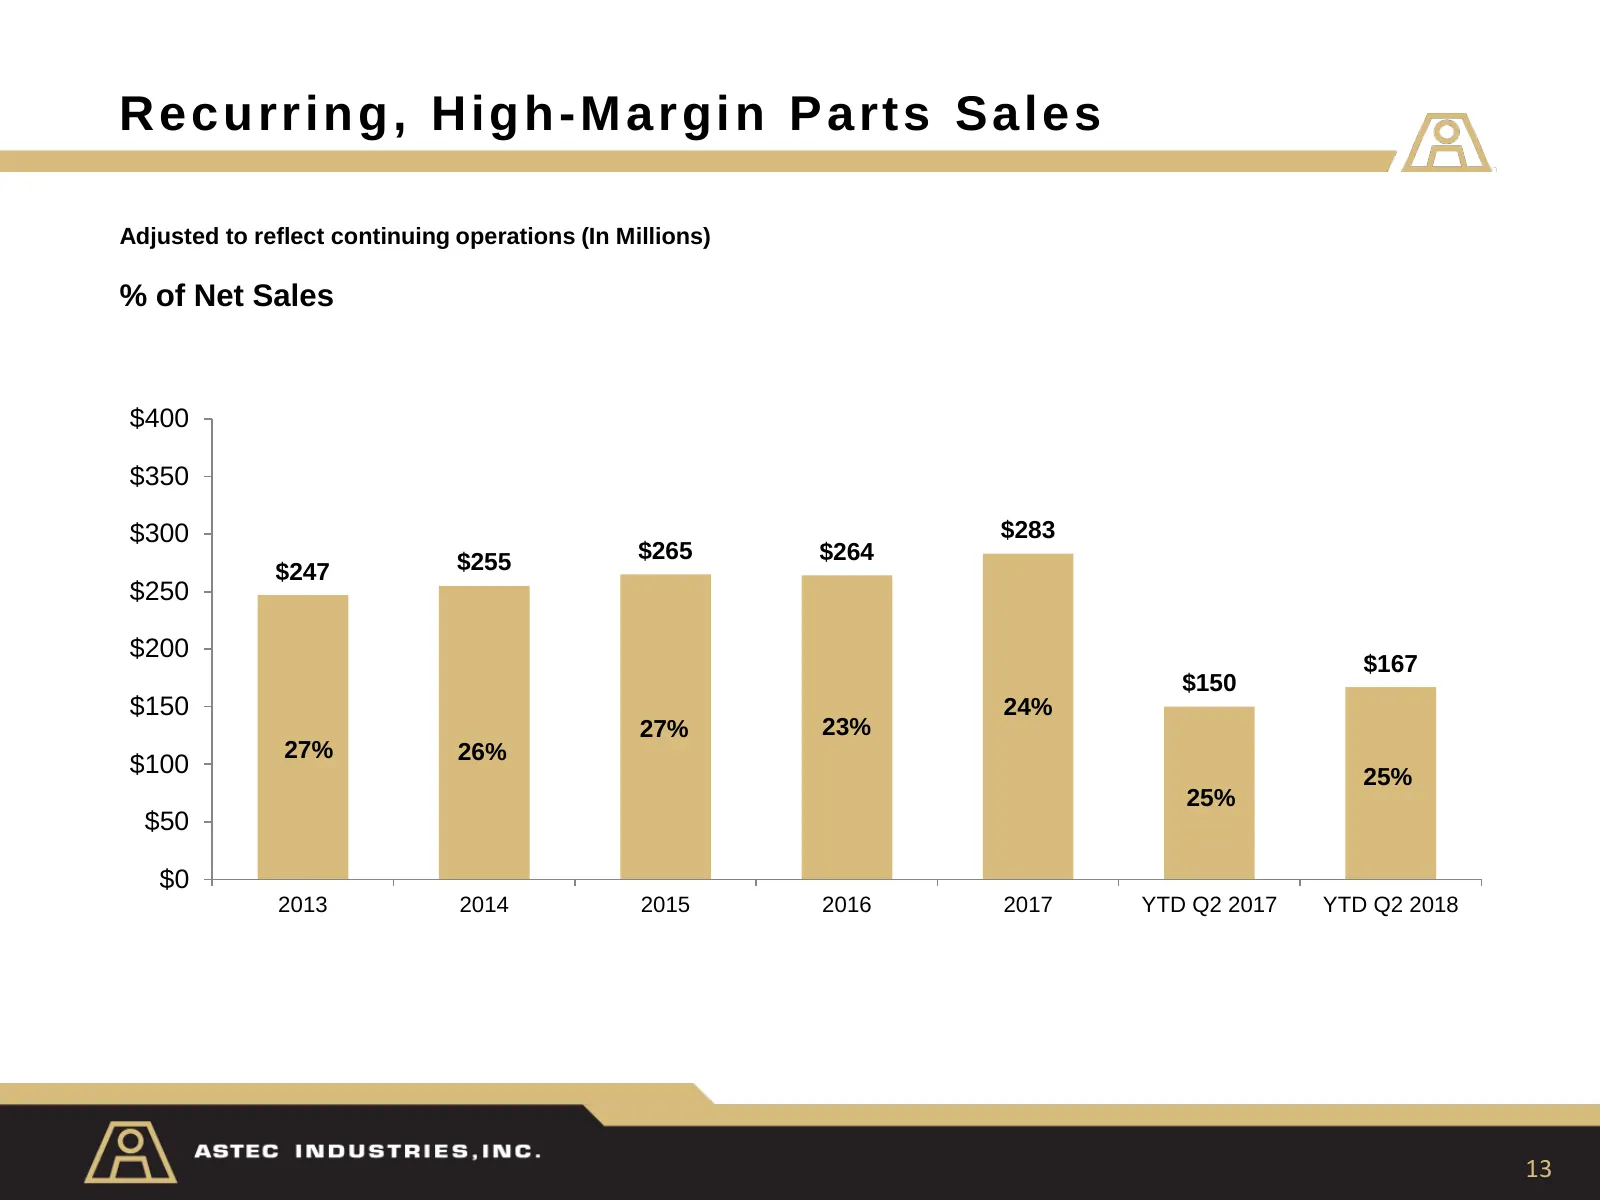
Recurring, High -M ar gi n Parts Sales Adjusted to reflect continuing operations (In Millions) % of Net Sales $400 $350 $300 $283 $255 $265 $264 $247 $250 $200 $167 $150 $150 24% 27% 23% 27% 26% $100 25% 25% $50 $0 2013 2014 2015 2016 2017 YTD Q2 2017 YTD Q2 2018 13
Slide 14: Disciplined Approach to Reducing Overhead Expenses
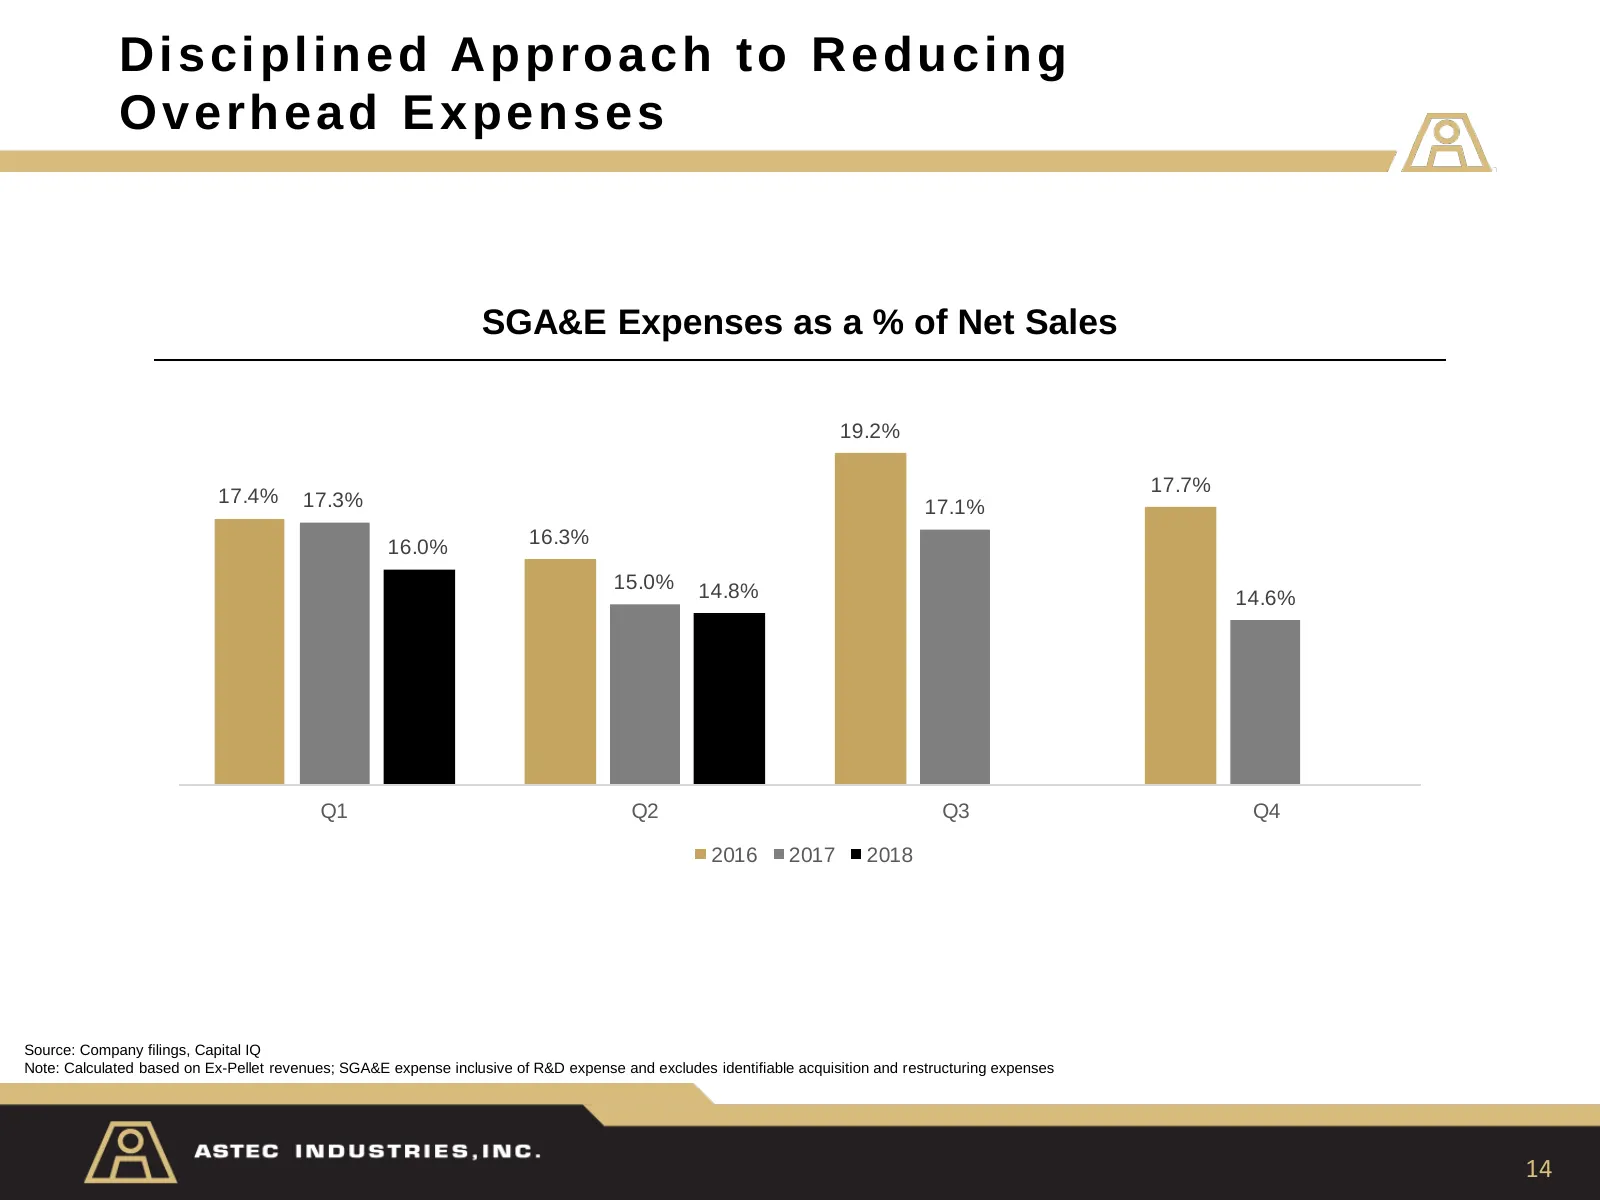
Discipline d Approach to Reducing Overhead Expenses SGA&E Expenses as a % of Net Sales 19.2% 17.7% 17.4% 17.3% 17.1% 16.0% 16.3% 15.0% 14.8% 14.6% Q1 Q2 Q3 Q4 2016 2017 2018 Source: Company filings, Capital IQ Note: Calculated based on Ex-Pellet revenues; SGA&E expense inclusive of R&D expense and e
Slide 15: Our SGA&E Expenses are In-line with Peers
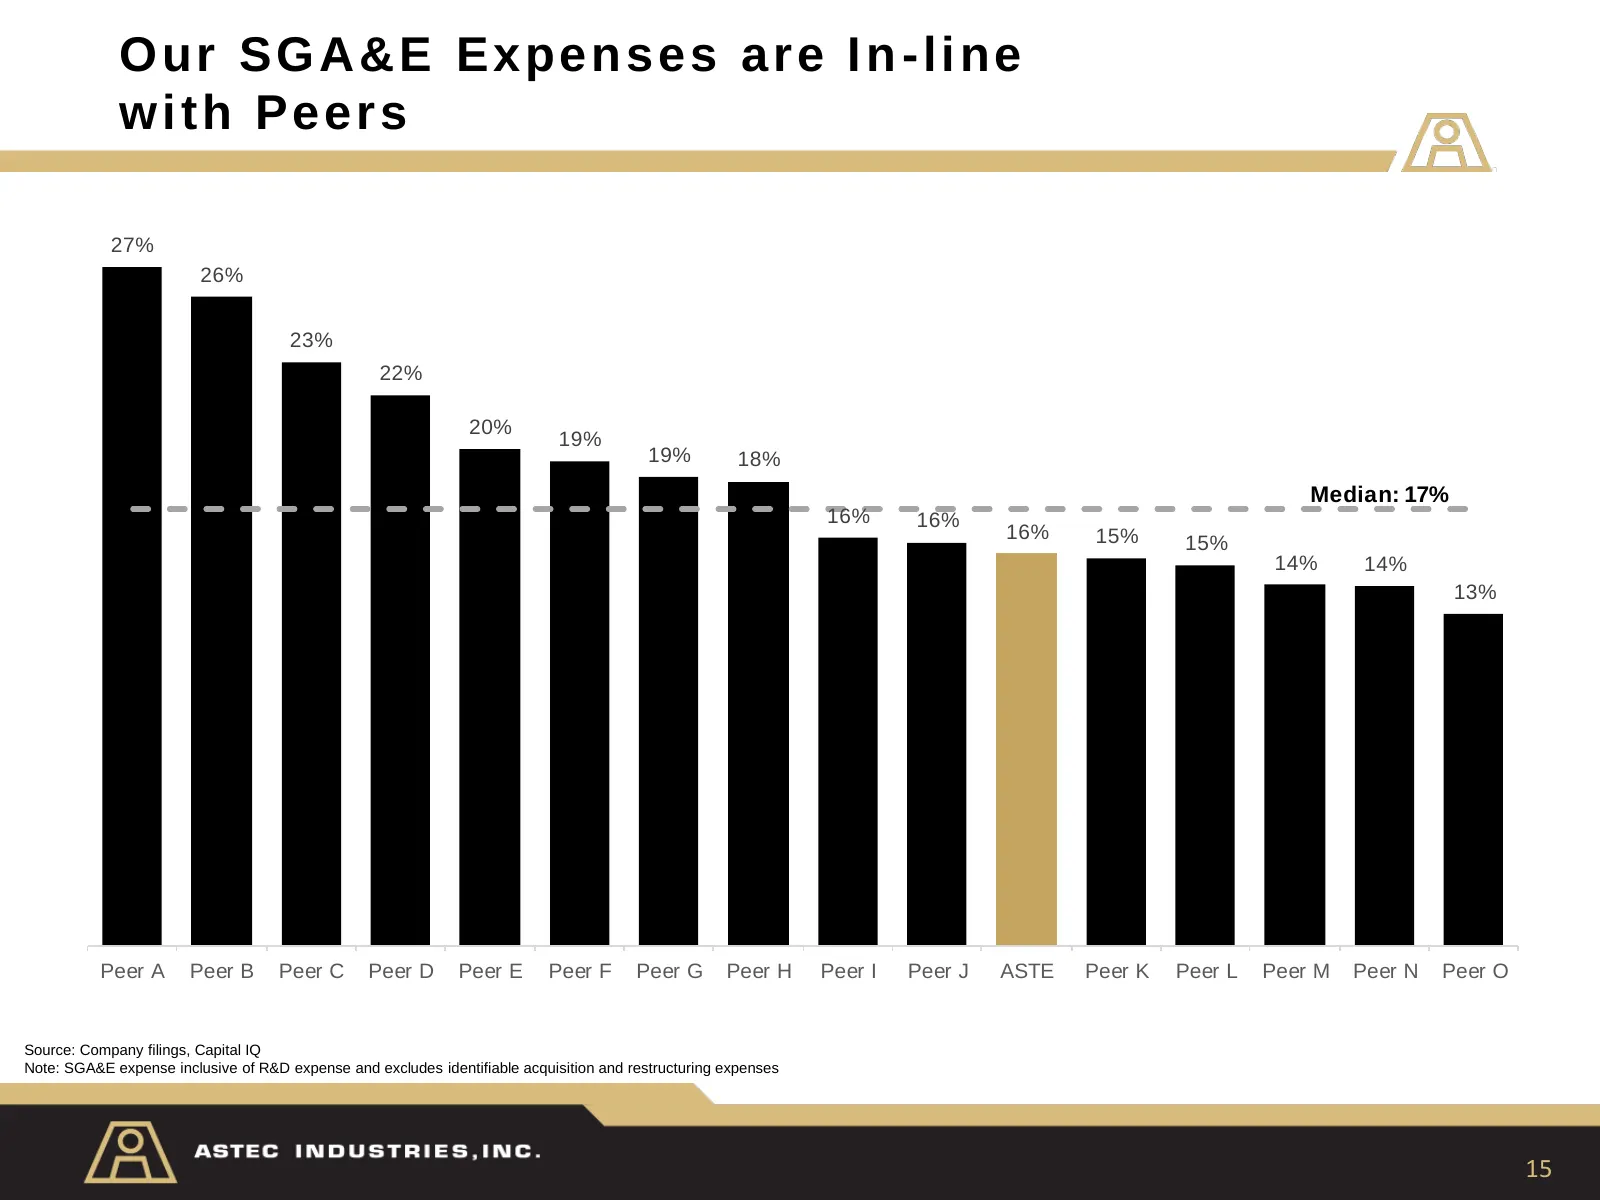
Our SGA&E Expenses are In -line w ith Peers 27% 26% 23% 22% 20% 19% 19% 18% Median: 17% 16% 16% 16% 15% 15% 14% 14% 13% Peer A Peer B Peer C Peer D Peer E Peer F Peer G Peer H Peer I Peer J ASTE Peer K Peer L Peer M Peer N Peer O Source: Company filings, Capital IQ Note: SGA&E expense inclusive of R
Slide 16: Recent Financial Highlights
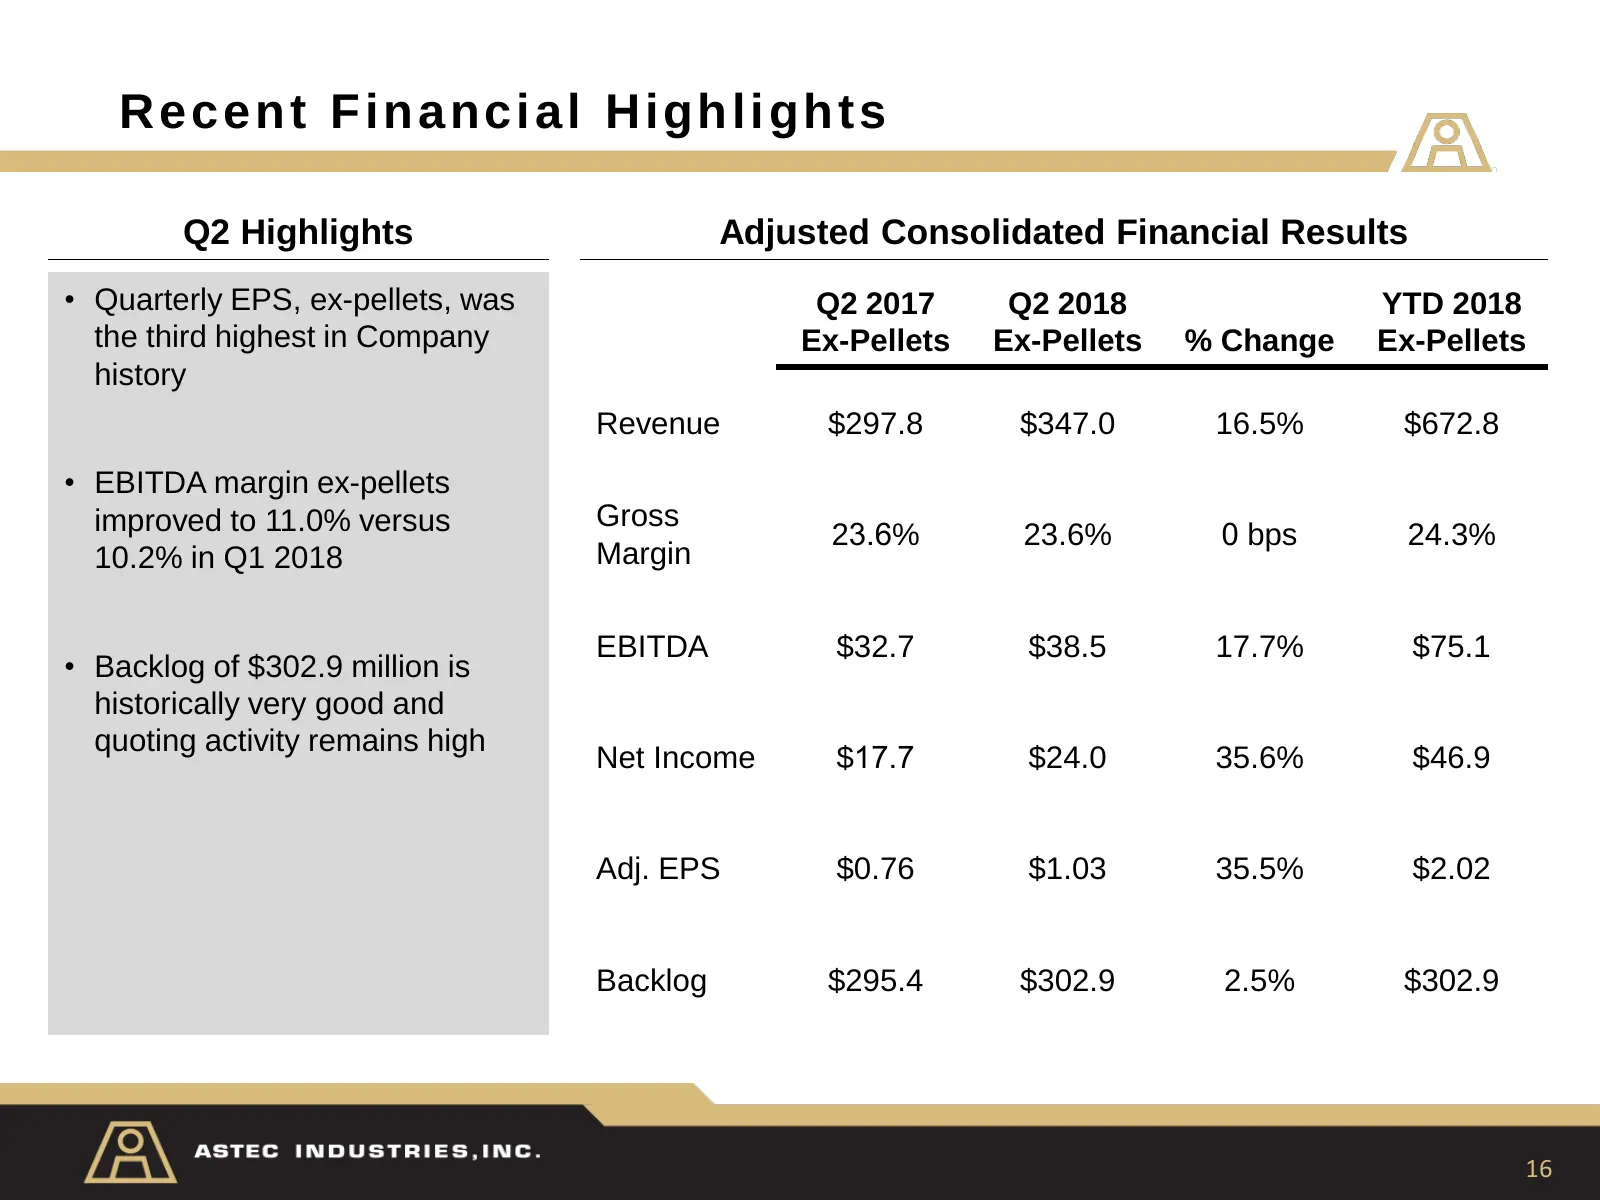
Recent Financial Highligh ts Q2 Highlights Adjusted Consolidated Financial Results • Quarterly EPS, ex-pellets, was Q2 2017 Q2 2018 YTD 2018 the third highest in Company Ex-Pellets Ex-Pellets % Change Ex-Pellets history Revenue $297.8 $347.0 16.5% $672.8 • EBITDA margin ex-pellets improved to 11.0%
Slide 17: Continued Progress Against Our Stated Performance Targets
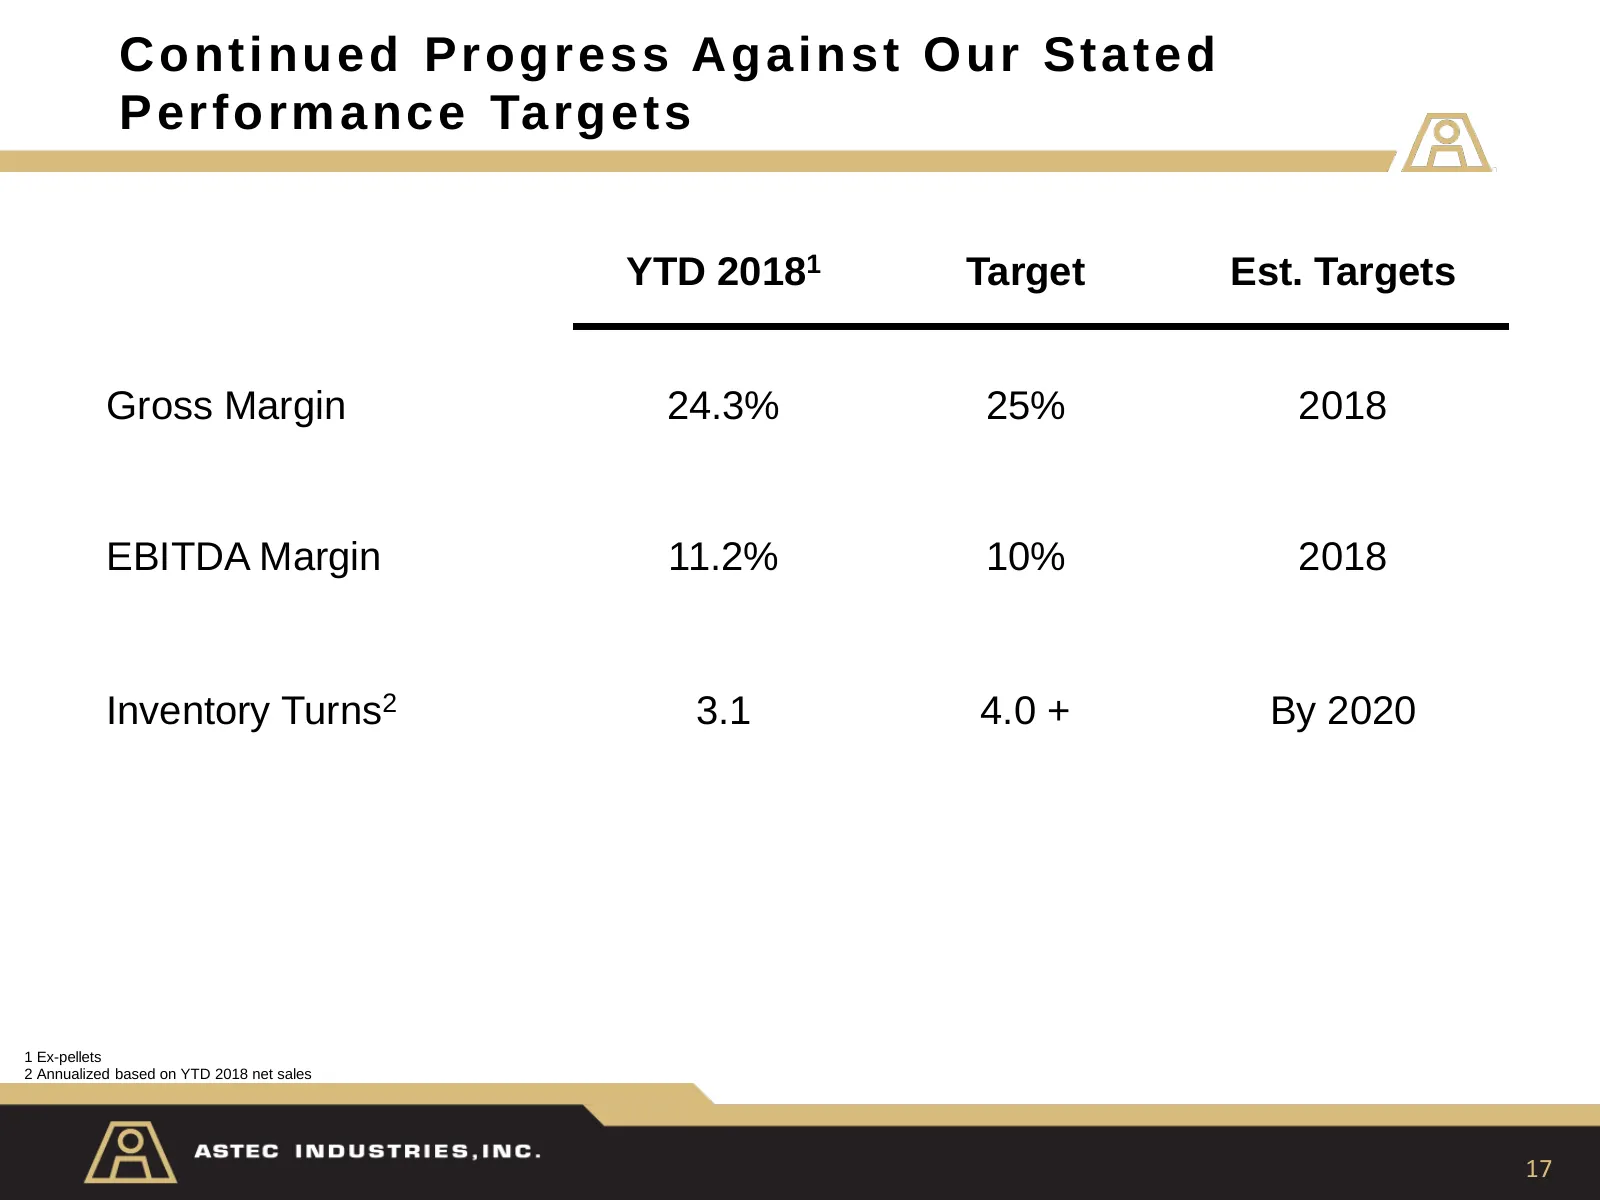
Continu ed Progress Against Our Stated Performance Targets YTD 20181 Target Est. Targets Gross Margin 24.3% 25% 2018 EBITDA Margin 11.2% 10% 2018 Inventory Turns2 3.1 4.0 + By 2020 1 Ex-pellets 2 Annualized based on YTD 2018 net sales 17
Slide 18: Balanced Approach to Capital Allocation
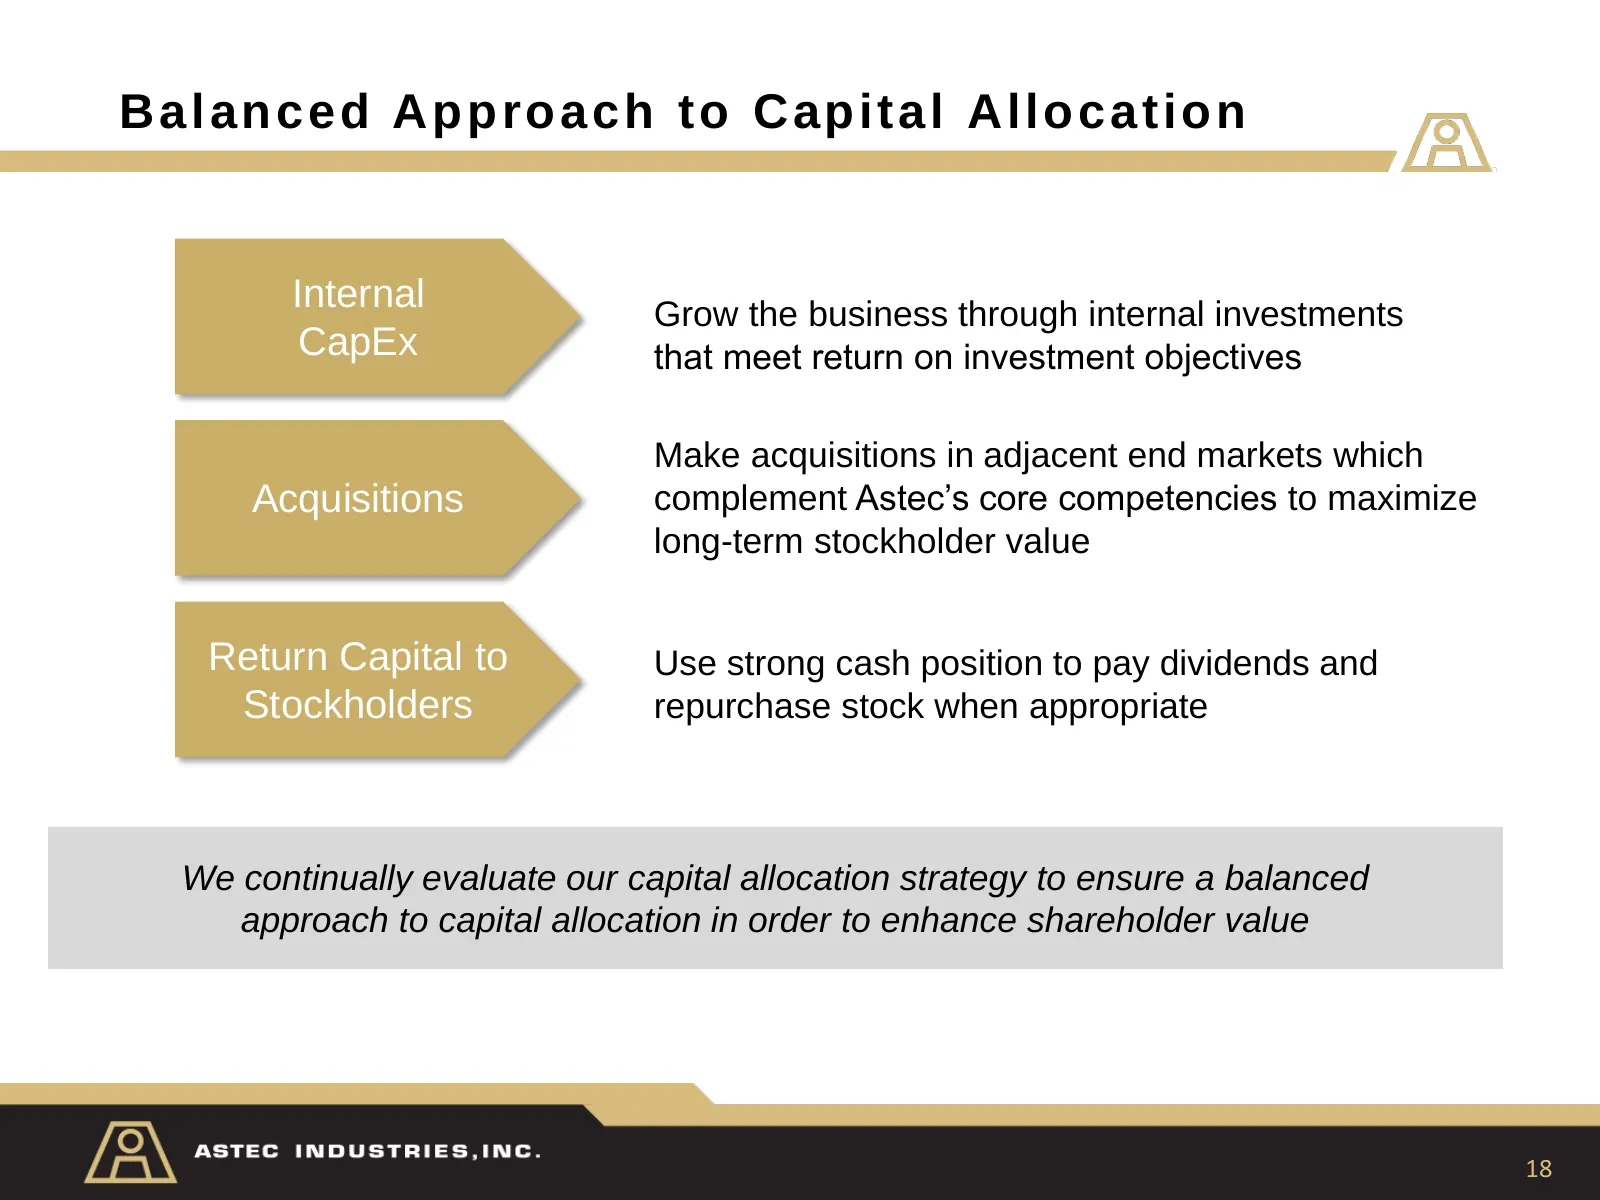
Balanced Approach to Capital Allocatio n Internal Grow the business through internal investments CapEx that meet return on investment objectives Make acquisitions in adjacent end markets which Acquisitions complement Astec’s core competencies to maximize long-term stockholder value Return Capital to
Slide 19: A Compelling Investment Opportunity
A Compellin g Investment Opport u ni t y • Leadership positions in attractive niche markets • Operate in industries with favorable market dynamics benefitting from population growth, urbanization and aging infrastructure • Industry-leading reputation for innovation, high-quality products and superio
Slide 20: Contact Information
Contact Informatio n Benjamin Brock David Silvious President & CEO VP, CFO, Treasurer Phone: 423-827-1256 Phone: 423-553-5928 Email: bbrock@astecindustries.com Email: dsilvious@astecindustries.com Richard Dorris Stephen Anderson Executive VP & COO VP of Administration & Director of Investor Relation
Slide 21: Appendix
Appendix
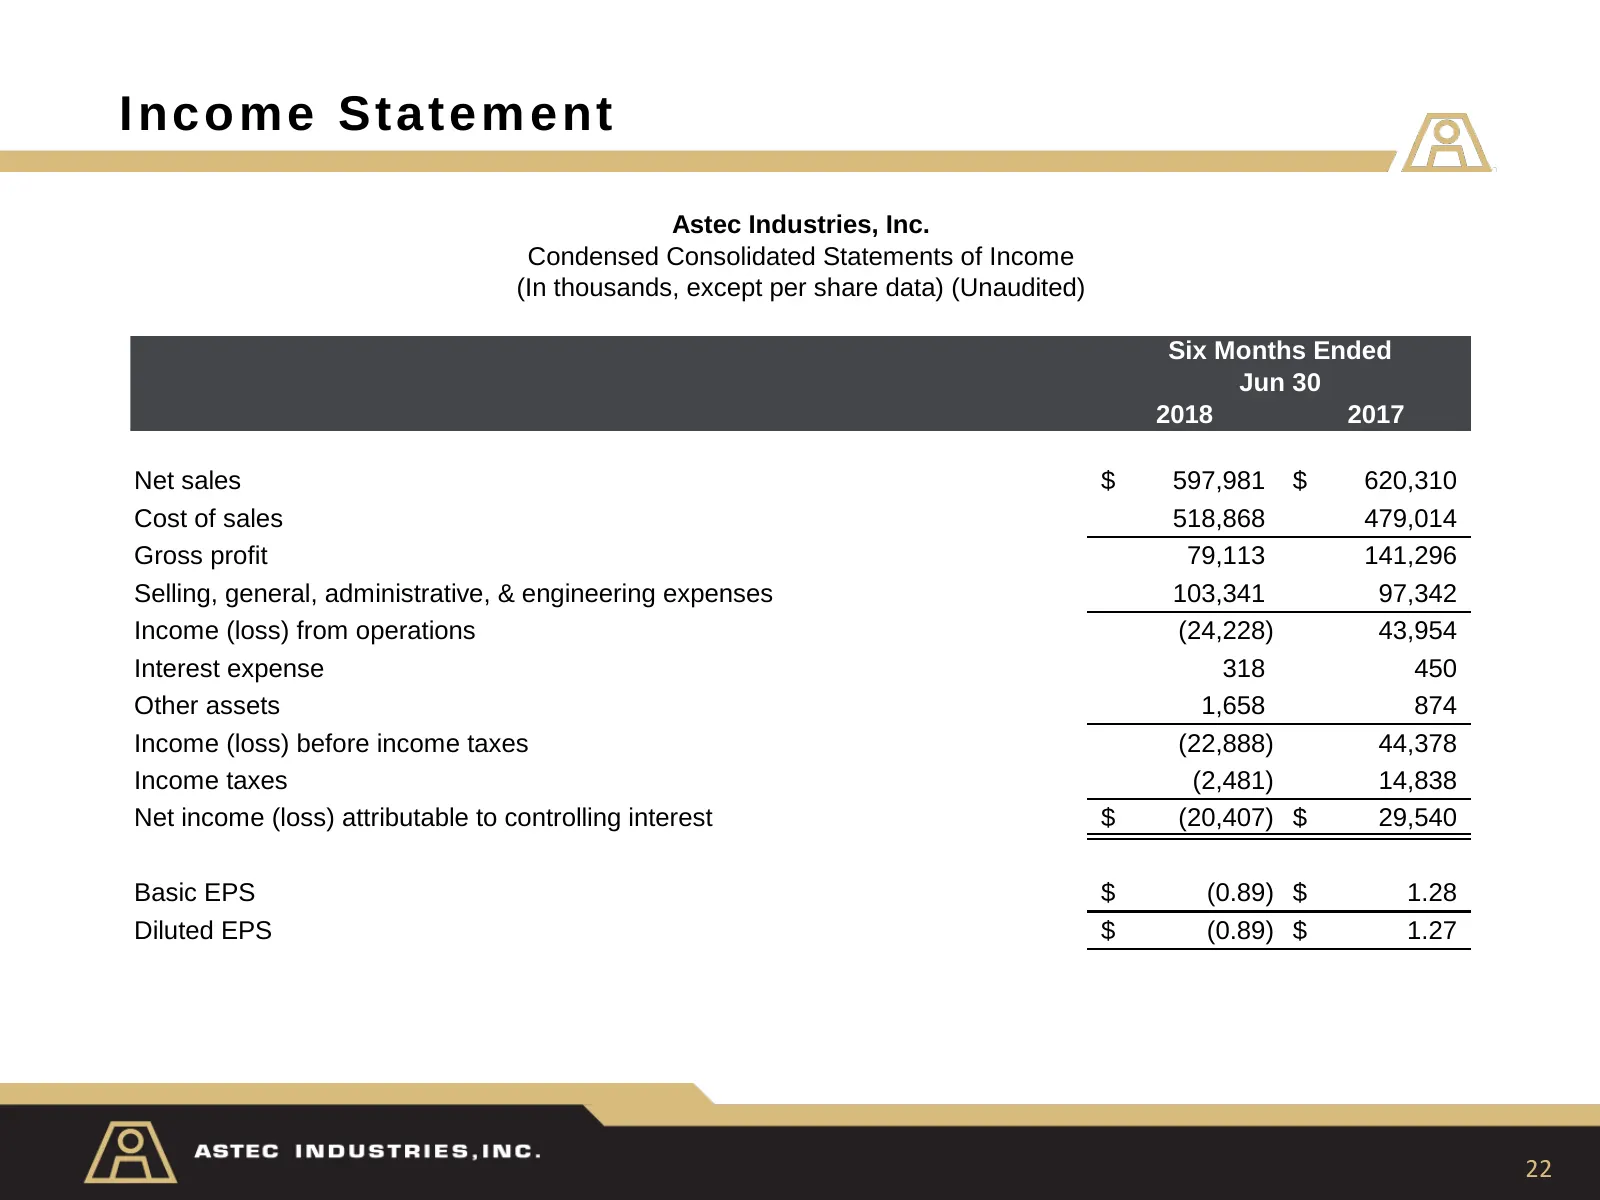
Slide 22: Income Statement
Income Statement Astec Industries, Inc. Condensed Consolidated Statements of Income (In thousands, except per share data) (Unaudited) Six Months Ended Jun 30 2018 2017 Net sales $ 597,981 $ 620,310 Cost of sales 518,868 479,014 Gross profit 79,113 141,296 Selling, general, administrative, & engineer
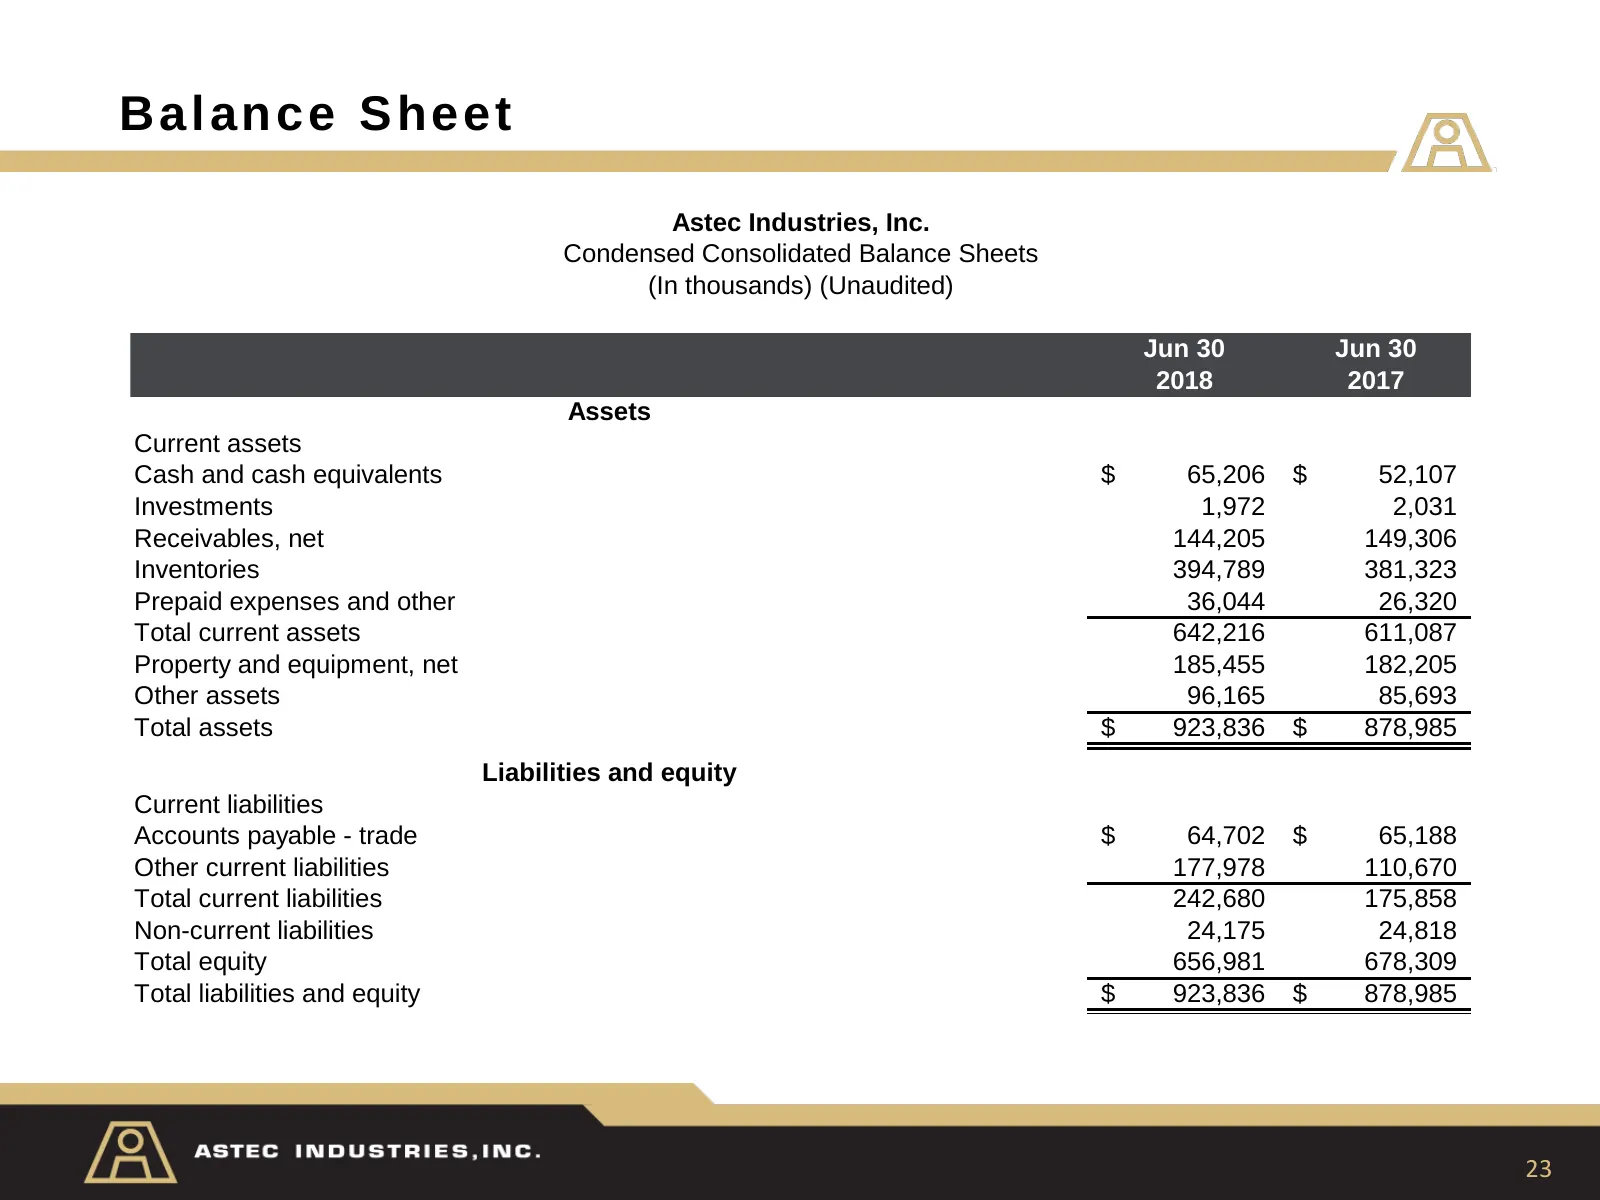
Slide 23: Balance Sheet
Balance Sheet Astec Industries, Inc. Condensed Consolidated Balance Sheets (In thousands) (Unaudited) Jun 30 Jun 30 2018 2017 Assets Current assets Cash and cash equivalents $ 65,206 $ 52,107 Investments 1,972 2,031 Receivables, net 144,205 149,306 Inventories 394,789 381,323 Prepaid expenses and ot
Source: Internet Archive copy of astecindustries.com
More decks from Astec Industries, Inc.
 Q3 2026 Earnings Presentation19 slides · Nov 5, 2026
 Q2 2026 Earnings Presentation20 slides · Aug 5, 2026
 Q1 2026 Earnings Presentation21 slides · May 6, 2026
 Q4 2025 Earnings Presentation20 slides · Feb 25, 2026
 Q3 2025 Earnings Presentation24 slides · Nov 5, 2025
 Q1 2025 Earnings Presentation28 slides · Apr 29, 2025