Emaar Properties (P.J.S.C) · DFM:EMAAR
Emaar Properties (P.J.S.C) — Emaar Malls PJSC — Q1 2018 Earnings Presentation
25 slides from Emaar Properties (P.J.S.C)'s earnings presentation, May 2018
Slide 1: Emaar Malls PJSC Q1 2018 Results
EMAAR MALLS PJSC Q1 2018 RESULTS 1 6 May 18 May2018 2017
Slide 2: Disclaimer
DISCLAIMER Emaar Malls PJSC (EM) gives notice that the particulars of this presentation do not constitute any part of an offer or a contract. Given that the presentation contains information based on forecasts and roll outs, all statements contained in this presentation are made without responsibili
Slide 3: Table of Contents
TABLE OF CONTENTS EMAAR MALLS AT A GLANCE 4 HIGHLIGHTS 5 VISION AND STRATEGY 6 EMAAR MALLS < Financial results 7 < Rental income 8 < Portfolio results 9 < Portfolio 10 < Key strengths 11 < Lease renewal status 13 NAMSHI < Namshi at a glance 15 < Key performance indicators 16 UPCOMING PROJECTS < Deve
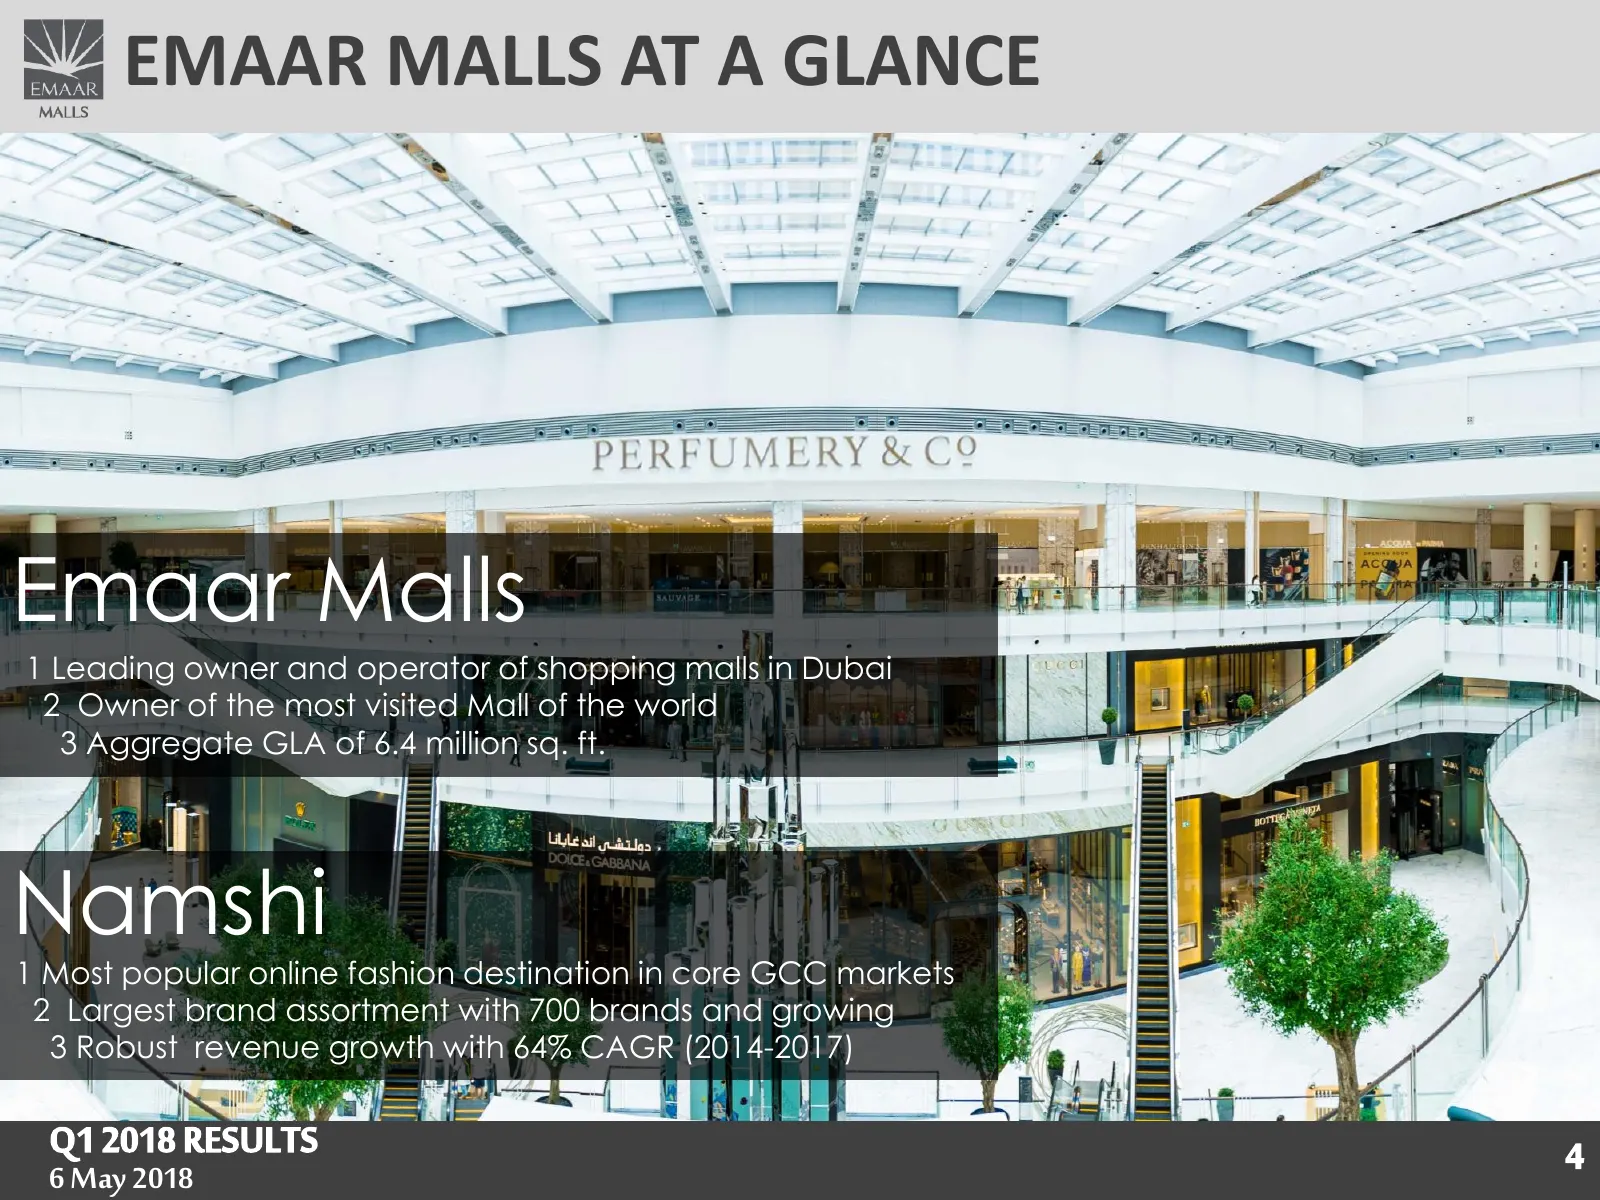
Slide 4: Emaar Malls at a Glance
EMAAR MALLS AT A GLANCE Emaar Malls 1 Leading owner and operator of shopping malls in Dubai 2 Owner of the most visited Mall of the world 3 Aggregate GLA of 6.4 million sq. ft. Namshi 1 Most popular online fashion destination in core GCC markets 2 Largest brand assortment with 700 brands and growing
Slide 5: Highlights
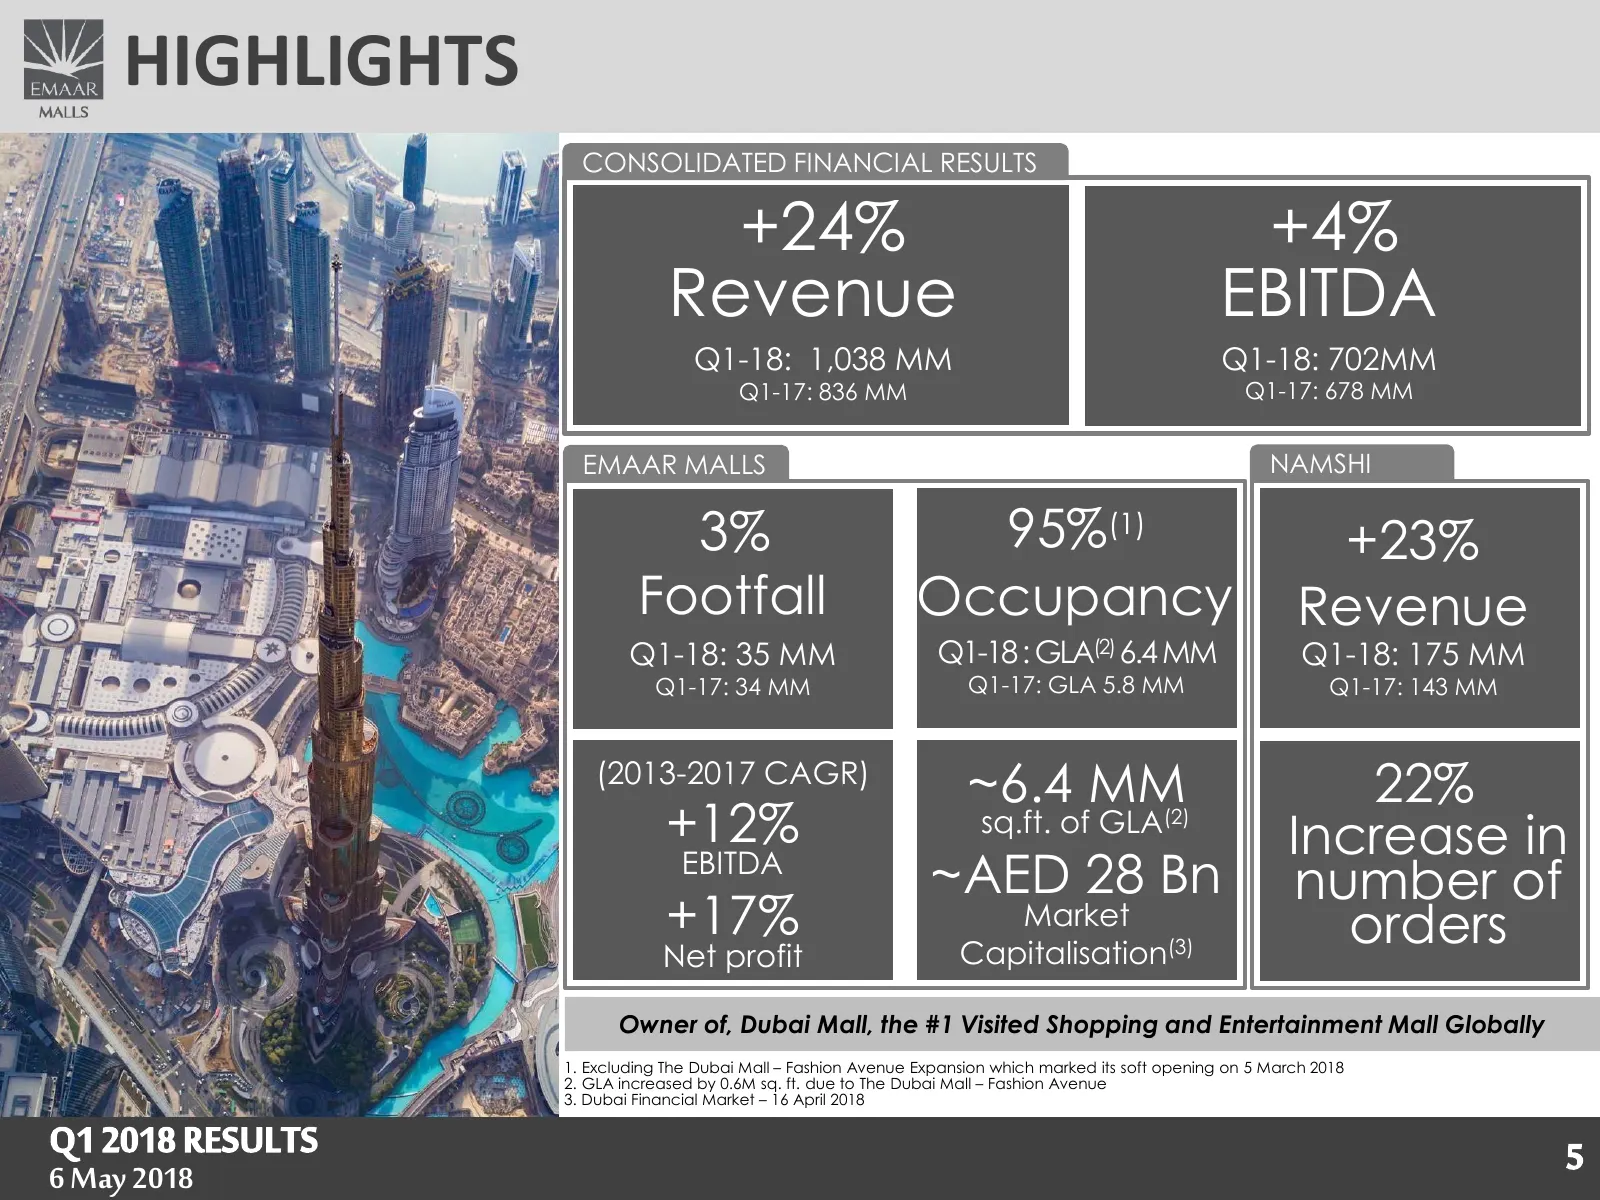
HIGHLIGHTS CONSOLIDATED FINANCIALFINANCIAL CONSOLIDATED RESULTS RESULTS +24% +4% Revenue EBITDA Q1-18: 1,038 MM Q1-18: 702MM Q1-17: 836 MM Q1-17: 678 MM EMAAR MALLS NAMSHI 3% 95%(1) +23% Footfall Occupancy Revenue Q1-18: 35 MM Q1-18 : GLA(2) 6.4 MM Q1-18: 175 MM Q1-17: 34 MM Q1-17: GLA 5.8 MM Q1-17:
Slide 6: Our Vision and Strategy
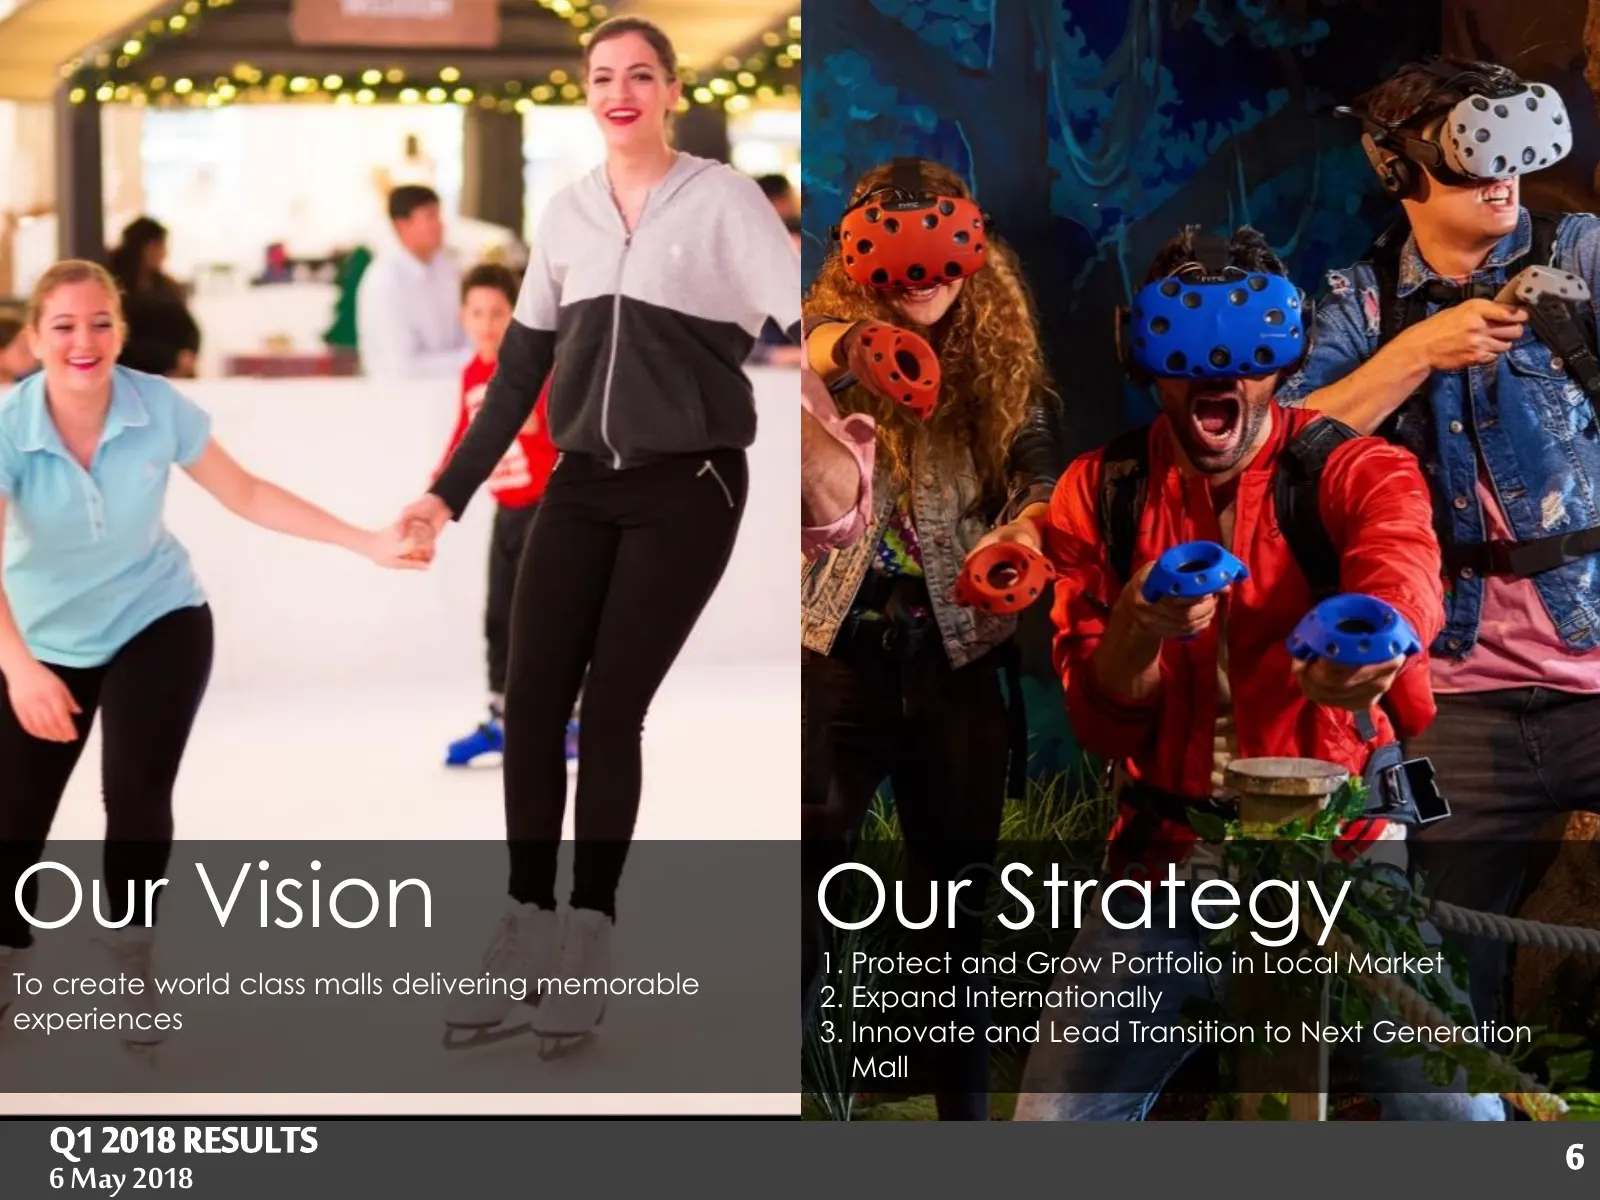
Our Vision OurOUR Strategy STRATEGY 1. Protect and Grow Portfolio in Local Market To create world class malls delivering memorable 2. Expand Internationally experiences 3. Innovate and Lead Transition to Next Generation Mall Q1 2018 RESULTS 66 6 May 2018
Slide 7: Financial Results Malls
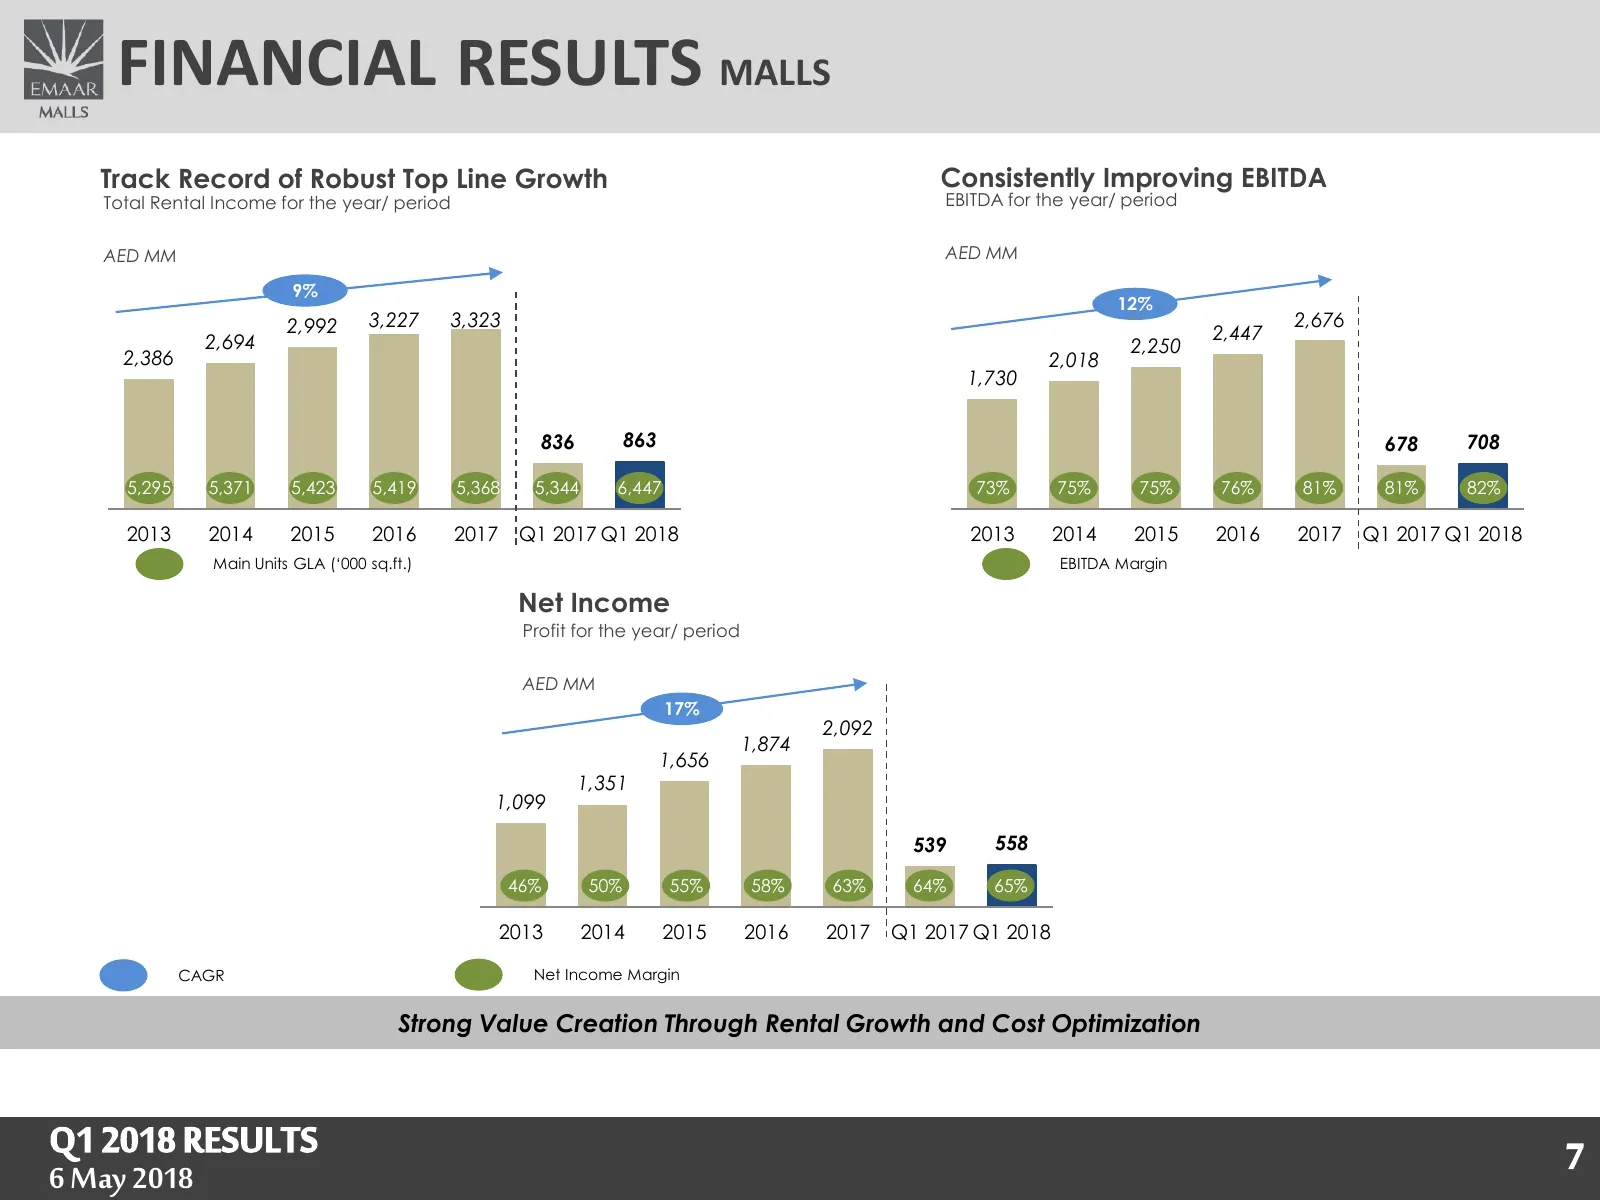
FINANCIAL RESULTS MALLS Track Record of Robust Top Line Growth Consistently Improving EBITDA Total Rental Income for the year/ period EBITDA for the year/ period AED MM AED MM 9% 12% 2,992 3,227 3,323 2,676 2,694 2,447 2,250 2,386 2,018 1,730 836 863 678 708 5,295 5,371 5,423 5,419 5,368 5,344 6,447
Slide 8: Rental Income Malls
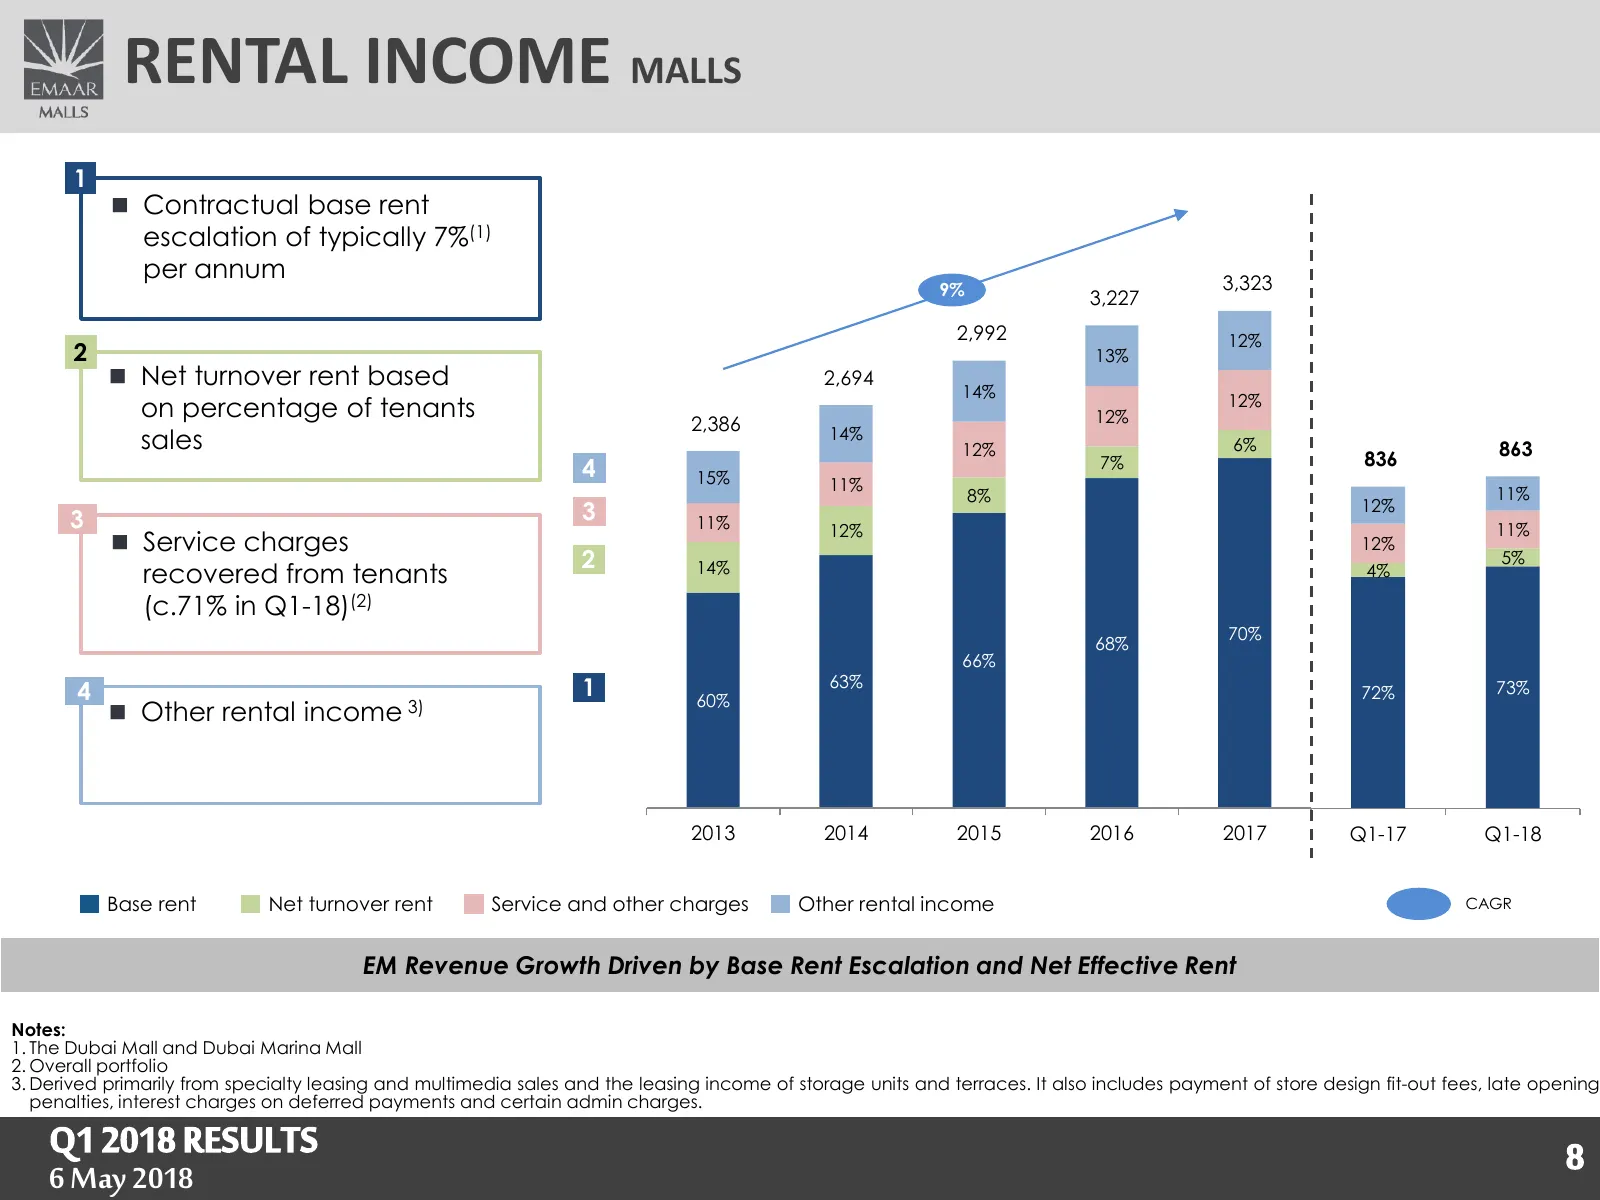
RENTAL INCOME MALLS 1 Contractual base rent escalation of typically 7%(1) per annum 3,323 9% 3,227 2,992 12% 2 13% Net turnover rent based 2,694 14% 12% on percentage of tenants 12% 2,386 sales 14% 12% 6% 863 7% 836 4 15% 11% 8% 11% 3 12% 3 11% 12% 11% Service charges 12% 2 5% recovered from t
Slide 9: Portfolio Results Malls
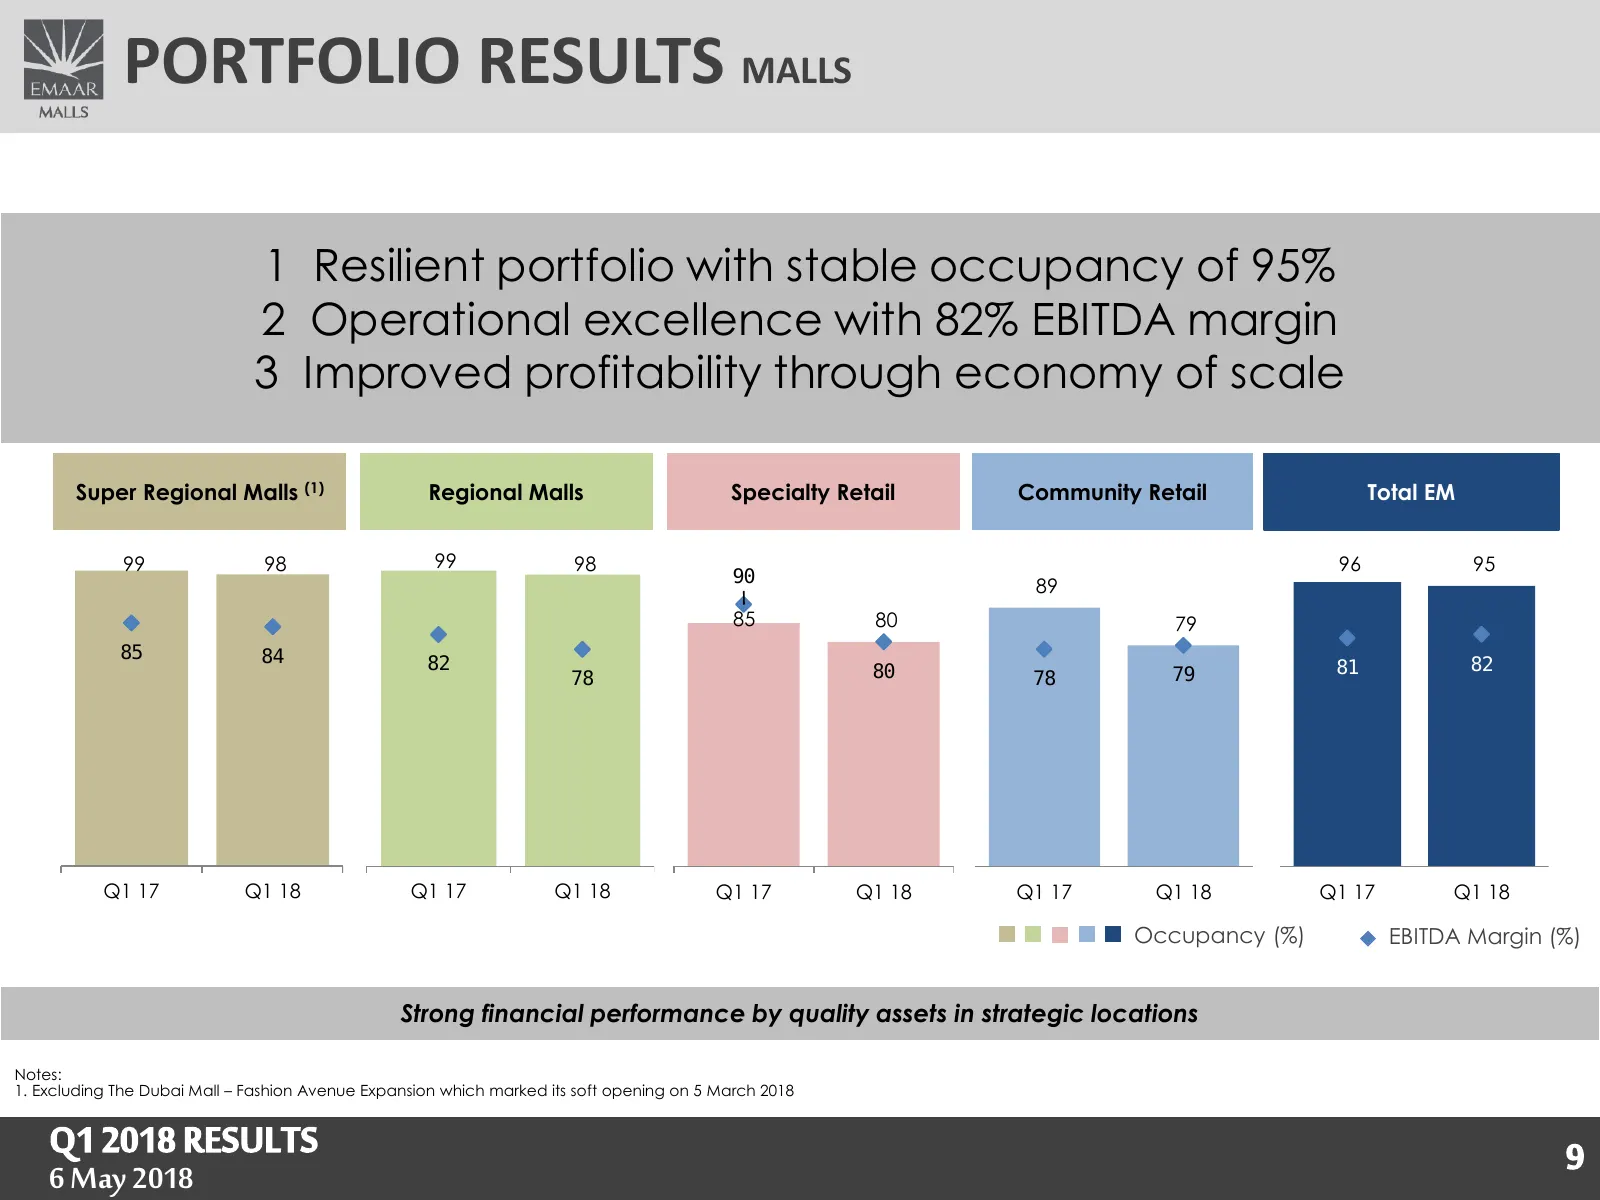
PORTFOLIO RESULTS MALLS 1 Resilient portfolio with stable occupancy of 95% 2 Operational excellence with 82% EBITDA margin 3 Improved profitability through economy of scale Super Regional Malls (1) Regional Malls Specialty Retail Community Retail Total EM 99 98 99 98 96 95 90 89 85 80 79 85 84 82 80
Slide 10: Portfolio Malls
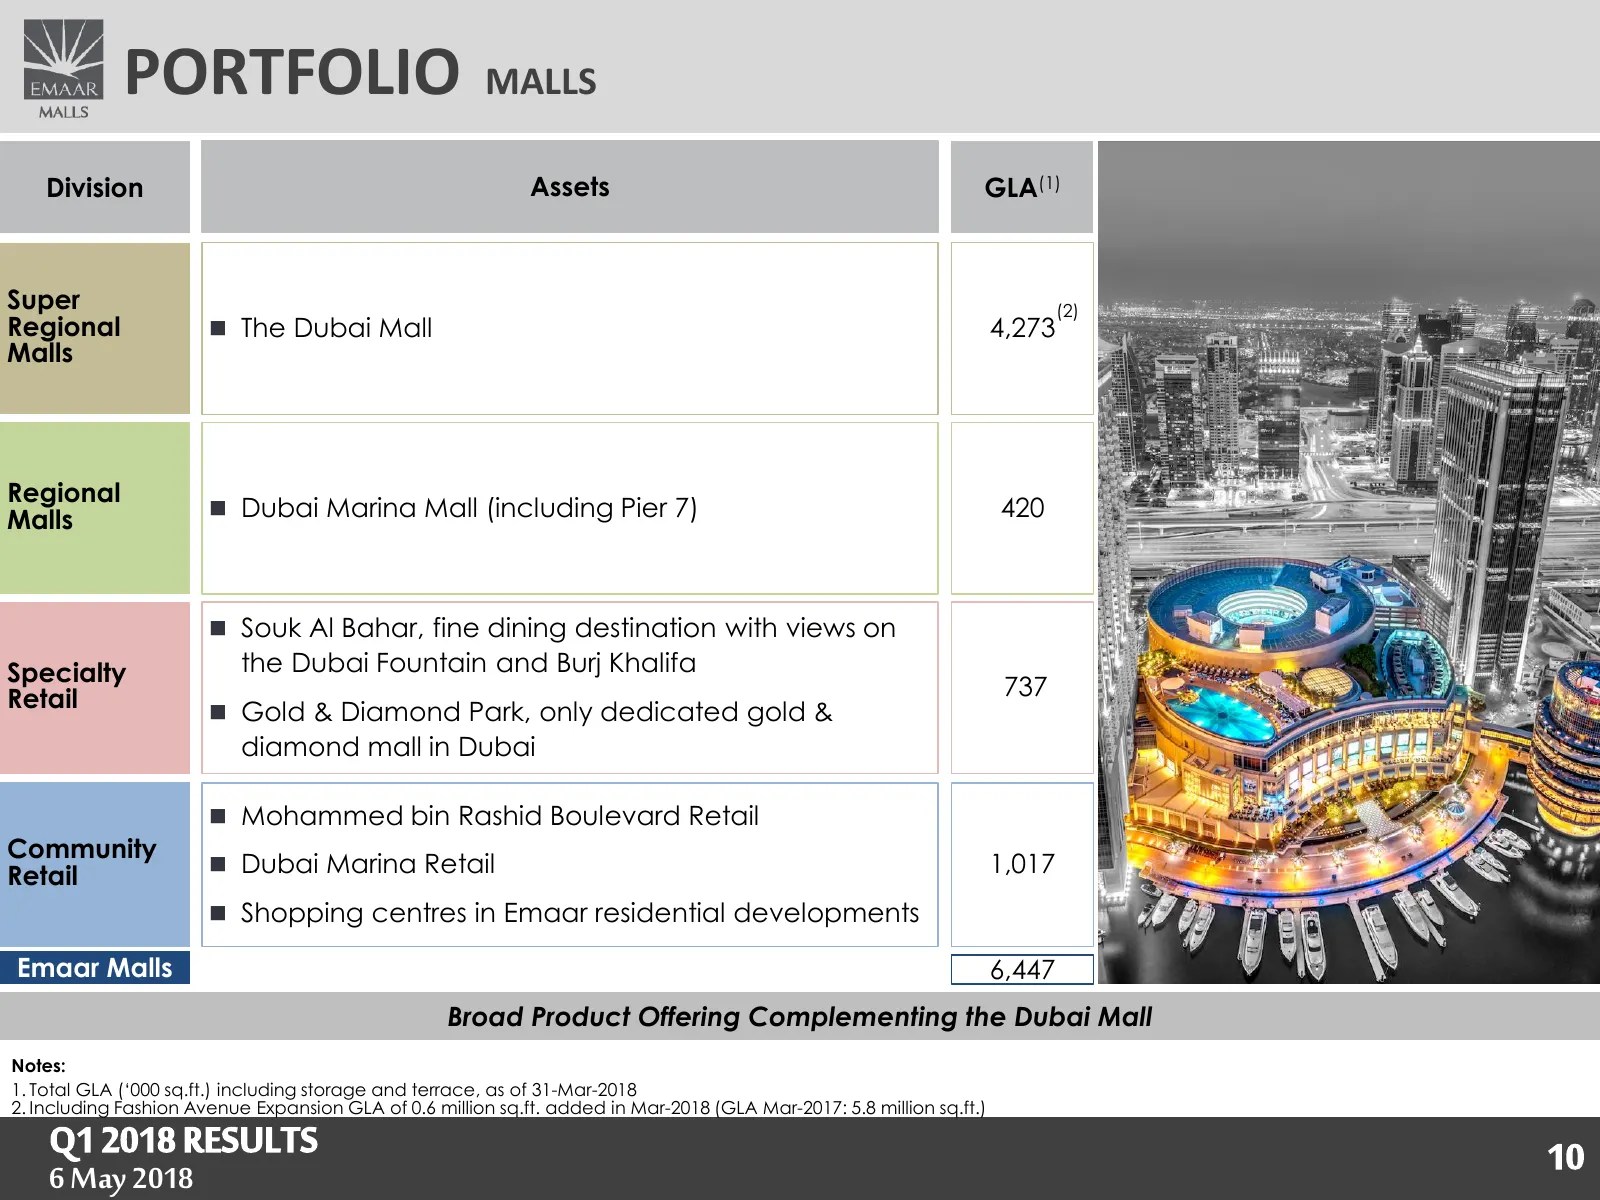
PORTFOLIO MALLS Division Assets GLA(1) Super (2) Regional The Dubai Mall 4,273 Malls Regional Malls Dubai Marina Mall (including Pier 7) 420 Souk Al Bahar, fine dining destination with views on Specialty the Dubai Fountain and Burj Khalifa Retail 737 Gold & Diamond Park, only dedicated gold
Slide 11: Key Strengths Malls
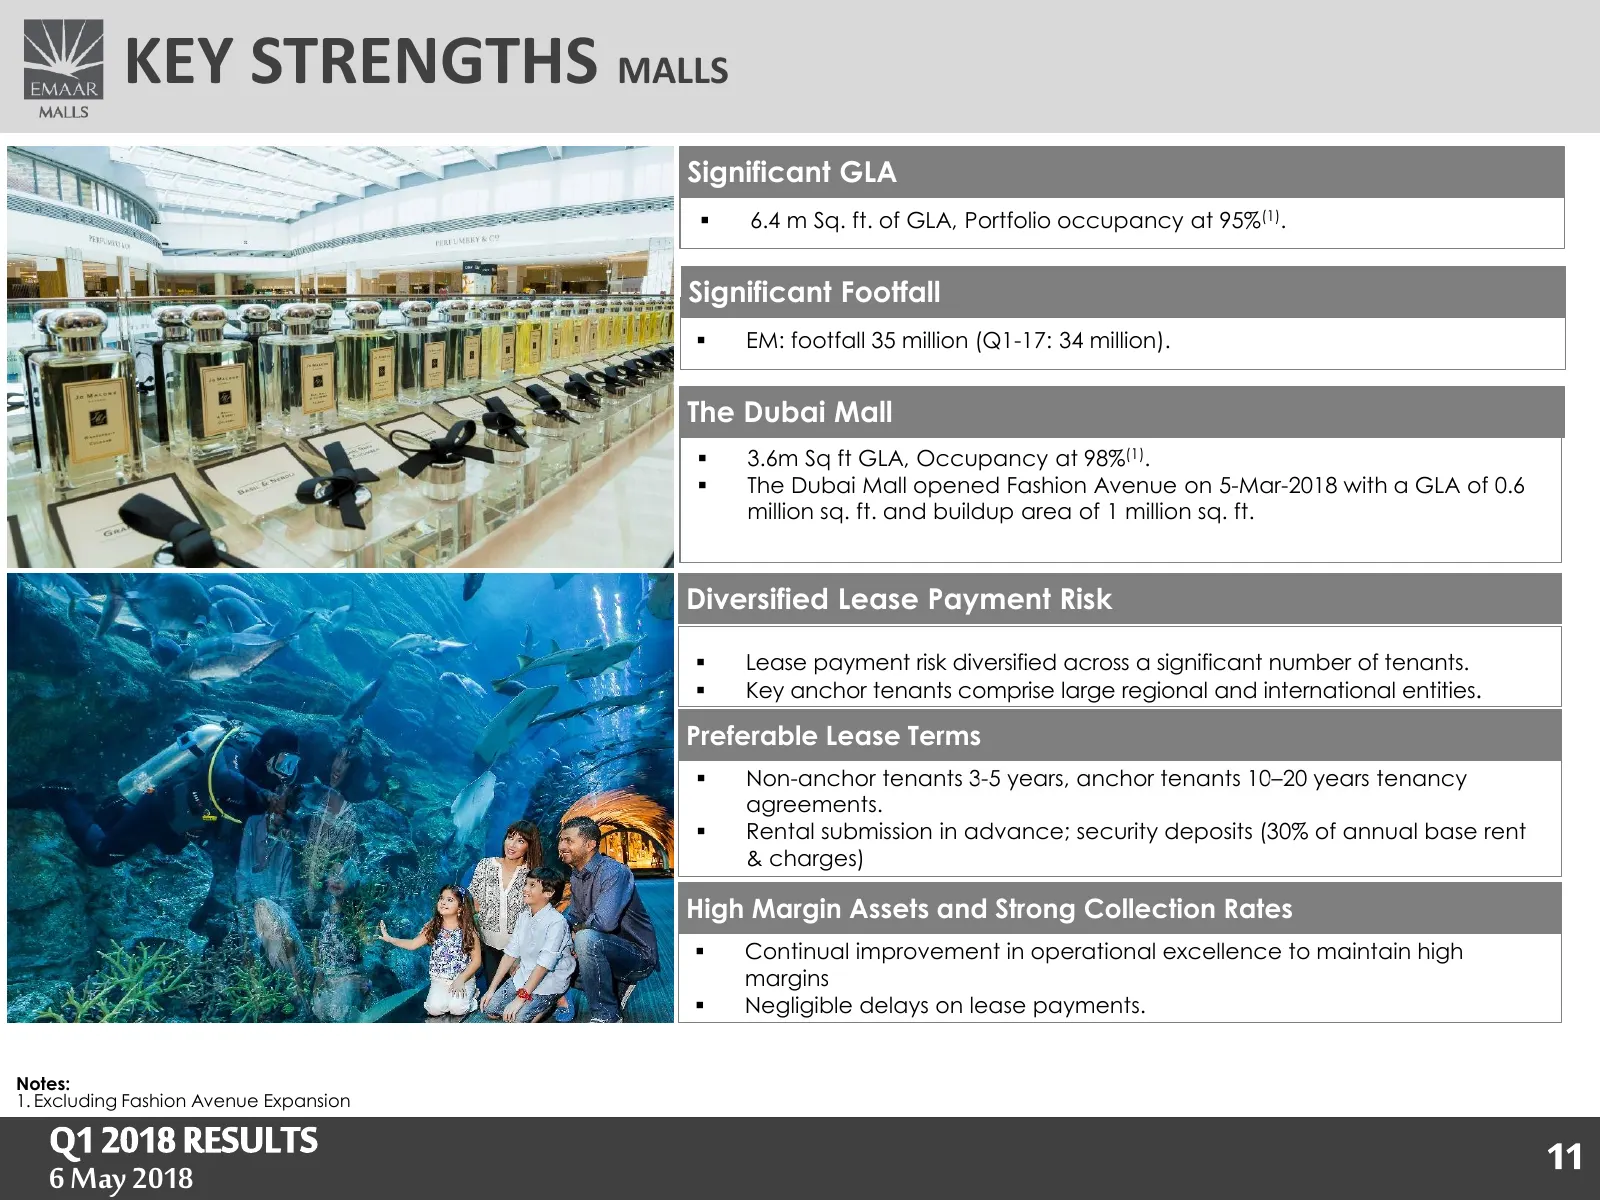
KEY STRENGTHS MALLS Significant GLA ▪ 6.4 m Sq. ft. of GLA, Portfolio occupancy at 95%(1). Significant Footfall ▪ EM: footfall 35 million (Q1-17: 34 million). The Dubai Mall ▪ 3.6m Sq ft GLA, Occupancy at 98%(1). ▪ The Dubai Mall opened Fashion Avenue on 5-Mar-2018 with a GLA of 0.6 million sq. ft.
Slide 12: Key Strengths (cont'd) Malls
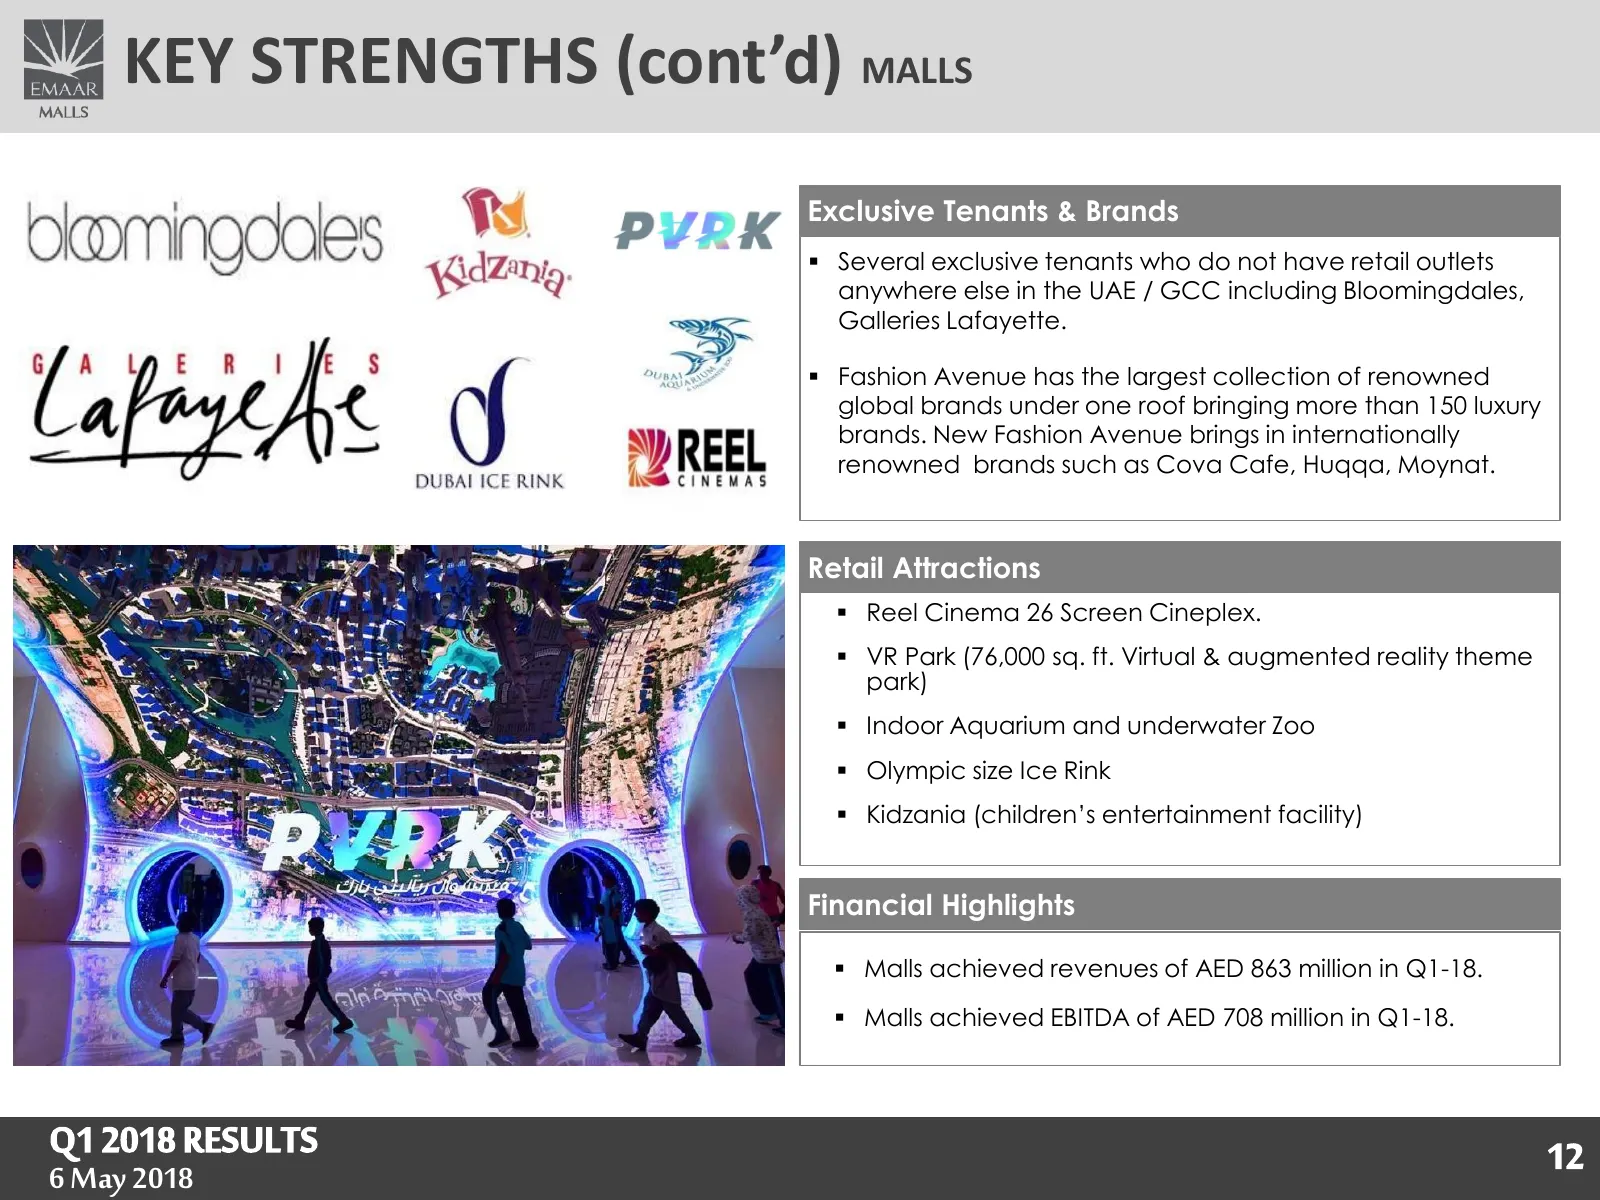
KEY STRENGTHS (cont’d) MALLS Exclusive Tenants & Brands ▪ Several exclusive tenants who do not have retail outlets anywhere else in the UAE / GCC including Bloomingdales, Galleries Lafayette. ▪ Fashion Avenue has the largest collection of renowned global brands under one roof bringing more than 150
Slide 13: Lease Renewal Status Malls
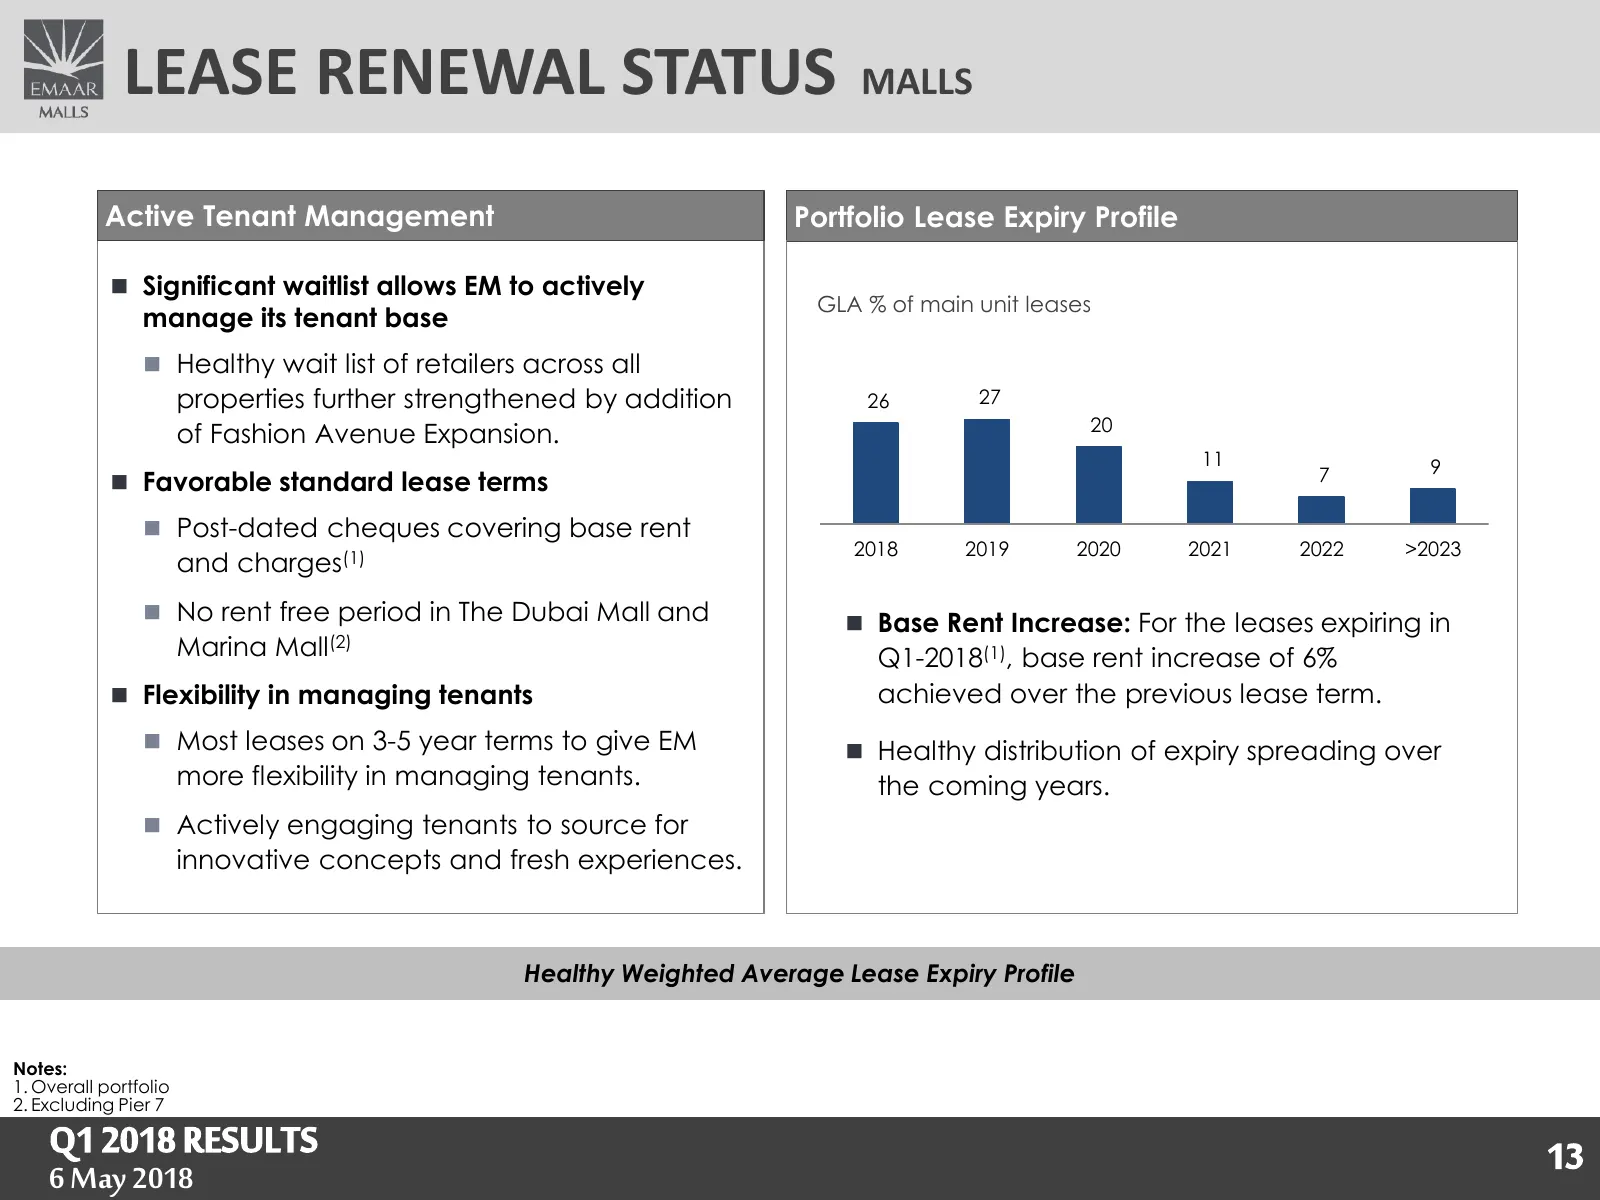
LEASE RENEWAL STATUS MALLS Active Tenant Management Portfolio Lease Expiry Profile Significant waitlist allows EM to actively GLA % of main unit leases manage its tenant base Healthy wait list of retailers across all properties further strengthened by addition 26 27 20 of Fashion Avenue Expansio
Slide 14: Q1 2018 RESULTS
Q1 2018 RESULTS 1414 6 May 18 May2018 2017
Slide 15: Namshi at a Glance
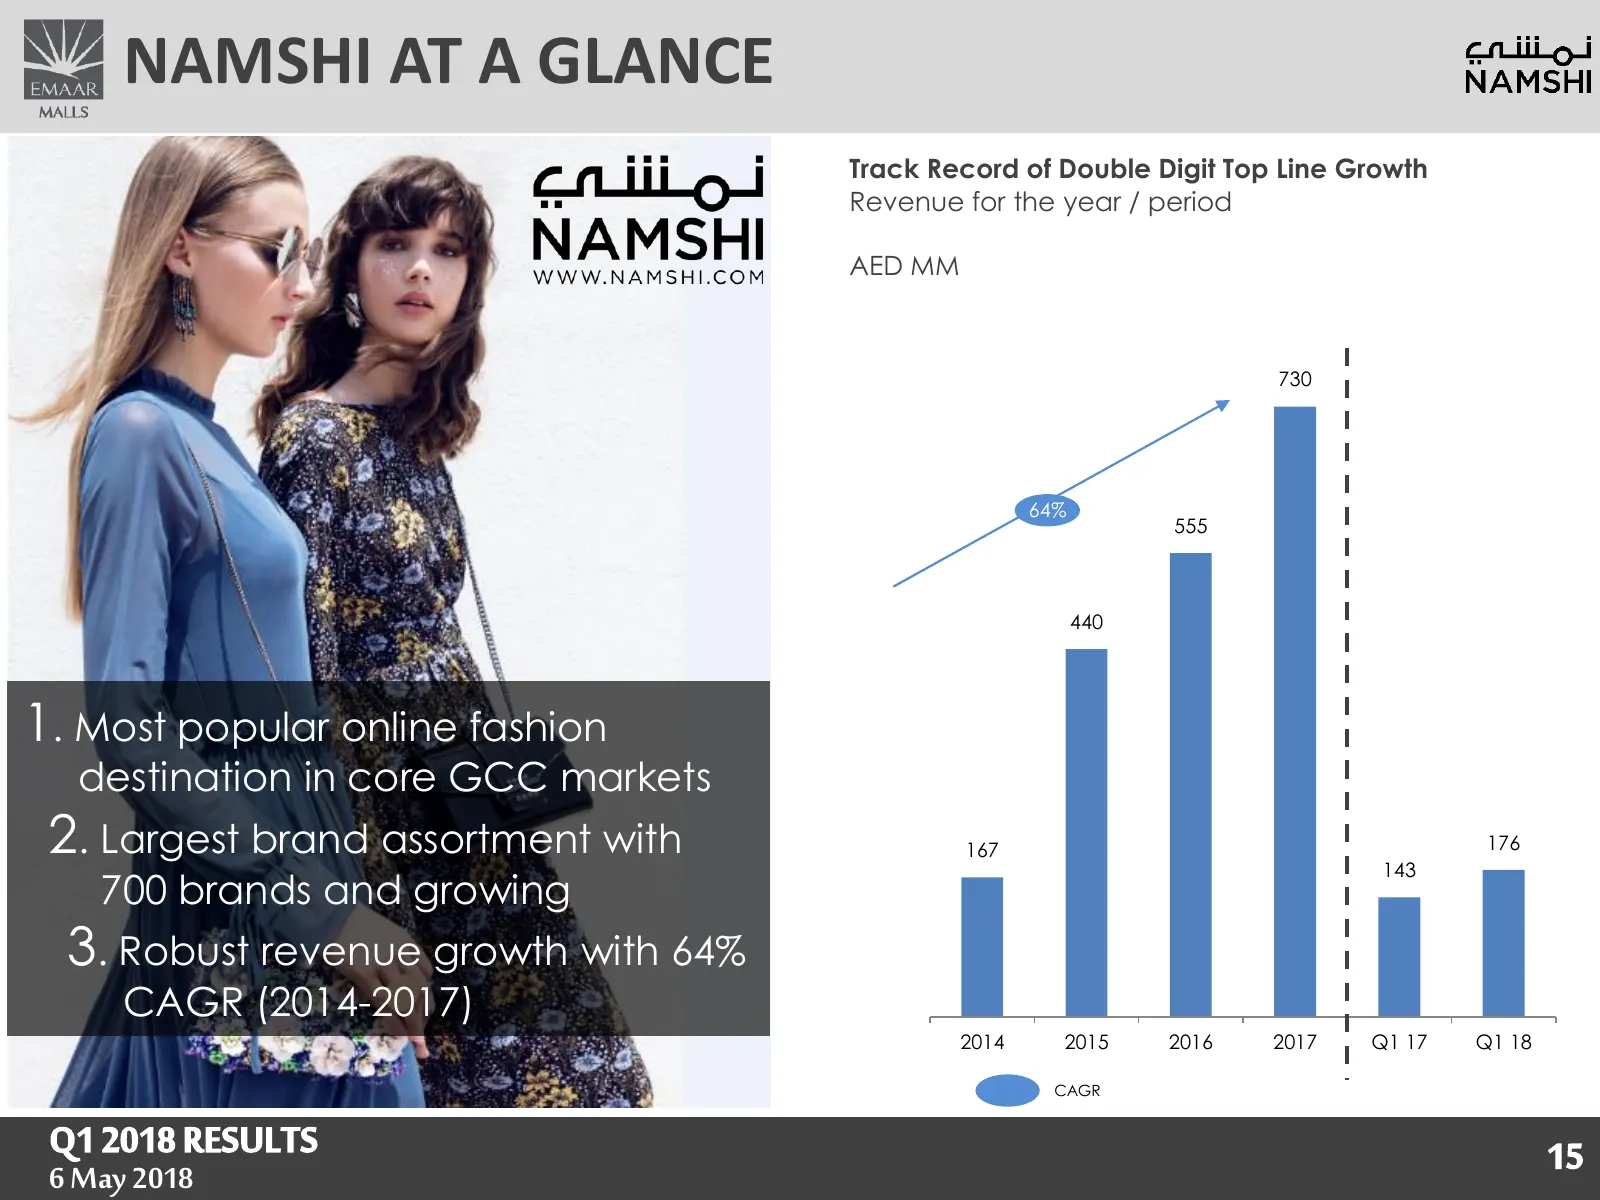
NAMSHI AT A GLANCE Track Record of Double Digit Top Line Growth Revenue for the year / period AED MM 730 64% 555 440 1. Most popular online fashion destination in core GCC markets 2. Largest brand assortment with 167 143 176 700 brands and growing 3. Robust revenue growth with 64% CAGR (2014-2017) 2
Slide 16: Key Performance Indicators
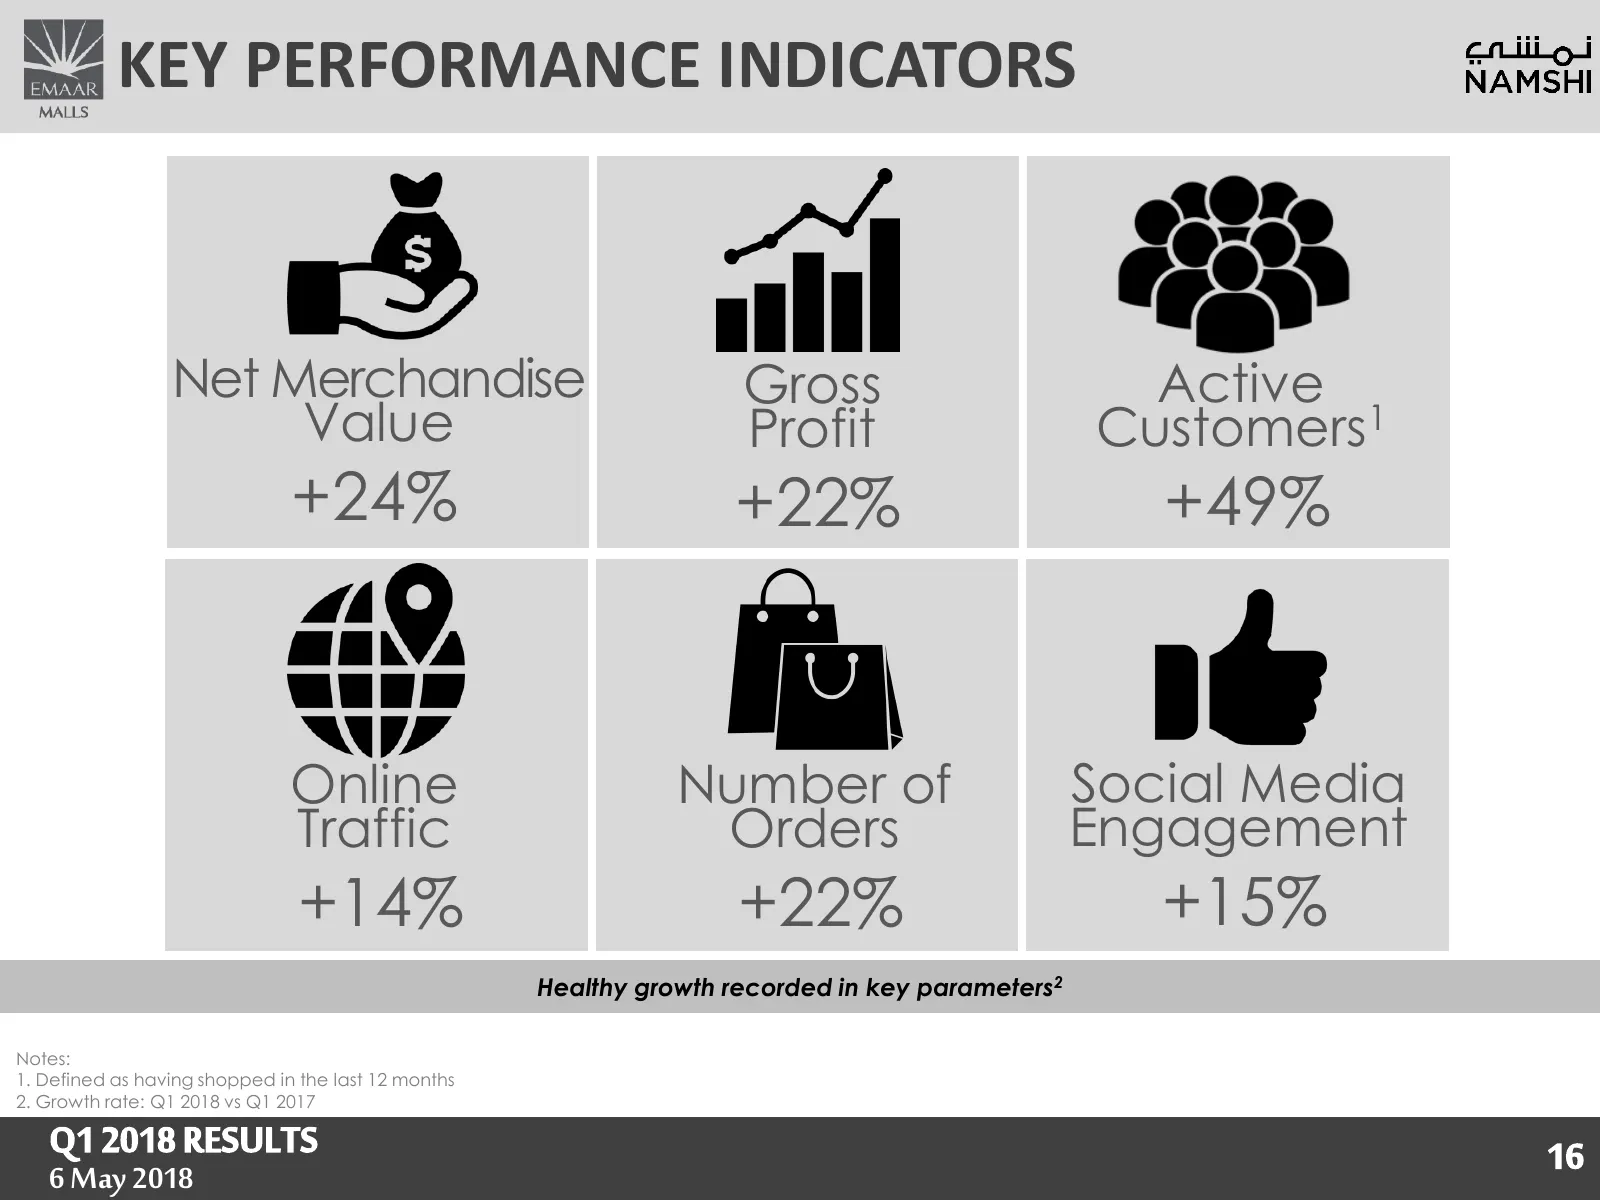
KEY PERFORMANCE INDICATORS Net Merchandise Gross Active Value Profit Customers1 +24% 29% +22% +49% Online Number of Social Media Traffic Orders Engagement +14% +22% +15% Healthy growth recorded in key parameters2 Notes: 1. Defined as having shopped in the last 12 months 2. Growth rate: Q1 2018 vs Q1
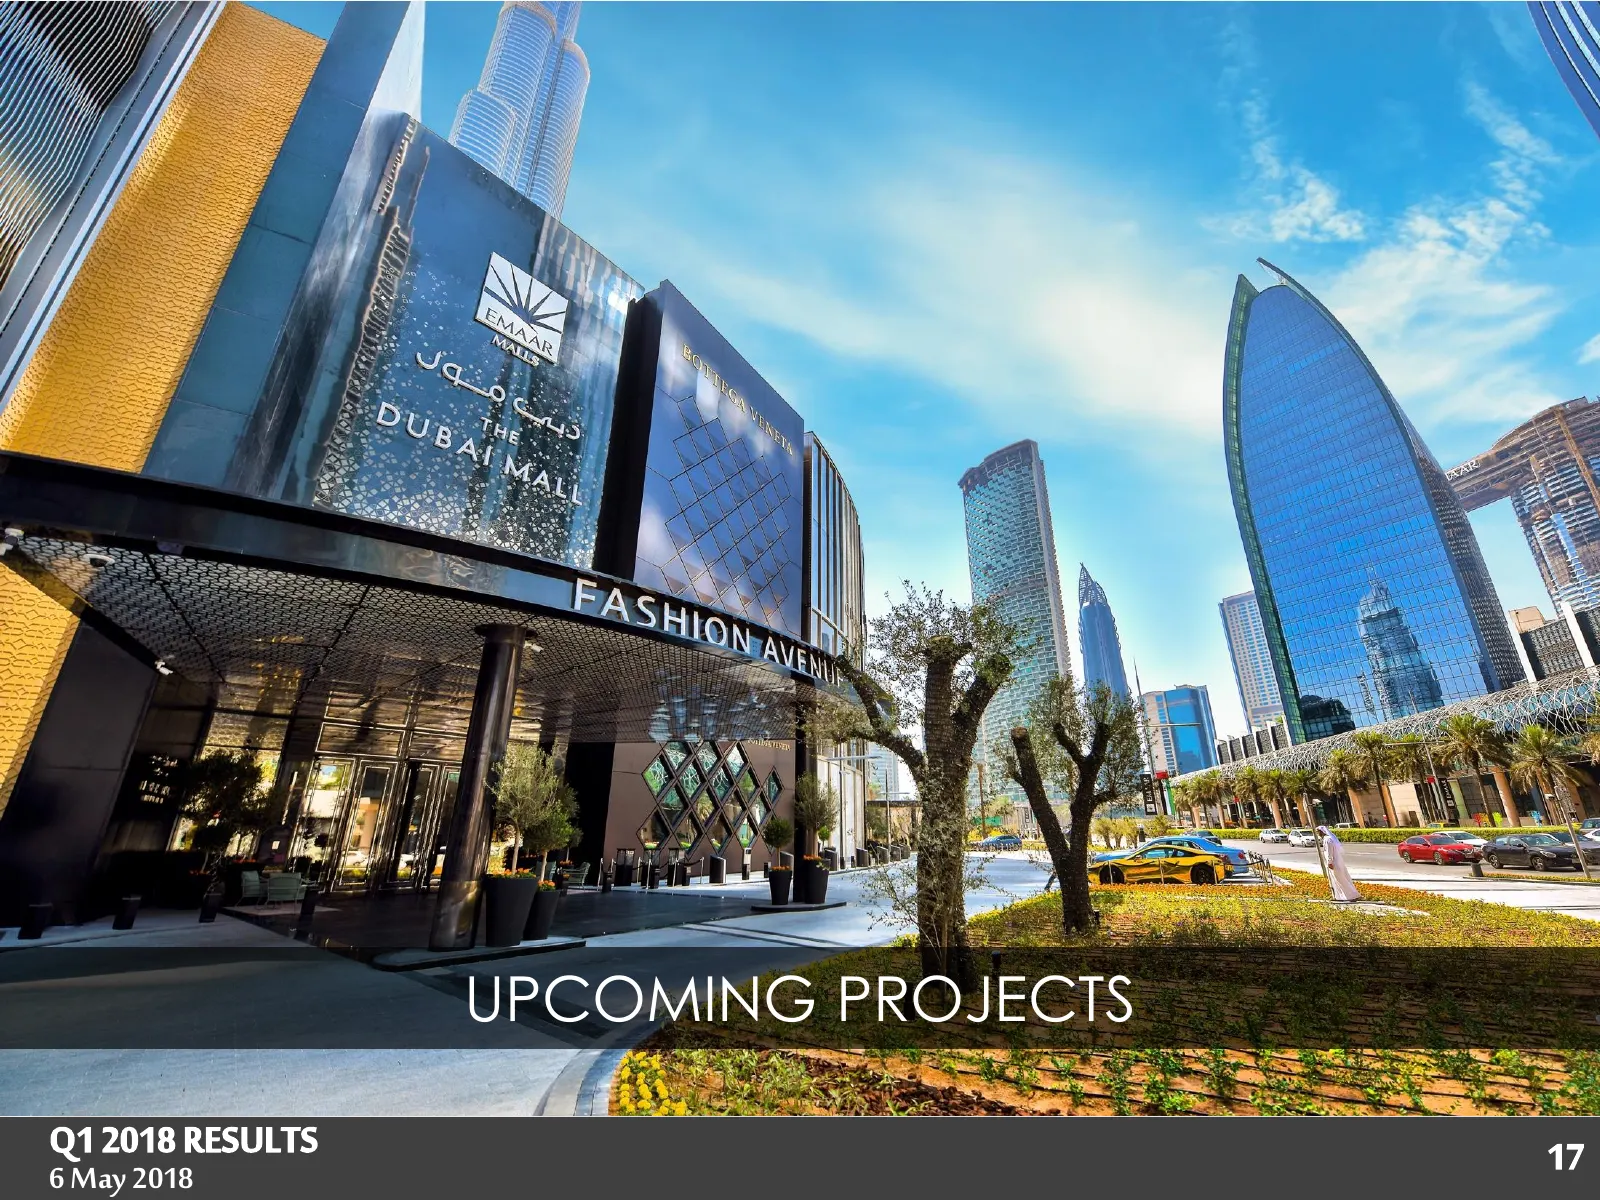
Slide 17: Upcoming Projects
UPCOMING PROJECTS Q1 2018 RESULTS 1717 6 May 18 May2018 2017
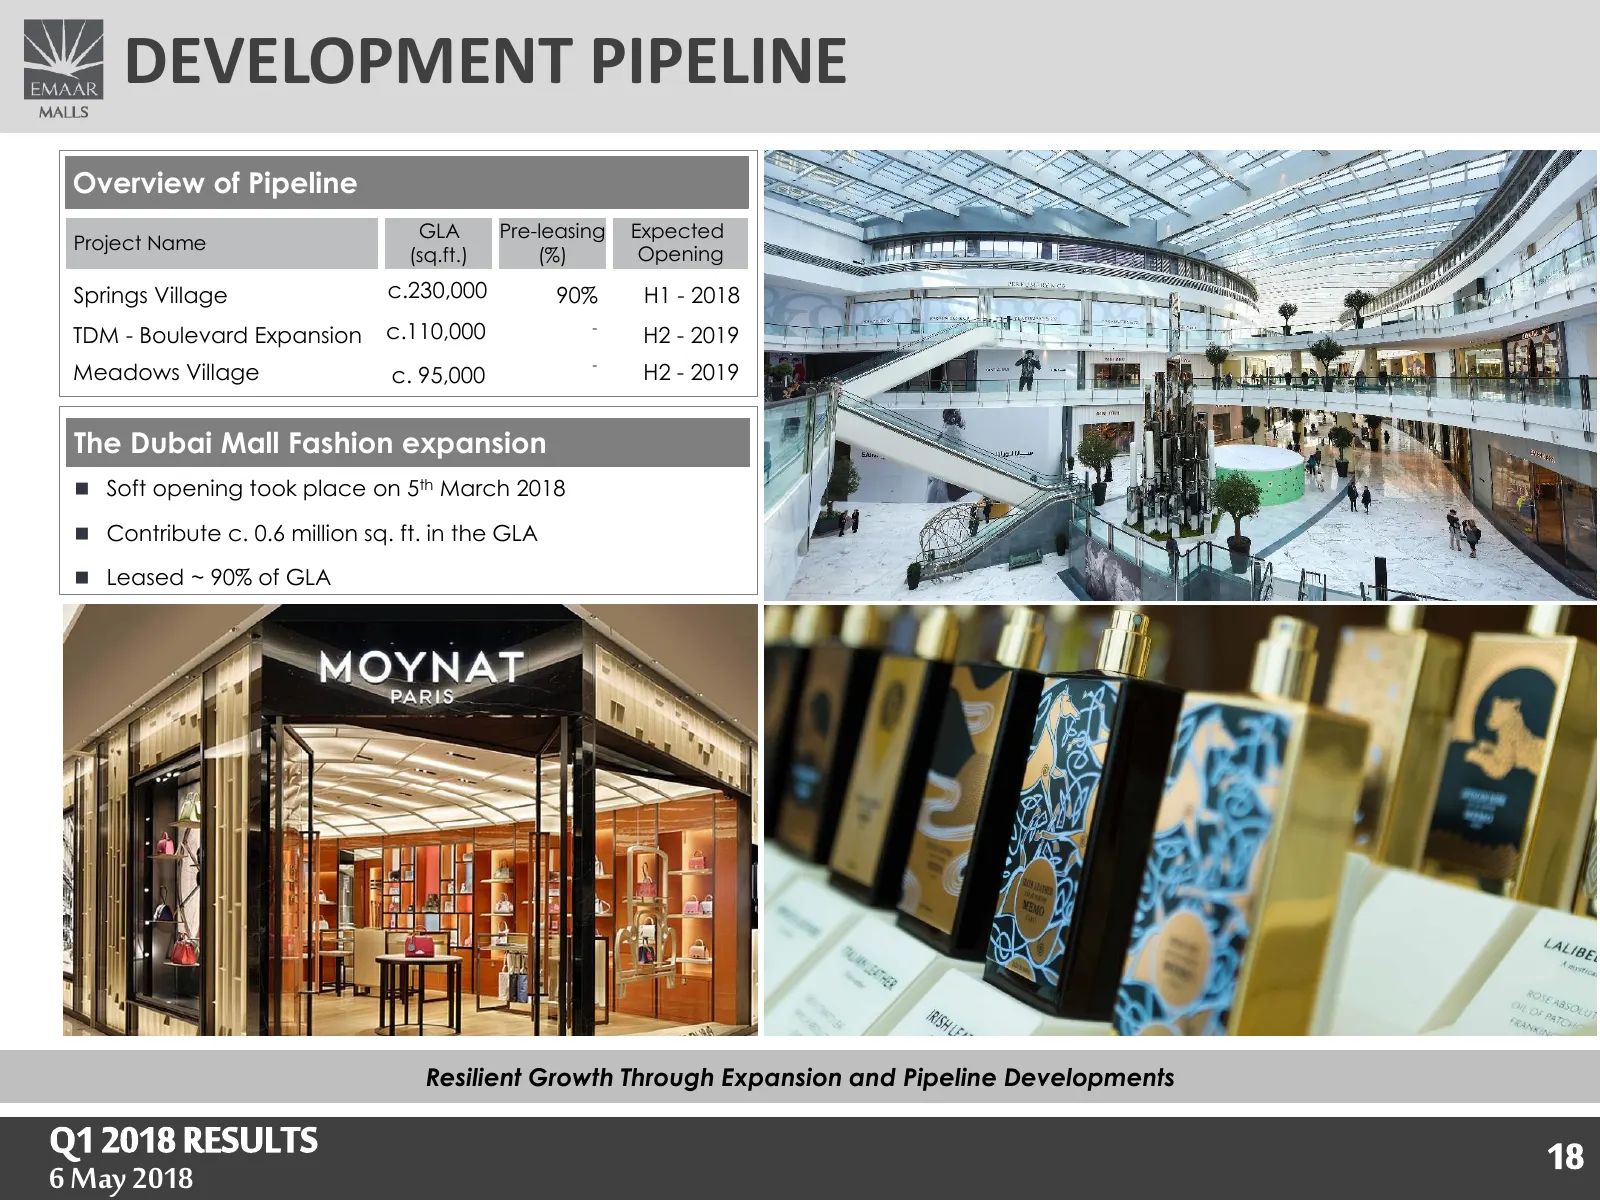
Slide 18: Development Pipeline
DEVELOPMENT PIPELINE Overview of Pipeline GLA Pre-leasing Expected Project Name (sq.ft.) (%) Opening Springs Village c.230,000 90% H1 - 2018 TDM - Boulevard Expansion c.110,000 - H2 - 2019 - Meadows Village c. 95,000 H2 - 2019 The Dubai Mall Fashion expansion Soft opening took place on 5th March 2
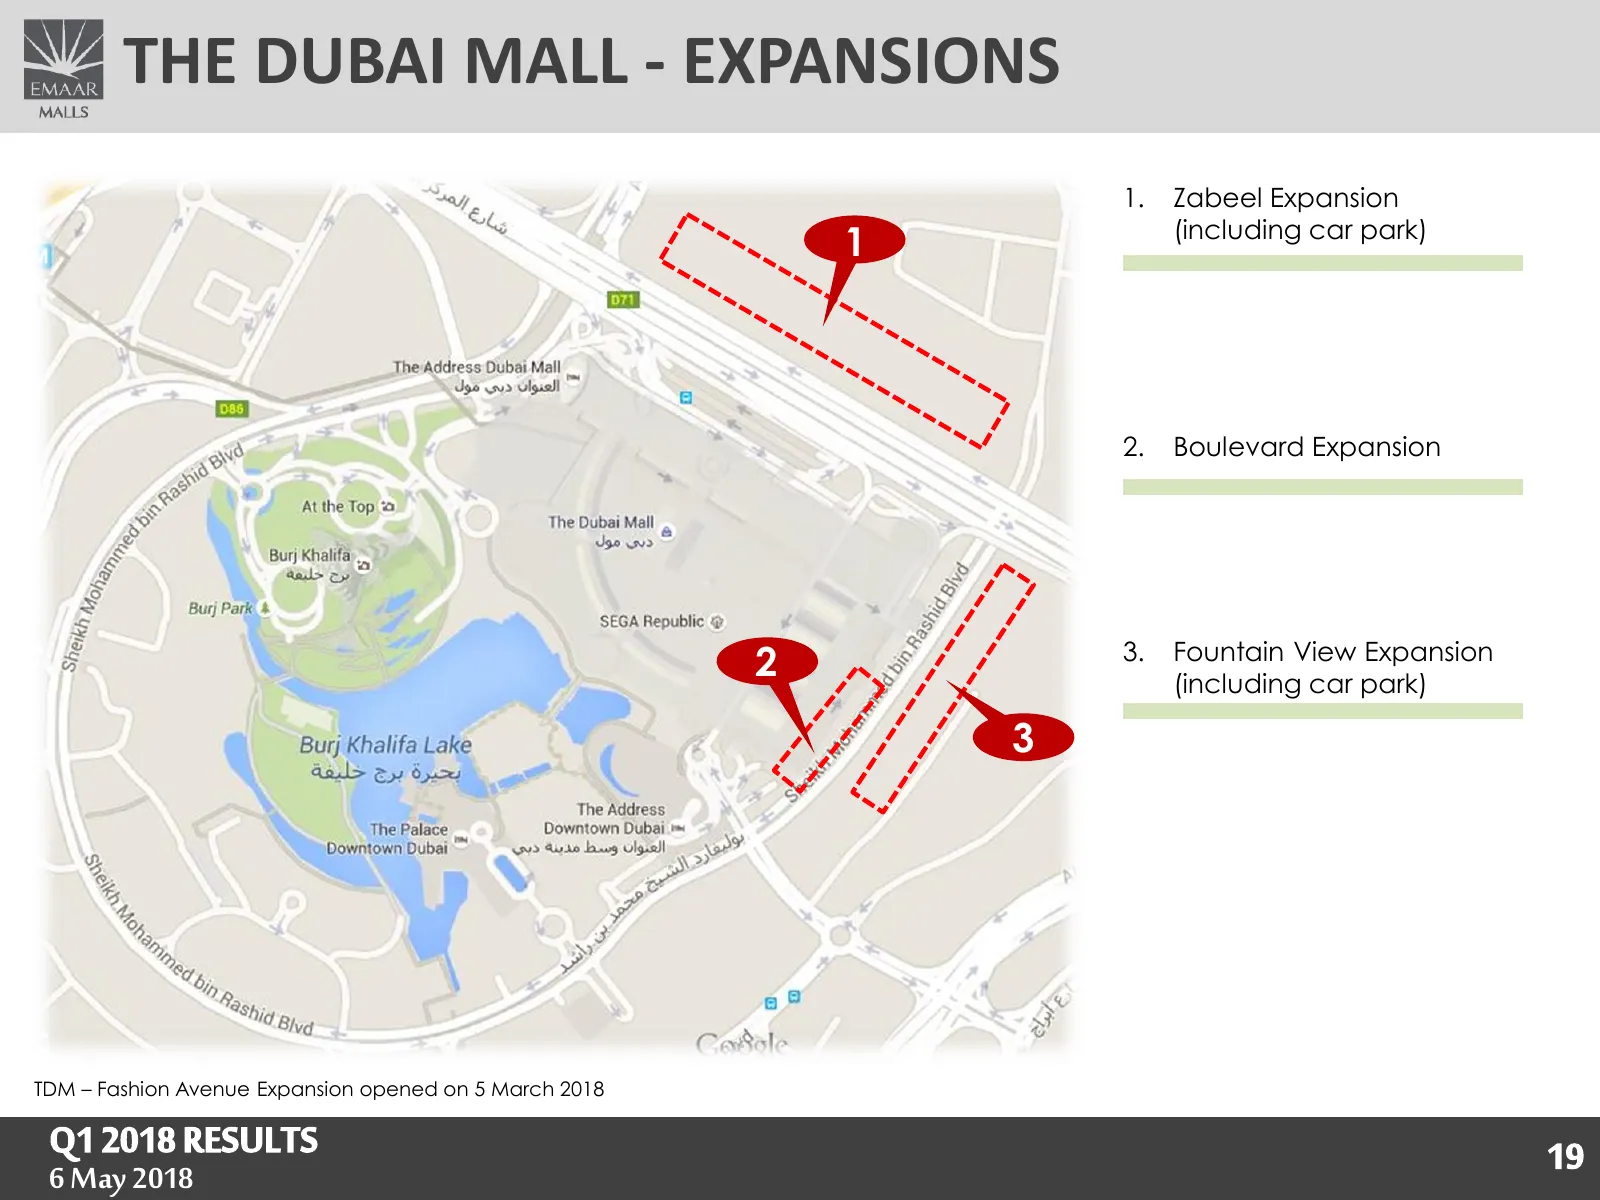
Slide 19: The Dubai Mall - Expansions
THE DUBAI MALL - EXPANSIONS 1. Zabeel Expansion (including car park) 11 2. Boulevard Expansion 3. Fountain View Expansion 22 (including car park) 33 TDM – Fashion Avenue Expansion opened on 5 March 2018 Q1 2018 RESULTS 1919 6 May 18 May2018 2017
Slide 20: Consolidated Financial Statements
CONSOLIDATED FINANCIAL STATEMENTS Q1 2018 RESULTS 2020 6 May 18 May2018 2017
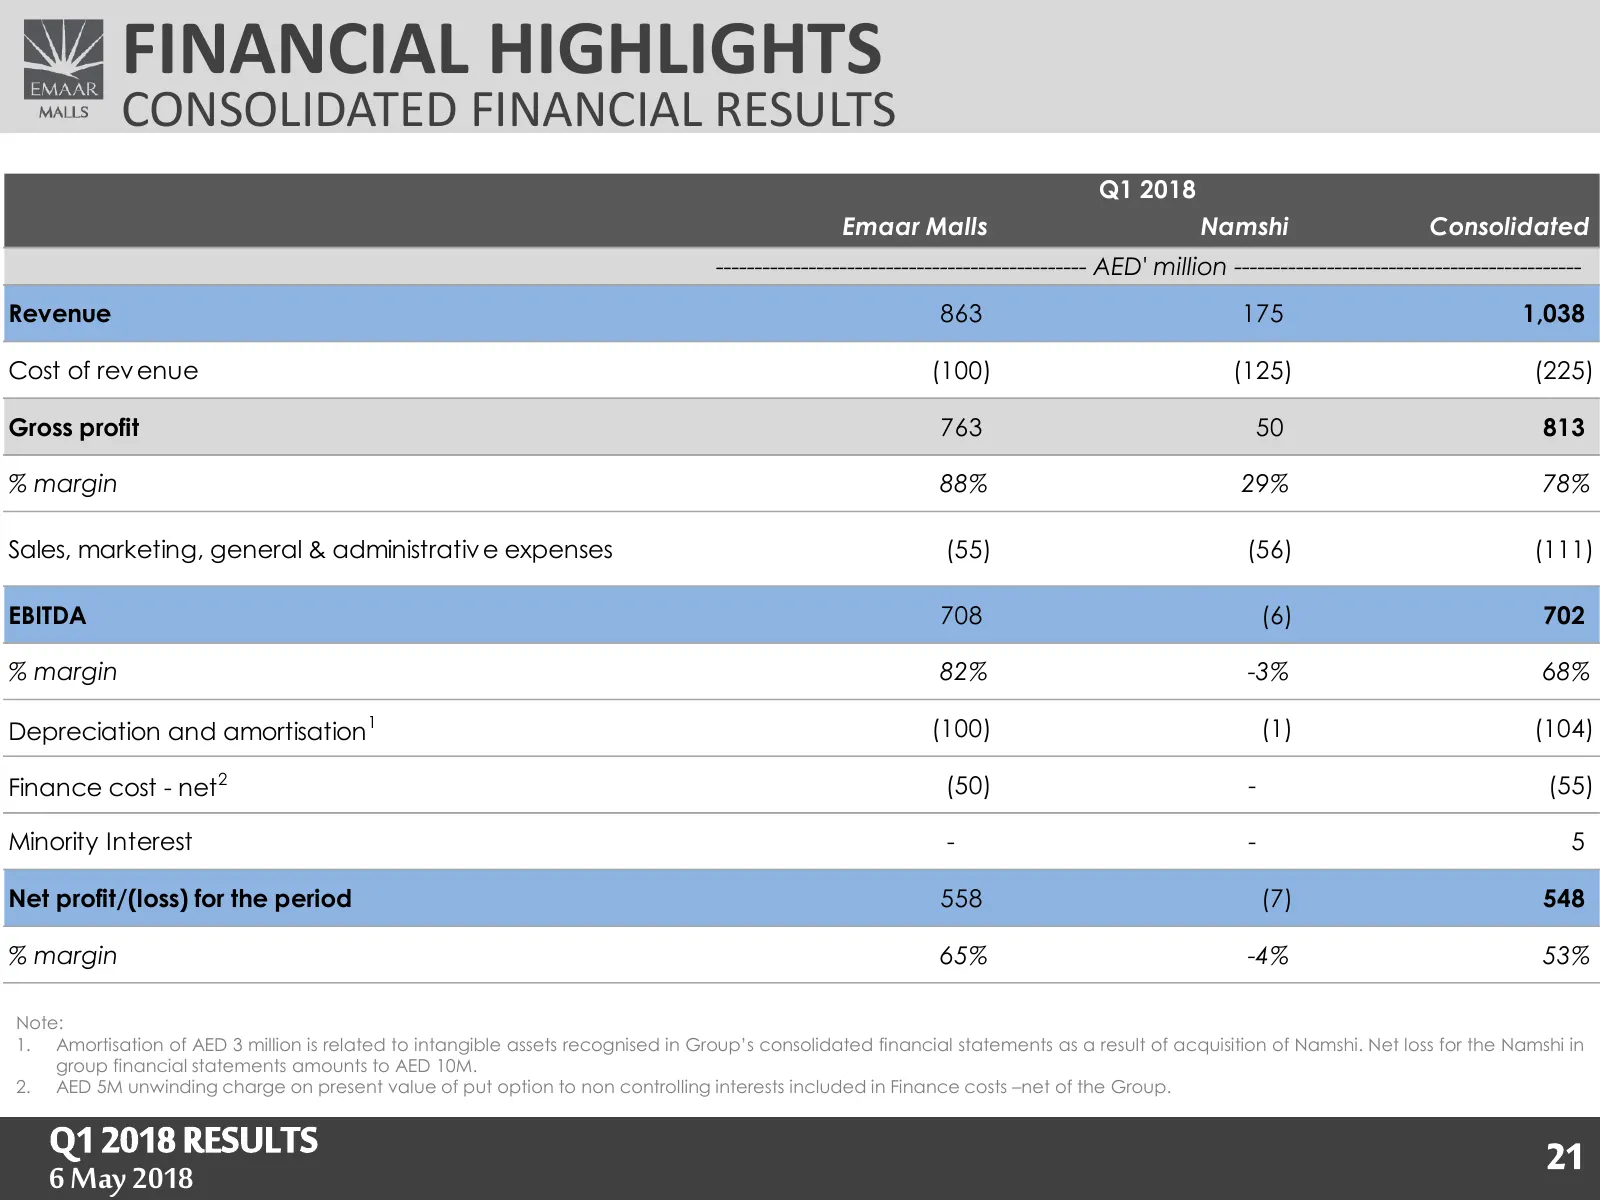
Slide 21: Financial Highlights
FINANCIAL HIGHLIGHTS CONSOLIDATED FINANCIAL RESULTS Q1 2018 Emaar Malls Namshi Consolidated ------------------------------------------------ AED' million --------------------------------------------- Revenue 863 175 1,038 Cost of rev enue (100) (125) (225) Gross profit 763 50 813 % margin 88% 29% 78
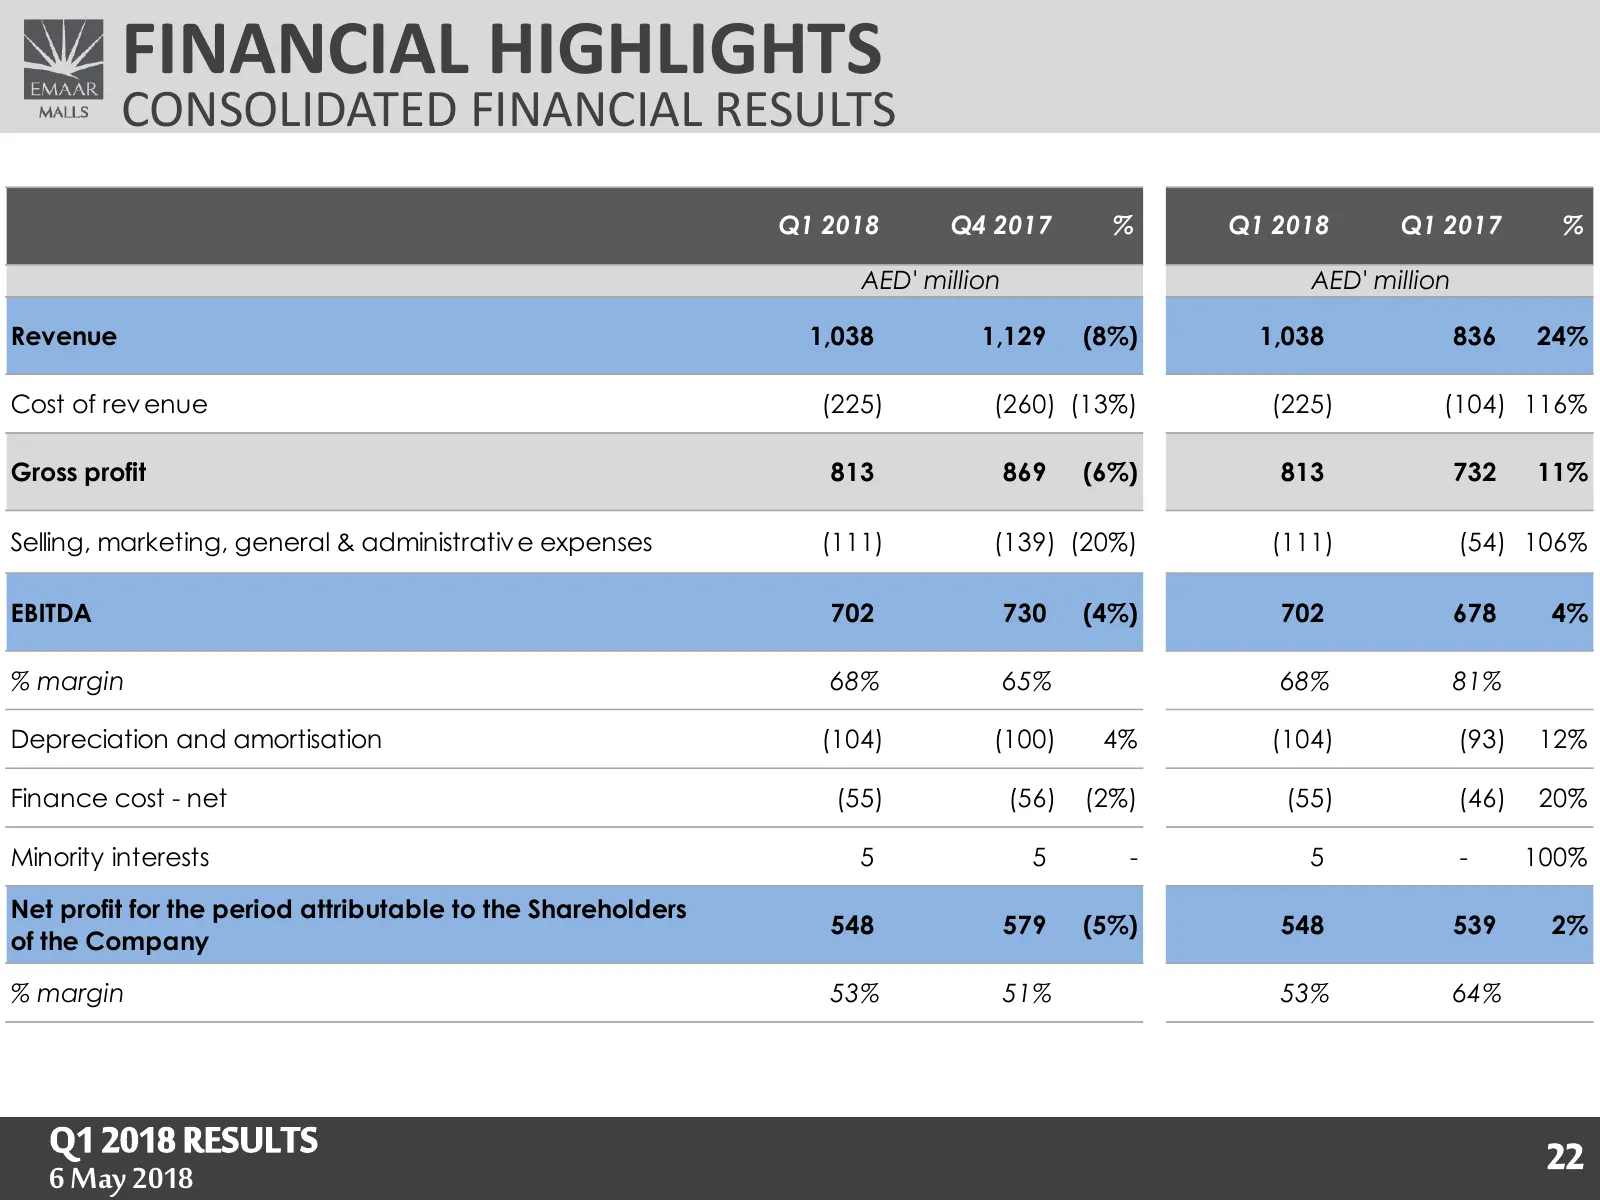
Slide 22: Financial Highlights
FINANCIAL HIGHLIGHTS CONSOLIDATED FINANCIAL RESULTS Q1 2018 Q4 2017 % Q1 2018 Q1 2017 % AED' million AED' million Revenue 1,038 1,129 (8%) 1,038 836 24% Cost of rev enue (225) (260) (13%) (225) (104) 116% Gross profit 813 869 (6%) 813 732 11% Selling, marketing, general & administrativ e expenses (1
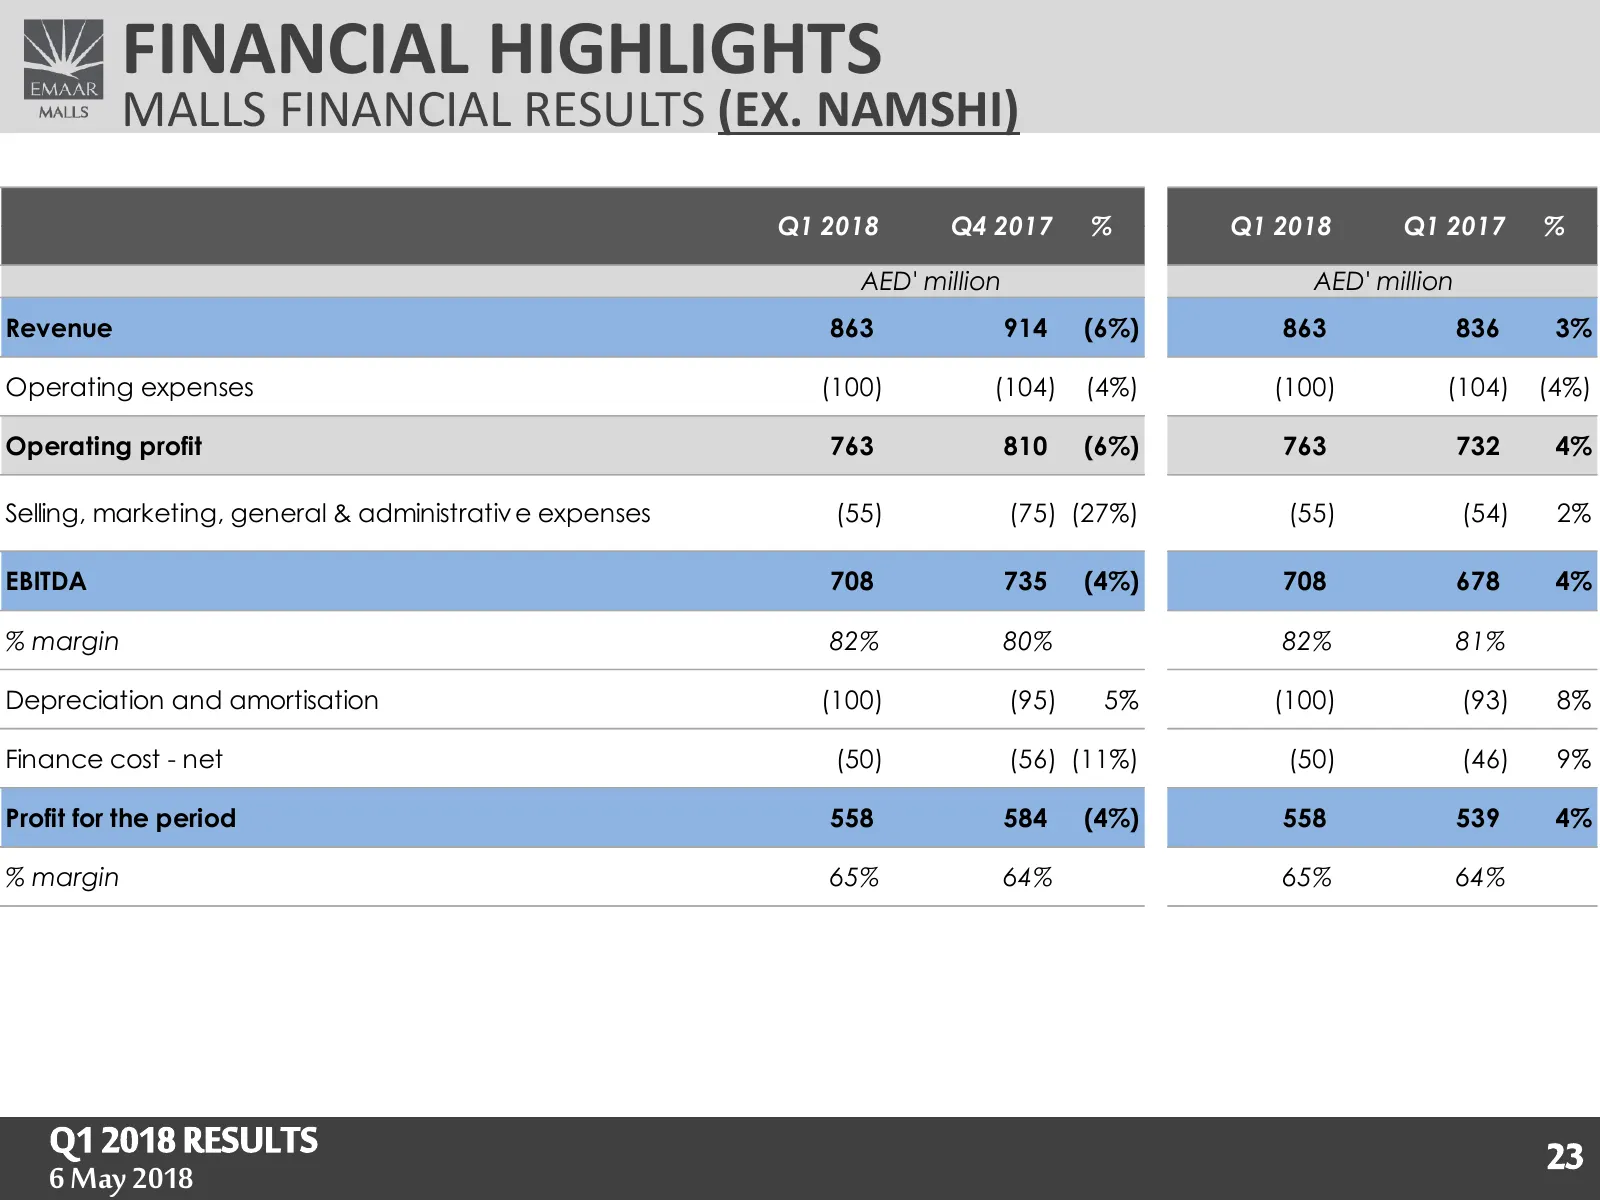
Slide 23: Financial Highlights: Malls Financial Results (ex. Namshi)
FINANCIAL HIGHLIGHTS MALLS FINANCIAL RESULTS (EX. NAMSHI) Q1 2018 Q4 2017 % Q1 2018 Q1 2017 % AED' million AED' million Revenue 863 914 (6%) 863 836 3% Operating expenses (100) (104) (4%) (100) (104) (4%) Operating profit 763 810 (6%) 763 732 4% Selling, marketing, general & administrativ e expenses
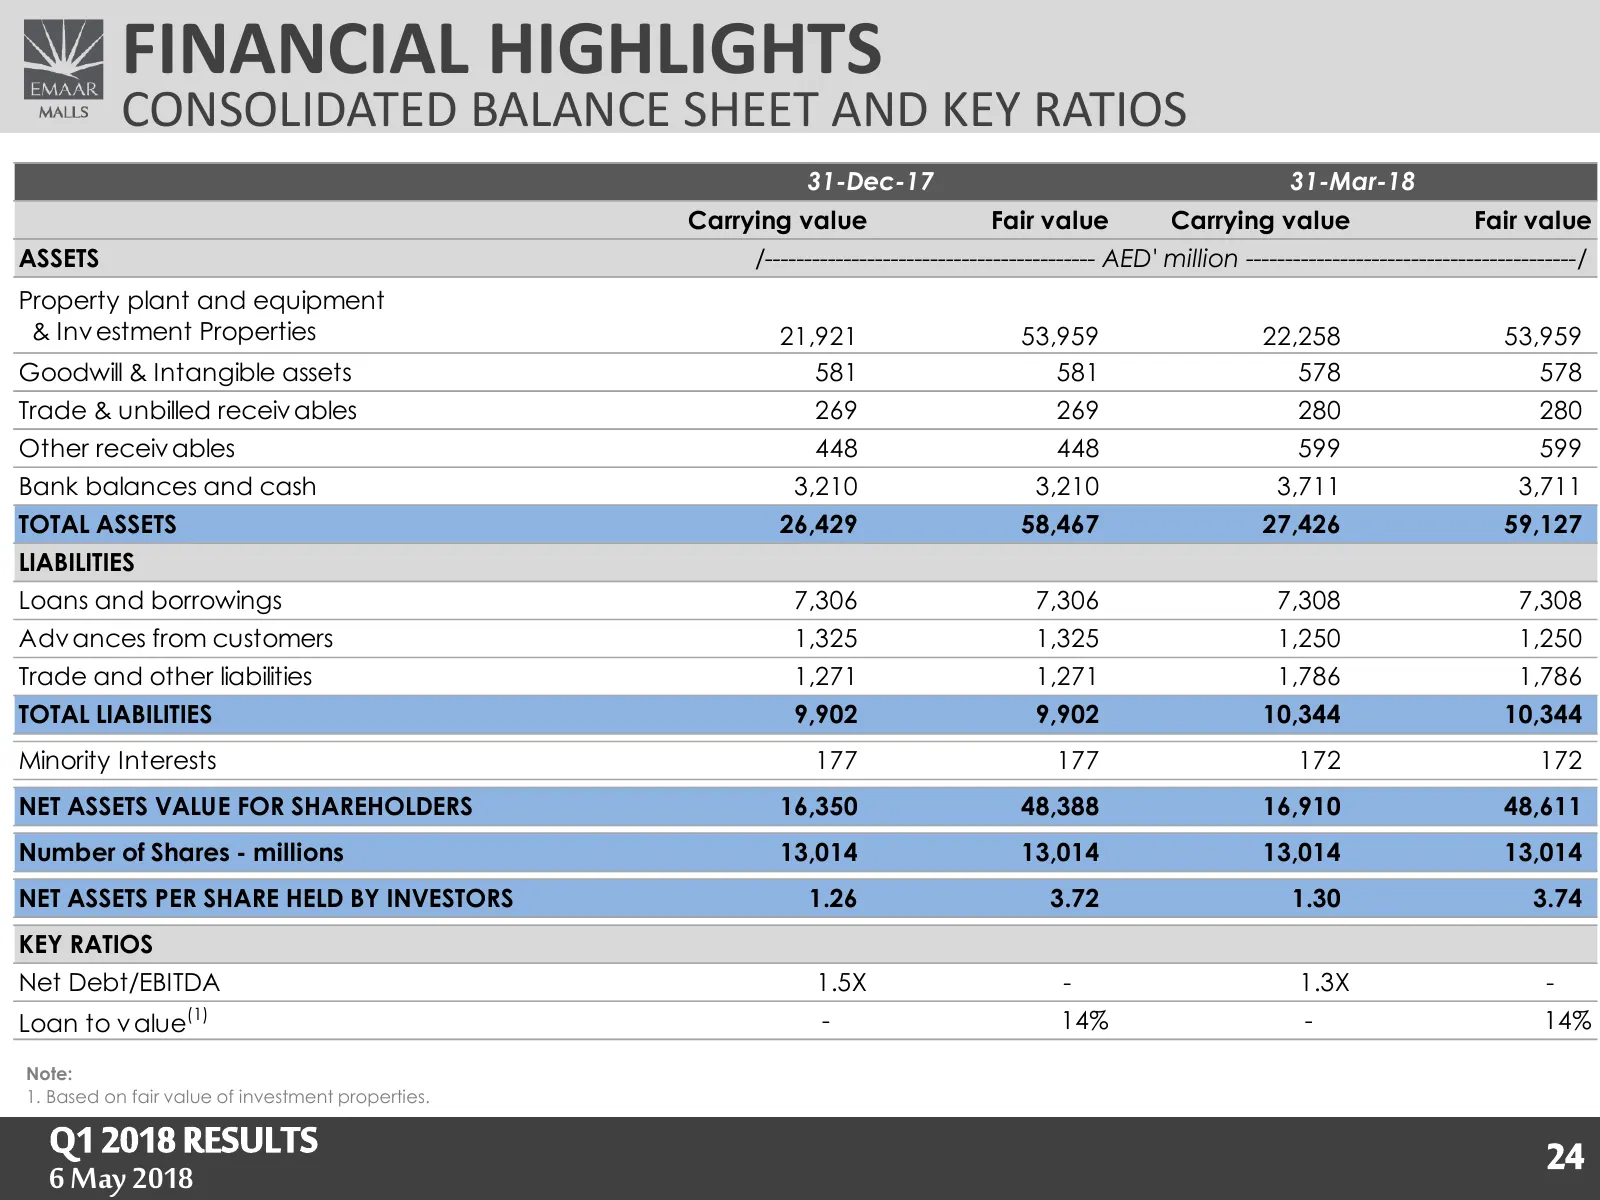
Slide 24: Financial Highlights: Consolidated Balance Sheet and Key Ratios
FINANCIAL HIGHLIGHTS CONSOLIDATED BALANCE SHEET AND KEY RATIOS 31-Dec-17 31-Mar-18 Carrying value Fair value Carrying value Fair value ASSETS /------------------------------------------ AED' million ------------------------------------------/ Property plant and equipment & Inv estment Properties 21,
Slide 25: Thank You
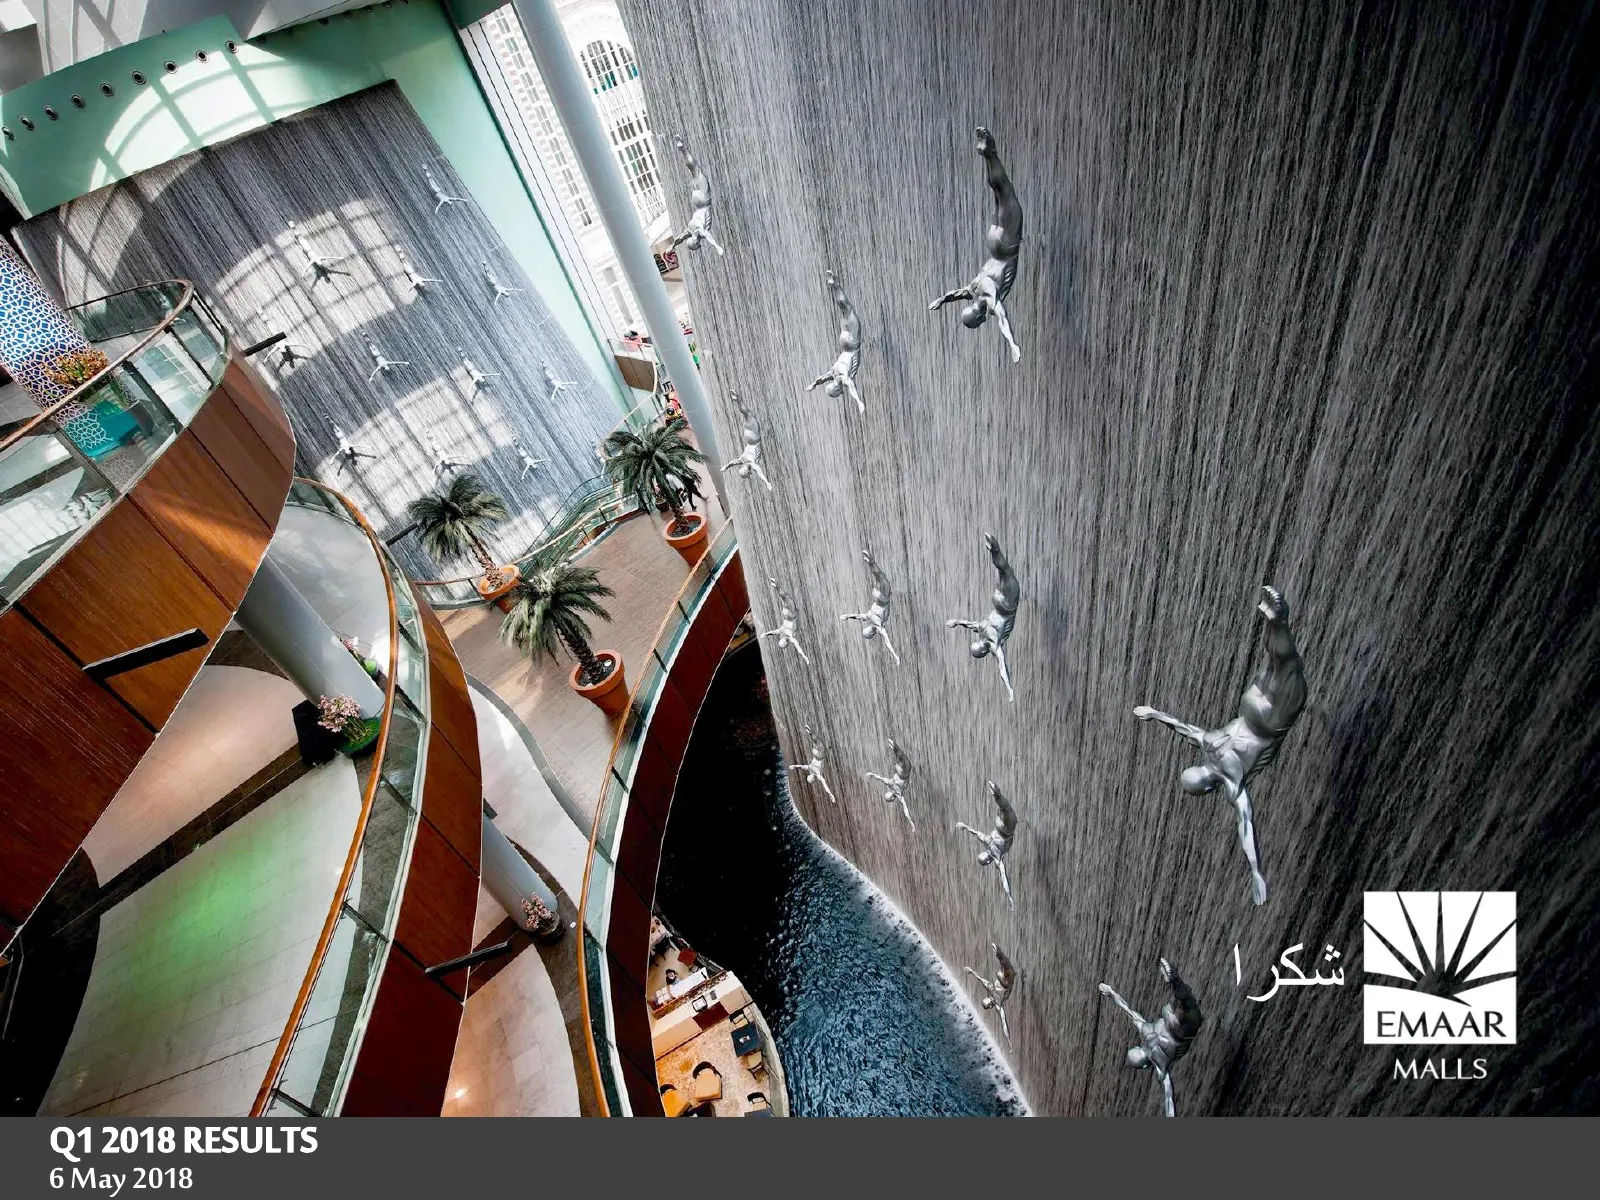
شكرا Q1 2018 RESULTS 25 6 May 2018
Source: Internet Archive copy of propdubaidc.emaar.com
More decks from Emaar Properties (P.J.S.C)
 H1 2026 Earnings Presentation78 slides · 2026
 Emaar Properties — 9M 2025 Earnings Presentation69 slides · November 2025
 H1 2025 Earnings Presentation69 slides · August 2025
 Emaar Properties — Q1 2025 Earnings Presentation68 slides · May 2025
 Emaar Properties — FY2025 Earnings Presentation71 slides · May 2025
 FY2024 Earnings Presentation70 slides · Feb 24, 2025