Omnitech Engineering Limited · NSE:OMNI
Omnitech Engineering — Q2 FY27 Earnings Presentation
29 slides from Omnitech Engineering's earnings presentation, Nov 5, 2026
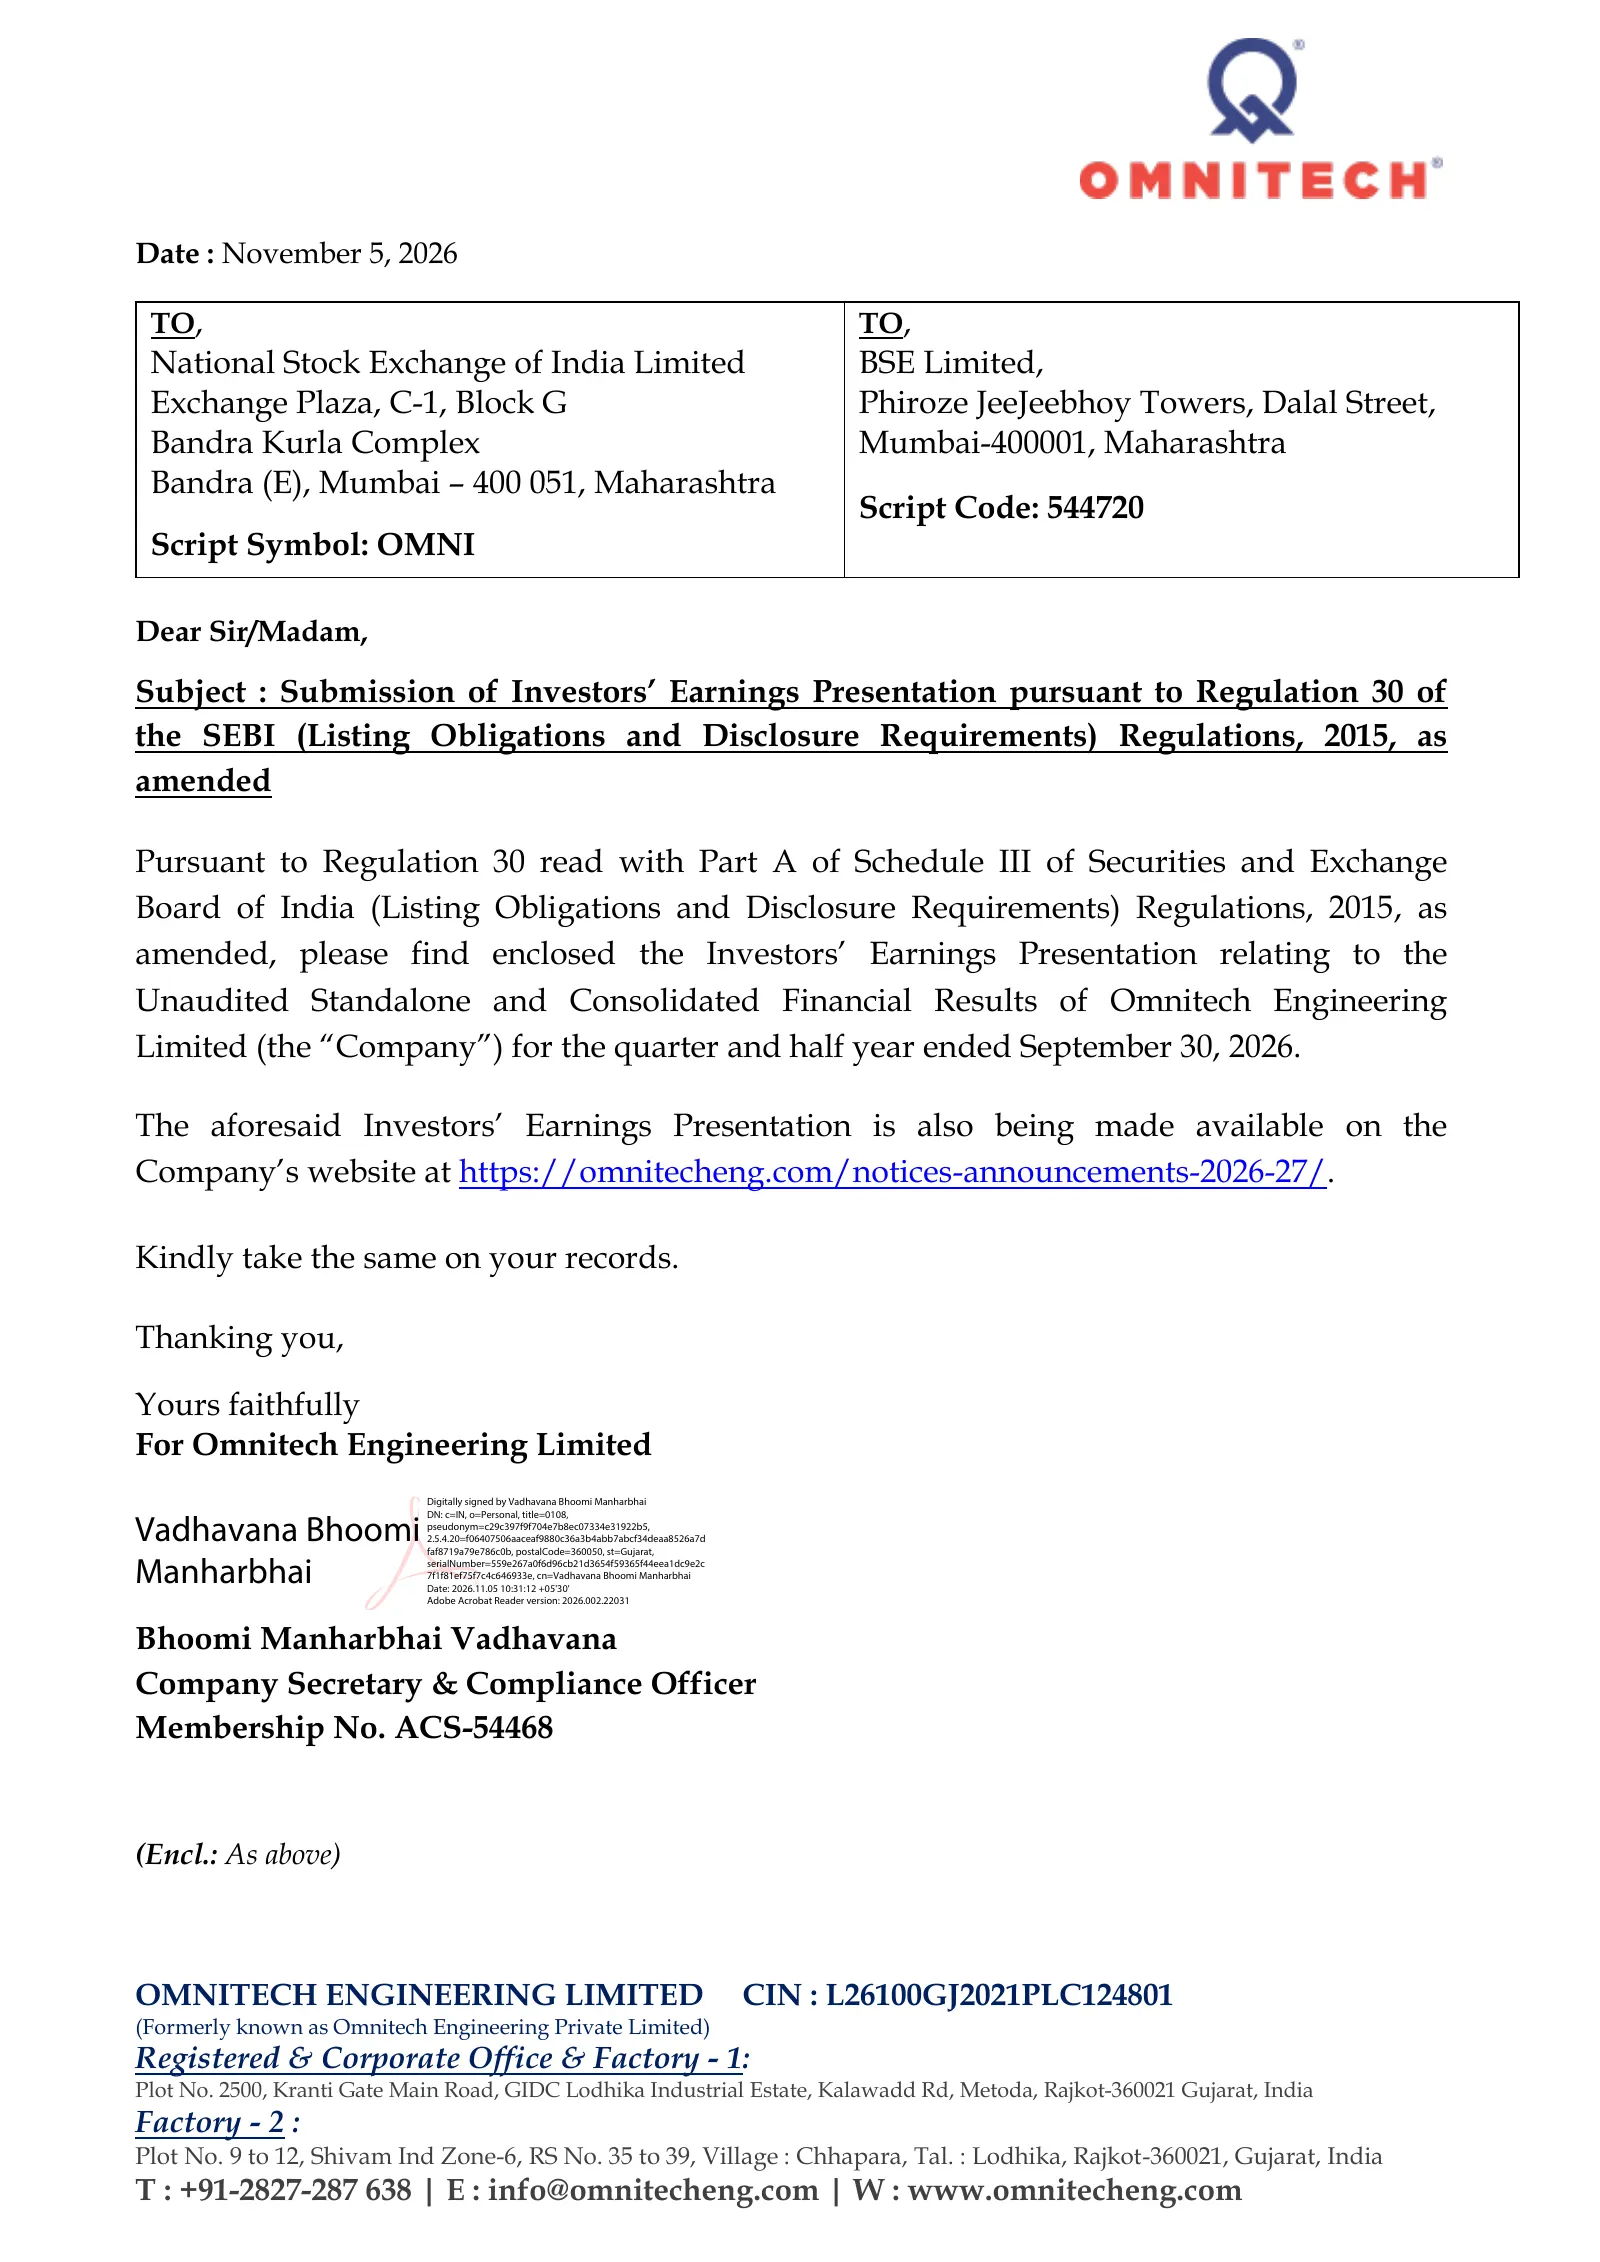
Slide 1: Exchange submission letter for earnings presentation
Date : November 5, 2026 TO, TO, National Stock Exchange of India Limited BSE Limited, Exchange Plaza, C-1, Block G Phiroze JeeJeebhoy Towers, Dalal Street, Bandra Kurla Complex Mumbai-400001, Maharashtra Bandra (E), Mumbai – 400 051, Maharashtra Script Code: 544720 Script Symbol: OMNI Dear Sir/Madam
Slide 2: Update on Earnings for Q2FY27 & H1FY27
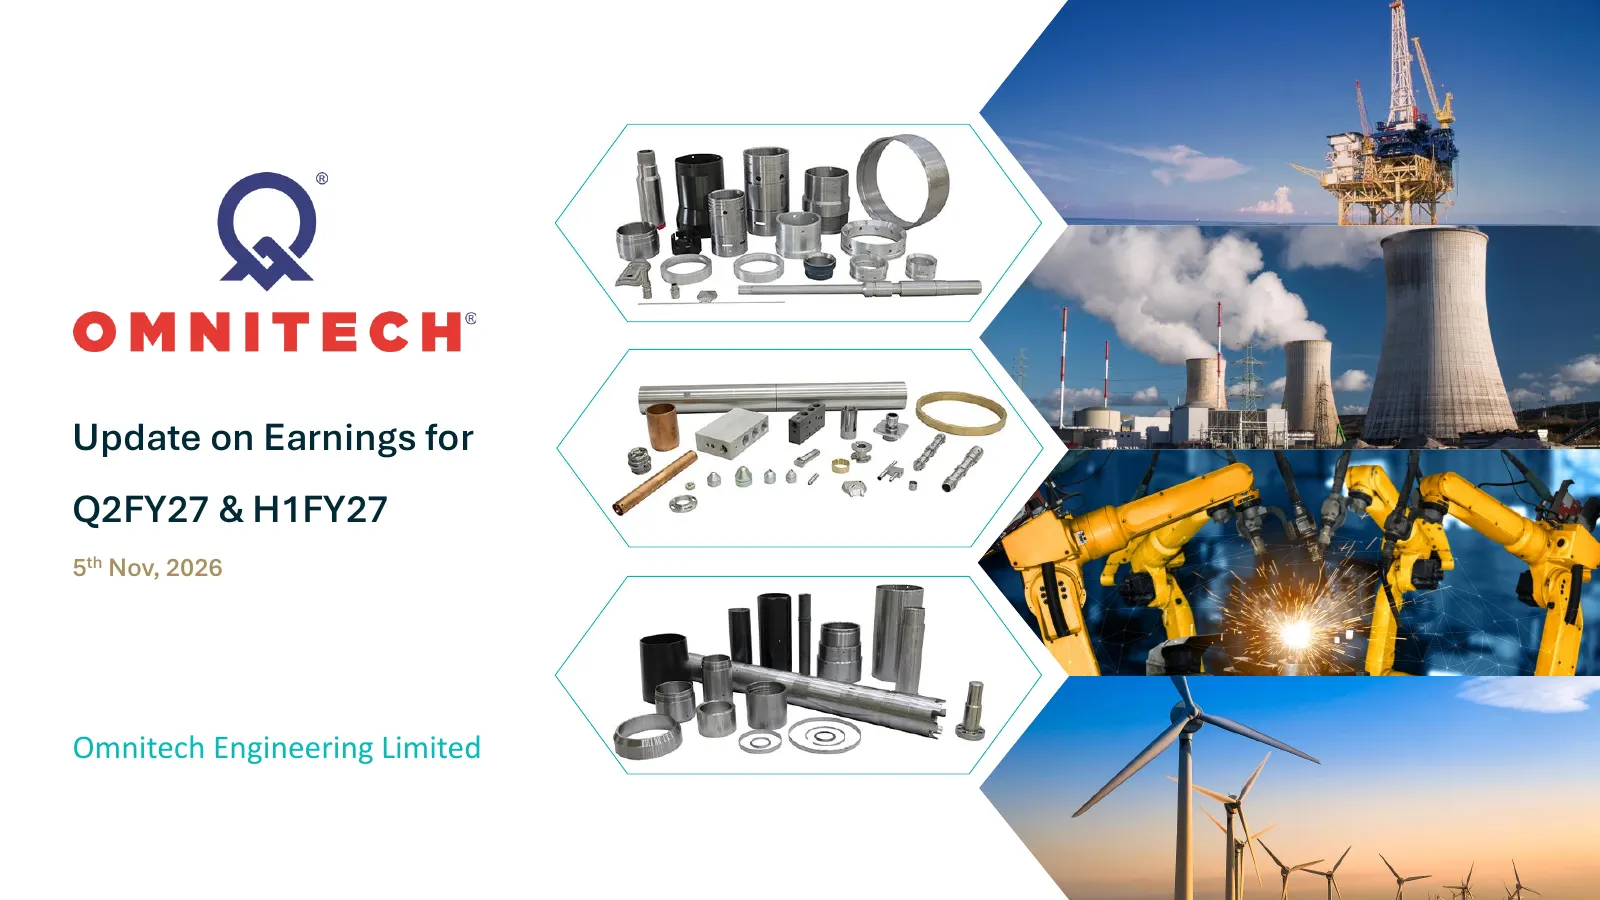
Update on Earnings for Q2FY27 & H1FY27 5th Nov, 2026 Omnitech Engineering Limited
Slide 3: Safe Harbor
Safe Harbor This presentation and the accompanying slides (the “Presentation”), which have been prepared by Omnitech Engineering Limited (the “Company”), have been prepared solely for information purposes and do not constitute any offer, recommendation or invitation to purchase or subscribe for any
Slide 4: Earnings Call – Q2 FY27 & H1 FY27
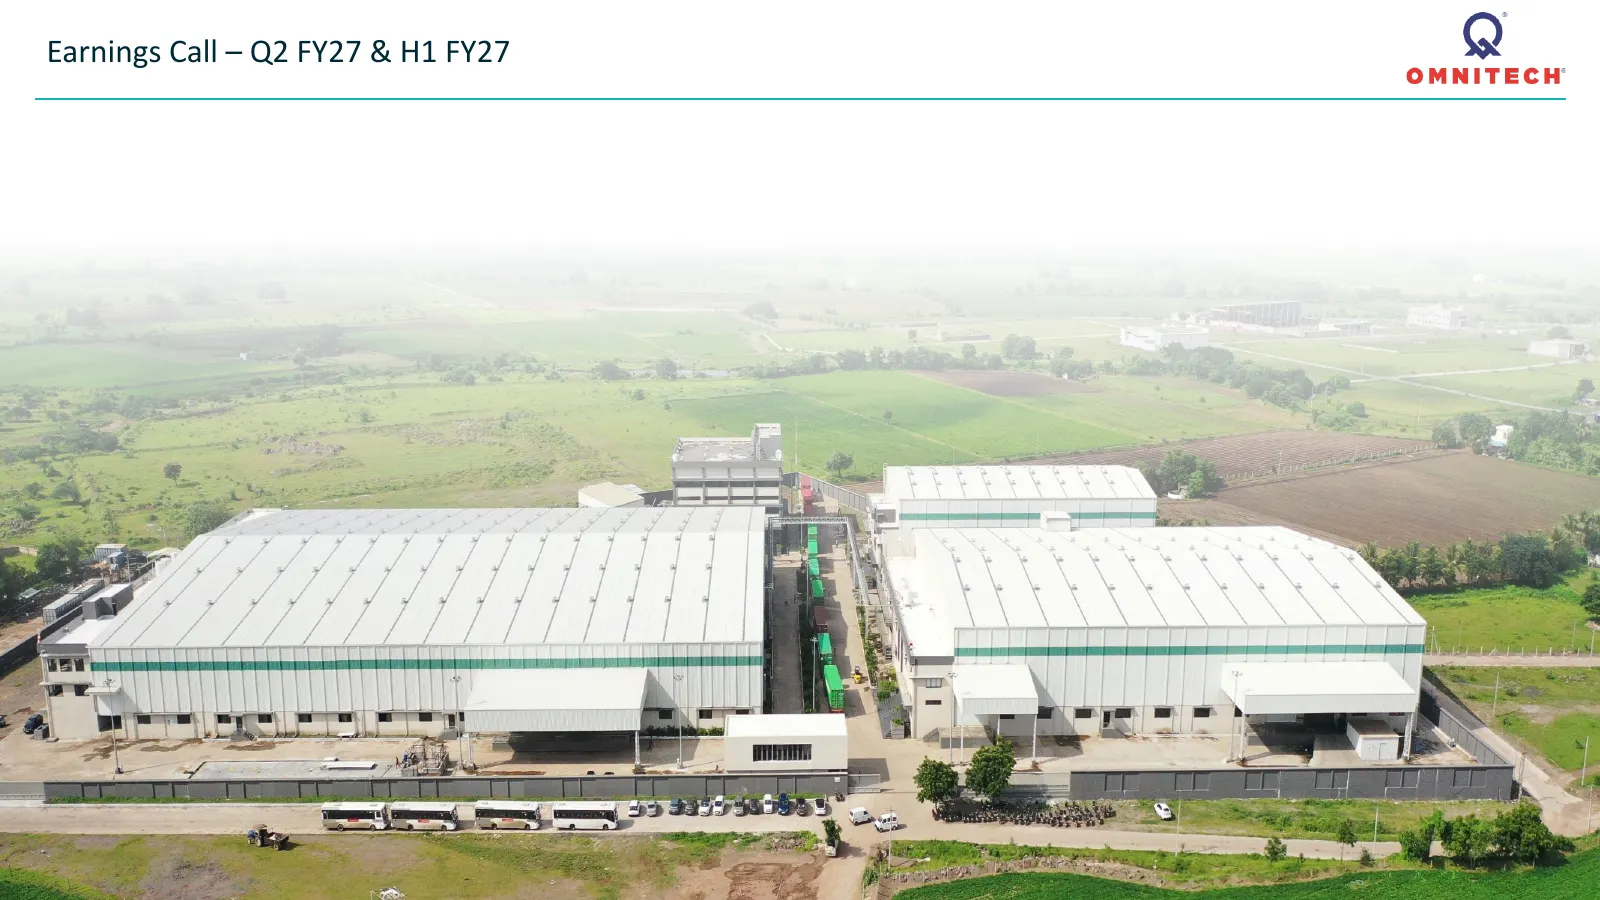
Earnings Call – Q2 FY27 & H1 FY27
Slide 5: Results for period of Q2 FY27 & H1 FY27 (Consolidated)
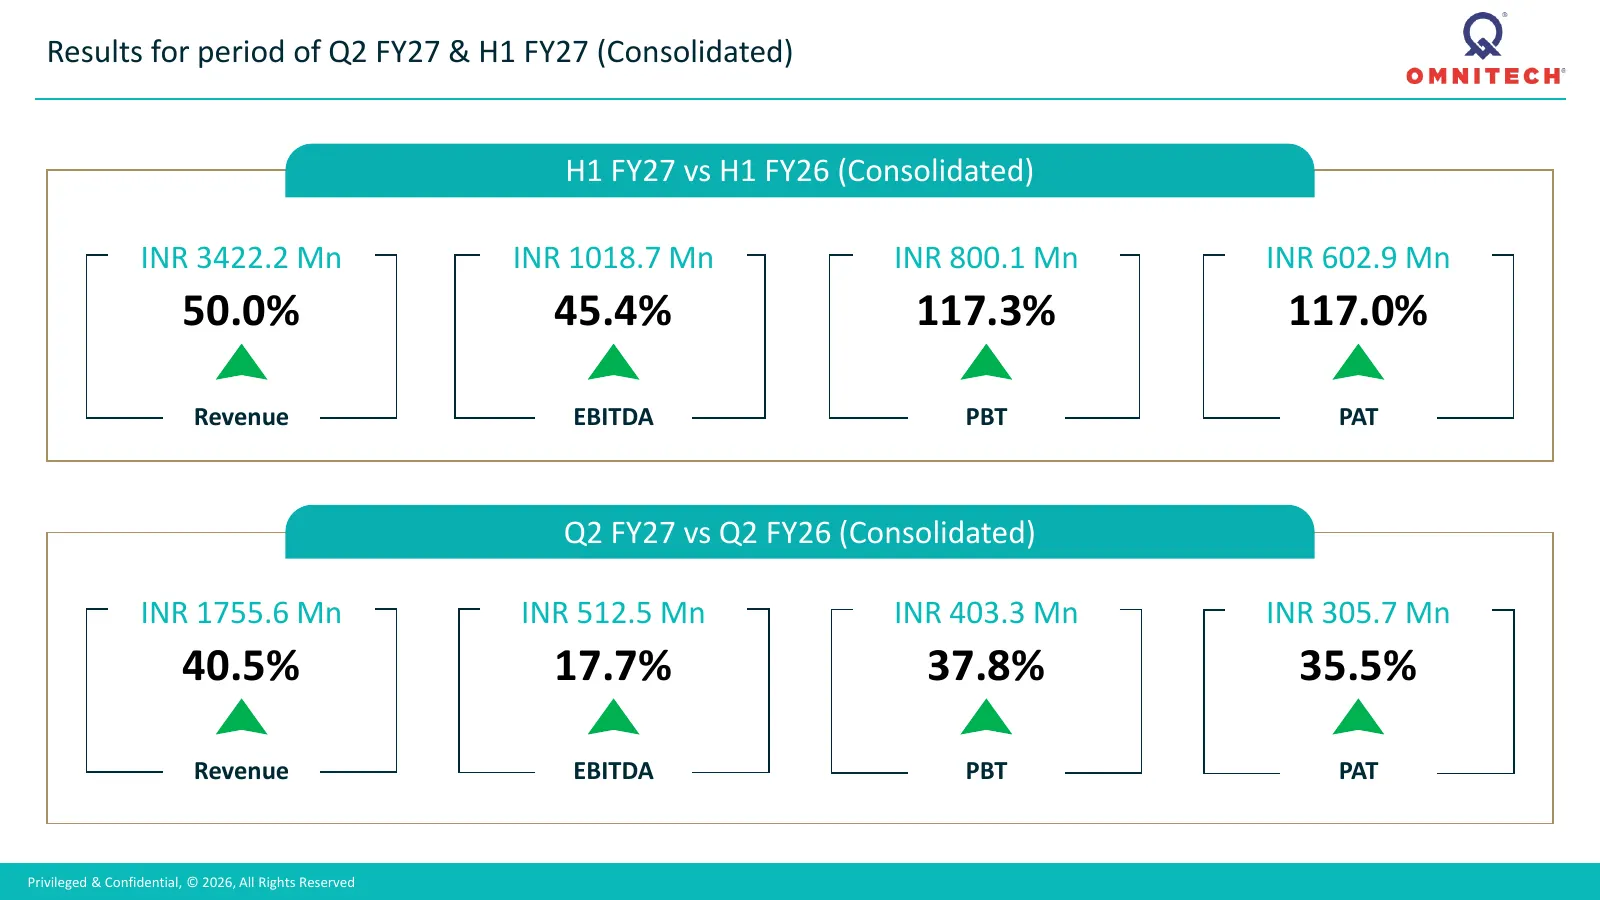
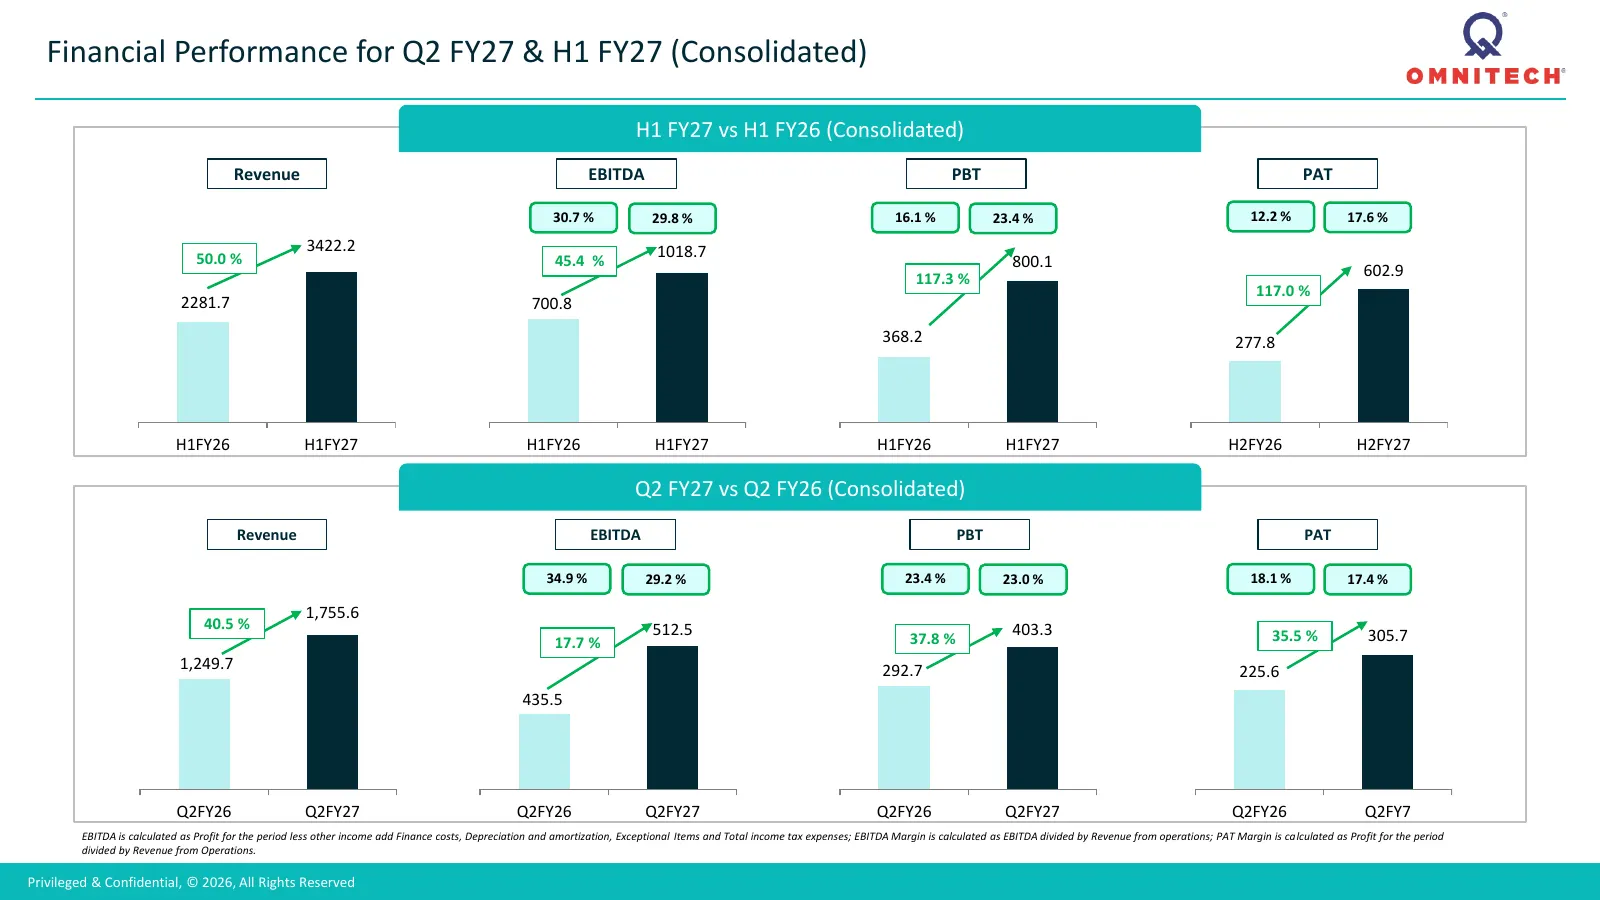
Results for period of Q2 FY27 & H1 FY27 (Consolidated) H1 FY27 vs H1 FY26 (Consolidated) INR 3422.2 Mn INR 1018.7 Mn INR 800.1 Mn INR 602.9 Mn 50.0% 45.4% 117.3% 117.0% Revenue EBITDA PBT PAT Q2 FY27 vs Q2 FY26 (Consolidated) INR 1755.6 Mn INR 512.5 Mn INR 403.3 Mn INR 305.7 Mn 40.5% 17.7% 37.8% 35.
Slide 6: Financial Performance for Q2 FY27 & H1 FY27 (Consolidated)
Financial Performance for Q2 FY27 & H1 FY27 (Consolidated) H1 FY27 vs H1 FY26 (Consolidated) Revenue EBITDA PBT PAT 30.7 % 29.8 % 16.1 % 23.4 % 12.2 % 17.6 % 3422.2 1018.7 50.0 % 45.4 % 800.1 117.3 % 602.9 117.0 % 2281.7 700.8 368.2 277.8 H1FY26 H1FY27 H1FY26 H1FY27 H1FY26 H1FY27 H2FY26 H2FY27 Q2 FY
Slide 7: Financial Snapshot for period Q2 FY27 (Consolidated)
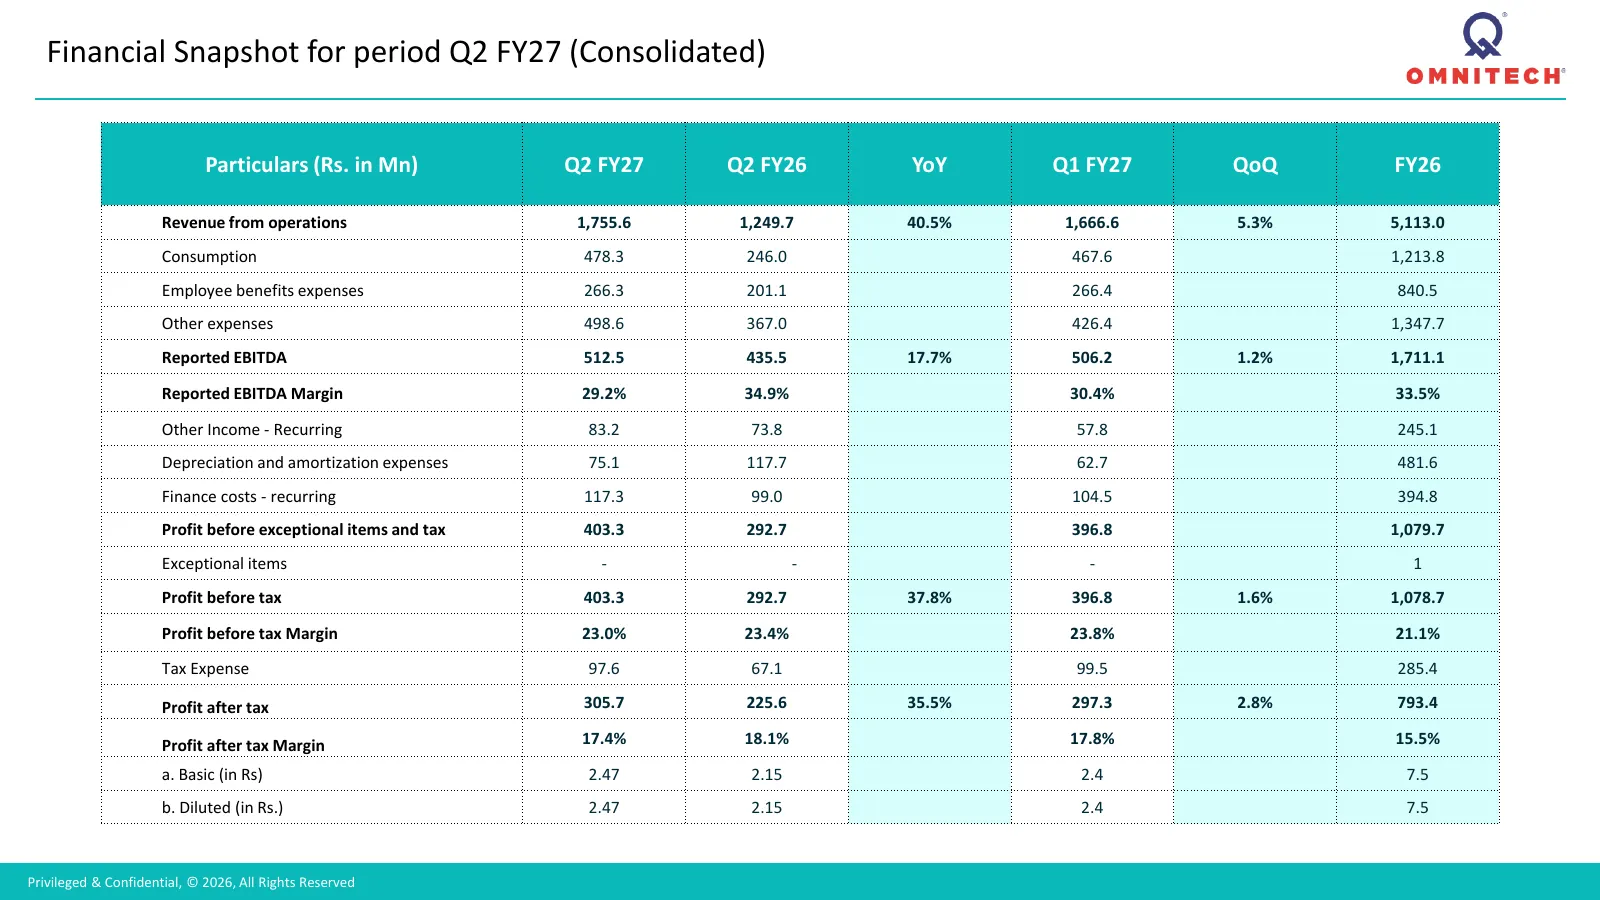
Financial Snapshot for period Q2 FY27 (Consolidated) Particulars (Rs. in Mn) Q2 FY27 Q2 FY26 YoY Q1 FY27 QoQ FY26 Revenue from operations 1,755.6 1,249.7 40.5% 1,666.6 5.3% 5,113.0 Consumption 478.3 246.0 467.6 1,213.8 Employee benefits expenses 266.3 201.1 266.4 840.5 Other expenses 498.6 367.0 426
Slide 8: Financial Performance (Consolidated)
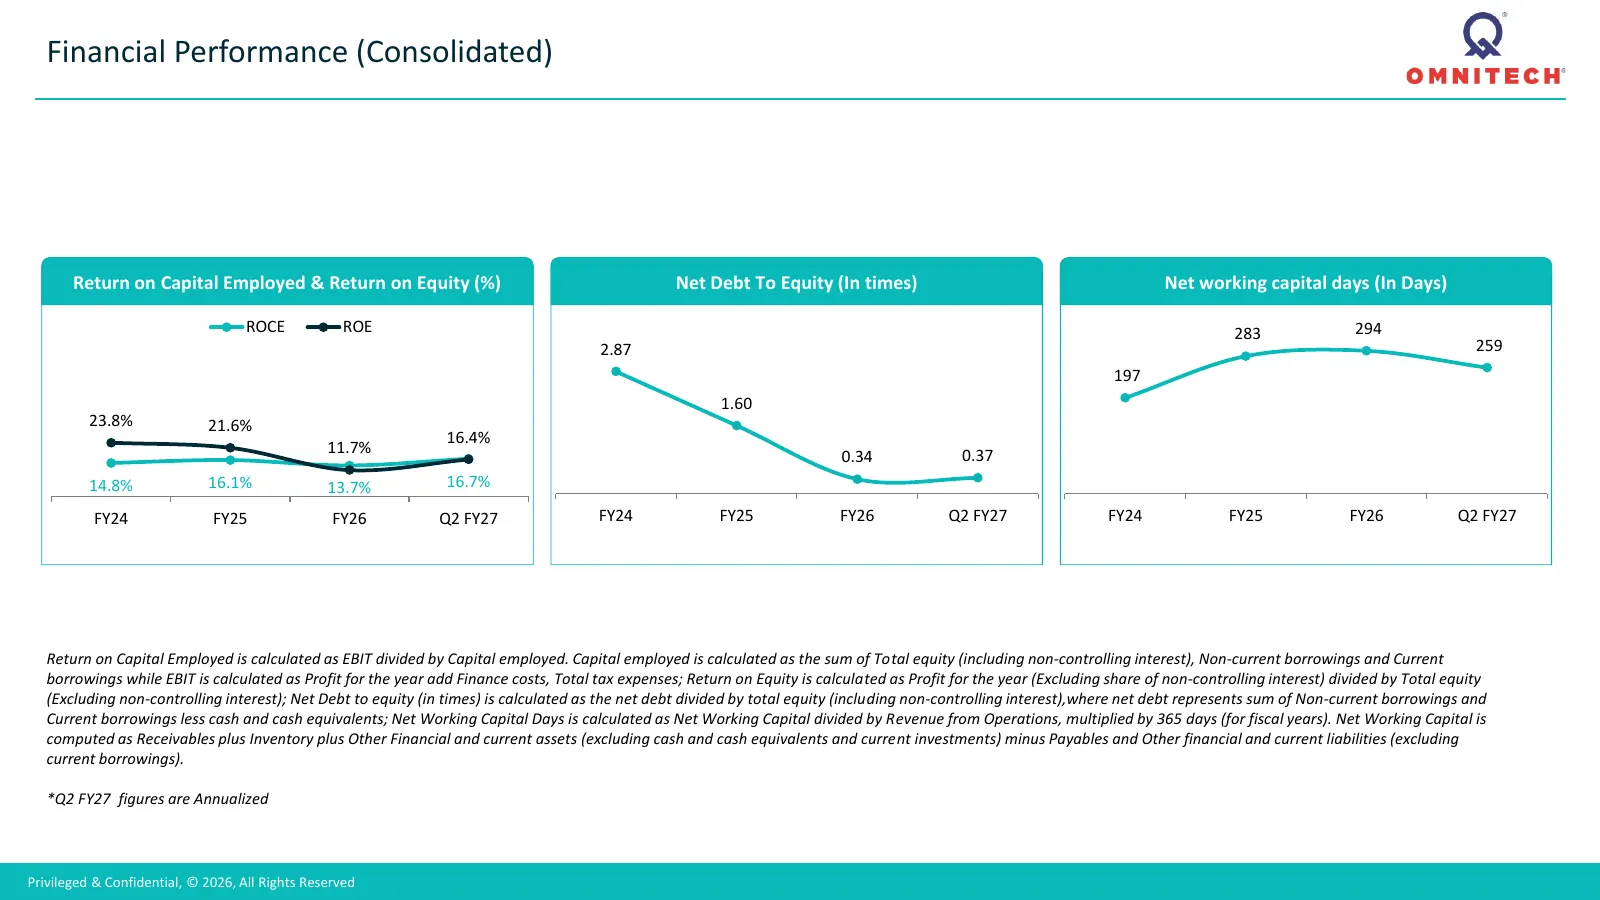
Financial Performance (Consolidated) Return on Capital Employed & Return on Equity (%) Net Debt To Equity (In times) Net working capital days (In Days) ROCE ROE 283 294 2.87 259 197 1.60 23.8% 21.6% 16.4% 11.7% 0.37 0.34 14.8% 16.1% 13.7% 16.7% FY24 FY25 FY26 Q2 FY27 FY24 FY25 FY26 Q2 FY27 FY24 FY25
Slide 9: Revenue split by End User Industries & Geographies and Business Update
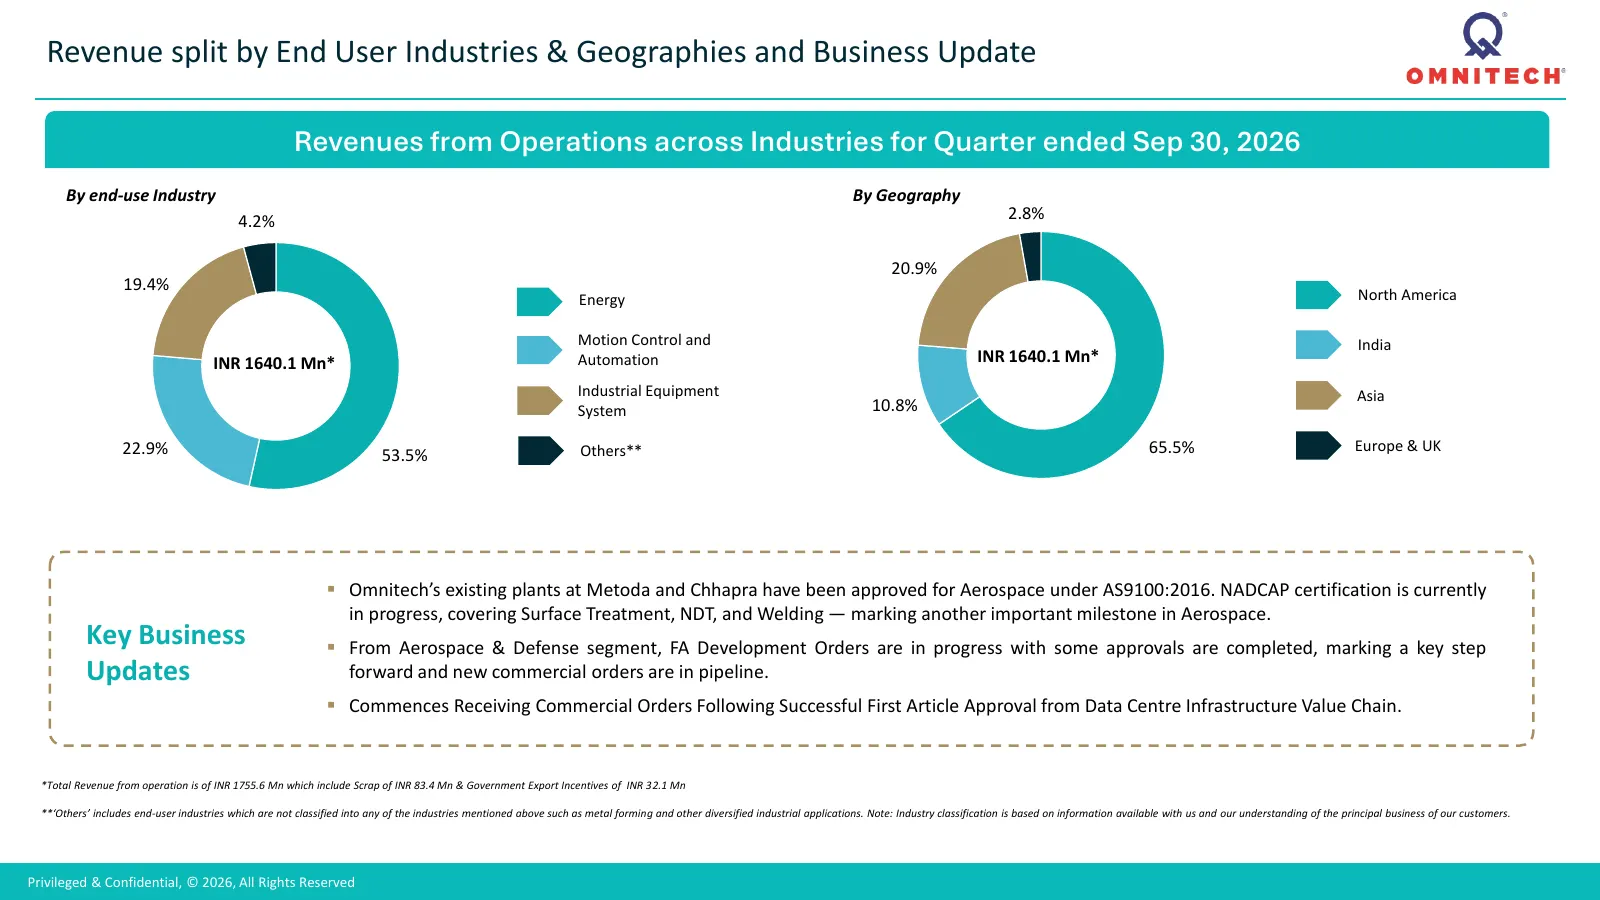
Revenue split by End User Industries & Geographies and Business Update Revenues from Operations across Industries for Quarter ended Sep 30, 2026 By end-use Industry By Geography 4.2% 2.8% 20.9% 19.4% Energy North America Motion Control and India INR 1640.1 Mn* Automation INR 1640.1 Mn* Industrial Eq
Slide 10: Strong And Expanding Order Book
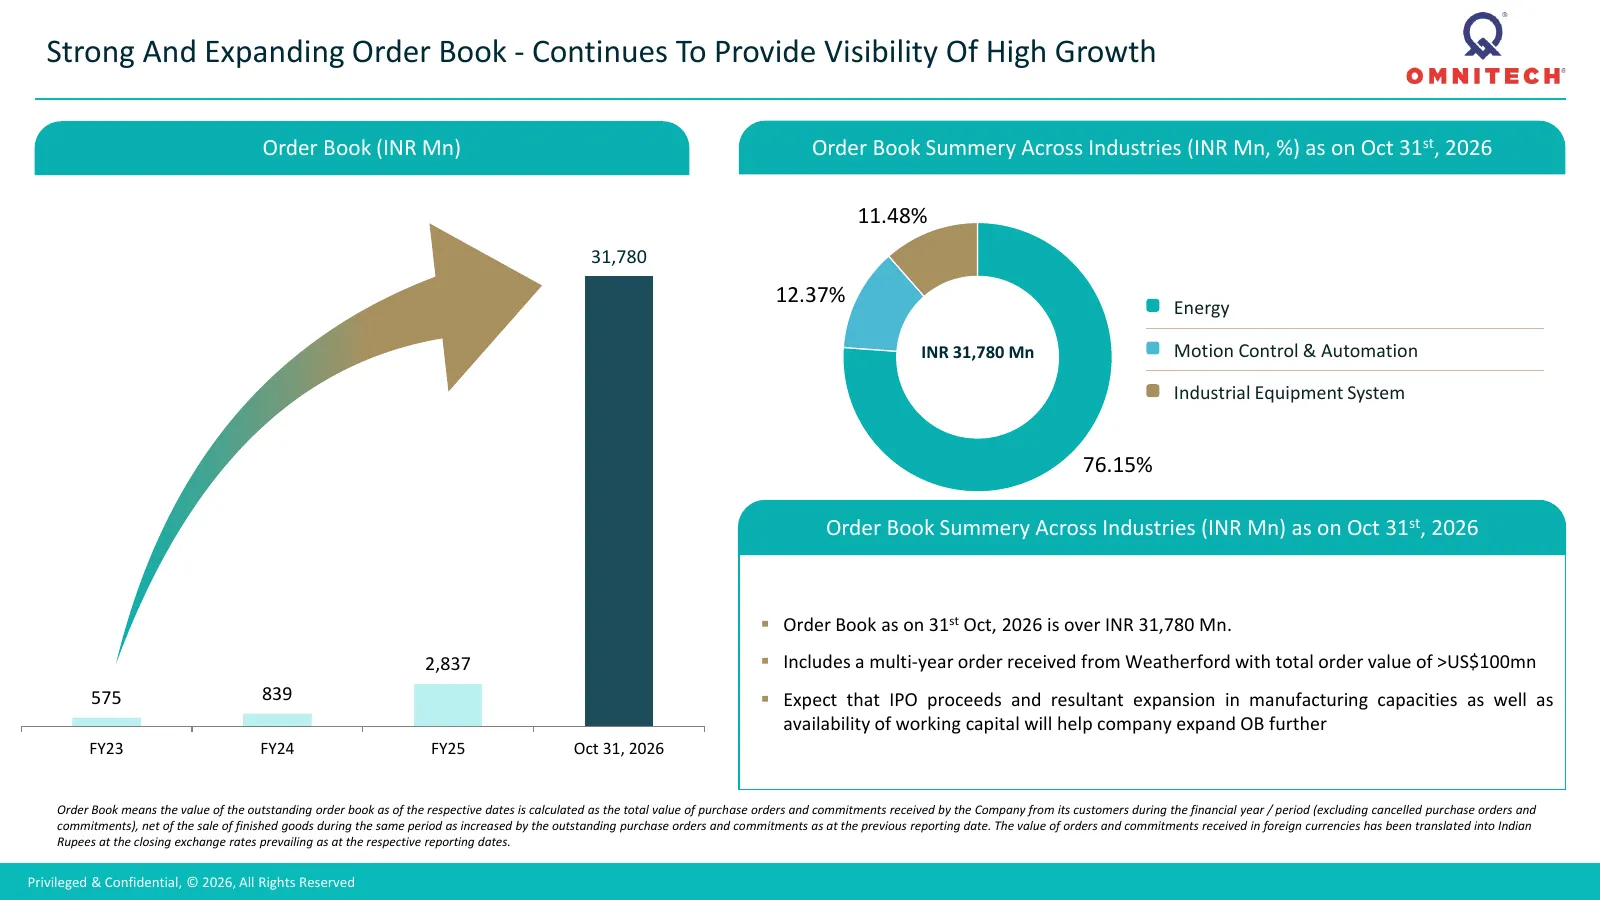
Strong And Expanding Order Book - Continues To Provide Visibility Of High Growth Order Book (INR Mn) Order Book Summery Across Industries (INR Mn, %) as on Oct 31st, 2026 11.48% 31,780 12.37% Energy INR 31,780 Mn Motion Control & Automation Industrial Equipment System 76.15% Order Book Summery Acros
Slide 11: Ongoing Expansion Site Arial View
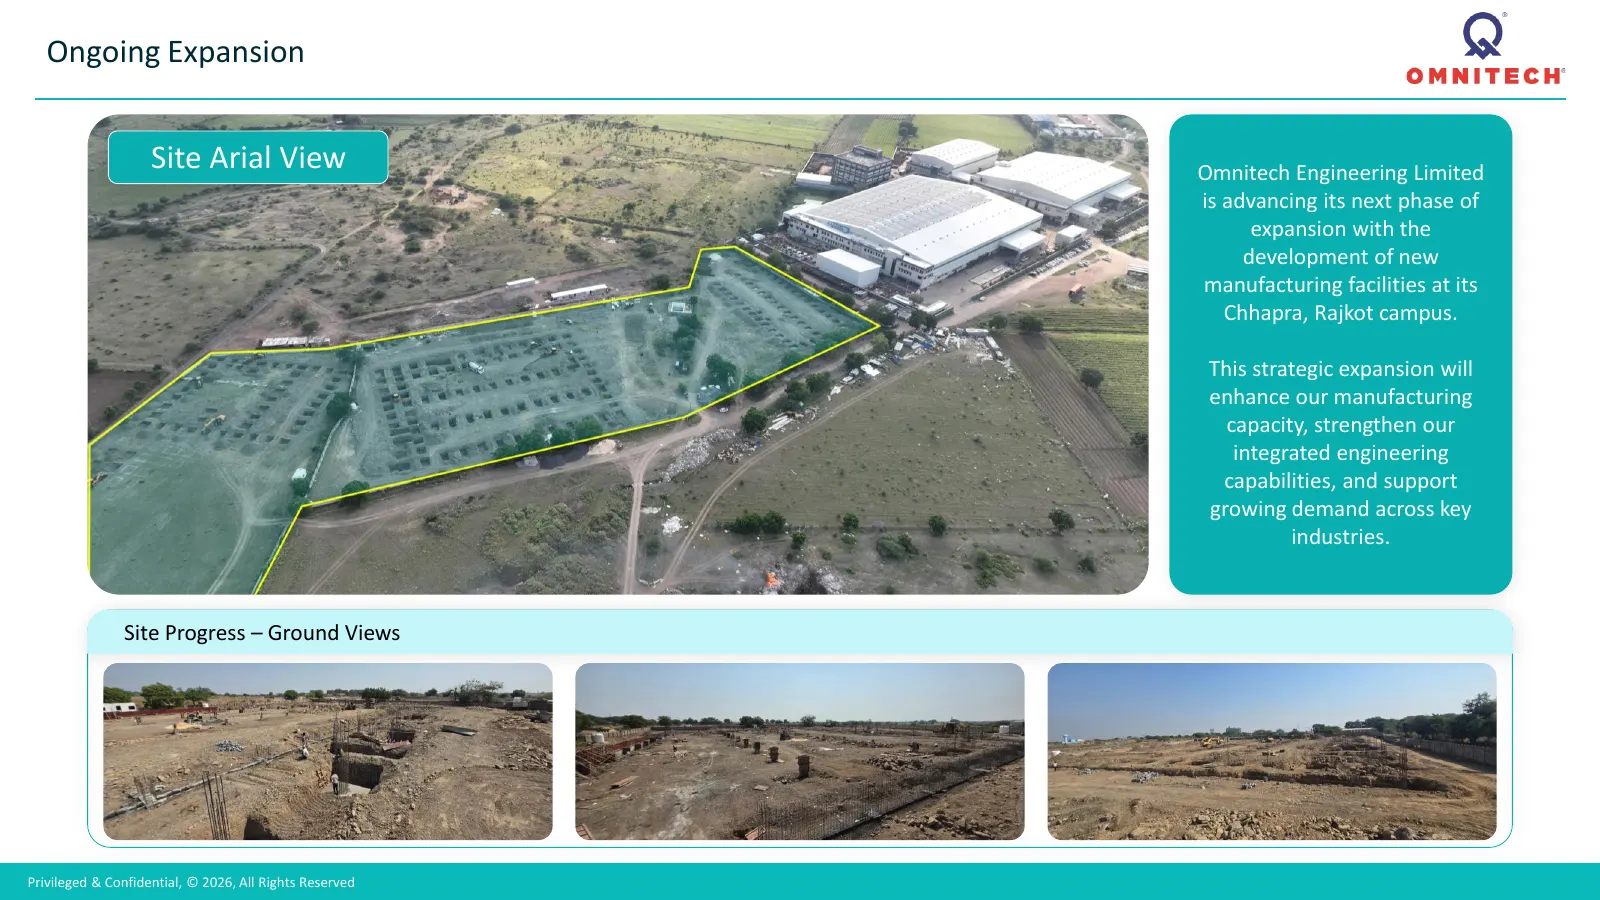
Ongoing Expansion Site Arial View Omnitech Engineering Limited is advancing its next phase of expansion with the development of new manufacturing facilities at its Chhapra, Rajkot campus. This strategic expansion will enhance our manufacturing capacity, strengthen our integrated engineering capabili
Slide 12: Developments
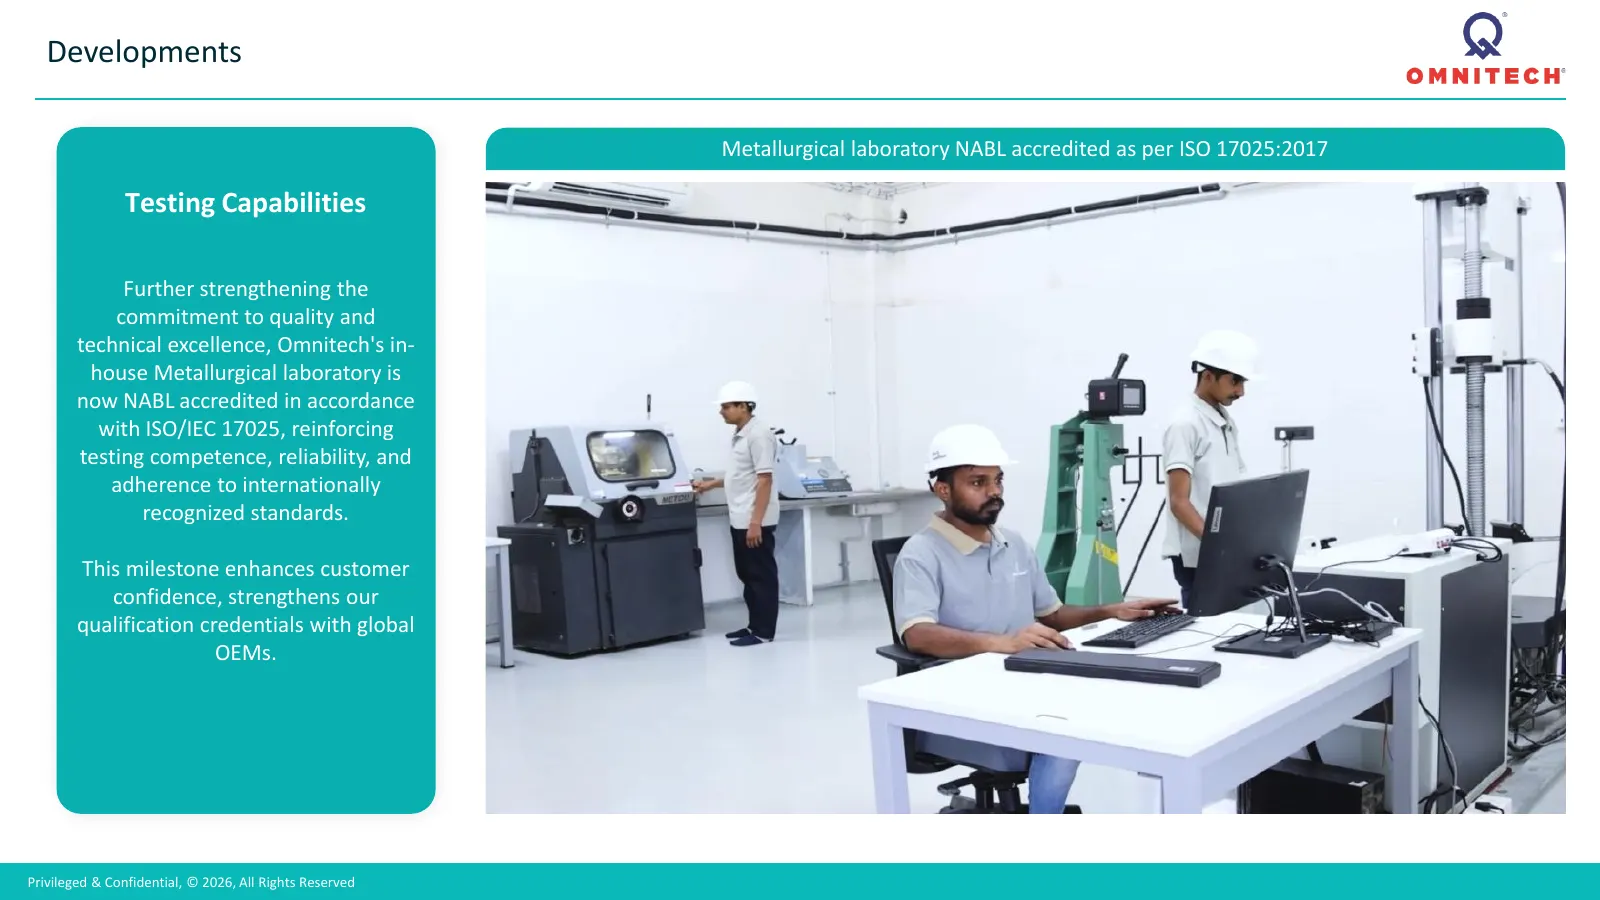
Developments Metallurgical laboratory NABL accredited as per ISO 17025:2017 Testing Capabilities Further strengthening the commitment to quality and technical excellence, Omnitech's in- house Metallurgical laboratory is now NABL accredited in accordance with ISO/IEC 17025, reinforcing testing compet
Slide 13: Company Overview
Company Overview Q
Slide 14: Snapshot of Omnitech Engineering
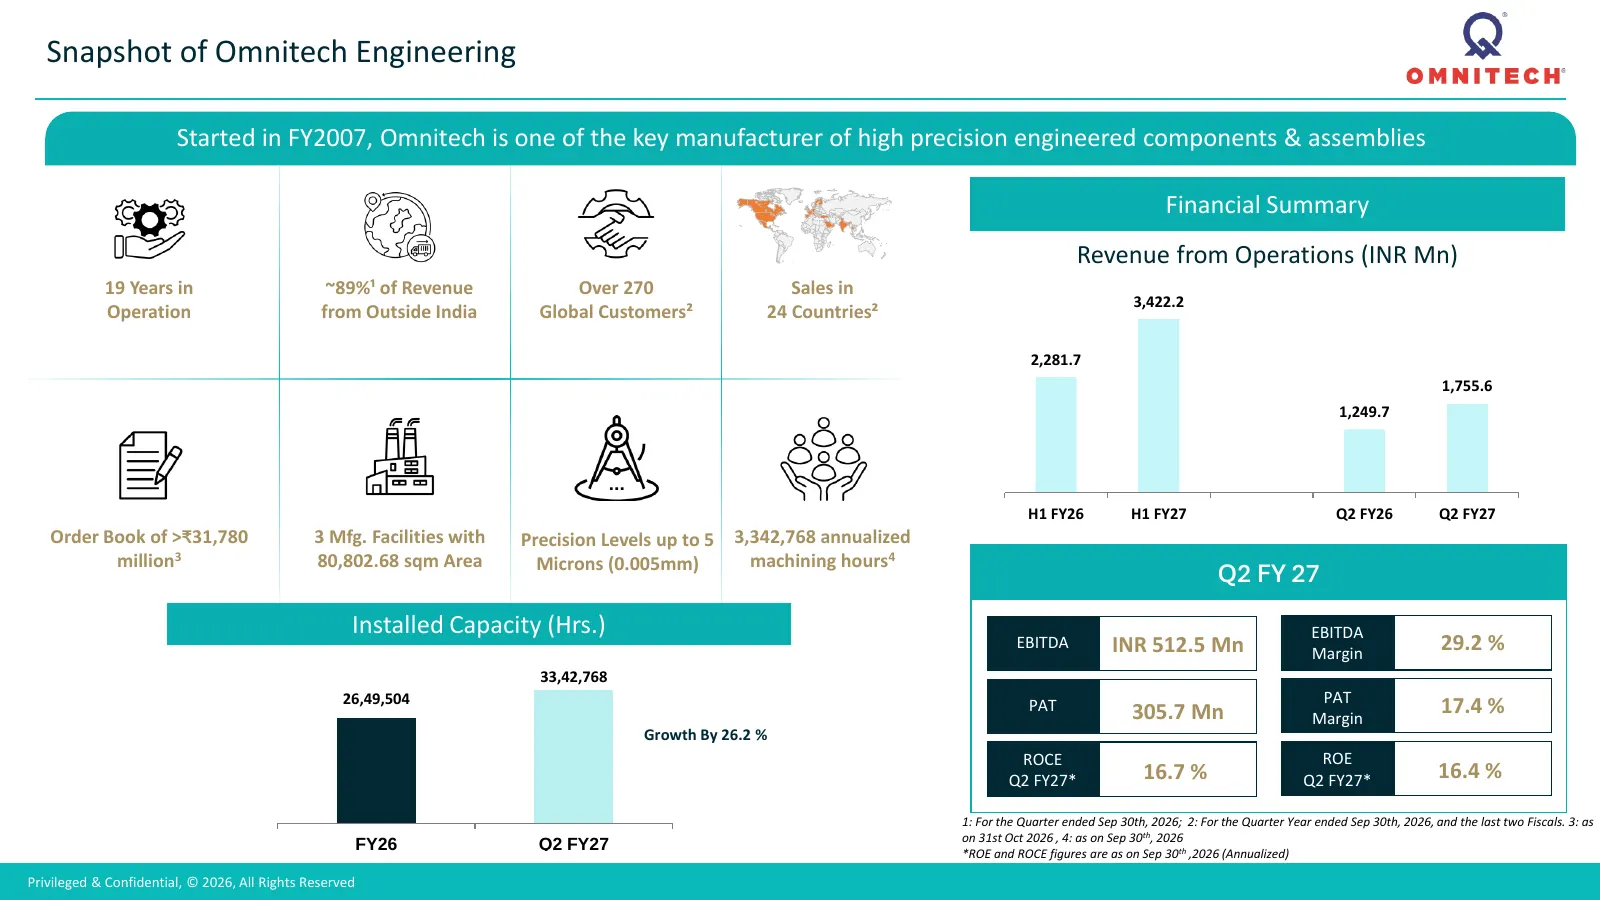
Snapshot of Omnitech Engineering Started in FY2007, Omnitech is one of the key manufacturer of high precision engineered components & assemblies Financial Summary Revenue from Operations (INR Mn) 19 Years in ~89%¹ of Revenue Over 270 Sales in 3,422.2 Operation from Outside India Global Customers² 24
Slide 15: Snapshot of Omnitech Engineering
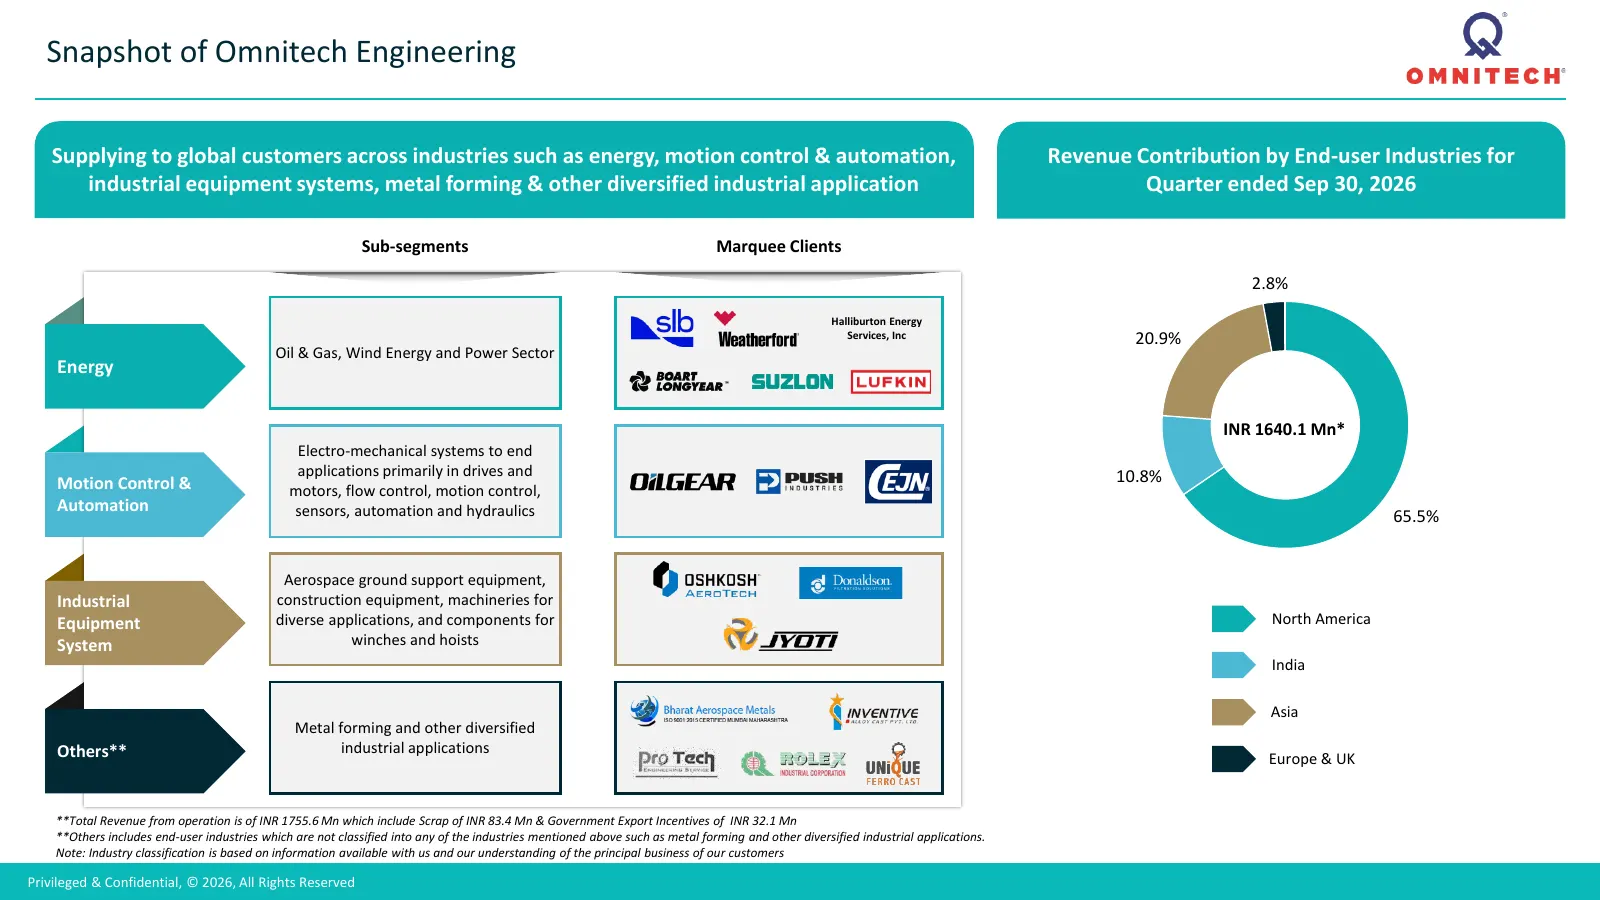
Snapshot of Omnitech Engineering Supplying to global customers across industries such as energy, motion control & automation, Revenue Contribution by End-user Industries for industrial equipment systems, metal forming & other diversified industrial application Quarter ended Sep 30, 2026 Sub-segments
Slide 16: Our Journey
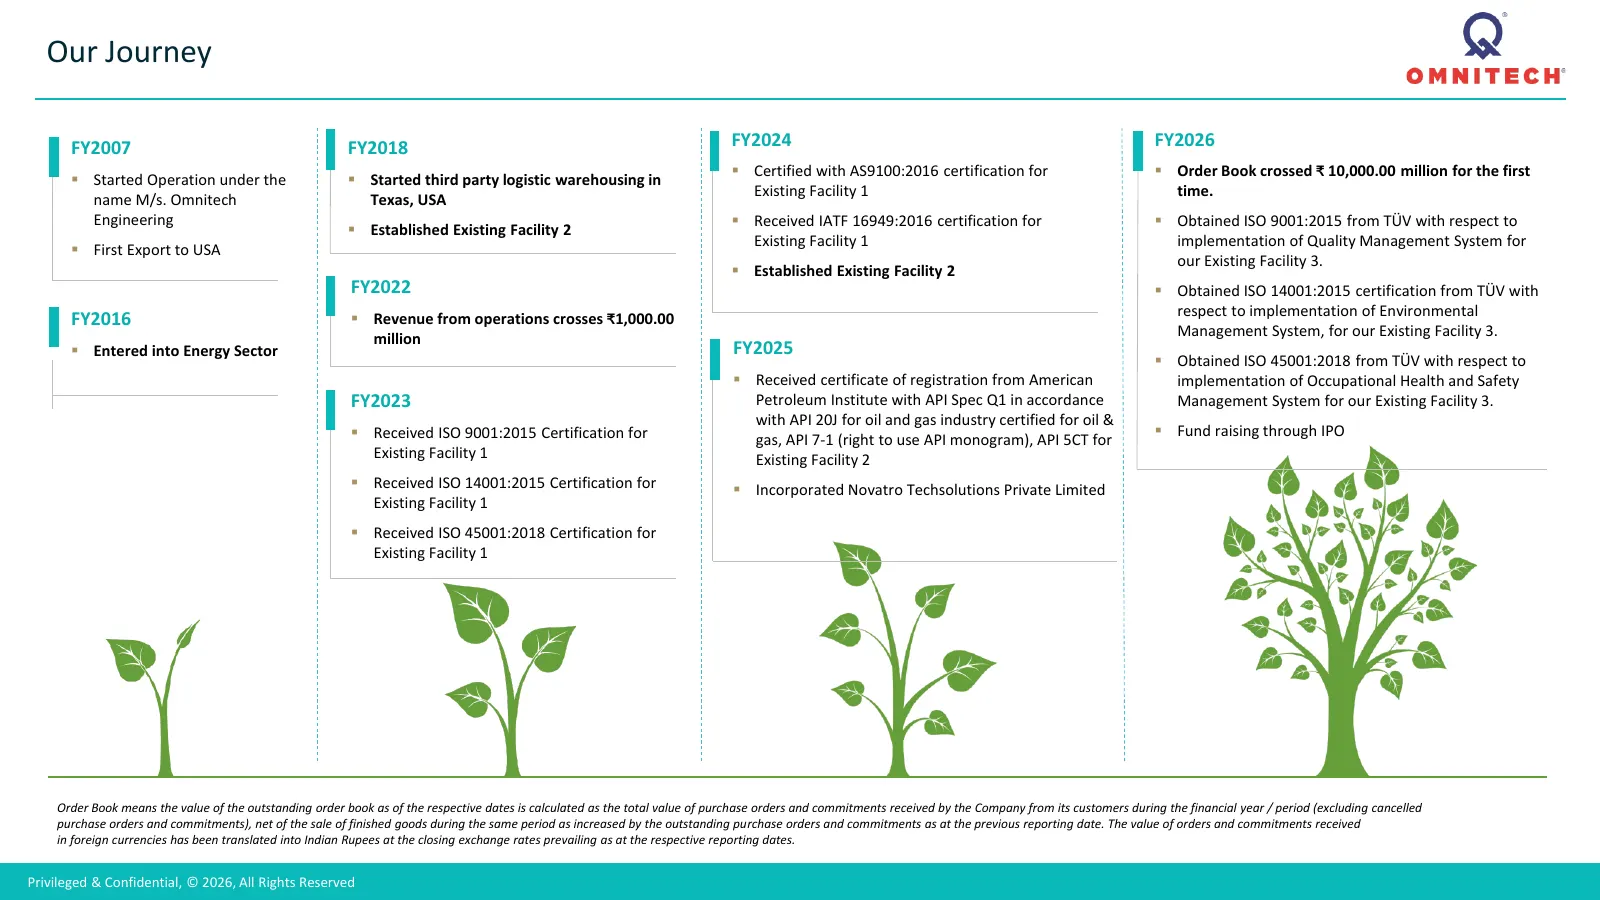
Our Journey FY2007 FY2018 FY2024 FY2026 ▪ Started Operation under the ▪ Started third party logistic warehousing in ▪ Certified with AS9100:2016 certification for ▪ Order Book crossed ₹ 10,000.00 million for the first name M/s. Omnitech Texas, USA Existing Facility 1 time. Engineering ▪ Established
Slide 17: Operations Supported By Our Manufacturing Facilities
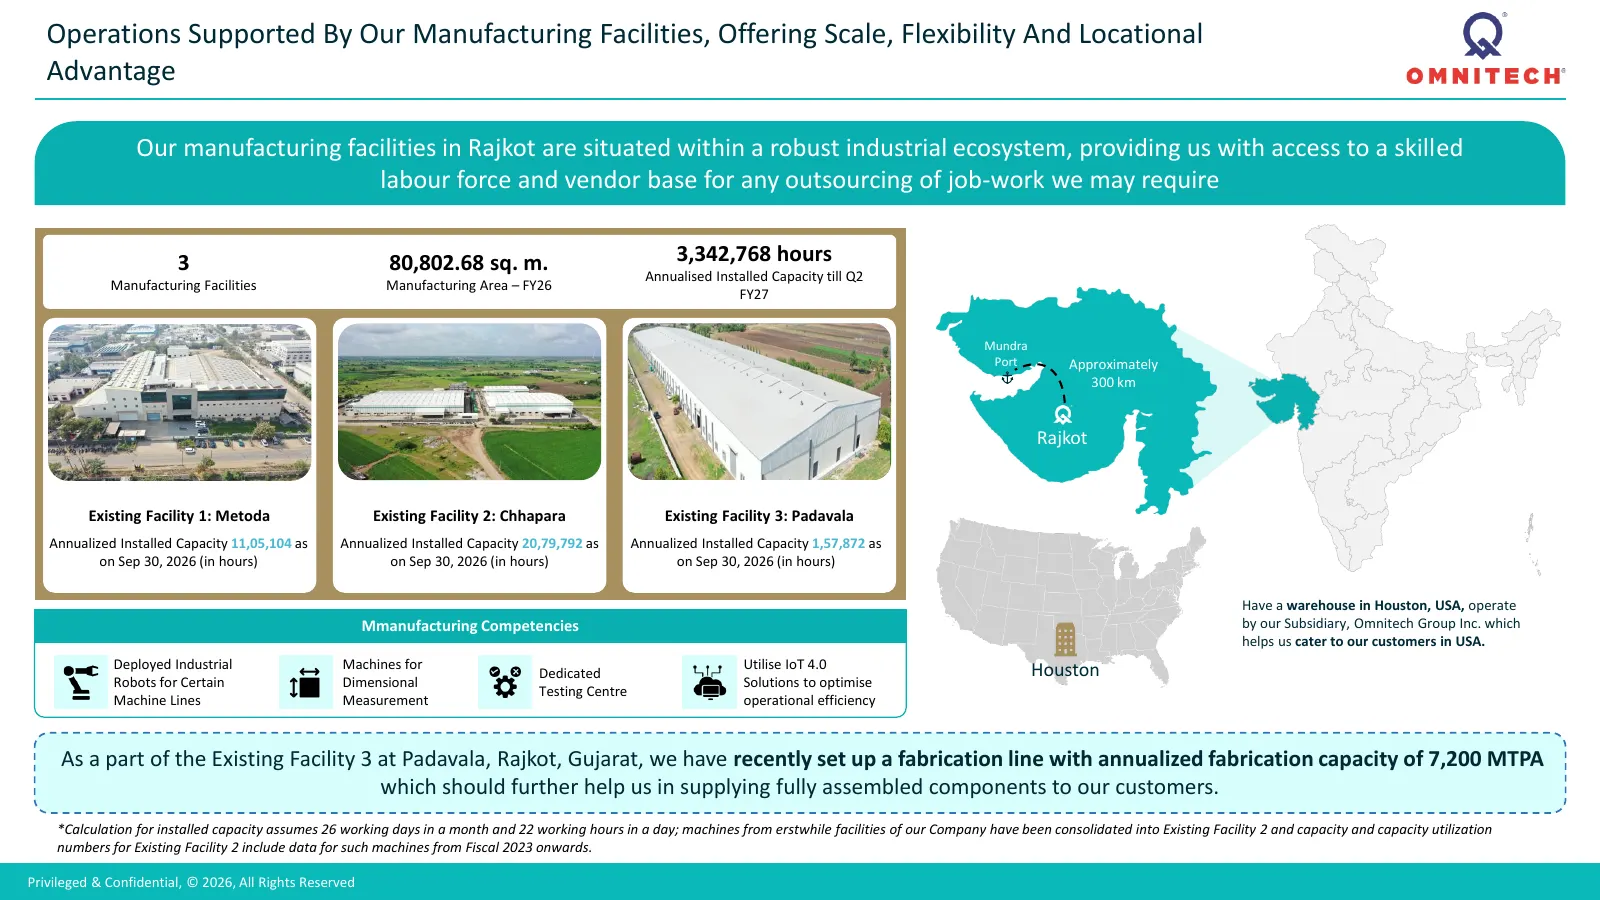
Operations Supported By Our Manufacturing Facilities, Offering Scale, Flexibility And Locational Advantage Our manufacturing facilities in Rajkot are situated within a robust industrial ecosystem, providing us with access to a skilled labour force and vendor base for any outsourcing of job-work we m
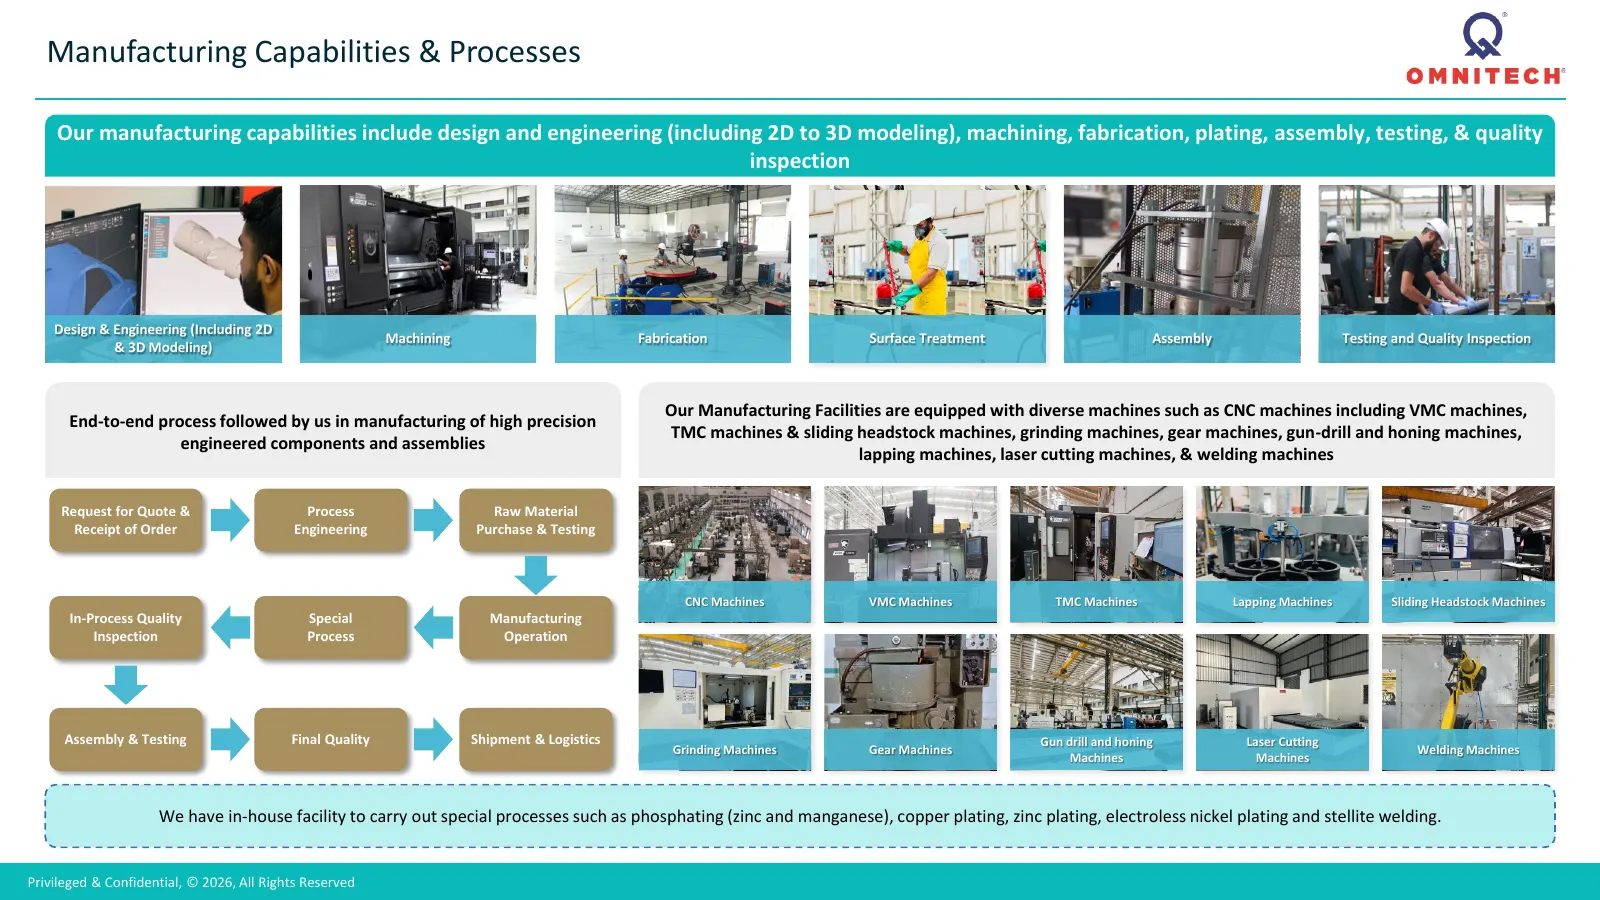
Slide 18: Manufacturing Capabilities & Processes
Manufacturing Capabilities & Processes Our manufacturing capabilities include design and engineering (including 2D to 3D modeling), machining, fabrication, plating, assembly, testing, & quality inspection Design & Engineering (Including 2D Machining Fabrication Surface Treatment Assembly Testing and
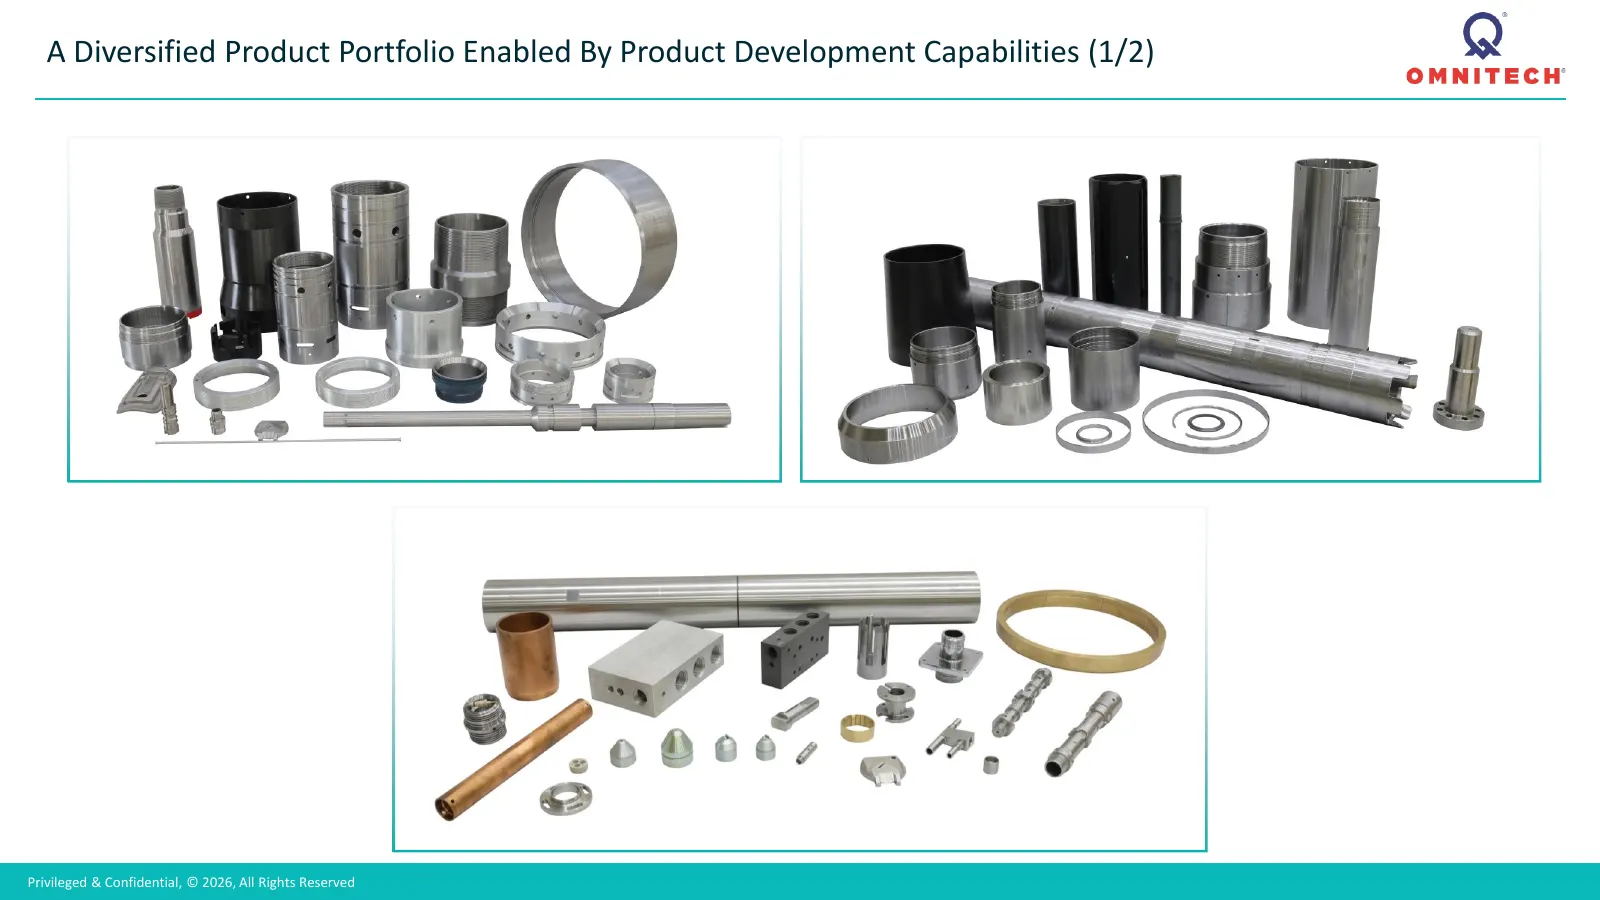
Slide 19: A Diversified Product Portfolio (1/2)
A Diversified Product Portfolio Enabled By Product Development Capabilities (1/2) Privileged & Confidential, © 2026, All Rights Reserved
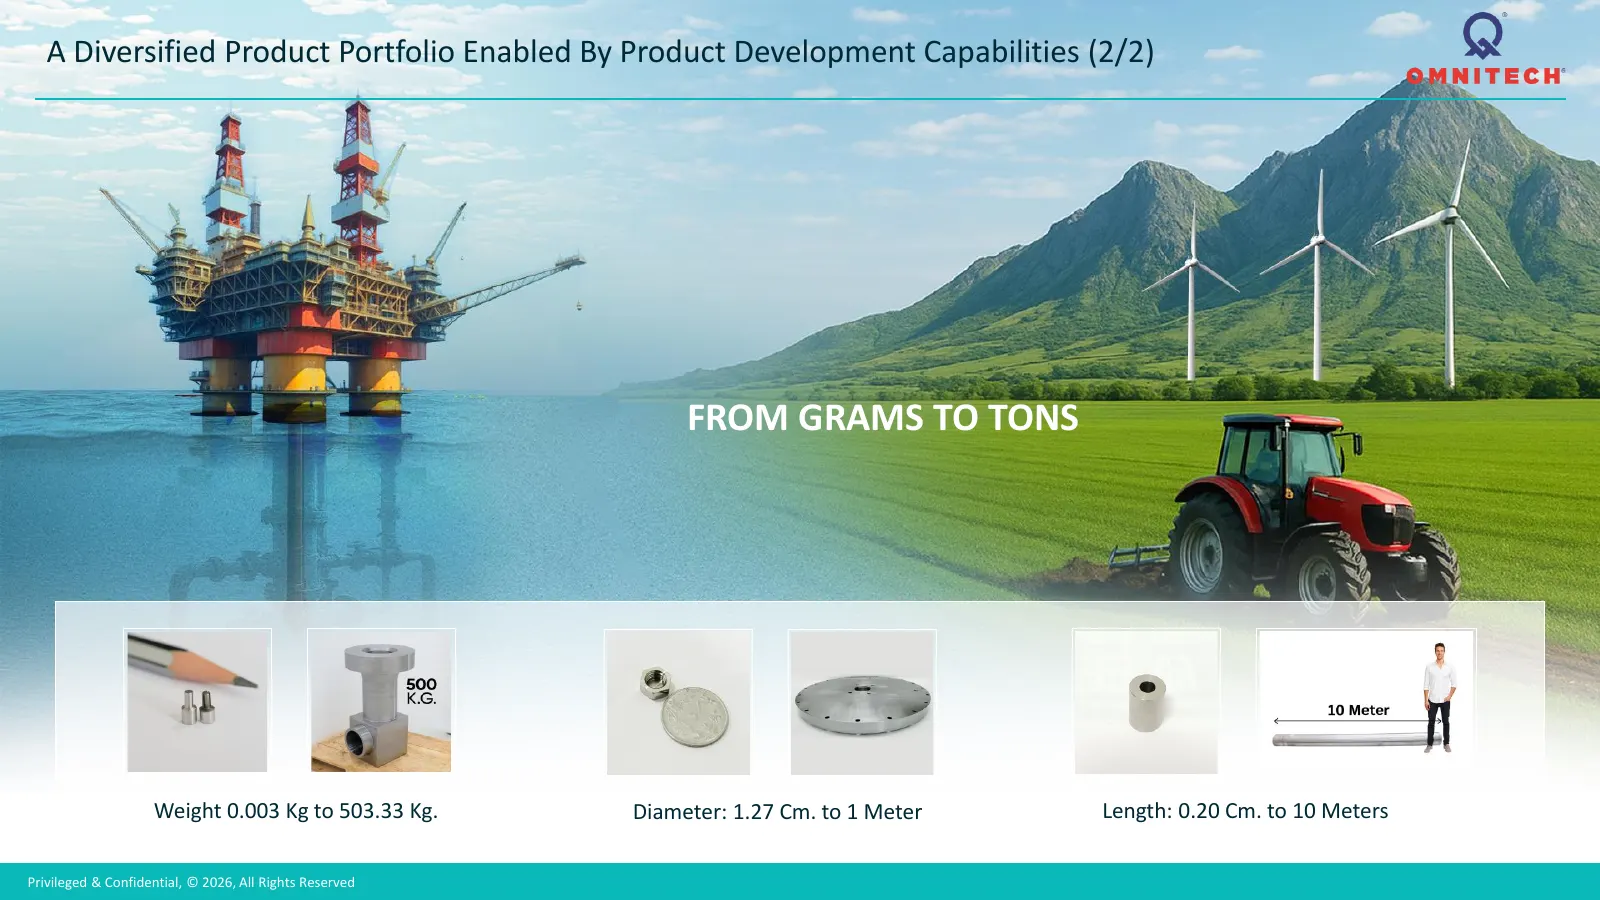
Slide 20: A Diversified Product Portfolio (2/2)
A Diversified Product Portfolio Enabled By Product Development Capabilities (2/2) FROM GRAMS TO TONS Weight 0.003 Kg to 503.33 Kg. Diameter: 1.27 Cm. to 1 Meter Length: 0.20 Cm. to 10 Meters Privileged & Confidential, © 2026, All Rights Reserved Strictly Private and Confidential |
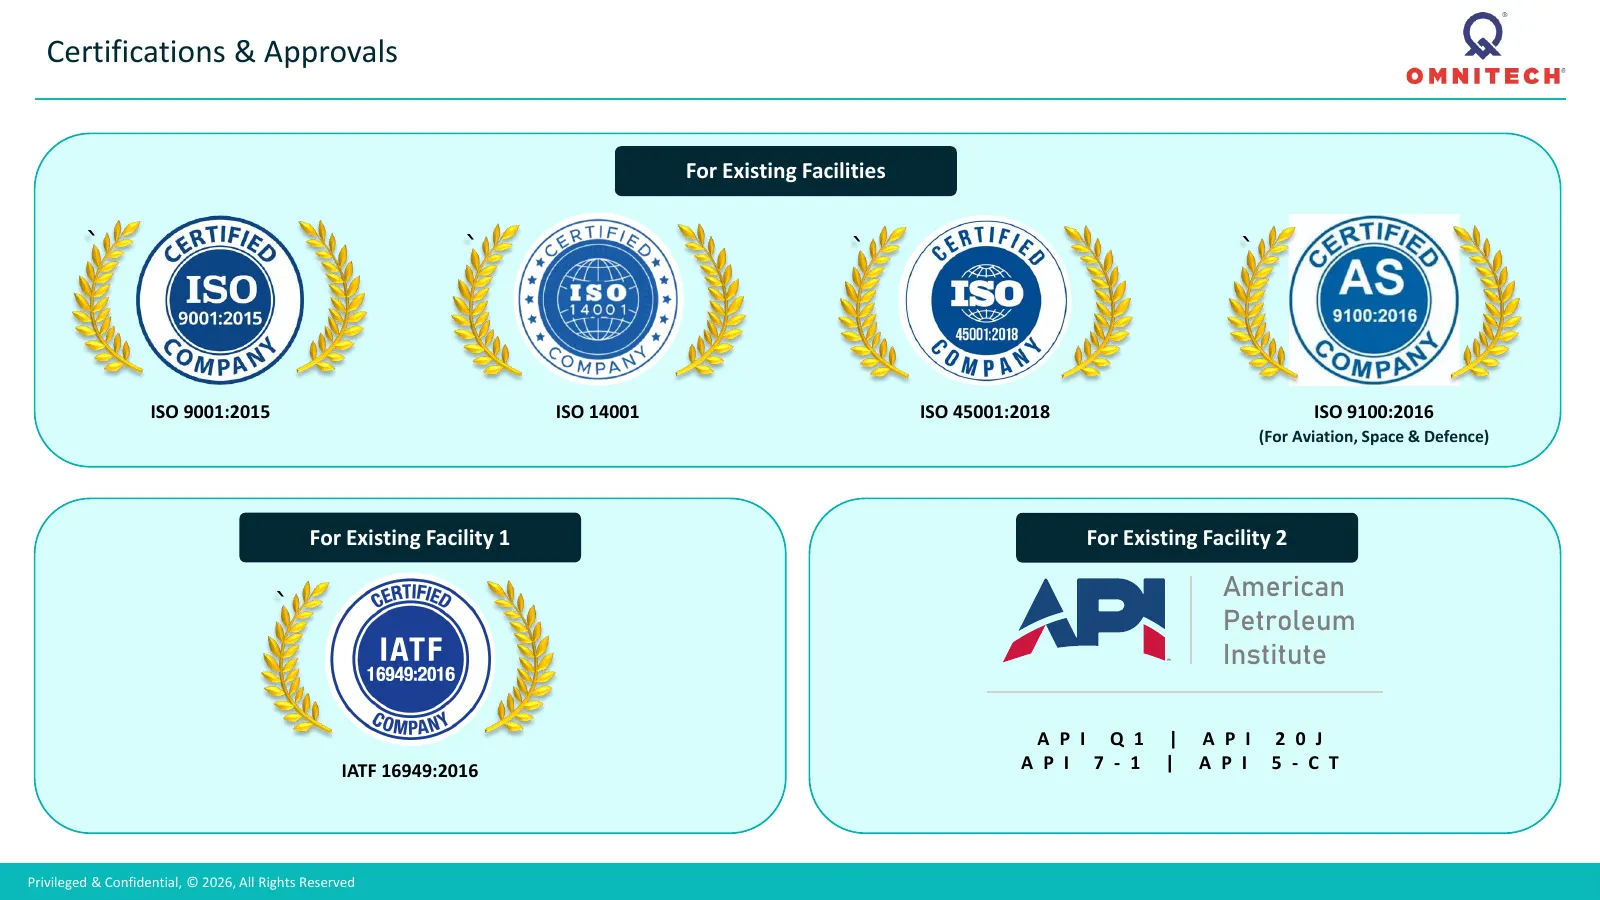
Slide 21: Certifications & Approvals
Certifications & Approvals For Existing Facilities ` ` ` ` ISO 9001:2015 ISO 14001 ISO 45001:2018 ISO 9100:2016 (For Aviation, Space & Defence) For Existing Facility 1 For Existing Facility 2 American ` Petroleum Institute A P I Q 1 | A P I 2 0 J IATF 16949:2016 A P I 7 - 1 | A P I 5 - C T Privilege

Slide 22: Experienced Promoters and Management Team (1/2)
Experienced Promoters and Management Team with Strong Domain Expertise (1/2) Udaykumar Arunkumar Parekh Dharmi A Parekh Chairman and Managing Director Non-Executive Director ▪ He holds a degree in Bachelor’s of Engineering in Mechanicals from V.V.P. ▪ She holds a degree of Bachelor’s of Commerce fro
Slide 23: Experienced Promoters and Management Team (2/2)
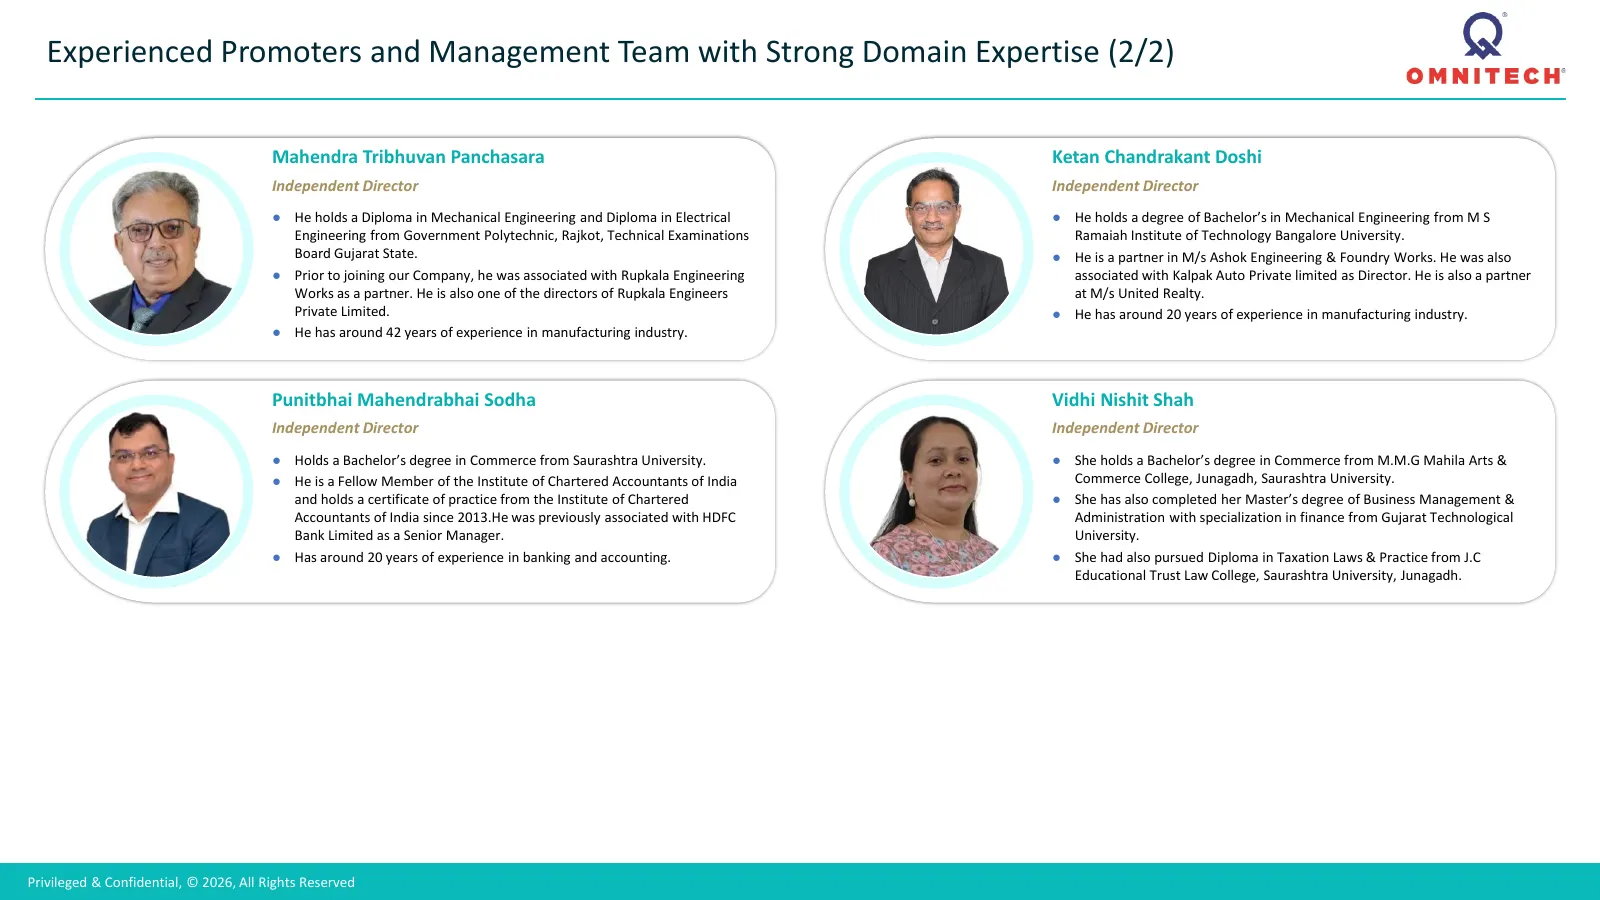
Experienced Promoters and Management Team with Strong Domain Expertise (2/2) Mahendra Tribhuvan Panchasara Ketan Chandrakant Doshi Independent Director Independent Director ● He holds a Diploma in Mechanical Engineering and Diploma in Electrical ● He holds a degree of Bachelor’s in Mechanical Engine
Slide 24: Awards, Accreditations and Recognition
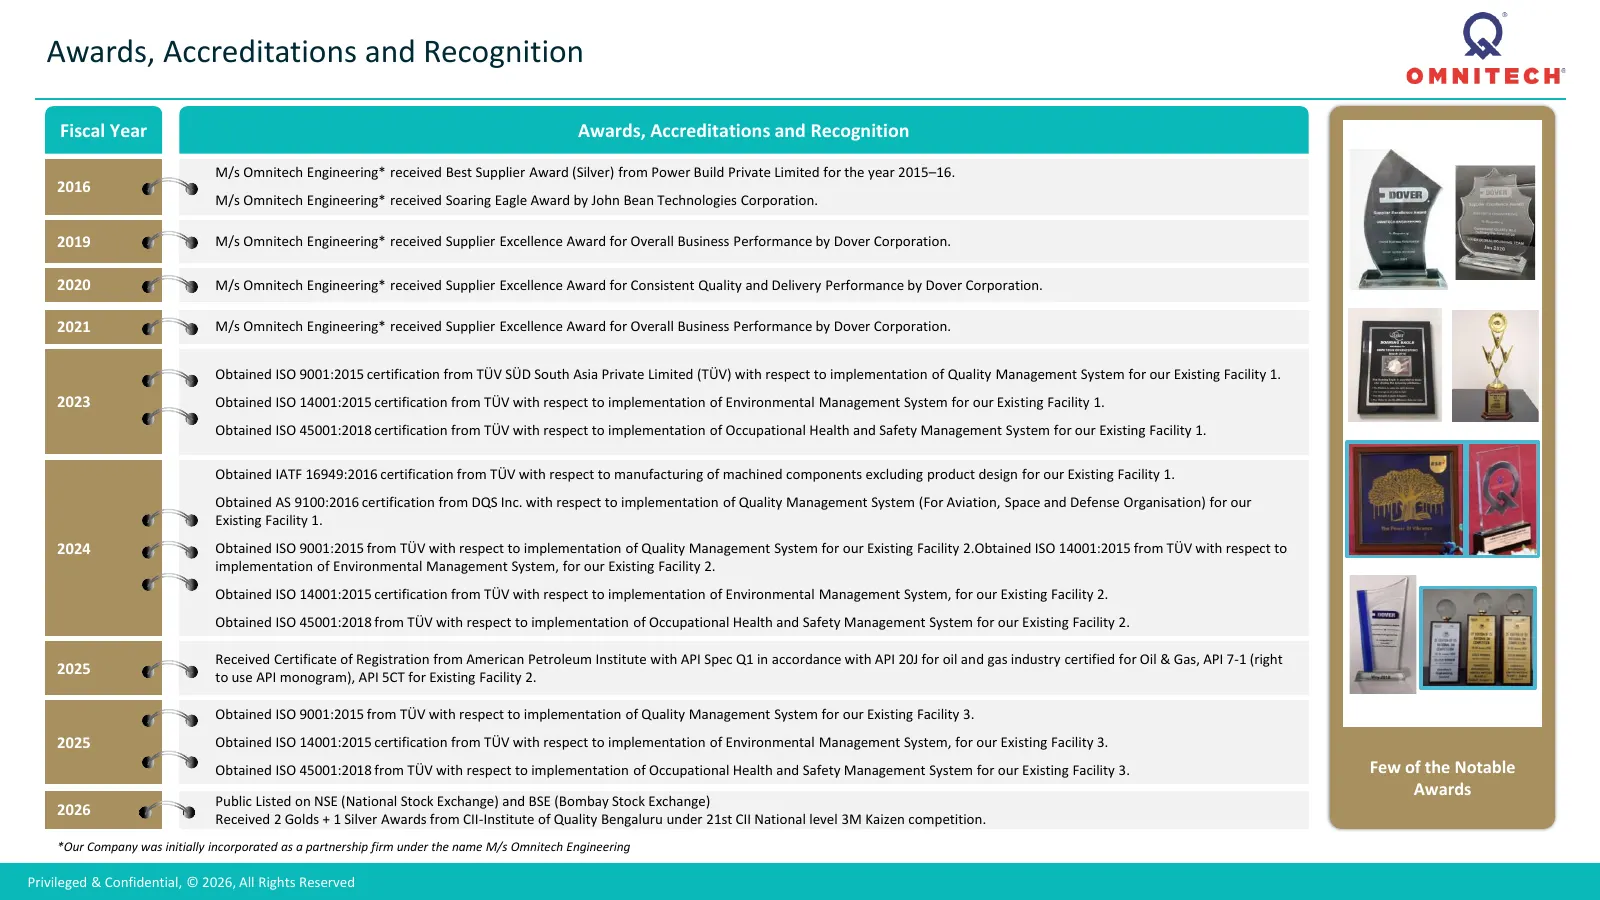
Awards, Accreditations and Recognition Fiscal Year Awards, Accreditations and Recognition M/s Omnitech Engineering* received Best Supplier Award (Silver) from Power Build Private Limited for the year 2015–16. 2016 M/s Omnitech Engineering* received Soaring Eagle Award by John Bean Technologies Corpo
Slide 25: Financial Summary
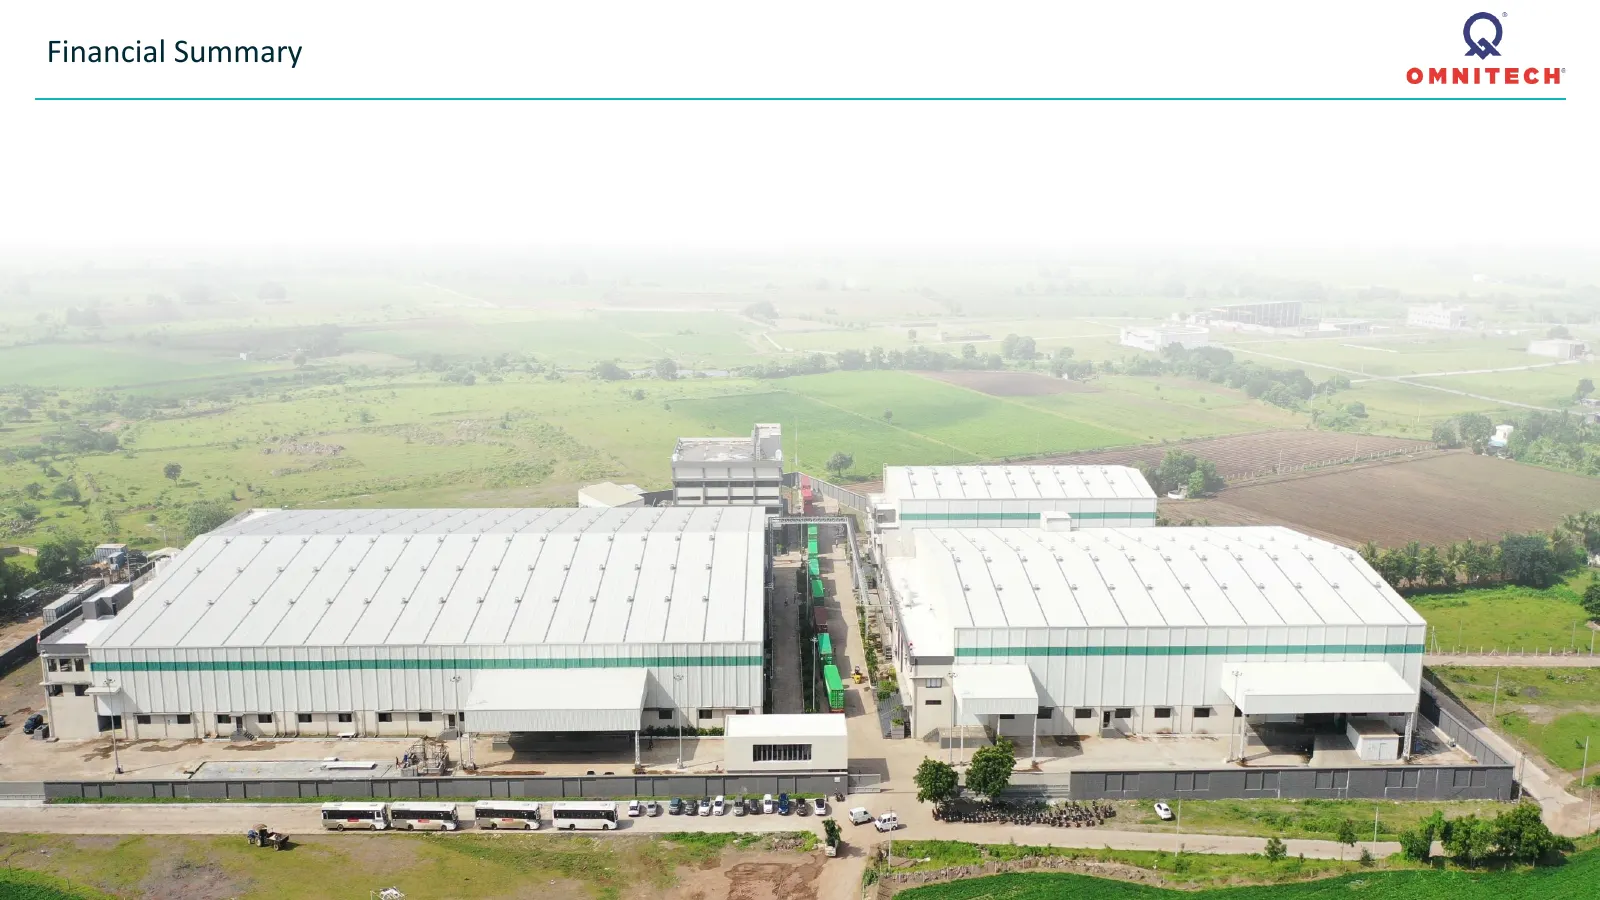
Financial Summary Q
Slide 26: Consolidated statement of Profit and Loss – Quarterly
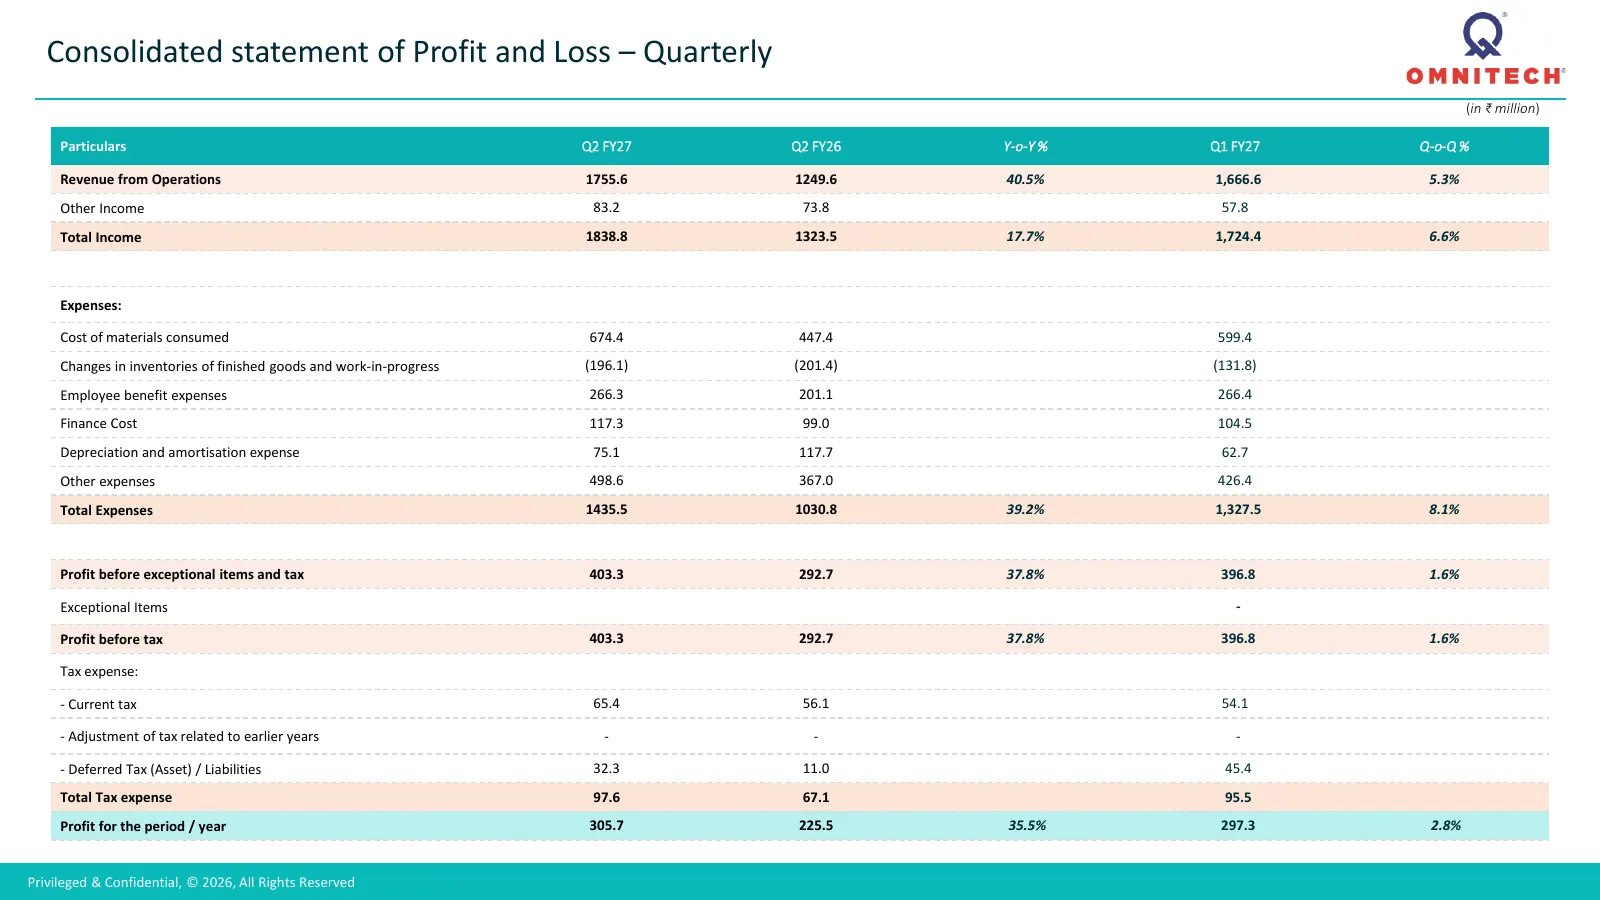
Consolidated statement of Profit and Loss – Quarterly (in ₹ million) Particulars Q2 FY27 Q2 FY26 Y-o-Y % Q1 FY27 Q-o-Q % Revenue from Operations 1755.6 1249.6 40.5% 1,666.6 5.3% Other Income 83.2 73.8 57.8 Total Income 1838.8 1323.5 17.7% 1,724.4 6.6% Expenses: Cost of materials consumed 674.4 447.4
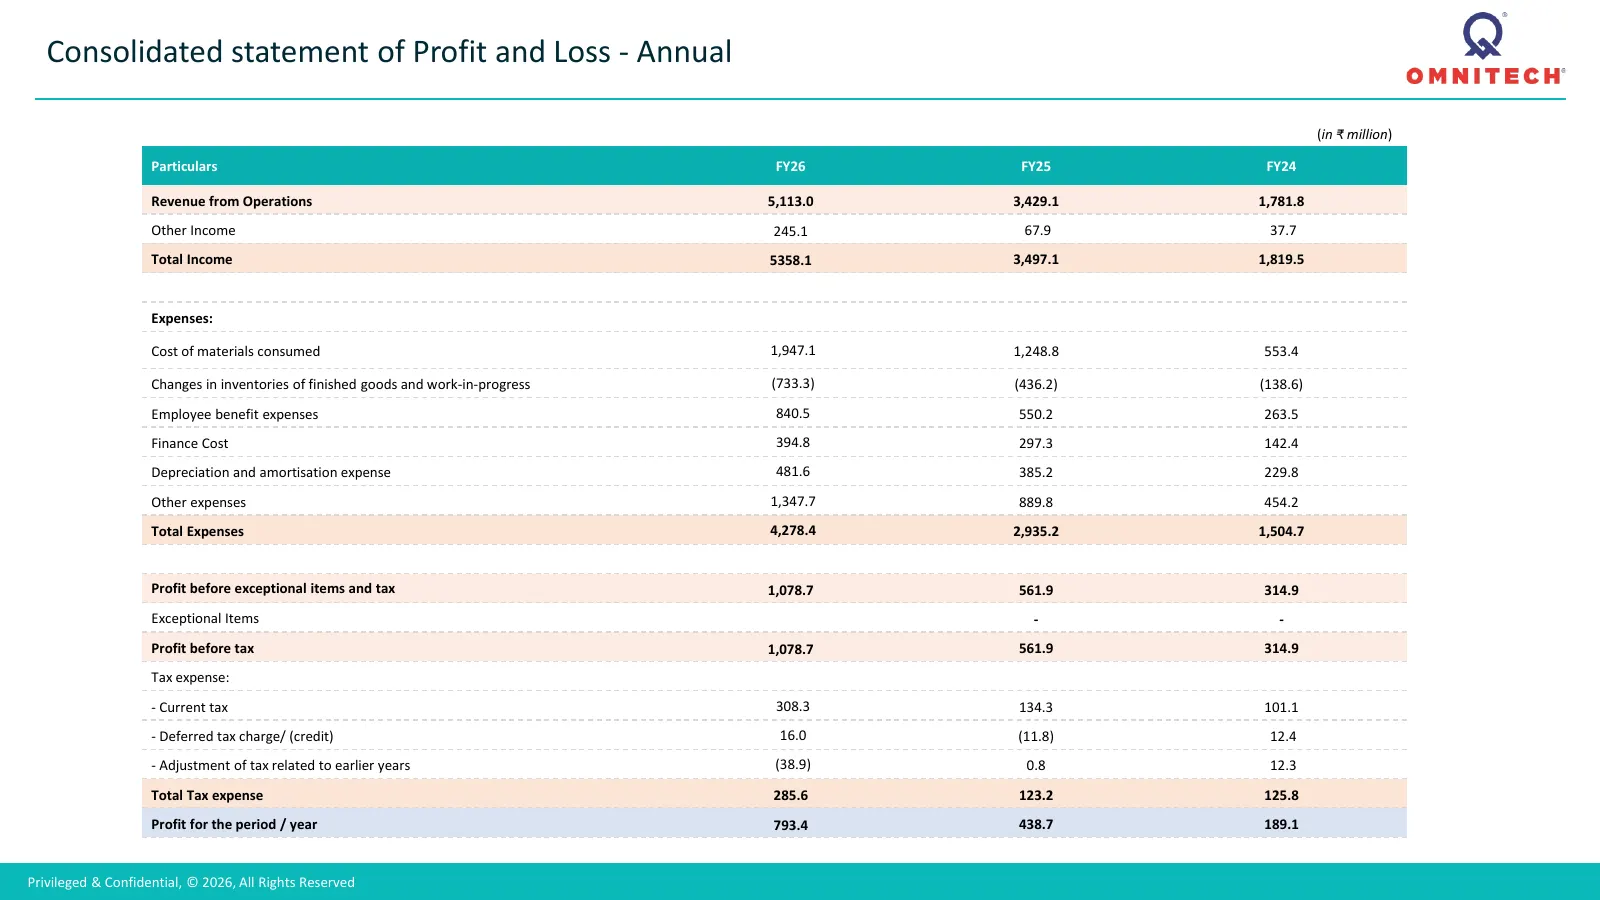
Slide 27: Consolidated statement of Profit and Loss - Annual
Consolidated statement of Profit and Loss - Annual (in ₹ million) Particulars FY26 FY25 FY24 Revenue from Operations 5,113.0 3,429.1 1,781.8 Other Income 245.1 67.9 37.7 Total Income 5358.1 3,497.1 1,819.5 Expenses: Cost of materials consumed 1,947.1 1,248.8 553.4 Changes in inventories of finished
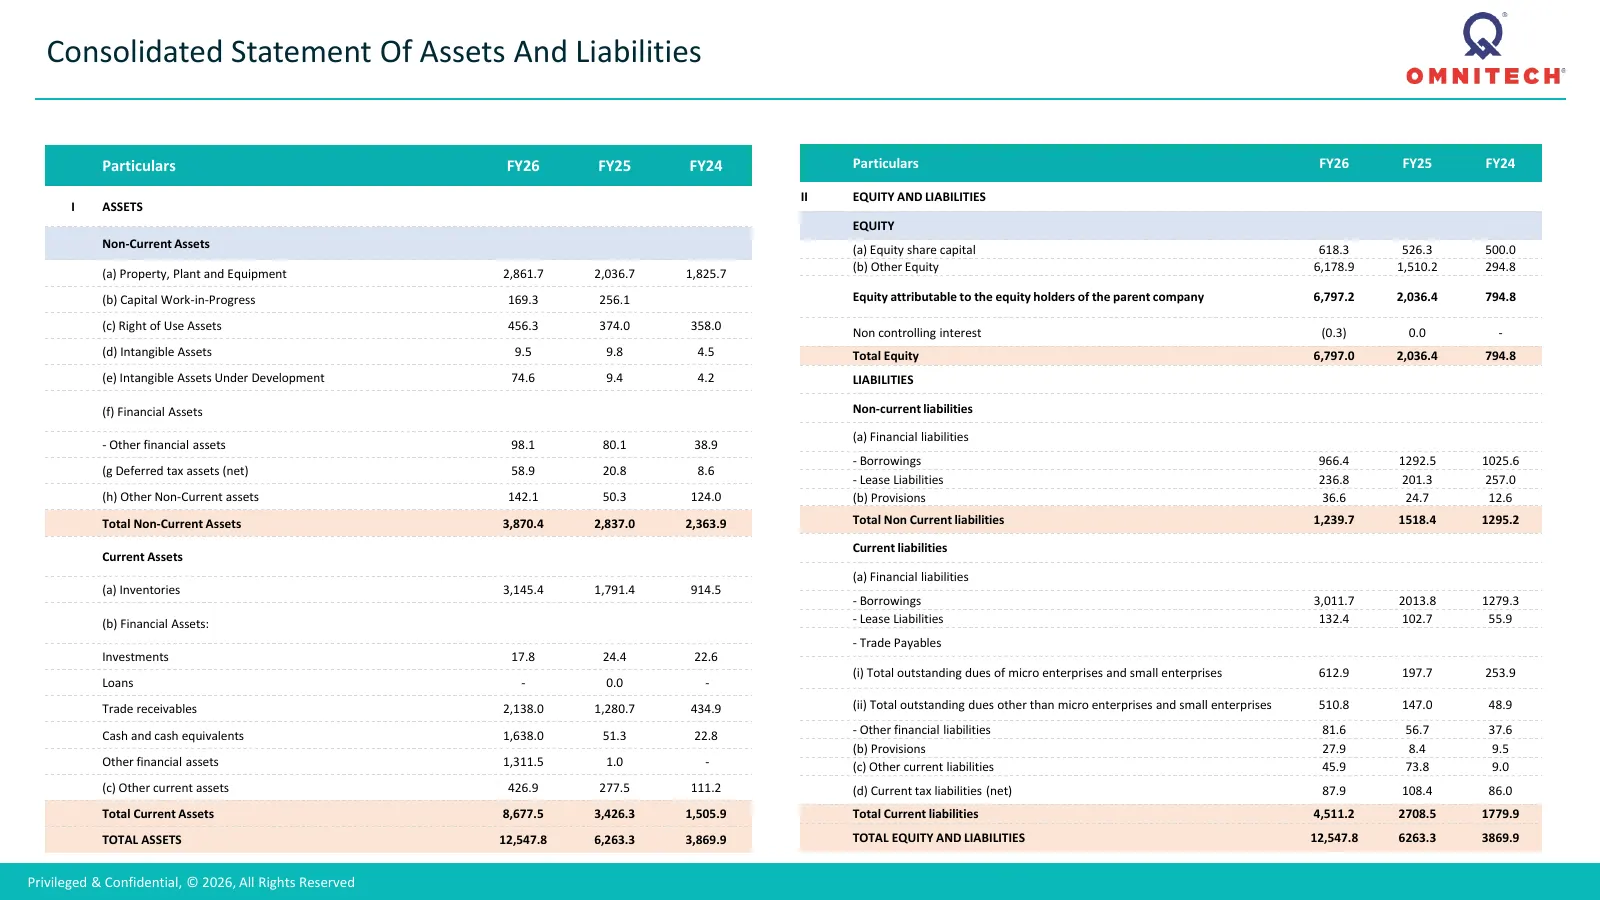
Slide 28: Consolidated Statement Of Assets And Liabilities
Consolidated Statement Of Assets And Liabilities Particulars FY26 FY25 FY24 Particulars FY26 FY25 FY24 II EQUITY AND LIABILITIES I ASSETS EQUITY Non-Current Assets (a) Equity share capital 618.3 526.3 500.0 (a) Property, Plant and Equipment 2,861.7 2,036.7 1,825.7 (b) Other Equity 6,178.9 1,510.2 29
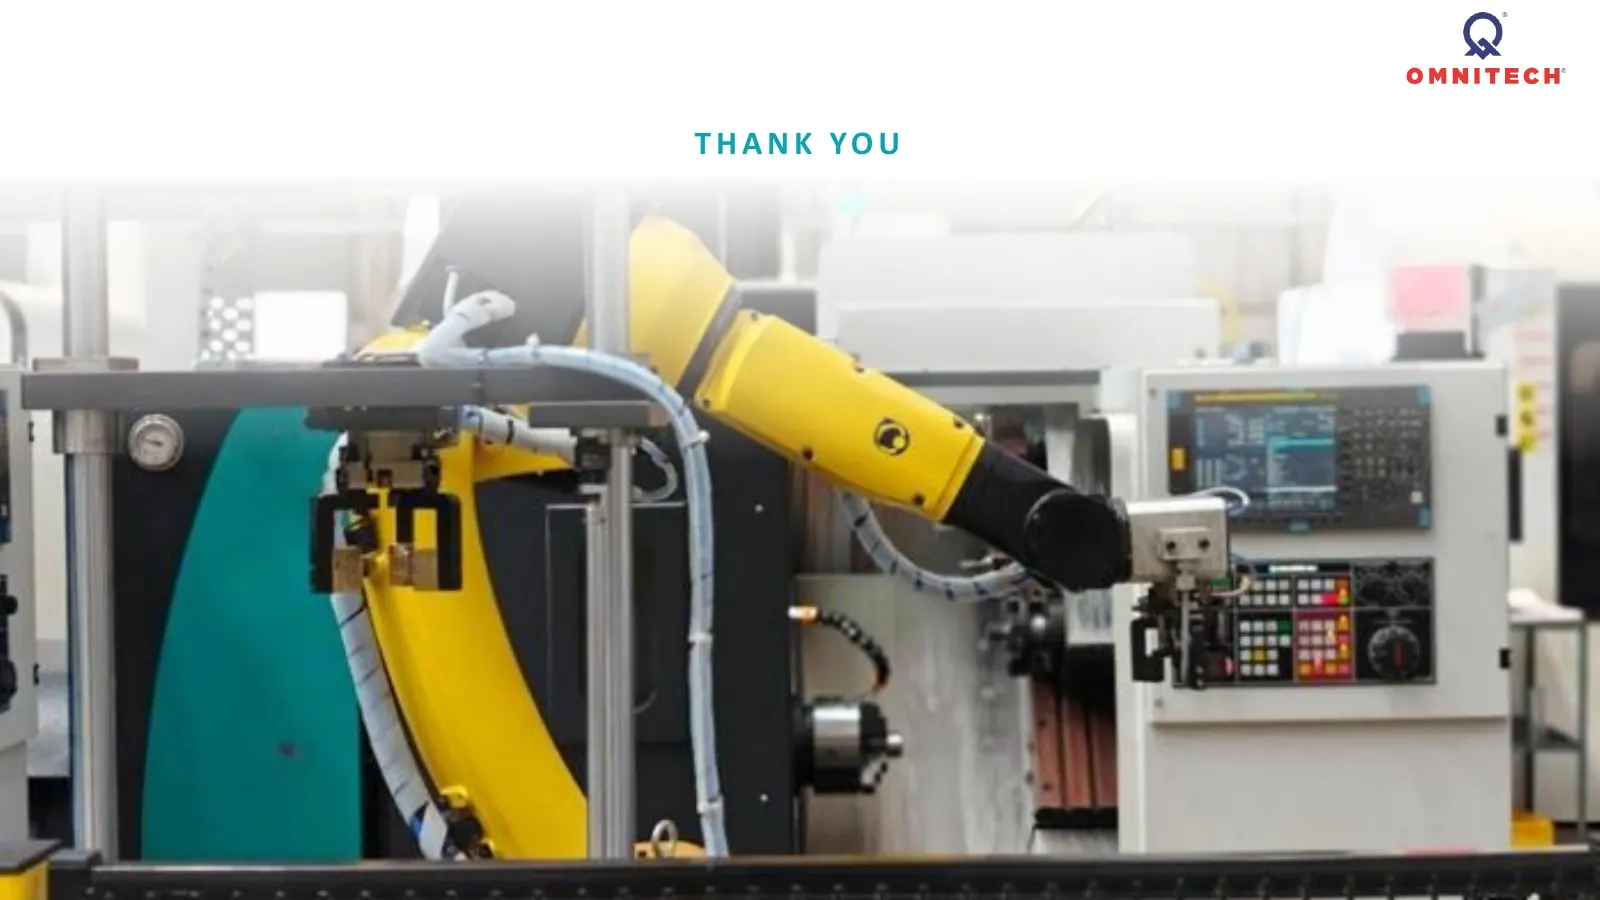
Slide 29: Thank You
T HANK YO U Strictly Private and Confidential |
Source: NSE filing, Nov 5, 2026