TIER REIT — Behringer Harvard REIT I — Shareholder Meeting (June 2007)
28 slides from TIER REIT's shareholder meeting presentation, Jun 20, 2007
Slide 1: Welcome to the Behringer Harvard REIT I Annual Meeting of Stockholders
Welcome to the Behringer Harvard REIT I, Inc. Annual Meeting of Stockholders June 20, 2007 104500 Investor Presentation © 2007 Behringer Harvard
Slide 2: Agenda
Agenda 1. Preliminary Remarks 2. Call to Order 3. Report on the Operations of the Company 4. Declaration of Quorum 5. Approval of Charter Amendments 6. Results of Balloting 7. Closing Remarks 8. Conclusion 9. Stockholder Question and Answer Period Page 2
Slide 3: Portfolio Highlights
More than $2.4 billion invested in wholly- and partially- owned assets as of March 31, 2007 36 property investments in 17 markets as of March 31, 2007 12.2 million rentable square feet as of March 31, 2007 Portfolio Highlights Page 3
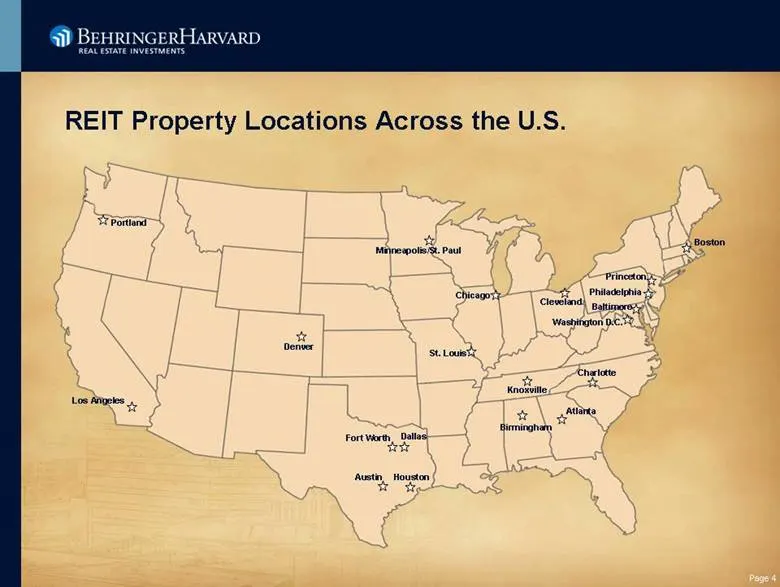
Slide 4: REIT Property Locations Across the U.S.
Denver Minneapolis/St. Paul Chicago St. Louis Princeton Philadelphia Baltimore Washington D.C. Cleveland Charlotte Atlanta Dallas Fort Worth Austin Portland Los Angeles Boston Houston REIT Property Locations Across the U.S. Birmingham Knoxville Page 4
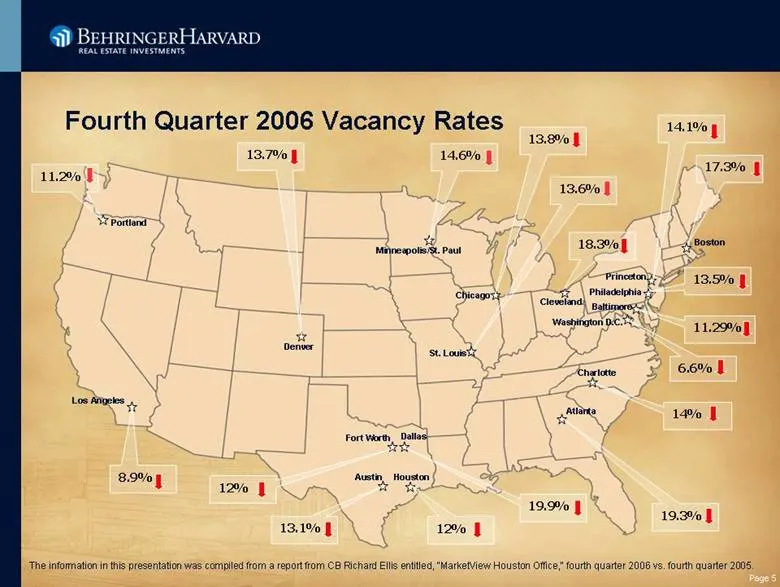
Slide 5: Fourth Quarter 2006 Vacancy Rates
Fourth Quarter 2006 Vacancy Rates 11.29% 6.6% 13.5% 19.3% 19.9% 12% 13.1% 14.1% 13.8% 13.6% 14.6% 13.7% 8.9% 12% 17.3% 14% 18.3% 11.2% Portland Denver Minneapolis/St. Paul Chicago St. Louis Boston Princeton Philadelphia Baltimore Washington D.C. Cleveland Charlotte Atlanta Dallas Fort Worth Austin H
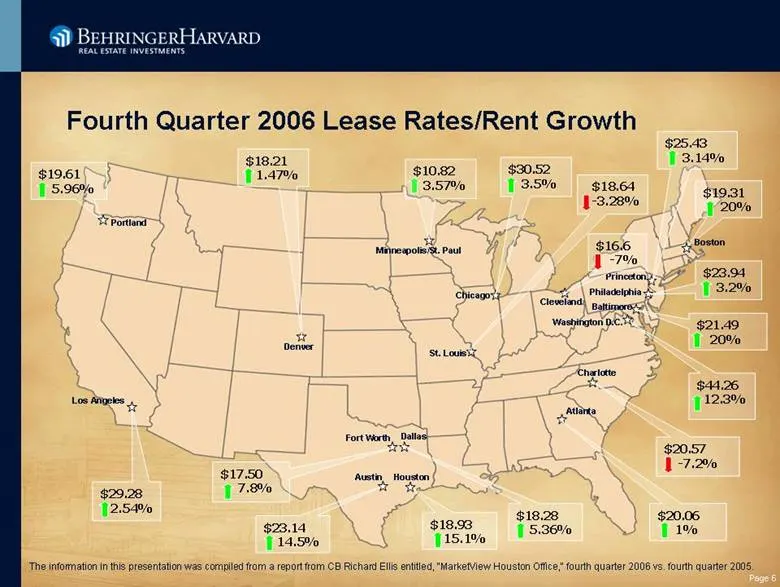
Slide 6: Fourth Quarter 2006 Lease Rates/Rent Growth
Minneapolis/St. Paul Chicago St. Louis Princeton Philadelphia Baltimore Washington D.C. Cleveland Charlotte Atlanta Dallas Fort Worth Austin $21.49 20% $44.26 12.3% $23.94 3.2% $20.06 1% $18.28 5.36% $18.93 15.1% $23.14 14.5% $30.52 3.5% $19.31 20% $10.82 3.57% $18.21 1.47% $29.28 2.54% $17.50 7.8%
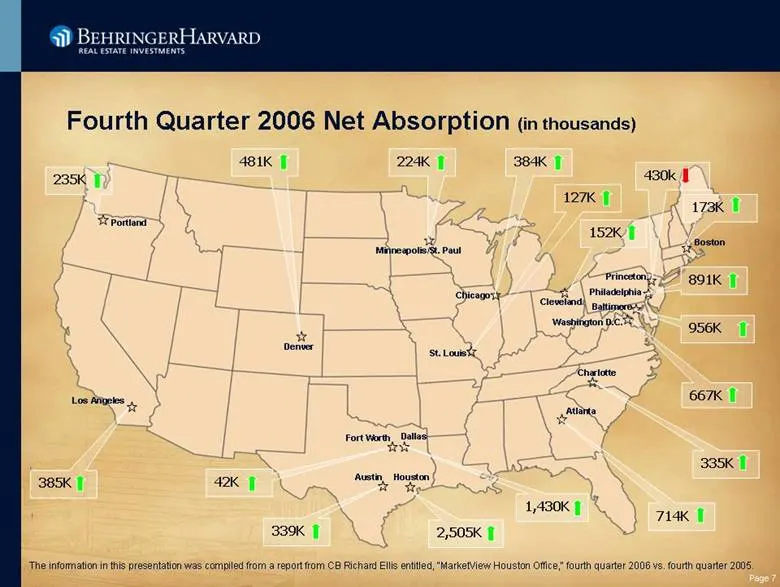
Slide 7: Fourth Quarter 2006 Net Absorption
Denver Minneapolis/St. Paul Chicago St. Louis Princeton Philadelphia Baltimore Washington D.C. Cleveland Charlotte Atlanta Dallas Fort Worth Austin Portland Los Angeles Boston Houston 956K 667K 891K 714K 1,430K 2,505K 339K 430k 384K 127K 224K 481K 385K 42K 173K 335K 152K 235K Fourth Quarter 2006 Net
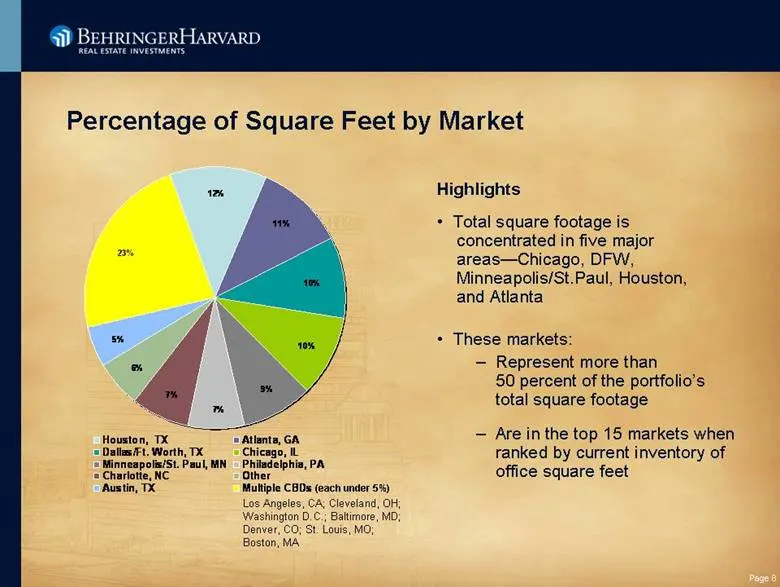
Slide 8: Percentage of Square Feet by Market
Percentage of Square Feet by Market Los Angeles, CA; Cleveland, OH; Washington D.C.; Baltimore, MD; Denver, CO; St. Louis, MO; Boston, MA Highlights Total square footage is concentrated in five major areas—Chicago, DFW, Minneapolis/St.Paul, Houston, and Atlanta These markets: – Represent more than 5
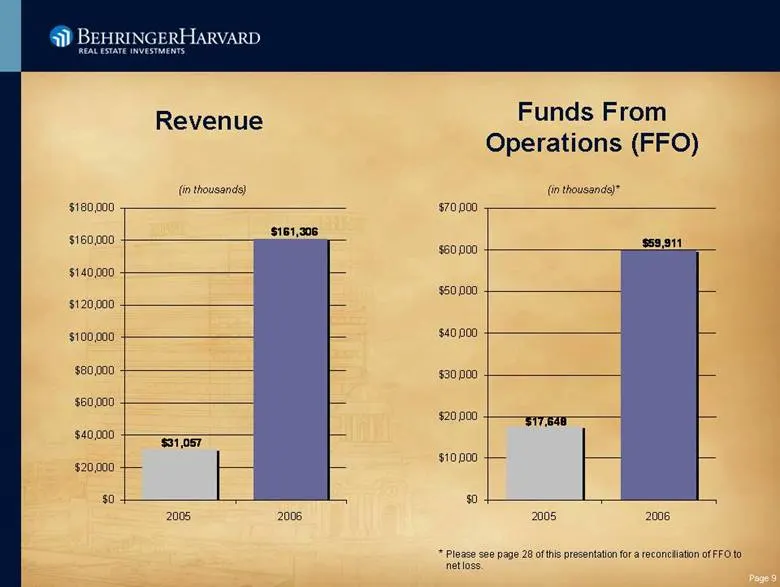
Slide 9: Revenue and Funds From Operations (FFO)
(in thousands)* Funds From Operations (FFO) * Please see page 28 of this presentation for a reconciliation of FFO to net loss. (in thousands) Revenue $31,057 $161,306 $0 $20,000 $40,000 $60,000 $80,000 $100,000 $120,000 $140,000 $160,000 $180,000 2005 2006 $59,911 $17,648 $0 $10,000 $20,000 $30,000
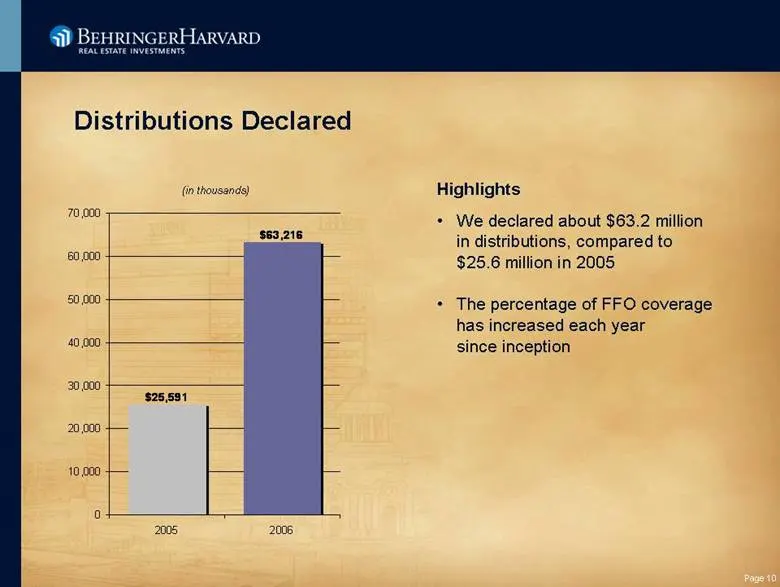
Slide 10: Distributions Declared
(in thousands) Distributions Declared Highlights We declared about $63.2 million in distributions, compared to $25.6 million in 2005 The percentage of FFO coverage has increased each year since inception $25,591 $63,216 0 10,000 20,000 30,000 40,000 50,000 60,000 70,000 2005 2006 Page 10
Slide 11: REIT Property Highlights
REIT Property Highlights Page 11
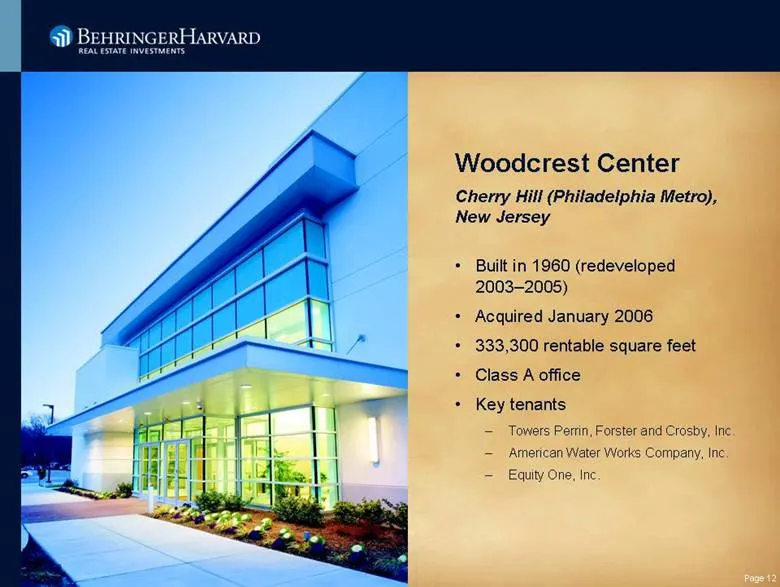
Slide 12: Woodcrest Center
Woodcrest Center Cherry Hill (Philadelphia Metro), New Jersey Built in 1960 (redeveloped 2003–2005) Acquired January 2006 333,300 rentable square feet Class A office • Key tenants – Towers Perrin, Forster and Crosby, Inc. – American Water Works Company, Inc. – Equity One, Inc. Page 12
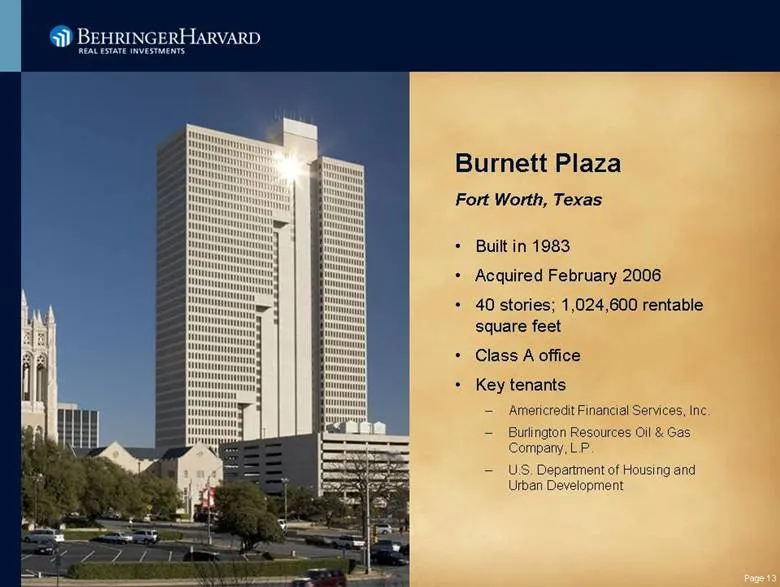
Slide 13: Burnett Plaza
Burnett Plaza Fort Worth, Texas Built in 1983 Acquired February 2006 40 stories; 1,024,600 rentable square feet Class A office • Key tenants – Americredit Financial Services, Inc. – Burlington Resources Oil & Gas Company, L.P. – U.S. Department of Housing and Urban Development Page 13
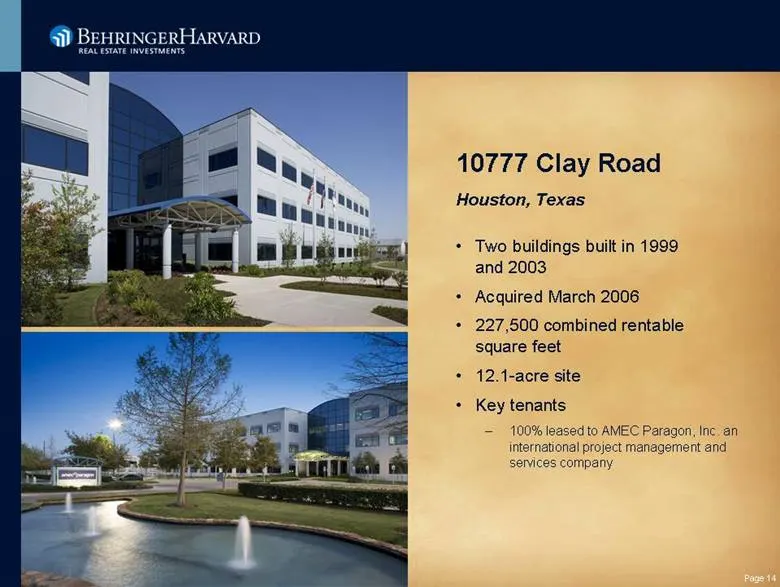
Slide 14: 10777 Clay Road
10777 Clay Road Houston, Texas Two buildings built in 1999 and 2003 Acquired March 2006 227,500 combined rentable square feet 12.1-acre site • Key tenants – 100% leased to AMEC Paragon, Inc. an international project management and services company Page 14
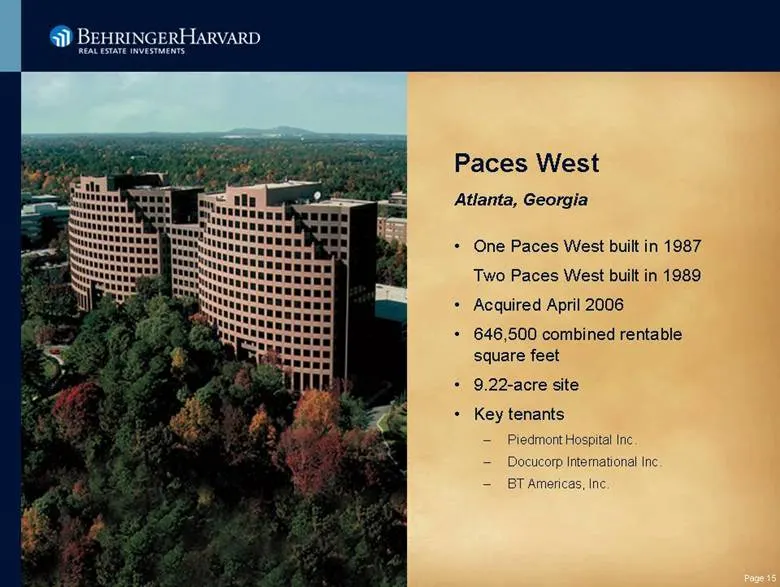
Slide 15: Paces West
Paces West Atlanta, Georgia One Paces West built in 1987 Two Paces West built in 1989 Acquired April 2006 646,500 combined rentable square feet 9.22-acre site • Key tenants – Piedmont Hospital Inc. – Docucorp International Inc. – BT Americas, Inc. Page 15
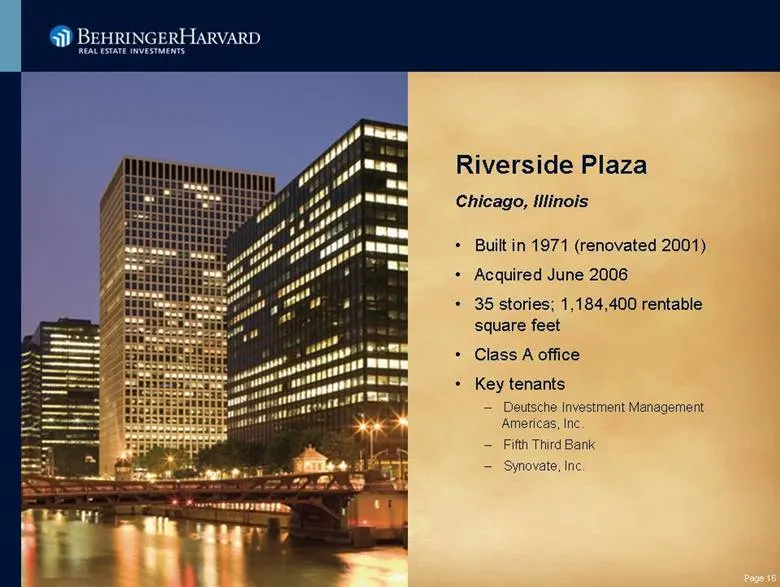
Slide 16: Riverside Plaza
Chicago, Illinois Built in 1971 (renovated 2001) Acquired June 2006 35 stories; 1,184,400 rentable square feet Class A office • Key tenants – Deutsche Investment Management Americas, Inc. – Fifth Third Bank – Synovate, Inc. Riverside Plaza Page 16
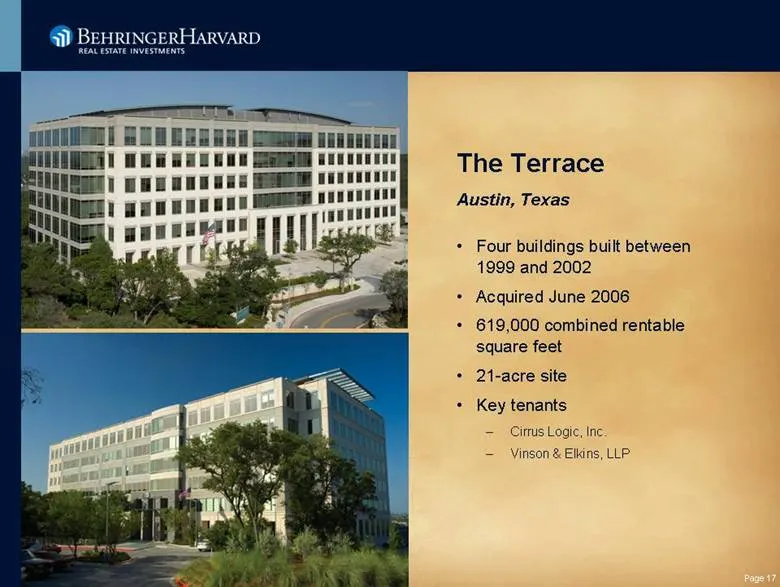
Slide 17: The Terrace
The Terrace Austin, Texas Four buildings built between 1999 and 2002 Acquired June 2006 619,000 combined rentable square feet 21-acre site • Key tenants – Cirrus Logic, Inc. – Vinson & Elkins, LLP Page 17
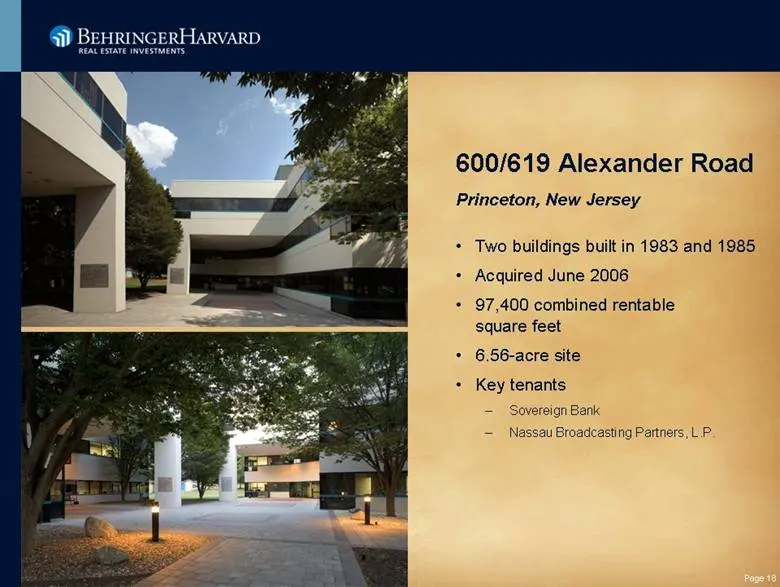
Slide 18: 600/619 Alexander Road
600/619 Alexander Road Princeton, New Jersey Two buildings built in 1983 and 1985 Acquired June 2006 97,400 combined rentable square feet 6.56-acre site • Key tenants – Sovereign Bank – Nassau Broadcasting Partners, L.P. Page 18
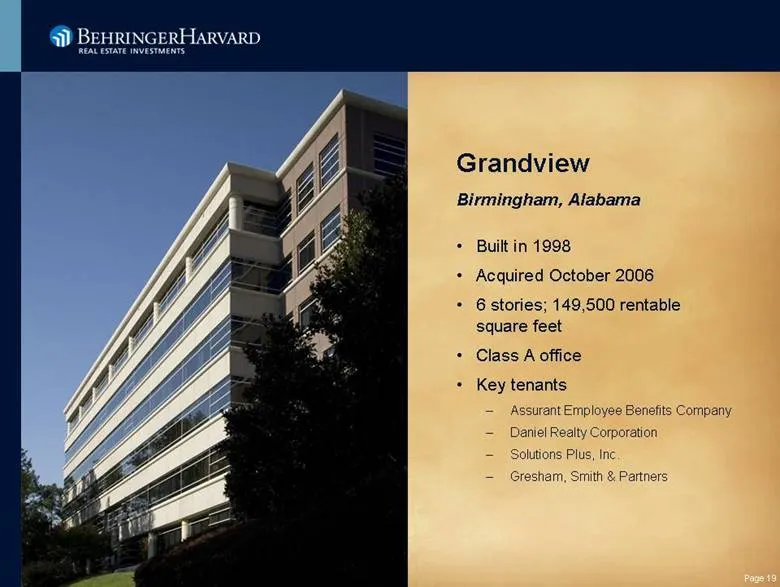
Slide 19: Grandview
Grandview Birmingham, Alabama Built in 1998 Acquired October 2006 6 stories; 149,500 rentable square feet Class A office • Key tenants – Assurant Employee Benefits Company – Daniel Realty Corporation – Solutions Plus, Inc. – Gresham, Smith & Partners Page 19
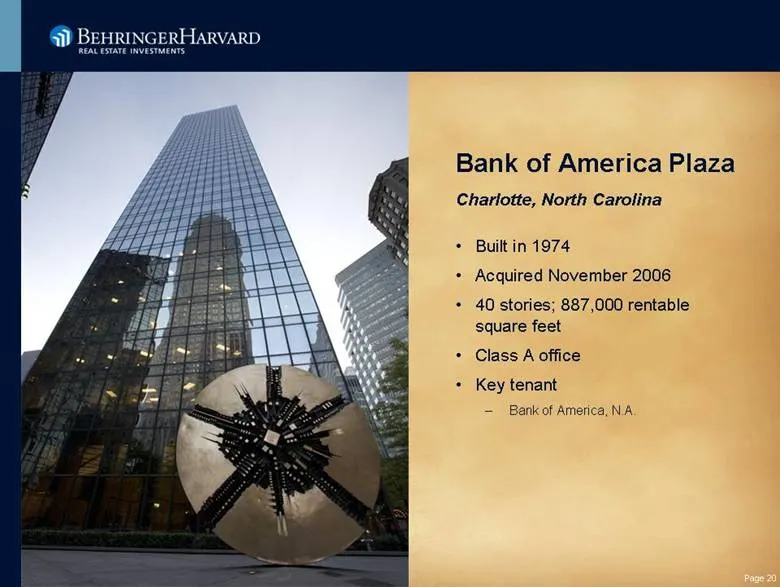
Slide 20: Bank of America Plaza
Bank of America Plaza Charlotte, North Carolina Built in 1974 Acquired November 2006 40 stories; 887,000 rentable square feet Class A office • Key tenant – Bank of America, N.A. Page 20
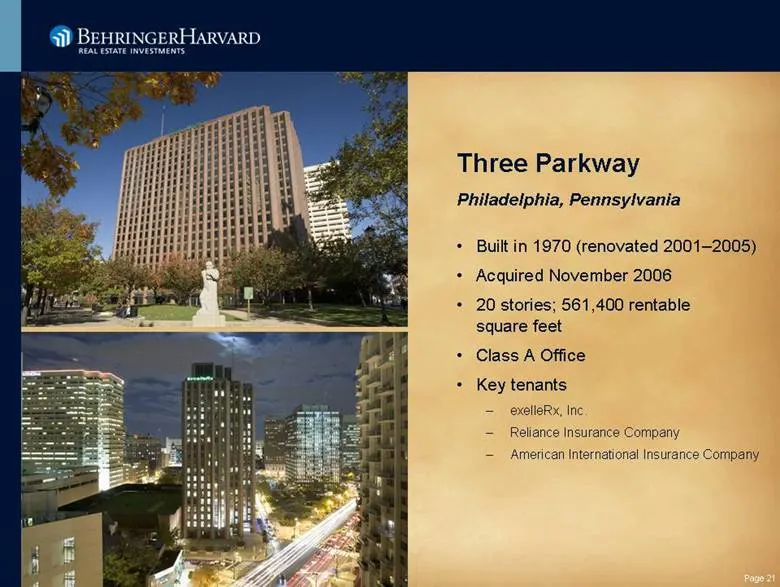
Slide 21: Three Parkway
Three Parkway Philadelphia, Pennsylvania Built in 1970 (renovated 2001–2005) Acquired November 2006 20 stories; 561,400 rentable square feet Class A Office • Key tenants – exelleRx, Inc. – Reliance Insurance Company – American International Insurance Company Page 21
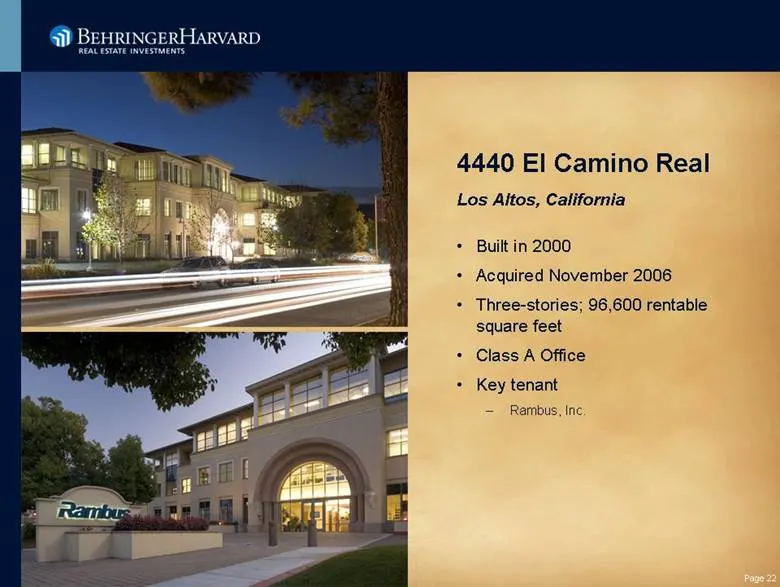
Slide 22: 4440 El Camino Real
4440 El Camino Real Los Altos, California Built in 2000 Acquired November 2006 Three-stories; 96,600 rentable square feet Class A Office • Key tenant – Rambus, Inc. Page 22
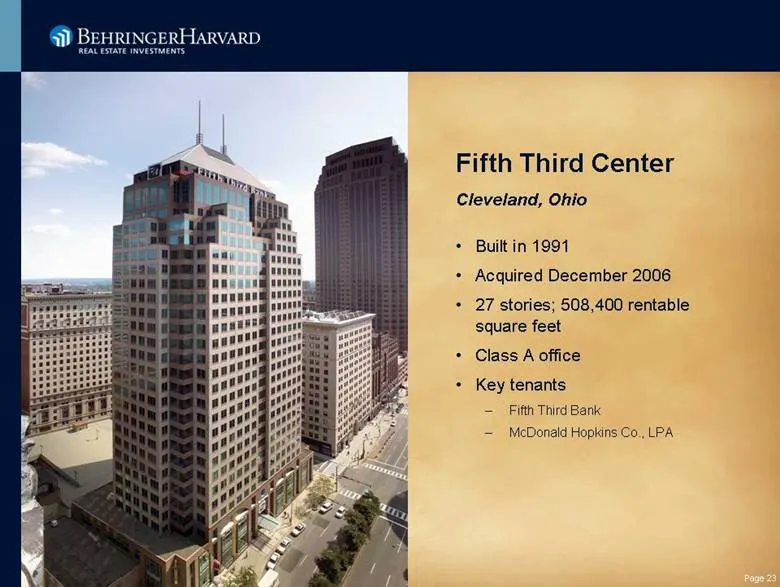
Slide 23: Fifth Third Center
Fifth Third Center Cleveland, Ohio Built in 1991 Acquired December 2006 27 stories; 508,400 rentable square feet Class A office • Key tenants – Fifth Third Bank – McDonald Hopkins Co., LPA Page 23
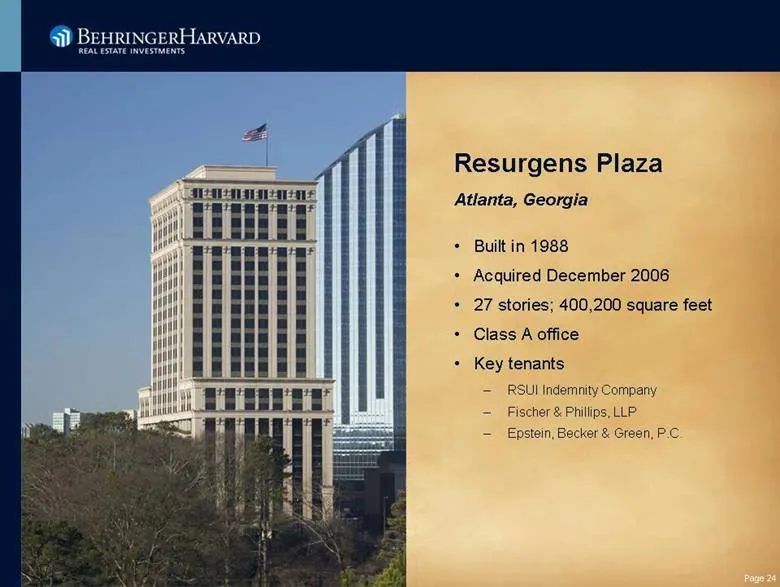
Slide 24: Resurgens Plaza
Resurgens Plaza Atlanta, Georgia Built in 1988 Acquired December 2006 27 stories; 400,200 square feet Class A office • Key tenants – RSUI Indemnity Company – Fischer & Phillips, LLP – Epstein, Becker & Green, P.C. Page 24
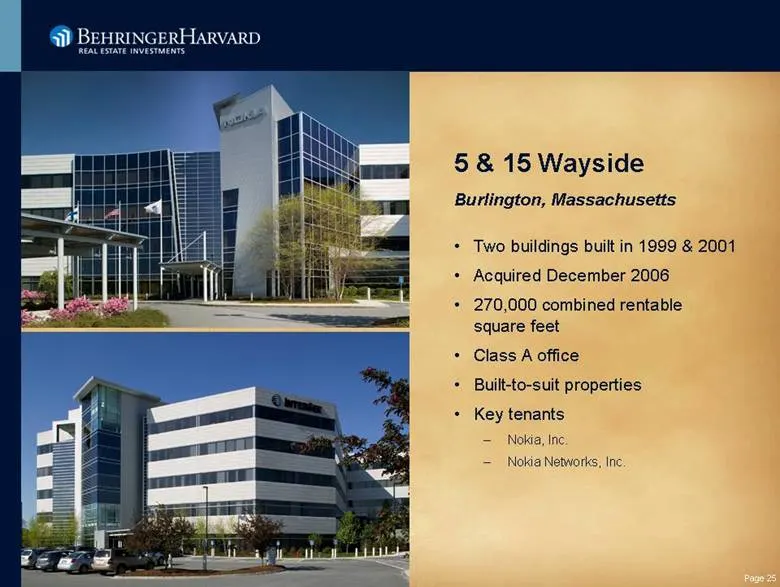
Slide 25: 5 & 15 Wayside
5 & 15 Wayside Burlington, Massachusetts Two buildings built in 1999 & 2001 Acquired December 2006 270,000 combined rentable square feet Class A office Built-to-suit properties • Key tenants – Nokia, Inc. – Nokia Networks, Inc. Page 25
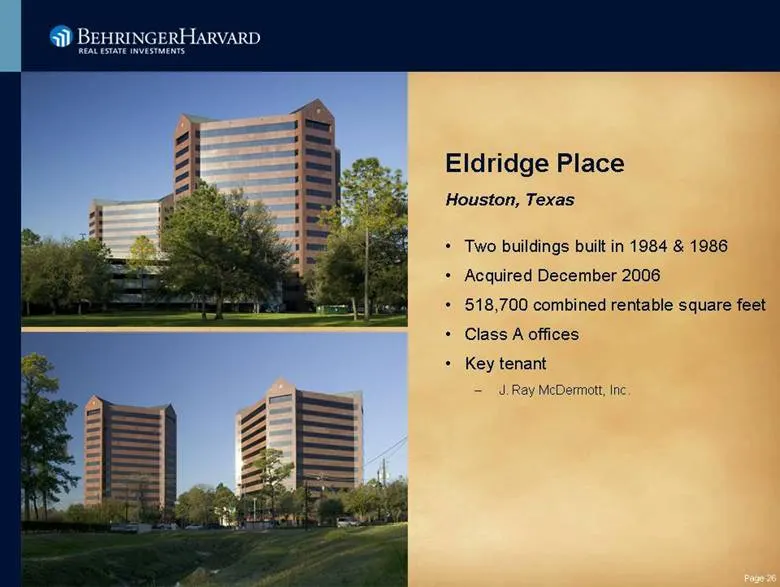
Slide 26: Eldridge Place
Eldridge Place Houston, Texas Two buildings built in 1984 & 1986 Acquired December 2006 518,700 combined rentable square feet Class A offices • Key tenant – J. Ray McDermott, Inc. Page 26
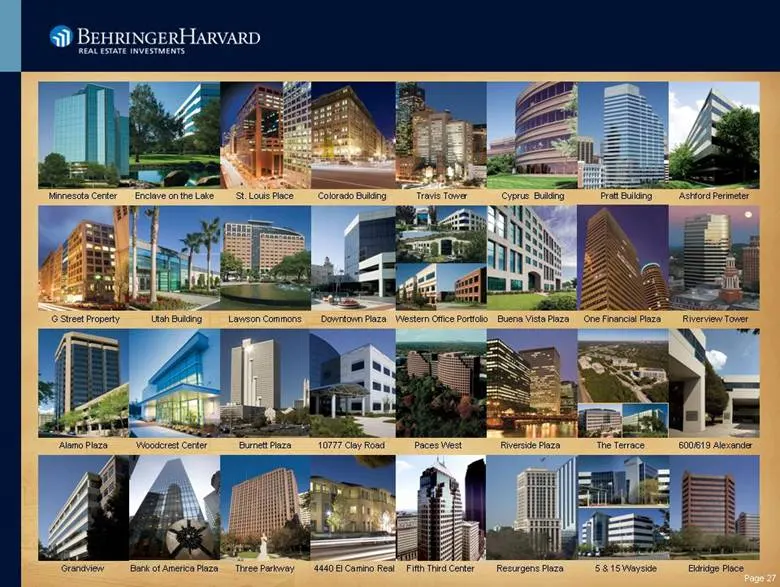
Slide 27: List of REIT properties
Minnesota Center Enclave on the Lake St. Louis Place Colorado Building Travis Tower Cyprus Building Pratt Building Ashford Perimeter Grandview Bank of America Plaza Three Parkway 4440 El Camino Real Fifth Third Center Resurgens Plaza 5 & 15 Wayside Eldridge Place Alamo Plaza Woodcrest Center Burnett
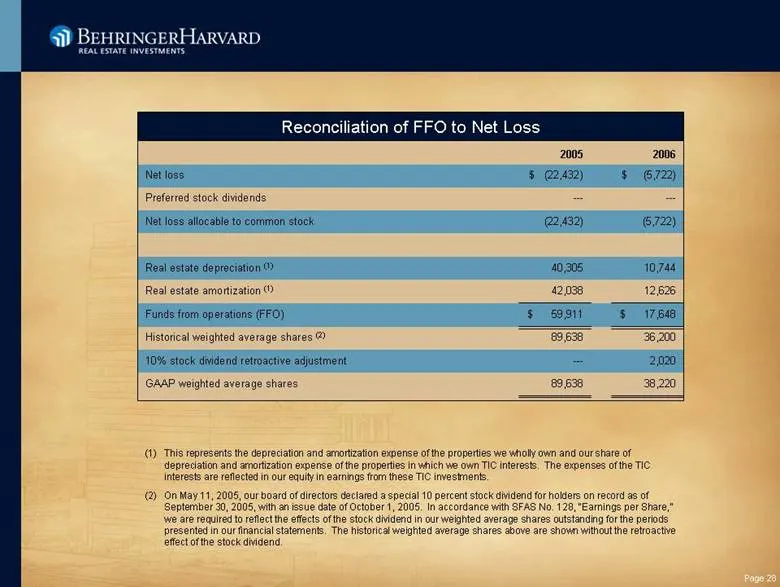
Slide 28: Reconciliation of FFO to Net Loss
38,220 89,638 GAAP weighted average shares 2,020 --- 10% stock dividend retroactive adjustment 36,200 89,638 Historical weighted average shares (2) $ 17,648 $ 59,911 Funds from operations (FFO) 12,626 42,038 Real estate amortization (1) 10,744 40,305 Real estate depreciation (1) (5,722) (22,432) Net
Source: SEC EDGAR · 8-K filed Jun 20, 2007
More decks from TIER REIT Inc
 Merger or Acquisition (June 2019)27 slides · Jun 4, 2019
 Merger or Acquisition (March 2019)18 slides · Mar 25, 2019
 Merger or Acquisition (March 2019)19 slides · Mar 25, 2019
 Investor Presentation (March 2019)30 slides · Mar 4, 2019
 Investor Presentation (February 2019)28 slides · Feb 19, 2019
 Investor Presentation (November 2018)28 slides · Nov 5, 2018