Bank of Florida — Bancshares of Florida — Investor Presentation (December 2005)
31 slides from Bank of Florida's investor presentation, Dec 14, 2005
Slide 1: Bancshares of Florida, Inc. Investor Presentation
Bancshares of Florida, Inc. Investor Presentation December 14, 2005 Financial Data at 9:30.05 ‘Valuation Data at 12.06.05 BANCSHARES oF FLORIDA 1x a NASDAQ: BOFL.
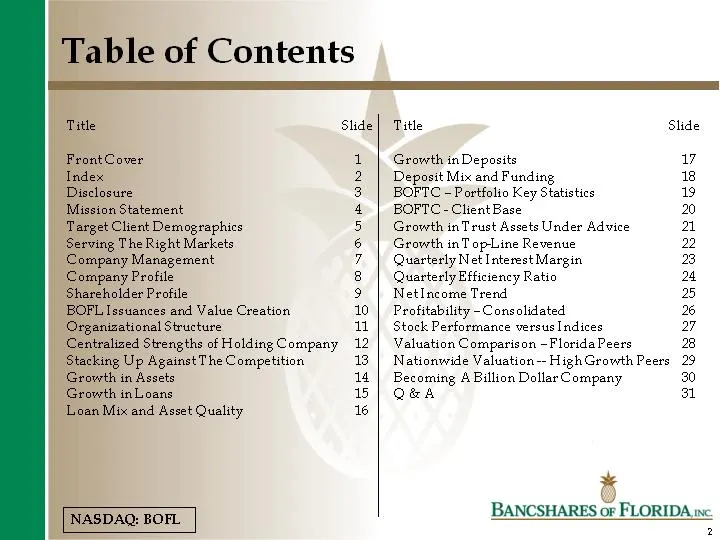
Slide 2: Index
Title 1 | Growth inDeposits v 2 | Deposit Mix and Funding 18 3. | BOFTC -Portfolio Key Statistics 19 ment 4 | BOFTC-ClientBase 20 it Demographics 5 | Growth inTrust Assets Under Advice a ight Markets 6 | Growth inTopLine Revenue 22 7 | Quarterly Net Interest Margin 2B 8 | Quarterly Efficiency Ratio
Slide 3: Disclosure
Disclosure This presentation includes numerous estimates and assumptions. Actual results will vary from the information presented herein and such results may and adverse. This information is presented for discussion purposes only. be negativ BANCSHARES oF FLORIDA 1x 7 NASDAQ: BOFL.
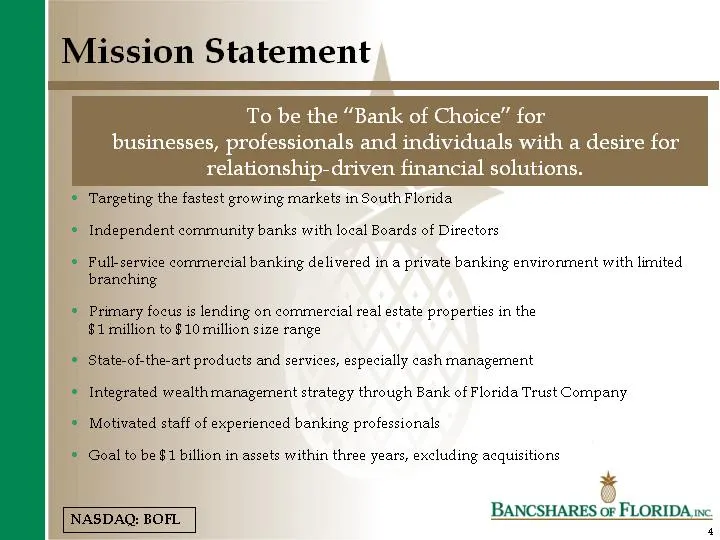
Slide 4: Mission Statement
Mission Statement To be the “Bank of Choice” for businesses, professionals and individuals with a desire for relationship-driven financial solutions. * Targeting the fastest growing markets in South Florida * Independent community banks with local Boards of Directors © Full-service commercial bankin
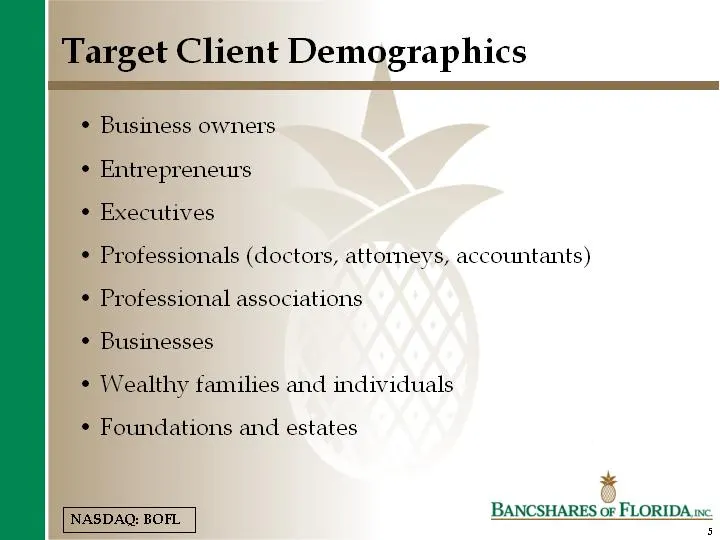
Slide 5: Target Client Demographics
Target Client Demographics ¢ Business owners * Entrepreneurs ¢ Executives * Professionals (doctors, attorneys, accountants) * Professional associations ¢ Businesses ¢ Wealthy families and individuals ¢ Foundations and estates BANCSHARES oF FLORIDA 1x 7 NASDAQ: BOFL.
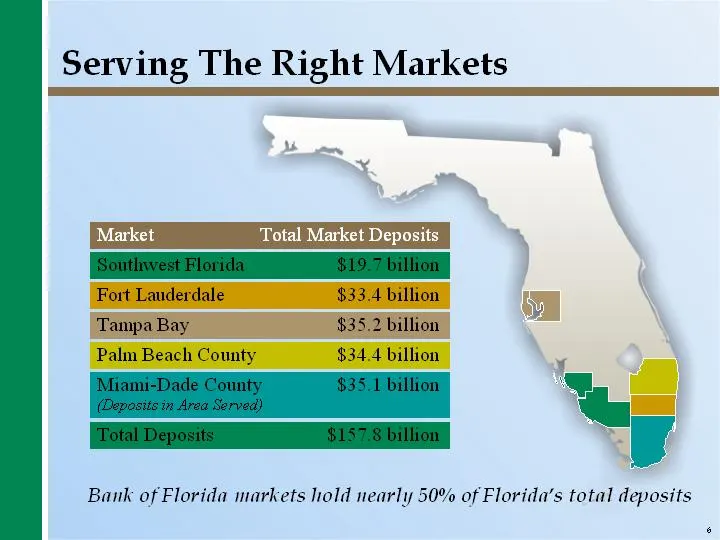
Slide 6: Serving The Right Markets
Serving The Right Markets Fort Lauderdale $33.4 billion Tampa Bay $35.2 billion Palm Beach County $34.4 billion a a ‘TonLDeponis——SIS7Sbilion f Bank of Florida markets hold nearly 50% of Florida’s total deposits
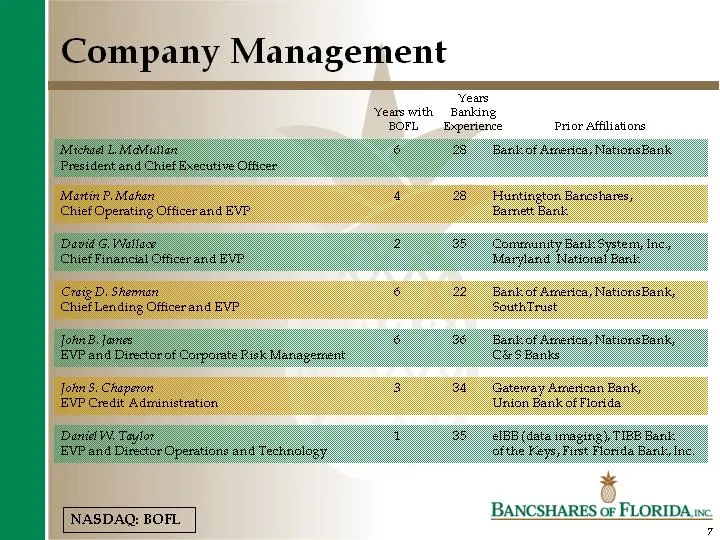
Slide 7: Company Management
Company Management Years Years with Banking BOFL Experience Prior Affiliations Martin P. Maken 4 28 Huntington Bancshares, Chief Operating Officerand EVP Bamett Bank Craig D. Shennan é 22 Bank of America, NationsBank, Chief Lending Officer and EVP SouthTrust Jolin S. Chaperon 3 84 Gateway American B
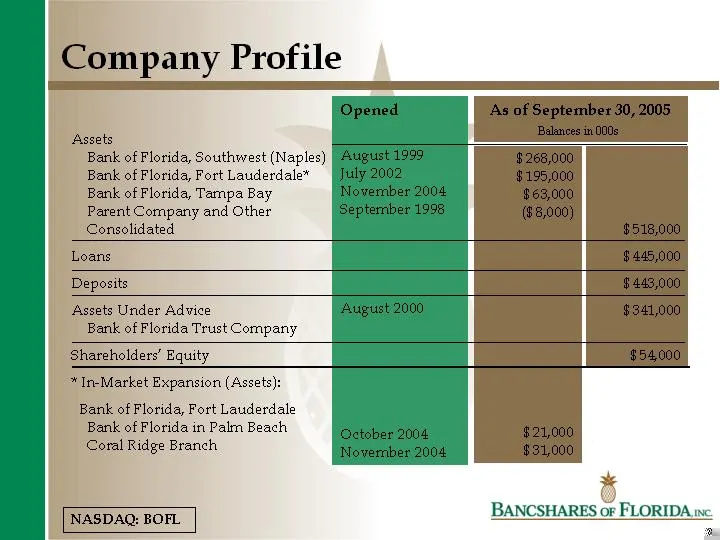
Slide 8: Company Profile
Company Profile Assets Bank of Florida, Southwest (Naples) Bank of Florida, Fort Lauderdale Bank of Florida, Tampa Bay Parent Company and Other Consolidated Deposits Assets Under Advice Bank of Florida Trust Company Shareholders’ Equity * In Market Expansion (Assets): Bank of Florida, Fort Lauderdal
Slide 9: Shareholder Profile
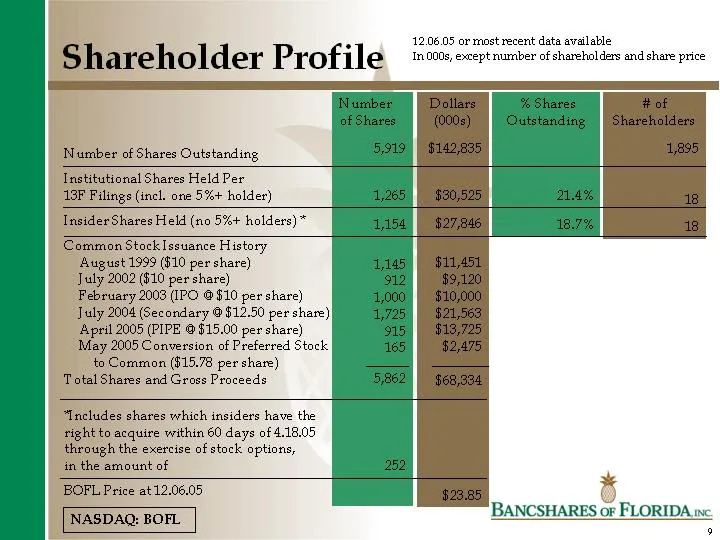
Shareholder Profile Number of Shares Outstanding Institutional Shares Held Per GF Filings (incl. one 5%+ holder) Insider Shares Held (no 5%+ holders) * Common Stock Issuance History August 1999 (10 per share) July 2002 ($10 per share) February 2003 (IPO @ $10 per share) July 2004 (Secondary @ $12.50
Slide 10: BOFL Issuances and Market Value Creation
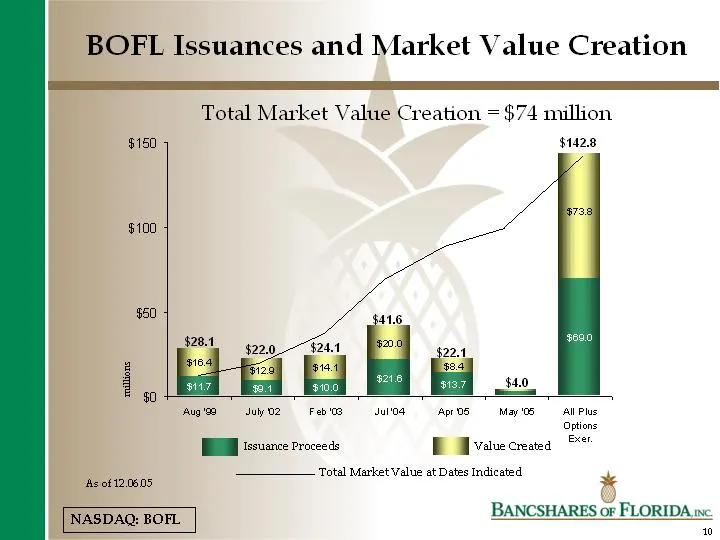
BOFL Issuances and Market Value Creation $150 $100 $60 As of 12.0605 Total Market Value Creation = $74 million Aug Juy02 Feb? urna prs May" AIPur Options Ber. PEGI tsuance Proceeds BG vane created Total Market Value at Dates Indicated NASDAQ: BOFL. BANCSHARES oF FLORIDA. inc. ad
Slide 11: Organizational Structure
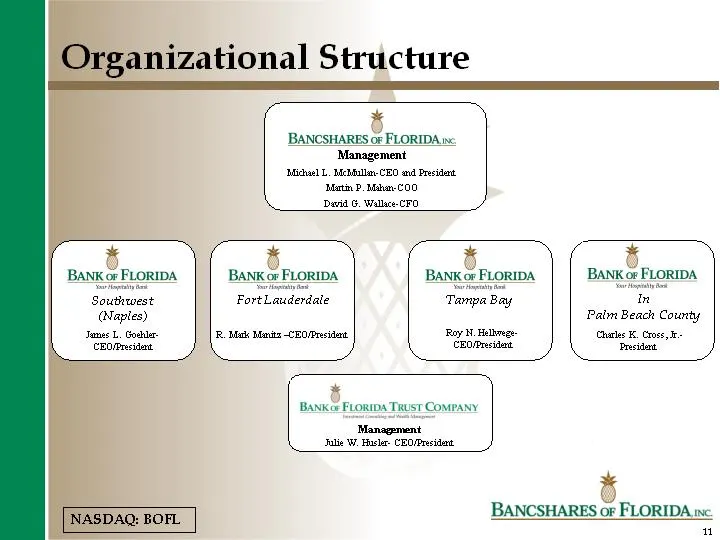
zational Structure BANCSHARES oF FLORIDA 0: ‘Management ‘Mia L. MeBula- CEO and Presid ‘Martin P. Bae CO0 David 6, Walle CFO BANK or FLORIDA BANK or FLORIDA BANK or FLORIDA BANK or FLORIDA Southwest Fort Lauderdale ‘Tampa Bay In (Mapies) Palm Beach Courty Jans L, Goce | | niok nents comida Roy N.Hel
Slide 12: Centralized Strengths of Holding Company
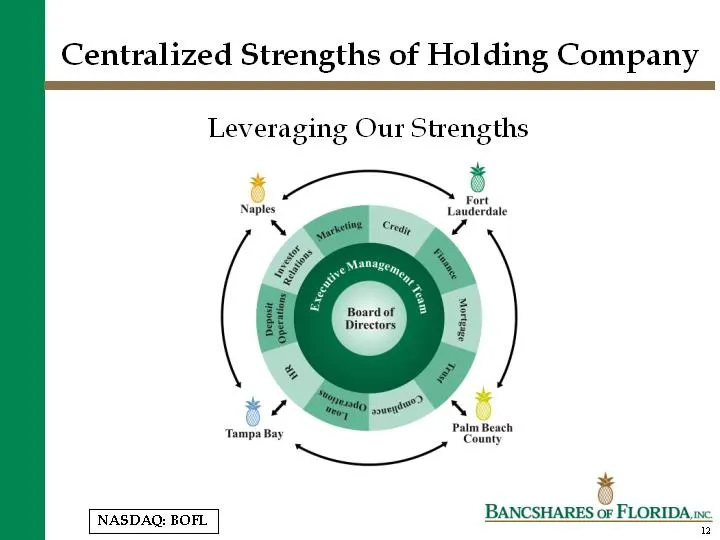
Centralized Strengths of Holding Company Leveraging Our Strengths 1— 8 Lauderdale 5. ‘Tampa Bay NASDAQ: BOFL. BANCSHARES oF FLORIDA, a
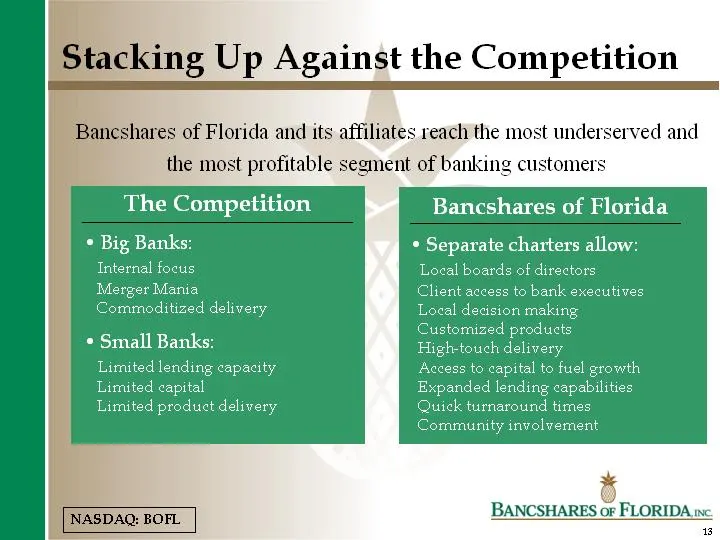
Slide 13: Stacking Up Against the Competition
g Up Against the Competition of Florida and its affiliates reach the most underserv ¢ most profitable segment of banking customers The Competition Bancshares of Florida * Big Banks: * Separate charters allow: Internal focus Local boards of directors Merger Mania Client access to bank executives Comm
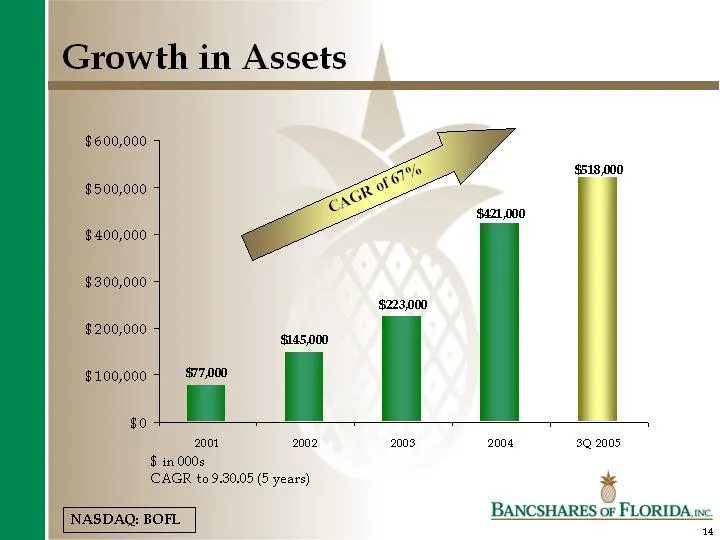
Slide 14: Growth in Assets
Growth in Assets $600,000 $500,000 $400,000 $300,000 $200,000 $100,000 $0 2001 2002 2003 2004 39 2005 $ in 000s CAGR to 9.30.05 (5 years) BANCSHARES oF FLORIDA. inc 7 NASDAQ: BOFL.
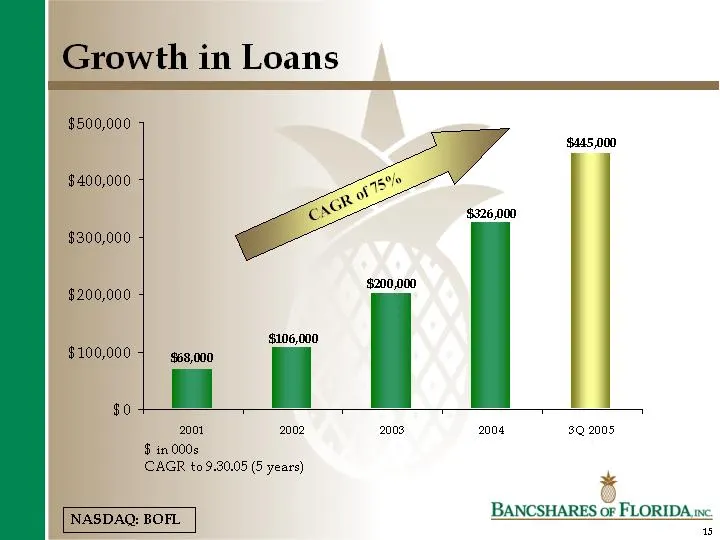
Slide 15: Growth in Loans
Growth in Loans $500,000 $400,000 $300,000 $200,000 $100,000 $0 2001 2002 2003 2004 3Q 2005 $ in 000s CAGR to 9.30.05 (5 years) BANCSHARES oF FLORIDA. inc a NASDAQ: BOFL.
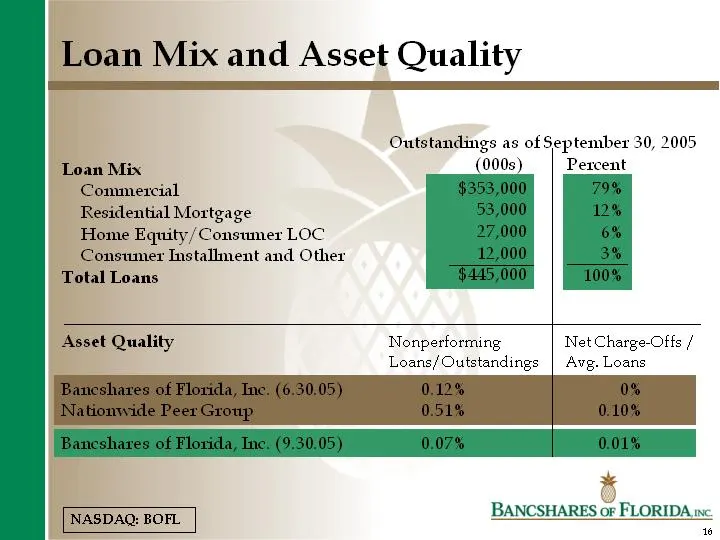
Slide 16: Loan Mix and Asset Quality
Loan Mix and Asset Quality Outstandings as of September 30, 2005 Loan Mix (000s) | Percent Commercial Residential Mortgage Home Equity/Consumer LOC Consumer Installment and Other Total Loans Asset Quality Nonperforming Net Charge-Offs / Loans/Outstandings | Avg. Loans NASDAQ: EOF. BANCSHARES oF FLOR
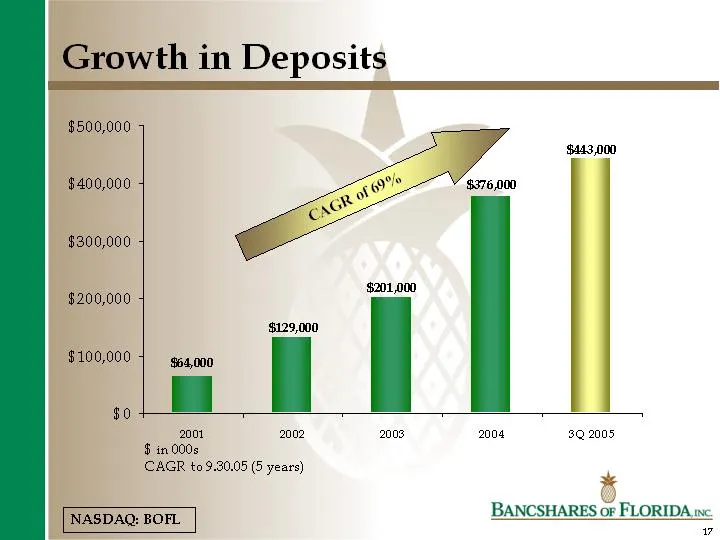
Slide 17: Growth in Deposits
Growth in Deposits $500,000 $400,000 $300,000 $200,000 $100,000 $0 2001 2002 2008 2004 3Q 2005, $ in 000s CAGR to 9.30.05 (5 years) BANCSHARES oF FLORIDA. inc ol NASDAQ: BOFL.
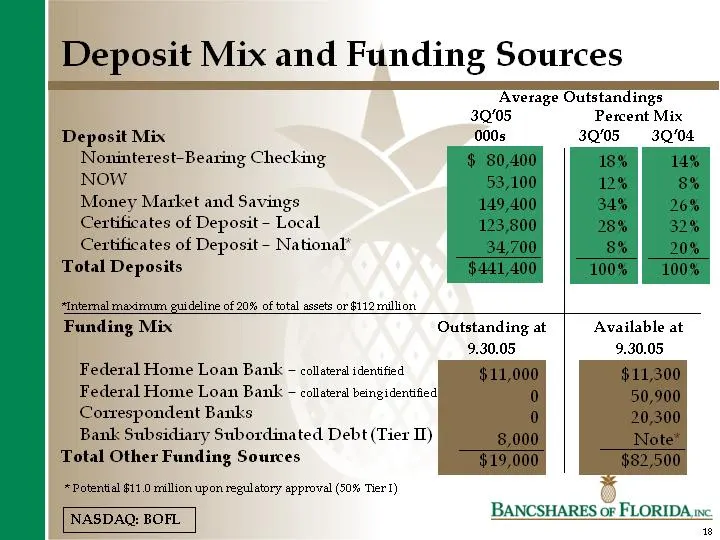
Slide 18: Deposit Mix and Funding Sources
Deposit Mix and Funding Sources "Average Outstandings 3Q'05 Percent Mix Deposit Mix 000s 3Q'05 3Q'04 Noninterest-Bearing Checking Now y Market and Savings cates of Deposit - Local Certificates of Deposit ~ National’ Total Deposits “Internal maximum guideline of 20% of total assets or $112 million. F
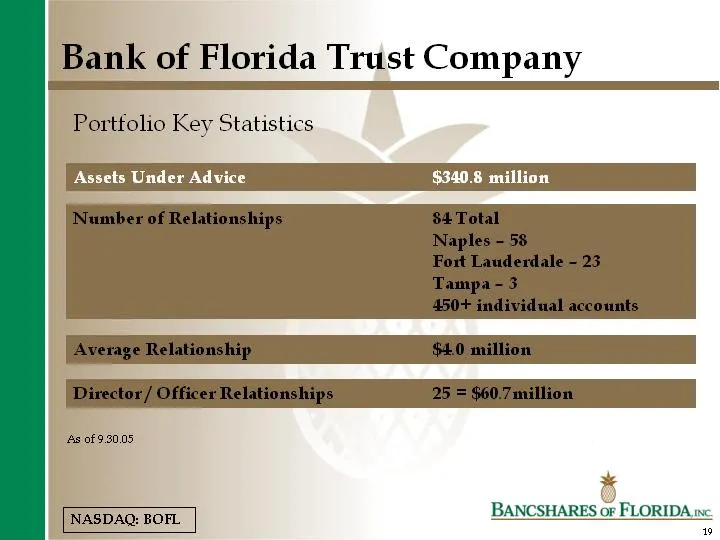
Slide 19: Bank of Florida Trust Company: Portfolio Key Statistics
Bank of Florida Trust Company Porttolio Key Statistics NASDAQ: BOFL BANCSHARES oF FLORIDA.nc. ~
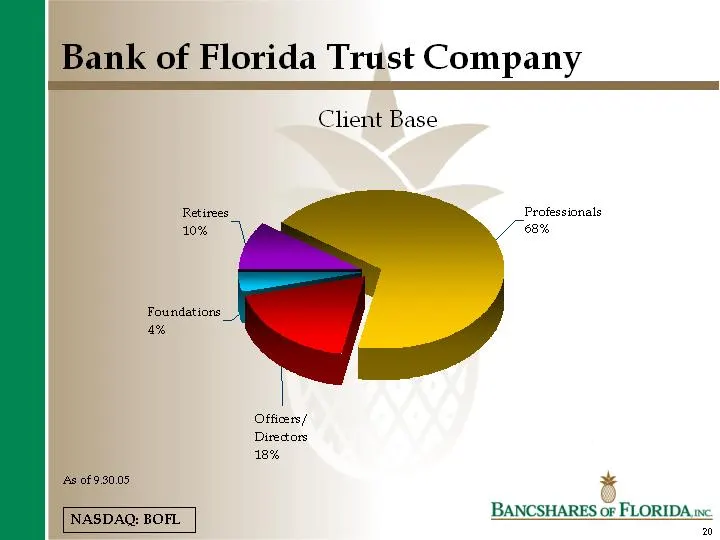
Slide 20: Bank of Florida Trust Company: Client Base
Bank of Florida Trust Company Client Base Professionals 68% Retirees 10% Foundations 4% Officers/ Directors 18% | As of 9.30.05 * BANCSHARES oF FLORIDA.nc | NASDAQ: BOFL. l 20
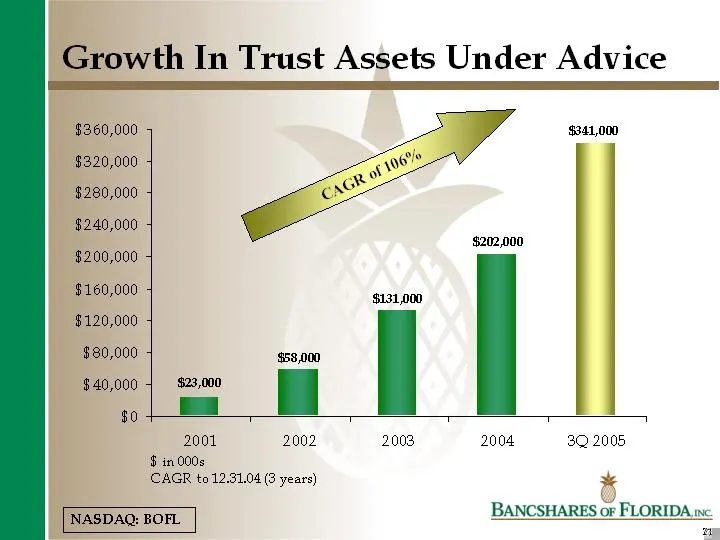
Slide 21: Growth in Trust Assets Under Advice
Growth In Trust Assets Under Advice $360,000 $320,000 $280,000 $240,000 $200,000 $160,000 $120,000 $80,000 $40,000 $0 2001 2002 2003 2004 3Q 2005 $ in.000s CAGR to 12.31.04 (3 years) BANCSHARES oF FLORIDA. inc NASDAQ: BOFL.
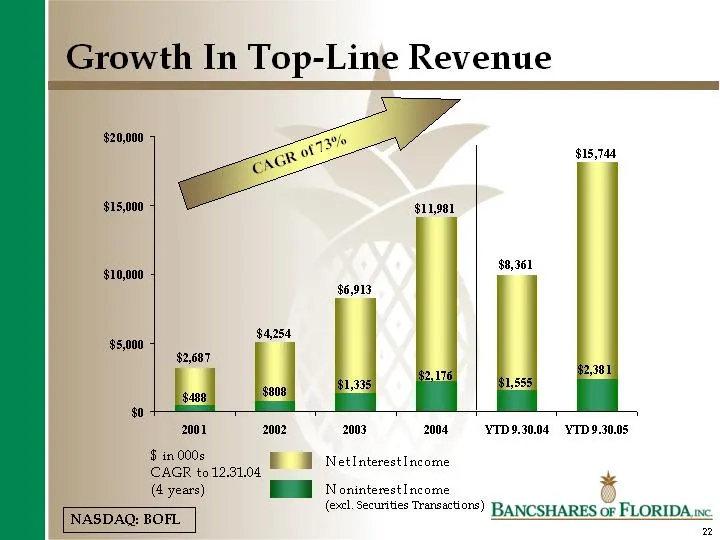
Slide 22: Growth in Top-Line Revenue
Growth In Top-Line Revenue $20,000 $15,744 $15,000 $1901 $10,000 a $6,913 254 $5,000 MS $2,687 | 1,335] = fb sss $408 $008 o} = | 2001 2002 2003 2004 YID9.30.04 YTD9.30.05 aan NetInterestIncome CAGR t012.31.04 (4 years) Noninterest Income NASDAQ: BOFL. (el. Securities Transactions) BANCSHARES oF FLO
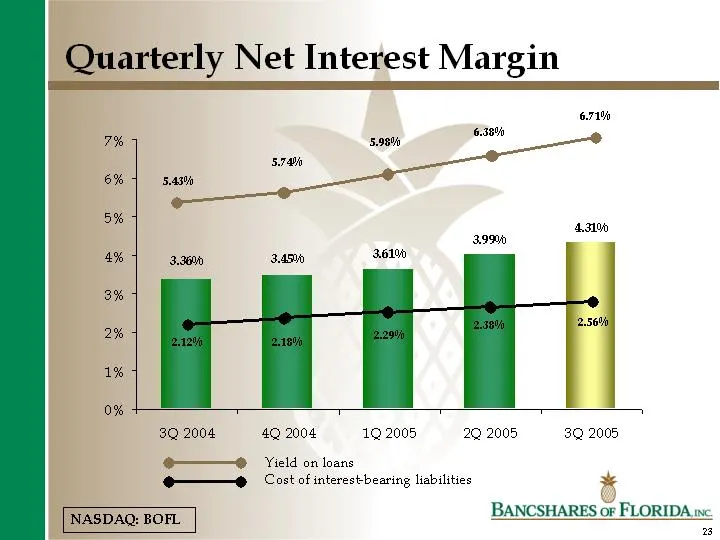
Slide 23: Quarterly Net Interest Margin
Quarterly Net Interest Margin 3Q 2004 4Q 2004 19 2005 29 2005 3Q 2005 Yield on loans $< _ Cost of interest bearing liabilities BANCSHARES oF FLORIDA. inc. a NASDAQ: BOFL.
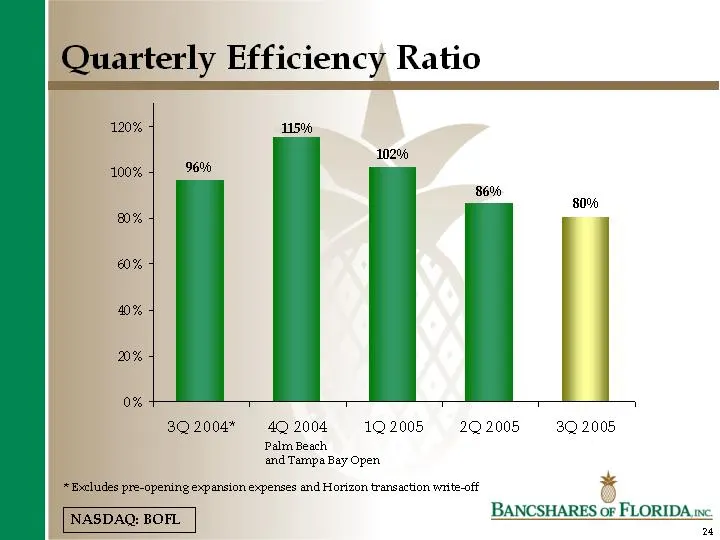
Slide 24: Quarterly Efficiency Ratio
Quarterly Efficiency Ratio 120% 115% 10206 100% co 86% 80% 0% 0% 0% 0% 0% 3Q2004* 492004 102005 = 202005 = 3.2005 Palm Beach and Tampa Bay Open * Excludes pre-opening expansion expenses and Horizon transaction write-off BANCSHARES oF FLORIDA. inc. NASDAQ: BOFL. on
Slide 25: Net Income Trend
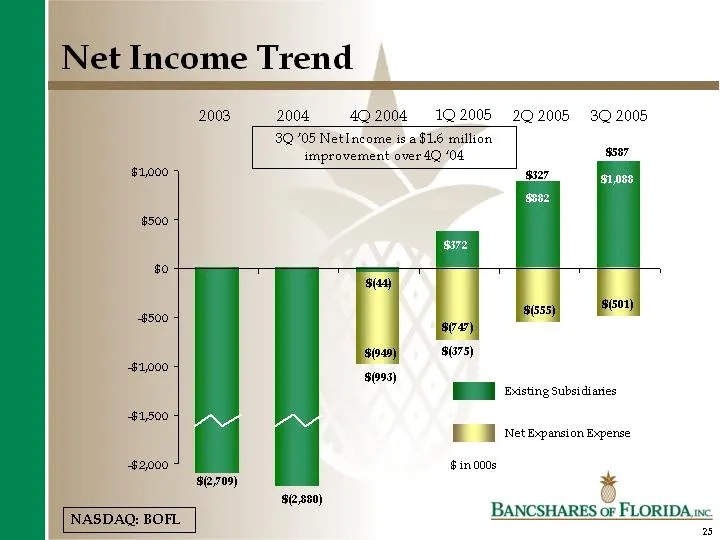
Net Income Trend 2003 2004 4.2004 1.2005 _2Q2005 3Q2005 3Q ’05 NetIncome is a $1.6 million improvement over 4 ‘04 $597 $1000 any sez $500 #0 = os 844) 9601) sos, -$500 bre} soa) 8675) perro $993) HEE sting subsidiaries $1,500 Net Expansion Expense $2,000 $ino00s 8.709) NASDAQ: BOFL. 82,800 ‘ i) BANC
Slide 26: Profitability - Consolidated
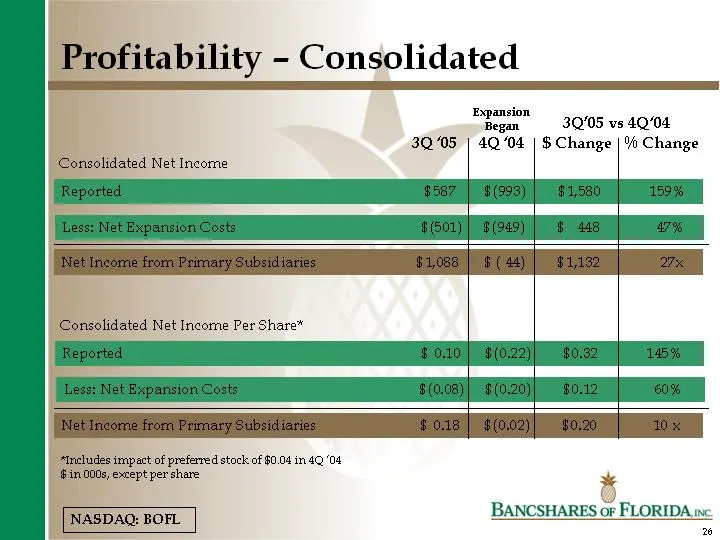
Profitability - Consolidated Expansion Began 305 vs 4004 3Q05 | 4004 | $ Change | % Change Consolidated Net Income Consolidated Net Income Per Share* “Includes impact of preferred stock of $0.04 in 49 ‘04 $ in 000s, except per share ote NASDAQ: EOF. BANCSHARES oF FLORIDA. we =
Slide 27: Stock Performance versus Indices
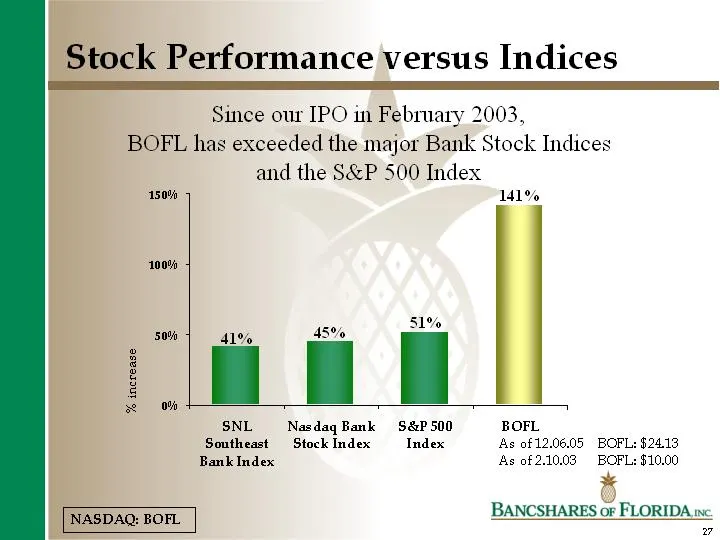
Stock Performance versus Indices Since our IPO in February 2003, BOFL has exceeded the major Bank Stock Indices and the S&P 500 Index 150% 141% 100% 51% 50% ] 41% 45% = Mm SNL Nasdaq Bank S&P 500 BOFL Southeast Stock Index Index As 0f 12.06.05 BOFL: $24.13 Bank Index As of 2.10.03 BOFL: $10.00 BANCS
Slide 28: Valuation Comparison
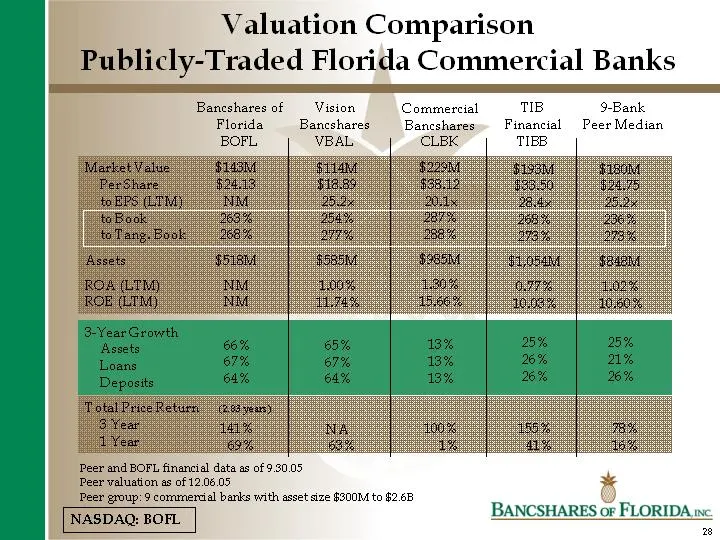
Valuation Comparison Publicly-Traded Florida Commercial Banks Bancshares of Vision Commercial TIB 9-Bank Florida Bancshares Bancshares» Financial Peer Median BOFL, VBAL CLBK TIEB Peer and BOFL financial data as of 9.30.05 Peer valuation as of 12.06.05 te Peer group: 9 commercial banks with asset ize
Slide 29: Nationwide Valuation Comparison
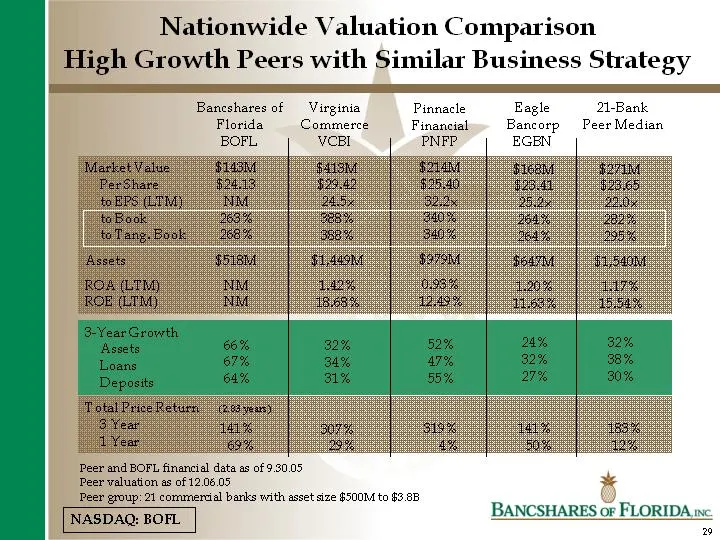
Nationwide Valuation Comparison High Growth Peers with Similar Business Strategy Bancshares of Virginia Pinnacle Eagle 21-Bank Florida Commerce Financial Bancorp Peer Median BOFL VCBI PNFP EGEN Peer and BOFL financial data as of 9.30.05 ‘ Peer valuation as of 12.06.05 te Peer group: 21 commensal bar
Slide 30: Becoming A $1 Billion Asset Company
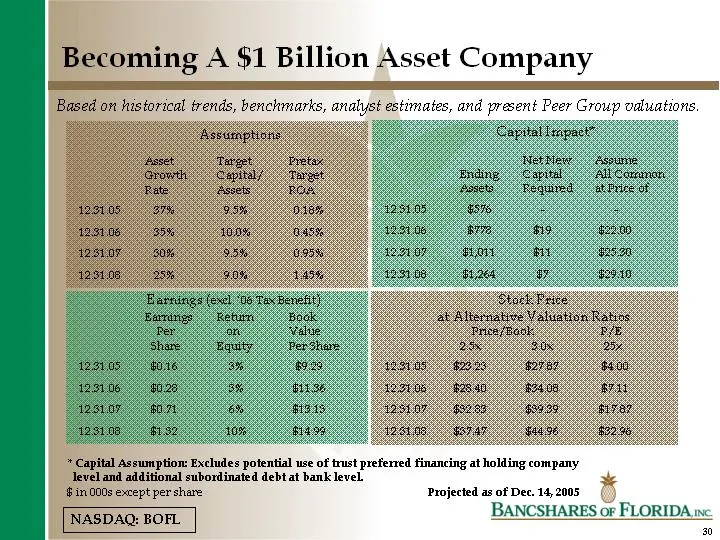
Becoming A $1 Billion Asset Company Based on historical trends, benchmarks, analyst estimates, and present Peer Group valuations. * Capital Assumption: Excludes potential use of trust preferred financing at holding company Jevel and additional subordinated debt at bank level. oe in 000s except per s
Slide 31: Bancshares of Florida, Inc.
Exhibit 99.1 Bancshares of Florida, Inc. Investor Presentation December 14, 2005 Financial Data at 9.30.05 Valuation Data at 12.06.05 NASDAQ: BOFL [LOGO OF BANCSHARES OF FLORIDA, INC.] Table of Contents Title Slide Front Cover Index Disclosure Mission Statement Target Client Demographics Serving The
Source: SEC EDGAR · 8-K filed Dec 14, 2005
More decks from Bank of Florida Corp
 IPO Roadshow (November 2009)47 slides · Nov 6, 2009
 Shareholder Meeting (May 2009)39 slides · May 1, 2009
 Raymond James Investor Conference March 200933 slides · Mar 10, 2009
 Investor Presentation (December 2008)26 slides · Dec 1, 2008
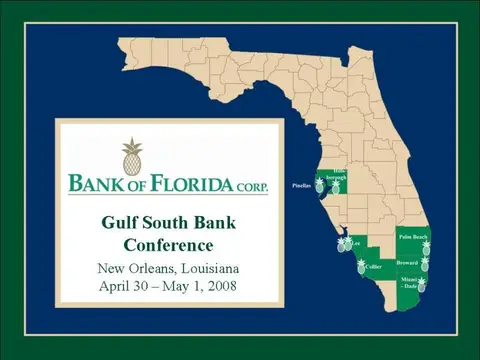 Gulf South Bank Conference 200835 slides · Apr 28, 2008
 Keefe, Bruyette & Woods Visitation (February 2008)28 slides · Feb 5, 2008