Aspen Insurance Holdings Ltd · NYSE:AHL/PE
Aspen Insurance — Q3 2011 Earnings Presentation
25 slides from Aspen Insurance's earnings presentation, Oct 27, 2011

Slide 1: Q3 2011 Earnings Conference Call
Q3 2011 EARNINGS CONFERENCE CALL Aspen Insurance Holdings Limited AHL: NYSE October 28, 2011
Slide 2: Safe Harbor Disclosure
AHL: NYSE SAFE HARBOR DISCLOSURE 2 This slide presentation is for information purposes only. It should be read in conjunction with our financial supplement posted on our website on the Investor Relations page and with other documents filed or to be filed shortly by Aspen Insurance Holdings Limited (
Slide 3: Financial Highlights: Q3 2011
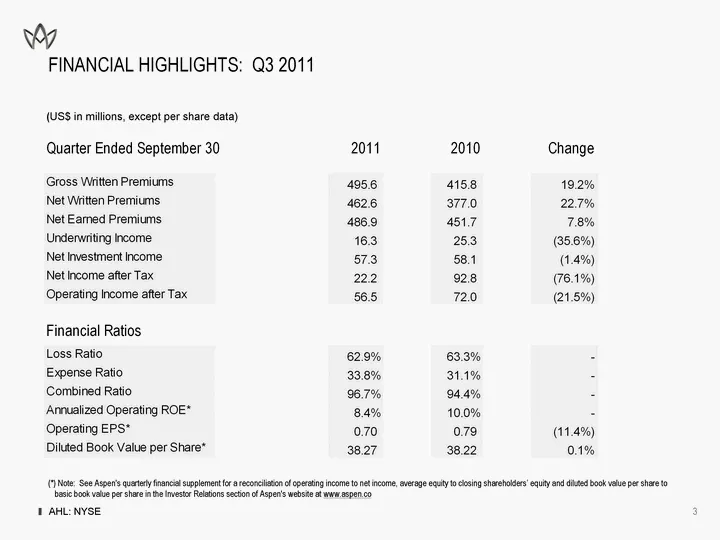
AHL: NYSE FINANCIAL HIGHLIGHTS: Q3 2011 AHL: NYSE 3 (US$ in millions, except per share data) (*) Note: See Aspen's quarterly financial supplement for a reconciliation of operating income to net income, average equity to closing shareholders' equity and diluted book value per share to basic book valu
Slide 4: Financial Highlights: YTD 2011
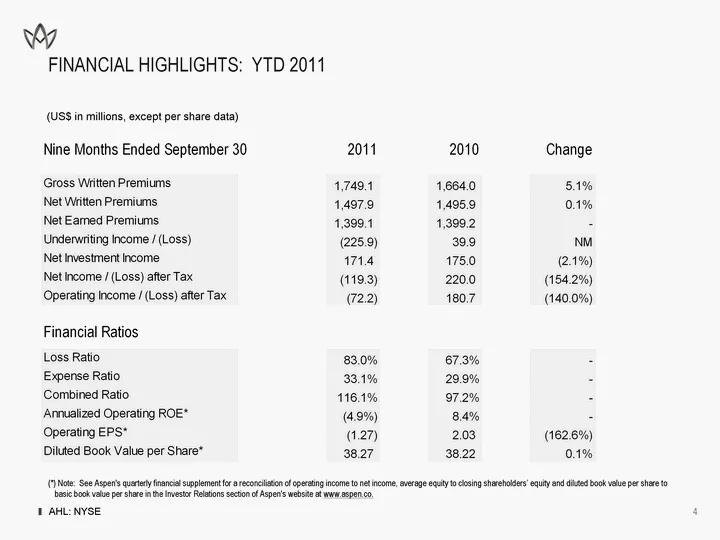
AHL: NYSE FINANCIAL HIGHLIGHTS: YTD 2011 AHL: NYSE 4 (US$ in millions, except per share data) (*) Note: See Aspen's quarterly financial supplement for a reconciliation of operating income to net income, average equity to closing shareholders' equity and diluted book value per share to basic book val
Slide 5: Growth in Book Value per Share and Net Income ROE
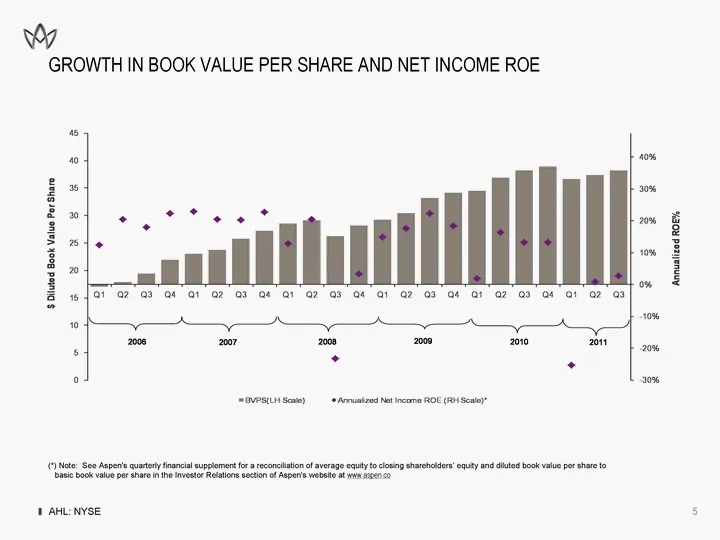
AHL: NYSE GROWTH IN BOOK VALUE PER SHARE AND NET INCOME ROE AHL: NYSE 5 (*) Note: See Aspen's quarterly financial supplement for a reconciliation of average equity to closing shareholders' equity and diluted book value per share to basic book value per share in the Investor Relations section of Aspe
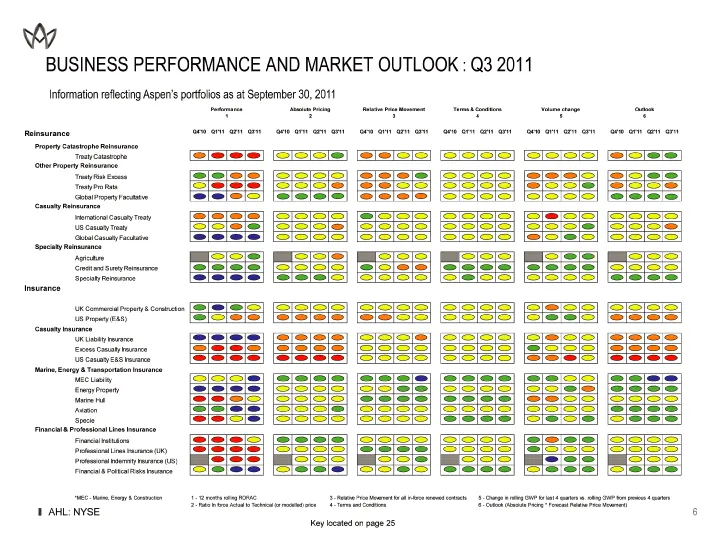
Slide 6: Business Performance and Market Outlook: Q3 2011
AHL: NYSE BUSINESS PERFORMANCE AND MARKET OUTLOOK : Q3 2011 Information reflecting Aspen's portfolios as at September 30, 2011 Key located on page 23 6
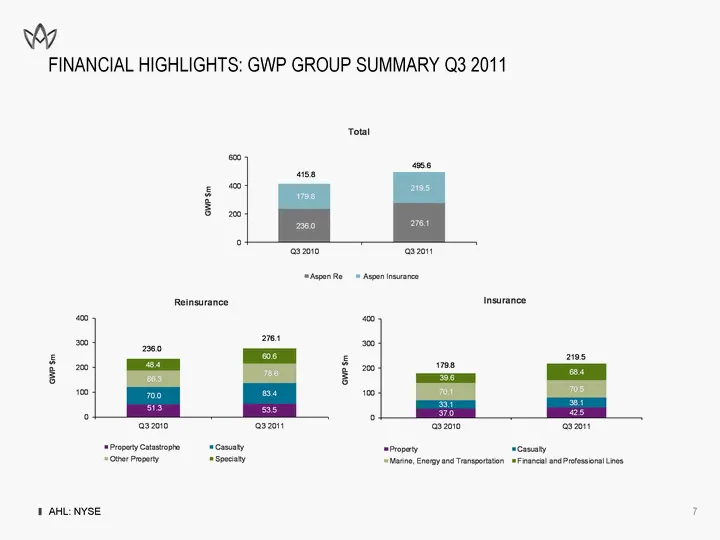
Slide 7: Financial Highlights: GWP Group Summary Q3 2011
AHL: NYSE FINANCIAL HIGHLIGHTS: GWP GROUP SUMMARY Q3 2011 AHL: NYSE 7
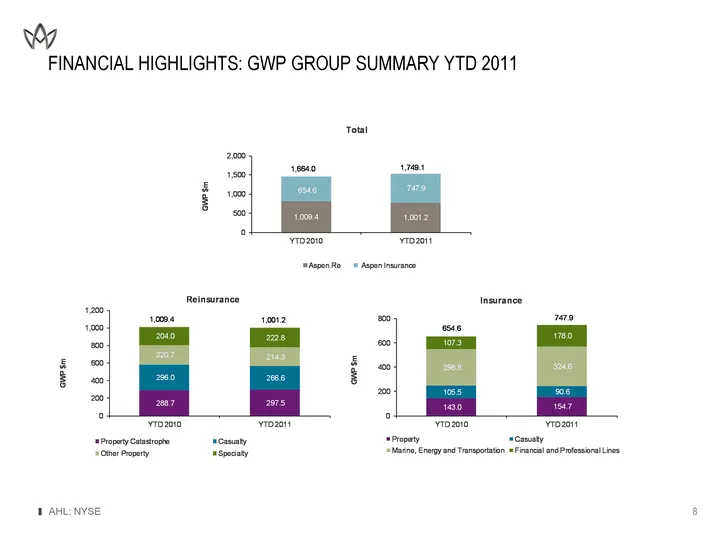
Slide 8: Financial Highlights: GWP Group Summary YTD 2011
AHL: NYSE FINANCIAL HIGHLIGHTS: GWP GROUP SUMMARY YTD 2011 8
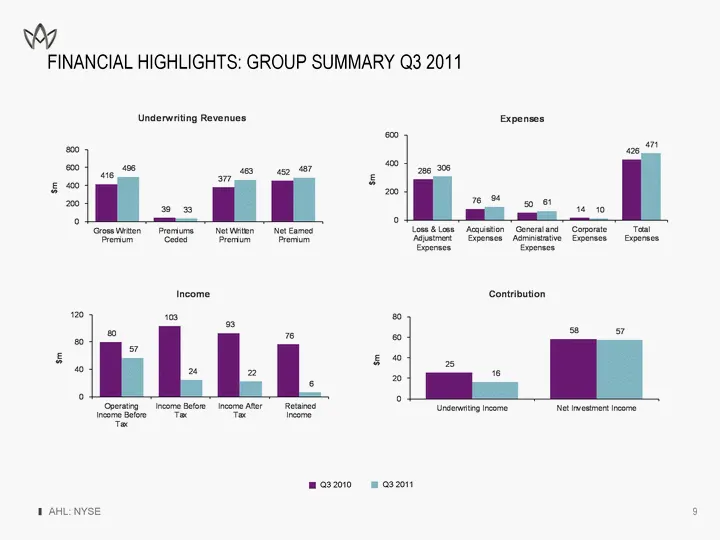
Slide 9: Financial Highlights: Group Summary Q3 2011
AHL: NYSE FINANCIAL HIGHLIGHTS: GROUP SUMMARY Q3 2011 Q3 2010 Q3 2011 9
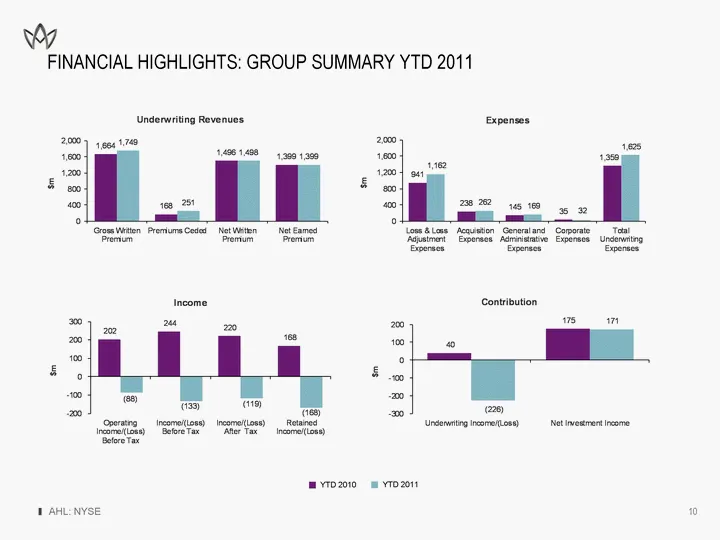
Slide 10: Financial Highlights: Group Summary YTD 2011
AHL: NYSE FINANCIAL HIGHLIGHTS: GROUP SUMMARY YTD 2011 YTD 2010 YTD 2011 10
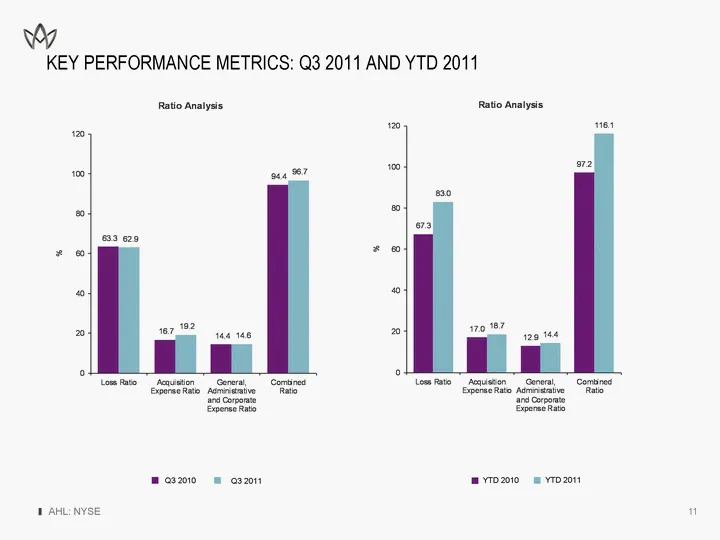
Slide 11: Key Performance Metrics: Q3 2011 and YTD 2011
AHL: NYSE KEY PERFORMANCE METRICS: Q3 2011 AND YTD 2011 11 Q3 2010 Q3 2011 YTD 2010 YTD 2011
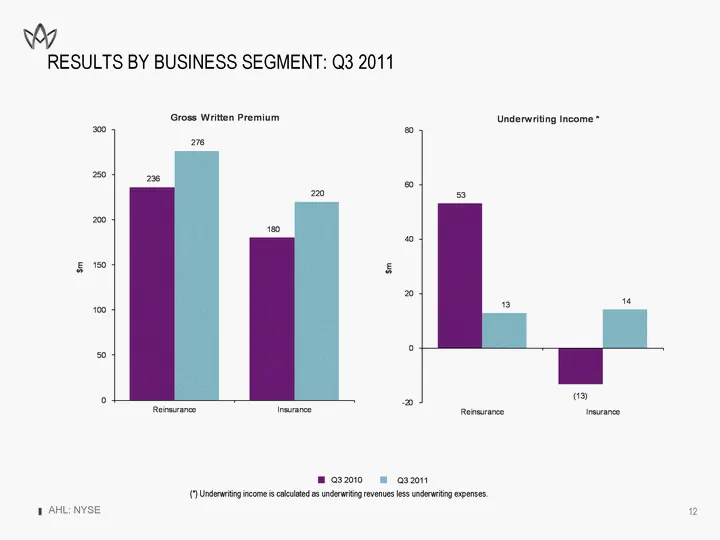
Slide 12: Results by Business Segment: Q3 2011
AHL: NYSE RESULTS BY BUSINESS SEGMENT: Q3 2011 (*) Underwriting income is calculated as underwriting revenues less underwriting expenses. 12 Q3 2010 Q3 2011
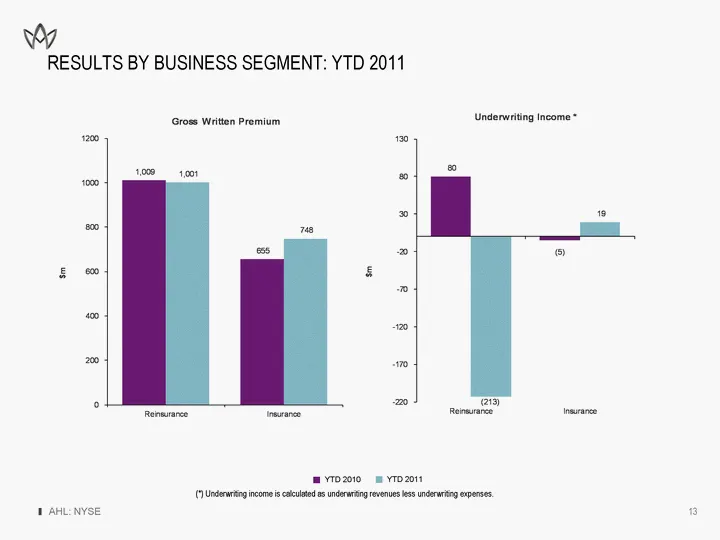
Slide 13: Results by Business Segment: YTD 2011
AHL: NYSE RESULTS BY BUSINESS SEGMENT: YTD 2011 (*) Underwriting income is calculated as underwriting revenues less underwriting expenses. 13 YTD 2010 YTD 2011
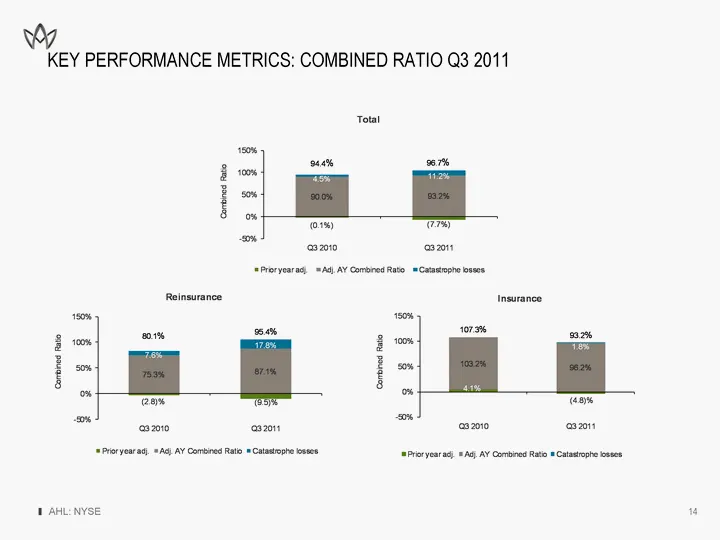
Slide 14: Key Performance Metrics: Combined Ratio Q3 2011
AHL: NYSE KEY PERFORMANCE METRICS: COMBINED RATIO Q3 2011 * 14
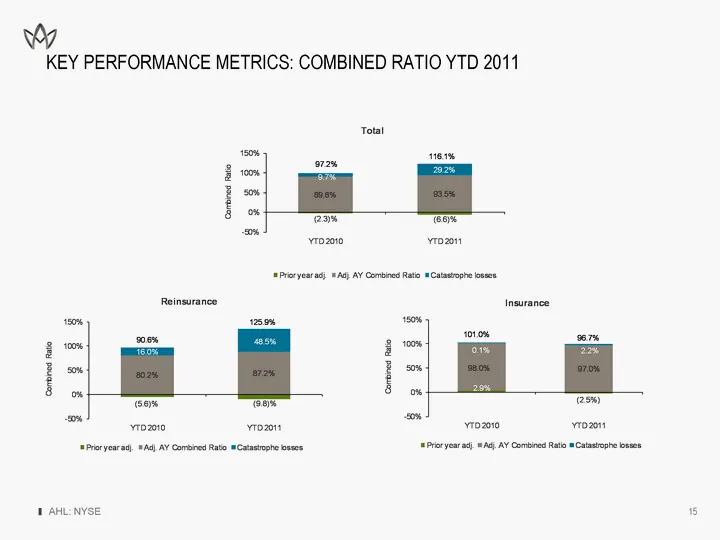
Slide 15: Key Performance Metrics: Combined Ratio YTD 2011
AHL: NYSE KEY PERFORMANCE METRICS: COMBINED RATIO YTD 2011 * 15
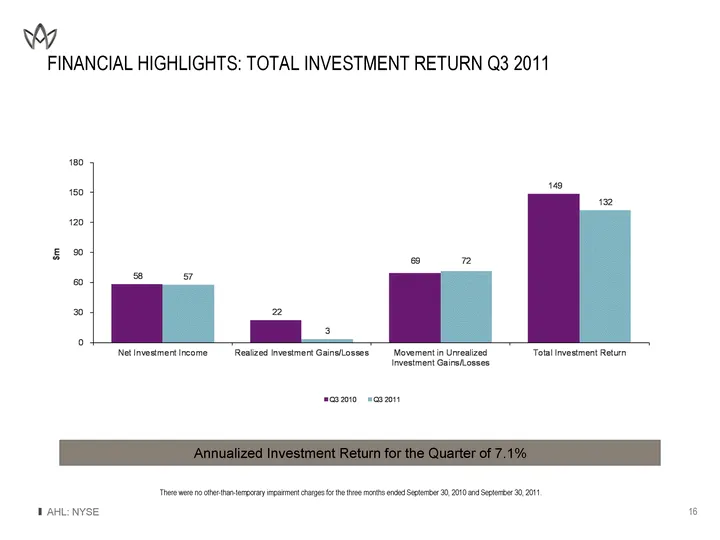
Slide 16: Financial Highlights: Total Investment Return Q3 2011
AHL: NYSE FINANCIAL HIGHLIGHTS: TOTAL INVESTMENT RETURN Q3 2011 - 16 Annualized Investment Return for the Quarter of 7.1% There were no other-than-temporary impairment charges for the three months ended September 30, 2010 and September 30, 2011.
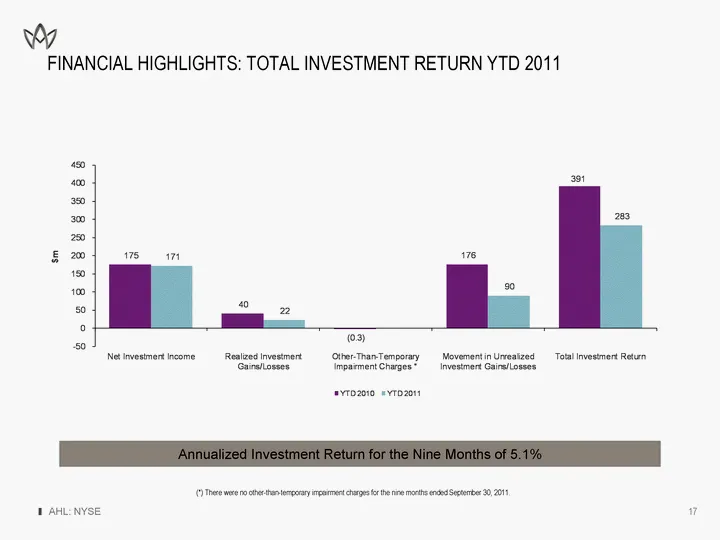
Slide 17: Financial Highlights: Total Investment Return YTD 2011
AHL: NYSE FINANCIAL HIGHLIGHTS: TOTAL INVESTMENT RETURN YTD 2011 - 17 Annualized Investment Return for the Nine Months of 5.1% (*) There were no other-than-temporary impairment charges for the nine months ended September 30, 2011.
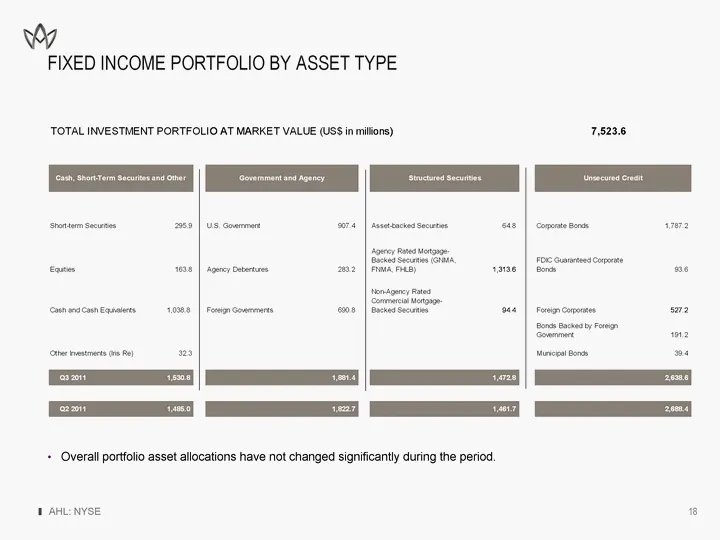
Slide 18: Fixed Income Portfolio by Asset Type
AHL: NYSE FIXED INCOME PORTFOLIO BY ASSET TYPE 18 Overall portfolio asset allocations have not changed significantly during the period.
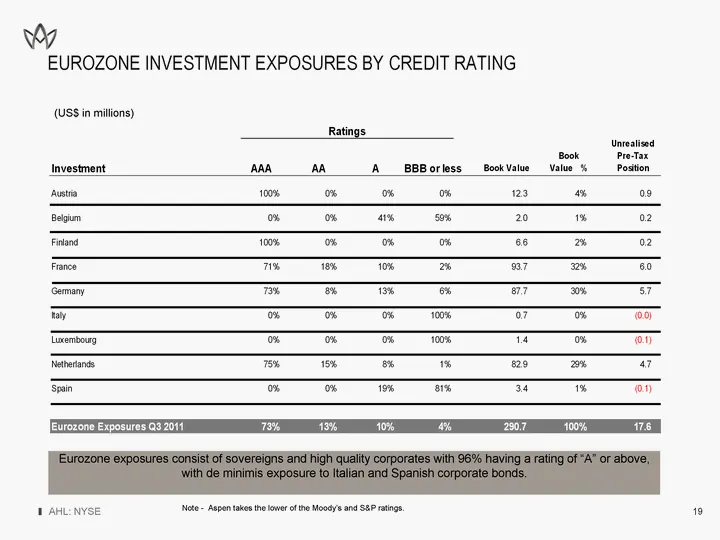
Slide 19: Eurozone Investment Exposures by Credit Rating
AHL: NYSE EUROZONE INVESTMENT EXPOSURES BY CREDIT RATING 1 Eurozone exposures consist of sovereigns and high quality corporates with 96% having a rating of "A" or above, with de minimis exposure to Italian and Spanish corporate bonds. Note - Aspen takes the lower of the Moody's and S&P ratings. (US$
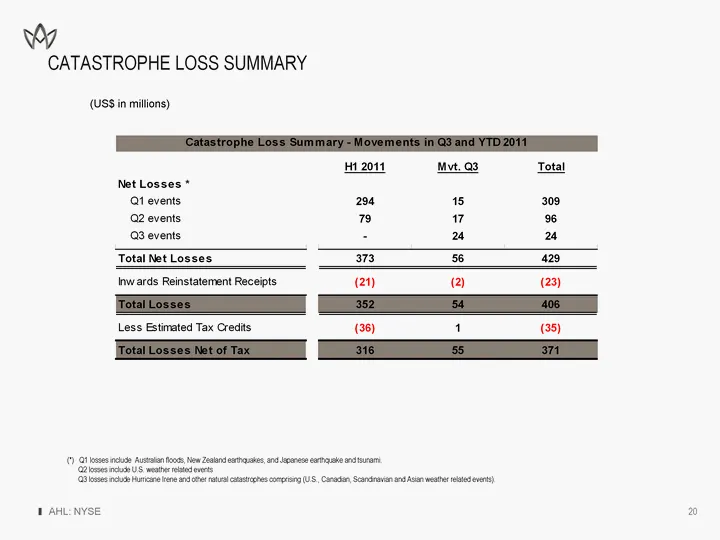
Slide 20: Catastrophe Loss Summary
AHL: NYSE 20 CATASTROPHE LOSS SUMMARY (US$ in millions) (*) Q1 losses include Australian floods, New Zealand earthquakes, and Japanese earthquake and tsunami. Q2 losses include U.S. weather related events Q3 losses include Hurricane Irene and other natural catastrophes comprising (U.S., Canadian, Sc
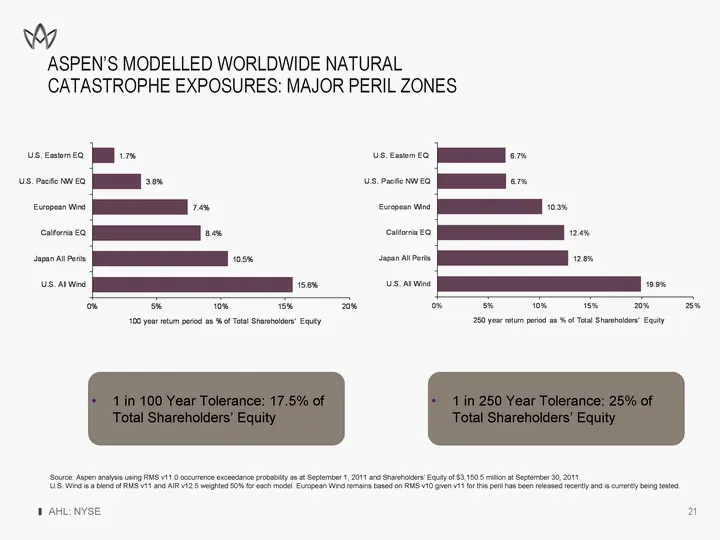
Slide 21: Aspen's Modelled Worldwide Natural Catastrophe Exposures
AHL: NYSE ASPEN'S MODELLED WORLDWIDE NATURAL CATASTROPHE EXPOSURES: MAJOR PERIL ZONES 21 1 in 100 Year Tolerance: 17.5% of Total Shareholders' Equity 1 in 250 Year Tolerance: 25% of Total Shareholders' Equity Source: Aspen analysis using RMS v11.0 occurrence exceedance probability as at September 1,
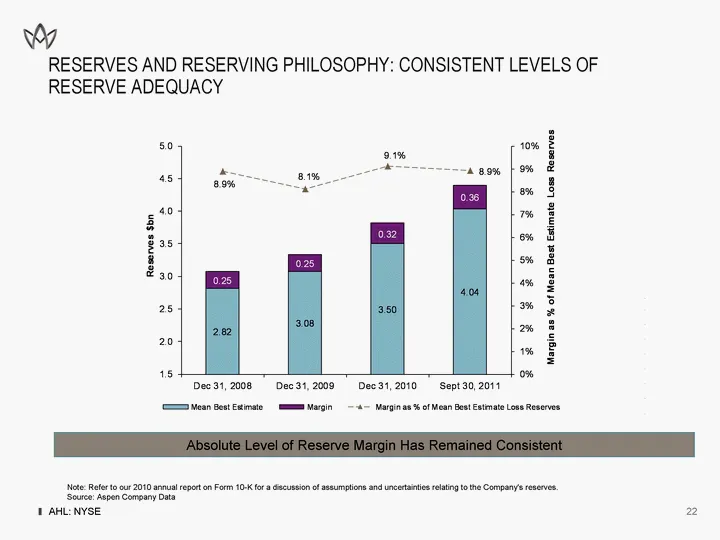
Slide 22: Reserves and Reserving Philosophy: Consistent Levels of Reserve Adequacy
RESERVES AND RESERVING PHILOSOPHY: CONSISTENT LEVELS OF RESERVE ADEQUACY 22 Note: Refer to our 2010 annual report on Form 10-K for a discussion of assumptions and uncertainties relating to the Company's reserves. Source: Aspen Company Data AHL: NYSE Absolute Level of Reserve Margin Has Remained Cons
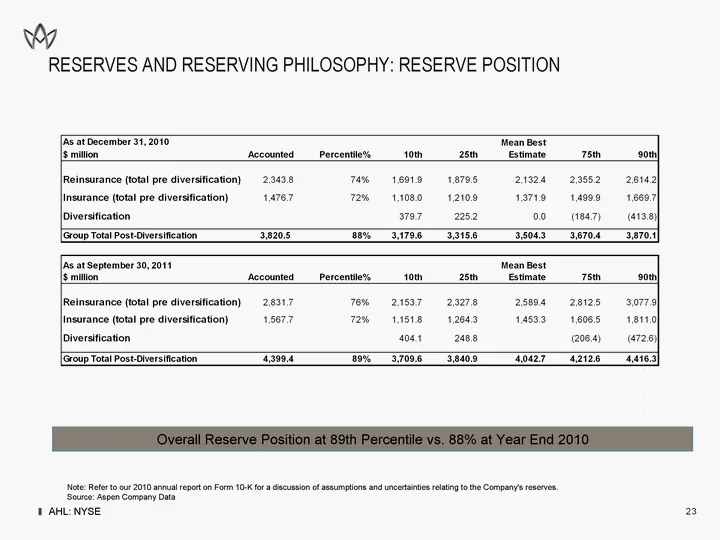
Slide 23: Reserves and Reserving Philosophy: Reserve Position
RESERVES AND RESERVING PHILOSOPHY: RESERVE POSITION 1 Overall Reserve Position at 89th Percentile vs. 88% at Year End 2010 Note: Refer to our 2010 annual report on Form 10-K for a discussion of assumptions and uncertainties relating to the Company's reserves. Source: Aspen Company Data AHL: NYSE
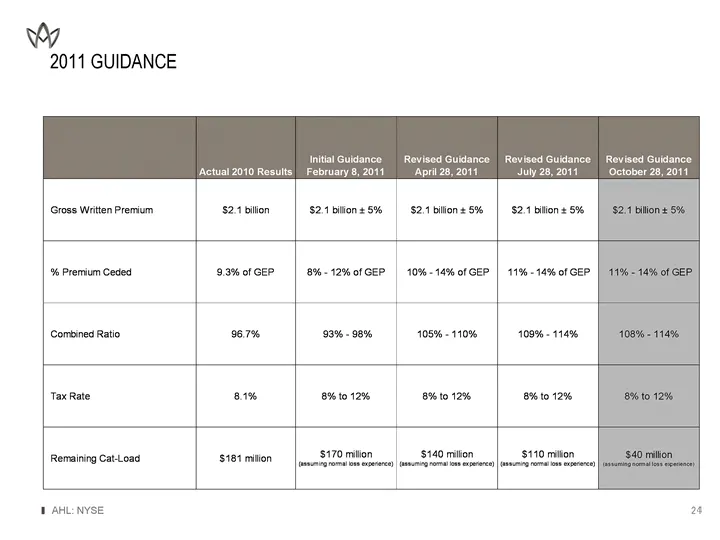
Slide 24: 2011 Guidance
wy 2011 GUIDANCE ‘Actual 2010 Results _ February &, 2011 uly 28,2011 er 28,2011 (Gross Writen Premium $2.1 billon S21 blions5% $2.1billons 5% | $2.1 billon + 536 °% Premium Cede 93% ofGEP | 8%-12%oIGEP 10%. 14% of EP | 11% -14% of GEP Combined Ratio 96.7% 93% - 989% 105% - 110% 100% 114% Tax Rate 81
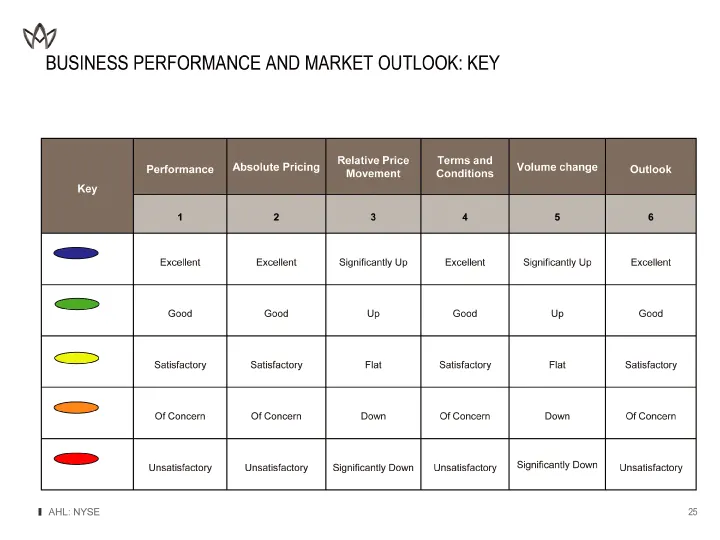
Slide 25: Business Performance and Market Outlook: Key
AHL: NYSE BUSINESS PERFORMANCE AND MARKET OUTLOOK: KEY Key Performance Absolute Pricing Relative Price Movement Terms and Conditions Volume change Outlook Key 1 2 3 4 5 6 Excellent Excellent Significantly Up Excellent Significantly Up Excellent Good Good Up Good Up Good Satisfactory Satisfactory Fla
Source: SEC EDGAR · 8-K filed Oct 27, 2011
More decks from Aspen Insurance Holdings Ltd
 Q1 2018 Earnings Presentation13 slides · May 2, 2018
 Q3 2017 Earnings Presentation20 slides · Nov 15, 2017
 Q2 2017 Earnings Presentation20 slides · Jul 26, 2017
 Q1 2017 Earnings Presentation20 slides · Apr 26, 2017
 Q4 2016 Earnings Presentation16 slides · Feb 14, 2017
 Q3 2016 Earnings Presentation16 slides · Oct 26, 2016