Arlington Asset Investment Corp
Arlington Asset Investment — Q2 2019 Earnings Presentation
27 slides from Arlington Asset Investment's earnings presentation, Aug 7, 2019
Slide 1: Investor Presentation Second Quarter 2019
Investor Presentation Second Quarter 2019 Exhibit 99.2
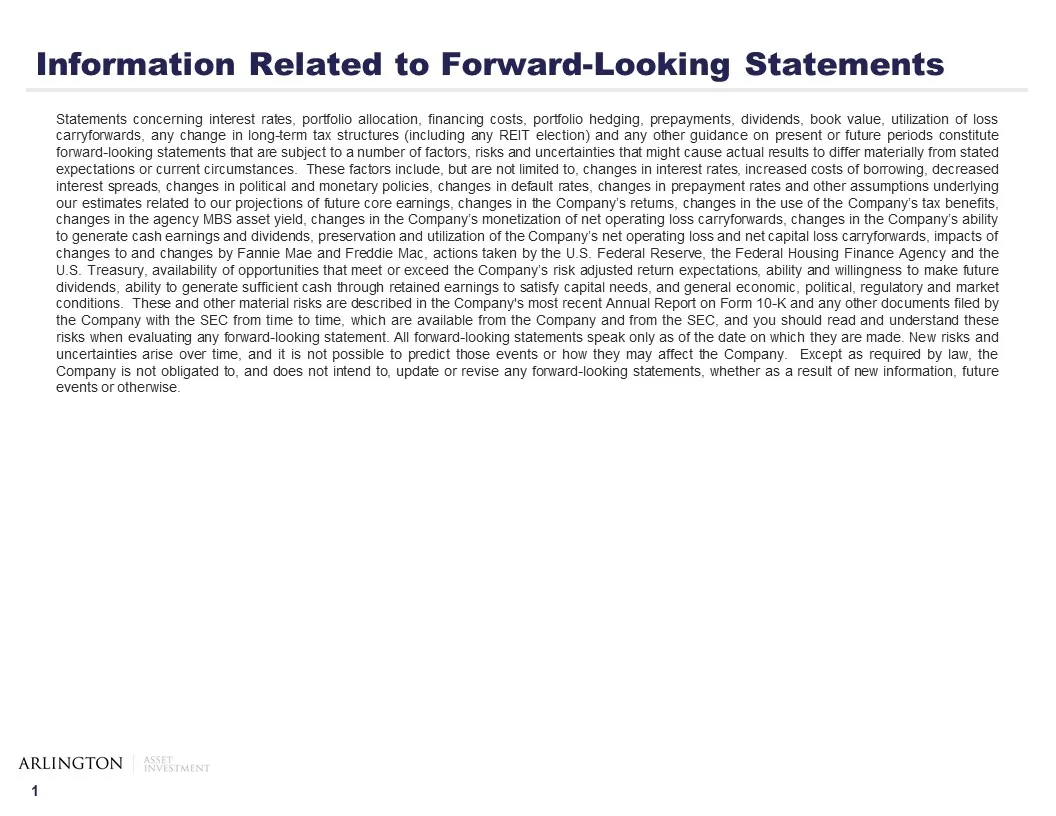
Slide 2: Information Related to Forward-Looking Statements
Information Related to Forward-Looking Statements Statements concerning interest rates, portfolio allocation, financing costs, portfolio hedging, prepayments, dividends, book value, utilization of loss carryforwards, any change in long-term tax structures (including any REIT election) and any other
Slide 3: Contents
Contents Second Quarter of 2019 Financial Results and Portfolio Update………………...Slide 3 Appendix – Additional Financial Data…………………………………………………Slide 18
Slide 4: Second Quarter of 2019 Financial Results and Portfolio Update
Second Quarter of 2019 Financial Results and Portfolio Update
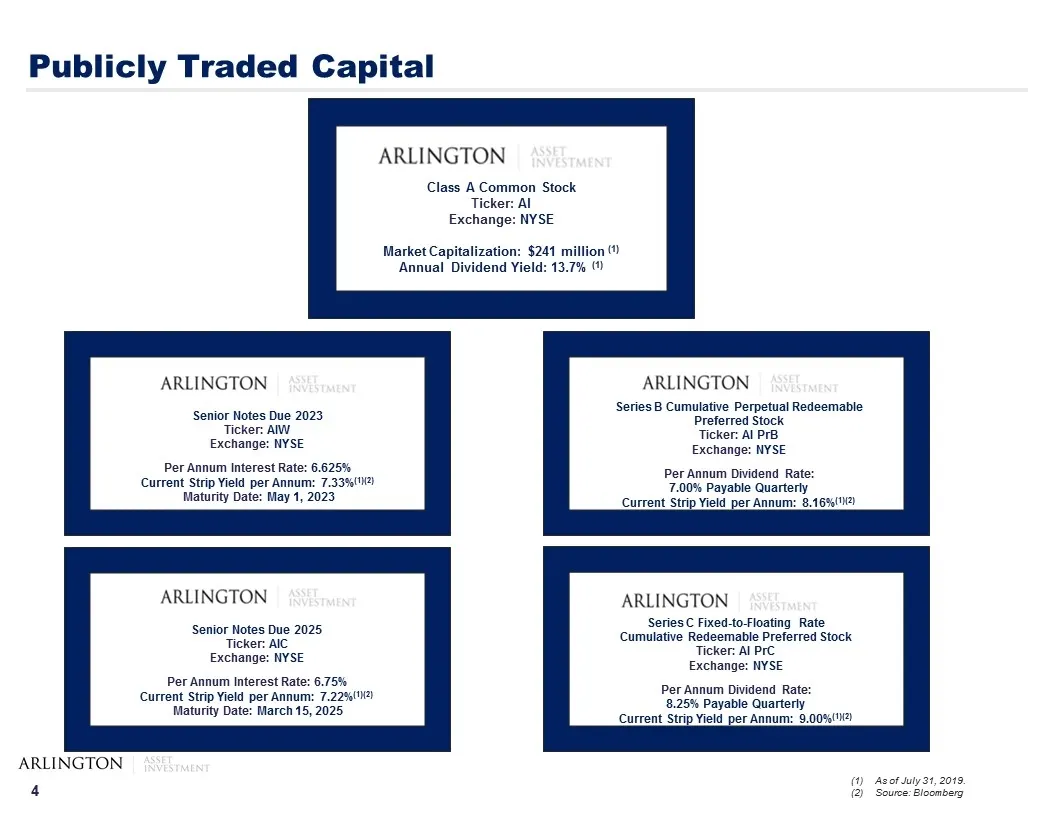
Slide 5: Publicly Traded Capital
Publicly Traded Capital Class A Common Stock Ticker: AI Exchange: NYSE Market Capitalization: $241 million (1) Annual Dividend Yield: 13.7% (1) Senior Notes Due 2023 Ticker: AIW Exchange: NYSE Per Annum Interest Rate: 6.625% Current Strip Yield per Annum: 7.33%(1)(2) Maturity Date: May 1, 2023 Senio
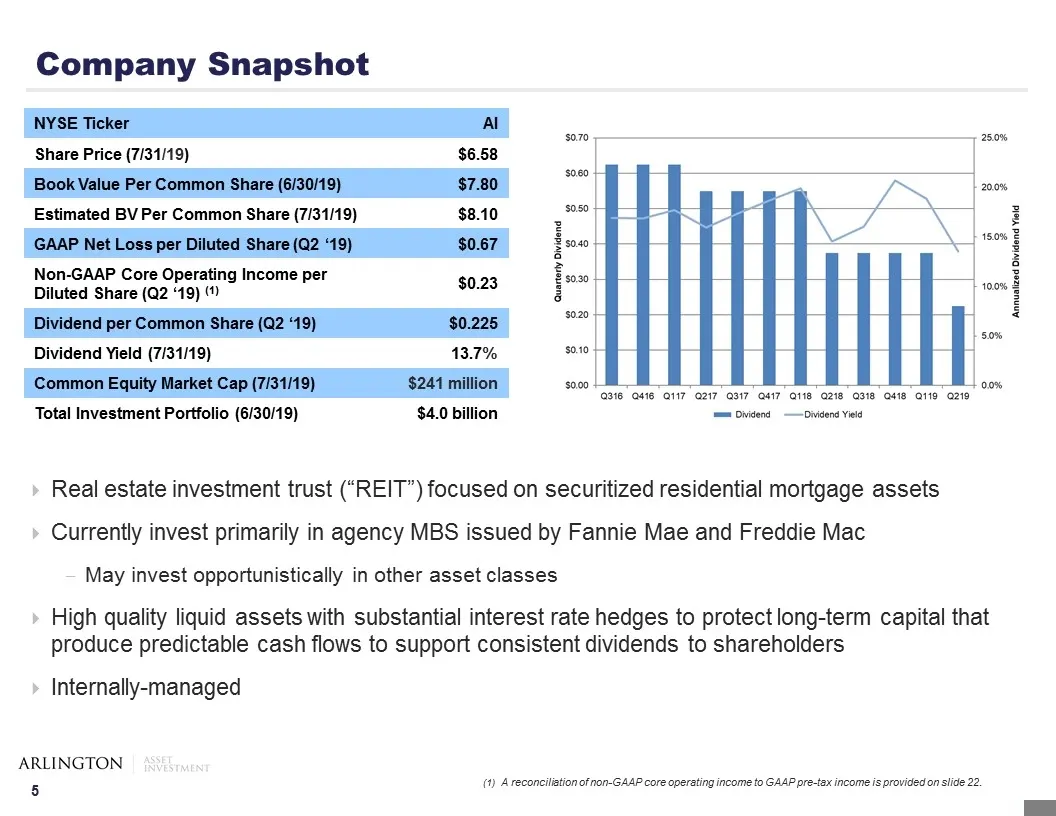
Slide 6: Company Snapshot
Company Snapshot Real estate investment trust (“REIT”) focused on securitized residential mortgage assets Currently invest primarily in agency MBS issued by Fannie Mae and Freddie Mac May invest opportunistically in other asset classes High quality liquid assets with substantial interest rate hedges
Slide 7: Second Quarter of 2019 Financial Highlights
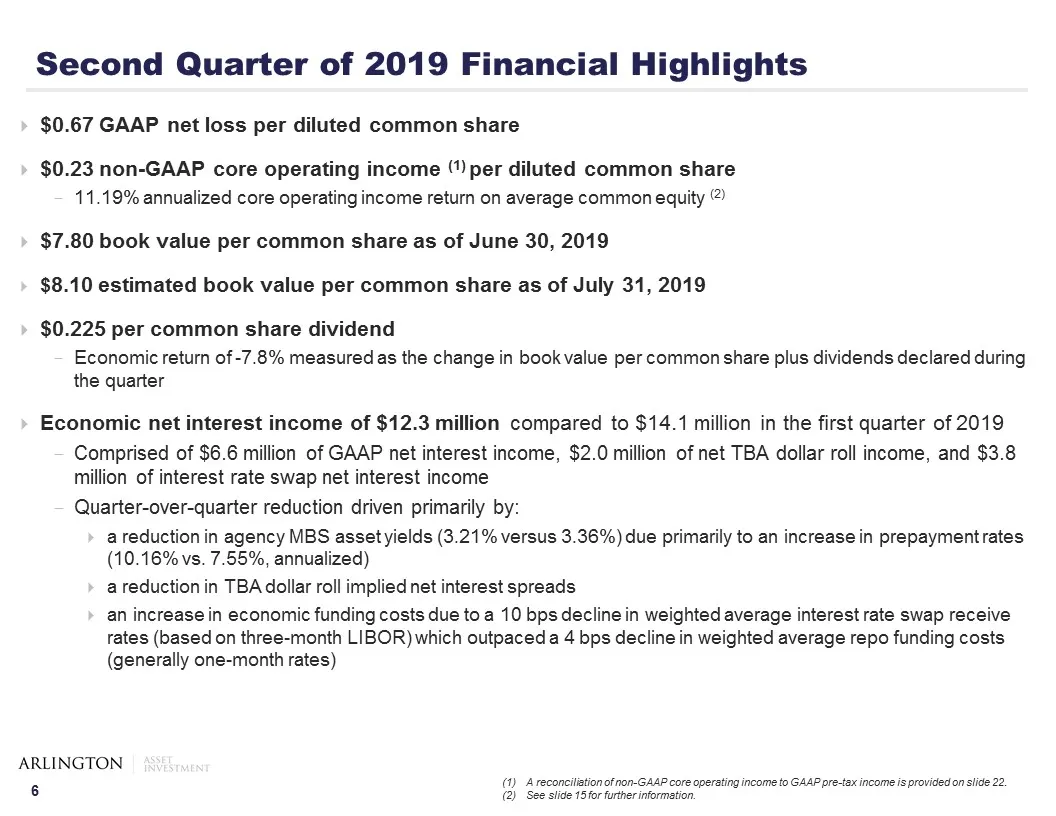
Second Quarter of 2019 Financial Highlights $0.67 GAAP net loss per diluted common share $0.23 non-GAAP core operating income (1) per diluted common share 11.19% annualized core operating income return on average common equity (2) $7.80 book value per common share as of June 30, 2019 $8.10 estimated
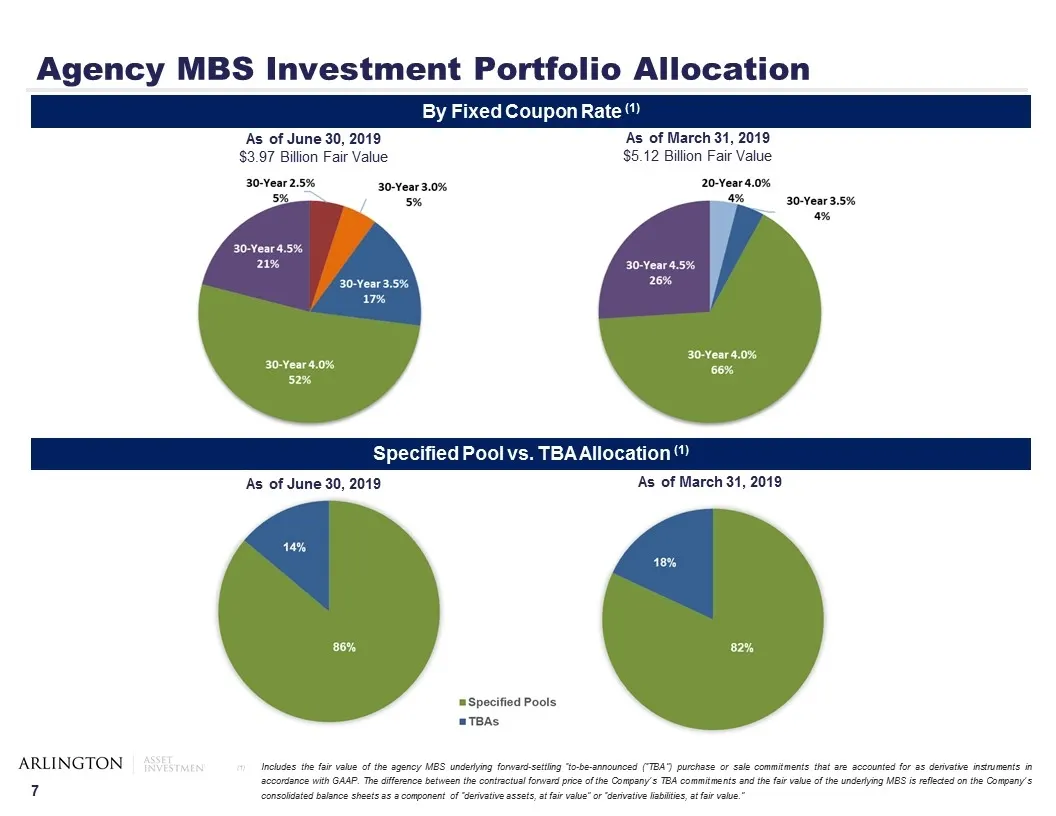
Slide 8: Agency MBS Investment Portfolio Allocation
As of June 30, 2019 $3.97 Billion Fair Value As of March 31, 2019 $5.12 Billion Fair Value Agency MBS Investment Portfolio Allocation Specified Pool vs. TBA Allocation (1) Includes the fair value of the agency MBS underlying forward-settling “to-be-announced (“TBA”) purchase or sale commitments that
Slide 9: Specified Agency MBS Historical Quarterly Prepayments and GAAP Asset Yield Performance
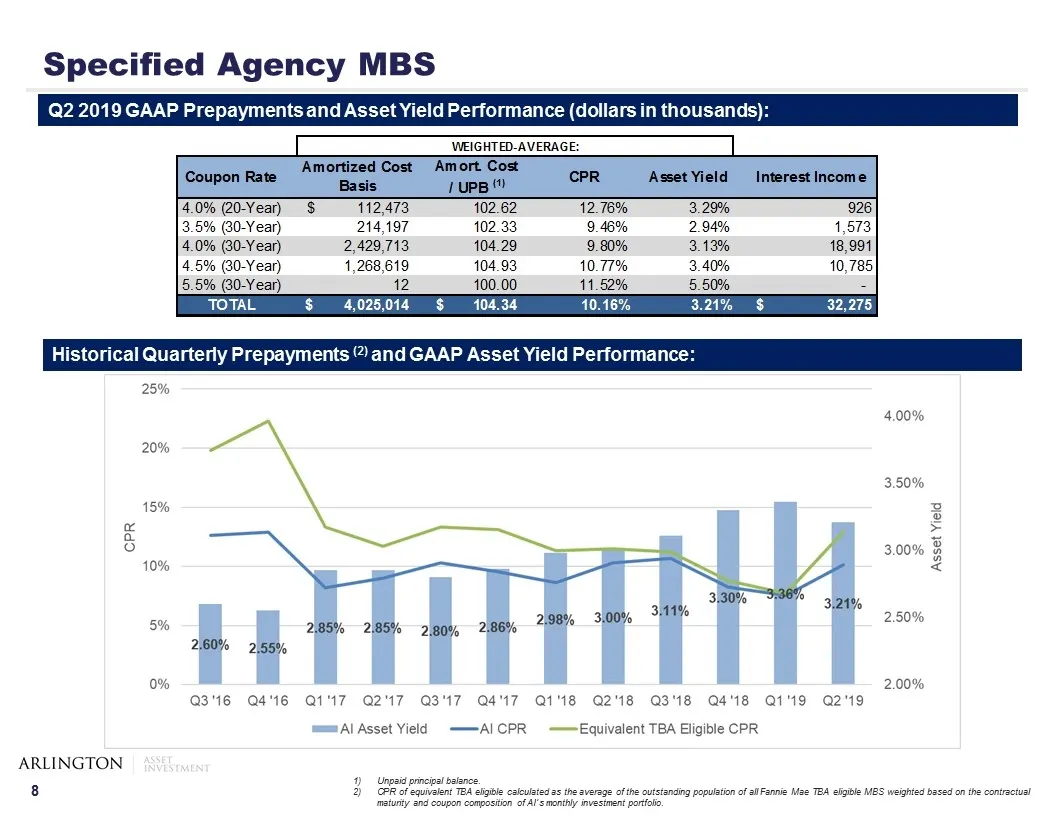
Specified Agency MBS Historical Quarterly Prepayments (2) and GAAP Asset Yield Performance: Q2 2019 GAAP Prepayments and Asset Yield Performance (dollars in thousands): Unpaid principal balance. CPR of equivalent TBA eligible calculated as the average of the outstanding population of all Fannie Mae
Slide 10: To-be-Announced (TBA) Agency MBS
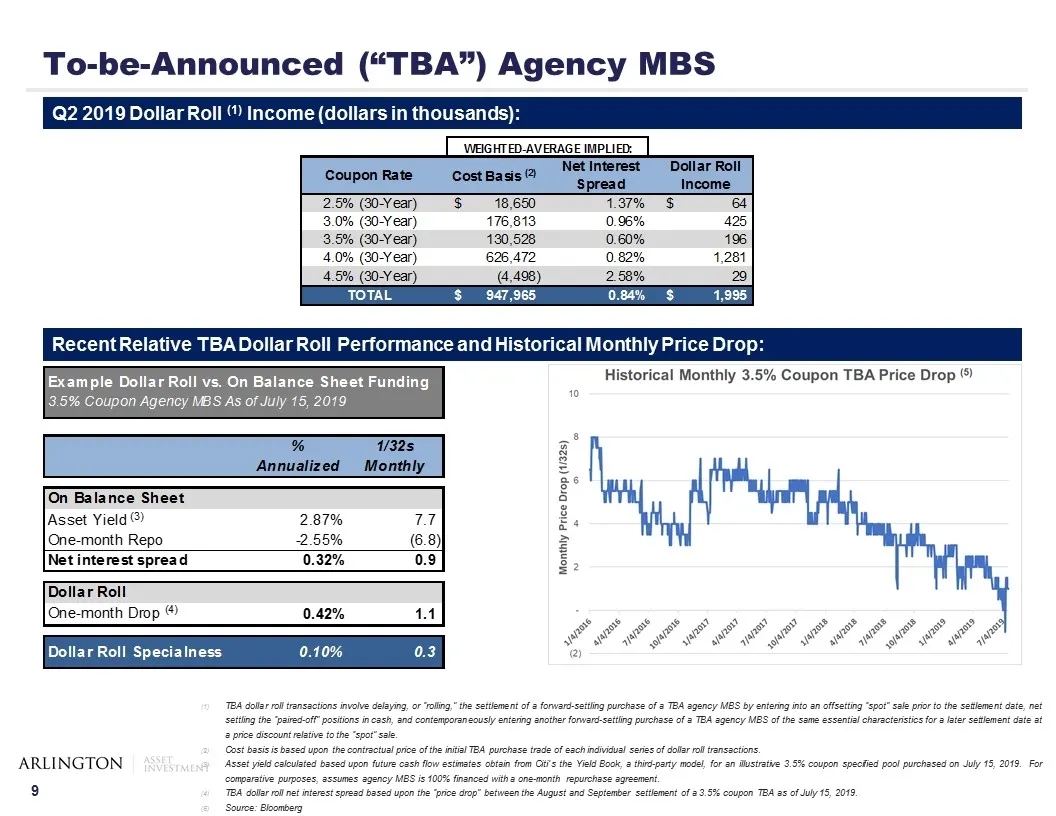
To-be-Announced (“TBA”) Agency MBS TBA dollar roll transactions involve delaying, or “rolling,” the settlement of a forward-settling purchase of a TBA agency MBS by entering into an offsetting “spot” sale prior to the settlement date, net settling the “paired-off” positions in cash, and contemporane
Slide 11: Financing Summary
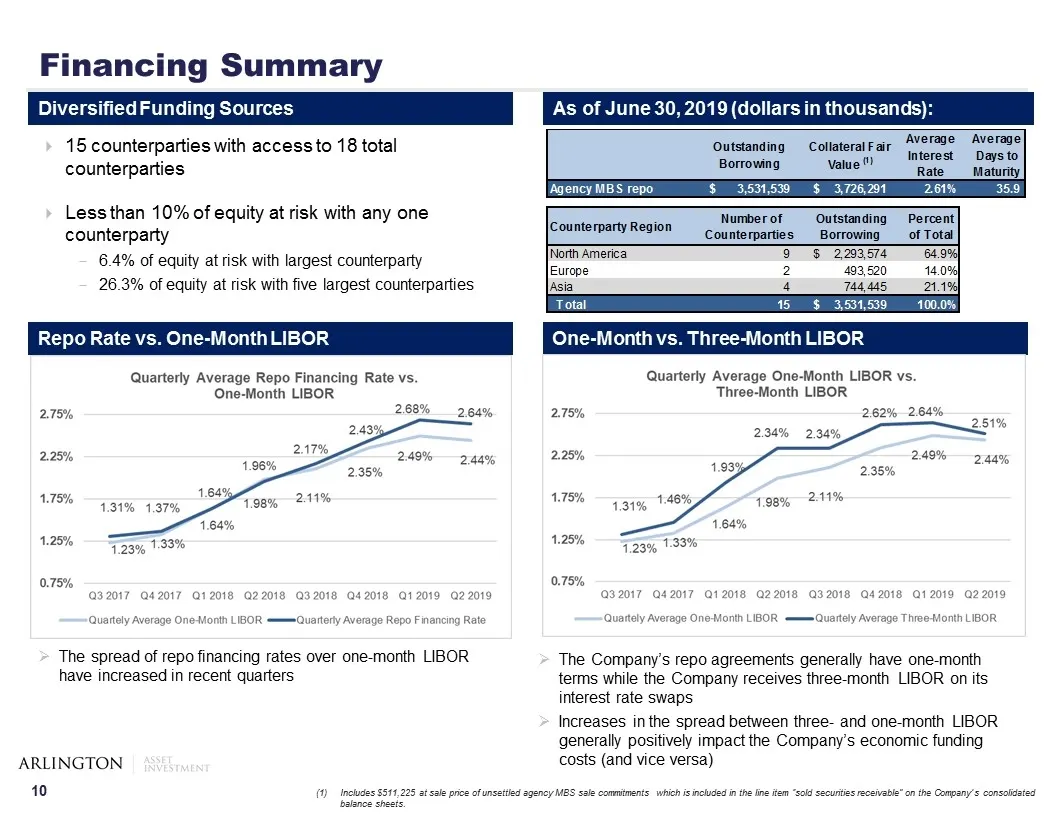
Financing Summary 15 counterparties with access to 18 total counterparties Less than 10% of equity at risk with any one counterparty 6.4% of equity at risk with largest counterparty 26.3% of equity at risk with five largest counterparties Diversified Funding Sources As of June 30, 2019 (dollars in t
Slide 12: Hedging Summary
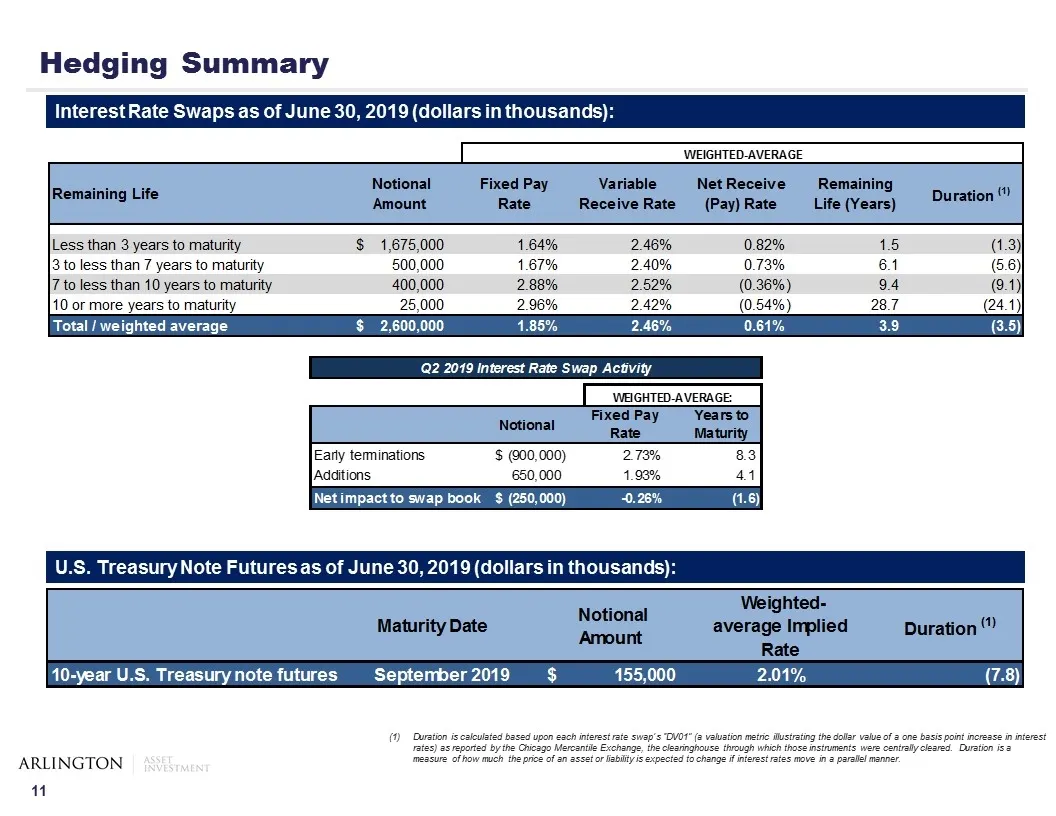
Hedging Summary Interest Rate Swaps as of June 30, 2019 (dollars in thousands): Duration is calculated based upon each interest rate swap’s “DV01” (a valuation metric illustrating the dollar value of a one basis point increase in interest rates) as reported by the Chicago Mercantile Exchange, the cl
Slide 13: Interest Rate Swap Book Well Matched to Repo Funding Balance
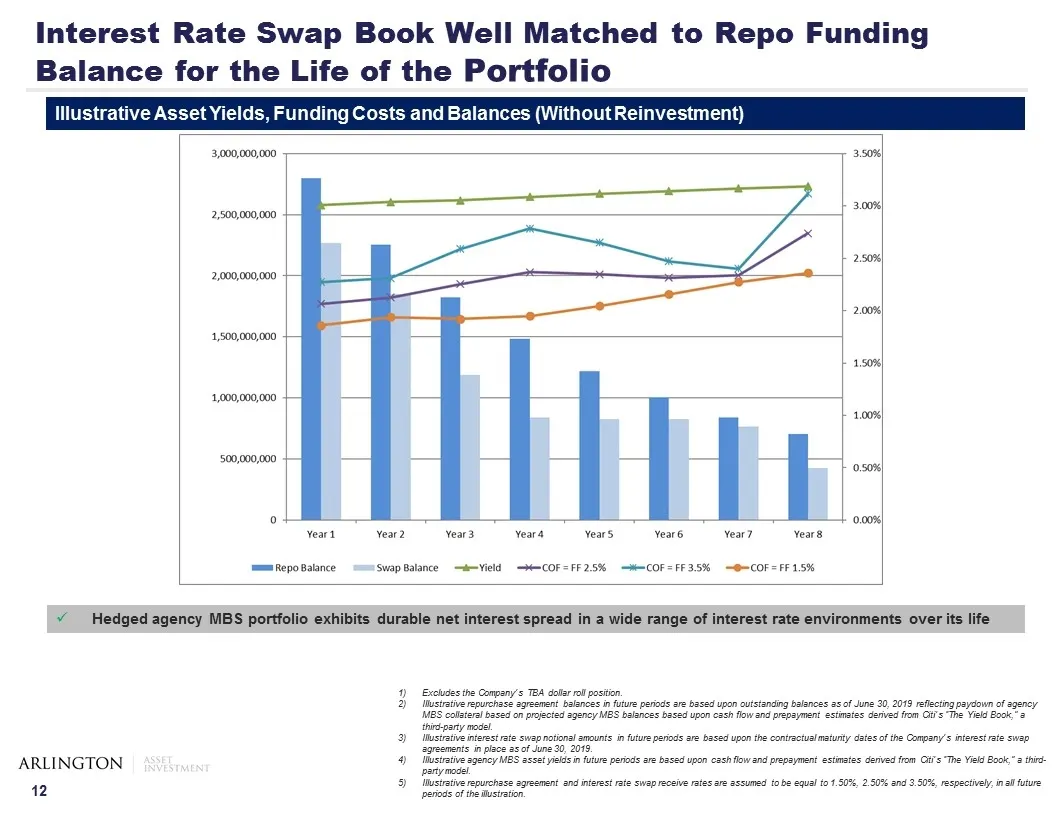
Interest Rate Swap Book Well Matched to Repo Funding Balance for the Life of the Portfolio Hedged agency MBS portfolio exhibits durable net interest spread in a wide range of interest rate environments over its life Excludes the Company’s TBA dollar roll position. Illustrative repurchase agreement b
Slide 14: Well Matched Hedging Can Protect Profitability Through Various Rate Environments
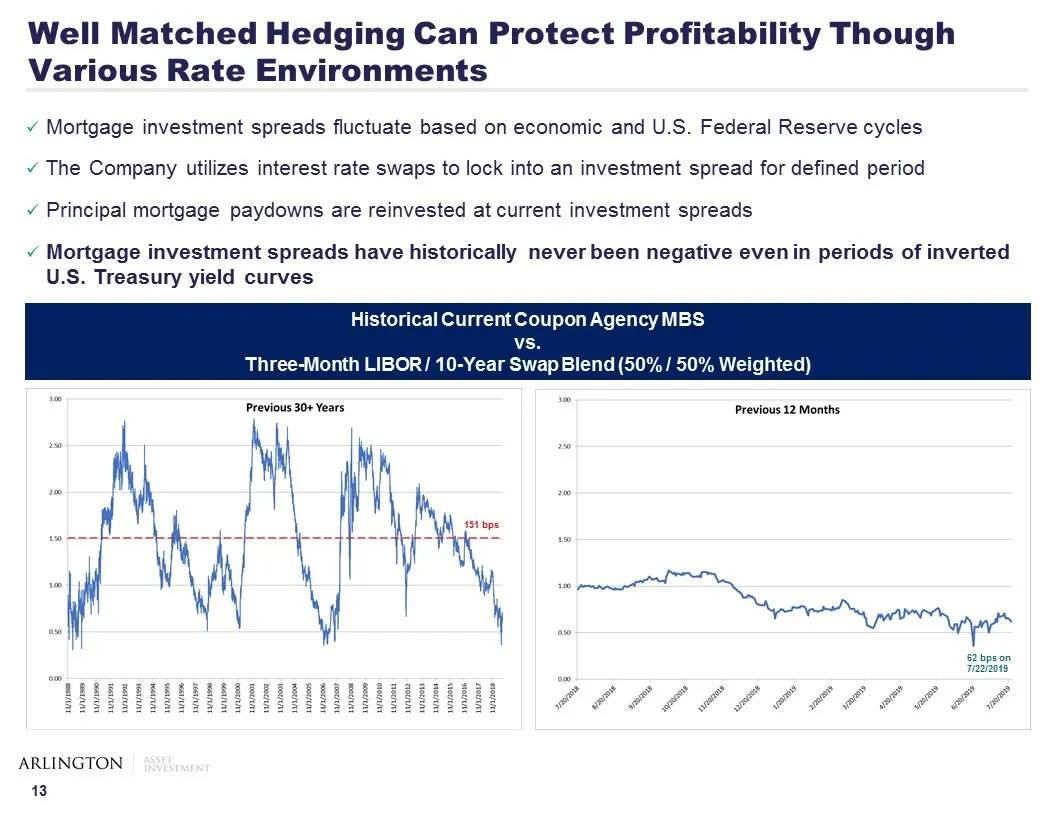
Well Matched Hedging Can Protect Profitability Though Various Rate Environments Mortgage investment spreads fluctuate based on economic and U.S. Federal Reserve cycles The Company utilizes interest rate swaps to lock into an investment spread for defined period Principal mortgage paydowns are reinve
Slide 15: Non-GAAP Core Operating Income
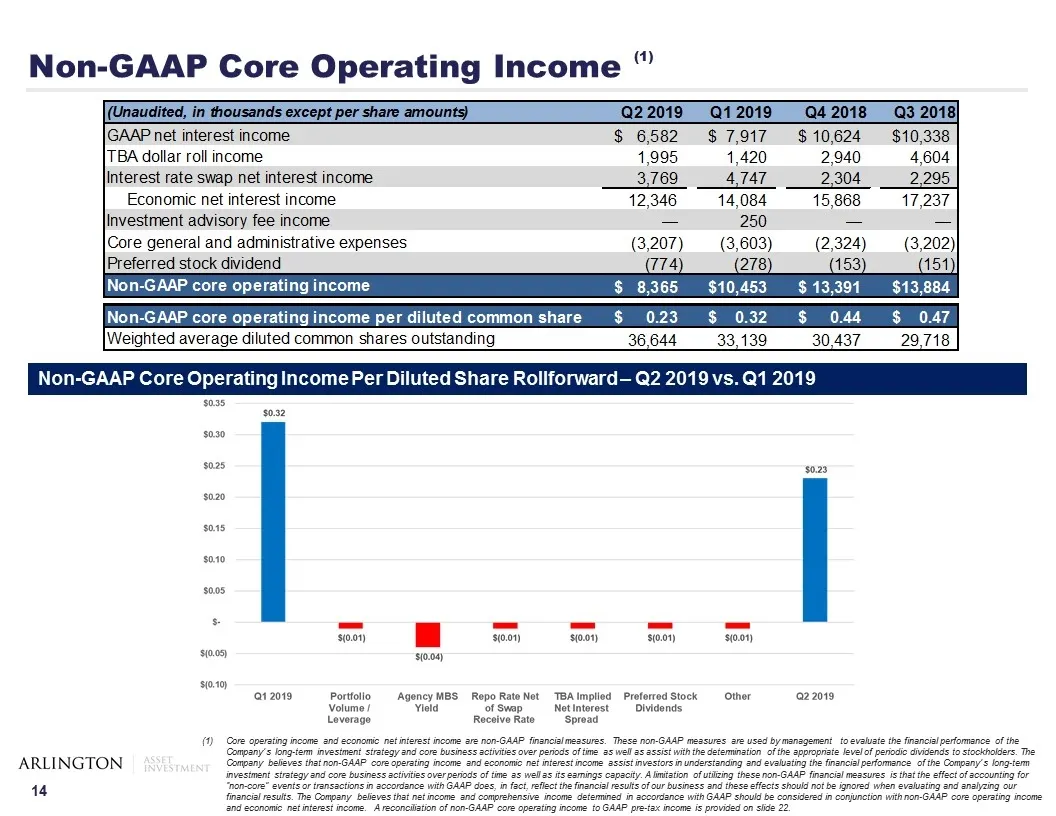
Non-GAAP Core Operating Income (1) Core operating income and economic net interest income are non-GAAP financial measures. These non-GAAP measures are used by management to evaluate the financial performance of the Company’s long-term investment strategy and core business activities over periods of
Slide 16: Core Operating Income Return on Equity
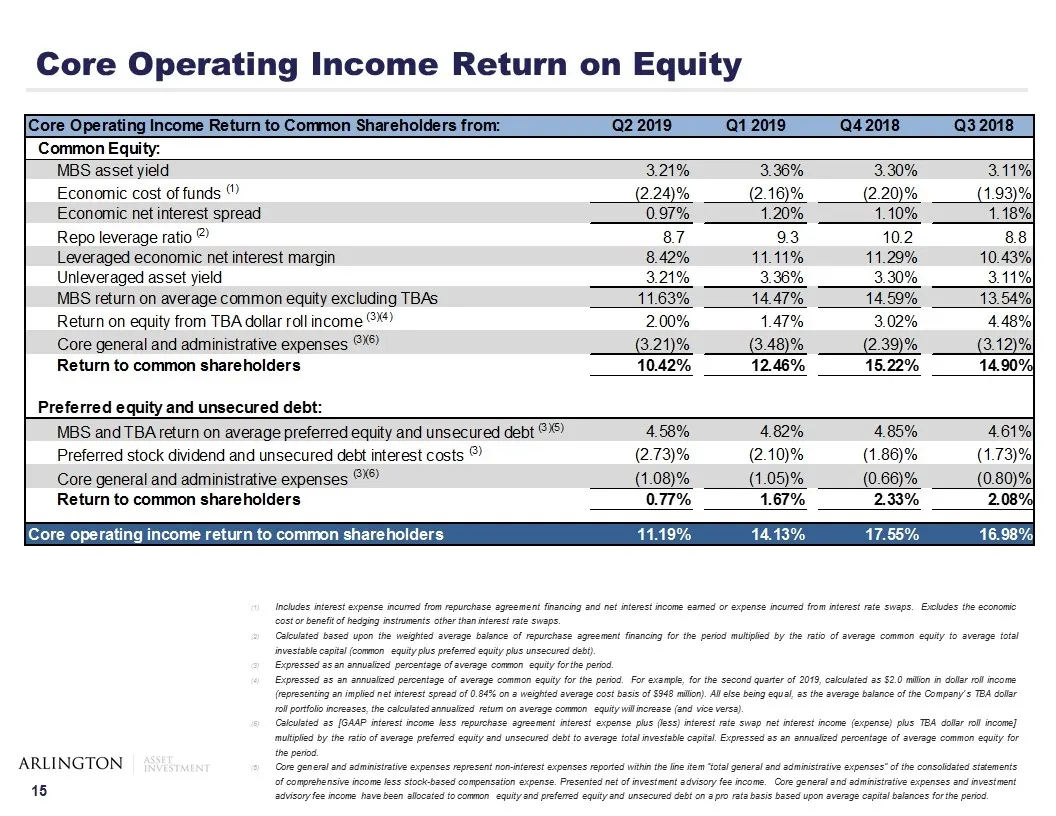
Core Operating Income Return on Equity Includes interest expense incurred from repurchase agreement financing and net interest income earned or expense incurred from interest rate swaps. Excludes the economic cost or benefit of hedging instruments other than interest rate swaps. Calculated based upo
Slide 17: Portfolio Weighted Average Statistics
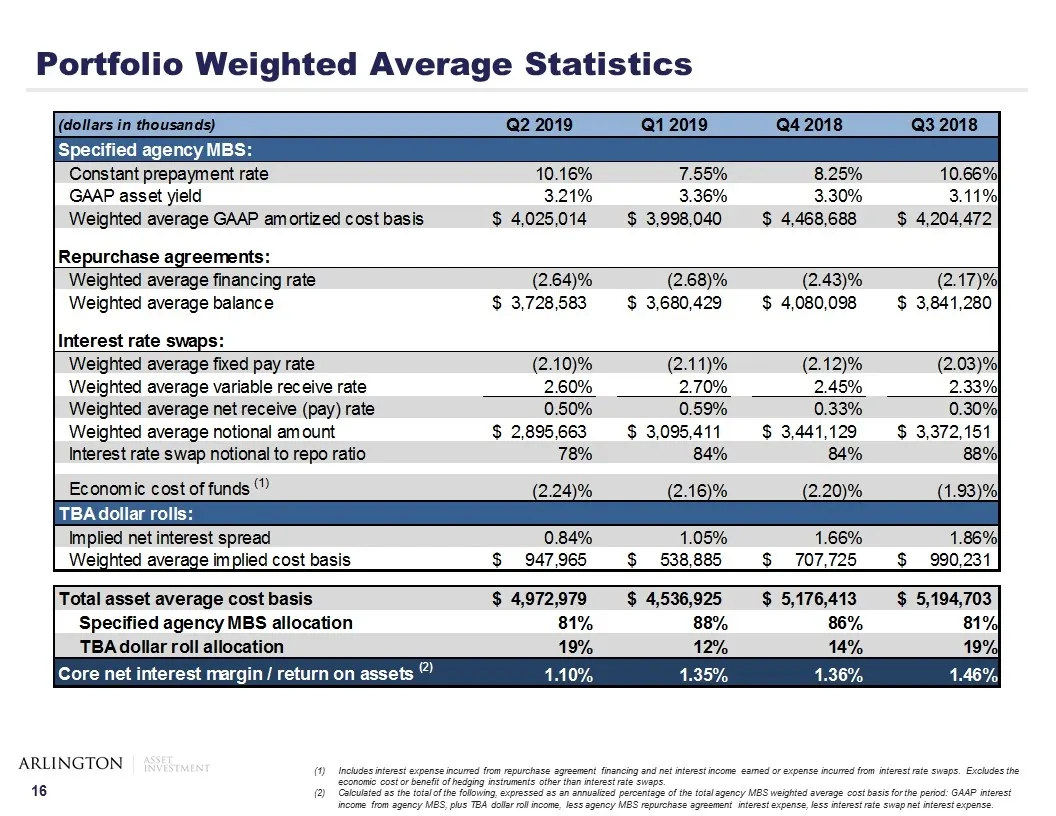
Portfolio Weighted Average Statistics Includes interest expense incurred from repurchase agreement financing and net interest income earned or expense incurred from interest rate swaps. Excludes the economic cost or benefit of hedging instruments other than interest rate swaps. Calculated as the tot
Slide 18: Book Value Per Share Rollforward
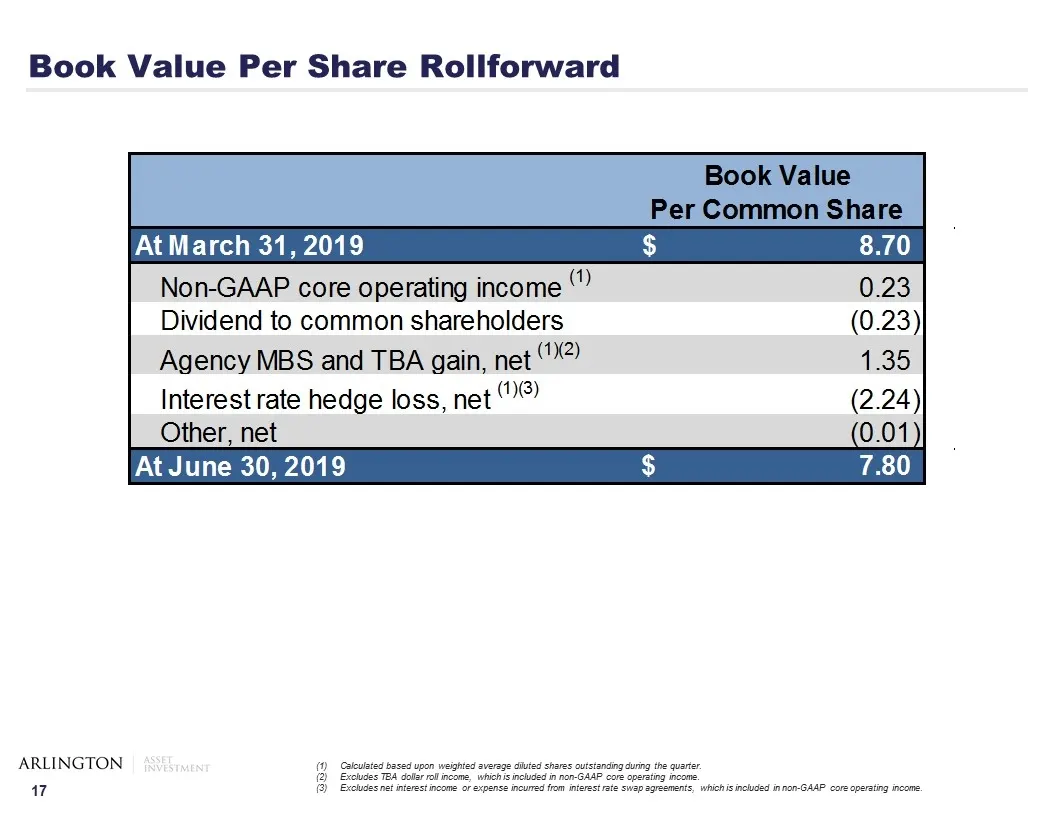
Book Value Per Share Rollforward Calculated based upon weighted average diluted shares outstanding during the quarter. Excludes TBA dollar roll income, which is included in non-GAAP core operating income. Excludes net interest income or expense incurred from interest rate swap agreements, which is i
Slide 19: Appendix – Additional Financial Data
Appendix – Additional Financial Data
Slide 20: Market Data
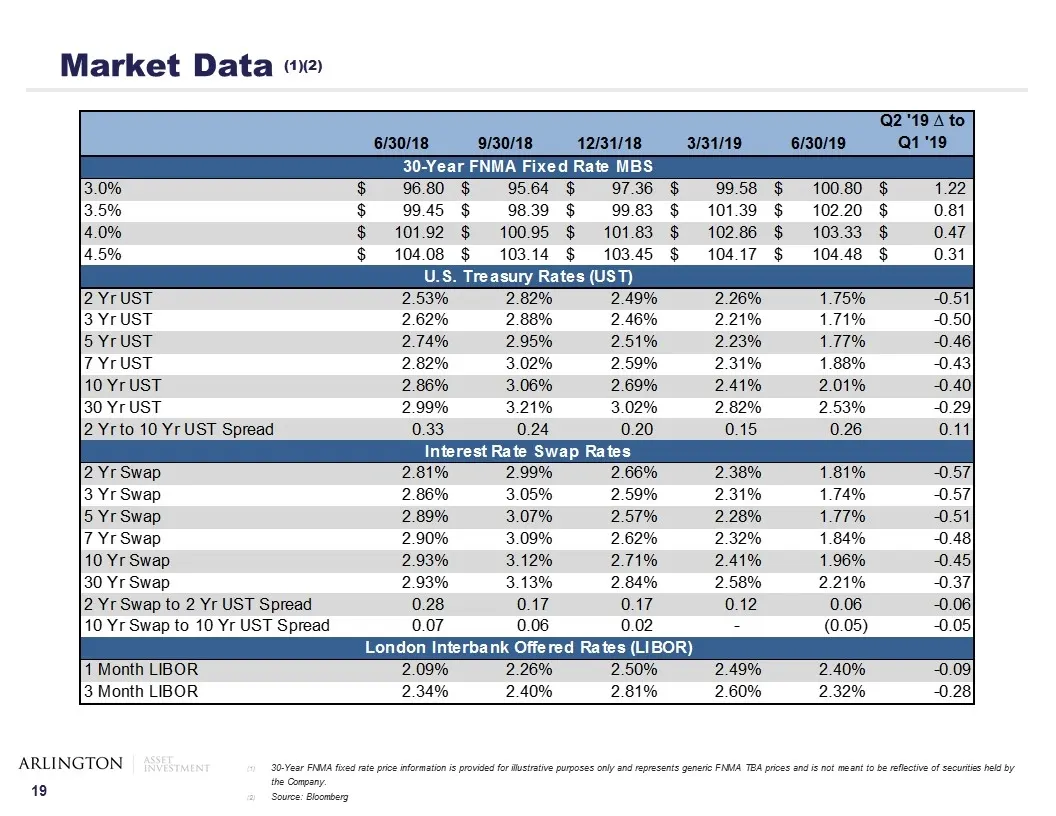
Market Data (1)(2) 30-Year FNMA fixed rate price information is provided for illustrative purposes only and represents generic FNMA TBA prices and is not meant to be reflective of securities held by the Company. Source: Bloomberg
Slide 21: Balance Sheet
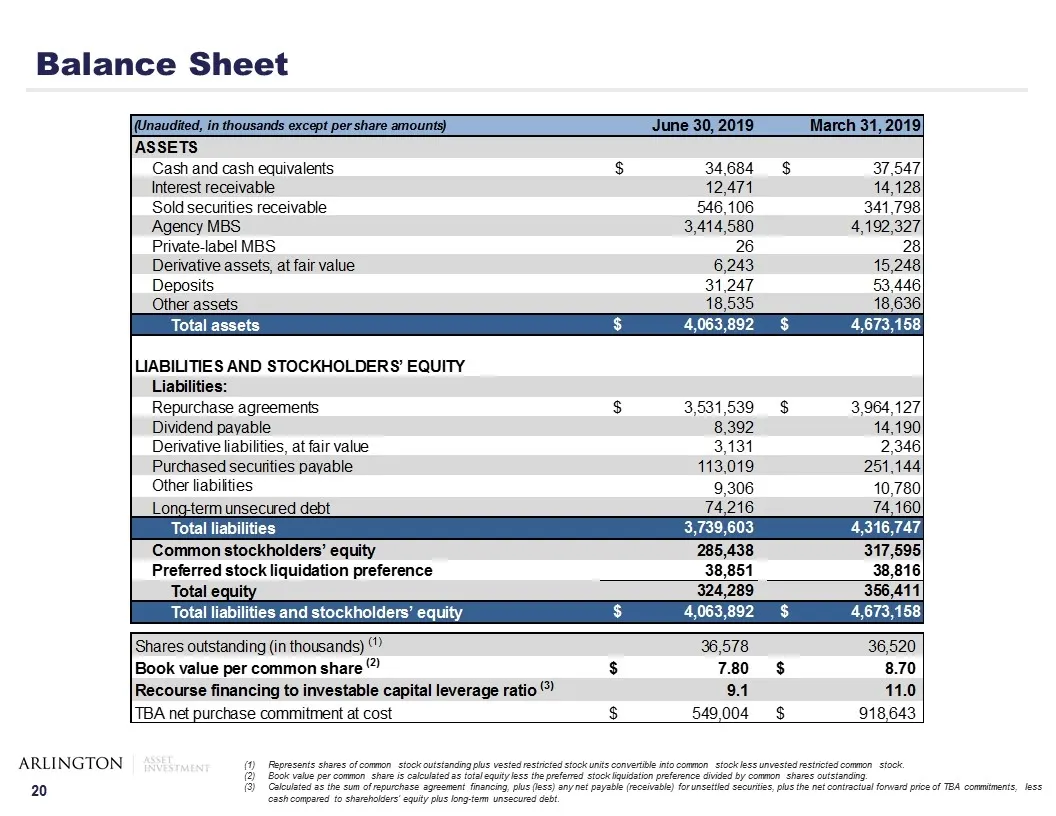
Balance Sheet Represents shares of common stock outstanding plus vested restricted stock units convertible into common stock less unvested restricted common stock. Book value per common share is calculated as total equity less the preferred stock liquidation preference divided by common shares outst
Slide 22: Statement of Comprehensive Income
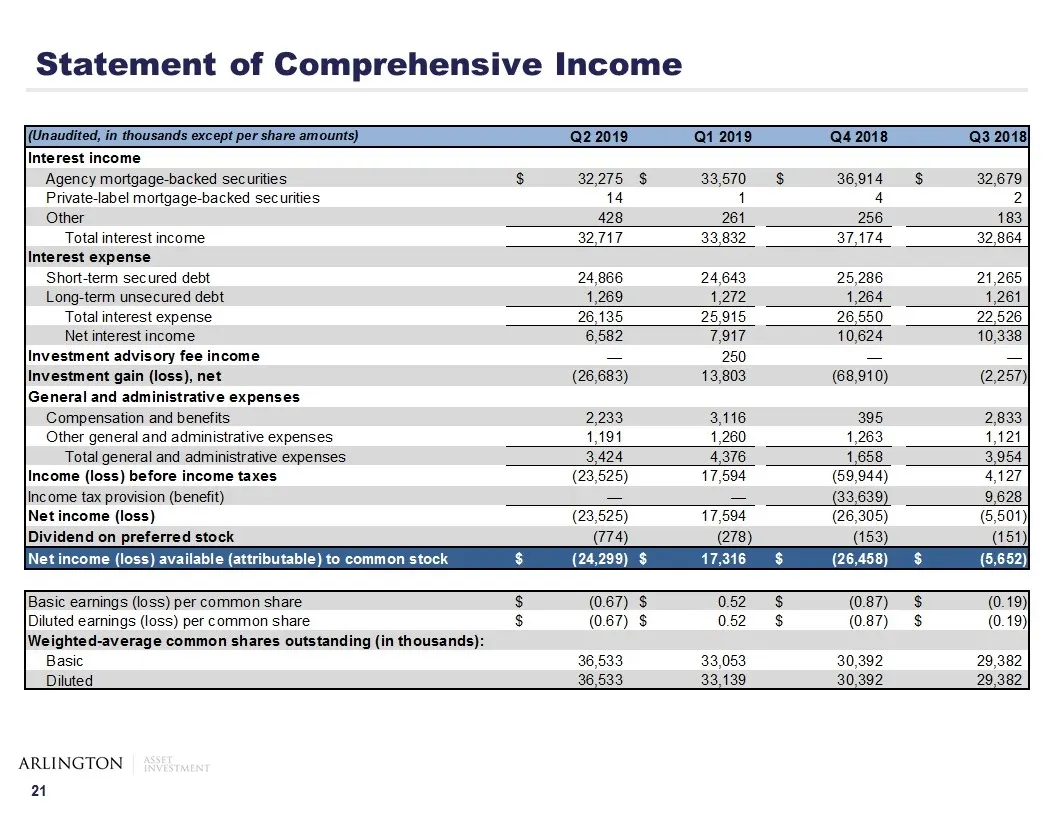
Statement of Comprehensive Income
Slide 23: Non-GAAP Core Operating Income Reconciliation
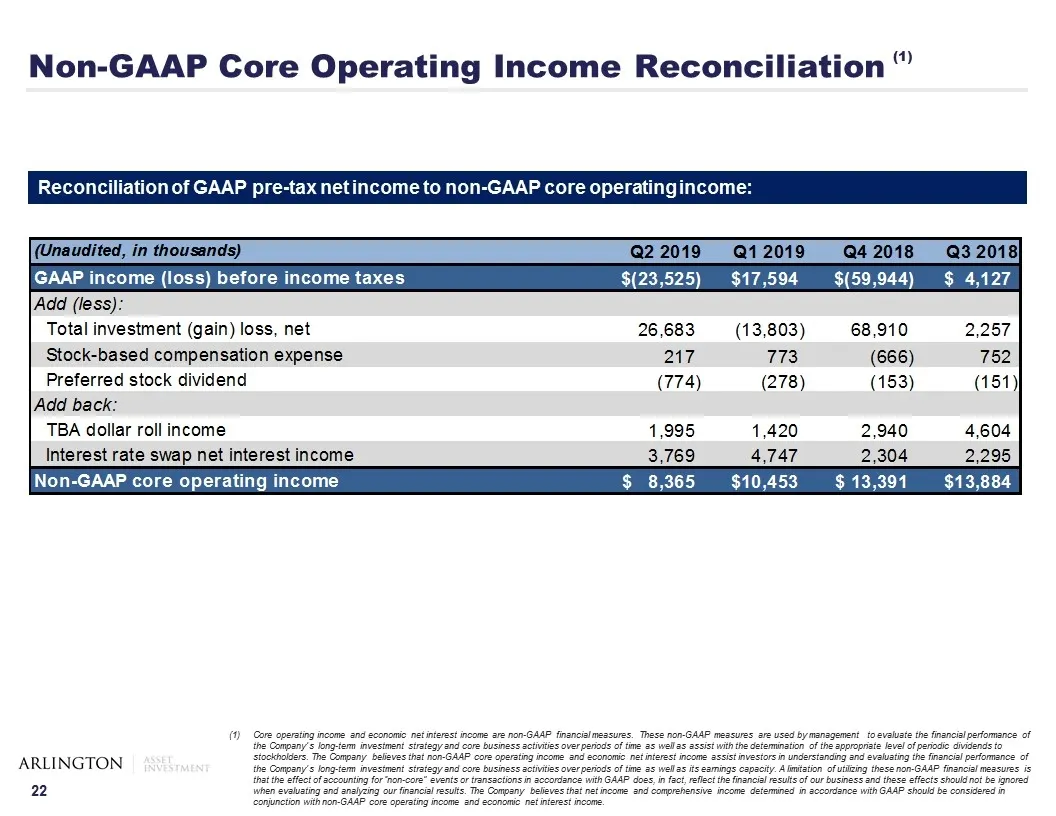
Non-GAAP Core Operating Income Reconciliation (1) Core operating income and economic net interest income are non-GAAP financial measures. These non-GAAP measures are used by management to evaluate the financial performance of the Company’s long-term investment strategy and core business activities o
Slide 24: Specified Agency MBS Investment Portfolio
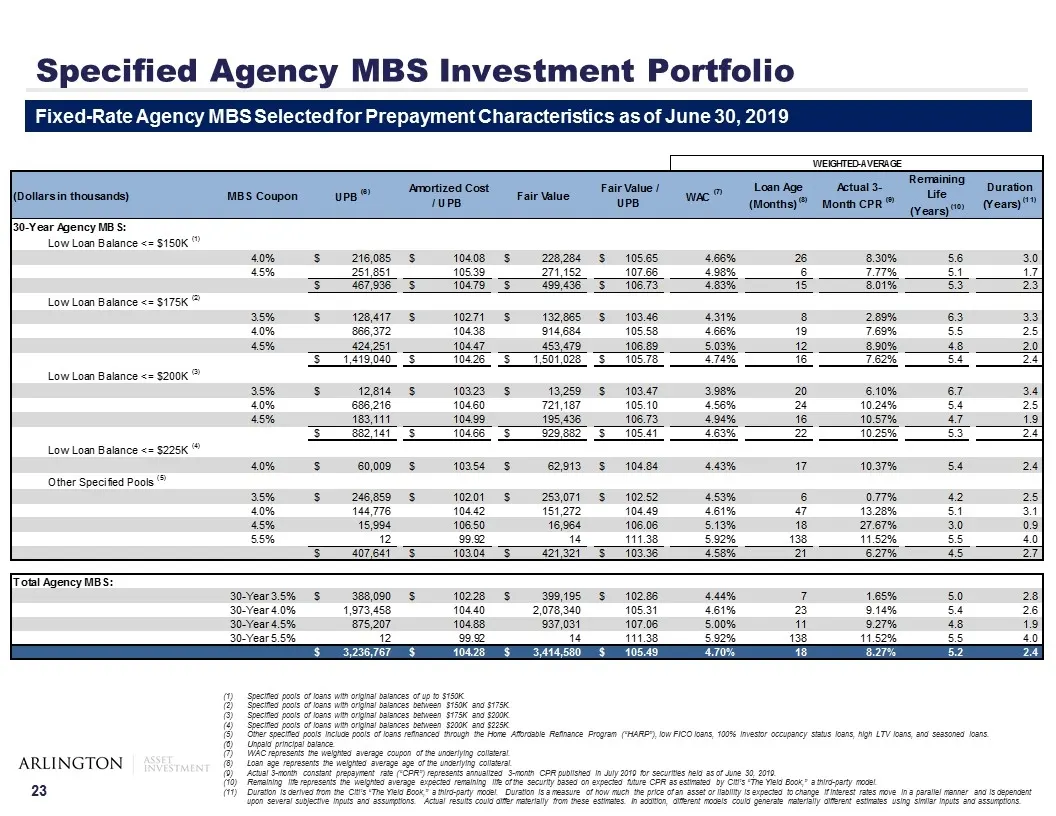
Specified Agency MBS Investment Portfolio Specified pools of loans with original balances of up to $150K. Specified pools of loans with original balances between $150K and $175K. Specified pools of loans with original balances between $175K and $200K. Specified pools of loans with original balances
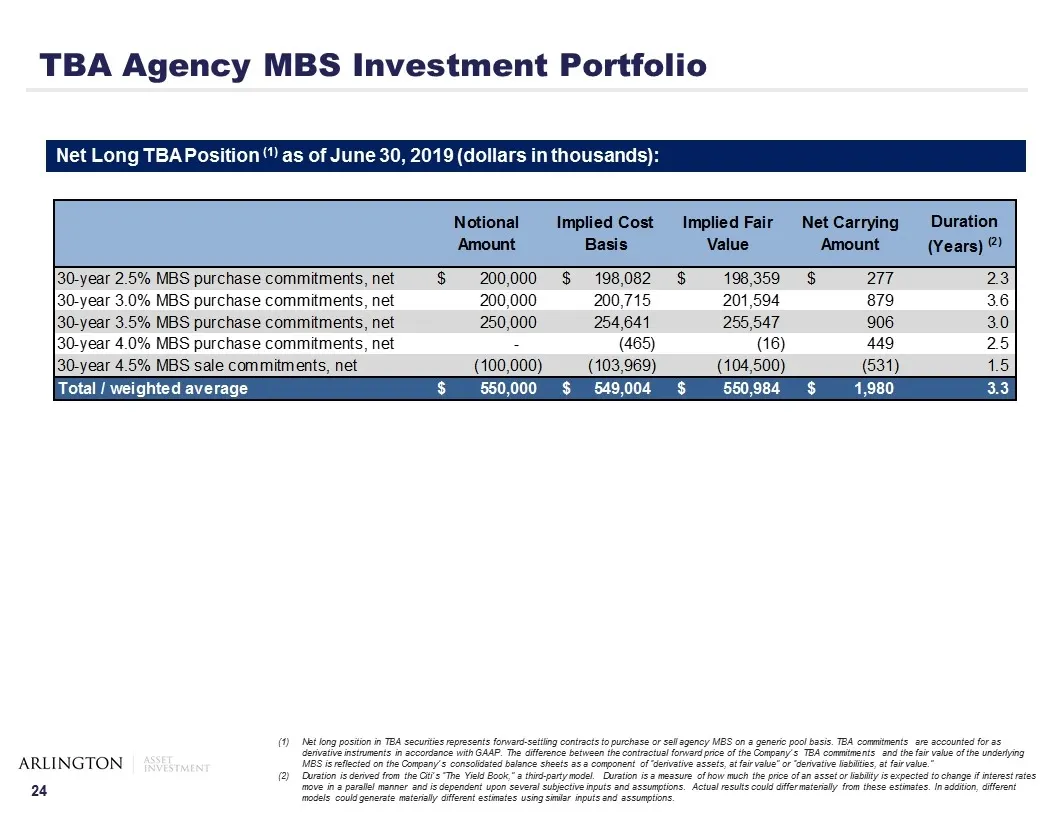
Slide 25: TBA Agency MBS Investment Portfolio
TBA Agency MBS Investment Portfolio Net Long TBA Position (1) as of June 30, 2019 (dollars in thousands): Net long position in TBA securities represents forward-settling contracts to purchase or sell agency MBS on a generic pool basis. TBA commitments are accounted for as derivative instruments in a
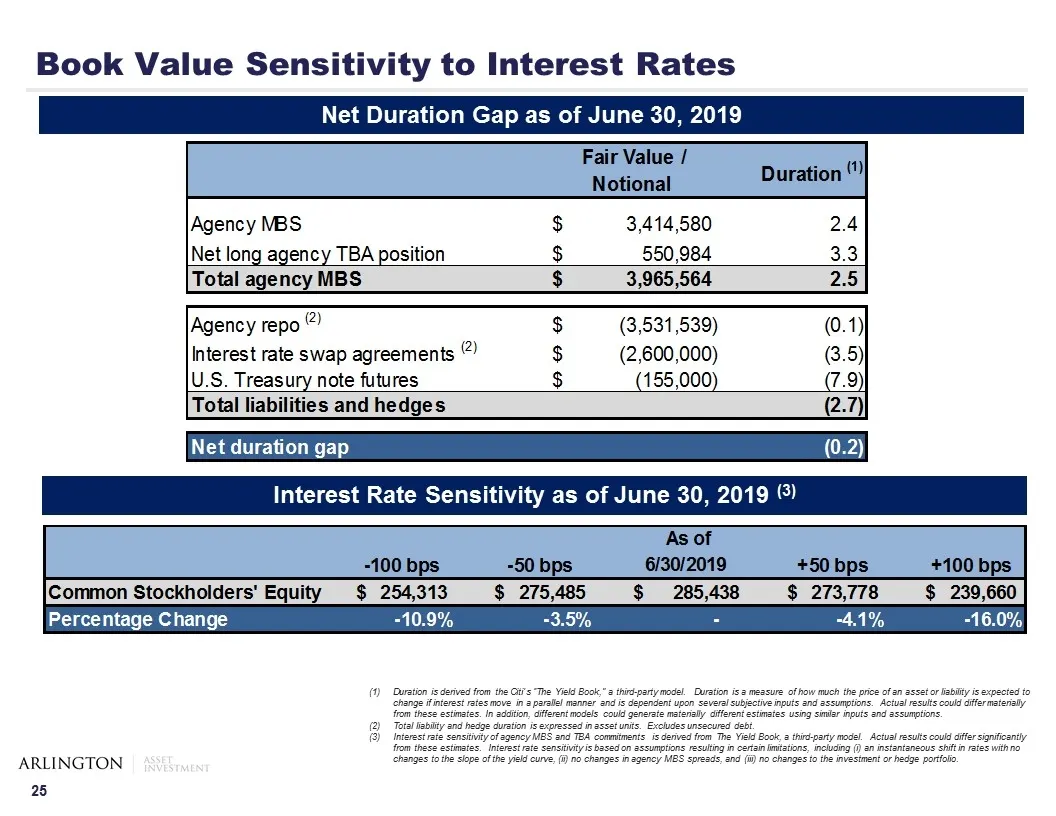
Slide 26: Interest Rate Sensitivity
Duration is derived from the Citi’s “The Yield Book,” a third-party model. Duration is a measure of how much the price of an asset or liability is expected to change if interest rates move in a parallel manner and is dependent upon several subjective inputs and assumptions. Actual results could diff
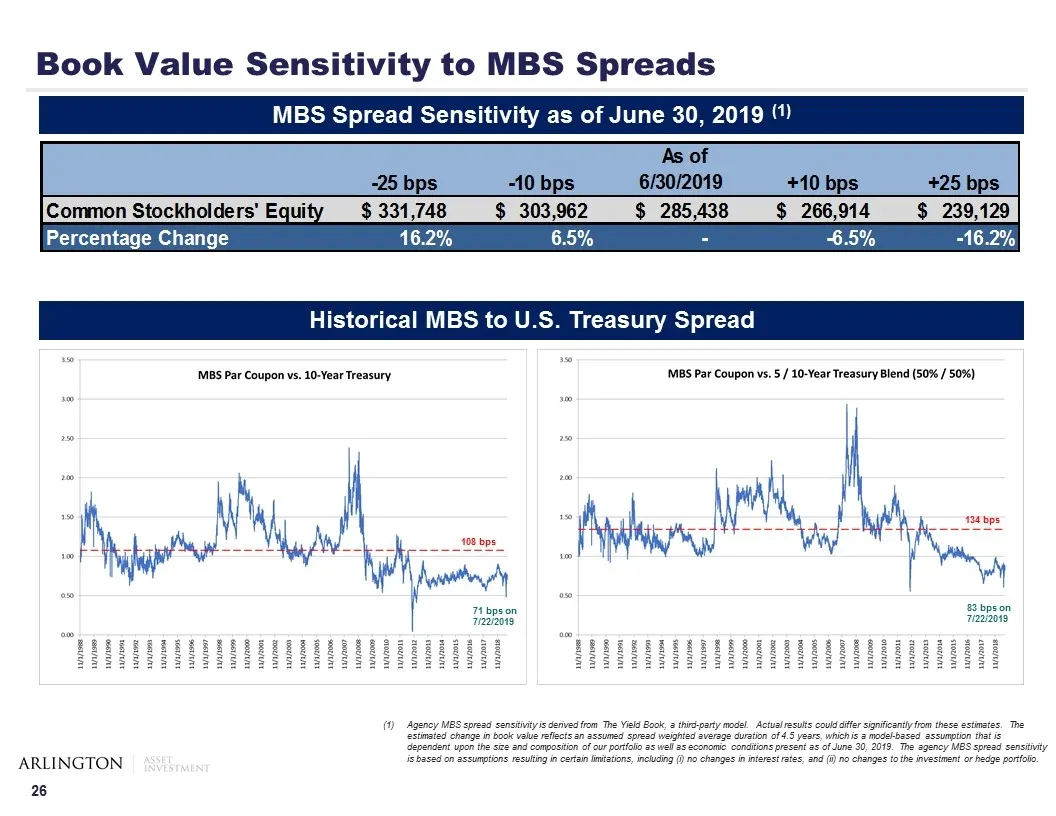
Slide 27: MBS Spread Sensitivity
Agency MBS spread sensitivity is derived from The Yield Book, a third-party model. Actual results could differ significantly from these estimates. The estimated change in book value reflects an assumed spread weighted average duration of 4.5 years, which is a model-based assumption that is dependent
Source: SEC EDGAR · 8-K filed Aug 7, 2019
More decks from Arlington Asset Investment Corp
 Q3 2023 Earnings Presentation12 slides · Nov 13, 2023
 Q2 2023 Earnings Presentation12 slides · Aug 14, 2023
 Q1 2023 Earnings Presentation16 slides · May 15, 2023
 Q4 2022 Earnings Presentation20 slides · Mar 31, 2023
 Q3 2022 Earnings Presentation29 slides · Nov 15, 2022
 Q2 2022 Earnings Presentation31 slides · Aug 10, 2022