Atlas Financial — Q3 2018 Earnings Presentation
32 slides from Atlas Financial's earnings presentation, Nov 5, 2018

Slide 1: Third Quarter 2018 Conference Call
NASDAQ: AFH Third Quarter 2018 Conference Call November 6, 2018
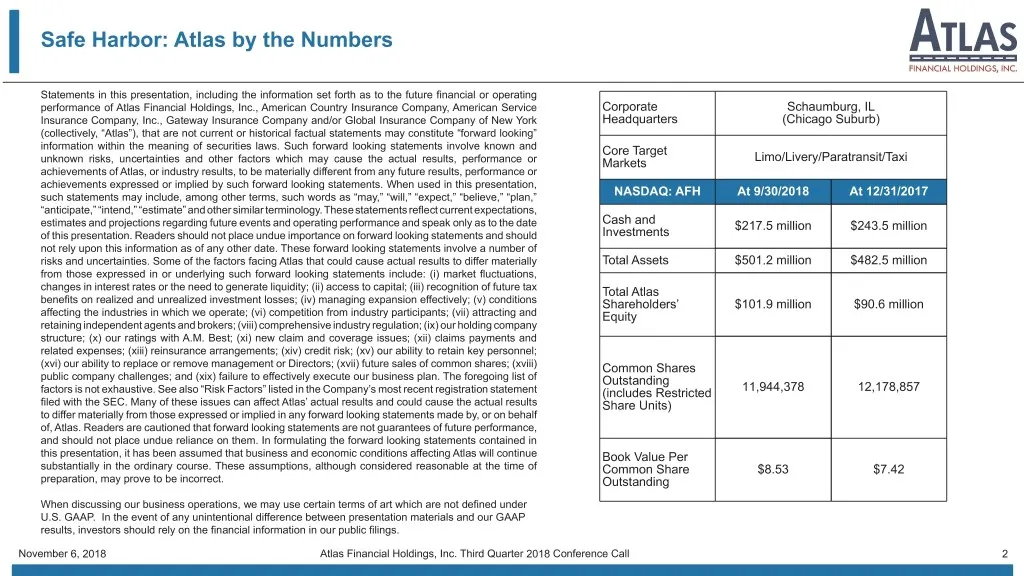
Slide 2: Safe Harbor: Atlas by the Numbers
Safe Harbor: Atlas by the Numbers Statements in this presentation, including the information set forth as to the future financial or operating performance of Atlas Financial Holdings, Inc., American Country Insurance Company, American Service Corporate Schaumburg, IL Insurance Company, Inc., Gateway
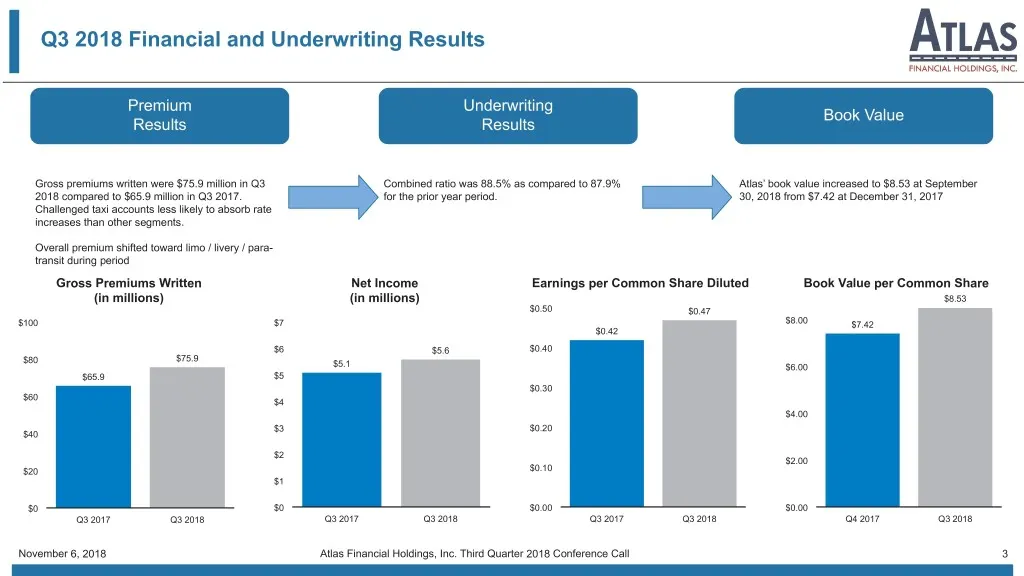
Slide 3: Q3 2018 Financial and Underwriting Results
Q3 2018 Financial and Underwriting Results Premium Underwriting Book Value Results Results Gross premiums written were $75.9 million in Q3 Combined ratio was 88.5% as compared to 87.9% Atlas’ book value increased to $8.53 at September 2018 compared to $65.9 million in Q3 2017. for the prior year per
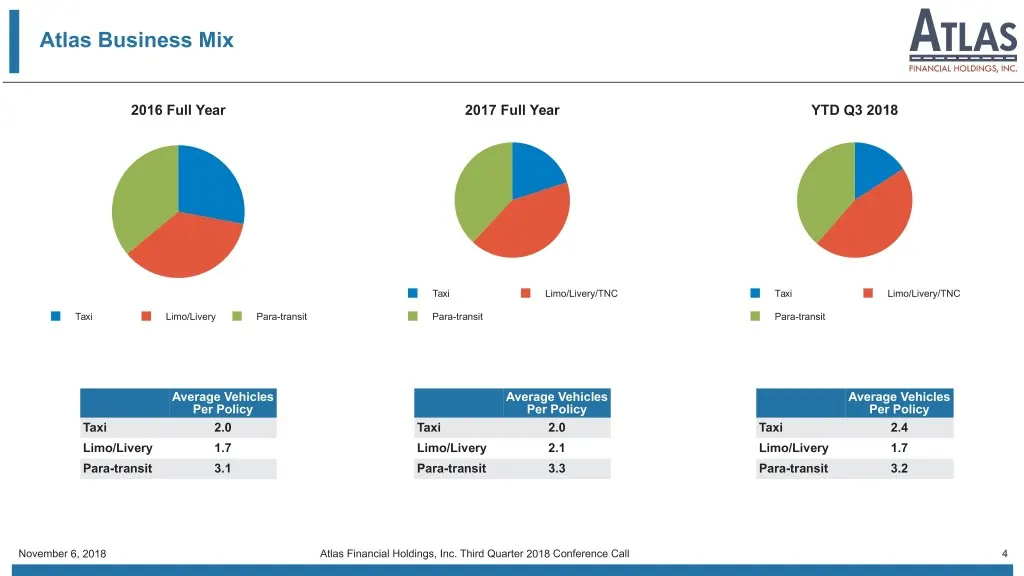
Slide 4: Atlas Business Mix
Atlas Business Mix 2016 Full Year 2017 Full Year YTD Q3 2018 Taxi Limo/Livery/TNC Taxi Limo/Livery/TNC Taxi Limo/Livery Para-transit Para-transit Para-transit Average Vehicles Average Vehicles Average Vehicles Per Policy Per Policy Per Policy Taxi 2.0 Taxi 2.0 Taxi 2.4 Limo/Livery 1.7 Limo/Livery 2.
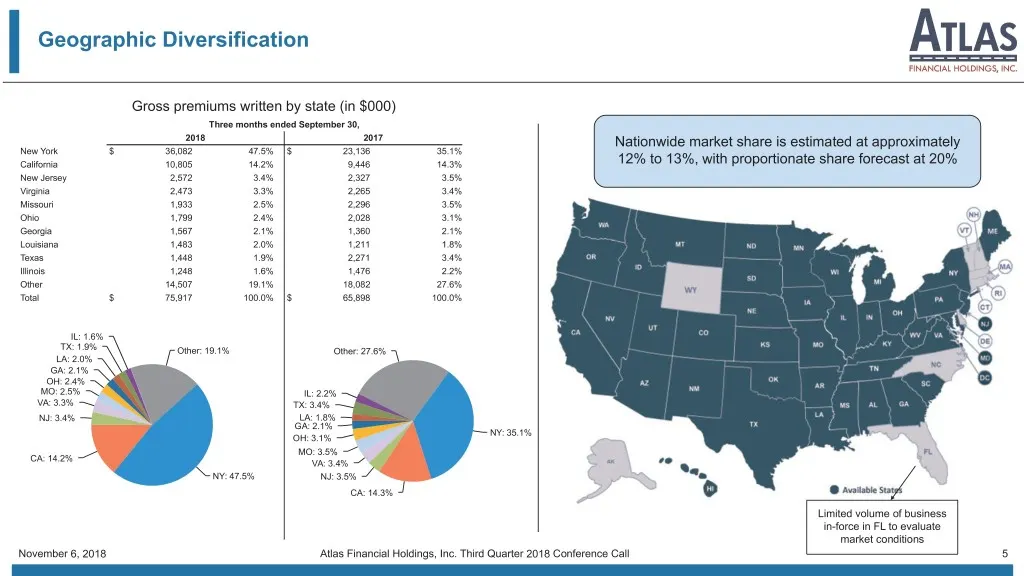
Slide 5: Geographic Diversification
Geographic Diversification Gross premiums written by state (in $000) Three months ended September 30, 2018 2017 Nationwide market share is estimated at approximately New York $ 36,082 47.5% $ 23,136 35.1% California 10,805 14.2% 9,446 14.3% 12% to 13%, with proportionate share forecast at 20% New Je
Slide 6: Premiums Written: Rate Activity
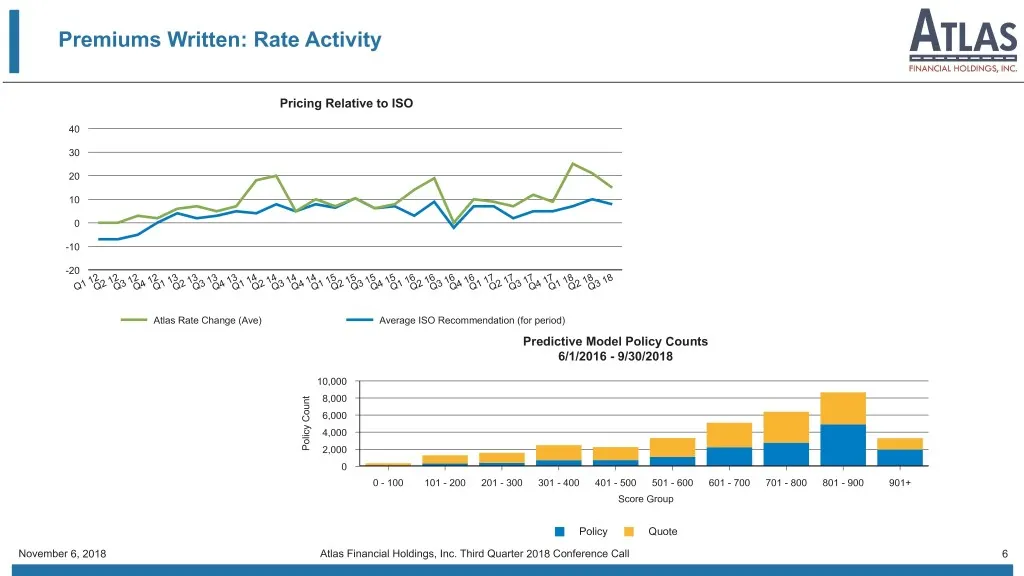
Premiums Written: Rate Activity Pricing Relative to ISO 40 30 20 10 0 -10 -20 12 12 12 12 13 13 13 13 14 14 14 14 15 15 15 15 16 16 16 16 17 17 17 17 18 18 18 Q1 Q2 Q3 Q4 Q1 Q2 Q3 Q4 Q1 Q2 Q3 Q4 Q1 Q2 Q3 Q4 Q1 Q2 Q3 Q4 Q1 Q2 Q3 Q4 Q1 Q2 Q3 Atlas Rate Change (Ave) Average ISO Recommendation (for peri
Slide 7: Market Conditions: Price Elasticity
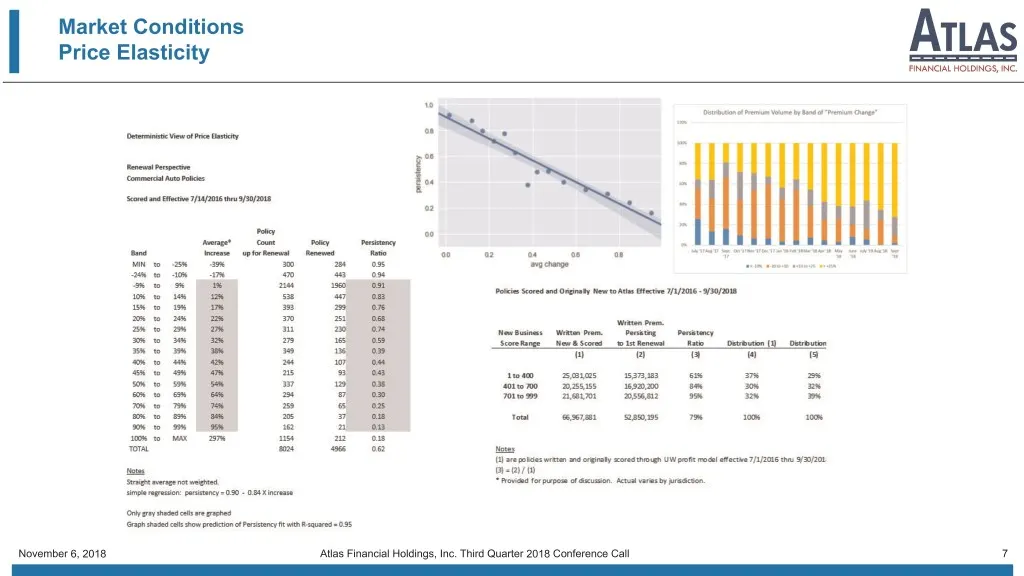
Market Conditions Price Elasticity November 6, 2018 Atlas Financial Holdings, Inc. Third Quarter 2018 Conference Call 7
Slide 8: Written Premium: In-force
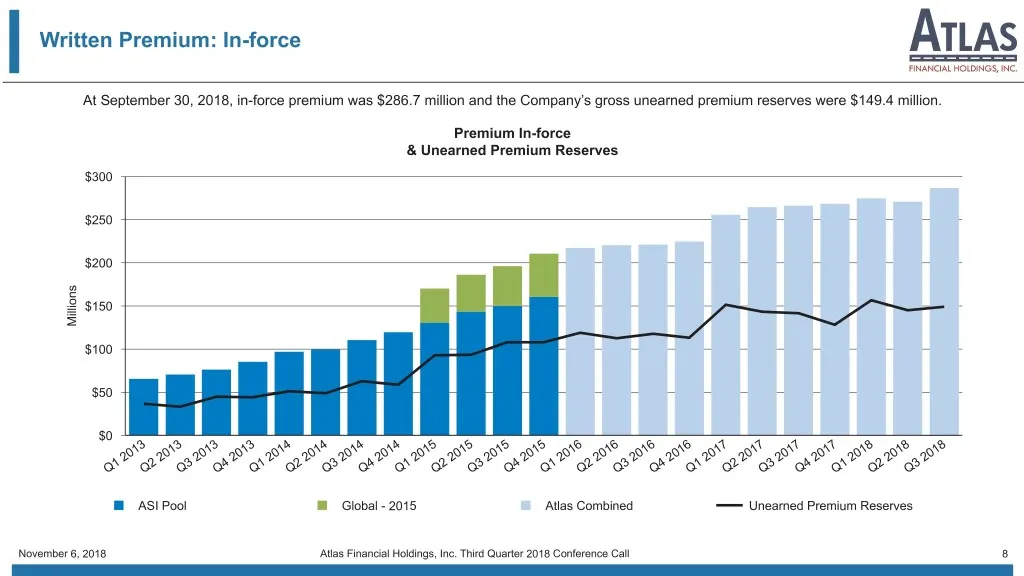
Written Premium: In-force At September 30, 2018, in-force premium was $286.7 million and the Company’s gross unearned premium reserves were $149.4 million. Premium In-force & Unearned Premium Reserves $300 $250 $200 s n o i l $150 l i M $100 $50 $0 13 13 13 13 14 14 14 14 15 15 15 15 16 16 16 16 17
Slide 9: Financial Highlights
Financial Highlights ATLAS FINANCIAL HOLDINGS, INC.
Slide 10: Third Quarter 2018 Financial Highlights
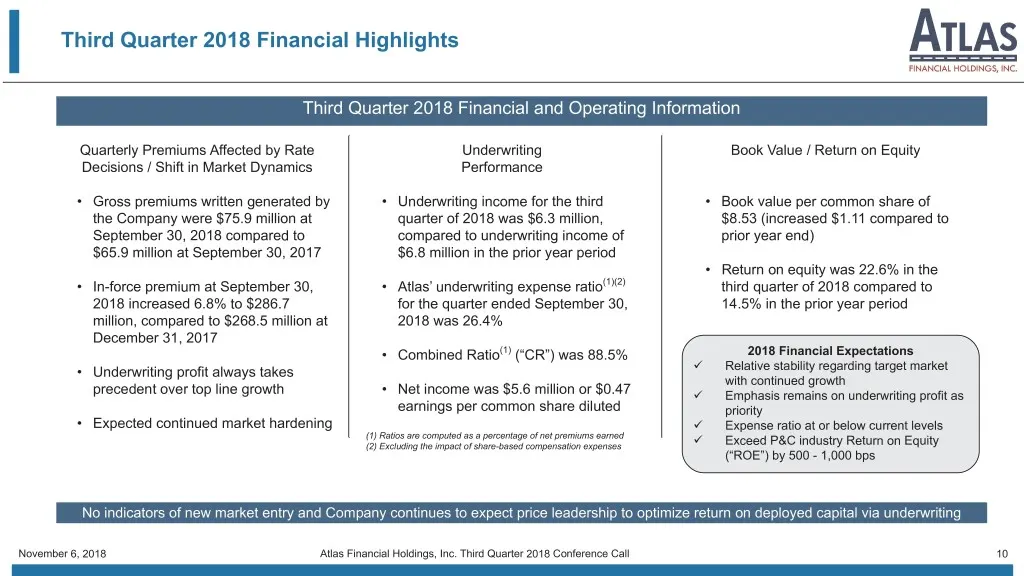
Third Quarter 2018 Financial Highlights Third Quarter 2018 Financial and Operating Information Quarterly Premiums Affected by Rate Underwriting Book Value / Return on Equity Decisions / Shift in Market Dynamics Performance • Gross premiums written generated by • Underwriting income for the third • B
Slide 11: Operating Leverage
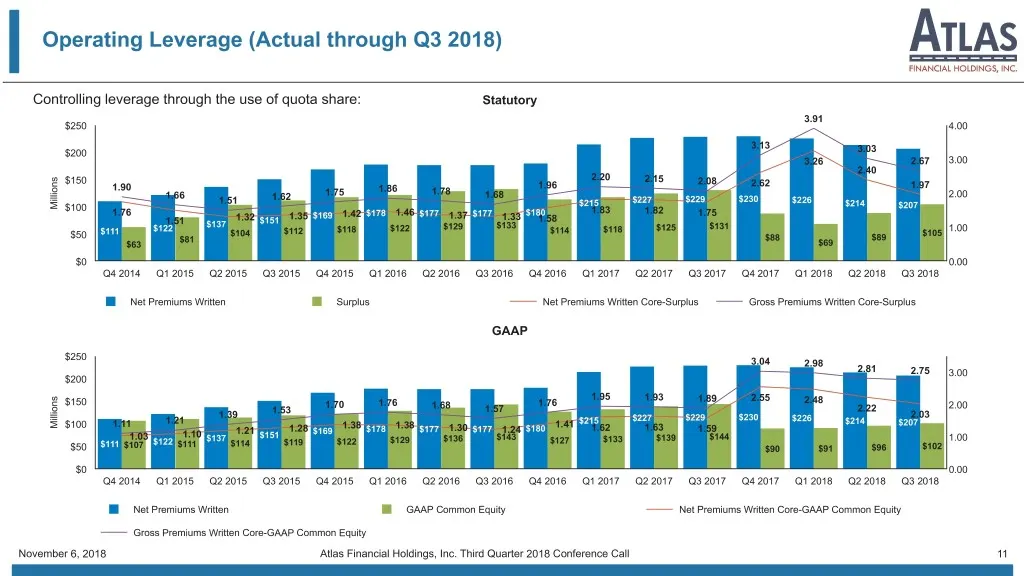
Operating Leverage (Actual through Q3 2018) Controlling leverage through the use of quota share: Statutory 3.91 $250 4.00 3.13 $200 3.03 3.26 2.67 3.00 2.40 s $150 2.20 2.15 2.08 n 1.90 1.96 2.62 1.97 o 1.86 i 1.78 l 1.75 l 1.66 1.68 2.00 i 1.62 1.51 $215 $227 $229 $230 $226 $214 M $207 $100 1.83 1.
Slide 12: Combined Ratio Analysis
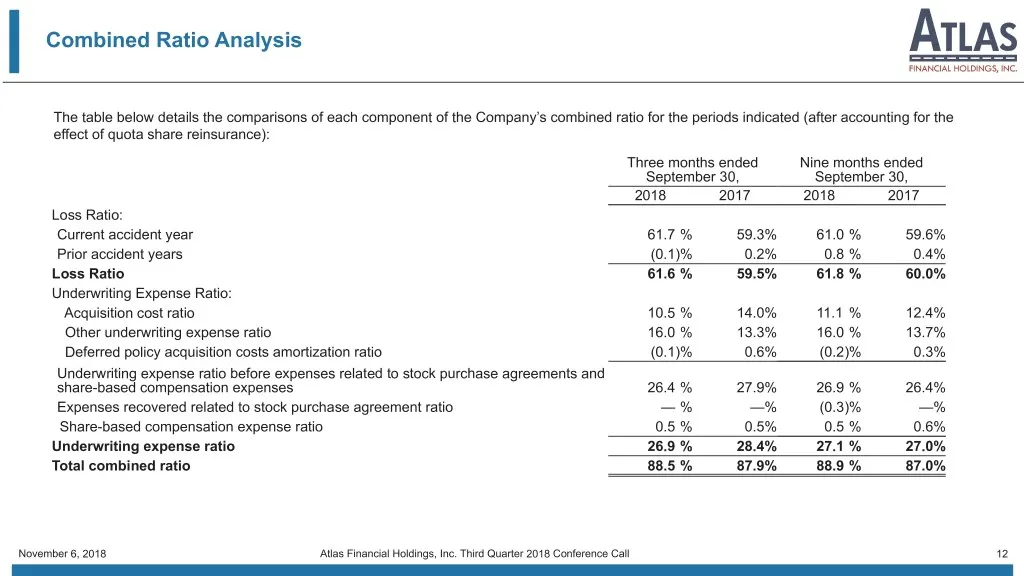
Combined Ratio Analysis The table below details the comparisons of each component of the Company’s combined ratio for the periods indicated (after accounting for the effect of quota share reinsurance): Three months ended Nine months ended September 30, September 30, 2018 2017 2018 2017 Loss Ratio: C
Slide 13: Combined Ratio
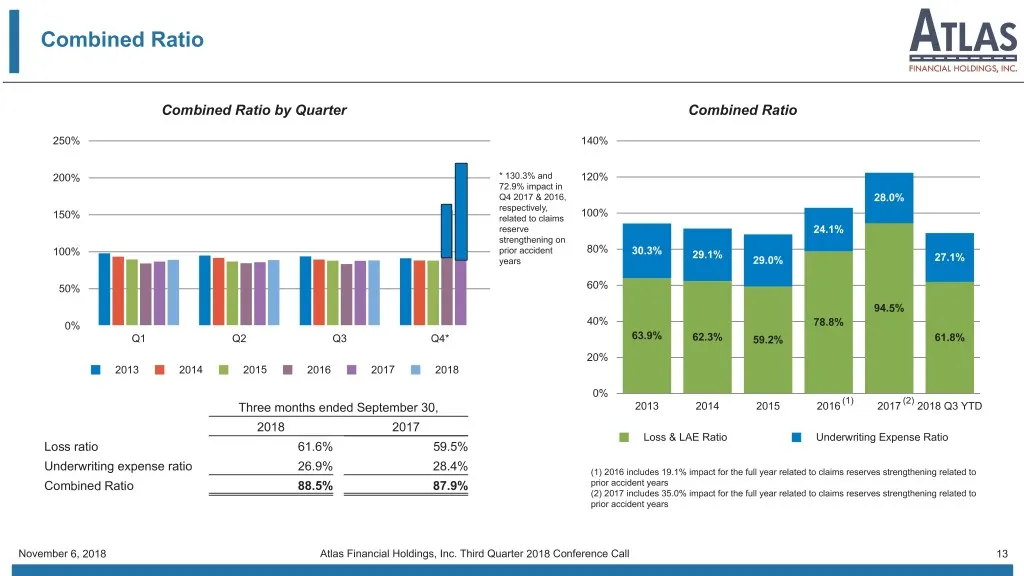
Combined Ratio Combined Ratio by Quarter Combined Ratio 250% 140% 200% * 130.3% and 120% 72.9% impact in Q4 2017 & 2016, 28.0% respectively, 100% 150% related to claims reserve 24.1% strengthening on 80% 100% prior accident 30.3% 29.1% years 29.0% 27.1% 50% 60% 94.5% 0% 40% 78.8% Q1 Q2 Q3 Q4* 63.9%
Slide 14: Healthy Balance Sheet with Availability of Capital & Reinsurance
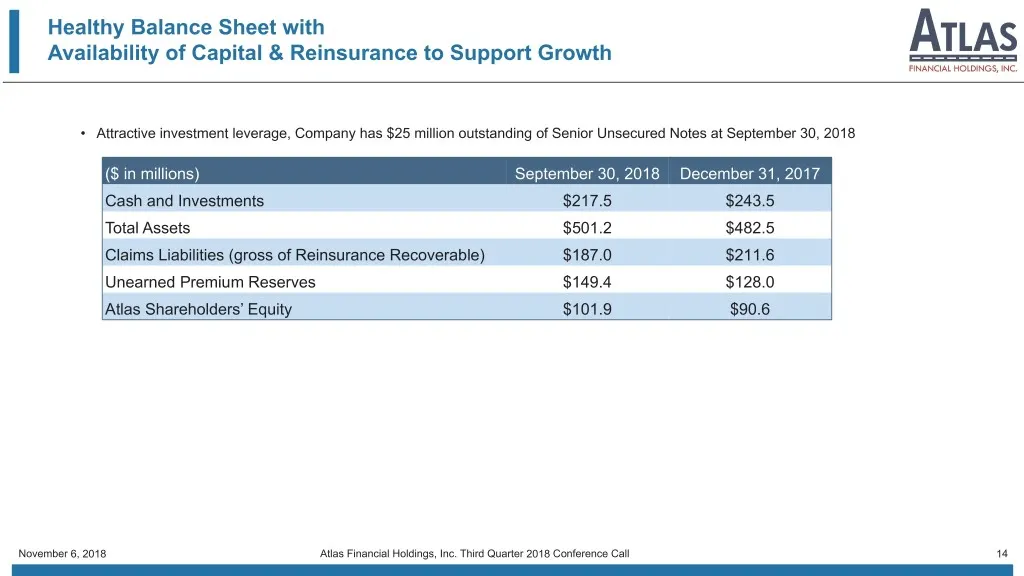
Healthy Balance Sheet with Availability of Capital & Reinsurance to Support Growth • Attractive investment leverage, Company has $25 million outstanding of Senior Unsecured Notes at September 30, 2018 ($ in millions) September 30, 2018 December 31, 2017 Cash and Investments $217.5 $243.5 Total Asset
Slide 15: Investment Portfolio
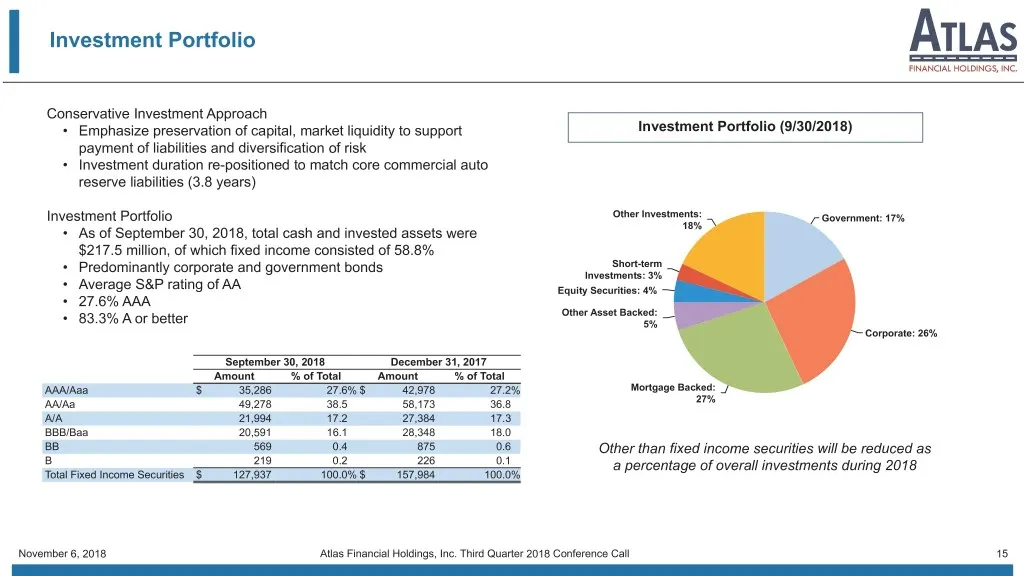
Investment Portfolio Conservative Investment Approach • Emphasize preservation of capital, market liquidity to support Investment Portfolio (9/30/2018) payment of liabilities and diversification of risk • Investment duration re-positioned to match core commercial auto reserve liabilities (3.8 years)
Slide 16: Detailed Impact of Changes to Book Value per Common Share
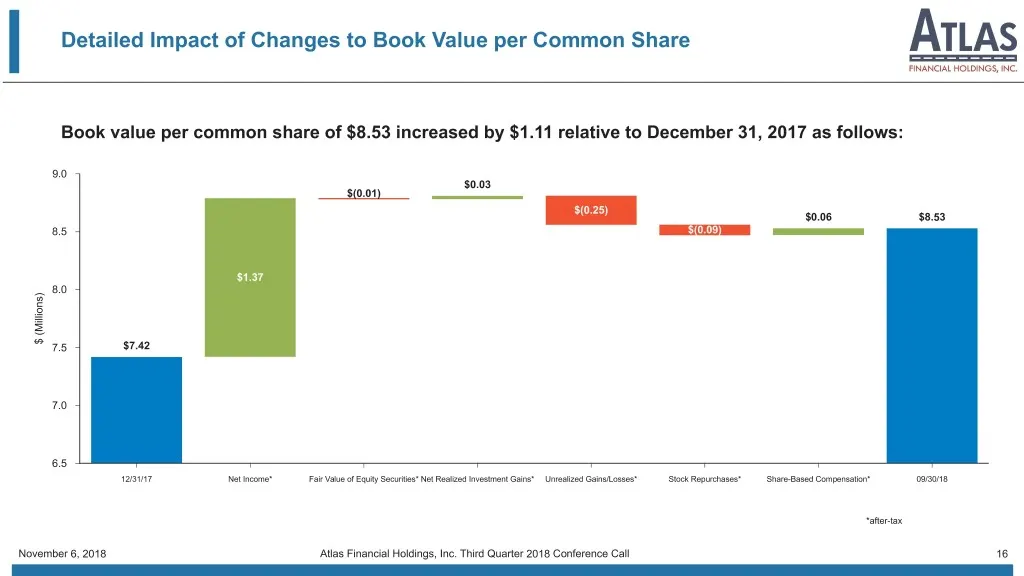
Detailed Impact of Changes to Book Value per Common Share Book value per common share of $8.53 increased by $1.11 relative to December 31, 2017 as follows: 9.0 $0.03 $(0.01) $(0.25) $0.06 $8.53 8.5 $(0.09) $1.37 8.0 ) s n o i l l i M ( $ 7.5 $7.42 7.0 6.5 12/31/17 Net Income* Fair Value of Equity Se
Slide 17: Operating Conclusions
Operating Conclusions ATLAS FINANCIAL HOLDINGS, INC.
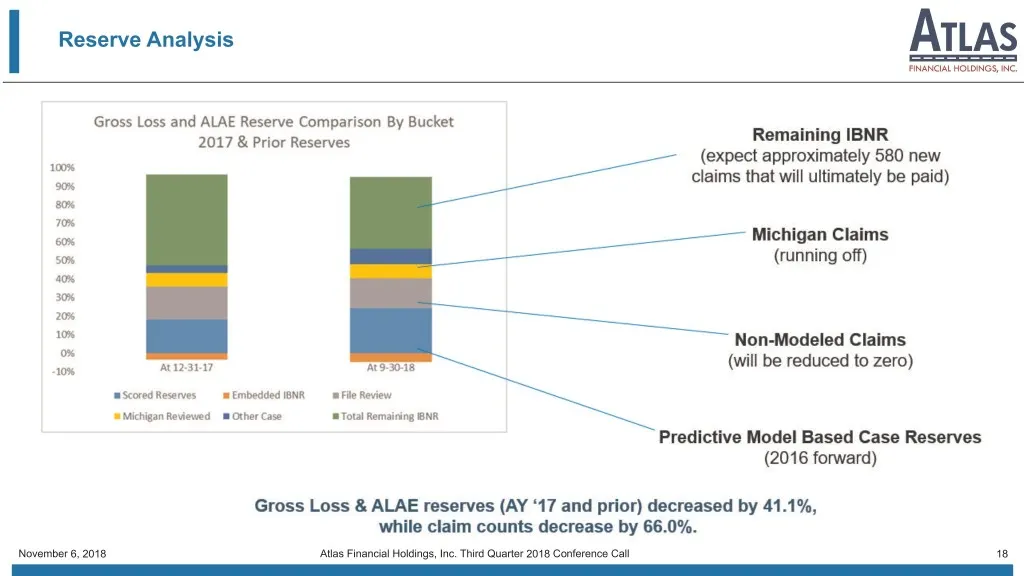
Slide 18: Reserve Analysis
Reserve Analysis November 6, 2018 Atlas Financial Holdings, Inc. Third Quarter 2018 Conference Call 18
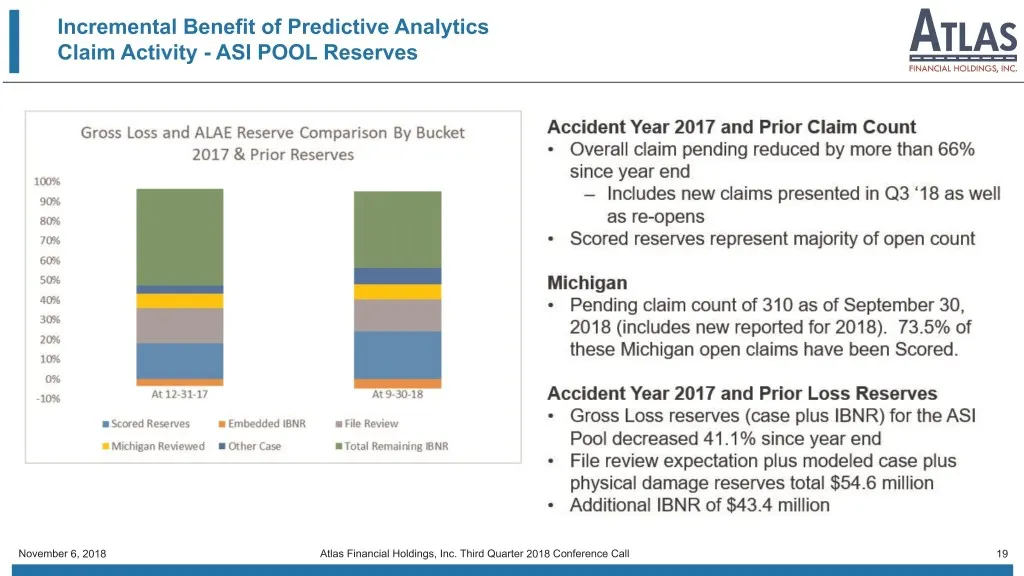
Slide 19: Incremental Benefit of Predictive Analytics: Claim Activity - ASI Pool Reserves
Incremental Benefit of Predictive Analytics Claim Activity - ASI POOL Reserves November 6, 2018 Atlas Financial Holdings, Inc. Third Quarter 2018 Conference Call 19
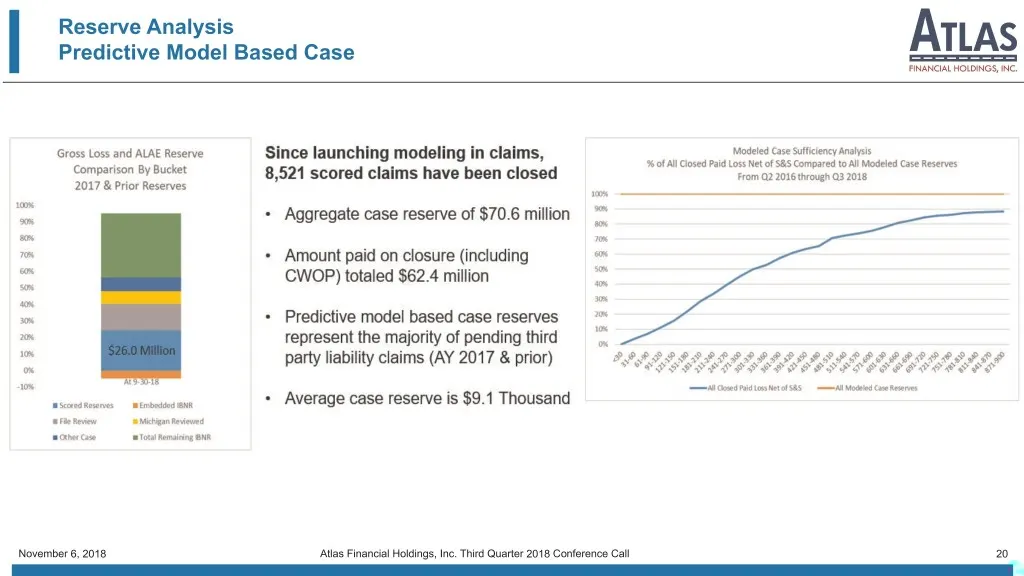
Slide 20: Reserve Analysis: Predictive Model Based Case
Reserve Analysis Predictive Model Based Case November 6, 2018 Atlas Financial Holdings, Inc. Third Quarter 2018 Conference Call 20
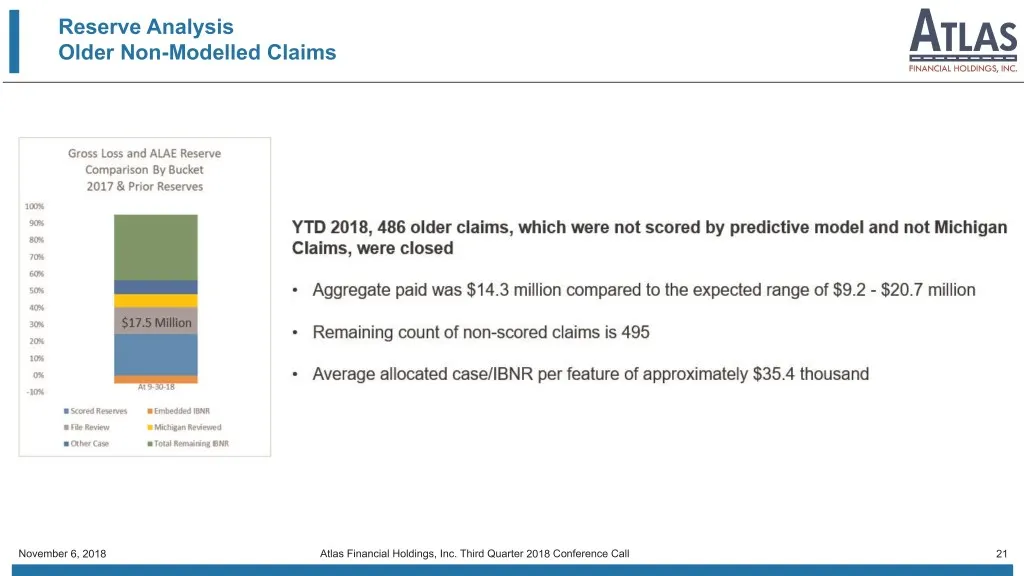
Slide 21: Reserve Analysis: Older Non-Modelled Claims
Reserve Analysis Older Non-Modelled Claims November 6, 2018 Atlas Financial Holdings, Inc. Third Quarter 2018 Conference Call 21
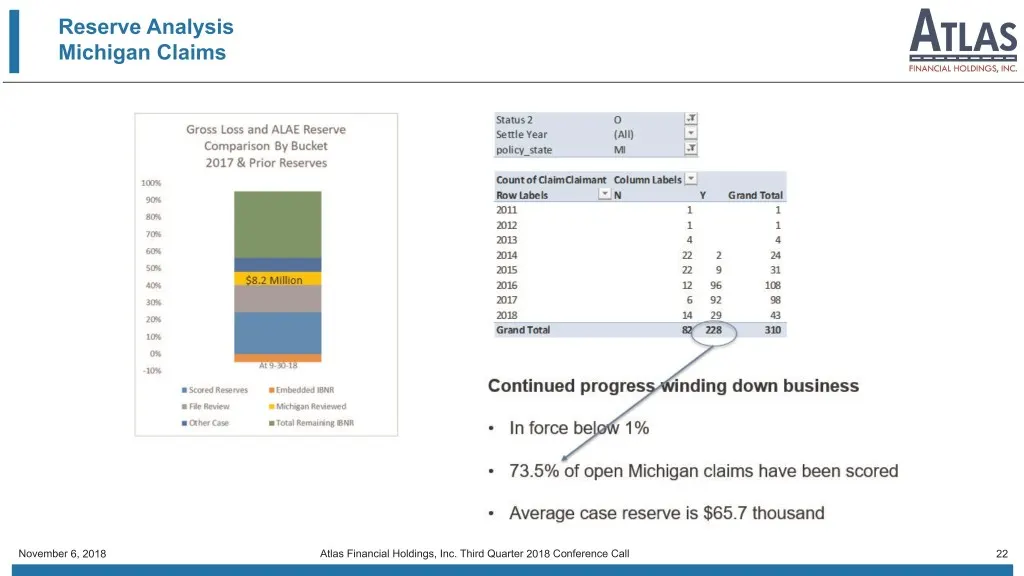
Slide 22: Reserve Analysis: Michigan Claims
Reserve Analysis Michigan Claims November 6, 2018 Atlas Financial Holdings, Inc. Third Quarter 2018 Conference Call 22
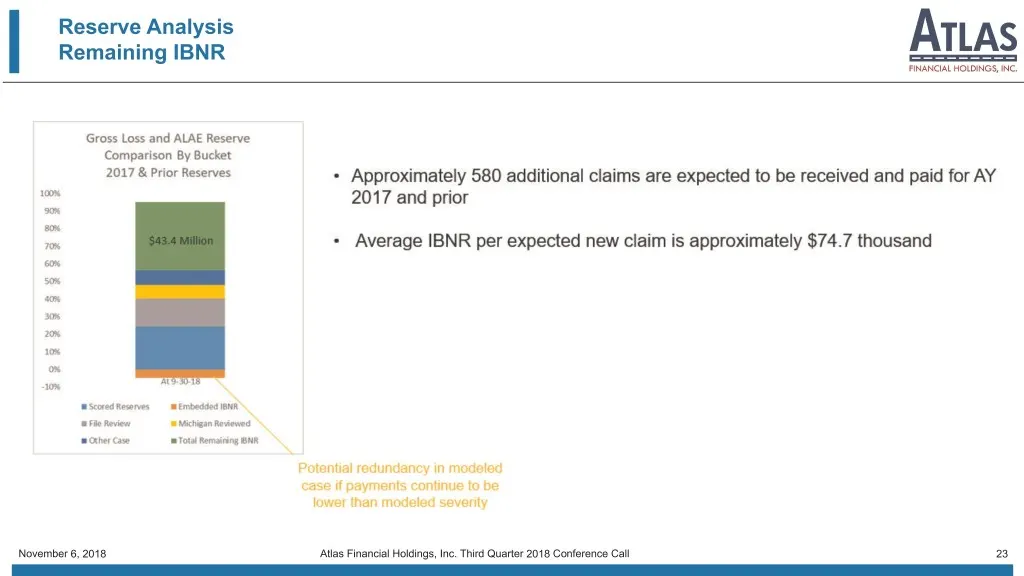
Slide 23: Reserve Analysis: Remaining IBNR
Reserve Analysis Remaining IBNR November 6, 2018 Atlas Financial Holdings, Inc. Third Quarter 2018 Conference Call 23
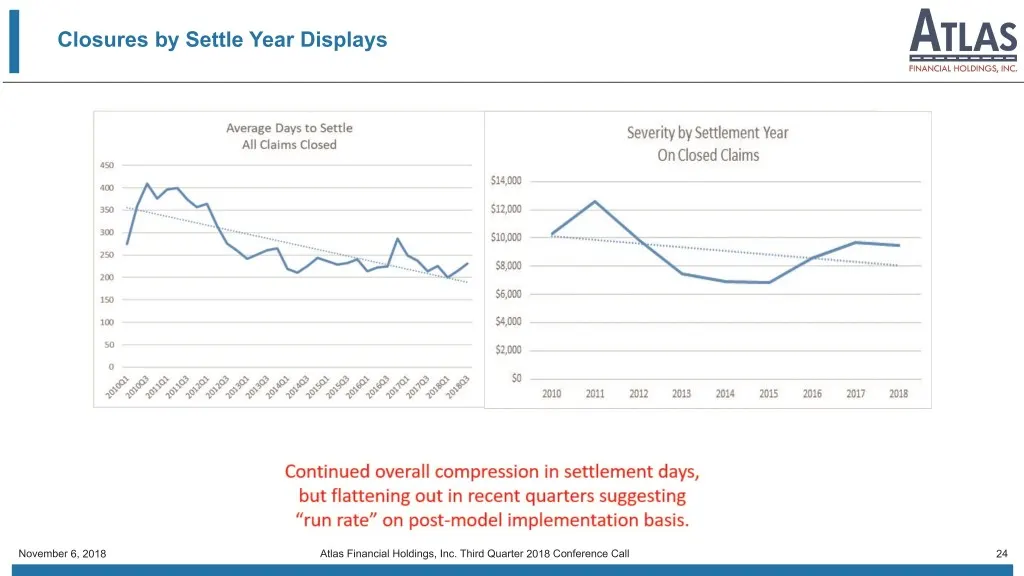
Slide 24: Closures by Settle Year Displays
Closures by Settle Year Displays November 6, 2018 Atlas Financial Holdings, Inc. Third Quarter 2018 Conference Call 24
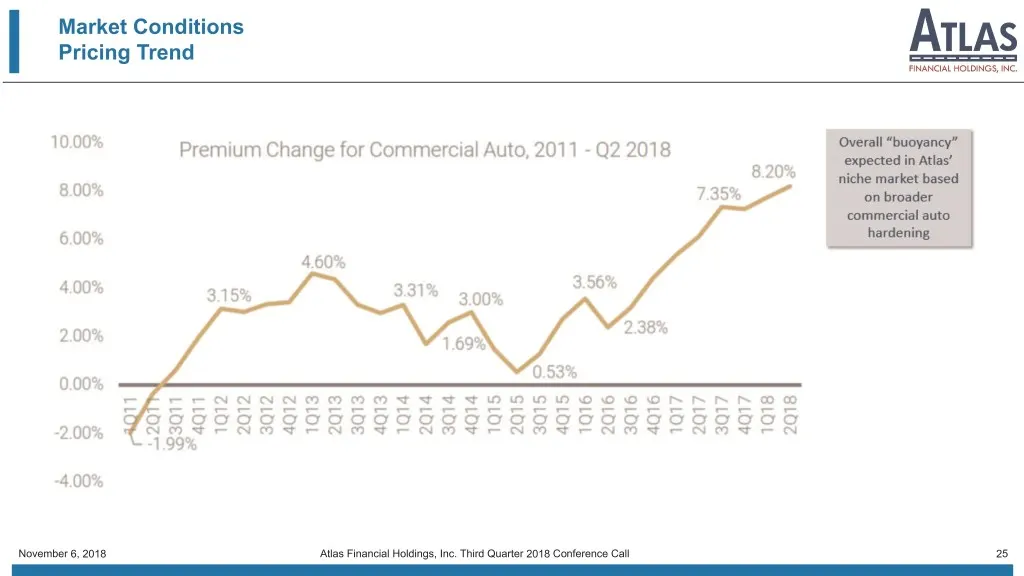
Slide 25: Market Conditions: Pricing Trend
Market Conditions Pricing Trend November 6, 2018 Atlas Financial Holdings, Inc. Third Quarter 2018 Conference Call 25
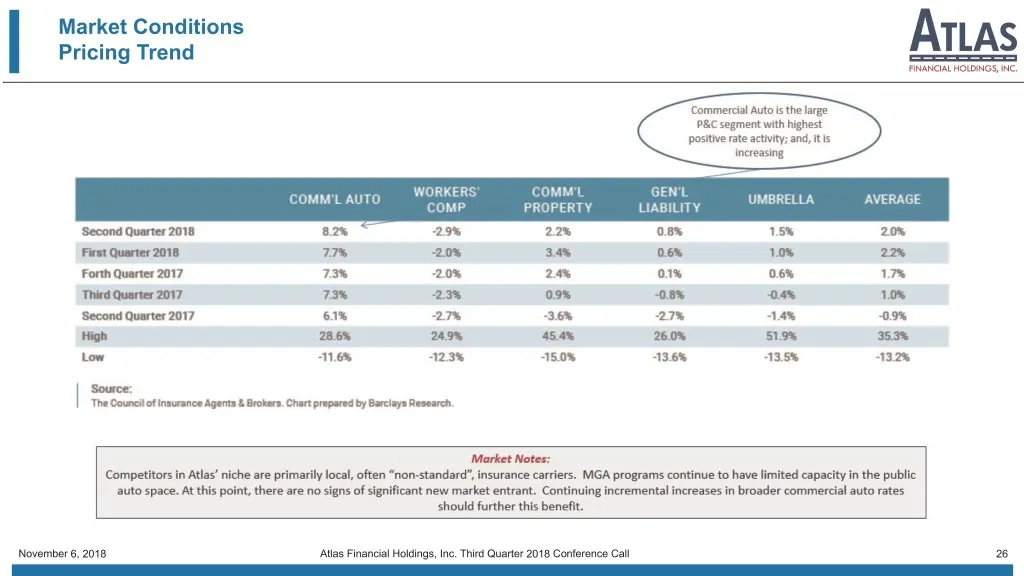
Slide 26: Market Conditions: Pricing Trend
Market Conditions Pricing Trend November 6, 2018 Atlas Financial Holdings, Inc. Third Quarter 2018 Conference Call 26
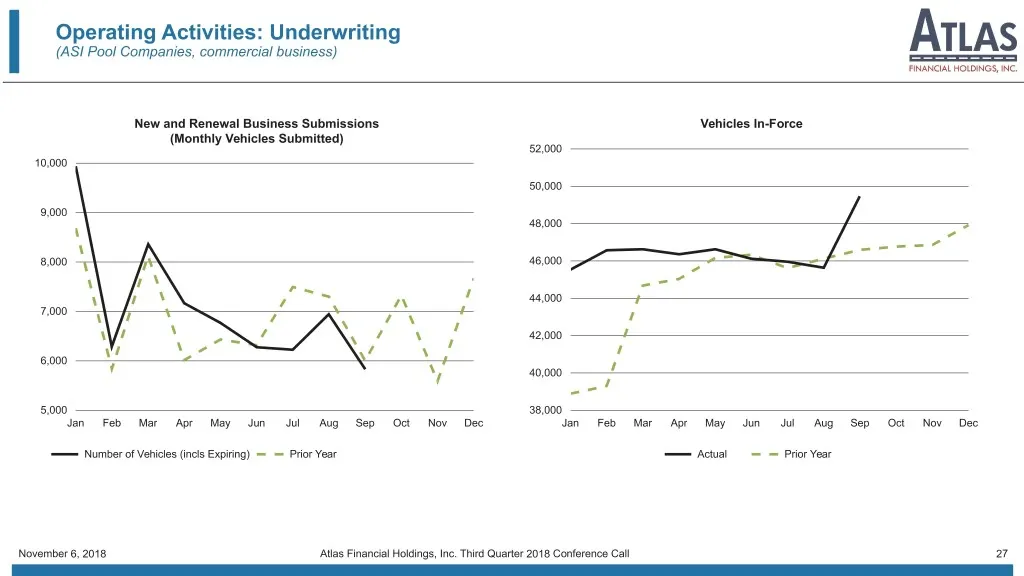
Slide 27: Operating Activities: Underwriting
Operating Activities: Underwriting (ASI Pool Companies, commercial business) New and Renewal Business Submissions Vehicles In-Force (Monthly Vehicles Submitted) 52,000 10,000 50,000 9,000 48,000 8,000 46,000 44,000 7,000 42,000 6,000 40,000 5,000 38,000 Jan Feb Mar Apr May Jun Jul Aug Sep Oct Nov De
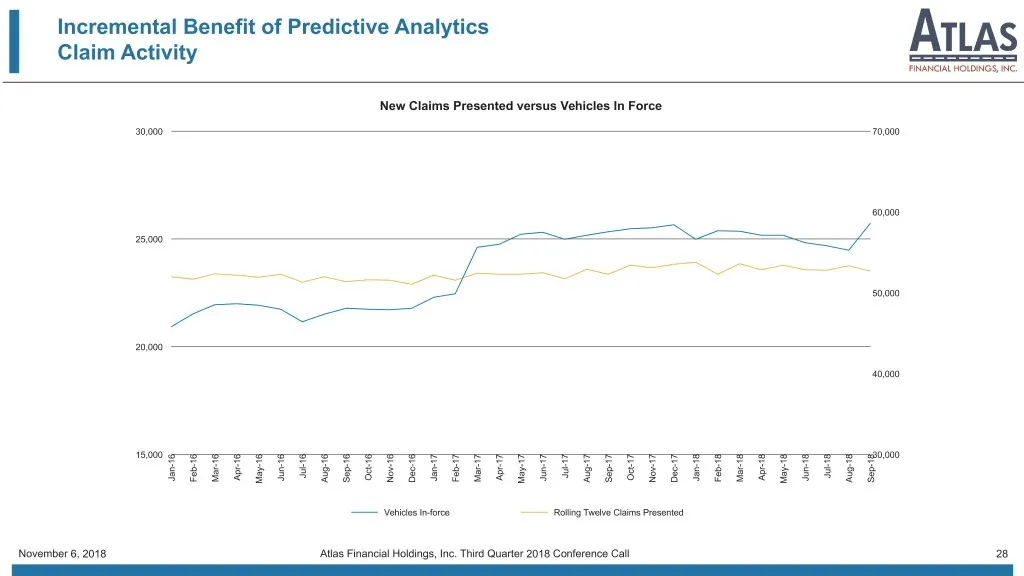
Slide 28: Incremental Benefit of Predictive Analytics: Claim Activity
Incremental Benefit of Predictive Analytics Claim Activity New Claims Presented versus Vehicles In Force 30,000 70,000 60,000 25,000 50,000 20,000 40,000 6 7 8 6 6 7 7 8 8 6 7 6 7 8 6 6 6 6 7 7 7 7 8 8 6 7 8 15,000 6 6 7 7 8 38 0,000 1 1 1 1 1 1 1 1 1 1 1 1 1 1 1 1 1 1 1 1 1 1 1 1 1 1 1 1 1 1 1 1 1
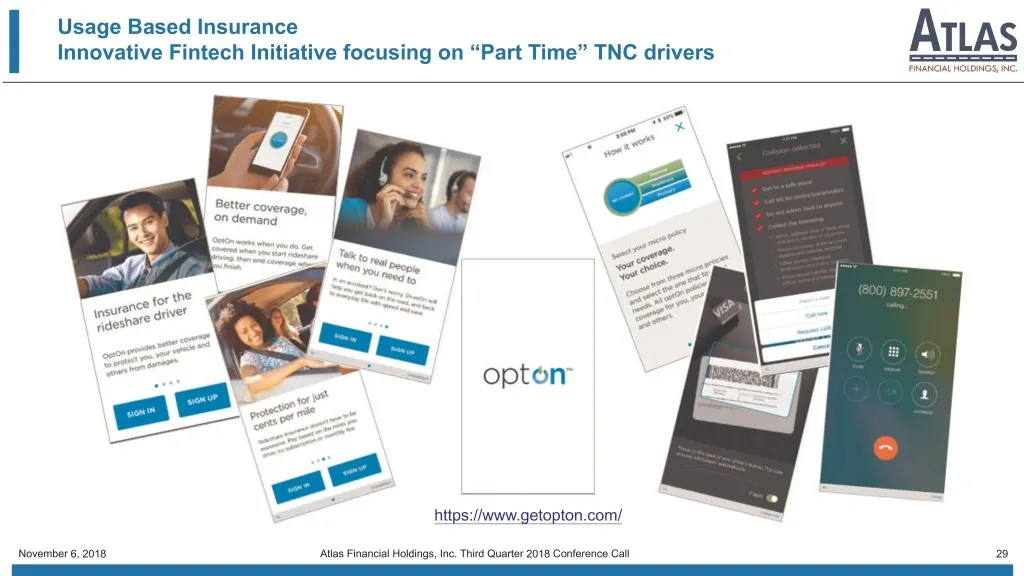
Slide 29: Usage Based Insurance
Usage Based Insurance Innovative Fintech Initiative focusing on “Part Time” TNC drivers https://www.getopton.com/ November 6, 2018 Atlas Financial Holdings, Inc. Third Quarter 2018 Conference Call 29
Slide 30: Outlook for 2018
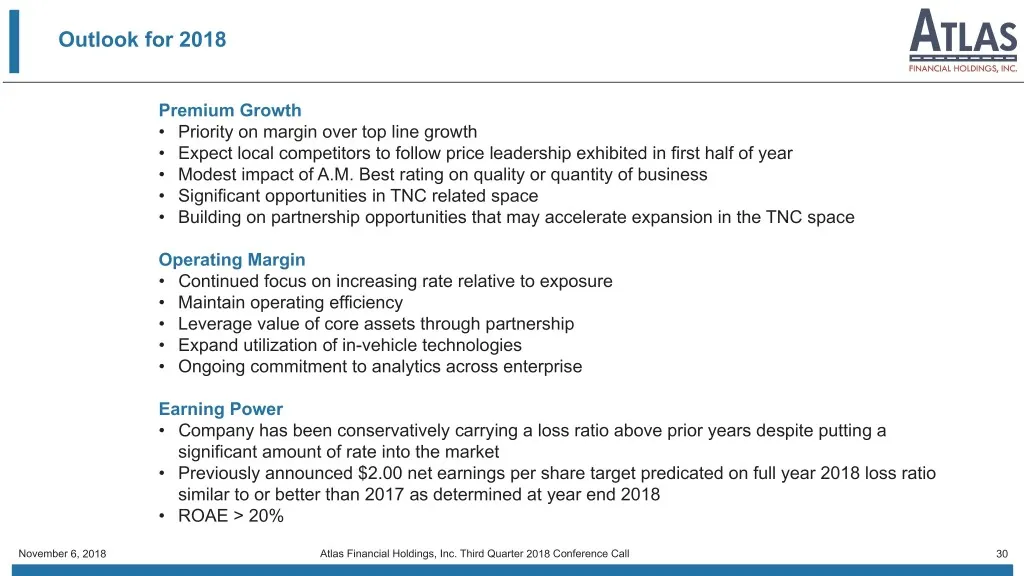
Outlook for 2018 Premium Growth • Priority on margin over top line growth • Expect local competitors to follow price leadership exhibited in first half of year • Modest impact of A.M. Best rating on quality or quantity of business • Significant opportunities in TNC related space • Building on partne
Slide 31: For Additional Information
For Additional Information At the Company: Scott Wollney Chief Executive Officer swollney@atlas-fin.com 847-700-8600 NASDAQ: AFH Investor Relations: The Equity Group Inc. Adam Prior Senior Vice President APrior@equityny.com A reconciliation of Non-GAAP financial measures can be found on the next sli
Slide 32: Reconciliation of Non-U.S. GAAP Financial Measurements
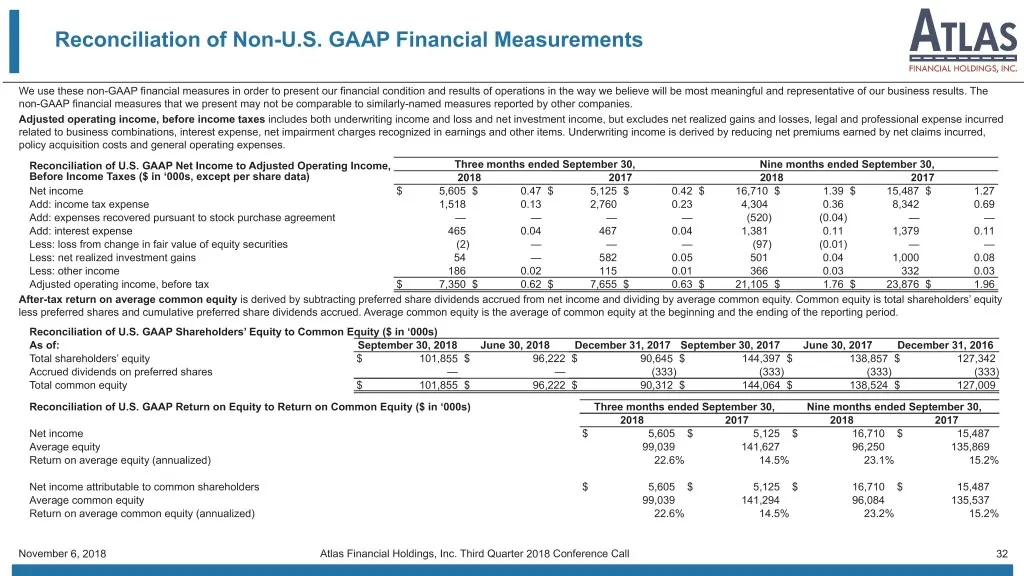
Reconciliation of Non-U.S. GAAP Financial Measurements We use these non-GAAP financial measures in order to present our financial condition and results of operations in the way we believe will be most meaningful and representative of our business results. The non-GAAP financial measures that we pres
Source: SEC EDGAR · 8-K filed Nov 5, 2018
More decks from Atlas Financial Holdings Inc
 Investor Presentation (November 2022)20 slides · Nov 14, 2022
 Investor Presentation (August 2022)21 slides · Aug 12, 2022
 Investor Presentation (May 2022)20 slides · May 23, 2022
 Investor Presentation (April 2022)18 slides · Apr 4, 2022
 Investor Presentation (November 2021)28 slides · Nov 8, 2021
 Q2 2021 Earnings Presentation26 slides · Aug 10, 2021