LIC Housing Finance Ltd · NSE:LICHSGFIN
LIC Housing Finance — Q3 FY2020 Earnings Presentation
20 slides from LIC Housing Finance's earnings presentation, February 2020
Slide 1: Q3 FY20 Investor Update
7 aa See: LIC HOUSING FINANCE LTD Q3 FY20 Investor Update
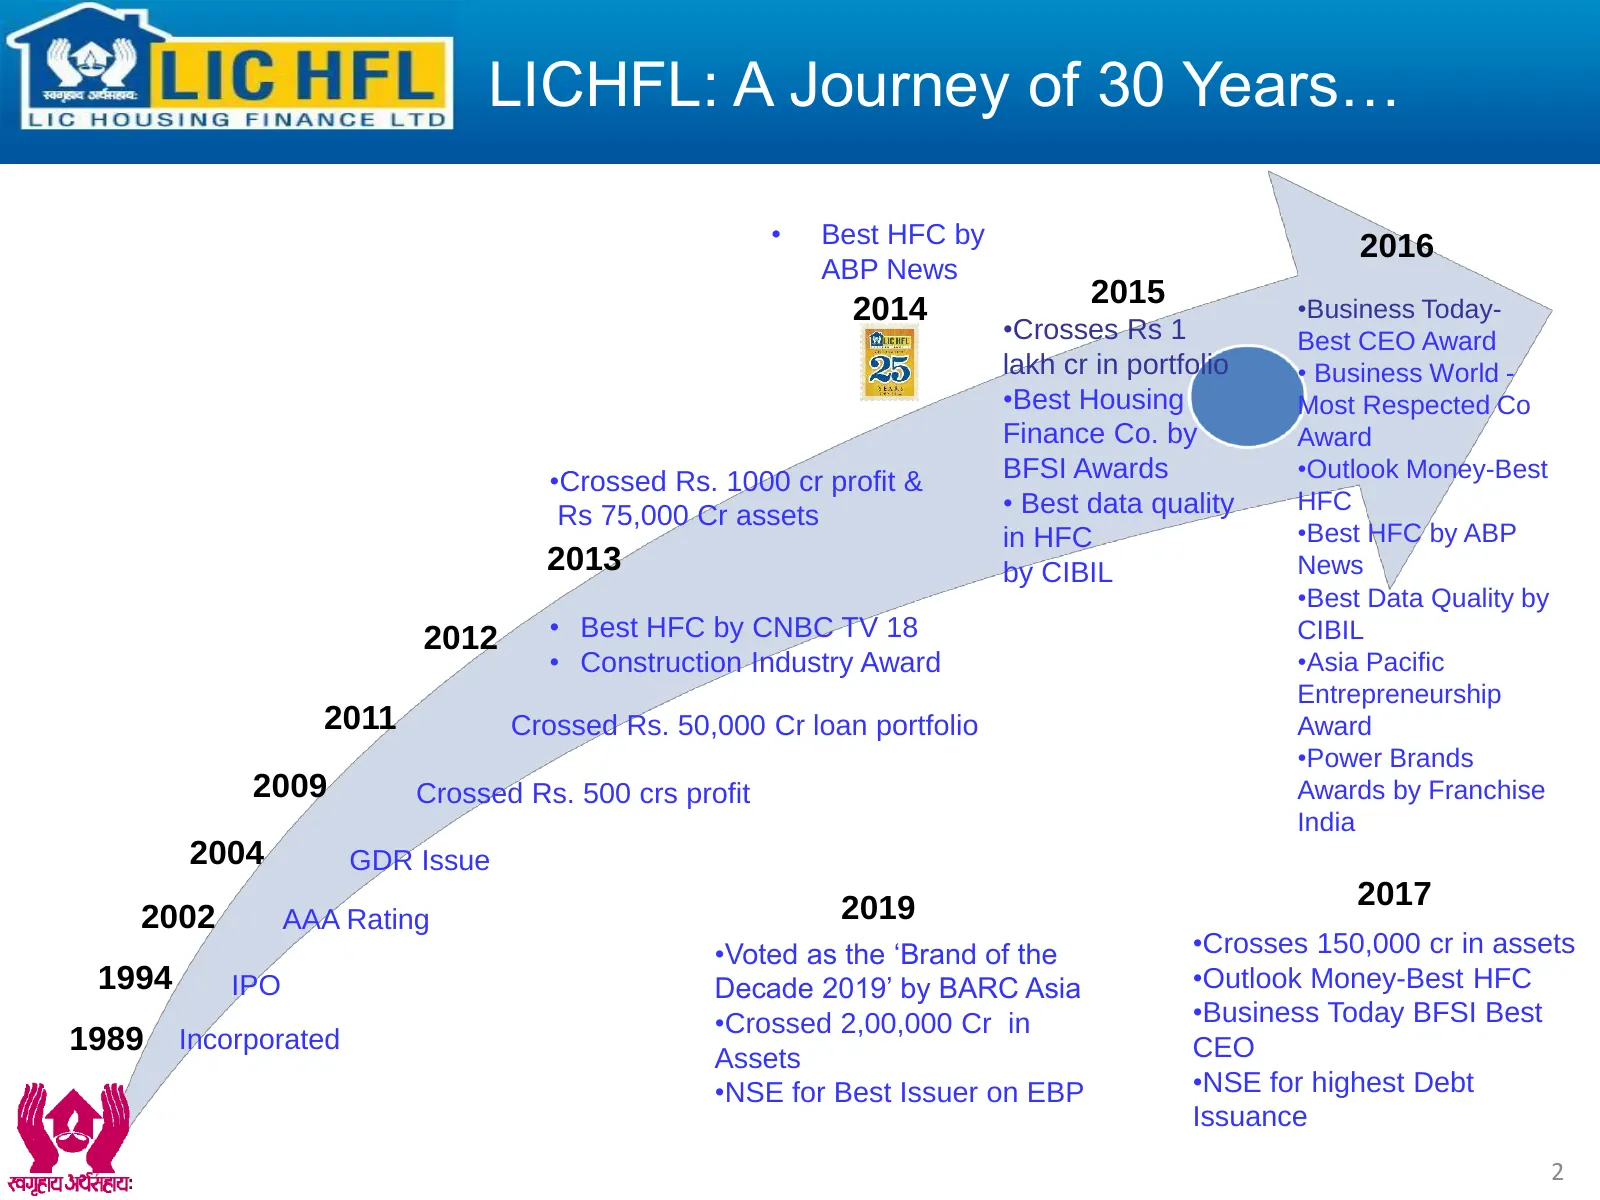
Slide 2: LICHFL: A Journey of 30 Years
LICHFL: A Journey of 30 Years… • Best HFC by 2016 ABP News 2015 •Business Today- 2014 •Crosses Rs 1 Best CEO Award lakh cr in portfolio • Business World - •Best Housing Most Respected Co Finance Co. by Award •Crossed Rs. 1000 cr profit & BFSI Awards •Outlook Money-Best Rs 75,000 Cr assets • Best dat
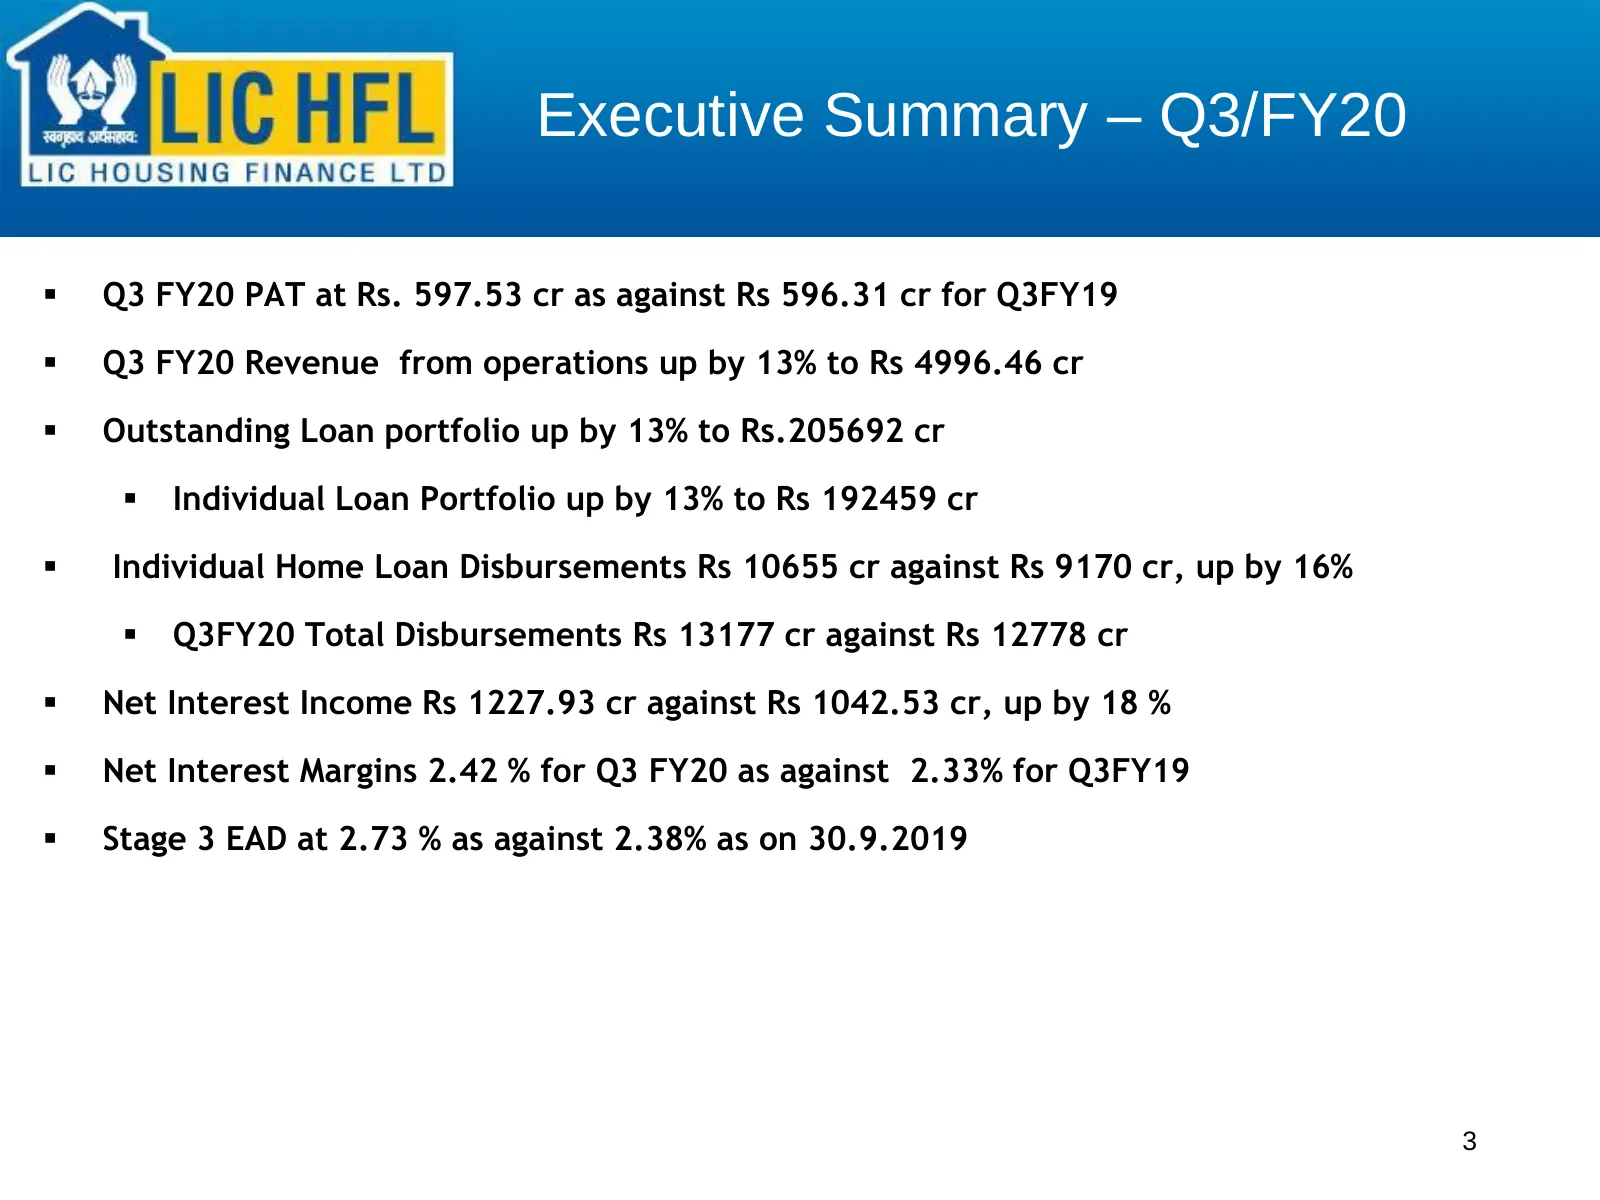
Slide 3: Executive Summary – Q3/FY20
Executive Summary – Q3/FY20 Q3 FY20 PAT at Rs. 597.53 cr as against Rs 596.31 cr for Q3FY19 Q3 FY20 Revenue from operations up by 13% to Rs 4996.46 cr Outstanding Loan portfolio up by 13% to Rs.205692 cr Individual Loan Portfolio up by 13% to Rs 192459 cr Individual Home Loan Disbursements
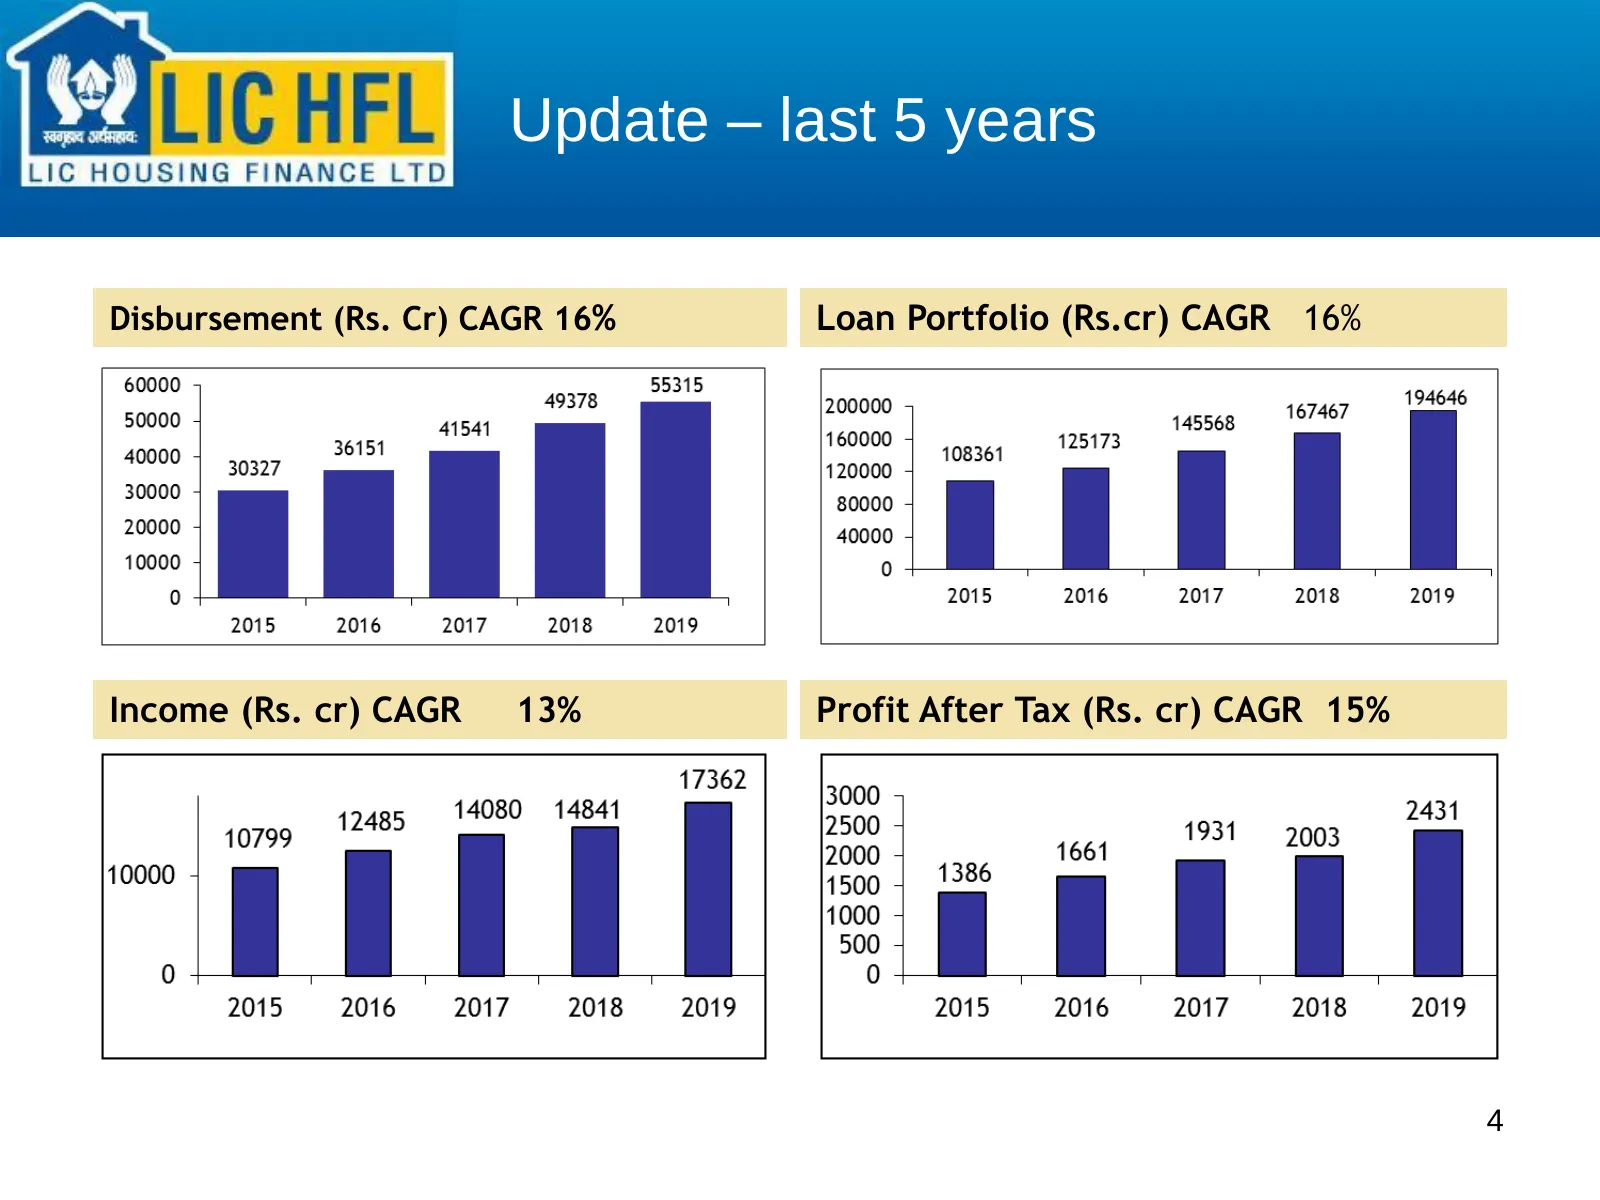
Slide 4: Update – last 5 years
Update – last 5 years Disbursement (Rs. Cr) CAGR 16% Loan Portfolio (Rs.cr) CAGR 16% Income (Rs. cr) CAGR 13% Profit After Tax (Rs. cr) CAGR 15% 4
Slide 5: Update – last 5 years
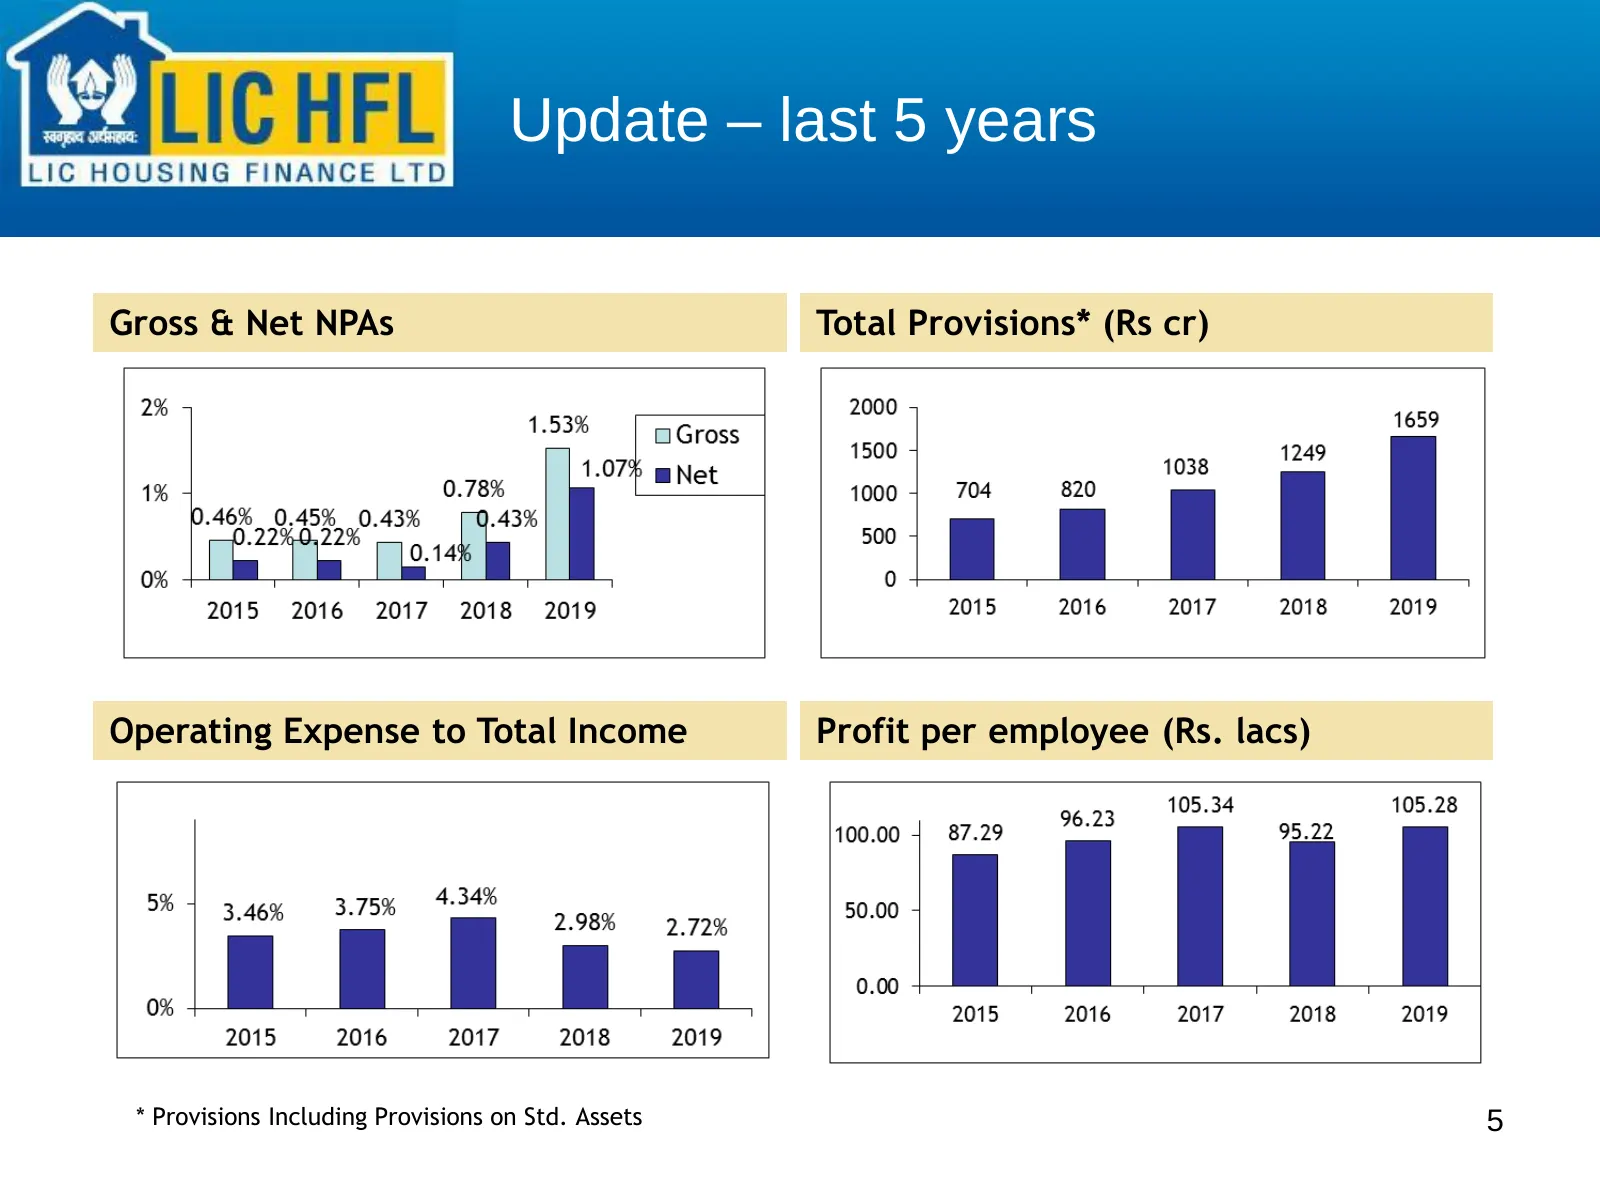
Update – last 5 years Gross & Net NPAs Total Provisions* (Rs cr) Operating Expense to Total Income Profit per employee (Rs. lacs) * Provisions Including Provisions on Std. Assets 5
Slide 6: Update – last 5 years
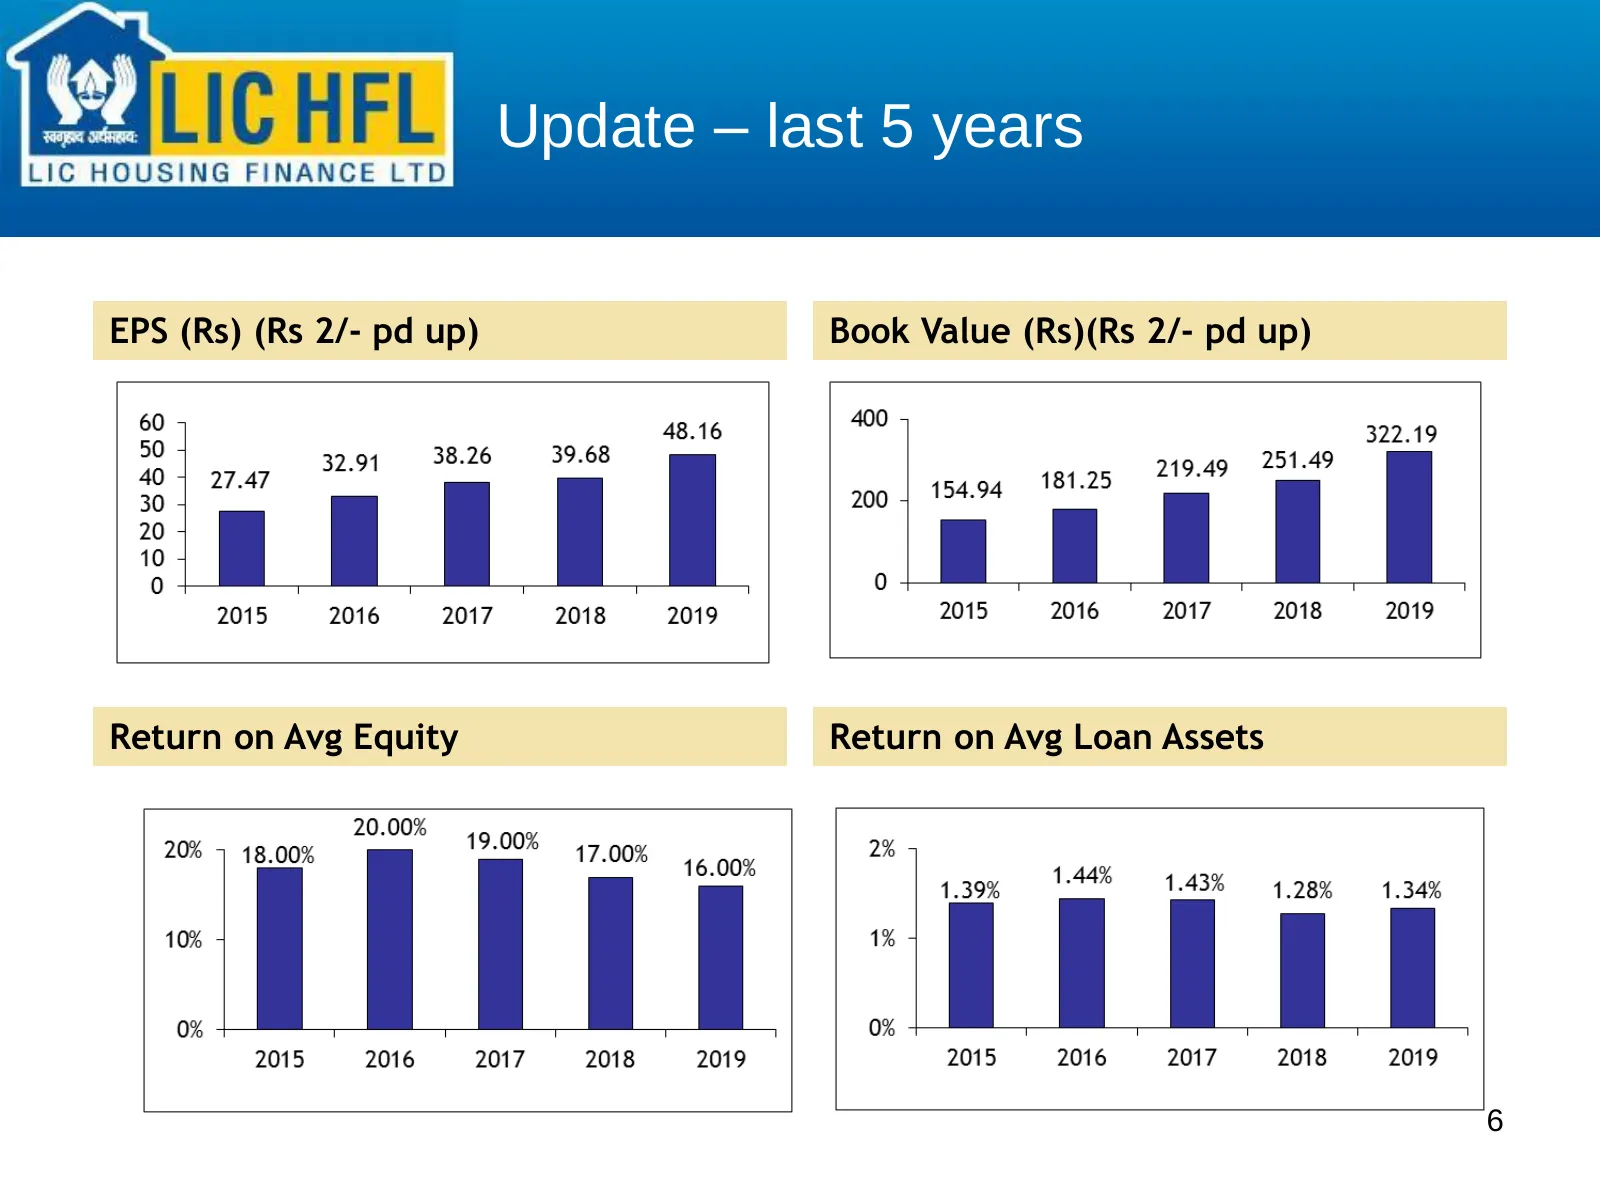
Update – last 5 years EPS (Rs) (Rs 2/- pd up) Book Value (Rs)(Rs 2/- pd up) Return on Avg Equity Return on Avg Loan Assets 6
Slide 7: Large geographic presence
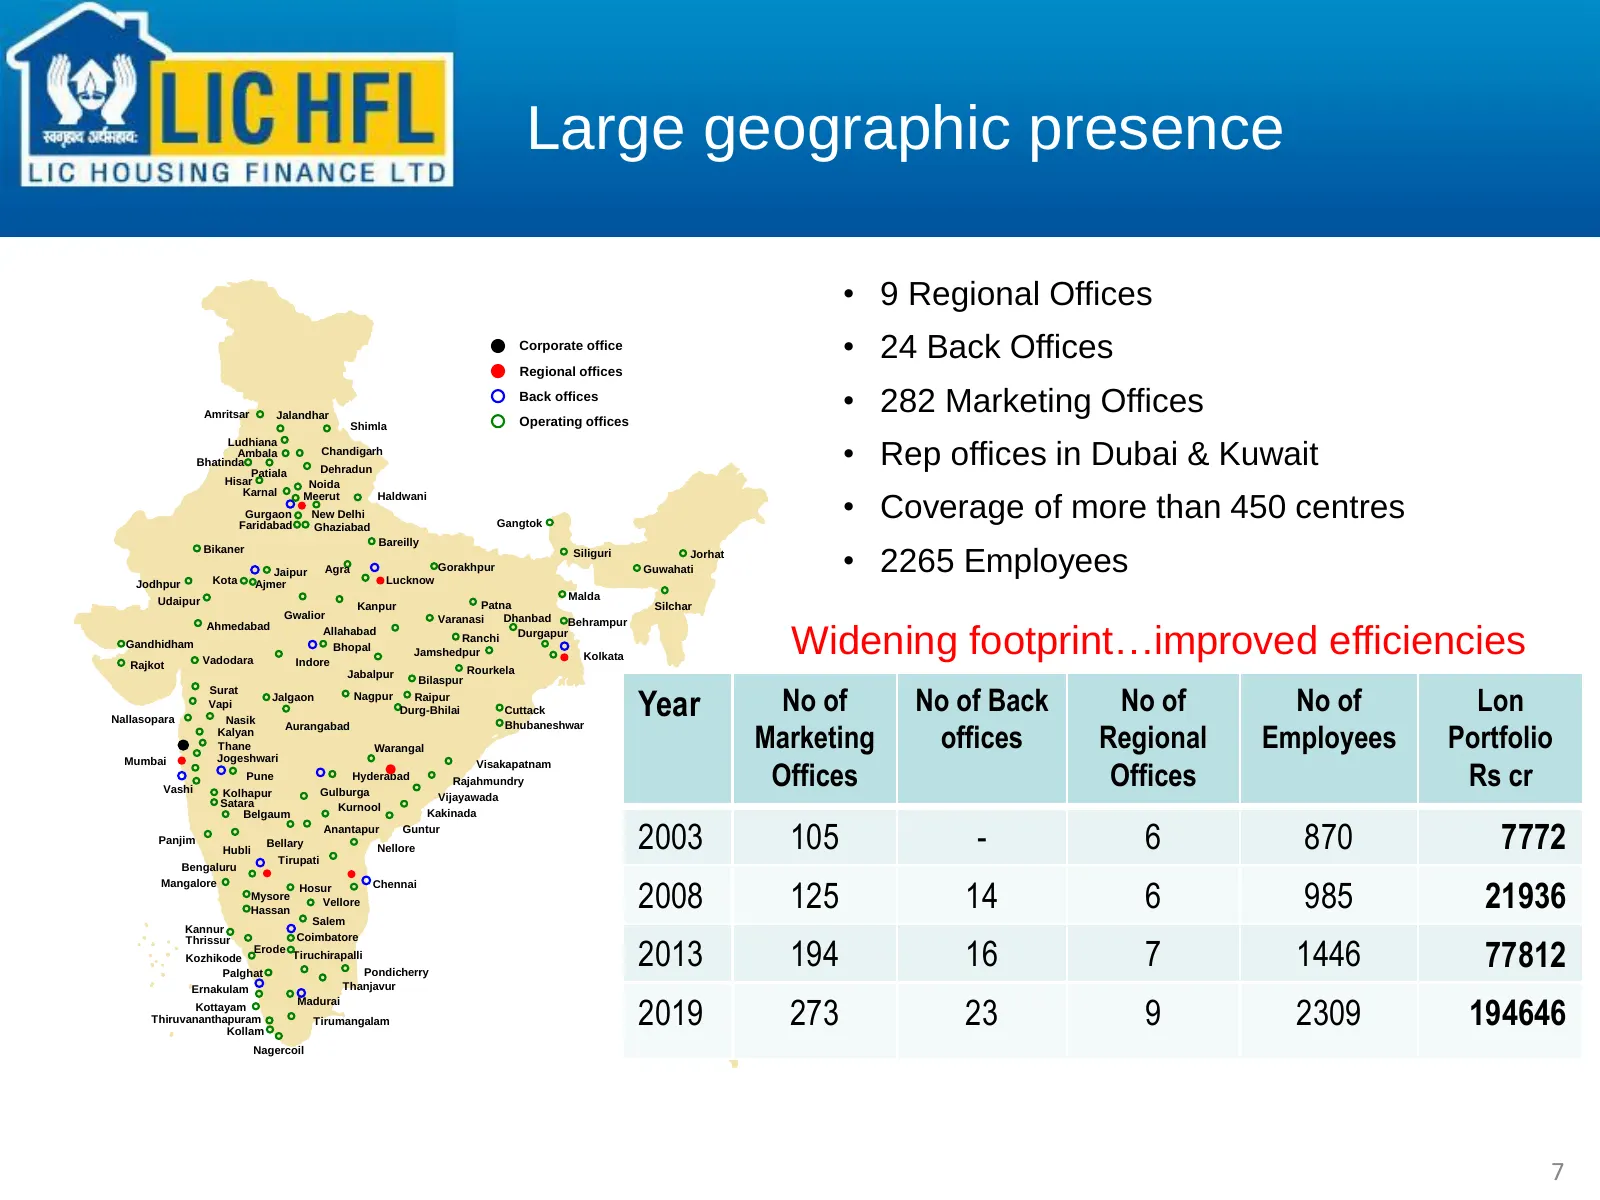
Large geographic presence • 9 Regional Offices Corporate office • 24 Back Offices Regional offices Amritsar Jalandhar Back offices Operating offices • 282 Marketing Offices Shimla • Rep offices in Dubai & Kuwait Ludhiana Ambala Chandigarh Bhatinda Patiala Dehradun Hisar Noida Karnal • Coverage of mo
Slide 8: Distribution Network
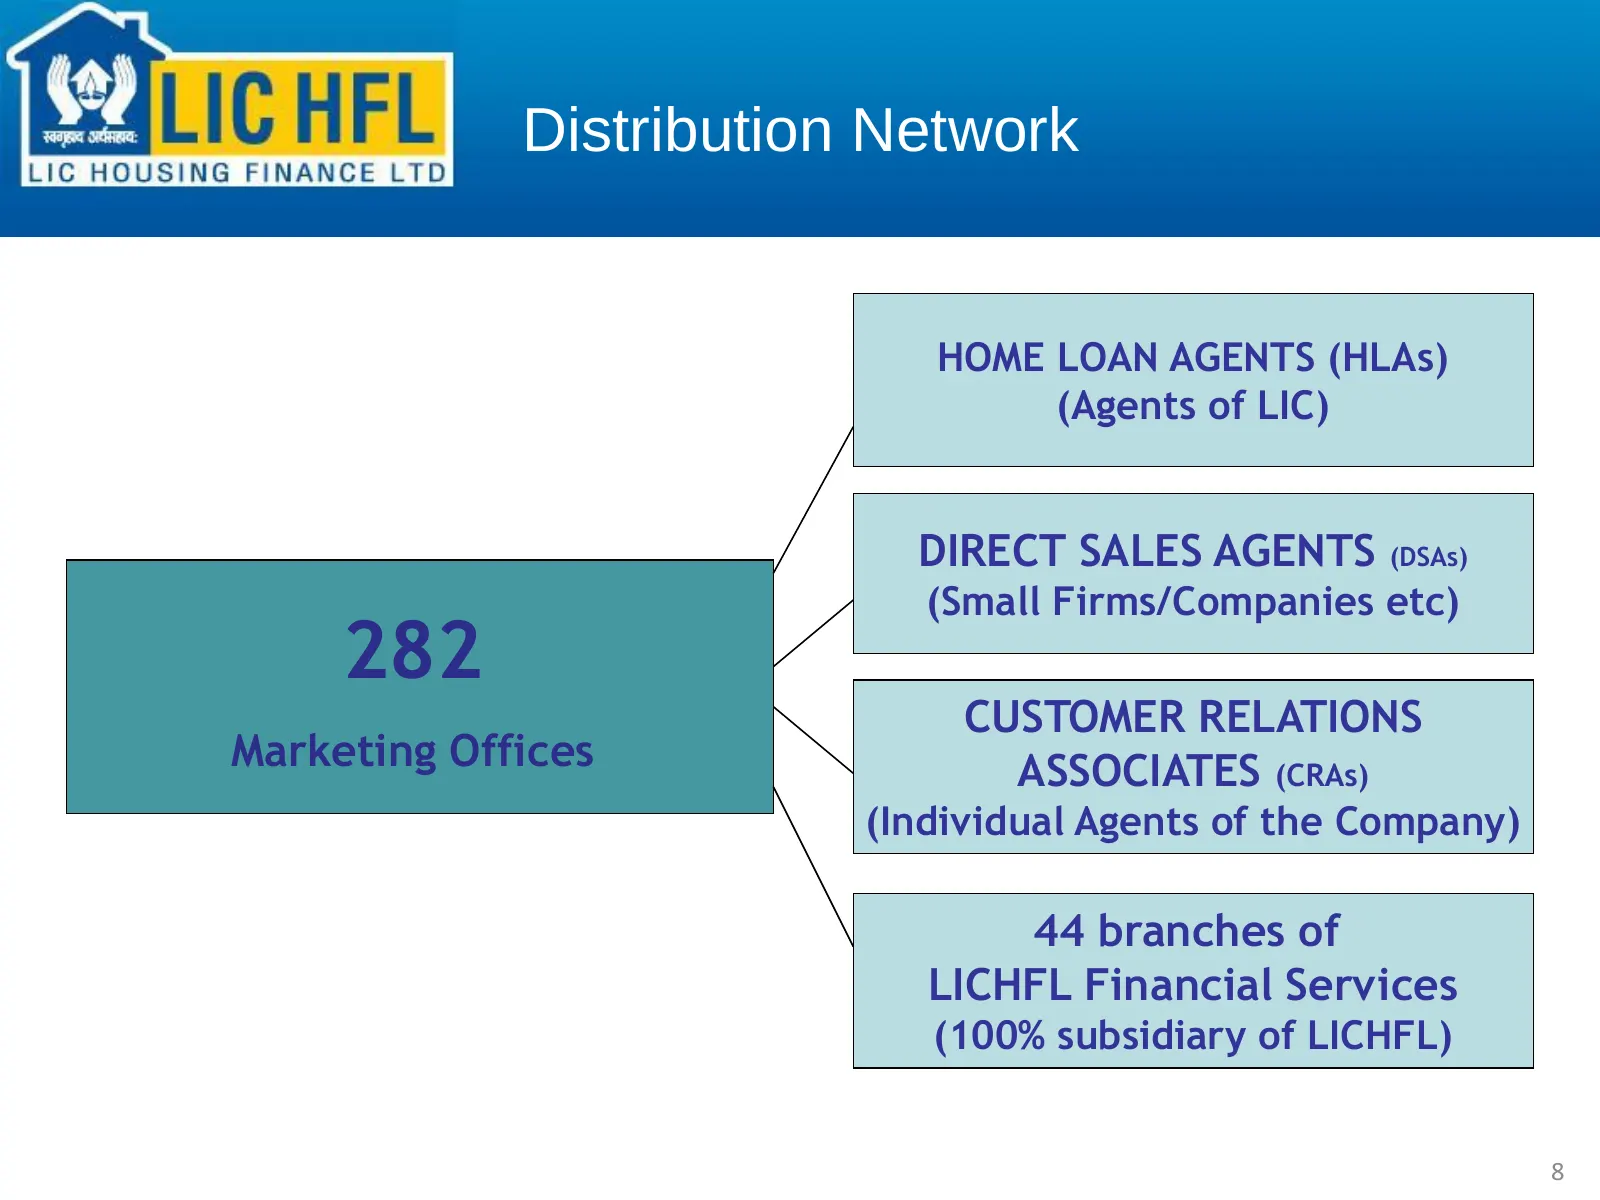
Distribution Network HOME LOAN AGENTS (HLAs) (Agents of LIC) DIRECT SALES AGENTS (DSAs) (Small Firms/Companies etc) 282 CUSTOMER RELATIONS Marketing Offices ASSOCIATES (CRAs) (Individual Agents of the Company) 44 branches of LICHFL Financial Services (100% subsidiary of LICHFL) 8
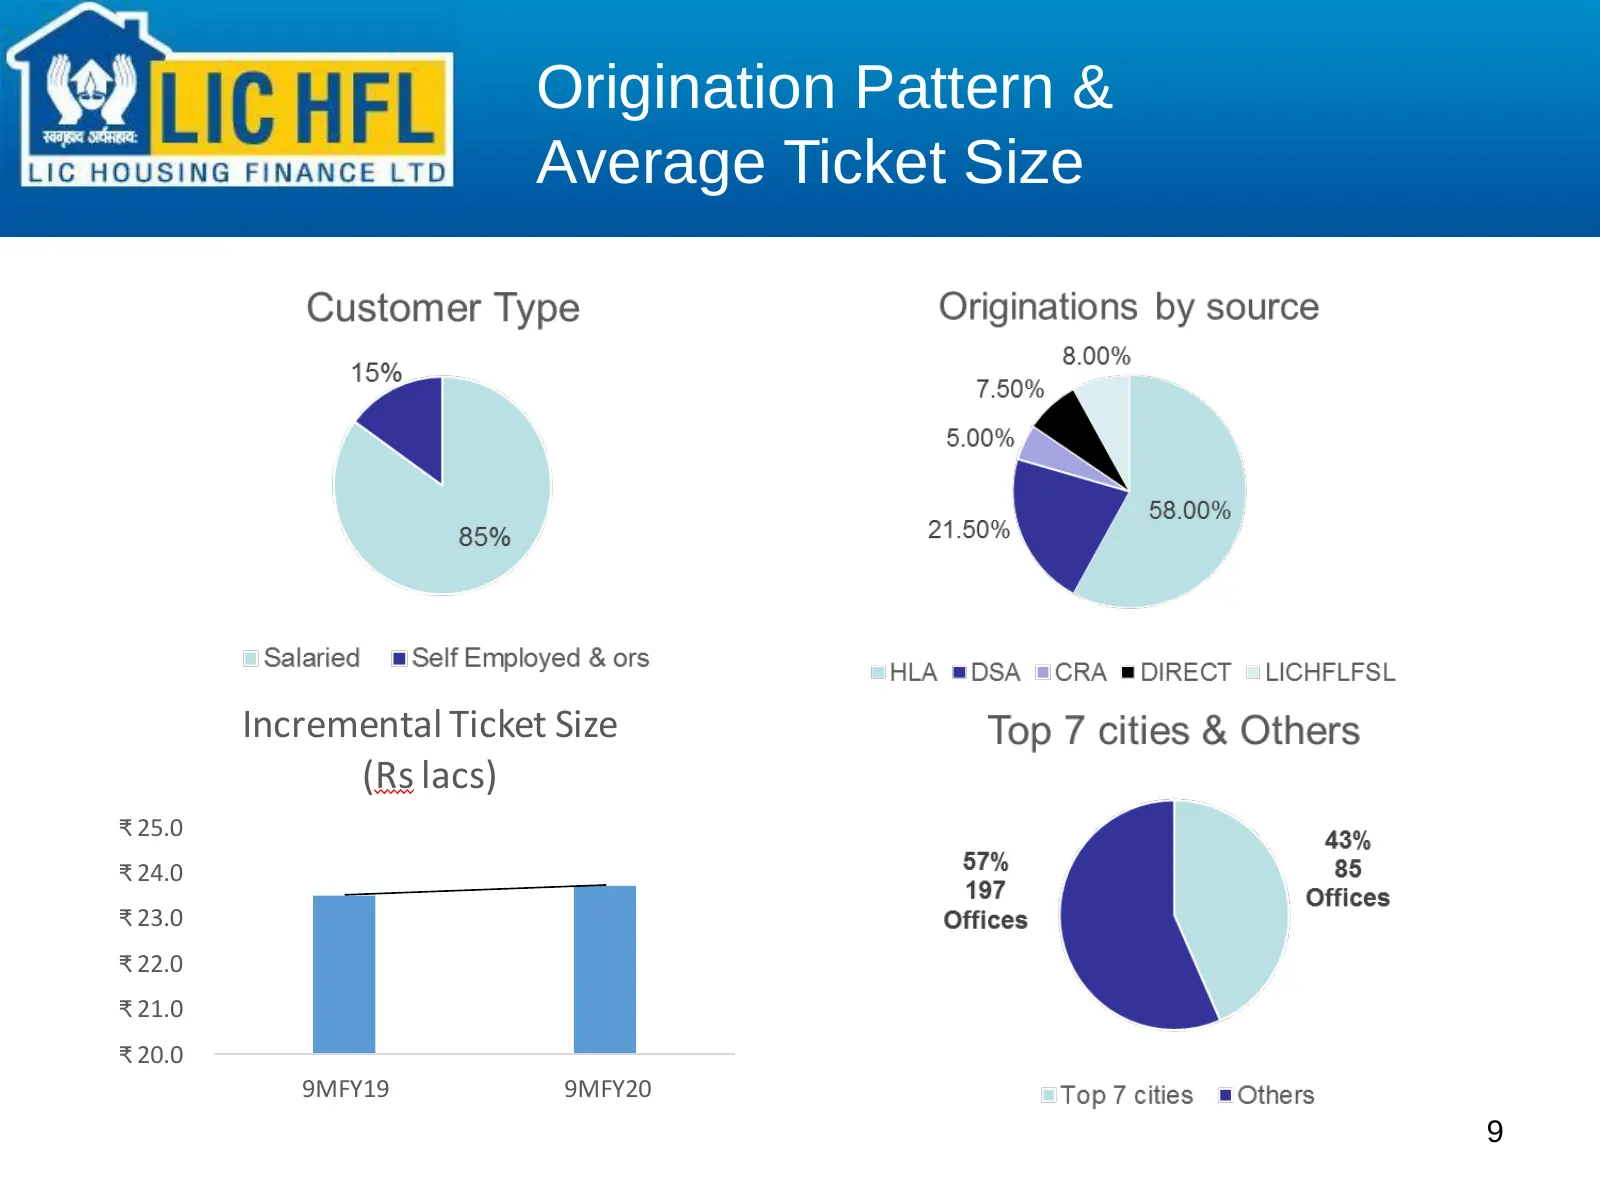
Slide 9: Origination Pattern & Average Ticket Size
Origination Pattern & Average Ticket Size Incremental Ticket Size (Rs lacs) ₹ 25.0 ₹ 24.0 ₹ 23.0 ₹ 22.0 ₹ 21.0 ₹ 20.0 9MFY19 9MFY20 9
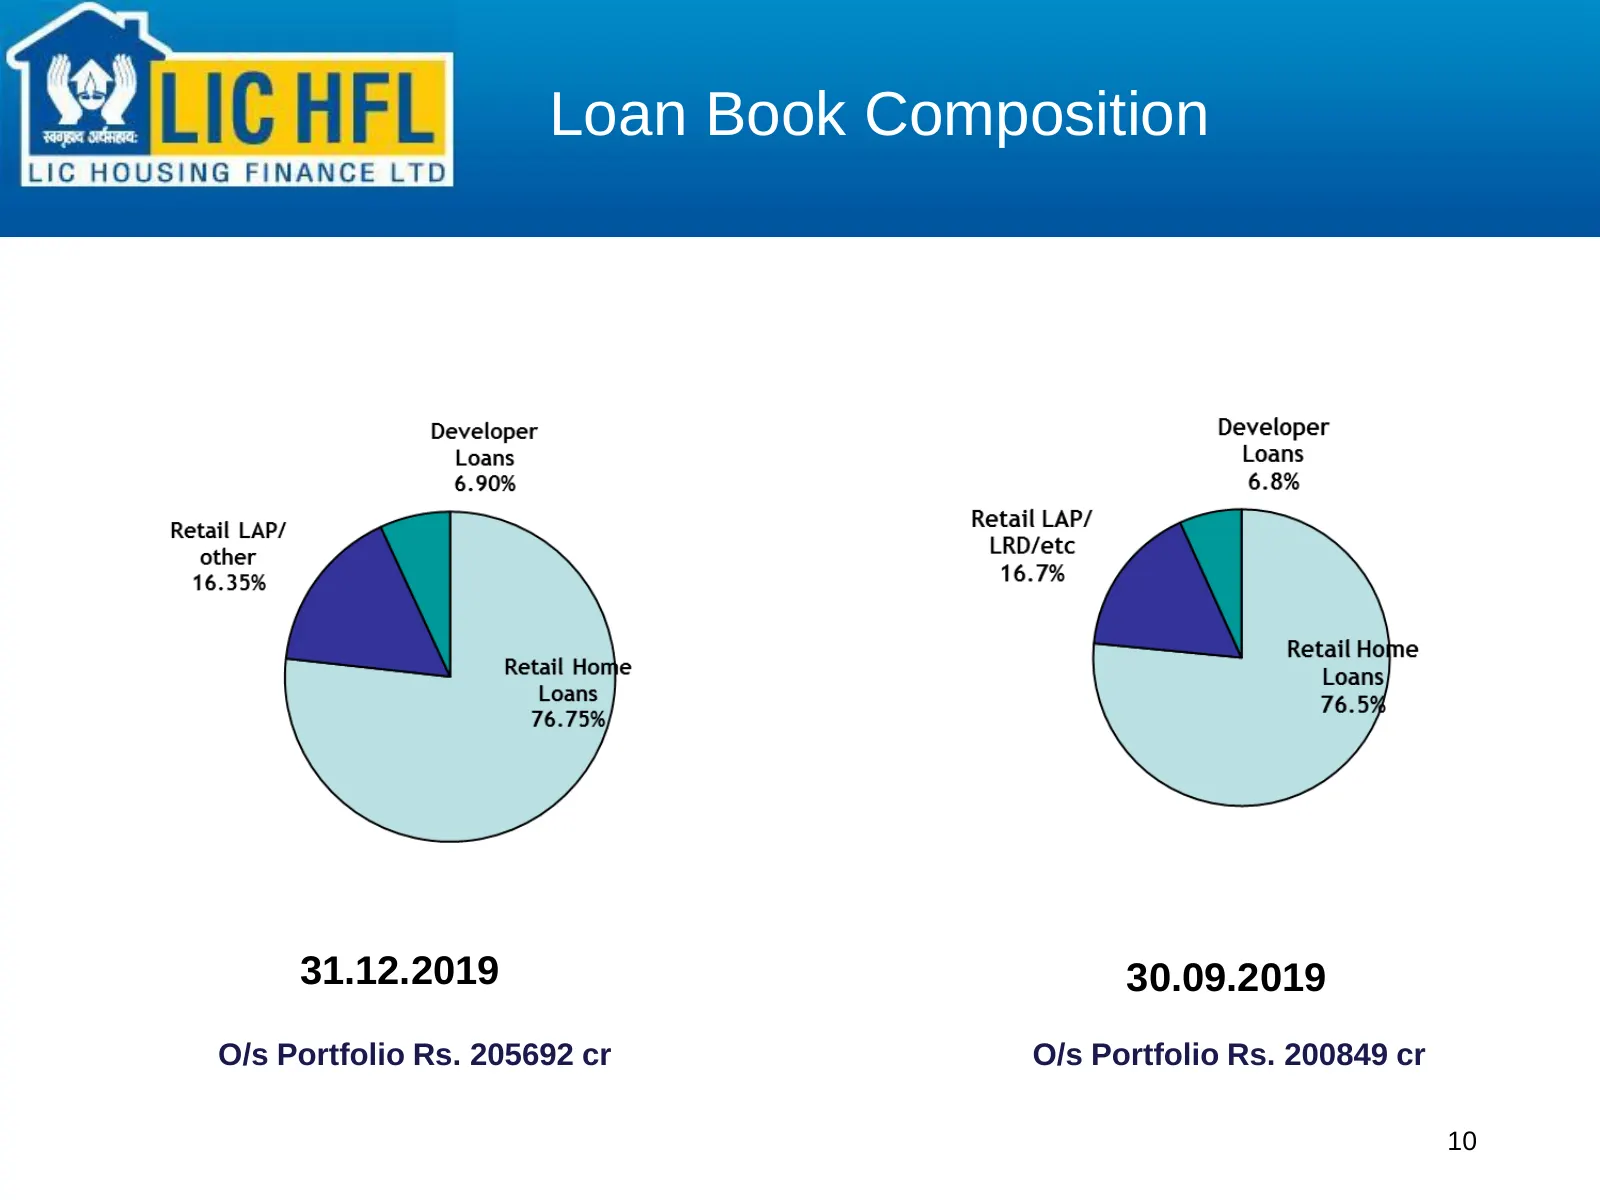
Slide 10: Loan Book Composition
Loan Book Composition 31.12.2019 30.09.2019 O/s Portfolio Rs. 205692 cr O/s Portfolio Rs. 200849 cr 10
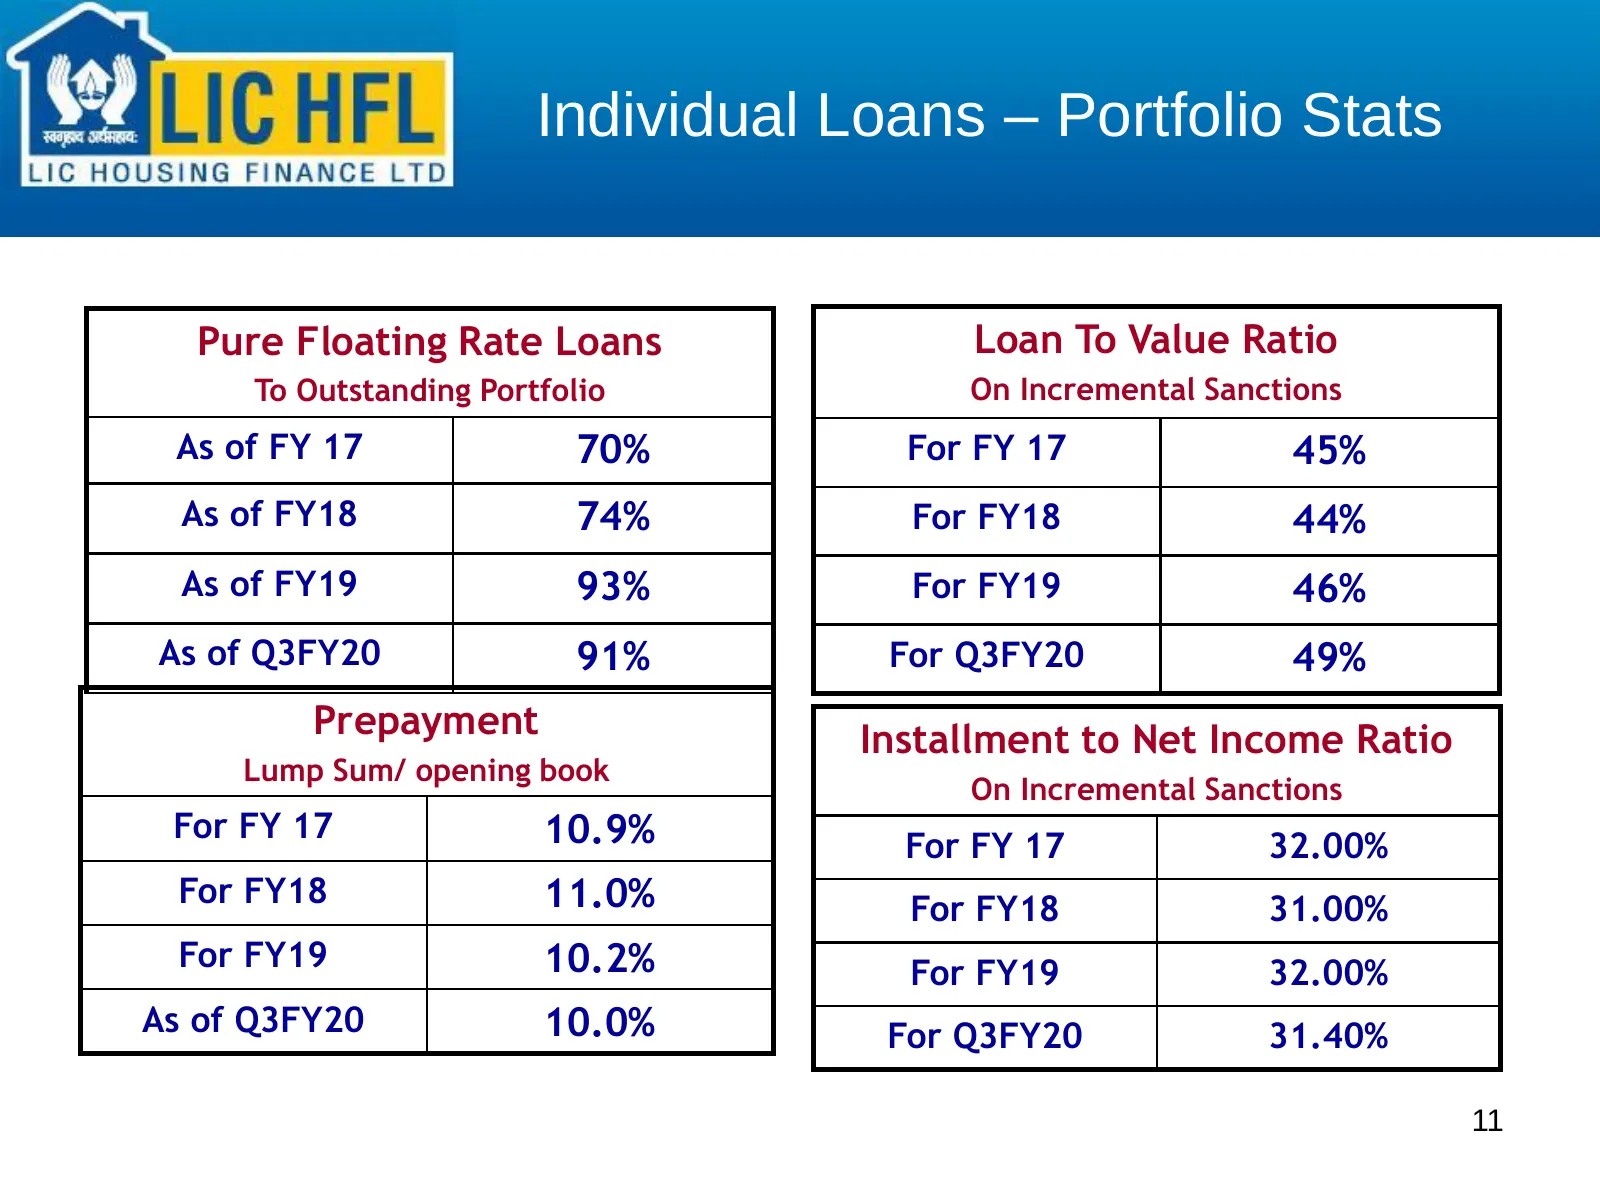
Slide 11: Individual Loans – Portfolio Stats
Individual Loans – Portfolio Stats Pure Floating Rate Loans Loan To Value Ratio To Outstanding Portfolio On Incremental Sanctions As of FY 17 70% For FY 17 45% As of FY18 74% For FY18 44% As of FY19 93% For FY19 46% As of Q3FY20 91% For Q3FY20 49% Prepayment Installment to Net Income Ratio Lump Sum/
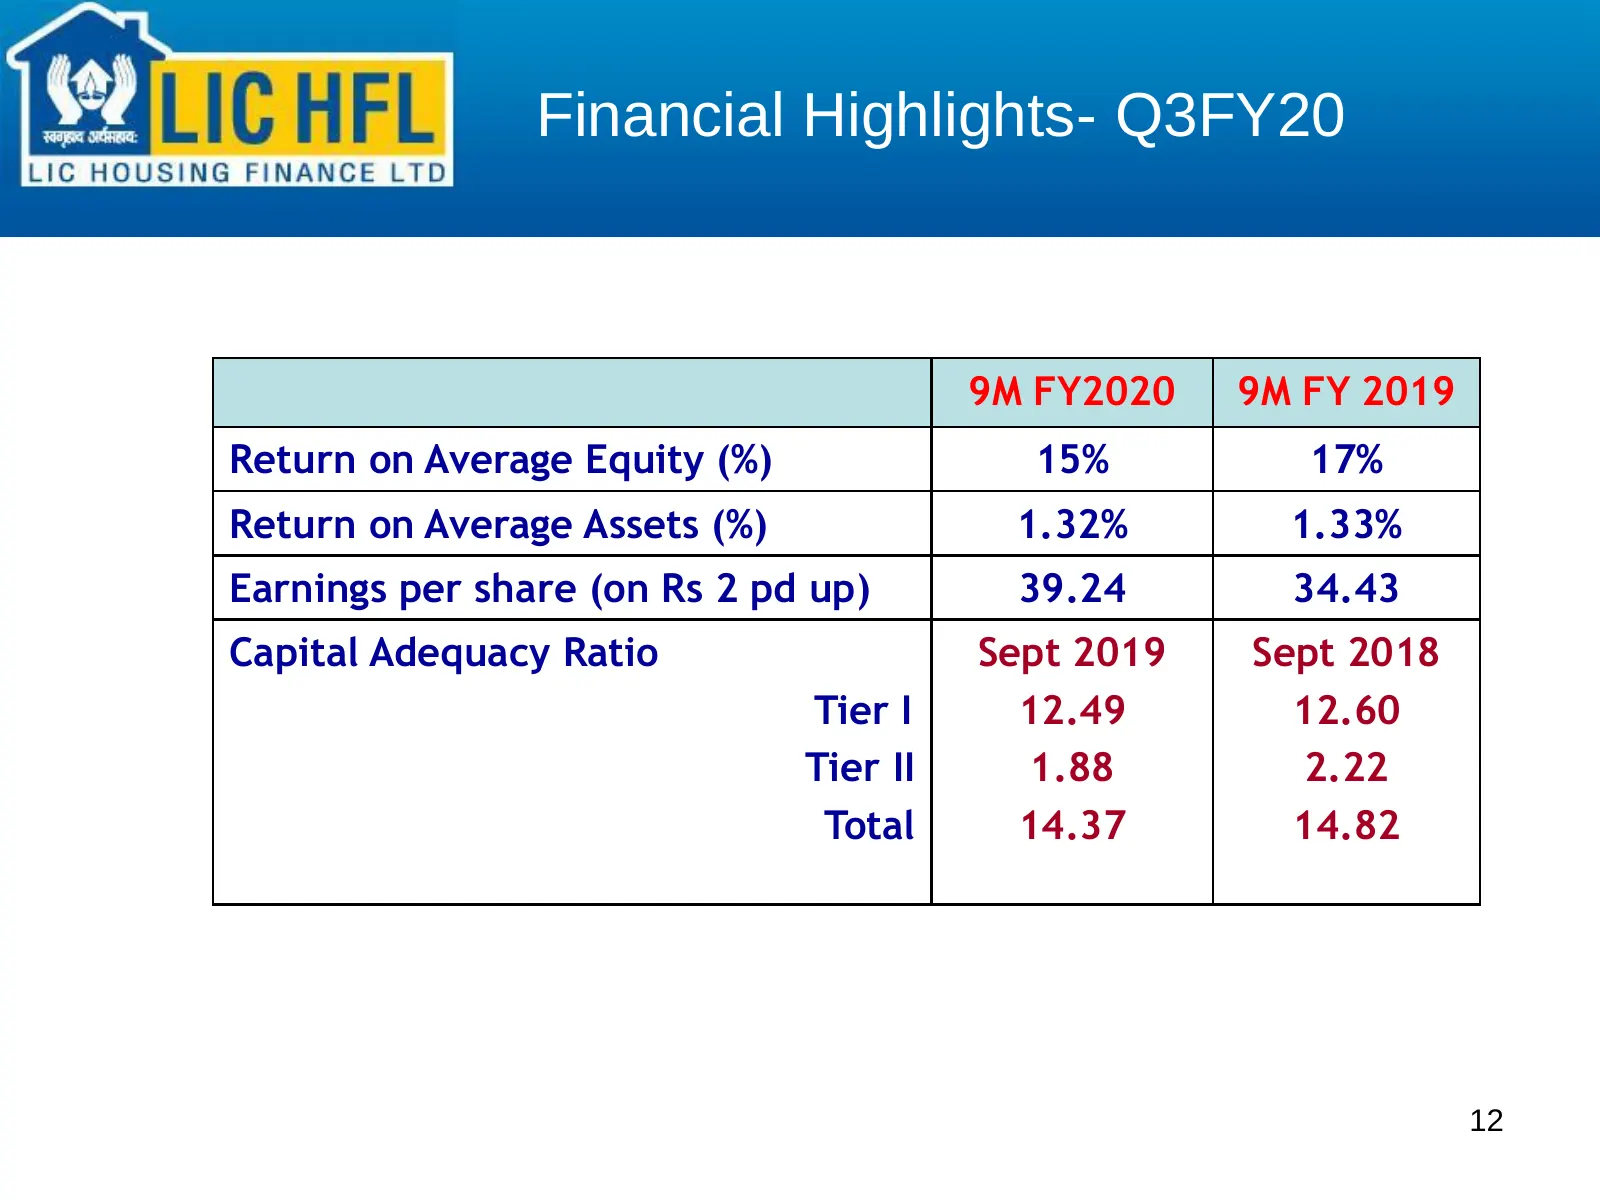
Slide 12: Financial Highlights- Q3FY20
Financial Highlights- Q3FY20 9M FY2020 9M FY 2019 Return on Average Equity (%) 15% 17% Return on Average Assets (%) 1.32% 1.33% Earnings per share (on Rs 2 pd up) 39.24 34.43 Capital Adequacy Ratio Sept 2019 Sept 2018 Tier I 12.49 12.60 Tier II 1.88 2.22 Total 14.37 14.82 12
Slide 13: Executive Summary-Q3/9MFY20
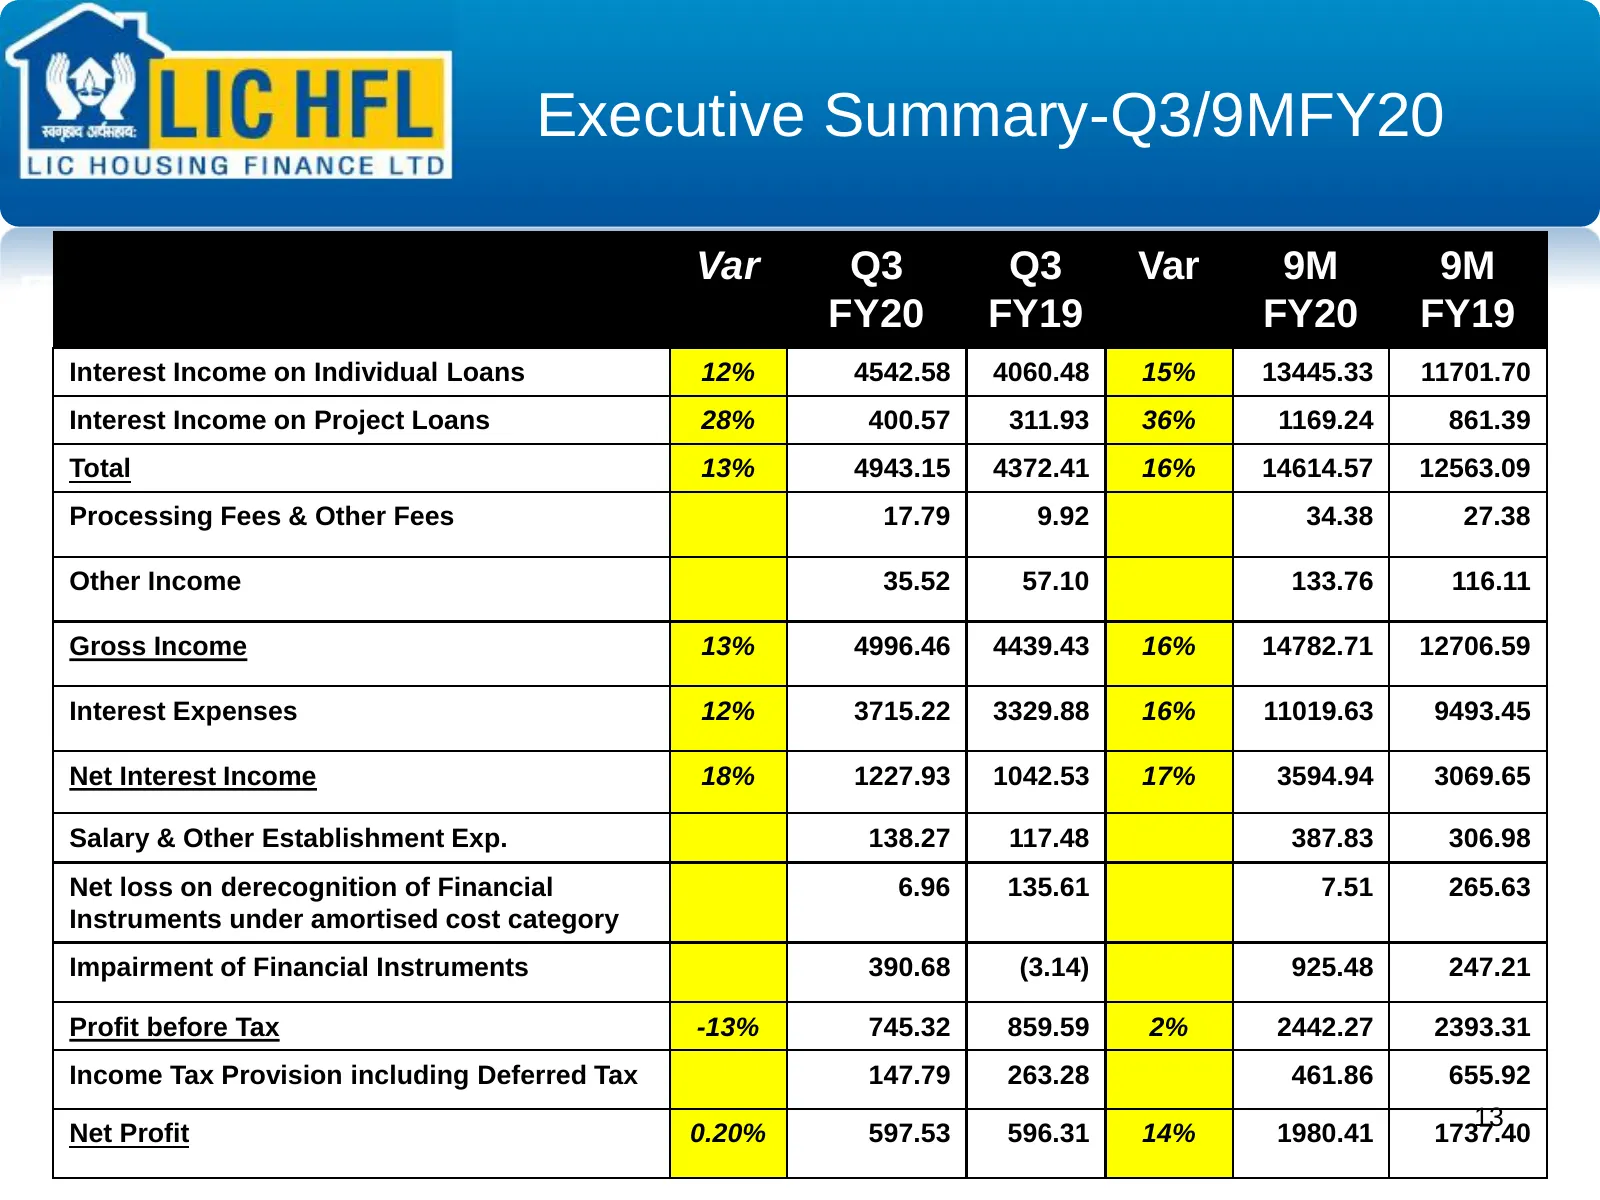
Executive Summary-Q3/9MFY20 Var Q3 Q3 Var 9M 9M FY20 FY19 FY20 FY19 Interest Income on Individual Loans 12% 4542.58 4060.48 15% 13445.33 11701.70 Interest Income on Project Loans 28% 400.57 311.93 36% 1169.24 861.39 Total 13% 4943.15 4372.41 16% 14614.57 12563.09 Processing Fees & Other Fees 17.79 9
Slide 14: Executive Summary-Q3/9MFY20
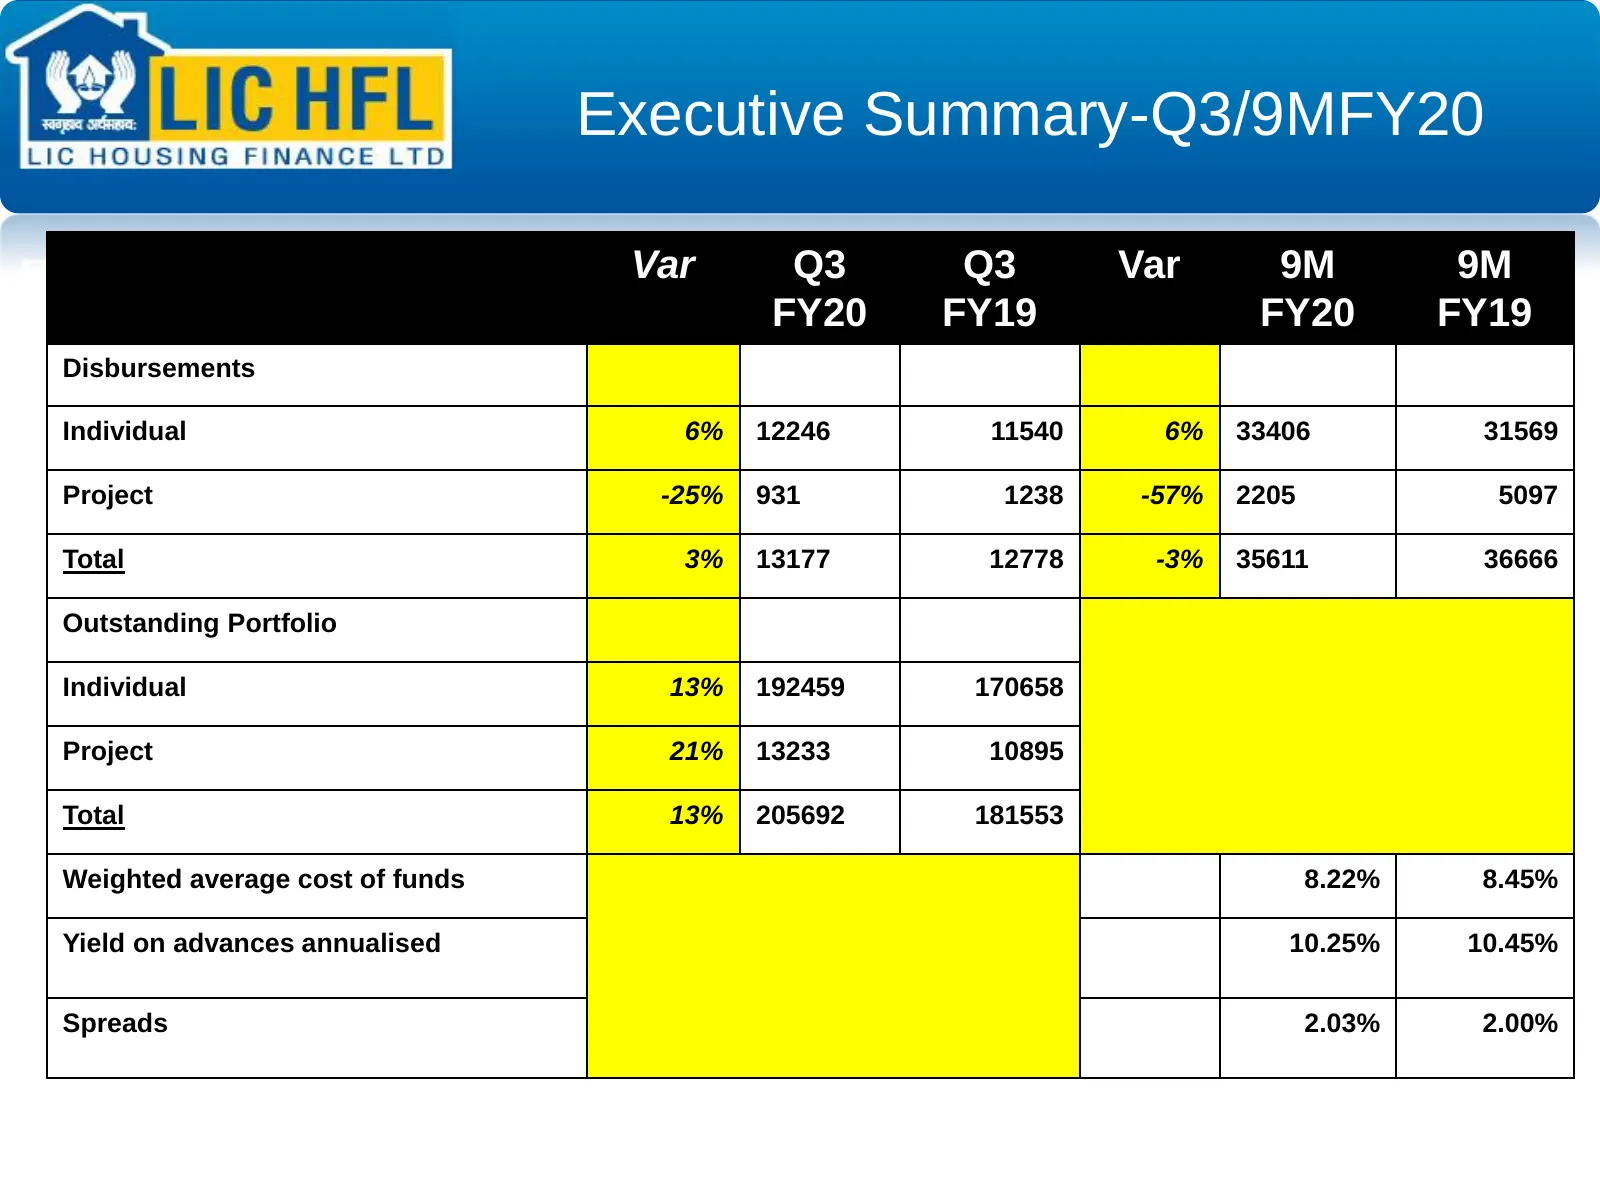
Executive Summary-Q3/9MFY20 Var Q3 Q3 Var 9M 9M FY20 FY19 FY20 FY19 Disbursements Individual 6% 12246 11540 6% 33406 31569 Project -25% 931 1238 -57% 2205 5097 Total 3% 13177 12778 -3% 35611 36666 Outstanding Portfolio Individual 13% 192459 170658 Project 21% 13233 10895 Total 13% 205692 181553 Weig
Slide 15: Liability Profile
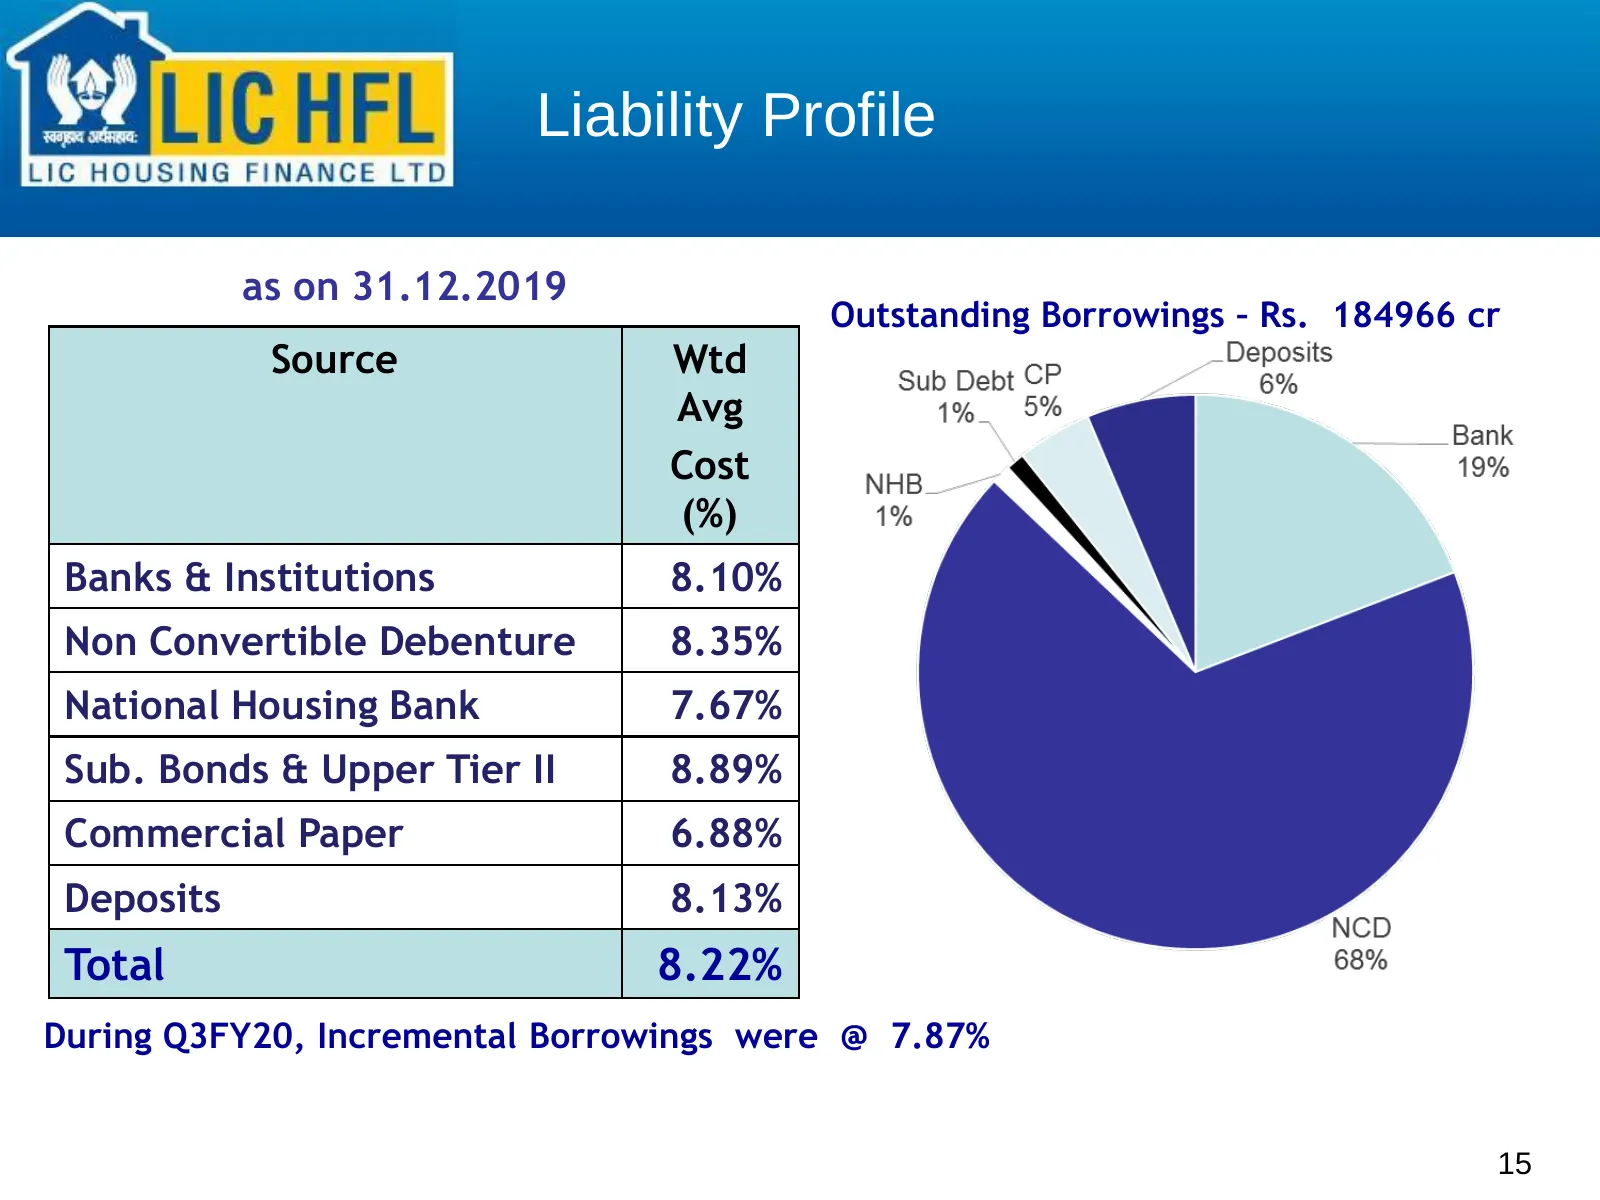
Liability Profile as on 31.12.2019 Outstanding Borrowings – Rs. 184966 cr Source Wtd Avg Cost (%) Banks & Institutions 8.10% Non Convertible Debenture 8.35% National Housing Bank 7.67% Sub. Bonds & Upper Tier II 8.89% Commercial Paper 6.88% Deposits 8.13% Total 8.22% During Q3FY20, Incremental Borro
Slide 16: Change in Liability Mix- last 3 yrs
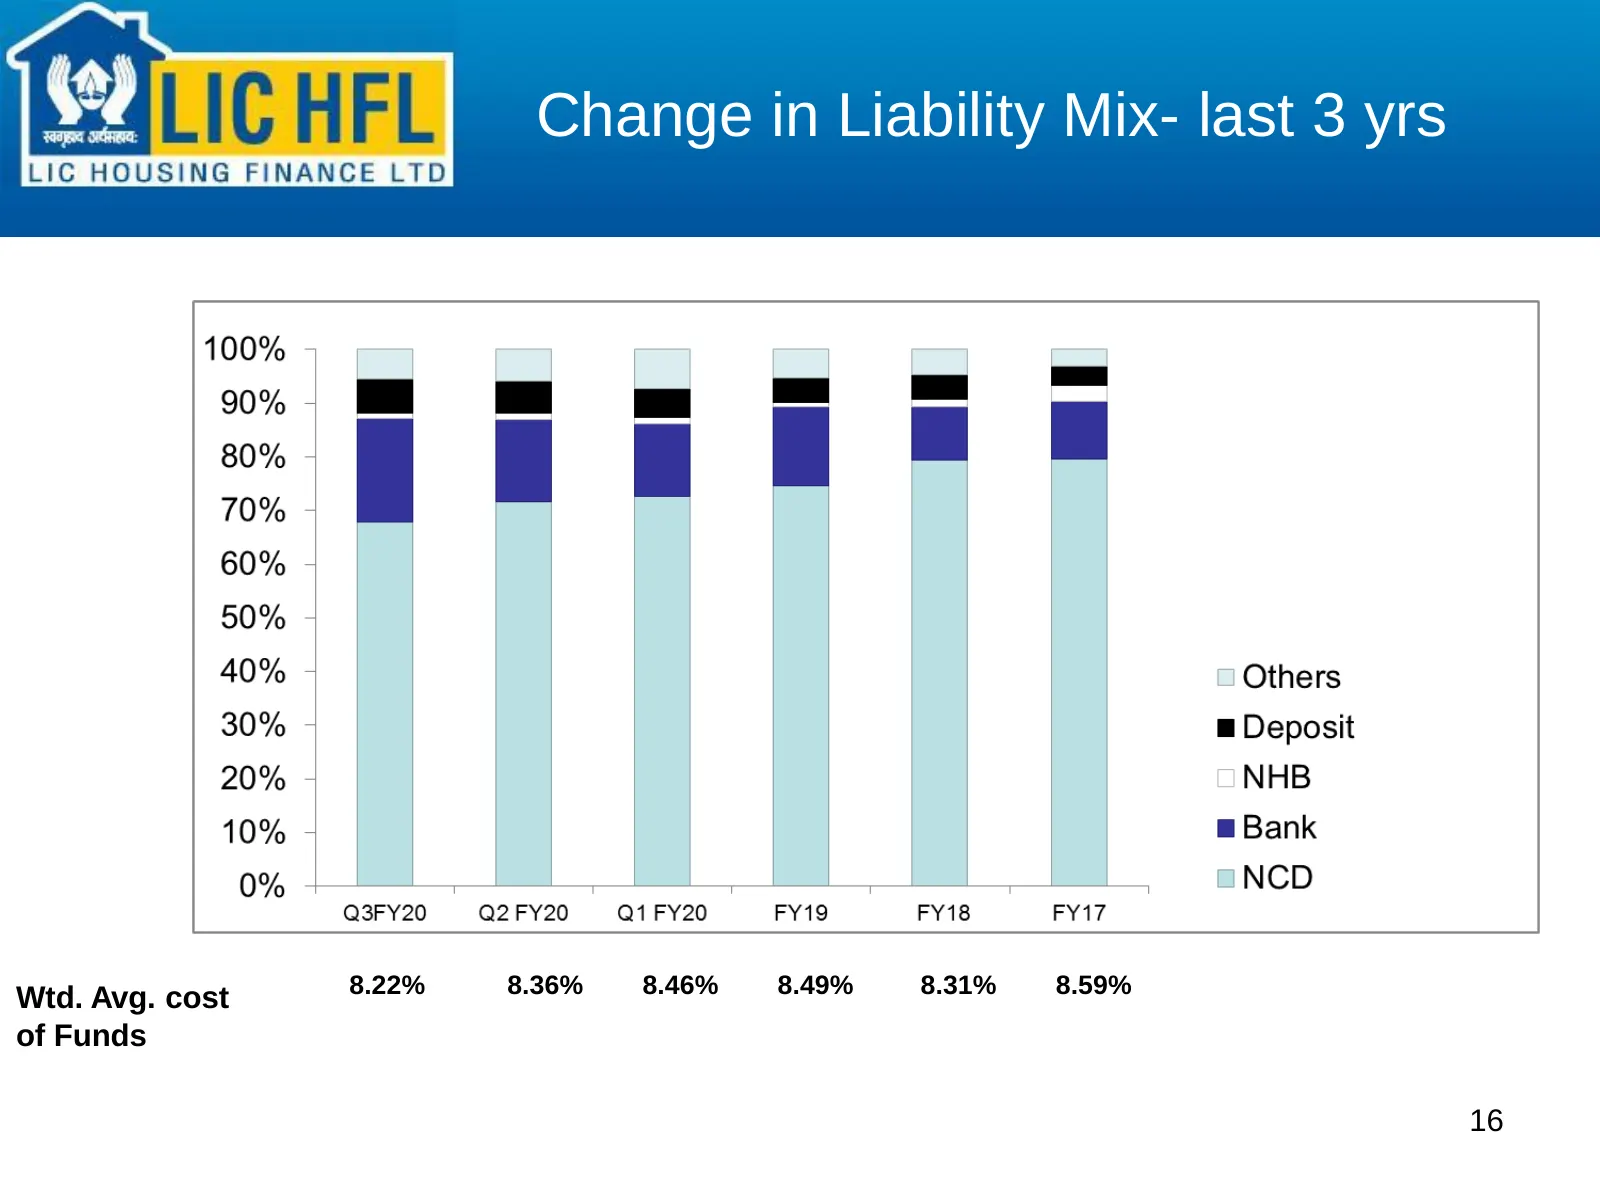
Change in Liability Mix- last 3 yrs Bank funding has reduced from 32% in FY12 to 25% in FY14. Retail Deposits increased to 2.2% 8.22% 8.36% 8.46% 8.49% 8.31% 8.59% Wtd. Avg. cost of Funds 16
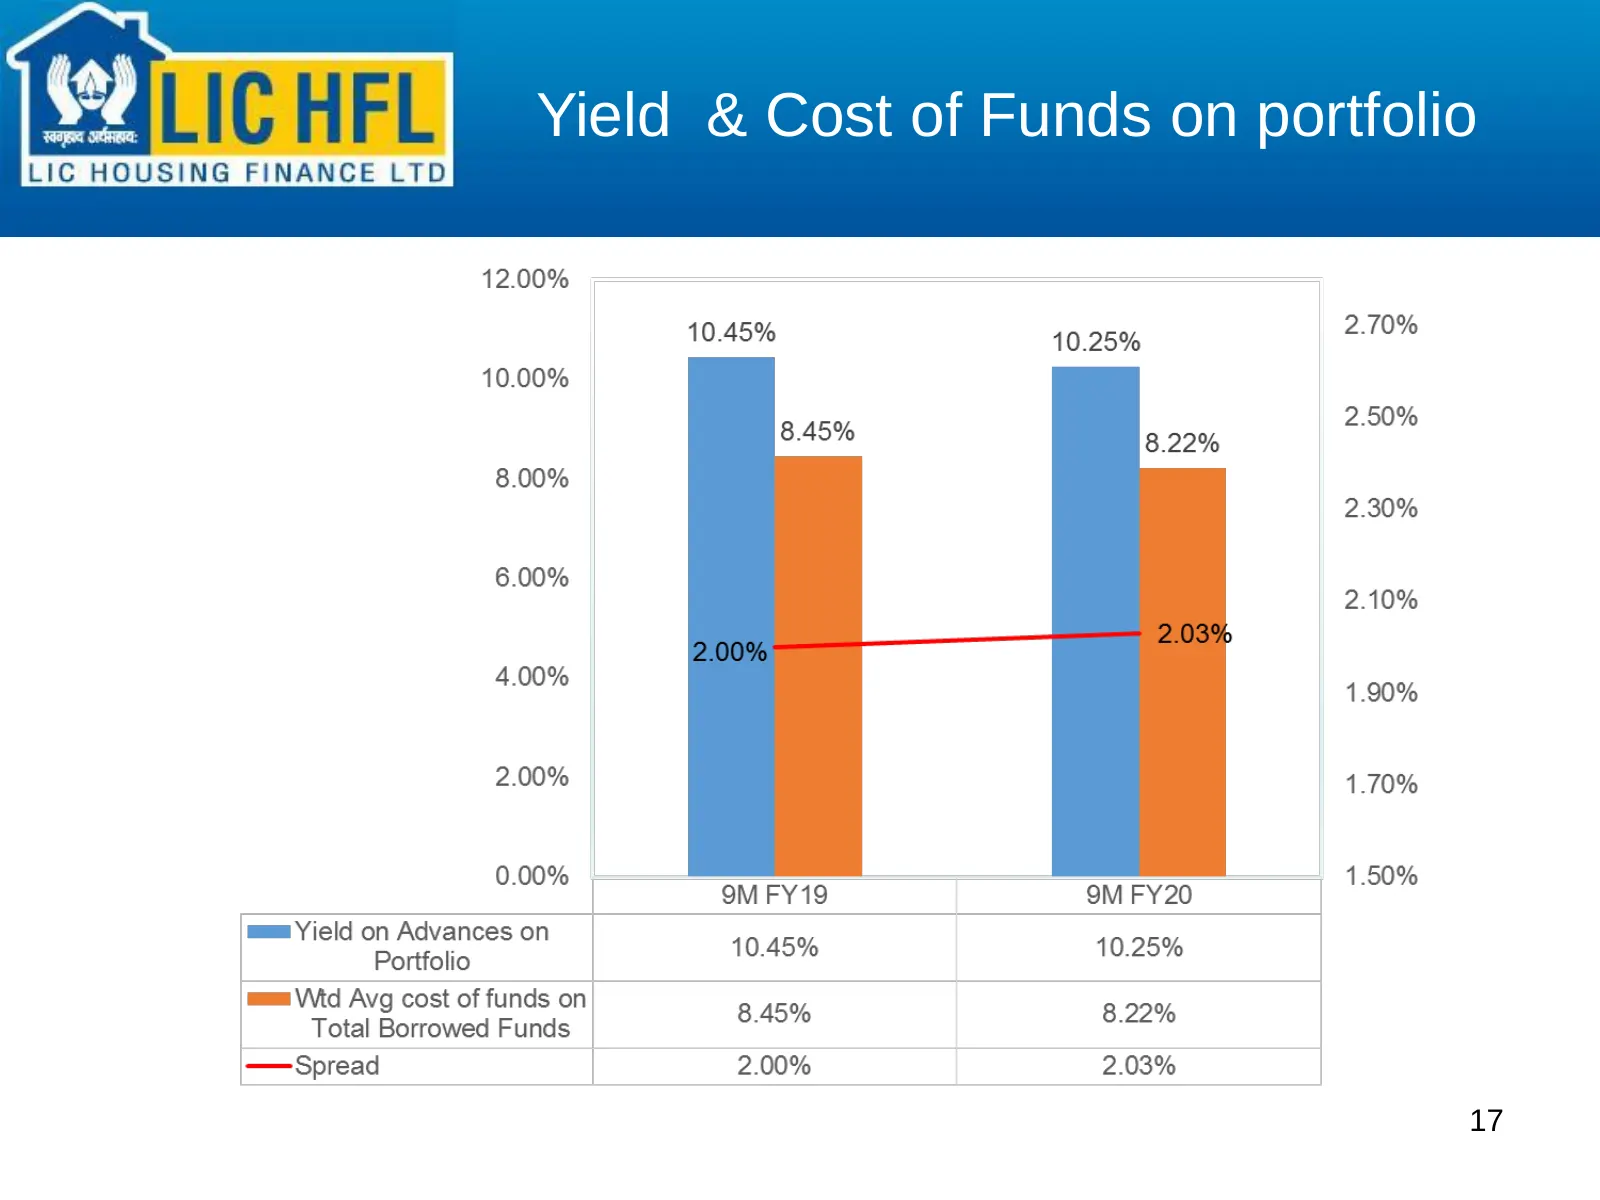
Slide 17: Yield & Cost of Funds on portfolio
Yield & Cost of Funds on portfolio 17
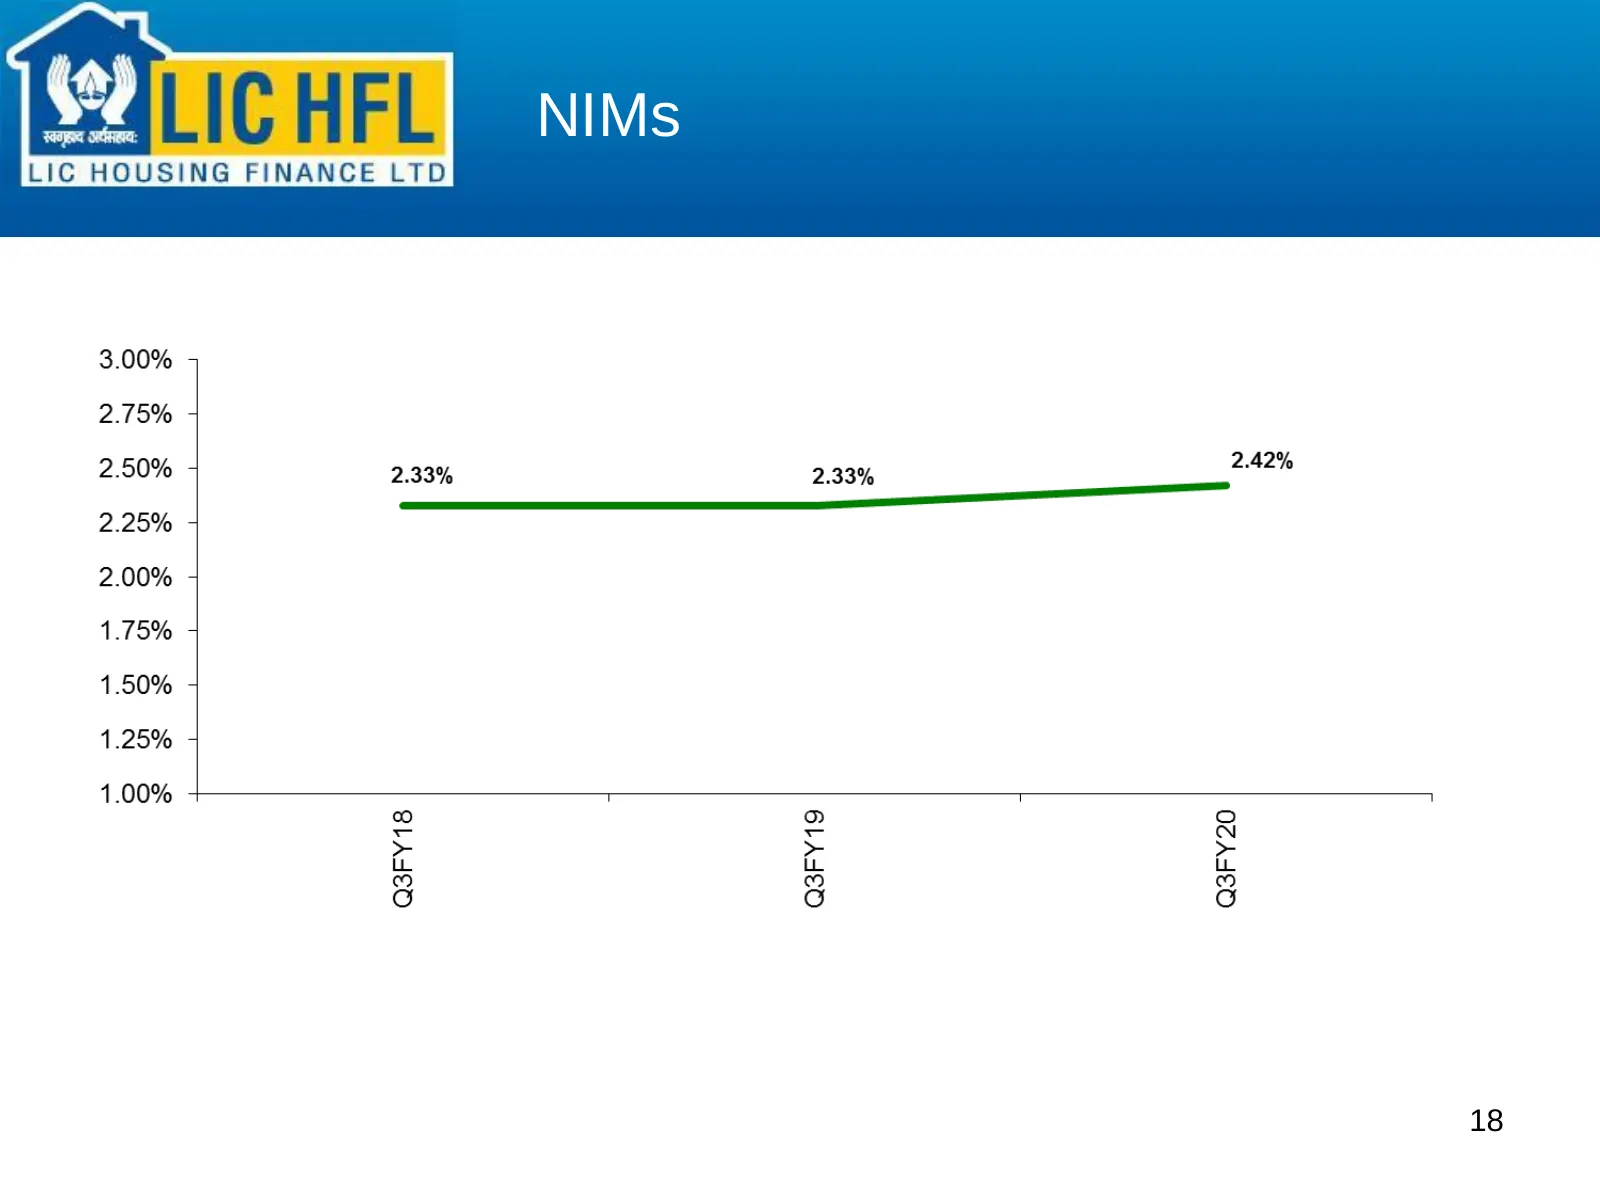
Slide 18: NIMs
7 ape orl, LIC HOUSING FINANCE LTD 3.00% 5 2.75% + 2.50% + 2.33% 2.33% 24% 2.25% + 2.00% + 1.75% + 1.50% + 1.25% + 1.00% T 1 1 Q3FY18 Q3FY19 Q3FY20 18
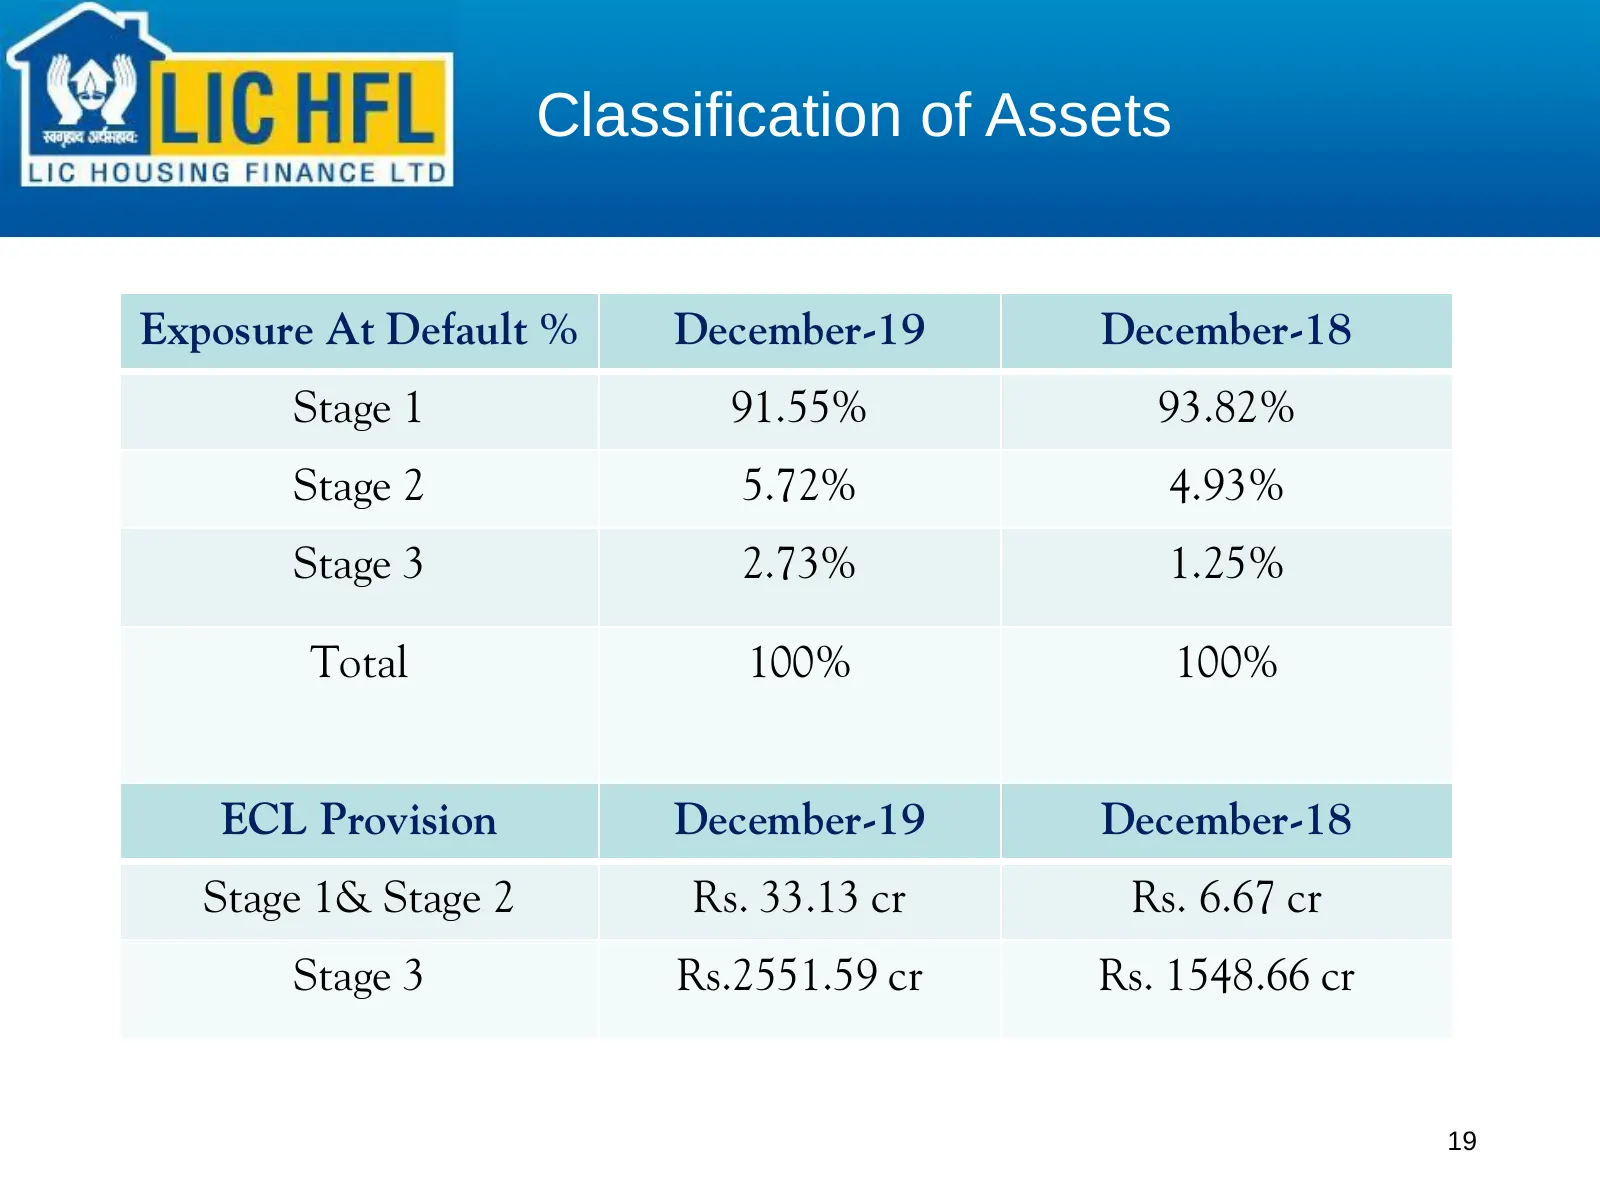
Slide 19: Classification of Assets
Classification of Assets Exposure At Default % December-19 December-18 Stage 1 91.55% 93.82% Stage 2 5.72% 4.93% Stage 3 2.73% 1.25% Total 100% 100% ECL Provision December-19 December-18 Stage 1& Stage 2 Rs. 33.13 cr Rs. 6.67 cr Stage 3 Rs.2551.59 cr Rs. 1548.66 cr 19
Slide 20: Thank you
Thank you DISCLAIMER This presentation is made purely for information. We have attempted to provide relevant information which we believe will help in knowing the Company. The users may use their own judgment and are advised to make their own calculations before deciding on any matter based on the i
Source: Internet Archive copy of lichousing.com
More decks from LIC Housing Finance Ltd
 Q2 FY2027 Earnings Presentation23 slides · Oct 30, 2026
 Q1 FY2027 Earnings Presentation23 slides · Jul 30, 2026
 Q4 FY2026 Earnings Presentation25 slides · May 13, 2026
 Q3 FY2026 Earnings Presentation23 slides · Jan 30, 2026
 Q1 FY2027 Earnings Presentation22 slides · 2026
 Q4 FY2026 Earnings Presentation24 slides · 2026