American Railcar Industries Inc
American Railcar Industries — Investor Presentation (February 2016)
33 slides from American Railcar Industries's investor presentation, Feb 4, 2016
Slide 1: American Railcar Industries, Inc. Investor Presentation
American Railcar Industries, Inc. INVESTOR PRESENTATION — FEBRUARY 2016 INVESTOR CONTACT: (636) 940-6000 WEBSITE: AMERICANRAILCAR.COM
Slide 2: Forward Looking Disclaimer
© Forward Looking Disclaimer Sate Harbor Statement without limitation, statements benefits from our employees’ input, trends related to railcar shipments for direct sale versus lease, our ee SU gtien CHIC TSI) CIEE sa conta aes plans, 7 railcars, customers. lease fleet, , inesses, the mix of for our
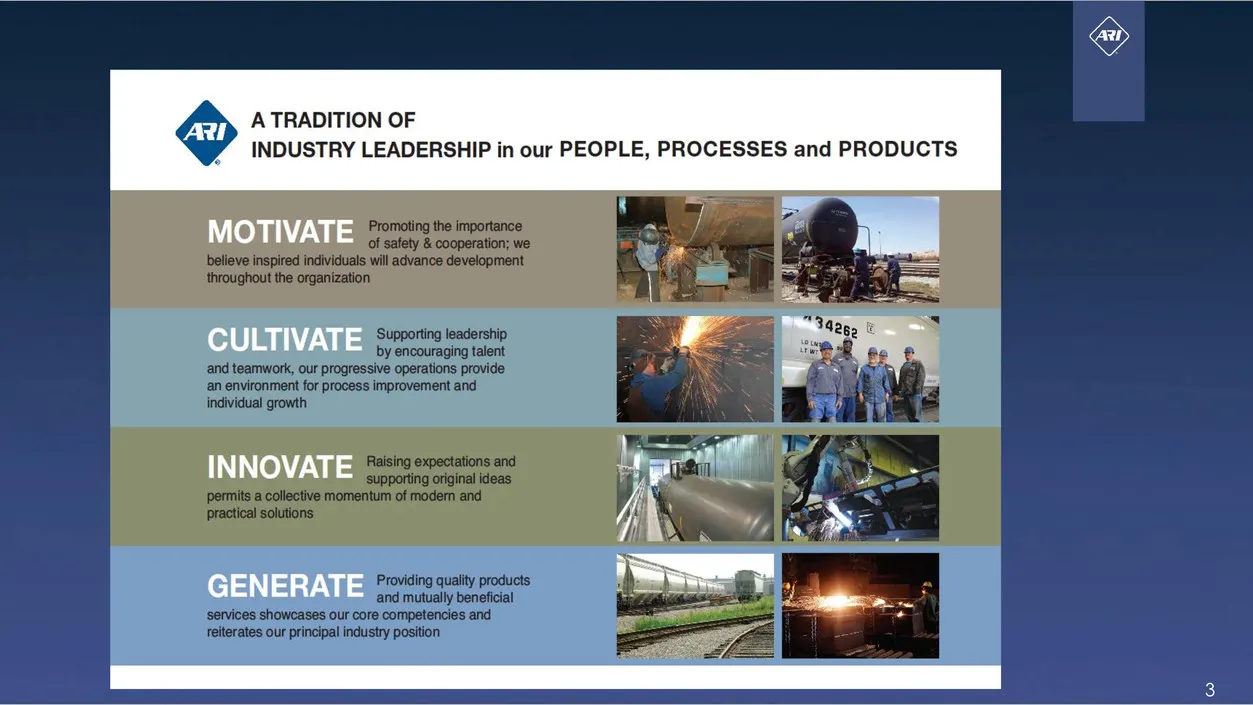
Slide 3: A Tradition of Industry Leadership
A TRADITION OF INDUSTRY LEADERSHIP in our PEOPLE, PROCESSES and PRODUCTS MOTIVATE ‘an environment for process improvement and individual growth INNOVATE Providing quality poate and mutually ben services showcases our core competencies sap reiterates our principal industry position
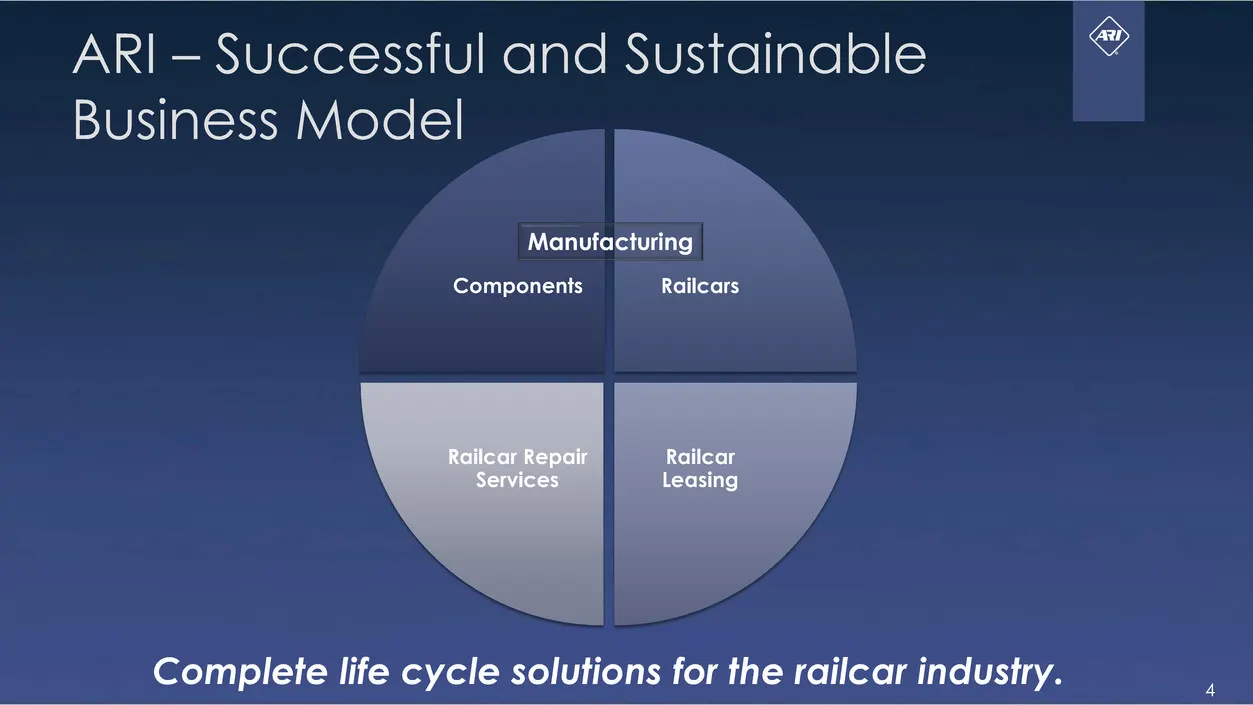
Slide 4: ARI — Successful and Sustainable Business Model
ARI — Successful and Sustainable Business Model = Manufacturing Components Railcars Complete life cycle solutions for the railcar industry.
Slide 5: ARI Key Railcar Markets
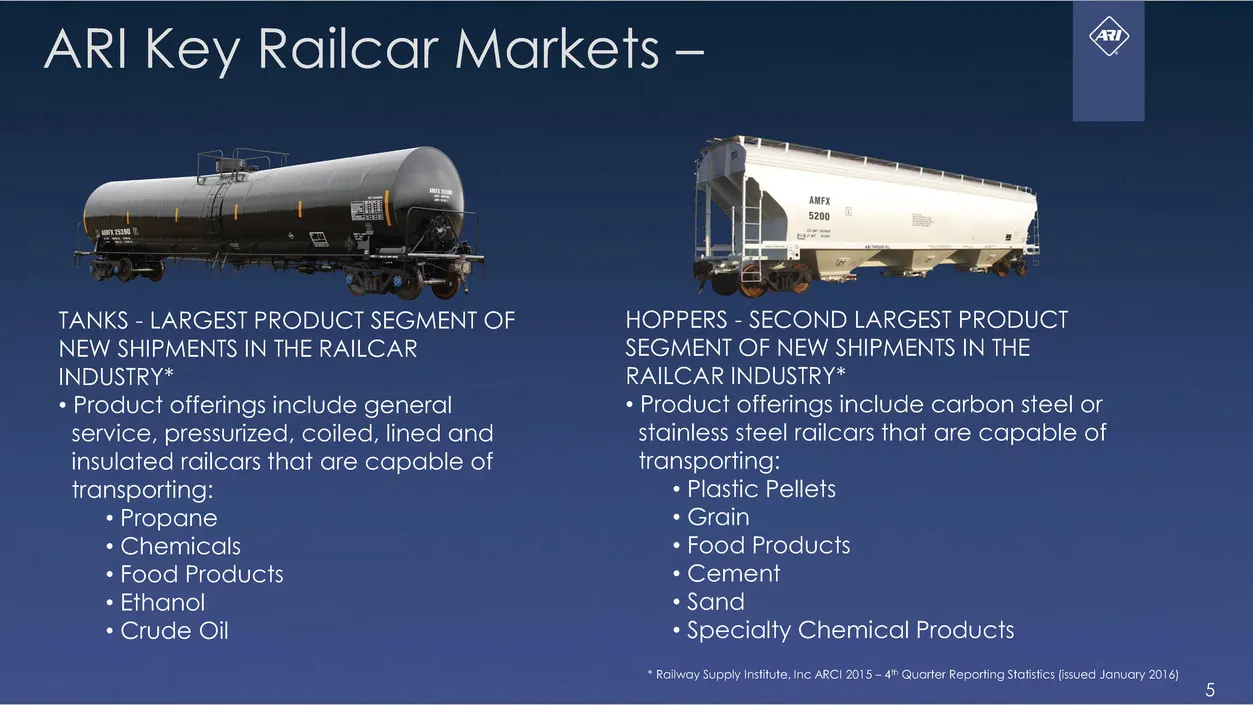
ARI Key Railcar Markets - o TANKS - LARGEST PRODUCT SEGMENT OF NEW SHIPMENTS IN THE RAILCAR INDUSTRY* * Product offerings include general service, pressurized, coiled, lined and insulated railcars that are capable of transporting: + Propane * Chemicals + Food Products + Ethanol * Crude Oil HOPPERS -
Slide 6: ARI Locations
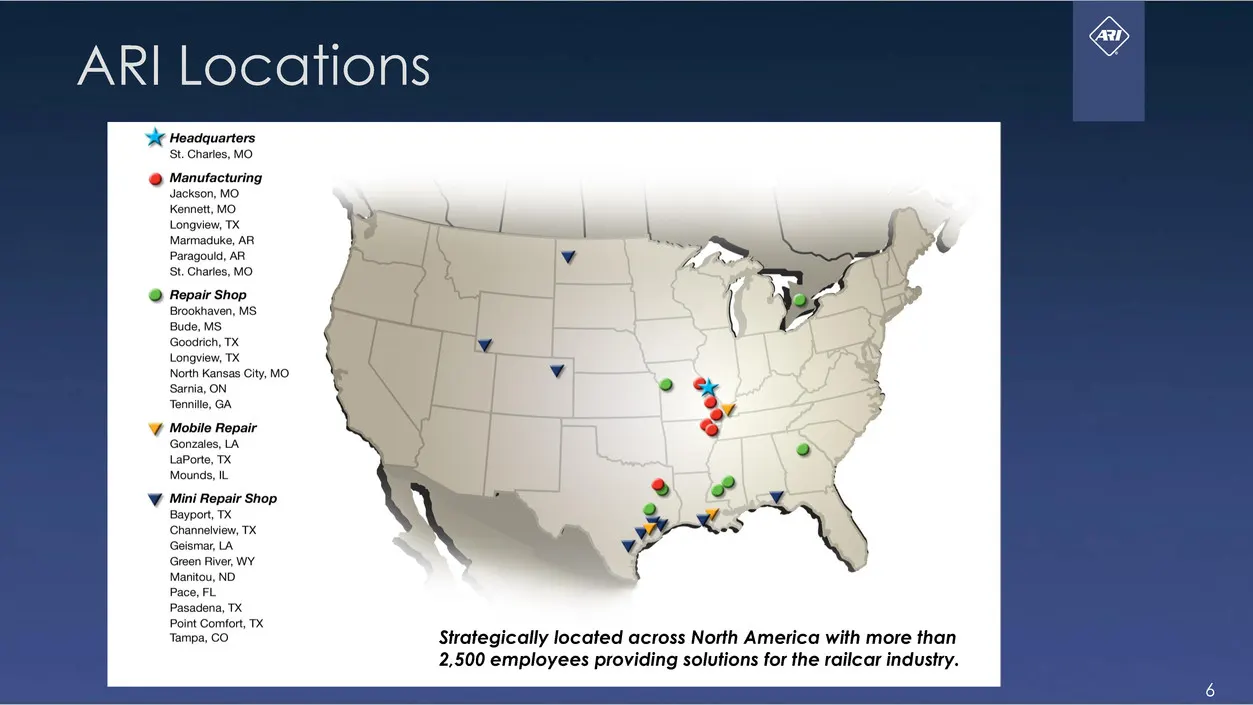
ARI Locations ie Headquarters St. Charles, MO © Mentecaring Mobite Repair Gonzales, tarete, TX Mounds, IL ie Read hop roeaealy located across North America with more than 0 employees providing solutions for the railcar industry.
Slide 7: North American Fleet by Railcar Type
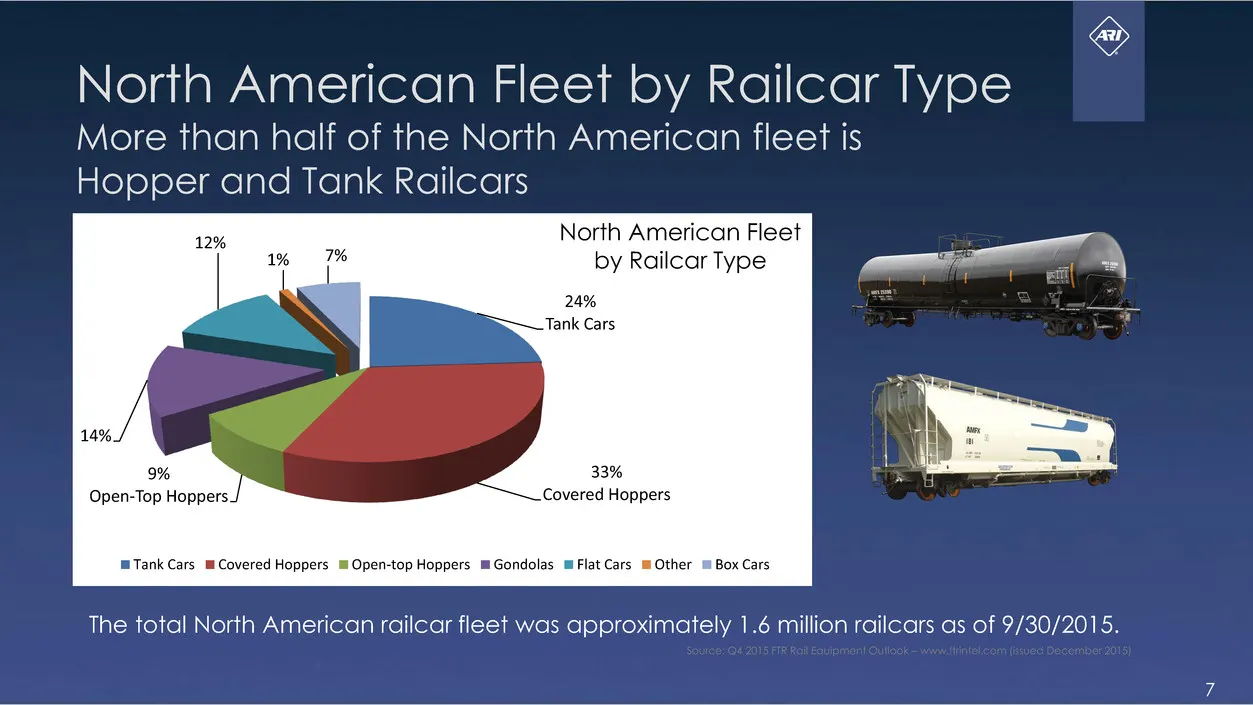
North American Fleet by Railcar Type More than half of the North American fleet is Hopper and Tank Railcars North American Fleet by Railcar Type 9% Covered Hoppers % Open-Top Hoppers mTank Cars m Covered Hoppers mOpen-top Hoppers mGondolas mFlat Cars mOther s Box Cars The total North American railca
Slide 8: Cyclical Industry Trends
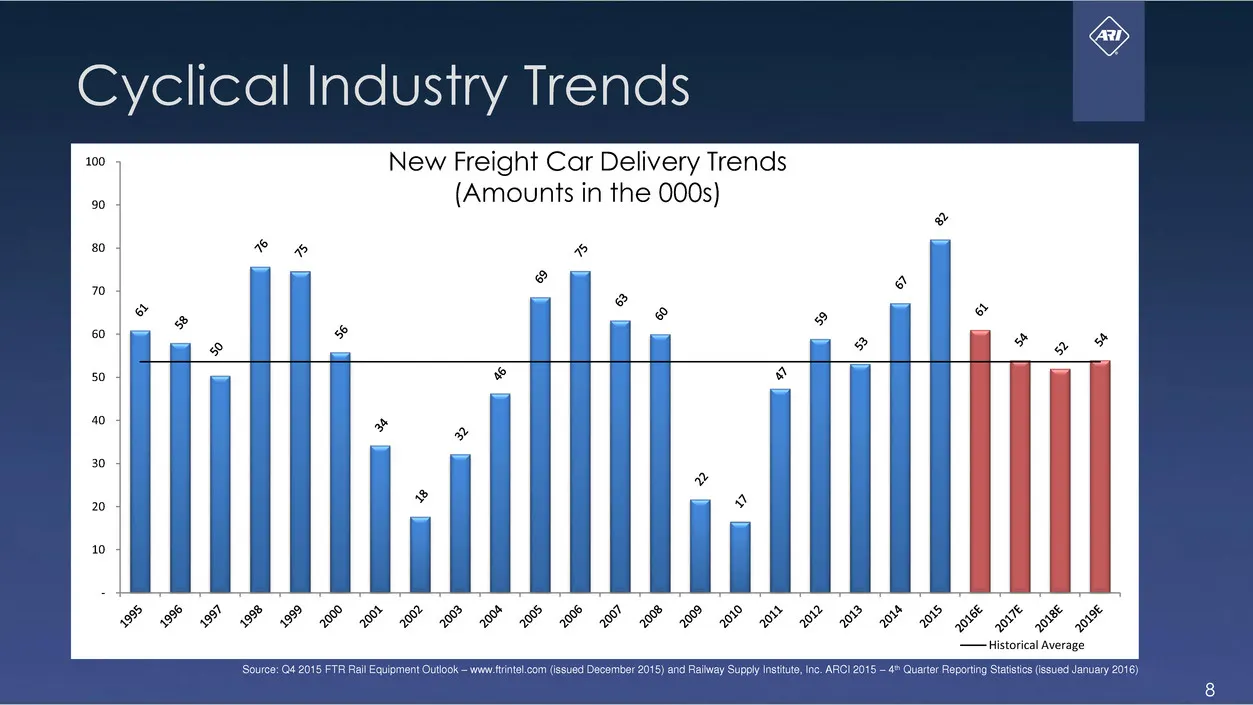
Cyclical Industry Trends New Freight Car Delivery Trends (Amounts in the 000s) I j ° 4 > ¢ ° see EEE EP ESS S SS SX SK SS Historia average ‘Source: Q4 2015 FTR Rall Equipment Outlook - www frintel.com (issued December 2015) and Rallway Supply Institute, nc. ARC! Quarter Reporting Statistics sued Jan
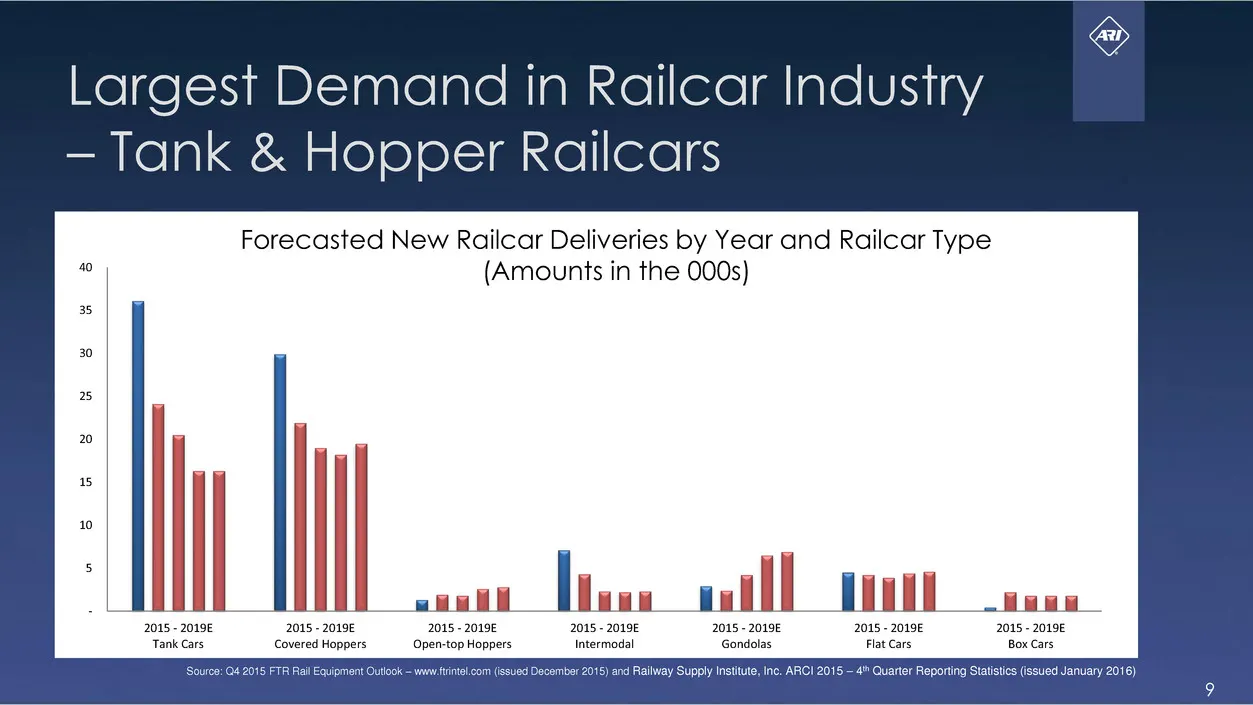
Slide 9: Largest Demand in Railcar Industry
Largest Demand in Railcar Industry — Tank & Hopper Railcars Forecasted New Railcar Deliveries by Year and Railcar Type (Amounts in the 000s) Prat | ivan wlll dial mt 2015 - 20198 1019 2015 - 20196
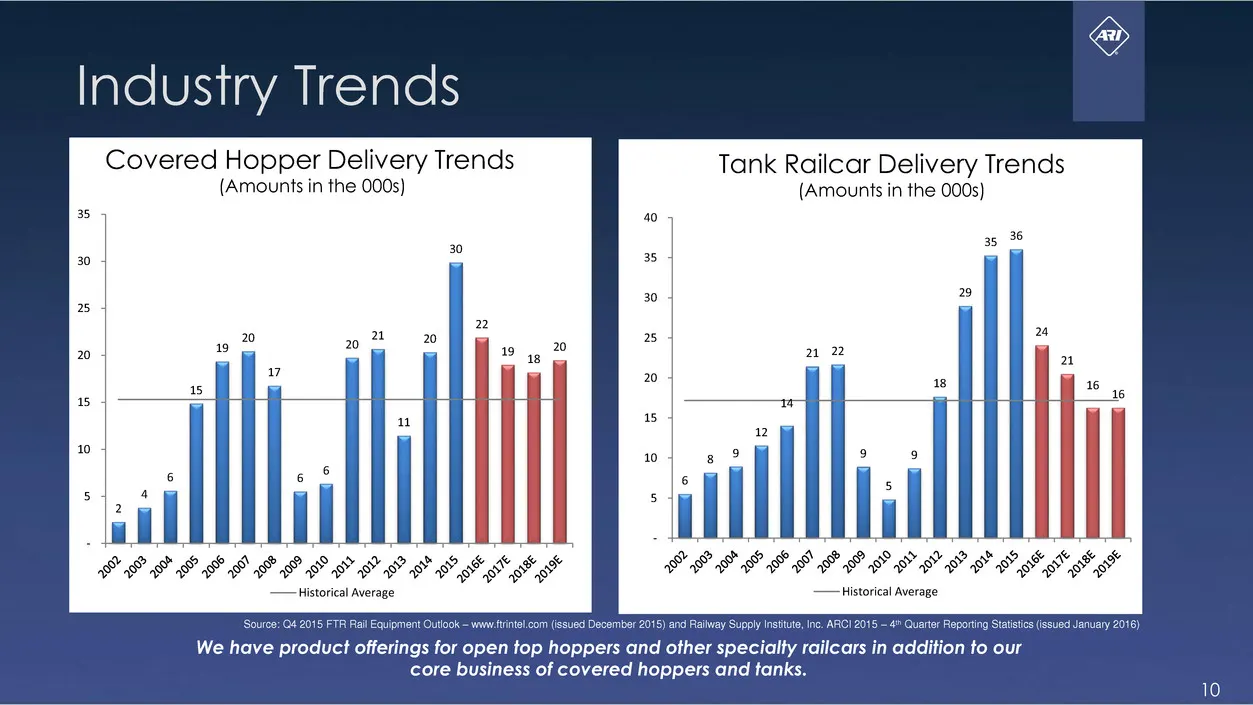
Slide 10: Industry Trends
Industry Trends Covered Hopper Delivery Trends Tank Railcar Delivery Trends (Amounts in the 000s) (Amounts in the 000s) : : ; ul mit FLL LESSEE PISS SSS S FH SLFS SIS F ILLS SEMA S —Historical Average —Historical Average ‘Source: Qé 2015 FTR Rail Equipment Outlook — www ftntl com (issued December 20
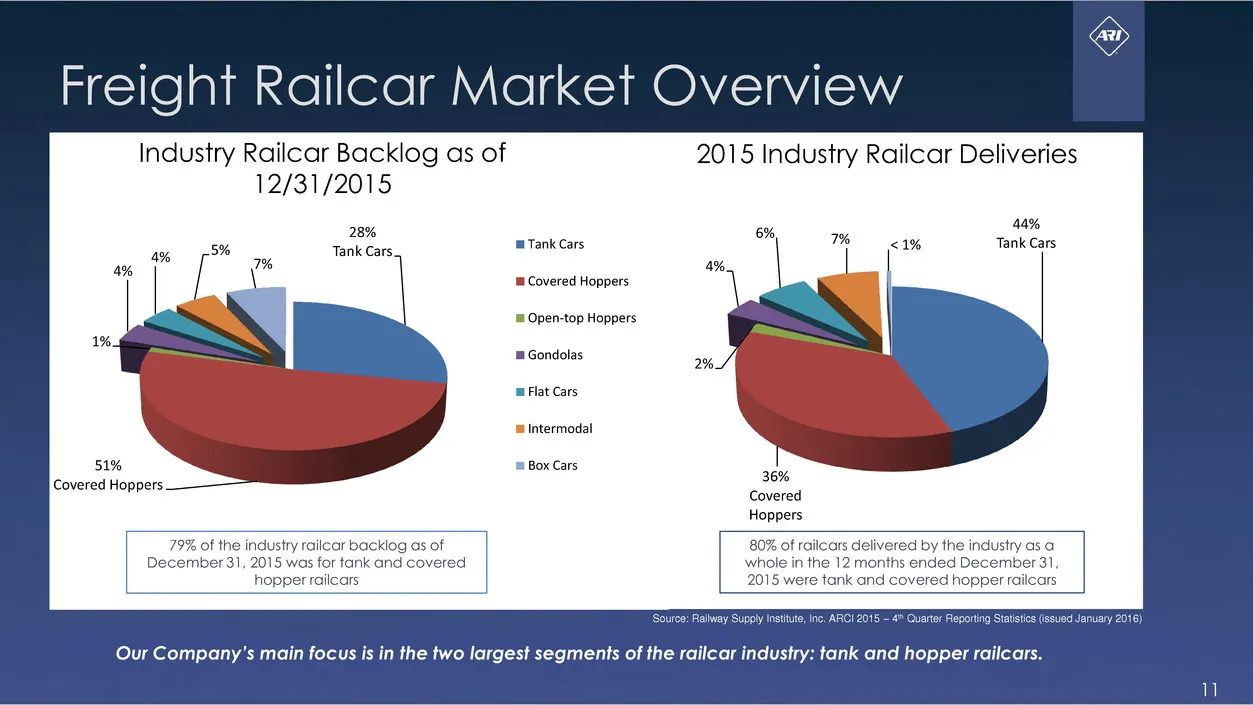
Slide 11: Industry Railcar Backlog and Deliveries
Industry Railcar Backlog as of 2015 Industry Railcar Deliveries 12/31/2015 44% Tank Cars ane Cars. m Tank Cars Covered Hoppers | Open-top Hoppers ™ Gondolas m Flat Cars Intermodal Box Cars Covered Hoppers. Pe Covered Hoppers 80% of railcars delivered by the industry as. a whole in the 12 months ende
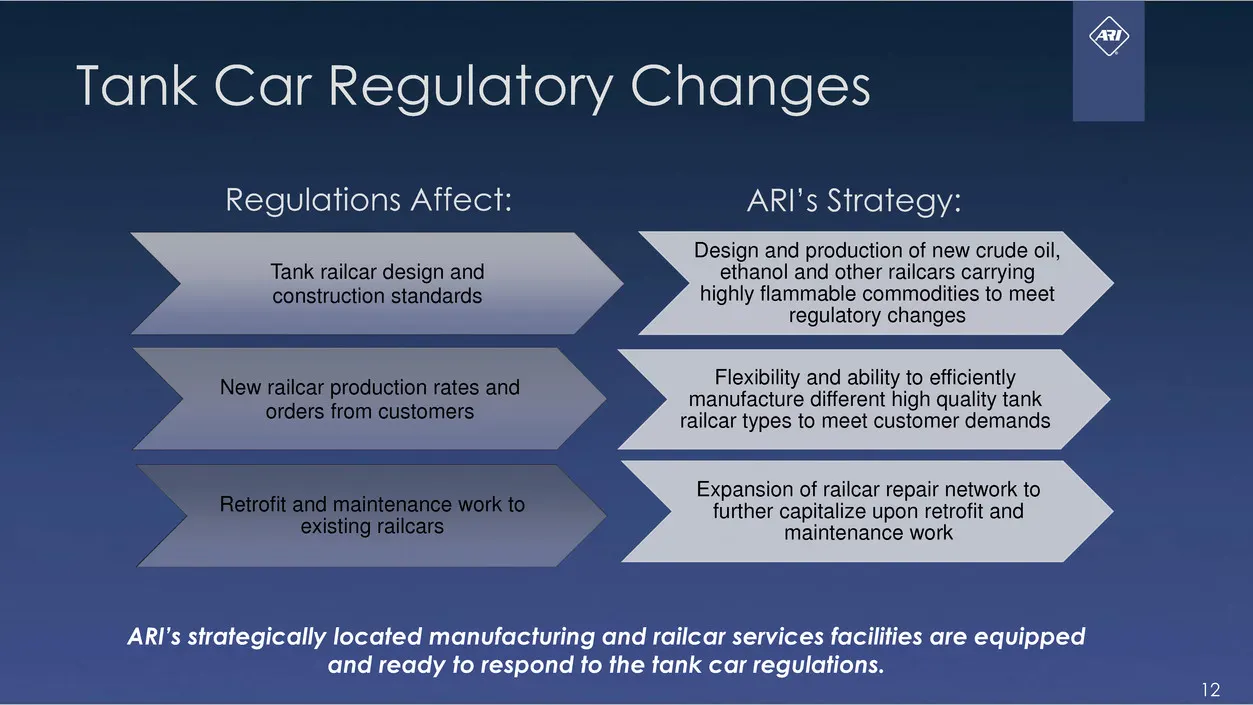
Slide 12: Tank Car Regulatory Changes
Tank Car Regulatory Changes Regulations Affect: ARI’s Strategy: Design and production of new crude oil, ethanol and other railcars carrying Tank railcar design and highly flammable commodities to meet construction standards 4 regulatory changes Flexibility and ability to efficiently manufacture diff
Slide 13: ARI’s Railcar Backlog
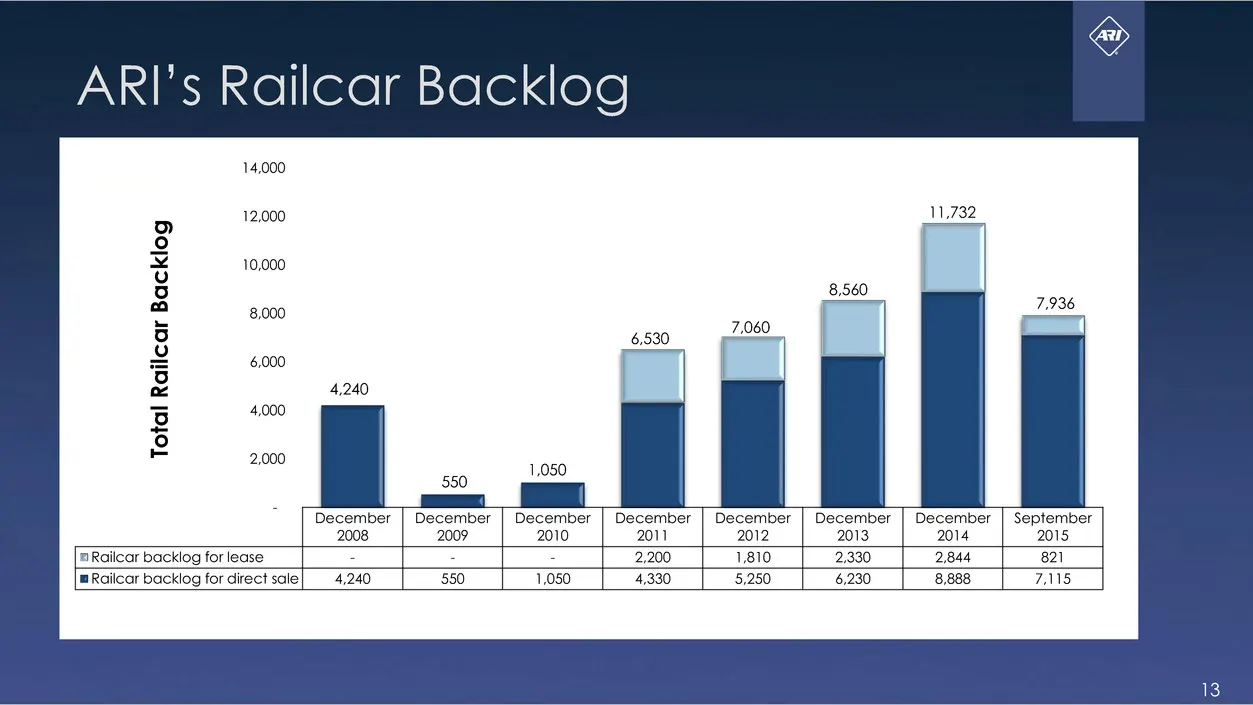
ARI’s Railcar Backlog D 3 x u 5 a - fe] o 5 a 3 ° 2 December December [ December | December | September 2008 2009 2010 2001 [BRailcar backlog forlease __| Z [ [iio [a0 [aa fo [mRoilcar backlog for direct sale] 4,240
Slide 14: Manufacturing Segment
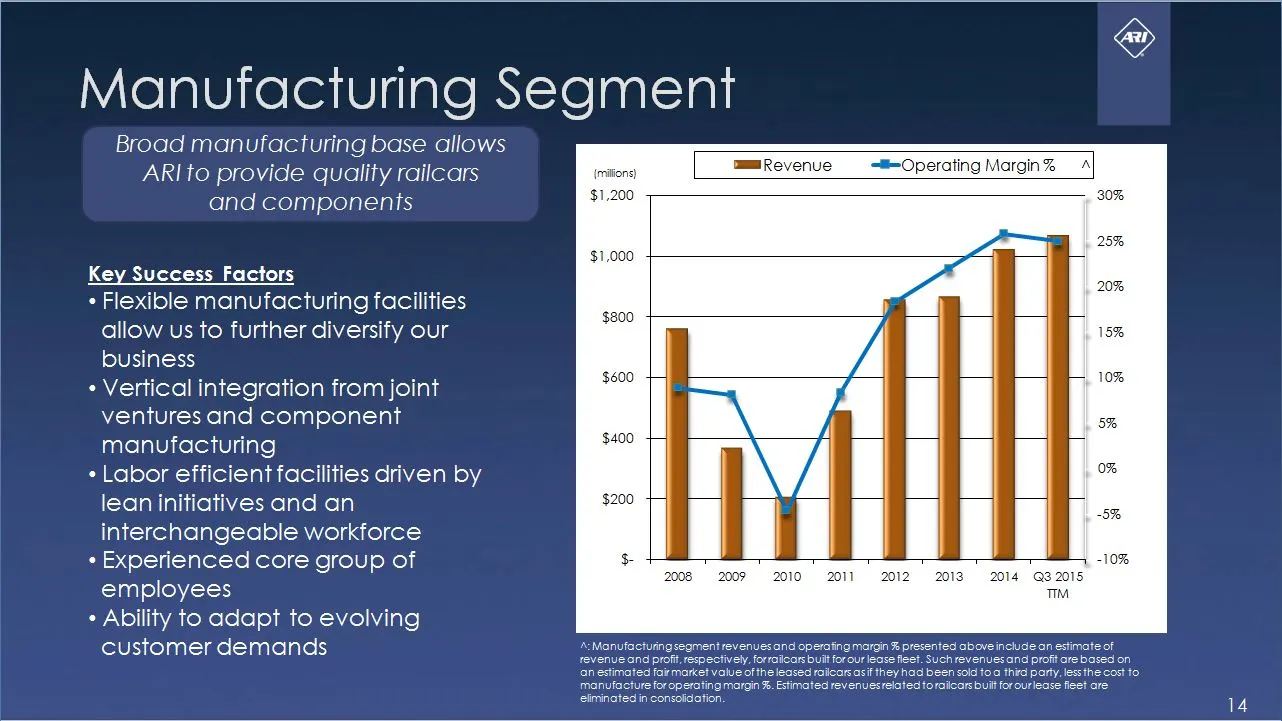
Manufacturing Segment Broad manufacturing base allows ARI to provide quality railcars and components m@m—Revenue Key Success Factors + Flexible manufacturing facilities allow us to further diversify our business + Vertical integration from joint ventures and component manufacturing + Labor efficient
Slide 15: Manufacturing Locations
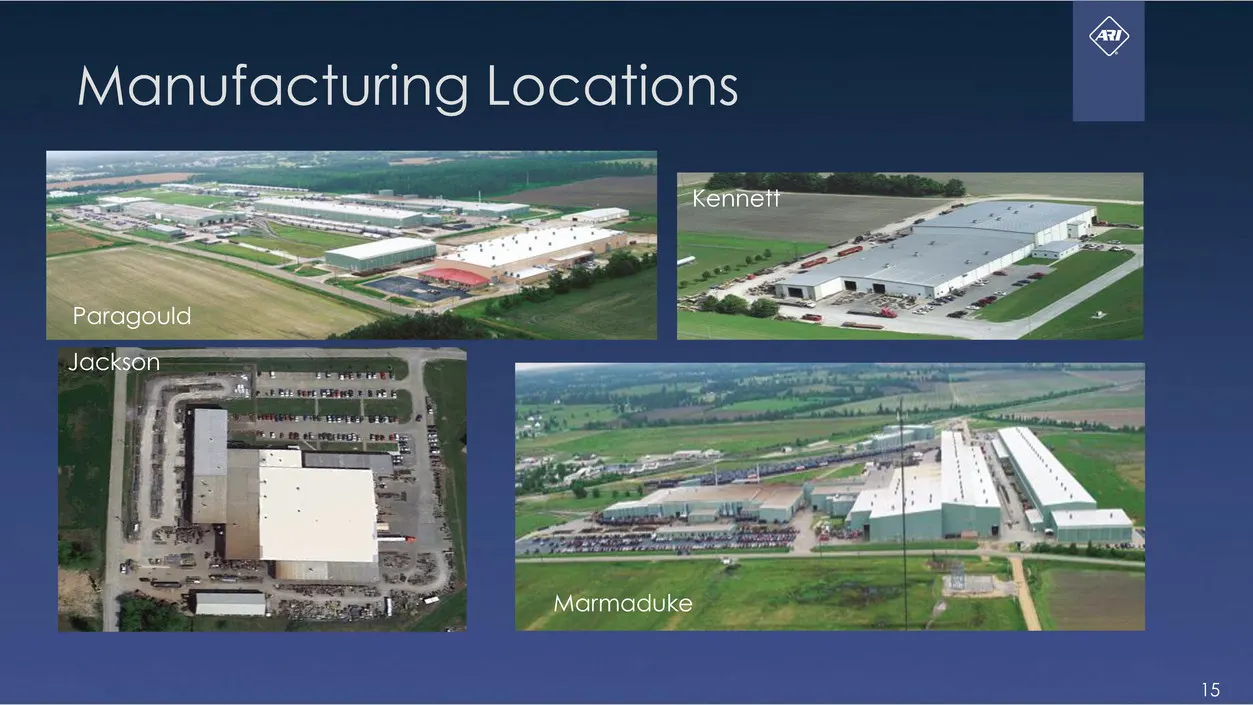
Manufacturing Locations
Slide 16: Flexible Manufacturing Plants
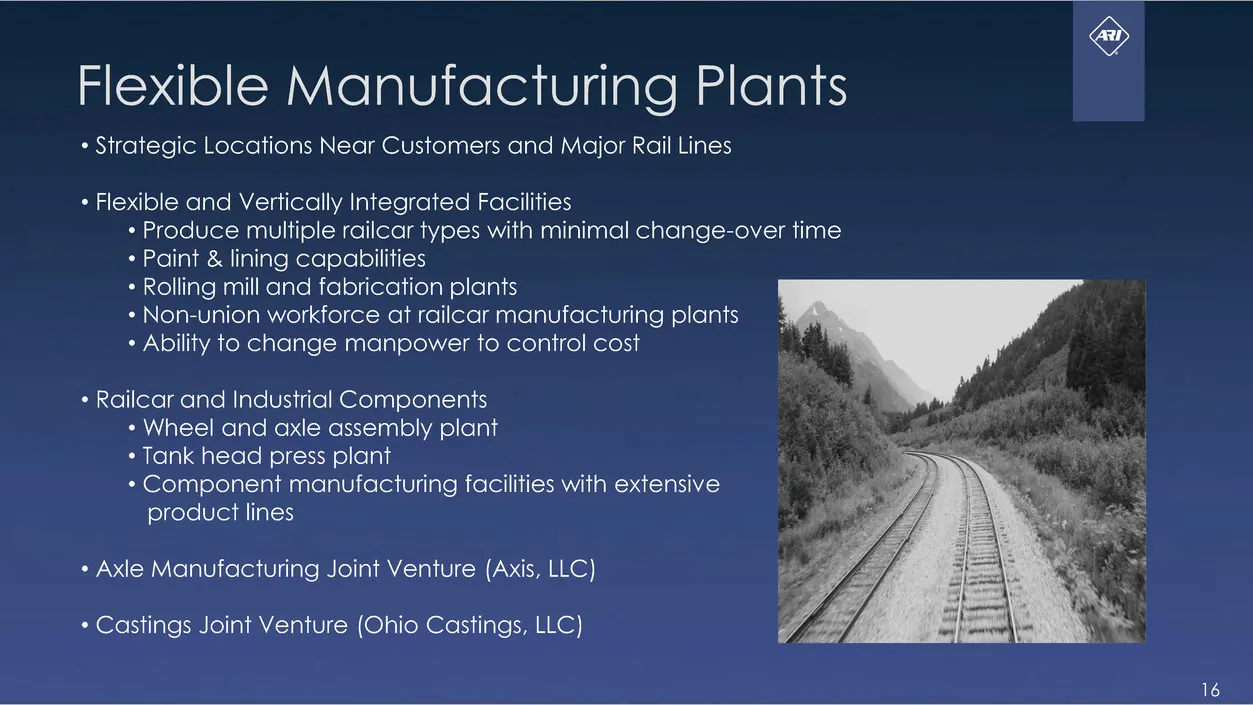
Flexible Manufacturing Plants + Strategic Locations Near Customers and Major Rail Lines + Flexible and Vertically Integrated Facilities + Produce multiple railcar types with minimal change-over time + Paint & lining capabilities * Rolling mill and fabrication plants + Non-union workforce at railcar
Slide 17: ARI Component Manufacturing
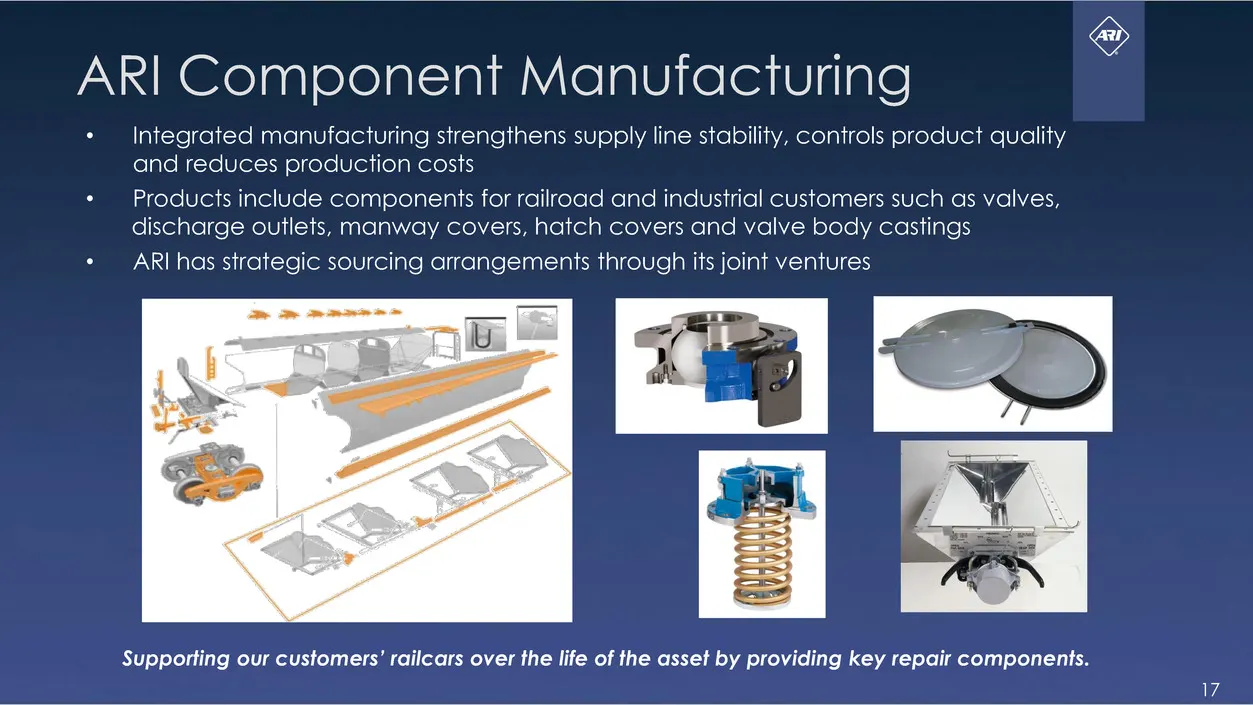
ARI Component Manufacturing * Integrated manufacturing strengthens supply line stability, controls product quality and reduces production costs Products include components for railroad and industrial customers such as valves, discharge outlets, manway covers, hatch covers and valve body castings ARI
Slide 18: Joint Venture — Axis, LLC
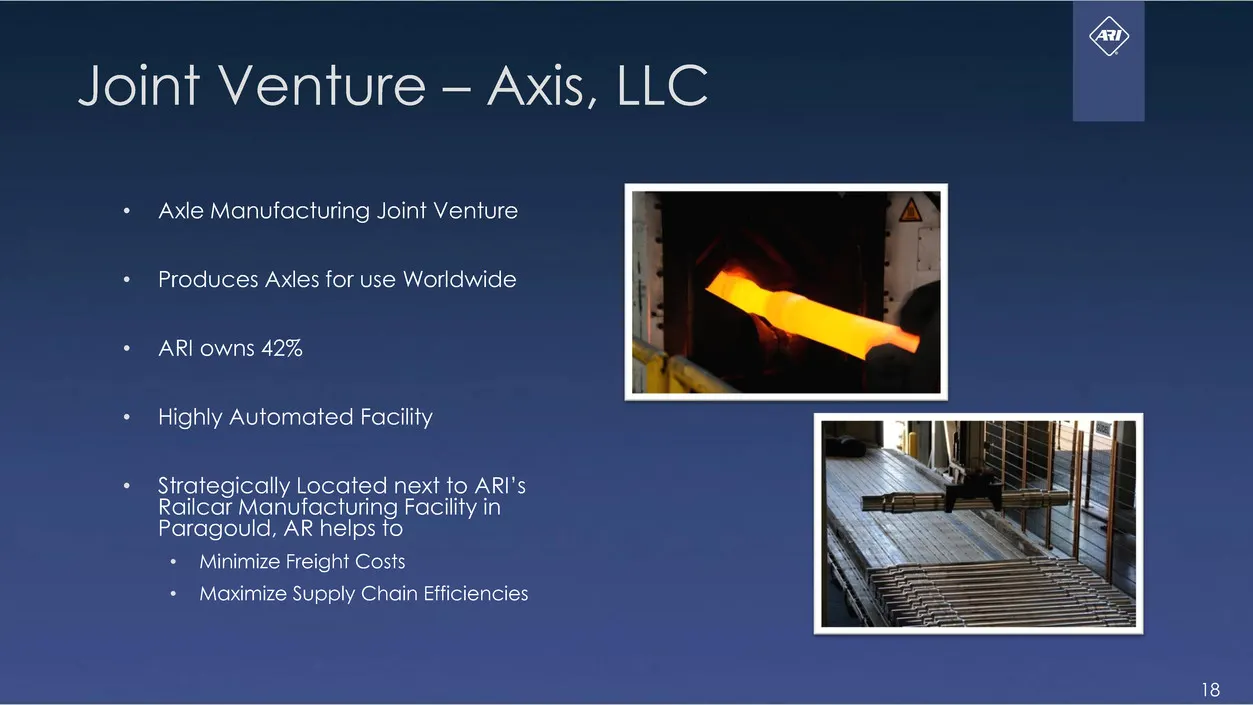
Joint Venture — Axis, LLC Axle Manufacturing Joint Venture Produces Axles for use Worldwide ARI owns 42% Highly Automated Facility Strategically Located next to ARI’s Railcar Manufacturing Facility in Paragould, AR helps fo * Minimize Freight Costs * Maximize Supply Chain Efficiencies
Slide 19: Joint Venture — Ohio Castings, LLC
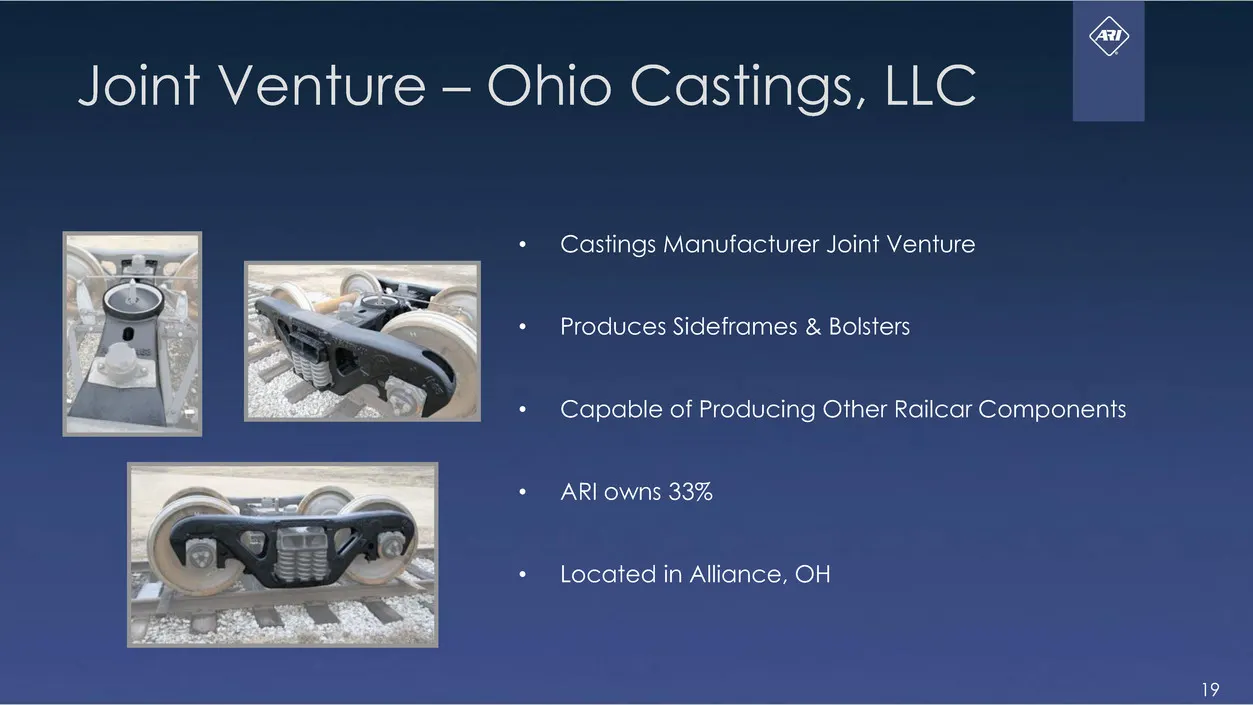
© Joint Venture — Ohio Castings, LLC Castings Manufacturer Joint Venture + Produces Sideframes & Bolsters * Capable of Producing Other Railcar Components + ARI owns 33% + Located in Alliance, OH
Slide 20: Railcar Leasing Segment
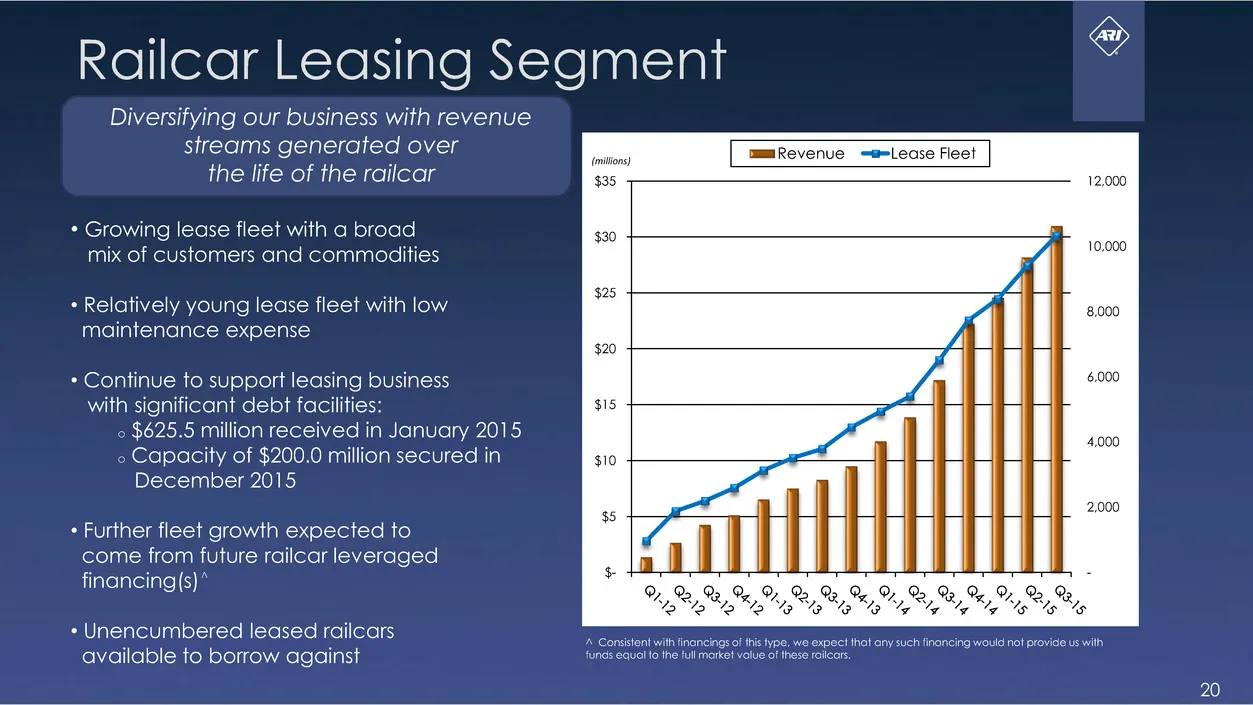
Railcar Leasing Segment Diversifying our business with revenue sireams generated over = $35 the life of the railcar * Growing lease fleet with a broad mix of customers and commodities * Relatively young lease fleet with low maintenance expense * Continue to support leasing business with significant
Slide 21: Railcar Services Segment
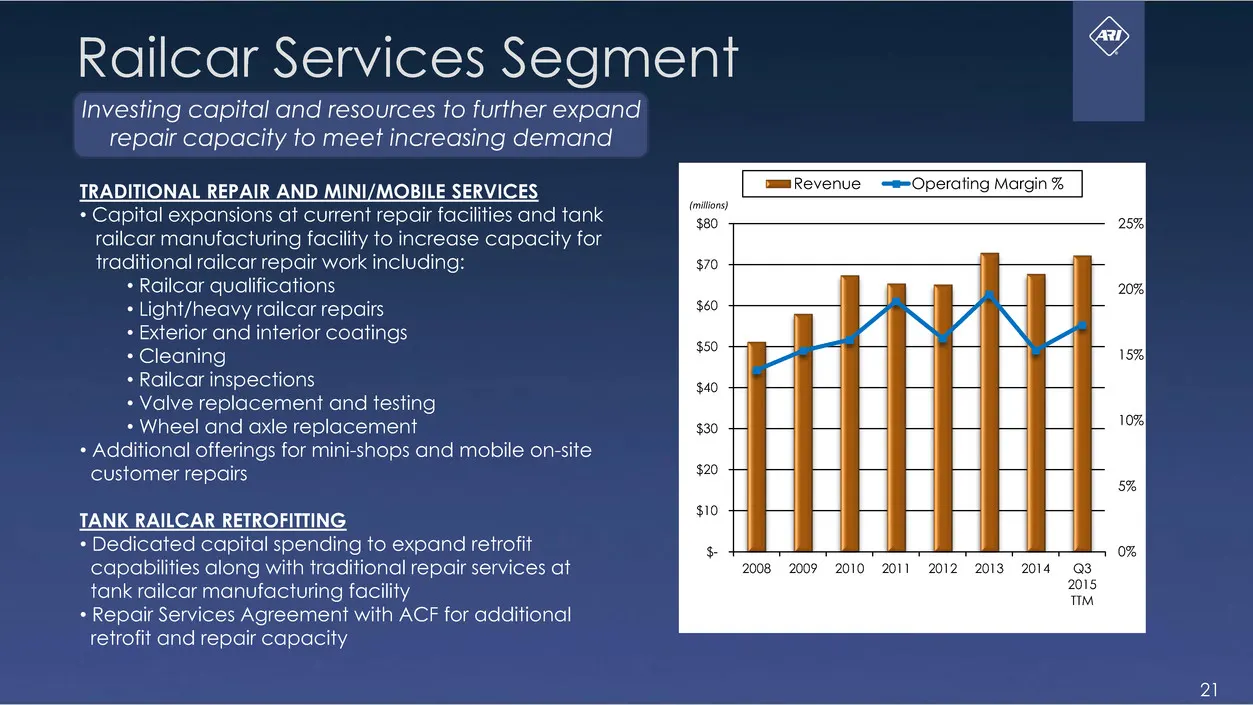
Railcar Services Segment Investing capital and resources to further expand repair capacity to meet increasing demand TRADITIONAL REPAIR AND MINI/MOBILE SERVICES * Capital expansions at current repair facilities and tank railcar manufacturing facility to increase capacity for traditional railcar repa
Slide 22: Full Service Repair Shops
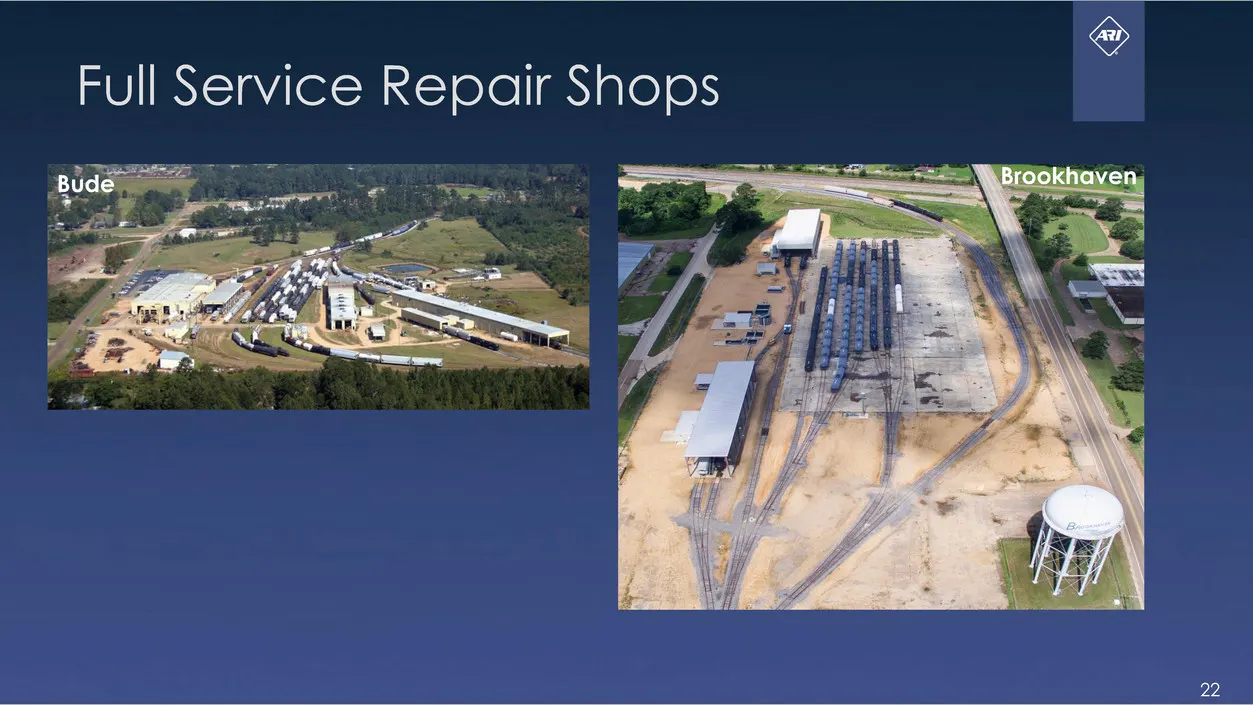
Full Service Repair Shops
Slide 23: Full Service Repair Shops (continued)
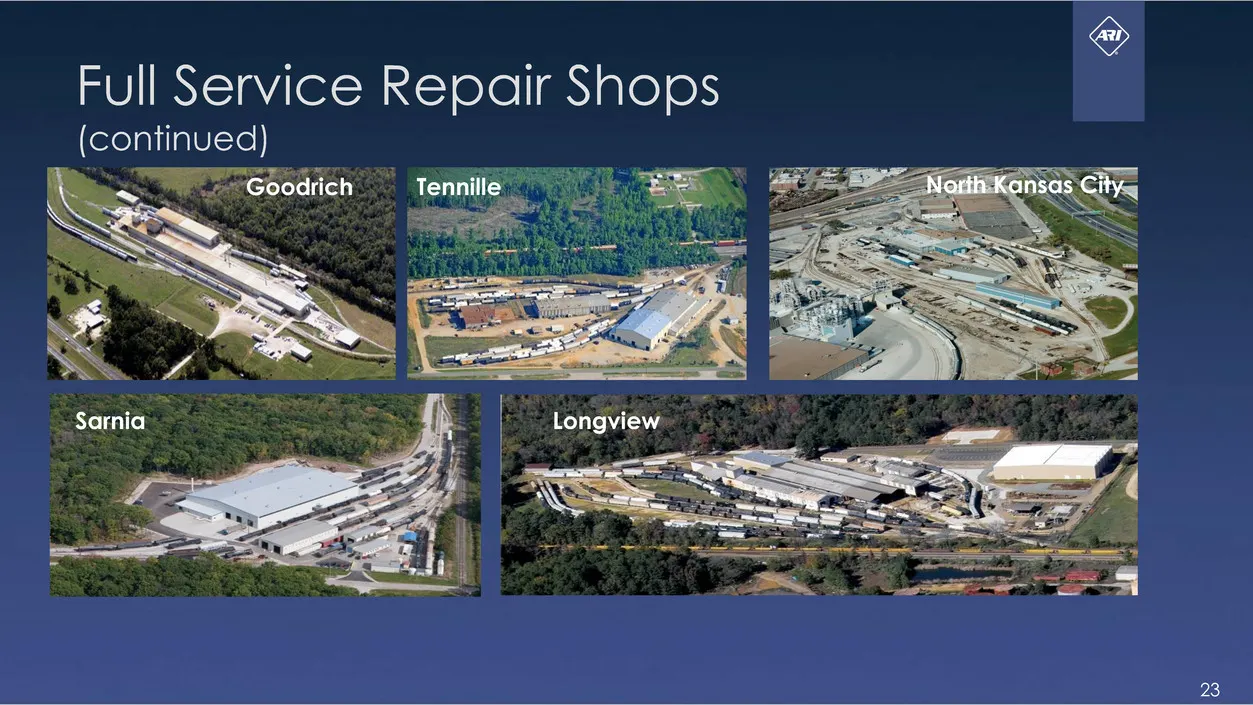
Full Service Repair Shops (continued) WEE Goodrich % Sarnia
Slide 24: Supporting the Growth of Demand for Repair Work
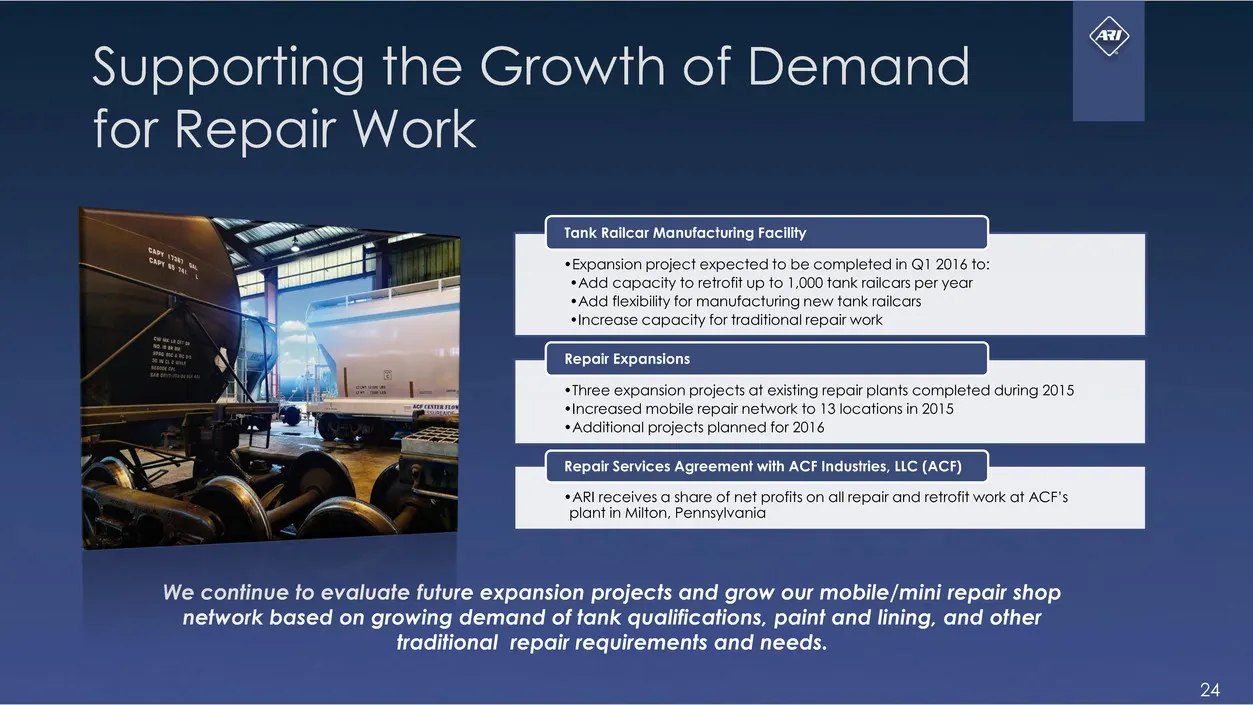
Supporting the Growth of Demand © for Repair Work Tank Railcar Manufacturing Facility expected to be completed in QI 2016 to: itech oer elseiec ise y for manufacturing nev fiveeriateiienavemervit “ap lexibiit se pansion projects at existing repair plants combeieg during 2015 d mobile repair n ralbie
Slide 25: Growth and Cost Reduction Initiatives
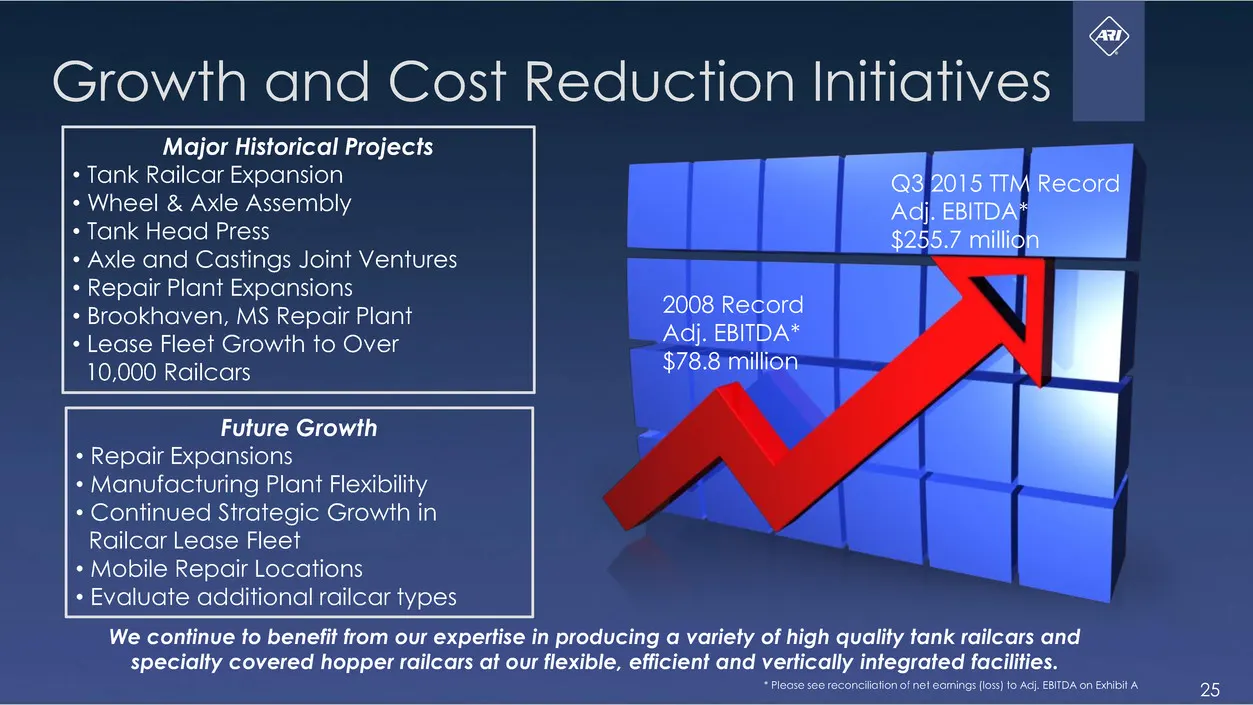
Growth and Cost Reduction Initiatives Major Historical Projects * Tank Railcar Expansion + Wheel & Axle Assembly + Tank Head Press + Axle and Castings Joint Ventures * Repair Plant Expansions + Brookhaven, MS Repair Plant + Lease Fleet Growth to Over 10,000 Railcars Future Growth + Repair Expansions
Slide 26: Objectives and Long-Term Strategies
Objectives and Long-Term Strategies We are focused on al the demands of the industry by offering new I lesigns, tive thinking, and efficient production. Integrated Manufacturing * Maximize production levels + Adapt to. the evolving demands of the industry * Respond to tank railcar regulations with n
Slide 27: Objectives and Long-Term Strategies (continued)
Objectives and Long-Term Strategies (continued) g our business We remain. further model 70a railcar leasing andrailcar services. Railcar Leasing * Continue'to. add railcars to our domestic fleet + Backlog (as of September 30, 2015) included 821 railcars to be manufactured for lease + Target a balanc
Slide 28: Strong Financial Profile
strong Financial Profile Positive financial returns resulting from ARI’s participation in the largest railcar markets: tank and hopper railcars + Healthy railcar backlog, including railcars for lease + Strong balance sheet with increased financing capacity to support operations and future lease flee
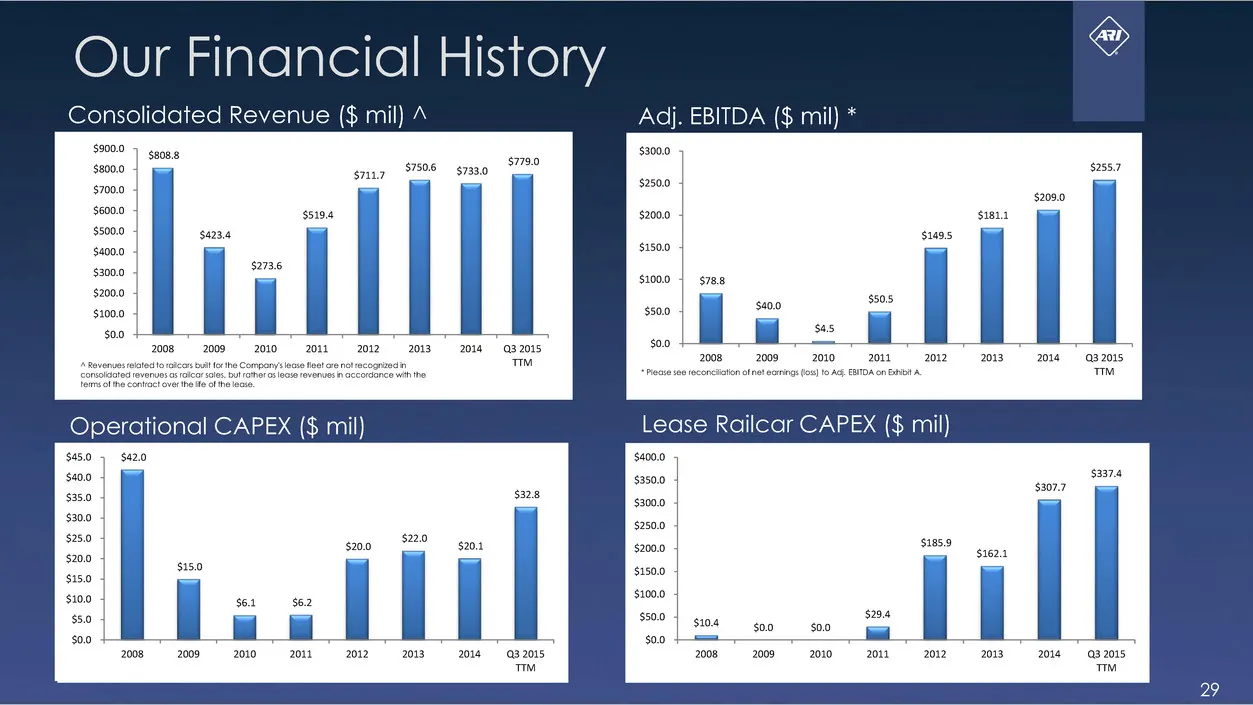
Slide 29: Our Financial History
Our Financial History Consolidated Revenue ($ mil) 4 Adj. EBITDA ($ mil) * 3779.0 sniz 57508 $733.0 009-2010 2011-«2012,-«2013.«S «20143 2015 7M 2008 2008» 201020112012, 20132018 <ercted rene ac samba foher oan roenon natcoserce mnie + necieieteconeaton net ering fs oA EMTDA on A 2011-2012, 20182018
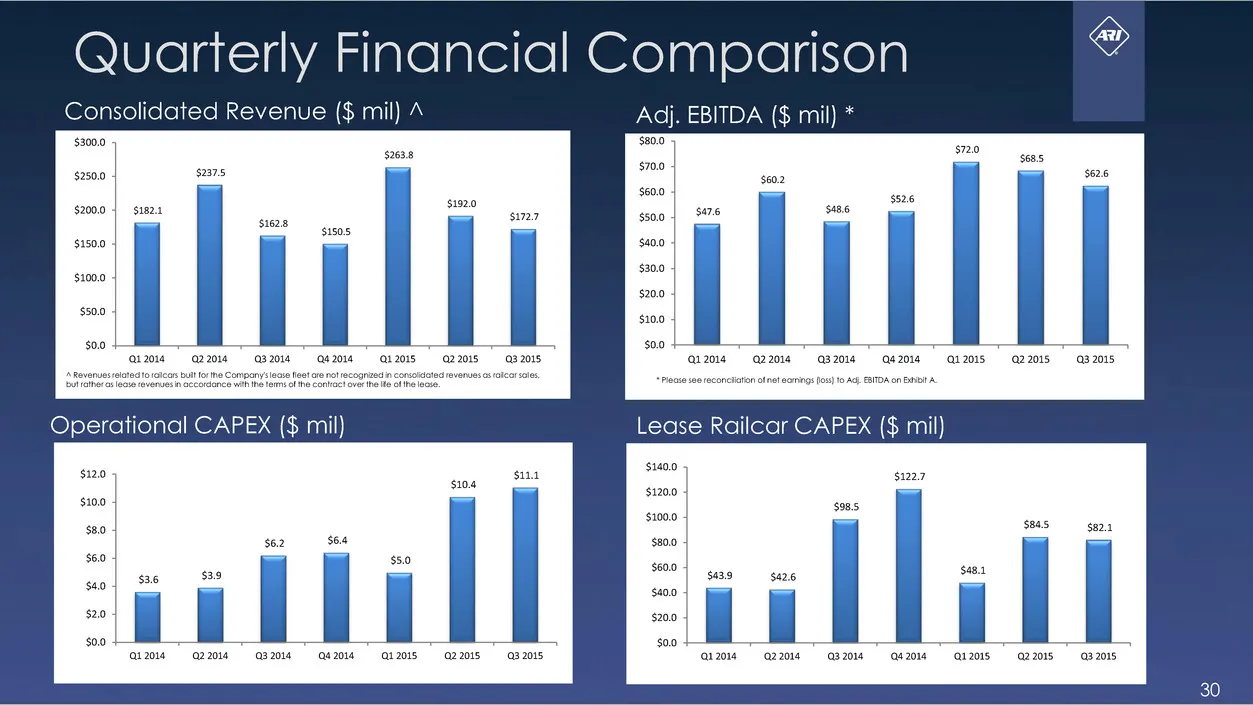
Slide 30: Quarterly Financial Comparison
Quarterly Financial Comparison Consolidated Revenue ($ mil) 4 Adj. EBITDA ($ mil) * seo 12014 a2 20132014 as 2014 i215 201532015, 12014 Q22018 3.2014 as 2014 © aI2015.—Q2215 3.2015, *Posesoe econtiaton ote! earings os) 10 Ad, SIDA on Bia A Operational CAPEX ($ mil) 0.0 i204 2201432014 sold ai 201522
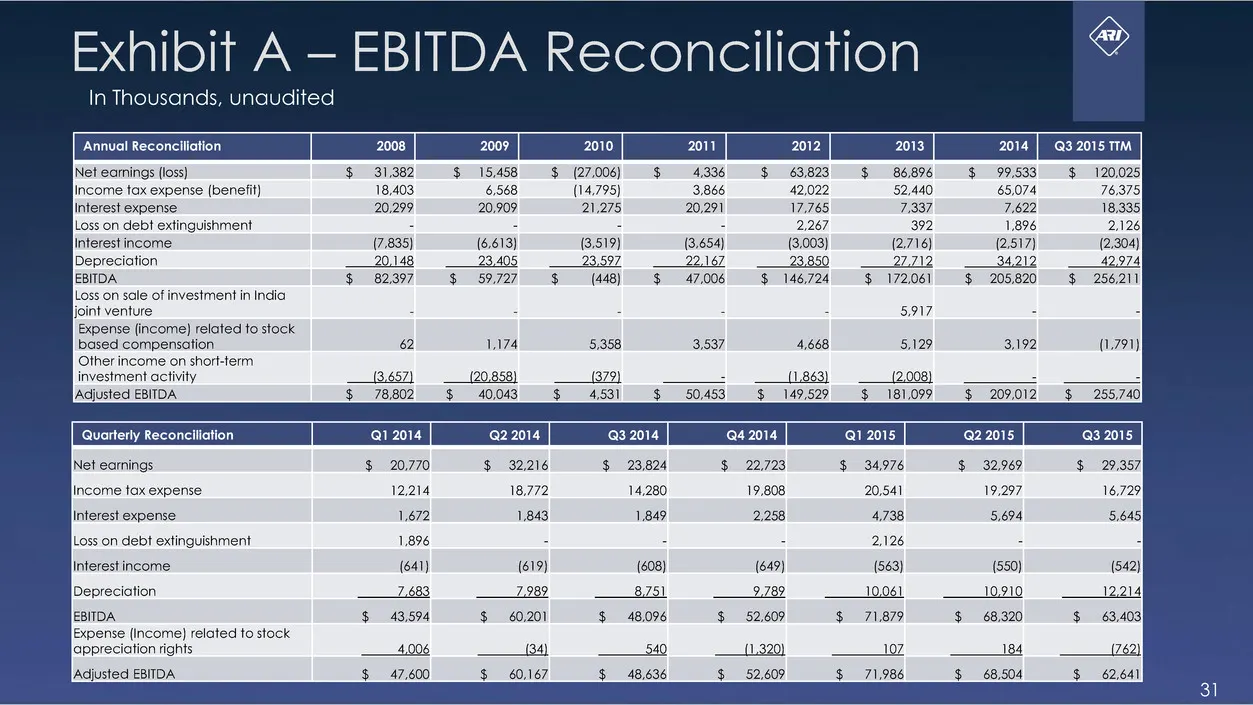
Slide 31: Exhibit A — EBITDA Reconciliation
Exhibit A — EBITDA Reconciliation In Thousands, unaudited a ar (loss) $ 31,382 _ Scns (benefit 18,403 nica 20.299 debt SE : e (7.835) 20.148 $82,397 PS enereSinresanTENIE joint ventu Expense incre) ielatedito sock ased SRG ES SSE rsa term. investment activity Adjusted EBITDA $20,770 12,214 1,672 1,8
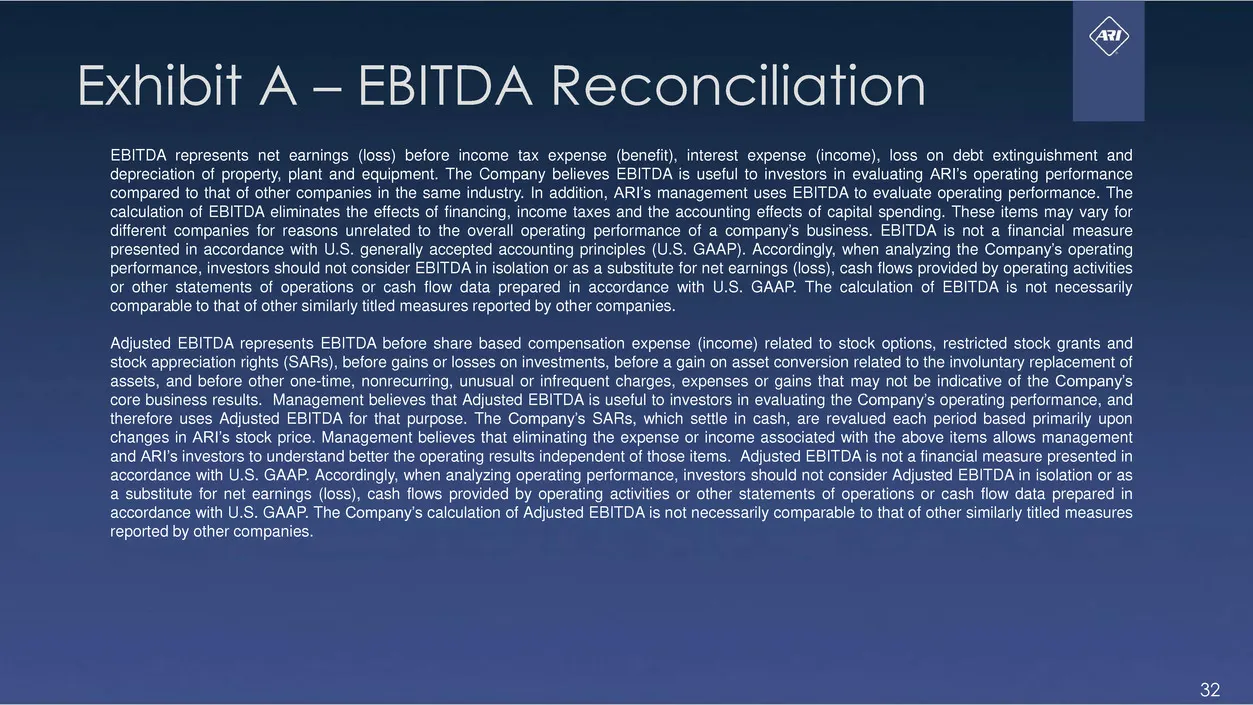
Slide 32: Exhibit A — EBITDA Reconciliation
& Exhibit A — EBITDA Reconciliation EBITDA represents net earnings (loss) isle jigs (at aise (Revs) hla area (Cte), (aes a ae Sunmueret and depreciation of property, plant and equipment. The Company believes EBITDA is useful to investors in evaluating ARI’s operating mance fared to that of other com
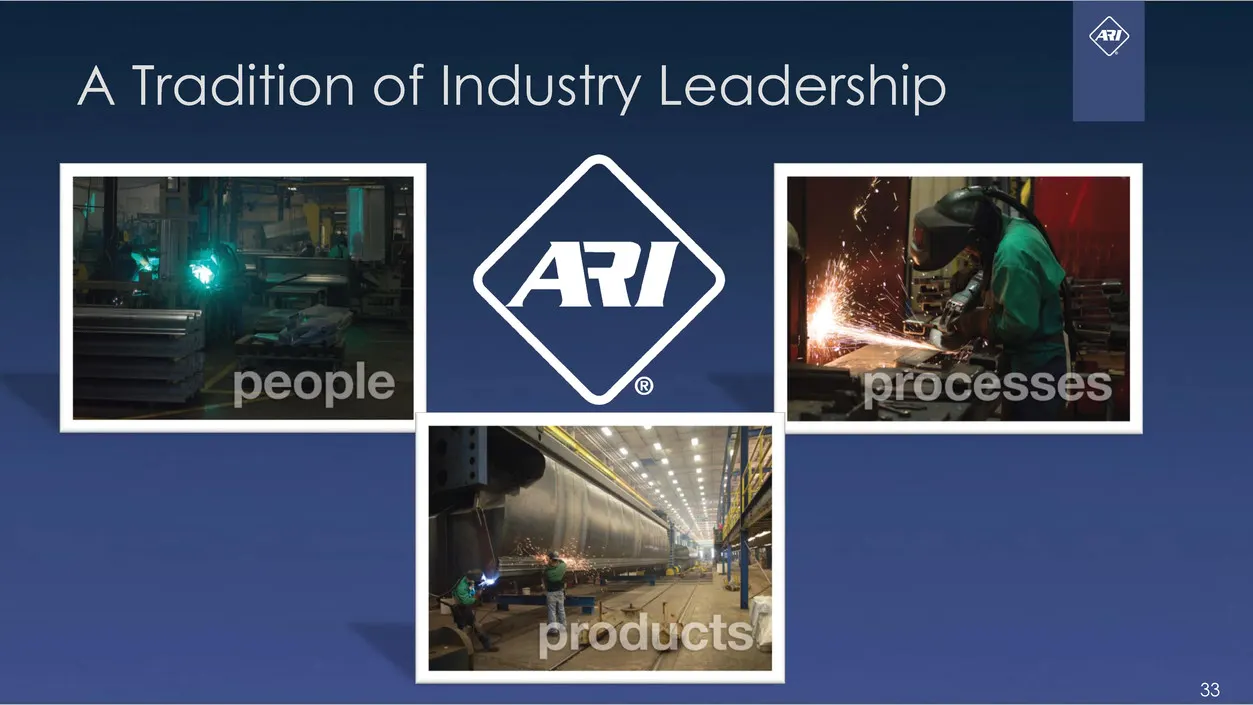
Slide 33: A Tradition of Industry Leadership
A Tradition of Industry Leadership
Source: SEC EDGAR · 8-K filed Feb 4, 2016
More decks from American Railcar Industries Inc
 Q3 2018 Earnings Presentation19 slides · Oct 30, 2018
 Investor Presentation (August 2018)26 slides · Aug 24, 2018
 Q2 2018 Earnings Presentation19 slides · Aug 1, 2018
 Q1 2018 Earnings Presentation18 slides · May 1, 2018
 Q4 2017 Earnings Presentation19 slides · Feb 23, 2018
 Cowen conference 201824 slides · Feb 6, 2018