Santander Holdings USA Inc · NYSE:SNUS/PH
Santander Holdings USA — Debt Investor Presentation (August 2024)
41 slides from Santander Holdings USA's debt investor presentation, Aug 1, 2024
Slide 1: Santander Holdings USA, Inc. Second Quarter 2024 Fixed Income Investor Presentation
August 1, 2024 SANTANDER HOLDINGS USA, INC. Second Quarter 2024 Fixed Income Investor Presentation 1
Slide 2: Important Information
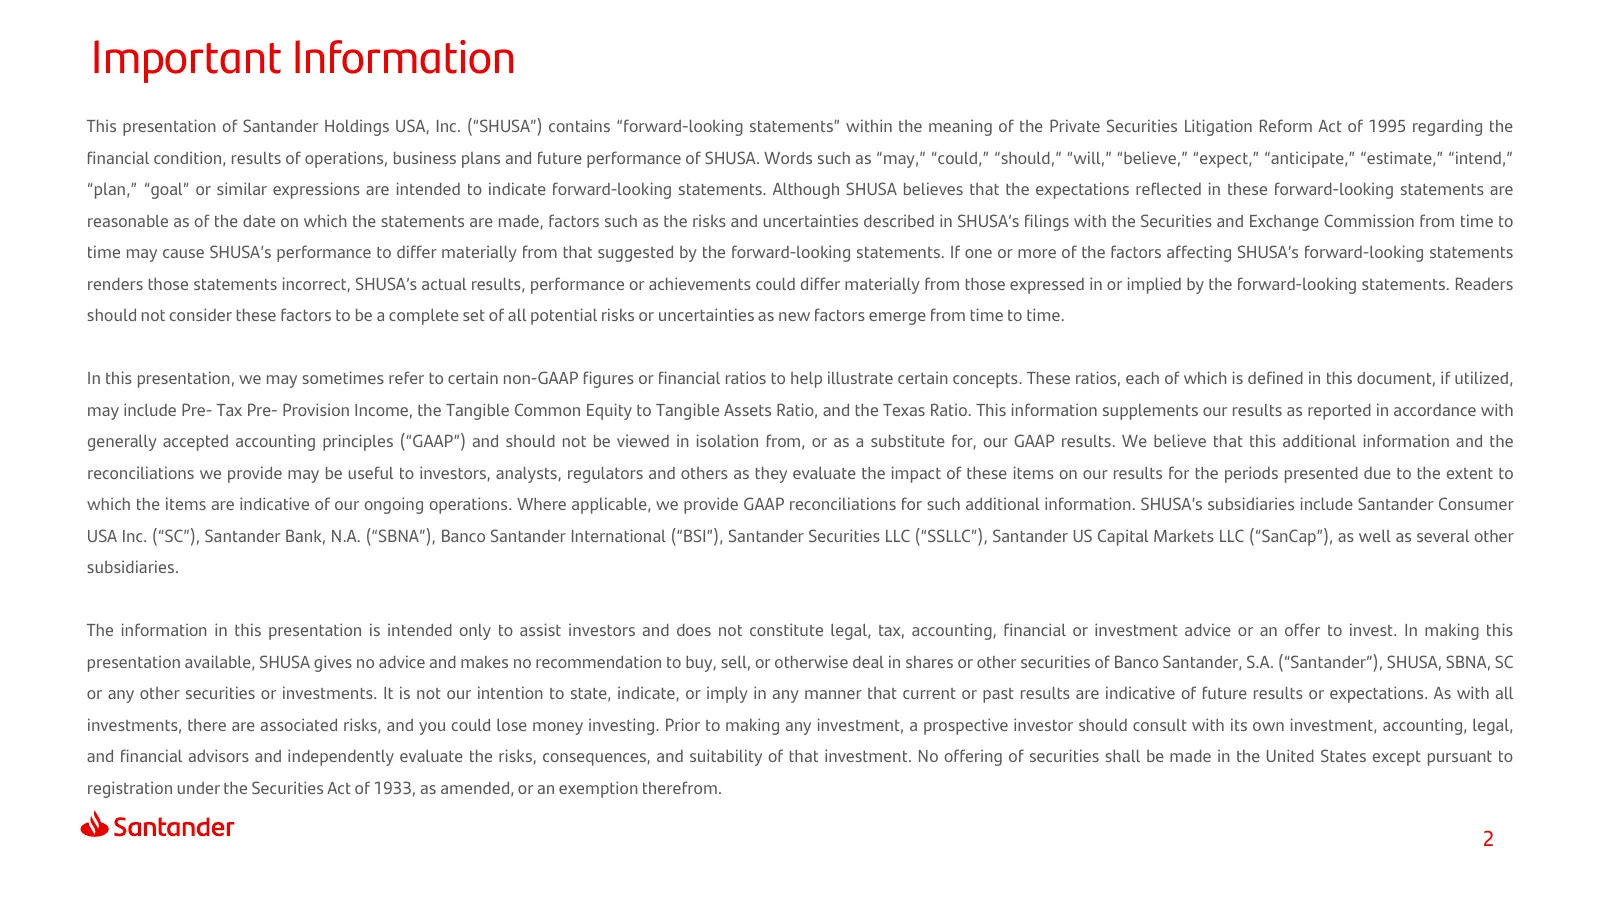
Important Information This presentation of Santander Holdings USA, Inc. (“SHUSA”) contains “forward-looking statements” within the meaning of the Private Securities Litigation Reform Act of 1995 regarding the financial condition, results of operations, business plans and future performance of SHUSA.
Slide 3: Index
Index 1 2 3 4 At a Glance Results Core Appendix Business Activities 3
Slide 4: SHUSA Q2 2024 Highlights
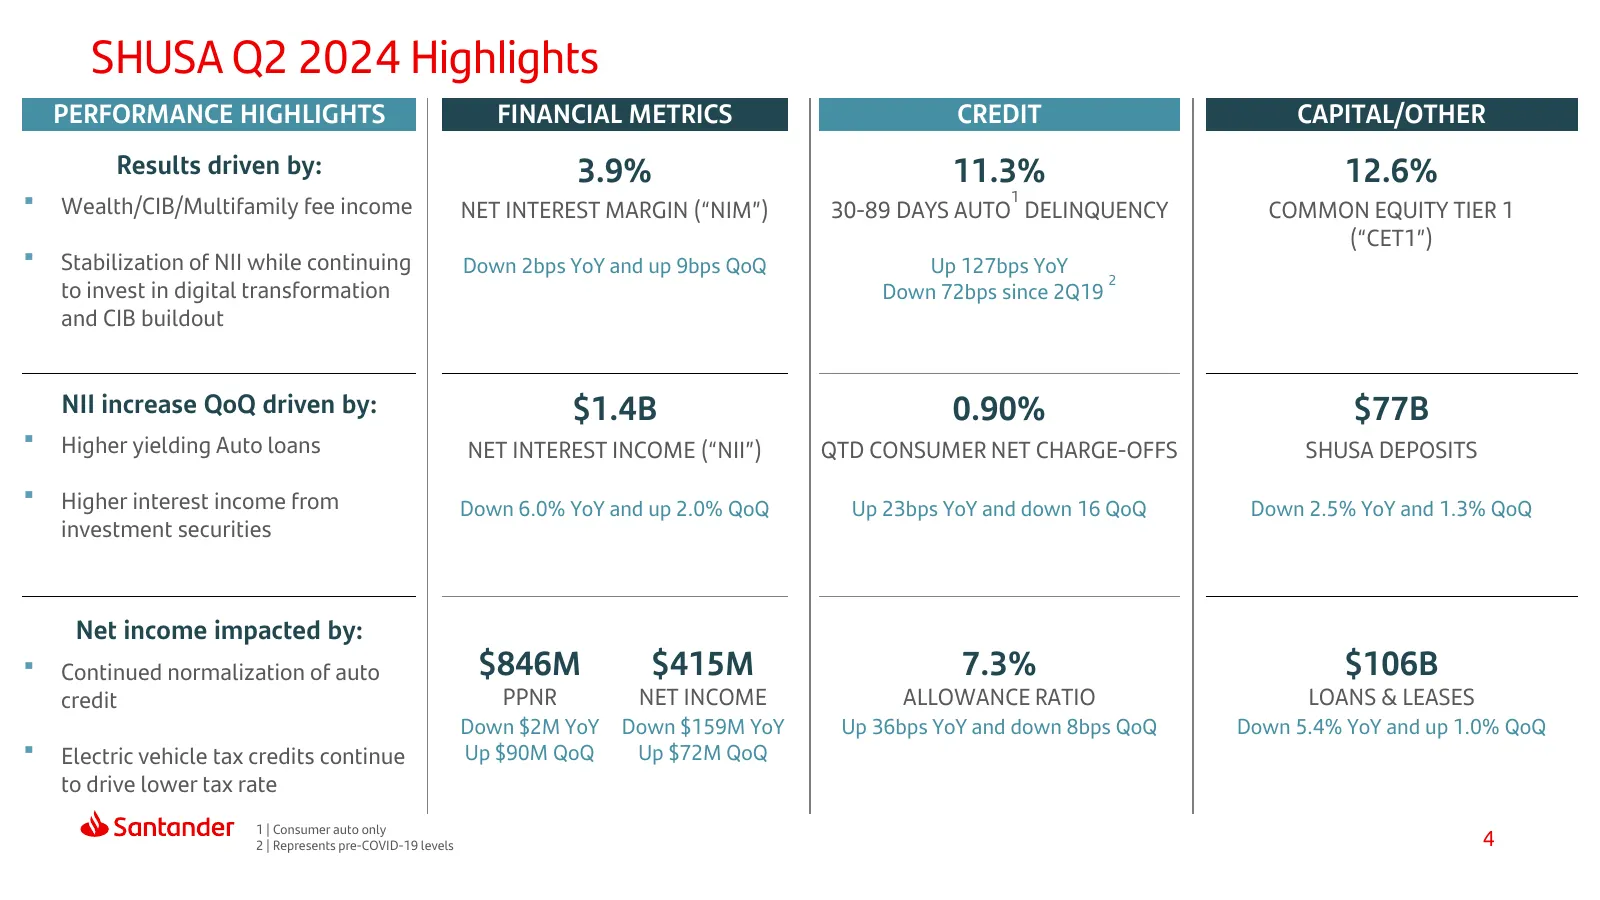
SHUSA Q2 2024 Highlights PERFORMANCE HIGHLIGHTS FINANCIAL METRICS CREDIT CAPITAL/OTHER Results driven by: 3.9% 11.3% 12.6% 1 Wealth/CIB/Multifamily fee income NET INTEREST MARGIN (“NIM”) 30-89 DAYS AUTO DELINQUENCY COMMON EQUITY TIER 1 (“CET1”) Stabilization of NII while continuing Down 2bps YoY
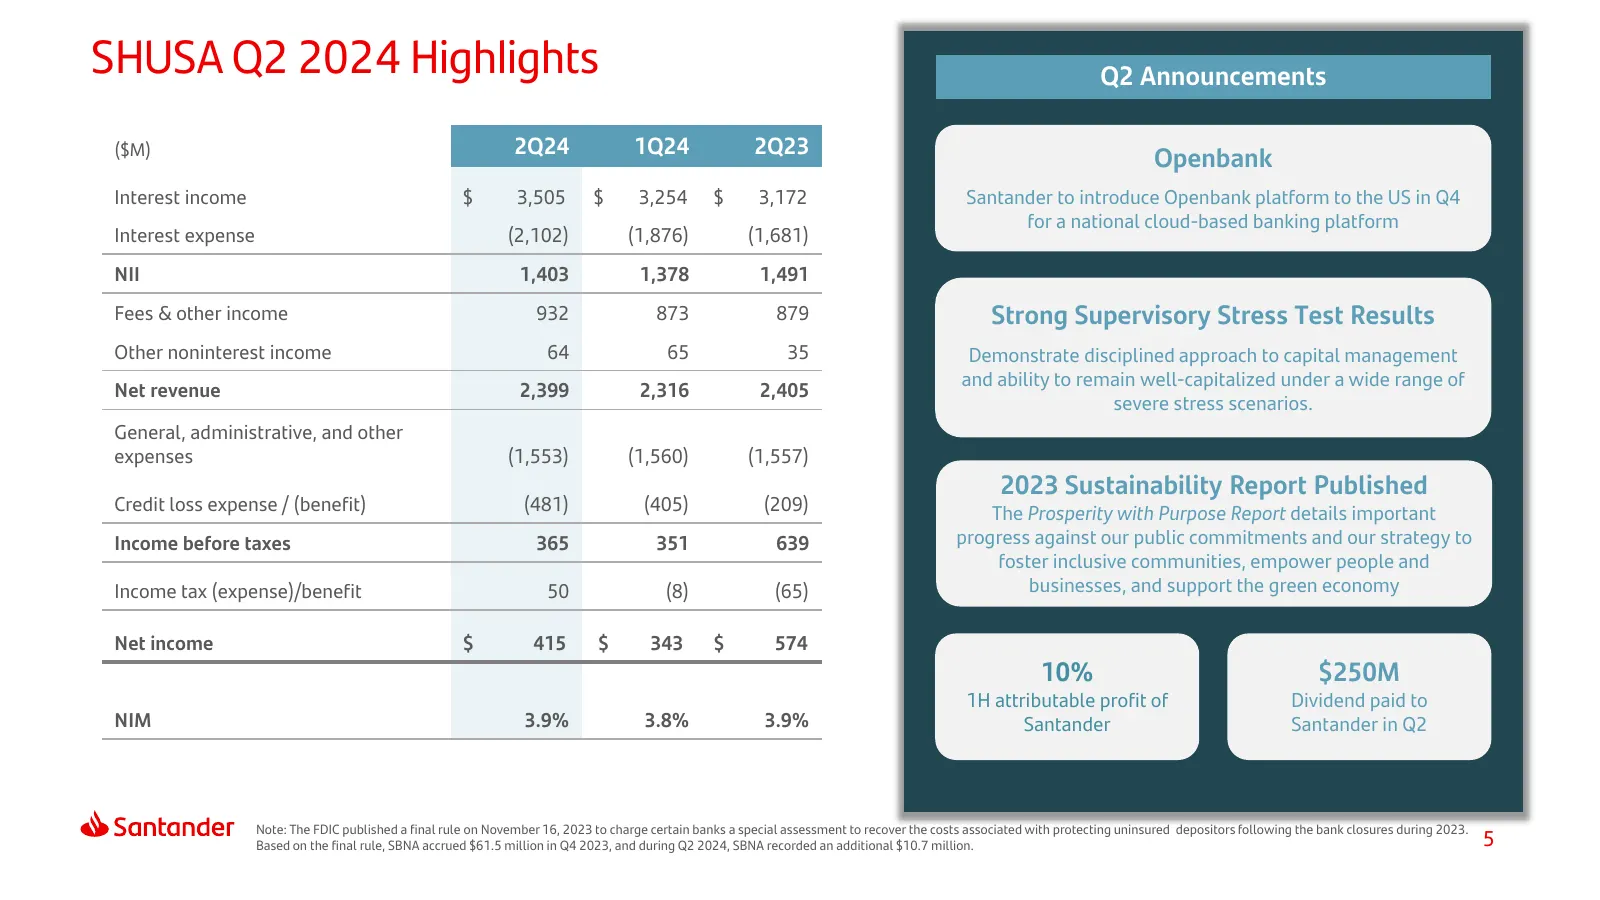
Slide 5: SHUSA Q2 2024 Highlights and Announcements
SHUSA Q2 2024 Highlights Q2 Announcements ($M) 2Q24 1Q24 2Q23 Openbank Interest income $ 3,505 $ 3,254 $ 3,172 Santander to introduce Openbank platform to the US in Q4 for a national cloud-based banking platform Interest expense (2,102) (1,876) (1,681) NII 1,403 1,378 1,491 Fees & other income 932 8
Slide 6: Index
Index 1 2 3 4 At a Glance Results Core Appendix Business Activities 6
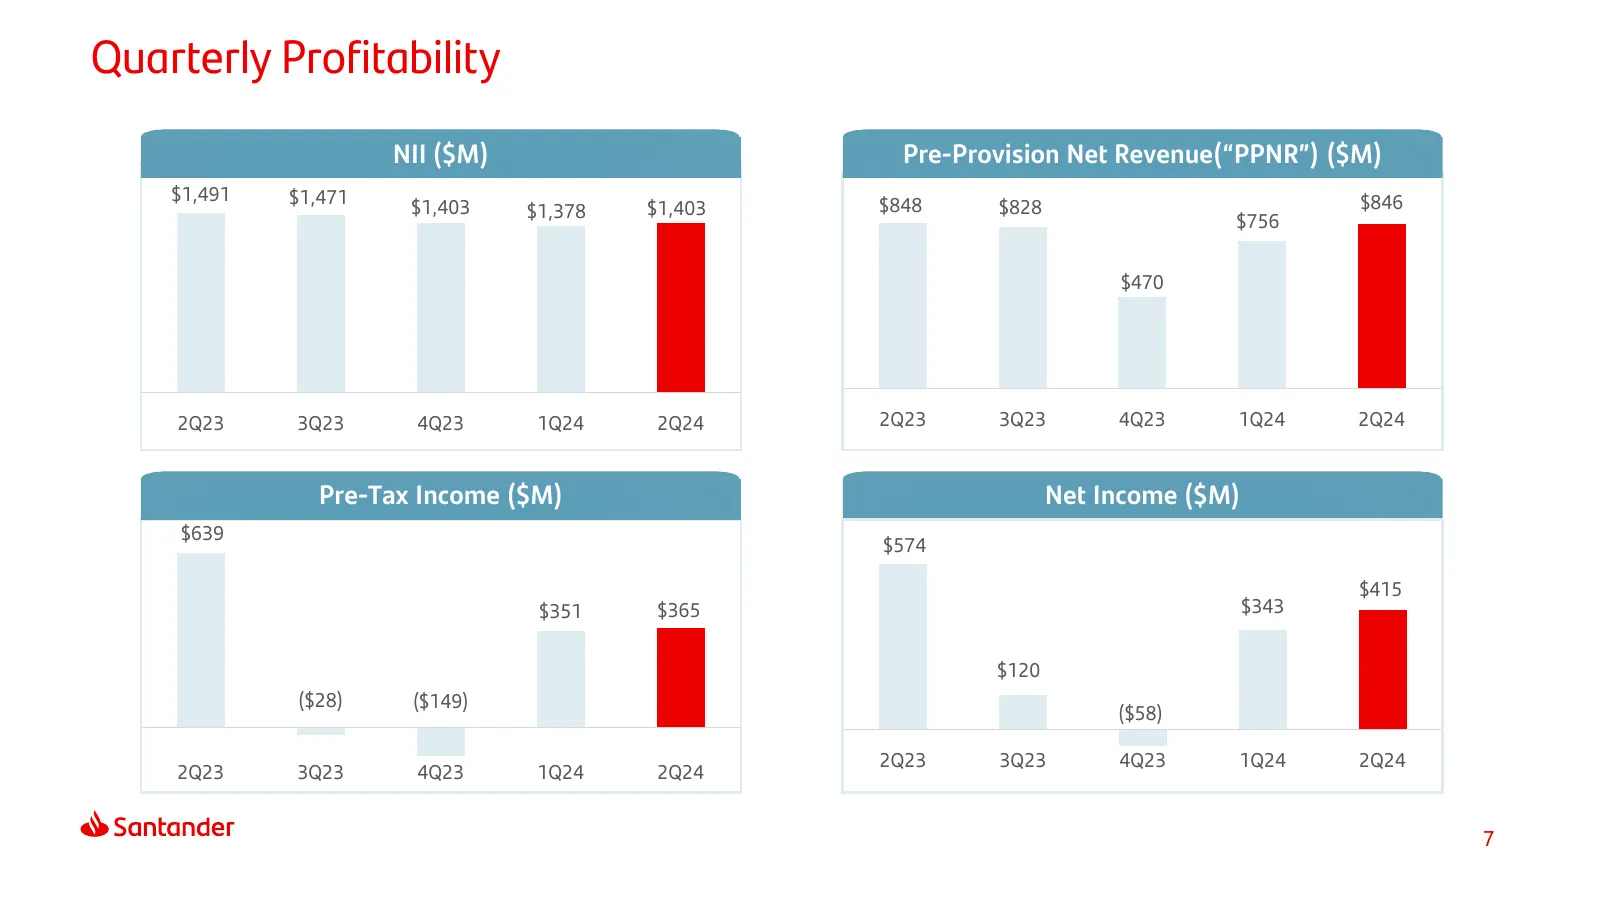
Slide 7: Quarterly Profitability
Quarterly Profitability NII ($M) Pre-Provision Net Revenue(“PPNR”) ($M) $1,491 $1,471 $846 $1,403 $1,378 $1,403 $848 $828 $756 $470 2Q23 3Q23 4Q23 1Q24 2Q24 2Q23 3Q23 4Q23 1Q24 2Q24 Pre-Tax Income ($M) Net Income ($M) $639 $574 $415 $351 $365 $343 $120 ($28) ($149) ($58) 2Q23 3Q23 4Q23 1Q24 2Q24 2Q2
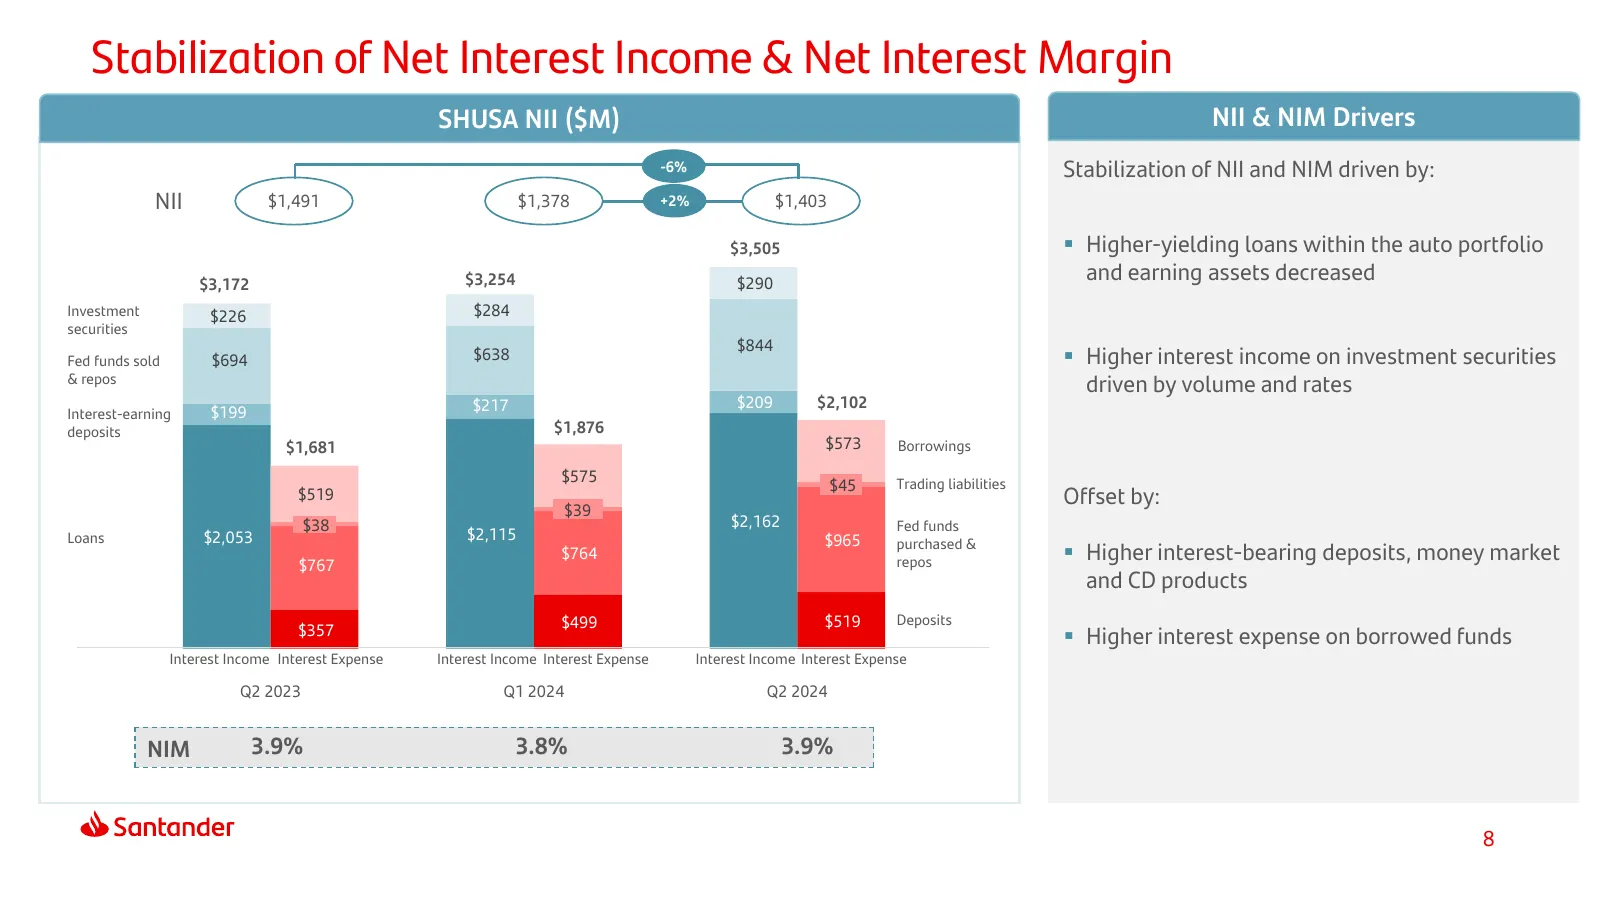
Slide 8: Stabilization of Net Interest Income & Net Interest Margin
Stabilization of Net Interest Income & Net Interest Margin SHUSA NII ($M) NII & NIM Drivers -6% Stabilization of NII and NIM driven by: NII $1,491 $1,378 +2% $1,403 $3,505 Higher-yielding loans within the auto portfolio $3,172 $3,254 $290 and earning assets decreased Investment $226 $284 securitie
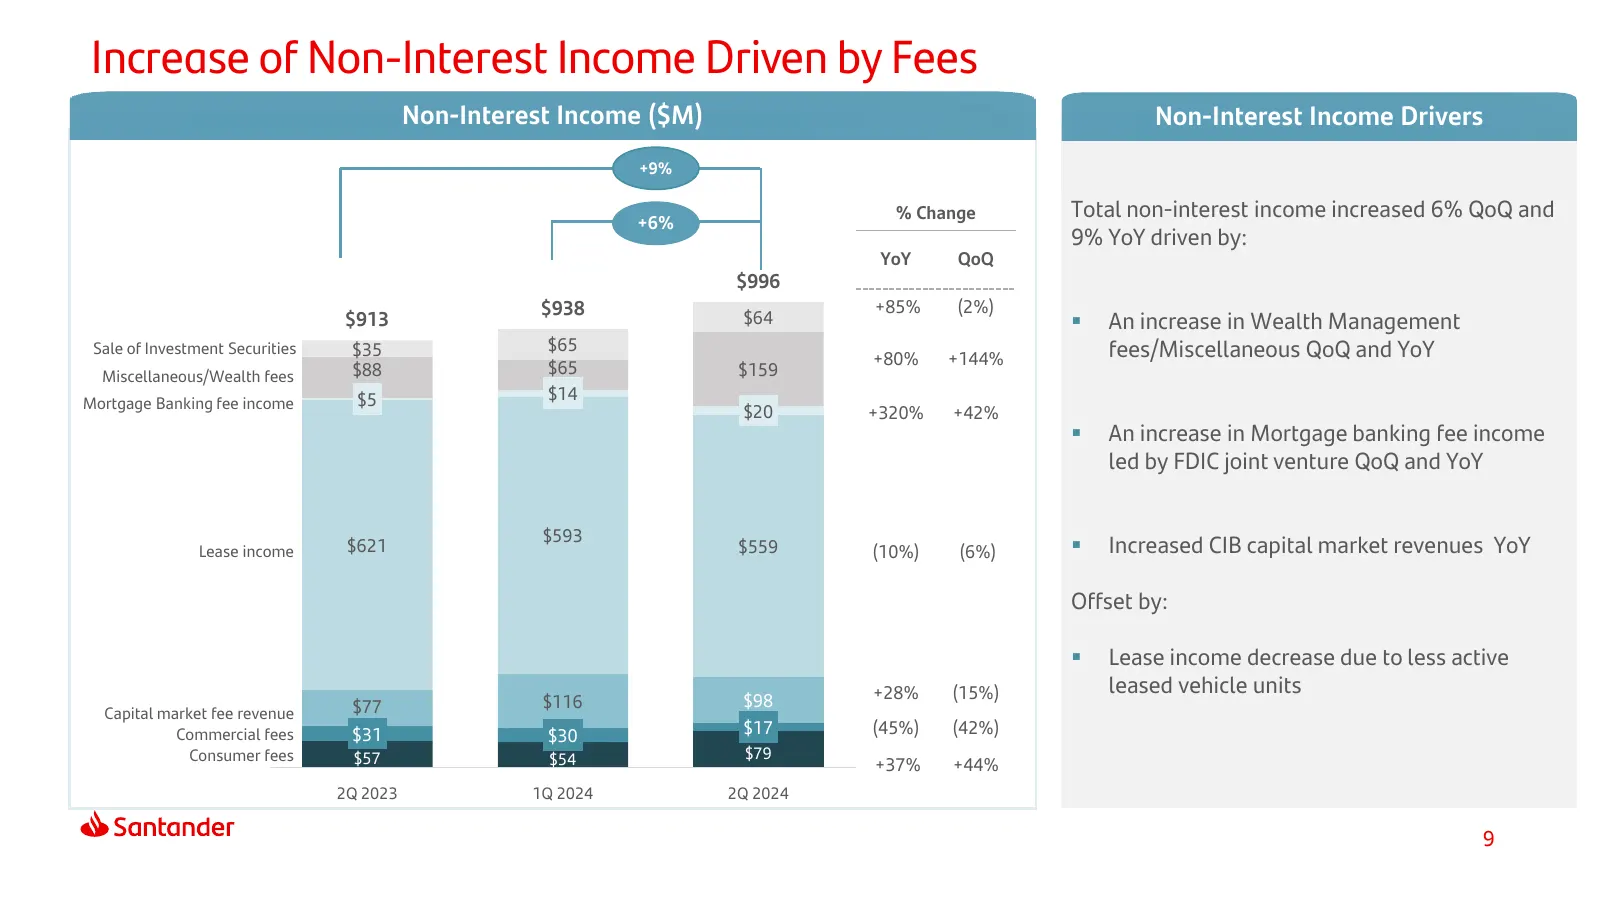
Slide 9: Increase of Non-Interest Income Driven by Fees
Increase of Non-Interest Income Driven by Fees Non-Interest Income ($M) Non-Interest Income Drivers +9% % Change Total non-interest income increased 6% QoQ and +6% 9% YoY driven by: YoY QoQ $996 $938 +85% (2%) $913 $64 An increase in Wealth Management Sale of Investment Securities $35 $65 fees/Mis
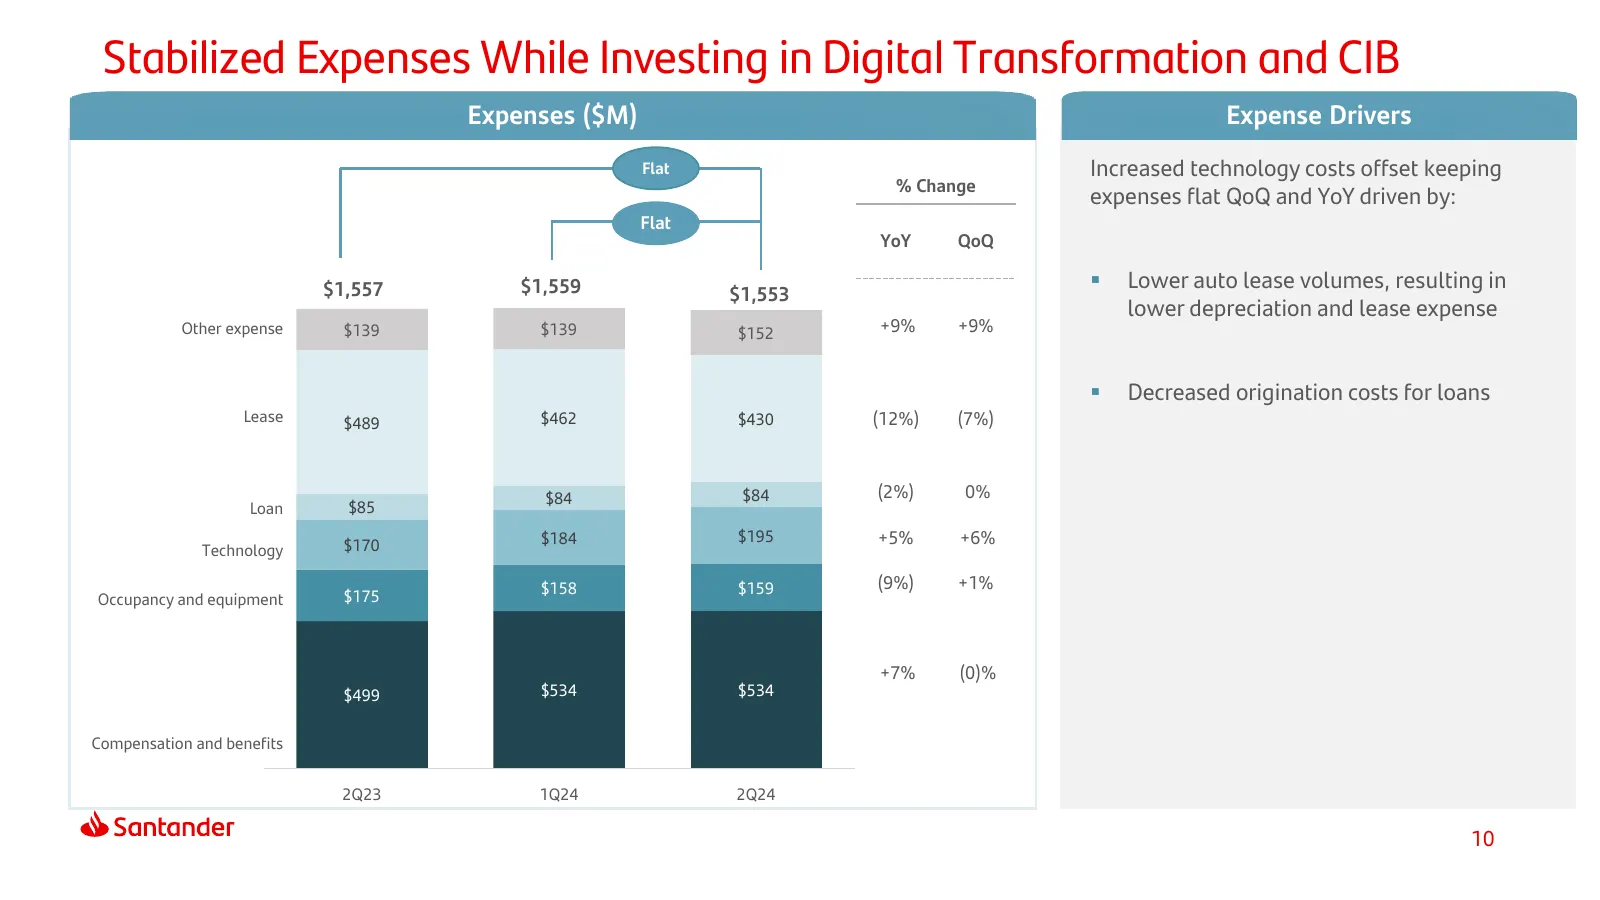
Slide 10: Stabilized Expenses While Investing in Digital Transformation and CIB
Stabilized Expenses While Investing in Digital Transformation and CIB Expenses ($M) Expense Drivers Flat Increased technology costs offset keeping % Change expenses flat QoQ and YoY driven by: Flat YoY QoQ $1,557 $1,559 Lower auto lease volumes, resulting in $1,553 lower depreciation and lease exp
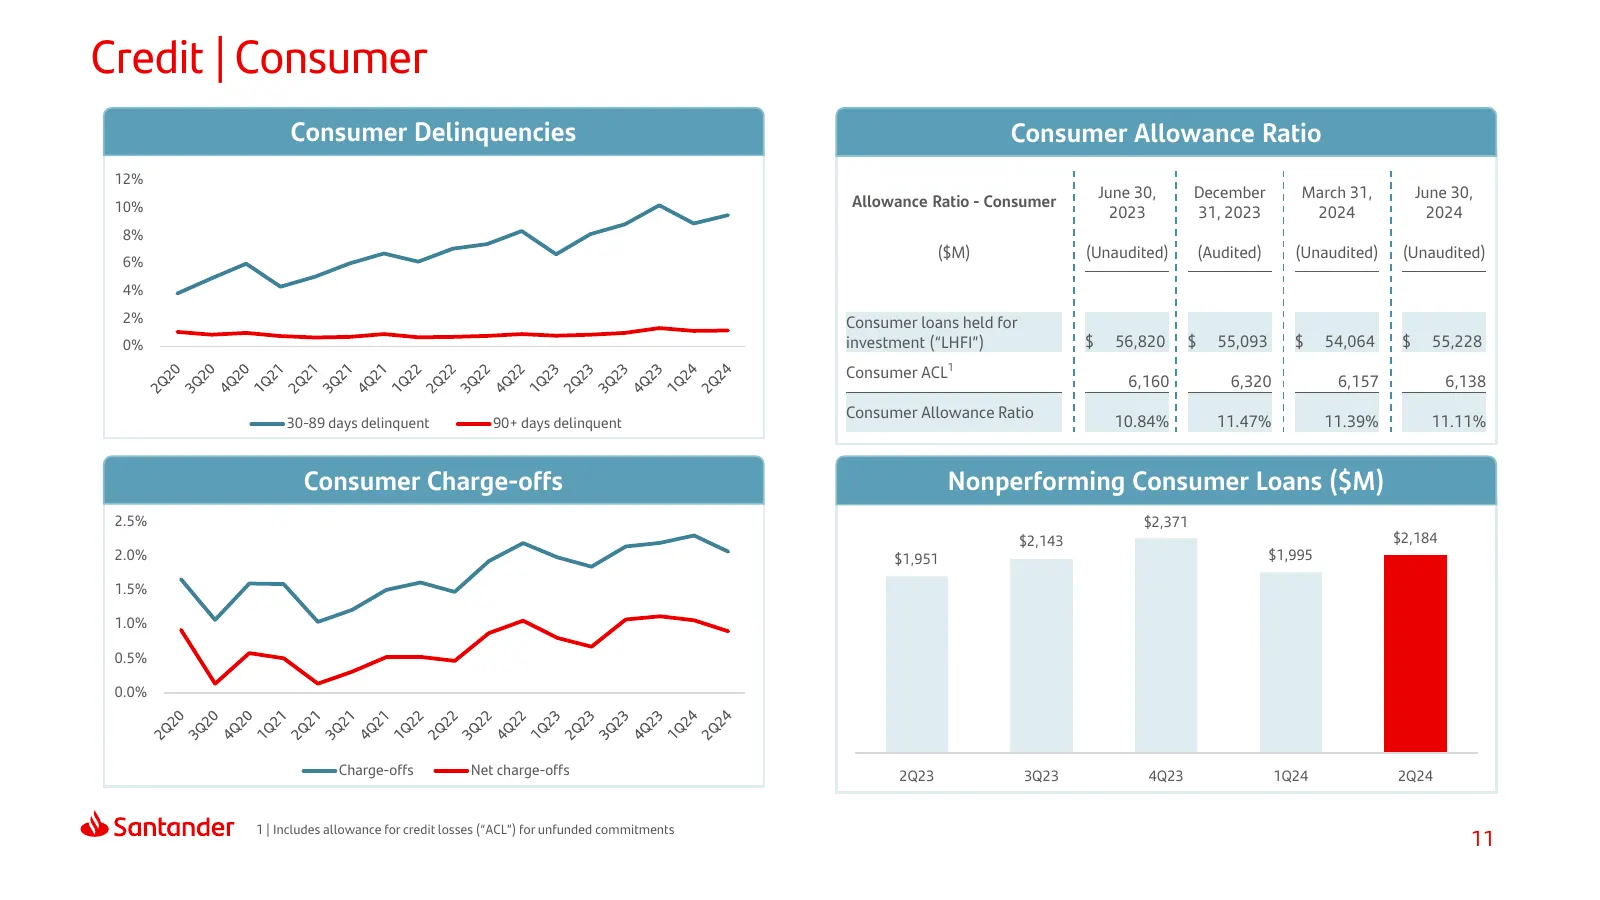
Slide 11: Credit | Consumer
Credit | Consumer Consumer Delinquencies Consumer Allowance Ratio 12% June 30, December March 31, June 30, 10% Allowance Ratio - Consumer 2023 31, 2023 2024 2024 8% ($M) (Unaudited) (Audited) (Unaudited) (Unaudited) 6% 4% 2% Consumer loans held for 0% investment (“LHFI”) $ 56,820 $ 55,093 $ 54,064 $
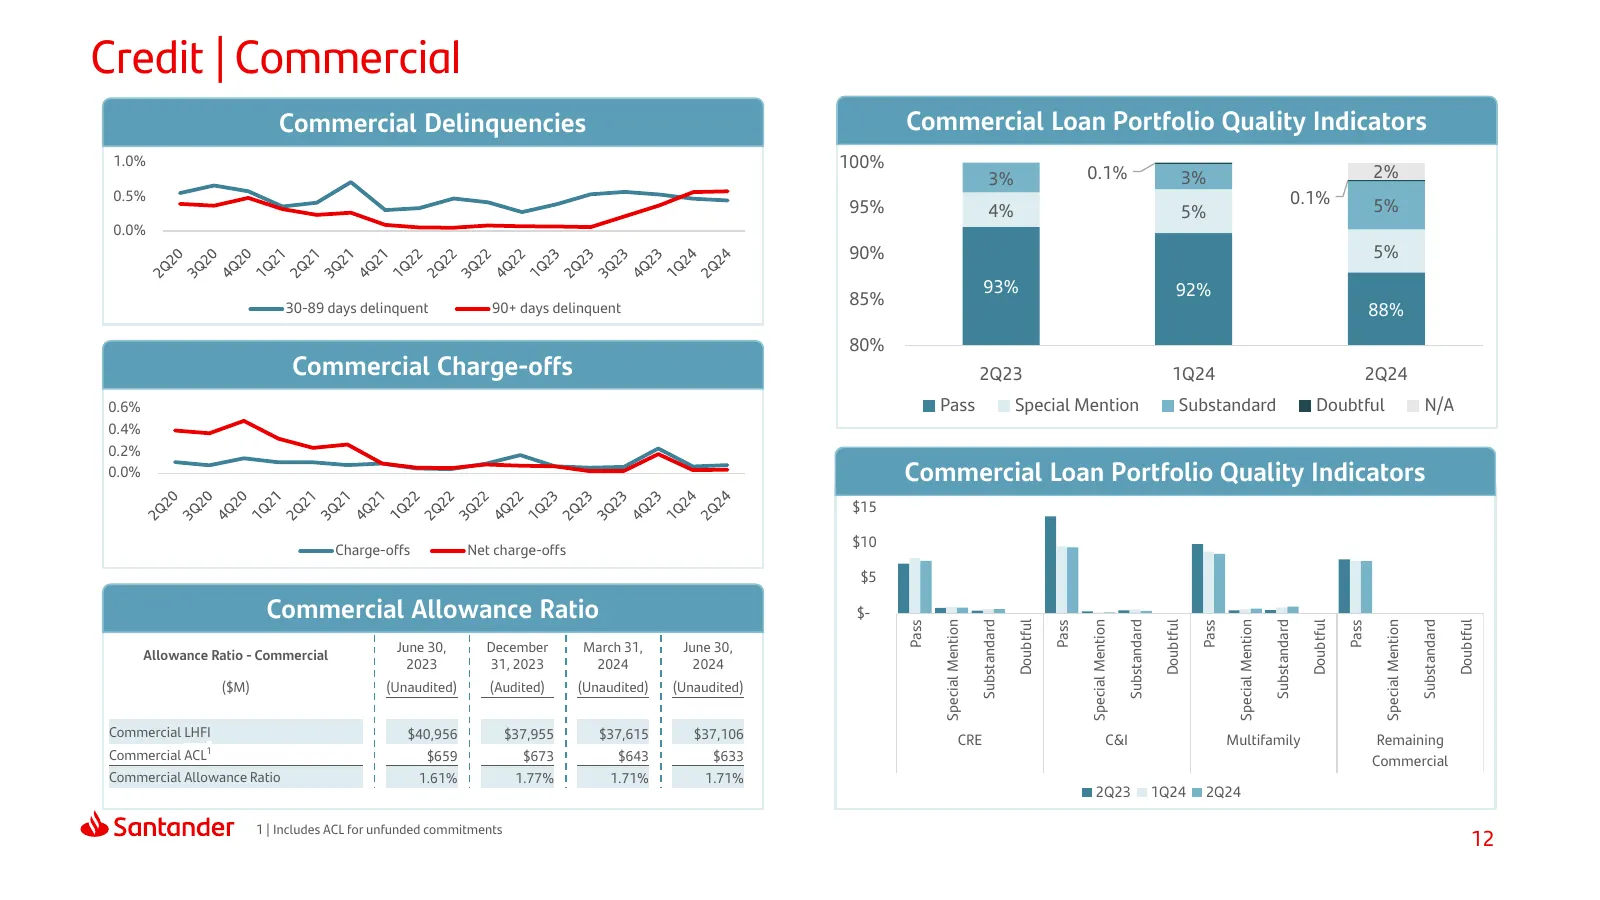
Slide 12: Credit | Commercial
Credit | Commercial Commercial Delinquencies Commercial Loan Portfolio Quality Indicators 1.0% 100% 3% 0.1% 3% 2% 0.5% 0.1% 5% 95% 4% 5% 0.0% 90% 5% 93% 92% 85% 30-89 days delinquent 90+ days delinquent 88% 80% Commercial Charge-offs 2Q23 1Q24 2Q24 0.6% Pass Special Mention Substandard Doubtful N/A
Slide 13: Q2 Balance Sheet Overview
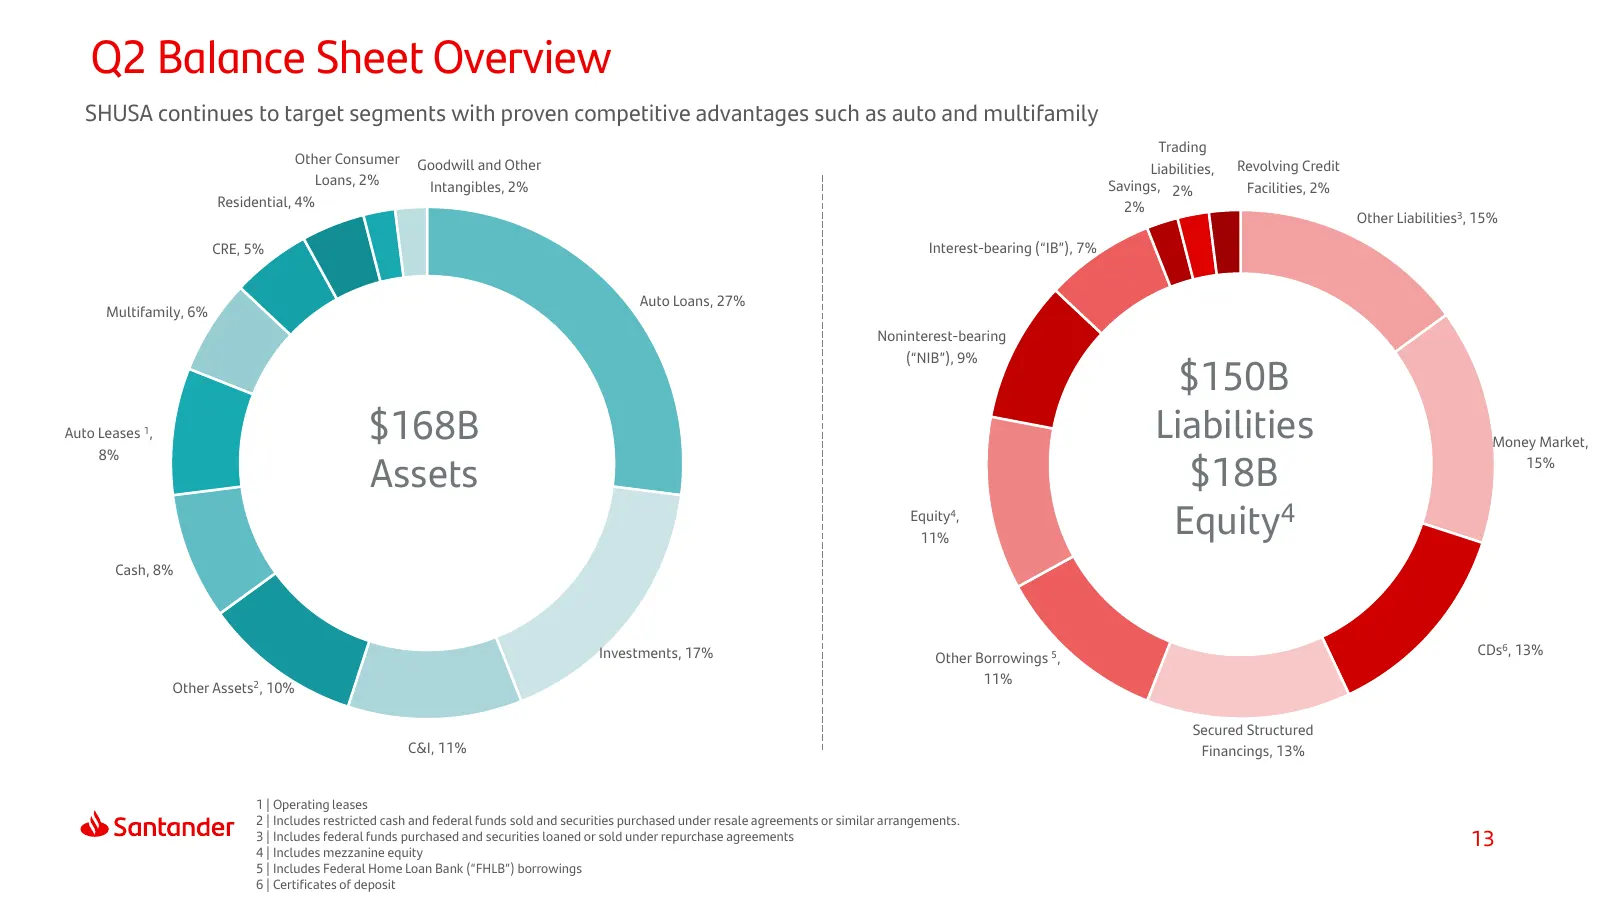
Q2 Balance Sheet Overview SHUSA continues to target segments with proven competitive advantages such as auto and multifamily Trading Other Consumer Goodwill and Other Revolving Credit Liabilities, Loans, 2% Intangibles, 2% Savings, 2% Facilities, 2% Residential, 4% 2% Other Liabilities3, 15% CRE, 5%
Slide 14: Balance Sheet Trends | Assets
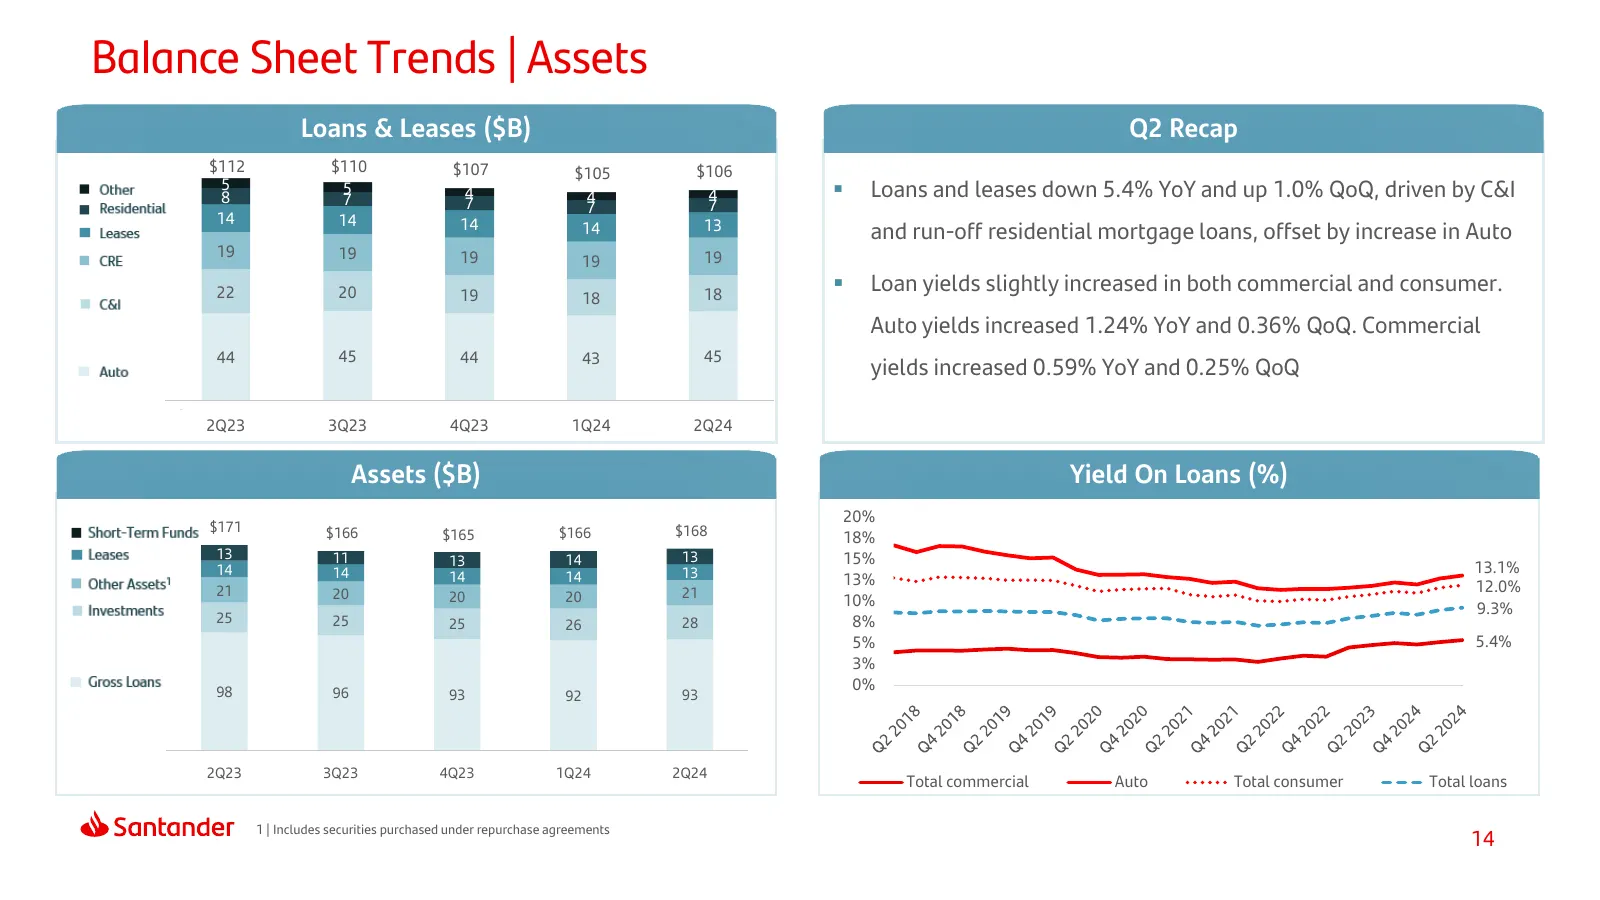
Balance Sheet Trends | Assets Loans & Leases ($B) Q2 Recap $112 $110 $107 $105 $106 5 8 5 7 4 4 4 Loans and leases down 5.4% YoY and up 1.0% QoQ, driven by C&I 7 7 7 14 14 14 13 14 and run-off residential mortgage loans, offset by increase in Auto 19 19 19 19 19 22 20 19 18 Loan yields slightly
Slide 15: Balance Sheet Trends | Liabilities
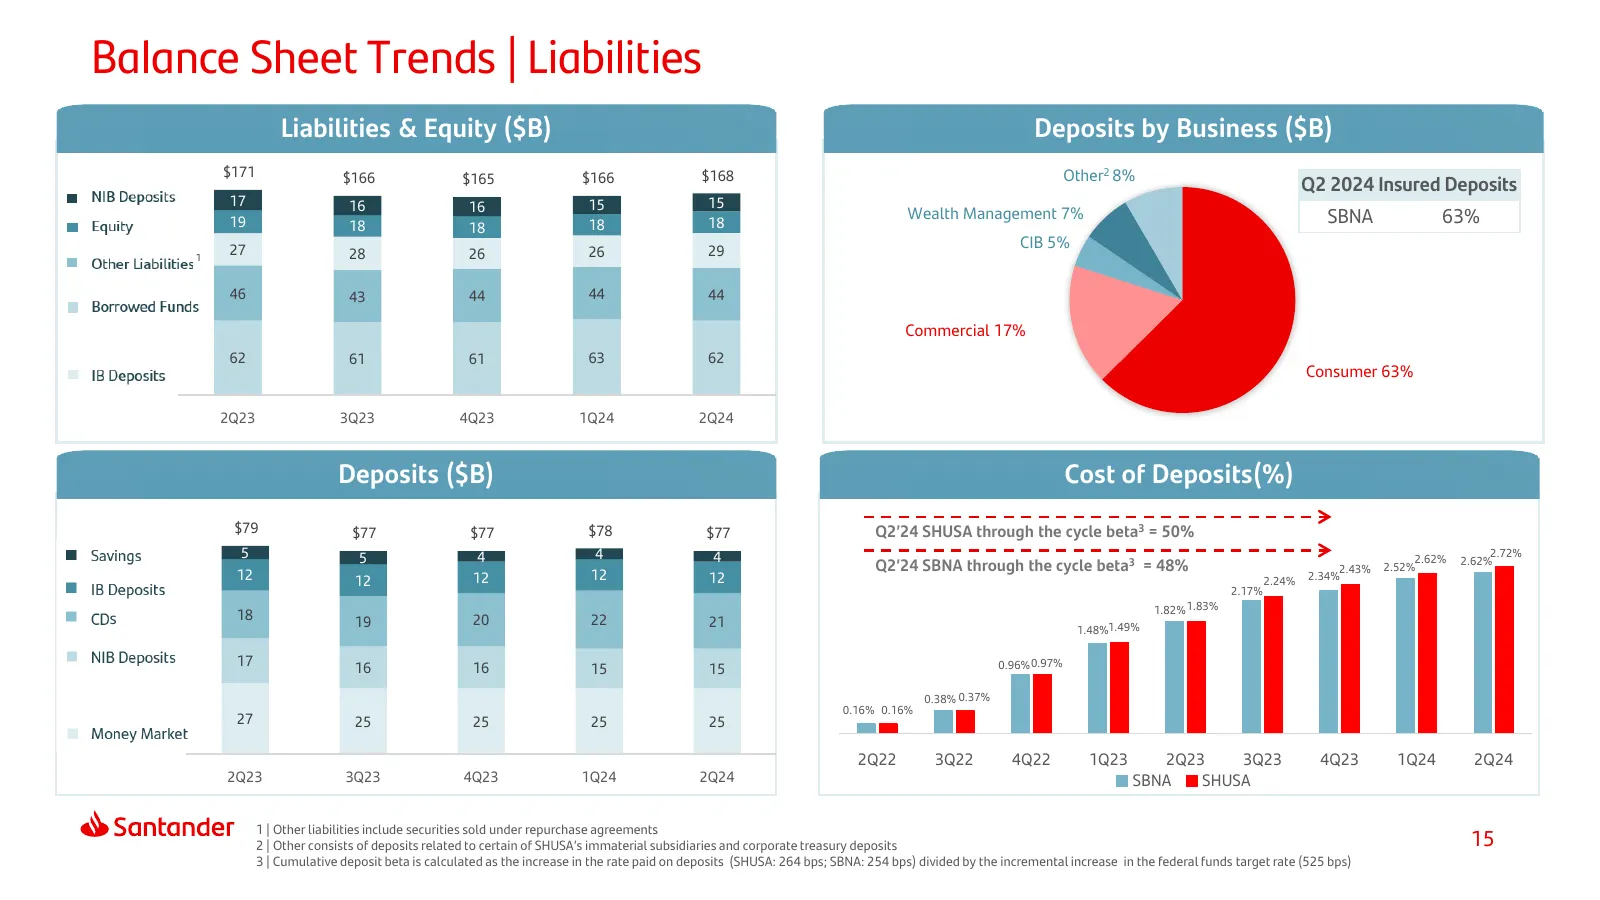
Balance Sheet Trends | Liabilities Liabilities & Equity ($B) Deposits by Business ($B) $171 $166 $165 $166 $168 Other2 8% Q2 2024 Insured Deposits 17 16 16 15 15 19 18 18 18 Wealth Management 7% SBNA 63% 18 27 29 CIB 5% 1 28 26 26 46 43 44 44 44 Commercial 17% 62 61 61 63 62 Consumer 63% 2Q23 3Q23 4
Slide 16: Liquidity & Wholesale Funding
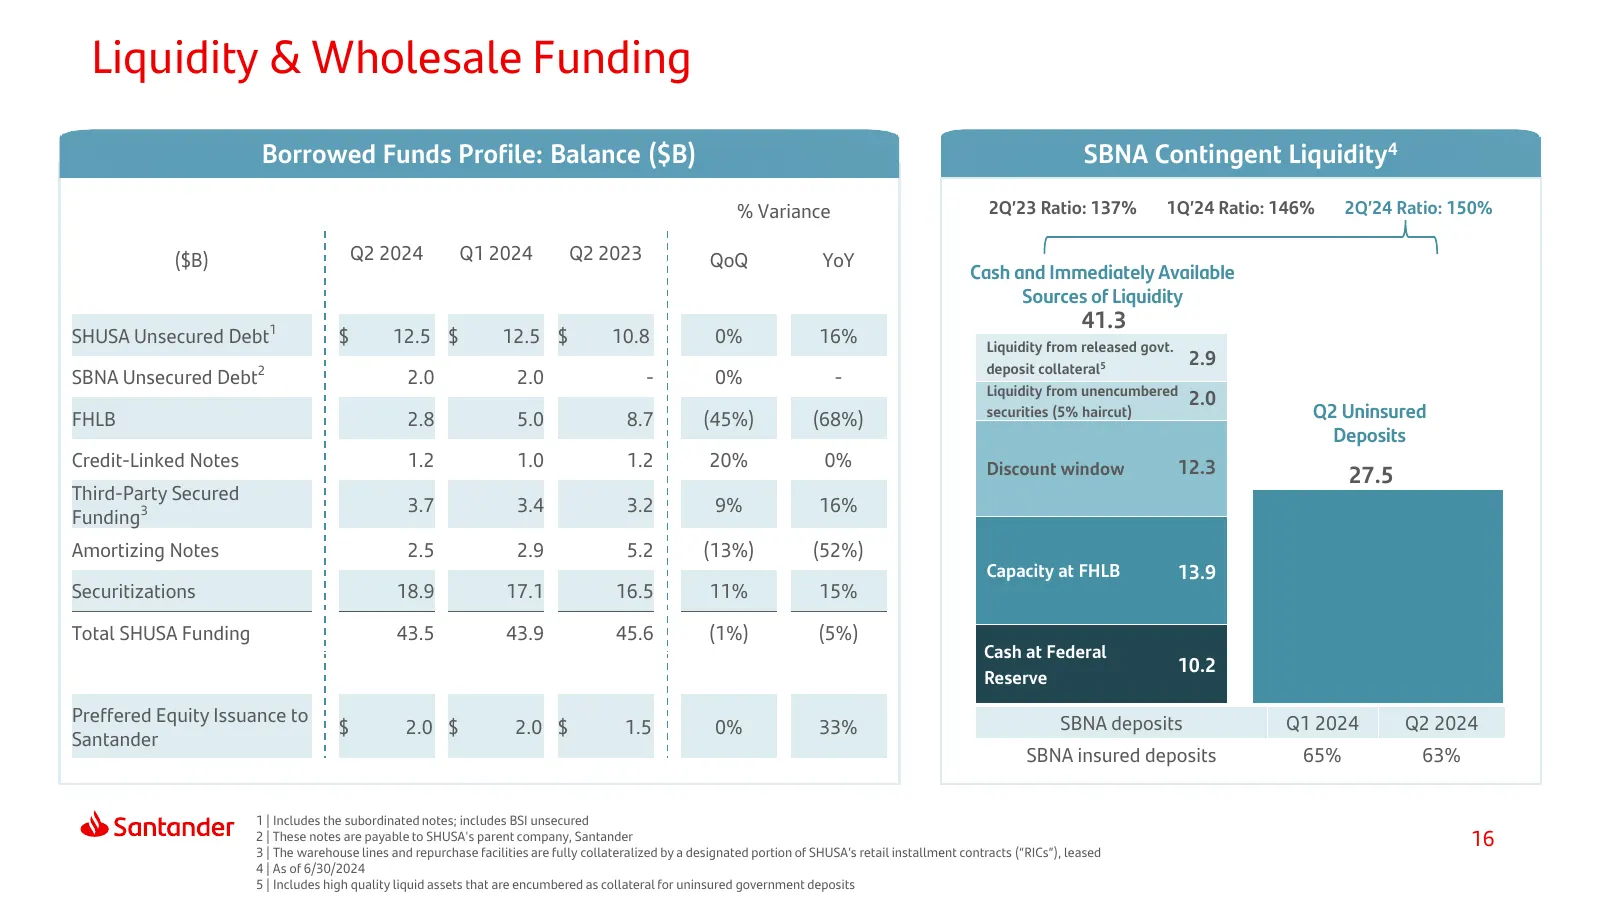
Liquidity & Wholesale Funding Borrowed Funds Profile: Balance ($B) SBNA Contingent Liquidity4 % Variance 2Q’23 Ratio: 137% 1Q’24 Ratio: 146% 2Q’24 Ratio: 150% ($B) Q2 2024 Q1 2024 Q2 2023 QoQ YoY Cash and Immediately Available Sources of Liquidity 41.3 SHUSA Unsecured Debt1 $ 12.5 $ 12.5 $ 10.8 0% 1
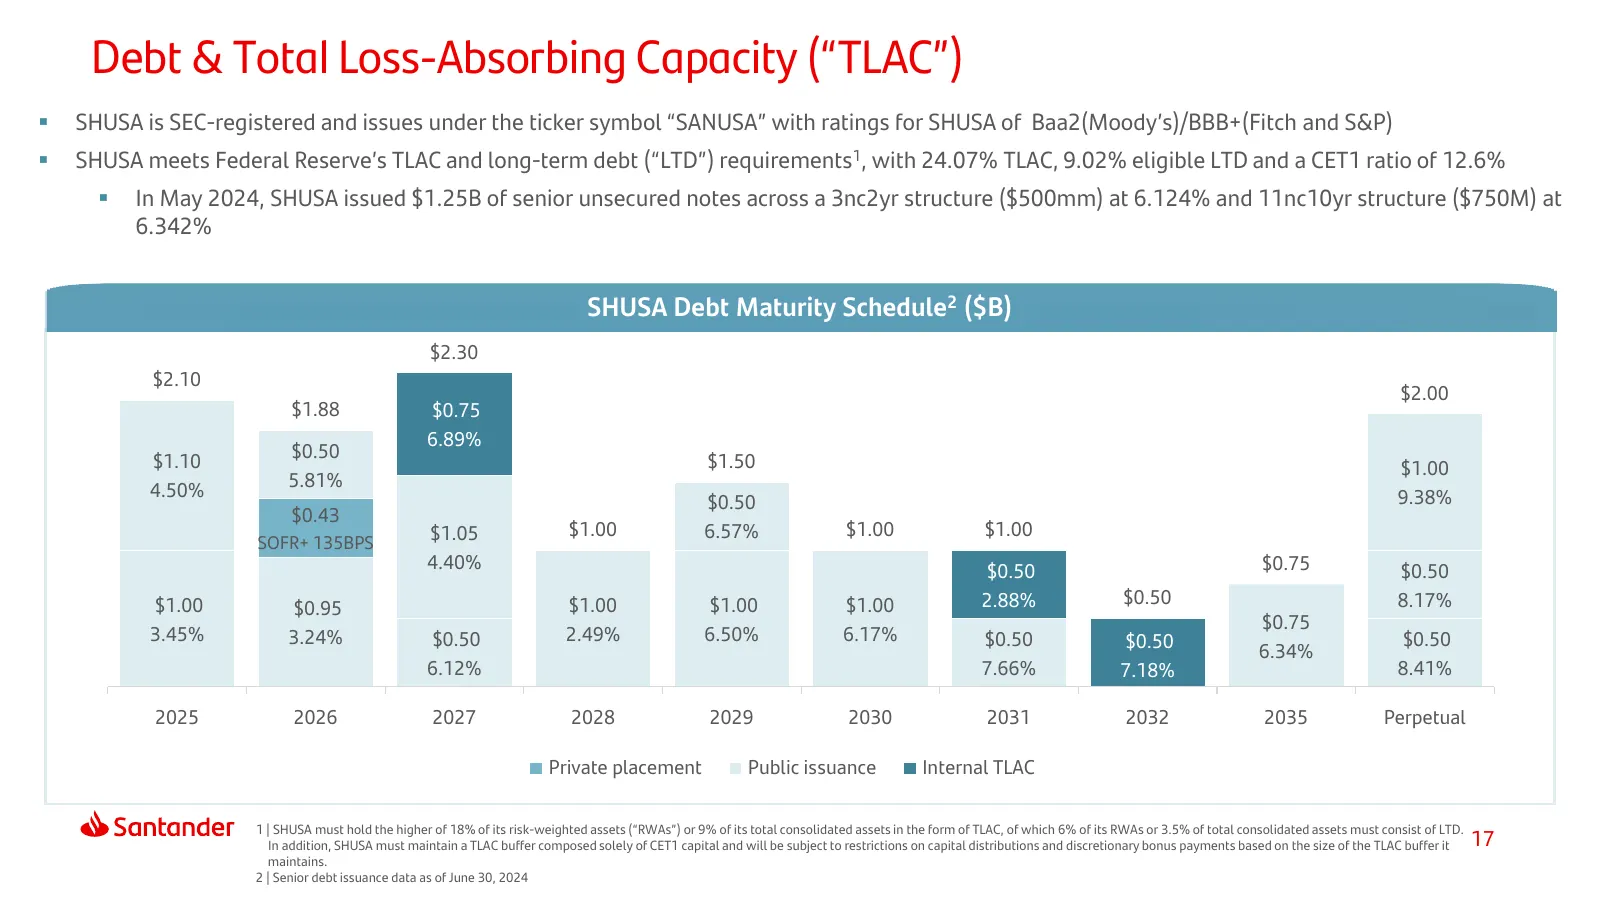
Slide 17: Debt & Total Loss-Absorbing Capacity (TLAC)
Debt & Total Loss-Absorbing Capacity (“TLAC”) SHUSA is SEC-registered and issues under the ticker symbol “SANUSA” with ratings for SHUSA of Baa2(Moody’s)/BBB+(Fitch and S&P) SHUSA meets Federal Reserve’s TLAC and long-term debt (“LTD”) requirements1, with 24.07% TLAC, 9.02% eligible LTD and a CE
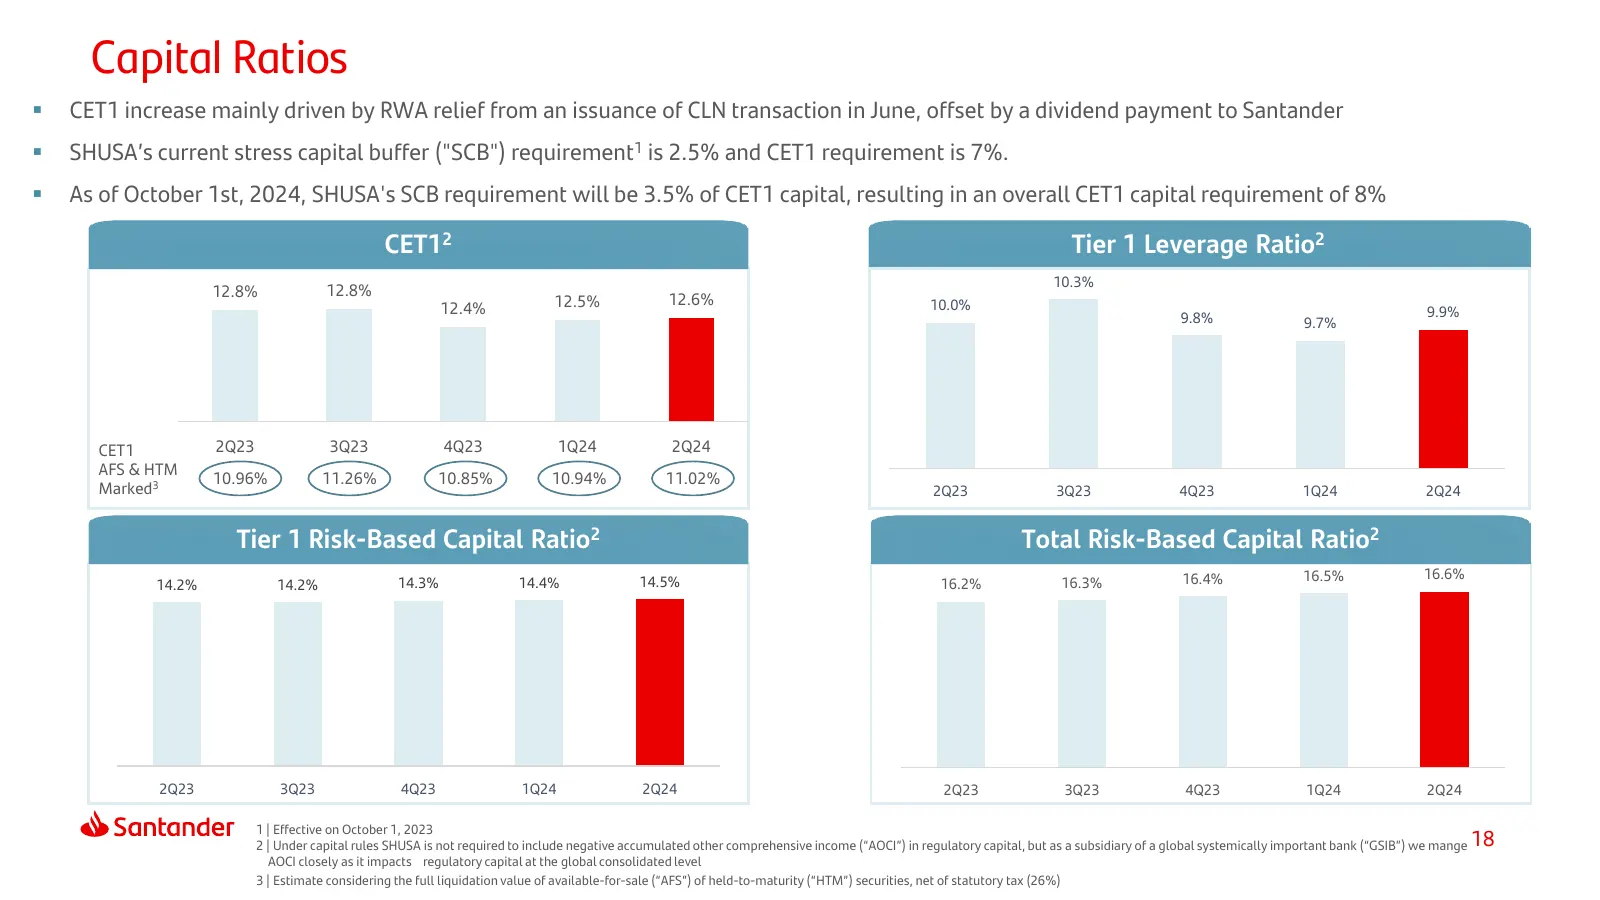
Slide 18: Capital Ratios
Capital Ratios CET1 increase mainly driven by RWA relief from an issuance of CLN transaction in June, offset by a dividend payment to Santander SHUSA’s current stress capital buffer ("SCB") requirement1 is 2.5% and CET1 requirement is 7%. As of October 1st, 2024, SHUSA's SCB requirement will b
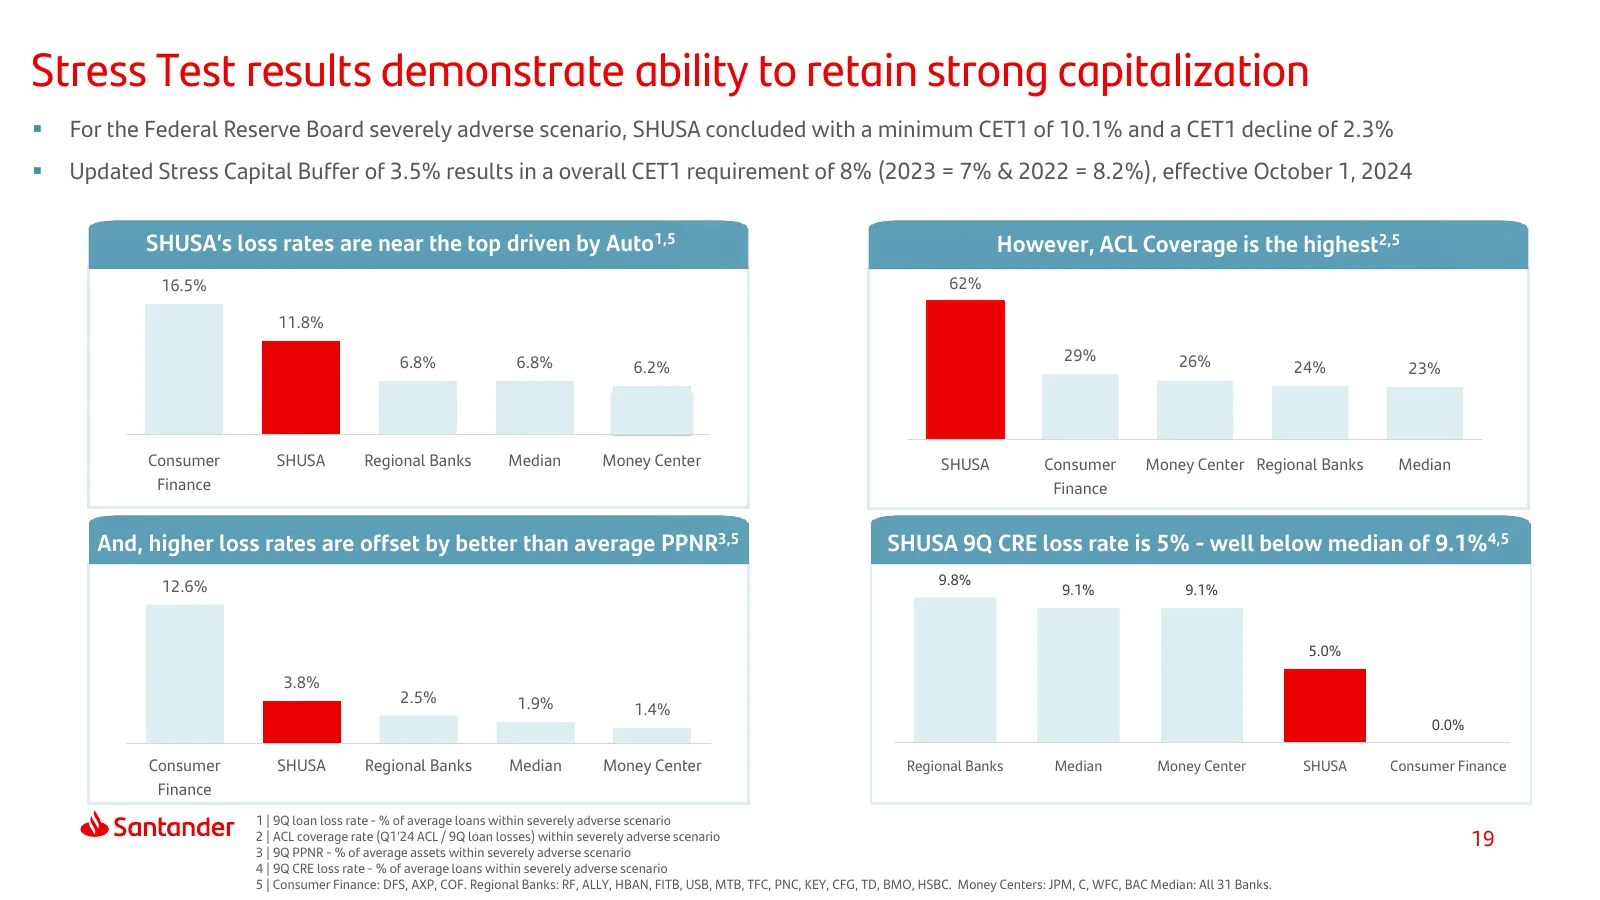
Slide 19: Stress Test results demonstrate ability to retain strong capitalization
Stress Test results demonstrate ability to retain strong capitalization For the Federal Reserve Board severely adverse scenario, SHUSA concluded with a minimum CET1 of 10.1% and a CET1 decline of 2.3% Updated Stress Capital Buffer of 3.5% results in a overall CET1 requirement of 8% (2023 = 7% &
Slide 20: Index
Index 1 2 3 4 At a Glance Results Core Appendix Business Activities 20
Slide 21: SHUSA
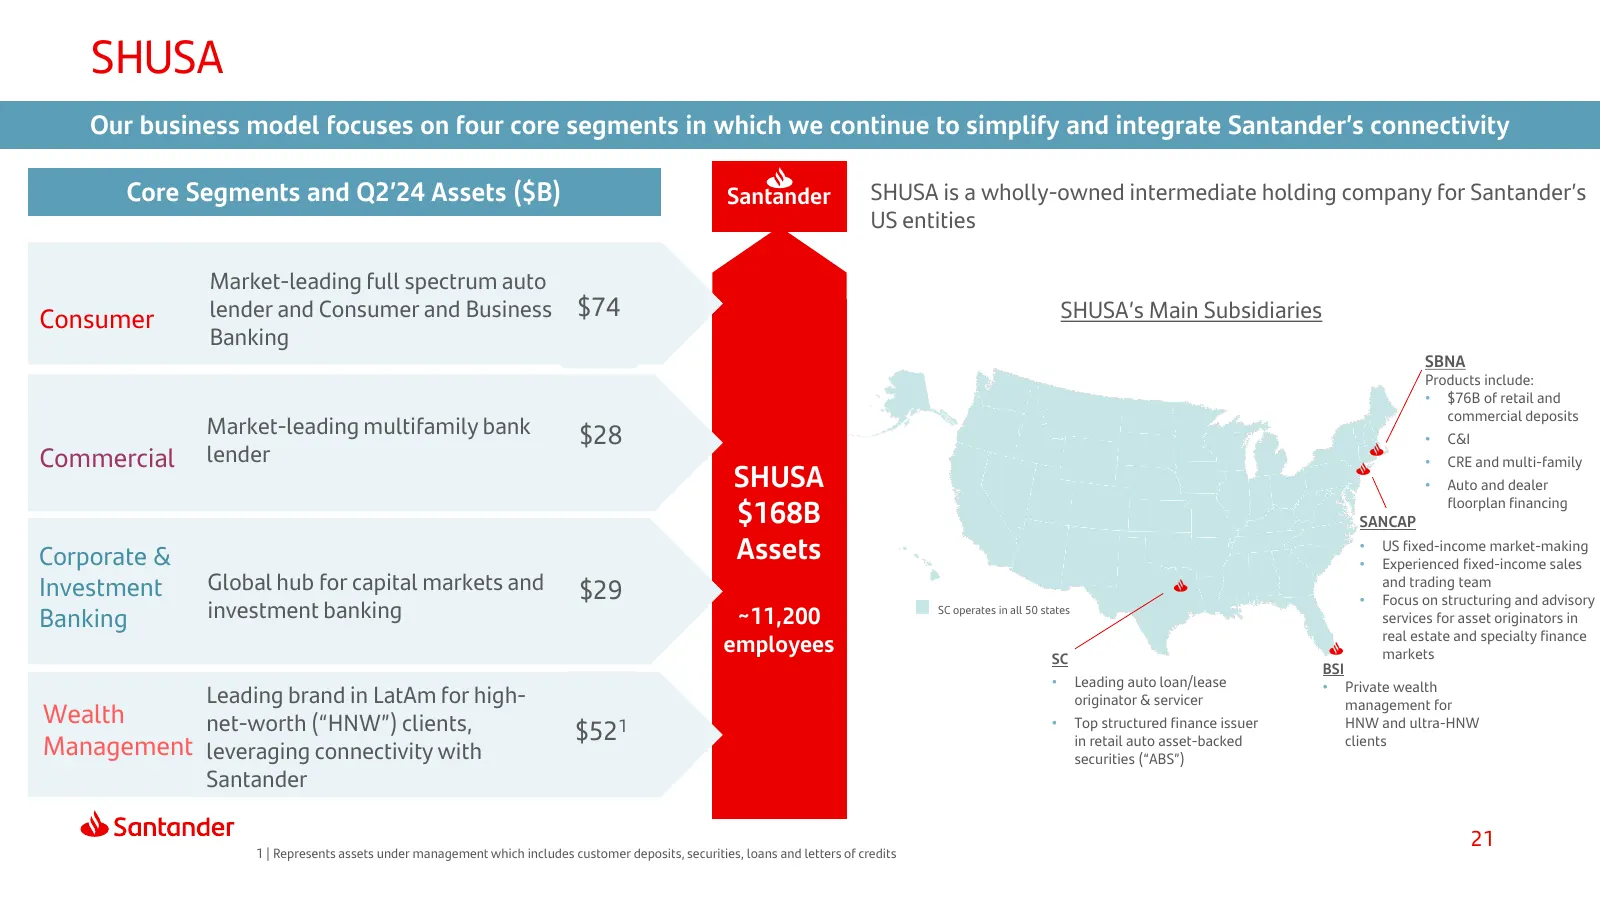
SHUSA Our business model focuses on four core segments in which we continue to simplify and integrate Santander’s connectivity Core Segments and Q2’24 Assets ($B) Santander SHUSA is a wholly-owned intermediate holding company for Santander’s US entities Market-leading full spectrum auto Consumer len
Slide 22: Business Activities Overview
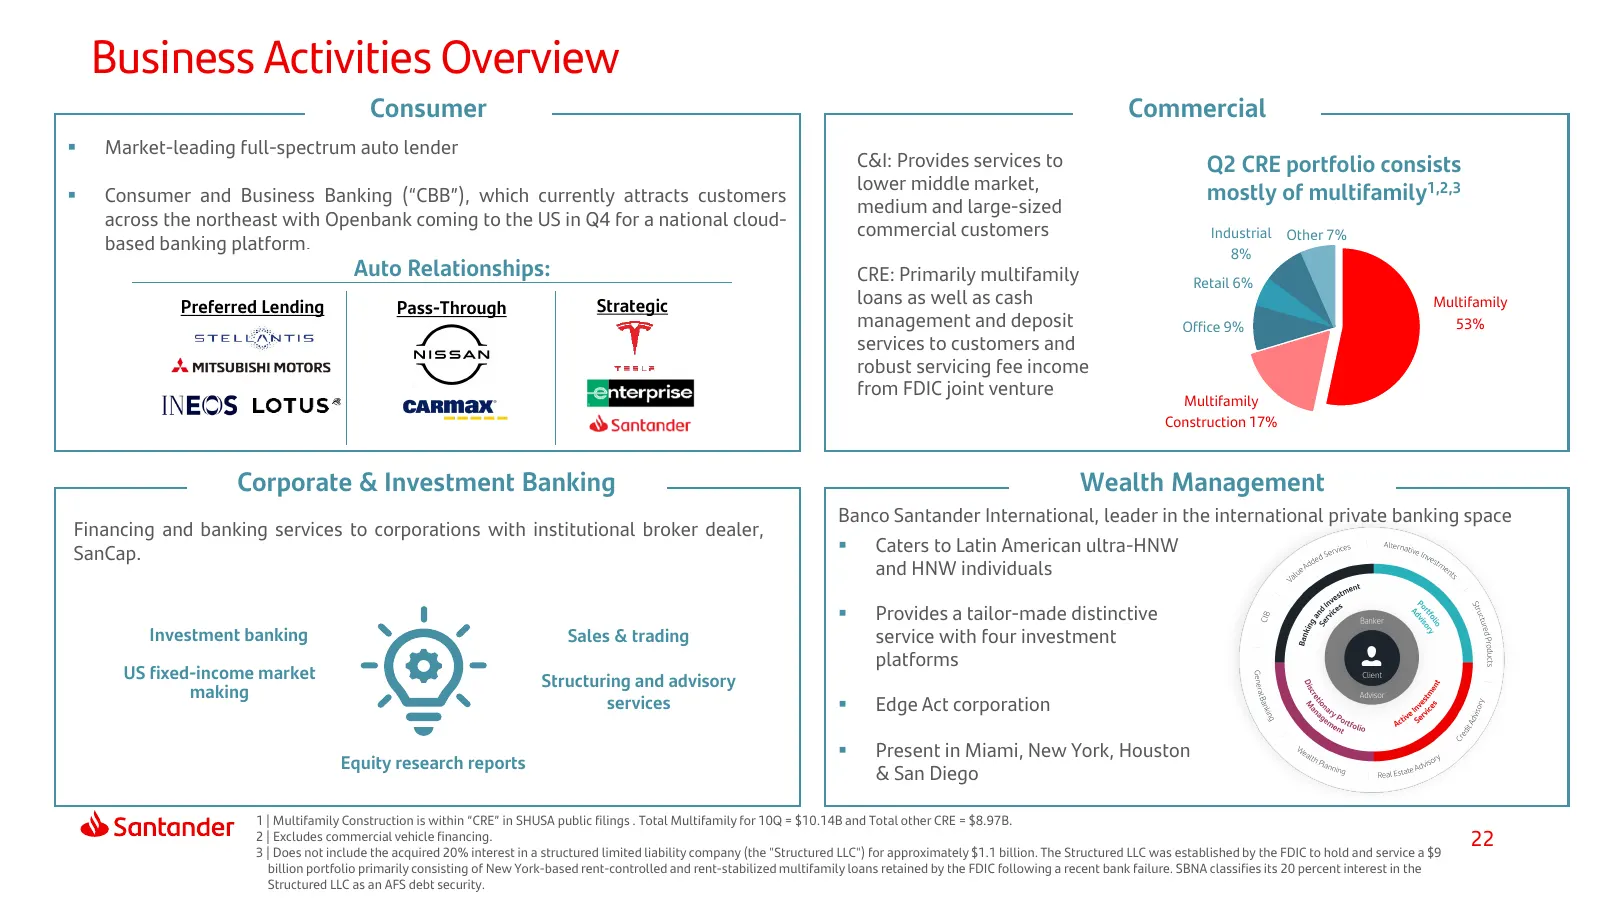
Business Activities Overview Consumer Commercial Market-leading full-spectrum auto lender C&I: Provides services to Q2 CRE portfolio consists lower middle market, mostly of multifamily1,2,3 Consumer and Business Banking (“CBB”), which currently attracts customers medium and large-sized across th
Slide 23: Consumer Activities | Auto and CBB
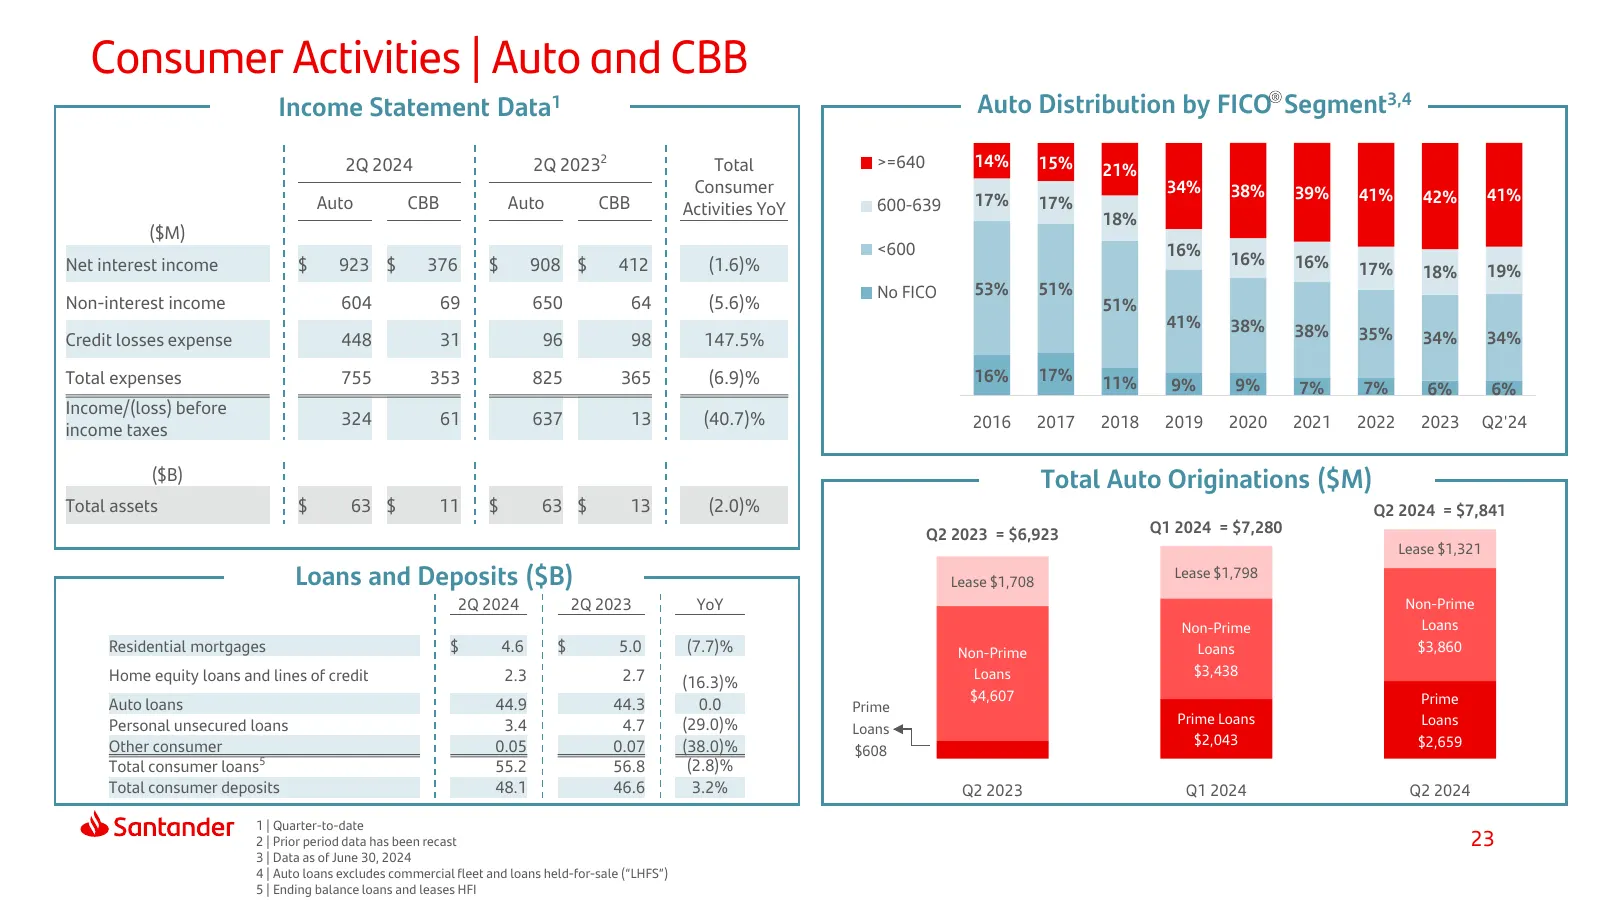
Consumer Activities | Auto and CBB Income Statement Data1 Auto Distribution by FICO Segment3,4 2Q 2024 2Q 20232 Total >=640 14% 15% 21% Consumer 34% 38% 39% 41% 41% Auto CBB Auto CBB 600-639 17% 17% 42% Activities YoY 18% ($M) <600 16% Net interest income $ 923 $ 376 $ 908 $ 412 (1.6)% 16% 16% 17% 1
Slide 24: Commercial Activities | CRE, Multifamily, and C&I
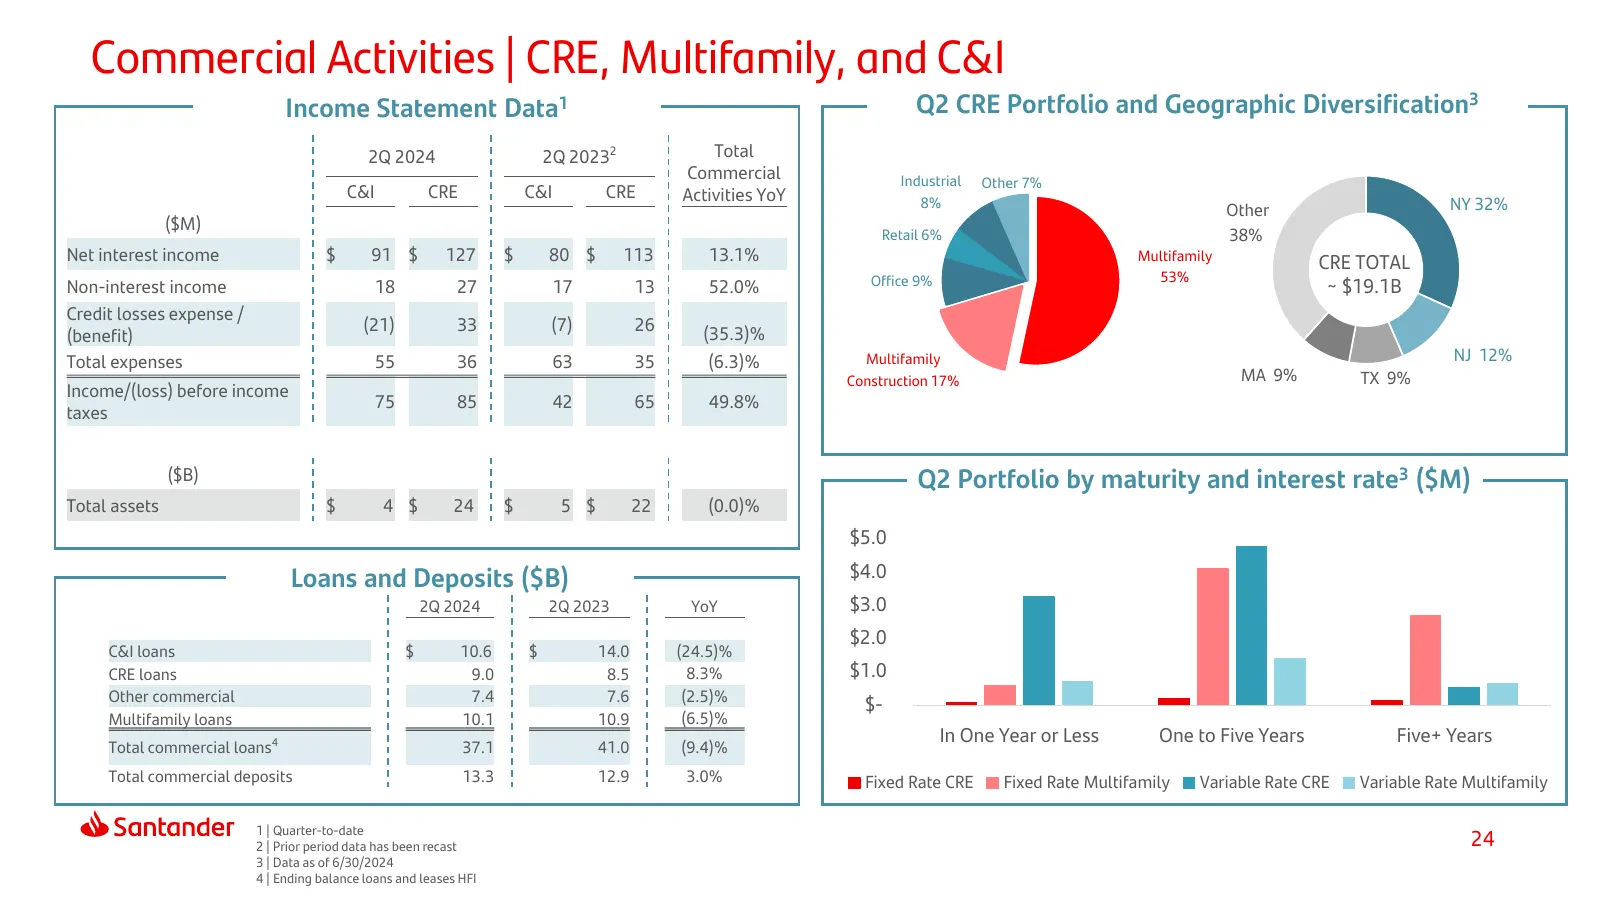
Commercial Activities | CRE, Multifamily, and C&I Income Statement Data1 Q2 CRE Portfolio and Geographic Diversification3 2Q 2024 2Q 20232 Total Commercial Industrial Other 7% C&I CRE C&I CRE Activities YoY 8% Other NY 32% ($M) Retail 6% 38% Net interest income $ 91 $ 127 $ 80 $ 113 13.1% Multifamil
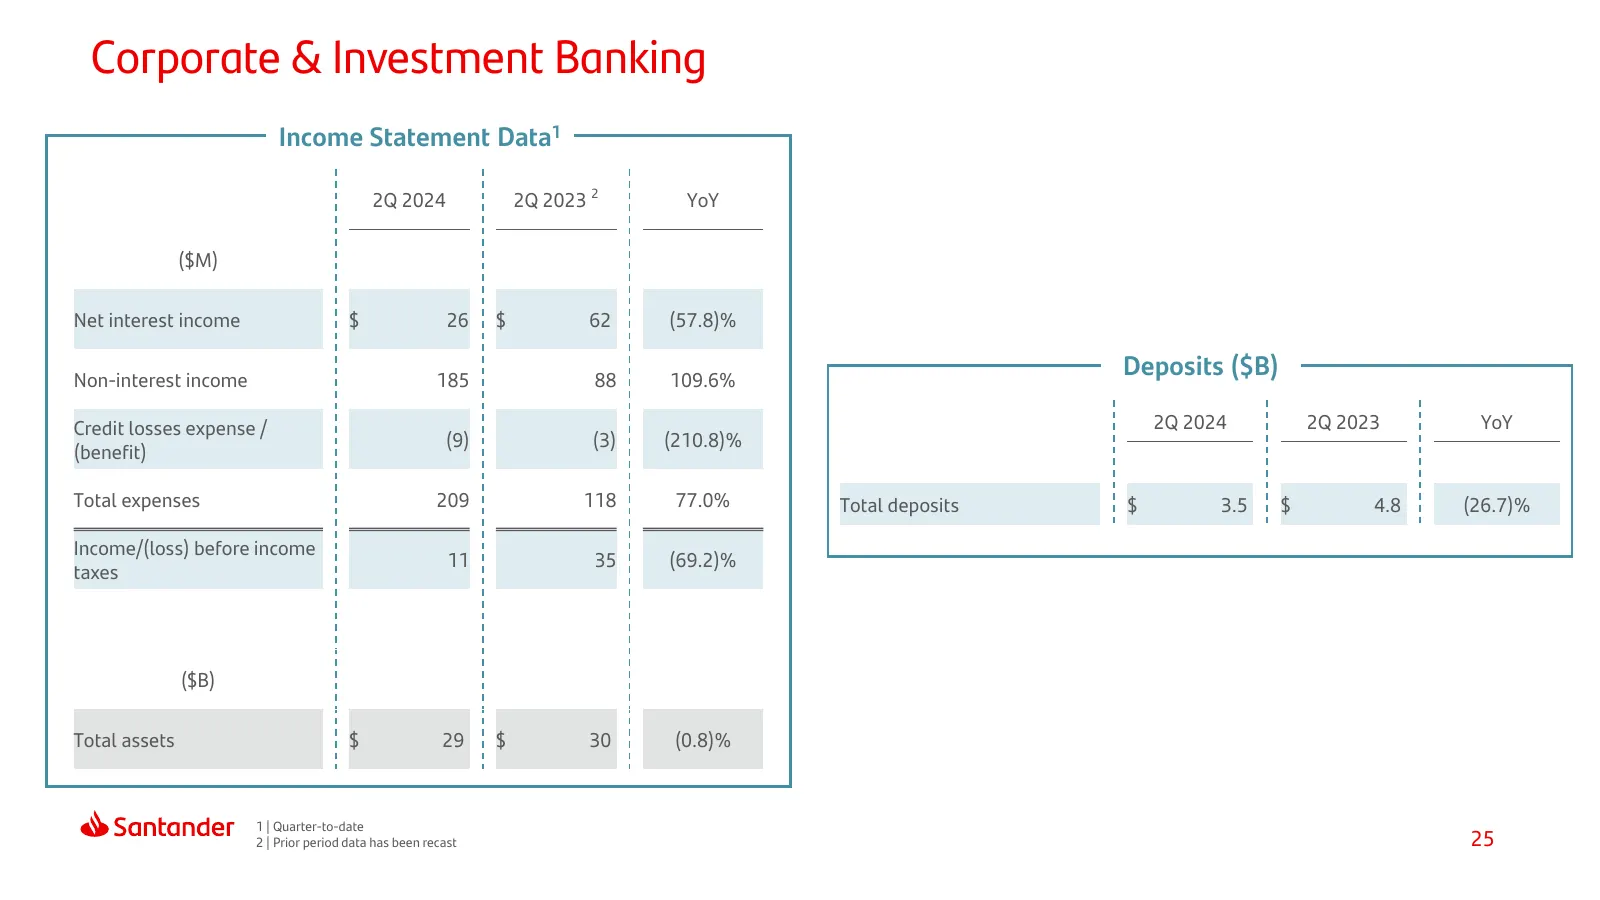
Slide 25: Corporate & Investment Banking
Corporate & Investment Banking Income Statement Data1 2Q 2024 2Q 2023 2 YoY ($M) Net interest income $ 26 $ 62 (57.8)% Non-interest income 185 88 109.6% Deposits ($B) Credit losses expense / 2Q 2024 2Q 2023 YoY (9) (3) (210.8)% (benefit) Total expenses 209 118 77.0% Total deposits $ 3.5 $ 4.8 (26.7)
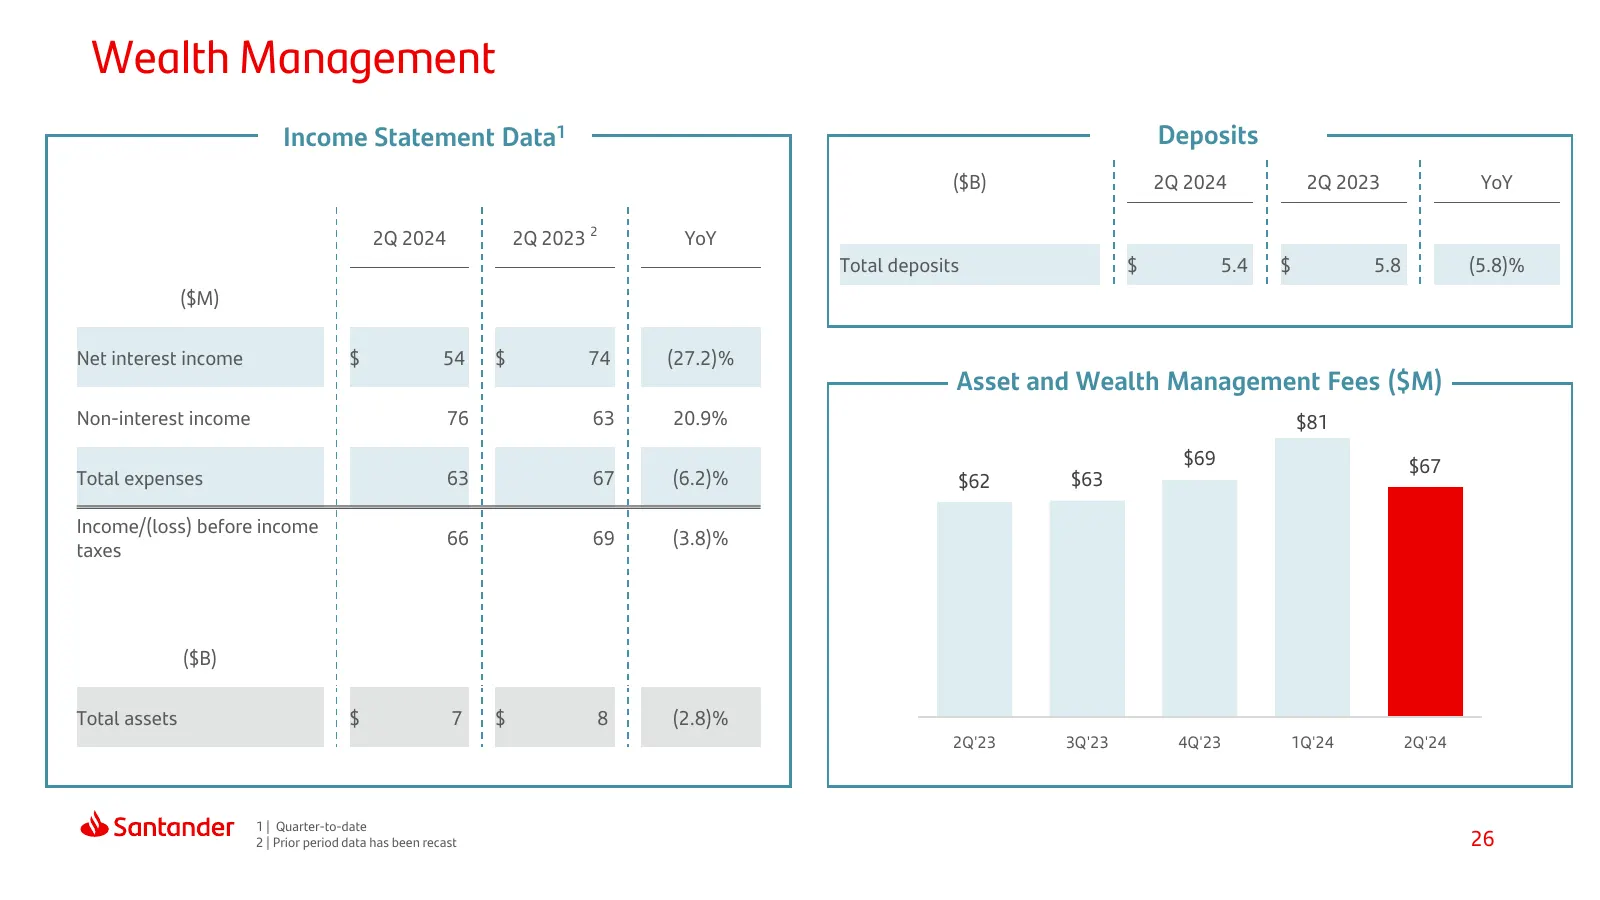
Slide 26: Wealth Management
Wealth Management Income Statement Data1 Deposits ($B) 2Q 2024 2Q 2023 YoY 2Q 2024 2Q 2023 2 YoY Total deposits $ 5.4 $ 5.8 (5.8)% ($M) Net interest income $ 54 $ 74 (27.2)% Asset and Wealth Management Fees ($M) Non-interest income 76 63 20.9% $81 $69 $67 Total expenses 63 67 (6.2)% $62 $63 Income/(
Slide 27: Index
Index 1 2 3 4 At a Glance Results Core Appendix Business Activities 27
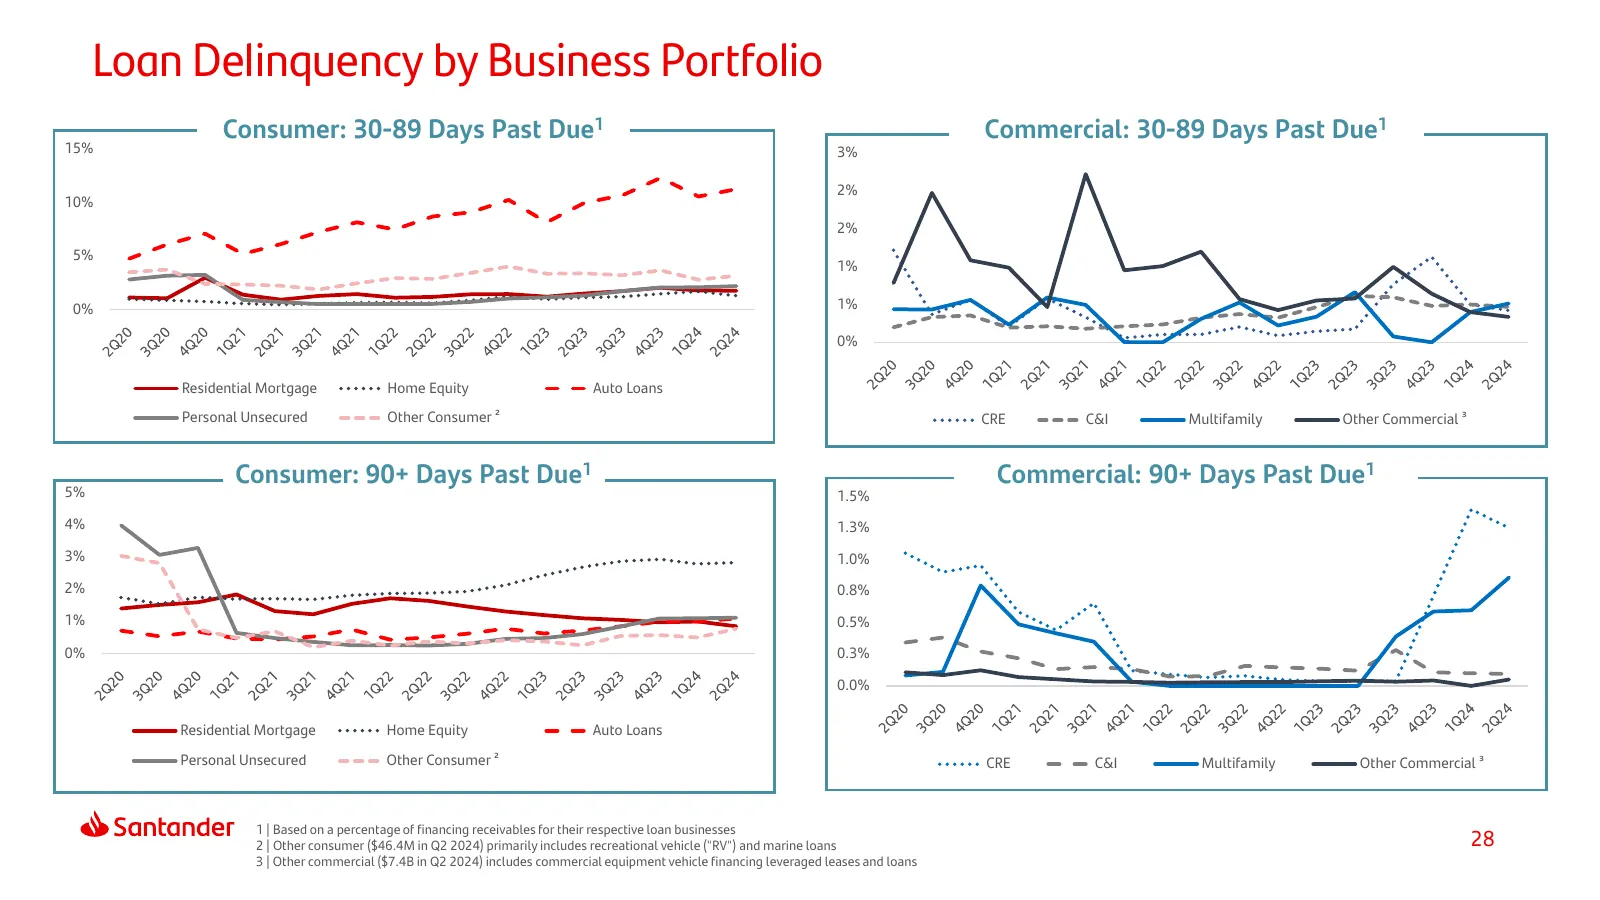
Slide 28: Loan Delinquency by Business Portfolio
Loan Delinquency by Business Portfolio Consumer: 30-89 Days Past Due1 Commercial: 30-89 Days Past Due1 15% 3% 2% 10% 2% 5% 1% 0% 1% 0% Residential Mortgage Home Equity Auto Loans Personal Unsecured Other Consumer ² CRE C&I Multifamily Other Commercial ³ Consumer: 90+ Days Past Due1 Commercial: 90+ D
Slide 29: Charge-offs and Recoveries by Business Portfolio
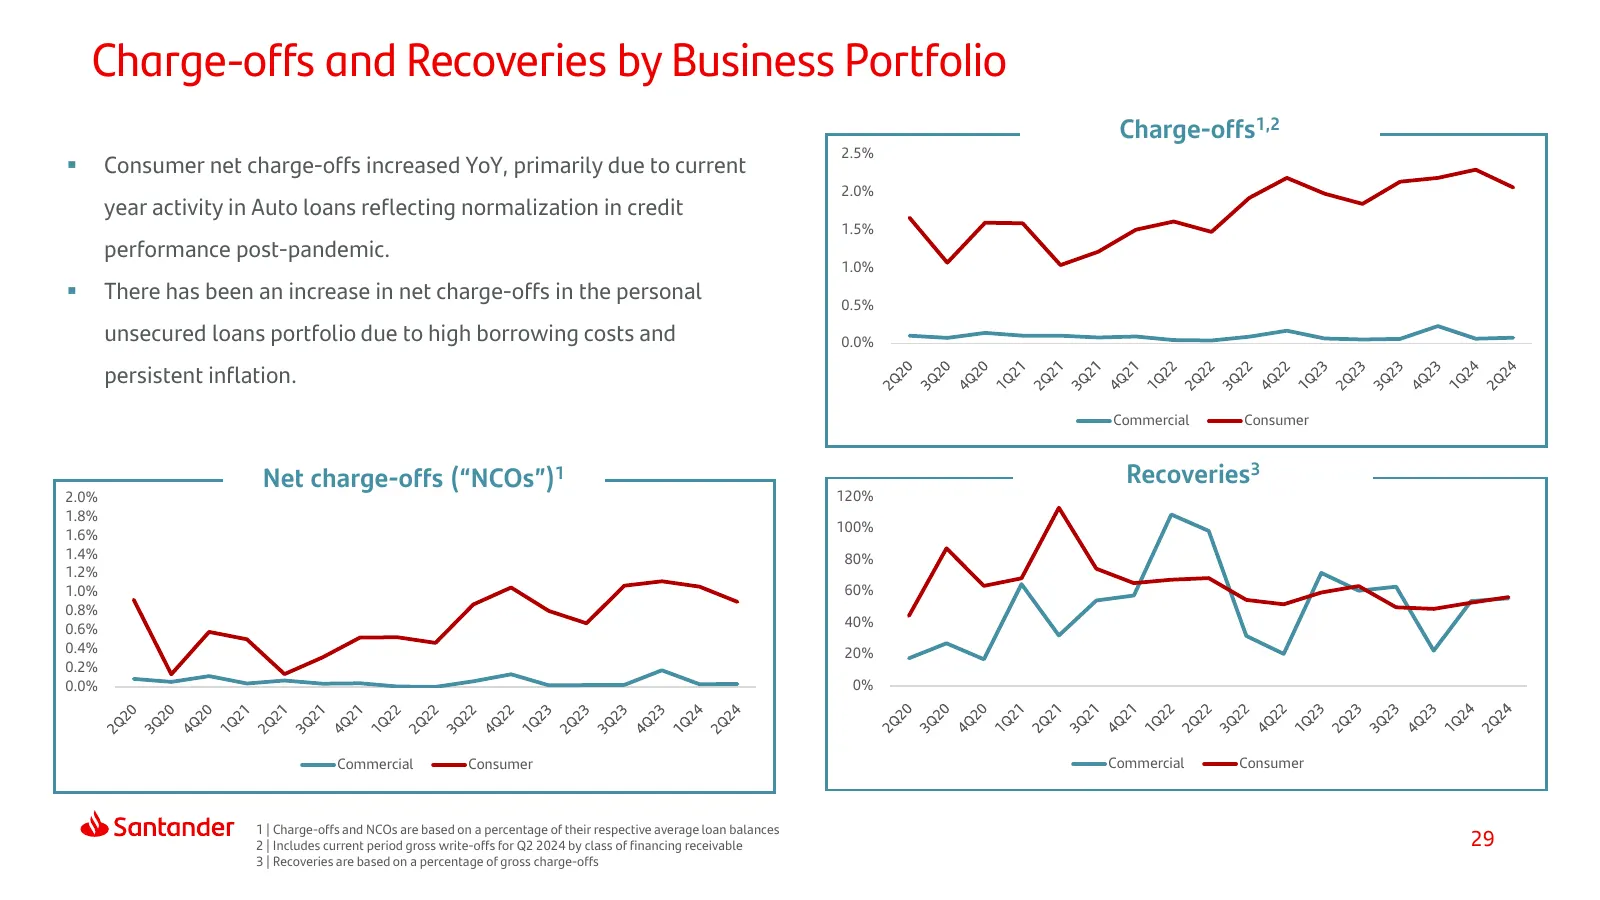
Charge-offs and Recoveries by Business Portfolio Charge-offs1,2 2.5% Consumer net charge-offs increased YoY, primarily due to current 2.0% year activity in Auto loans reflecting normalization in credit 1.5% performance post-pandemic. 1.0% There has been an increase in net charge-offs in the pers
Slide 30: Total Allowance For Credit Losses (ACL)
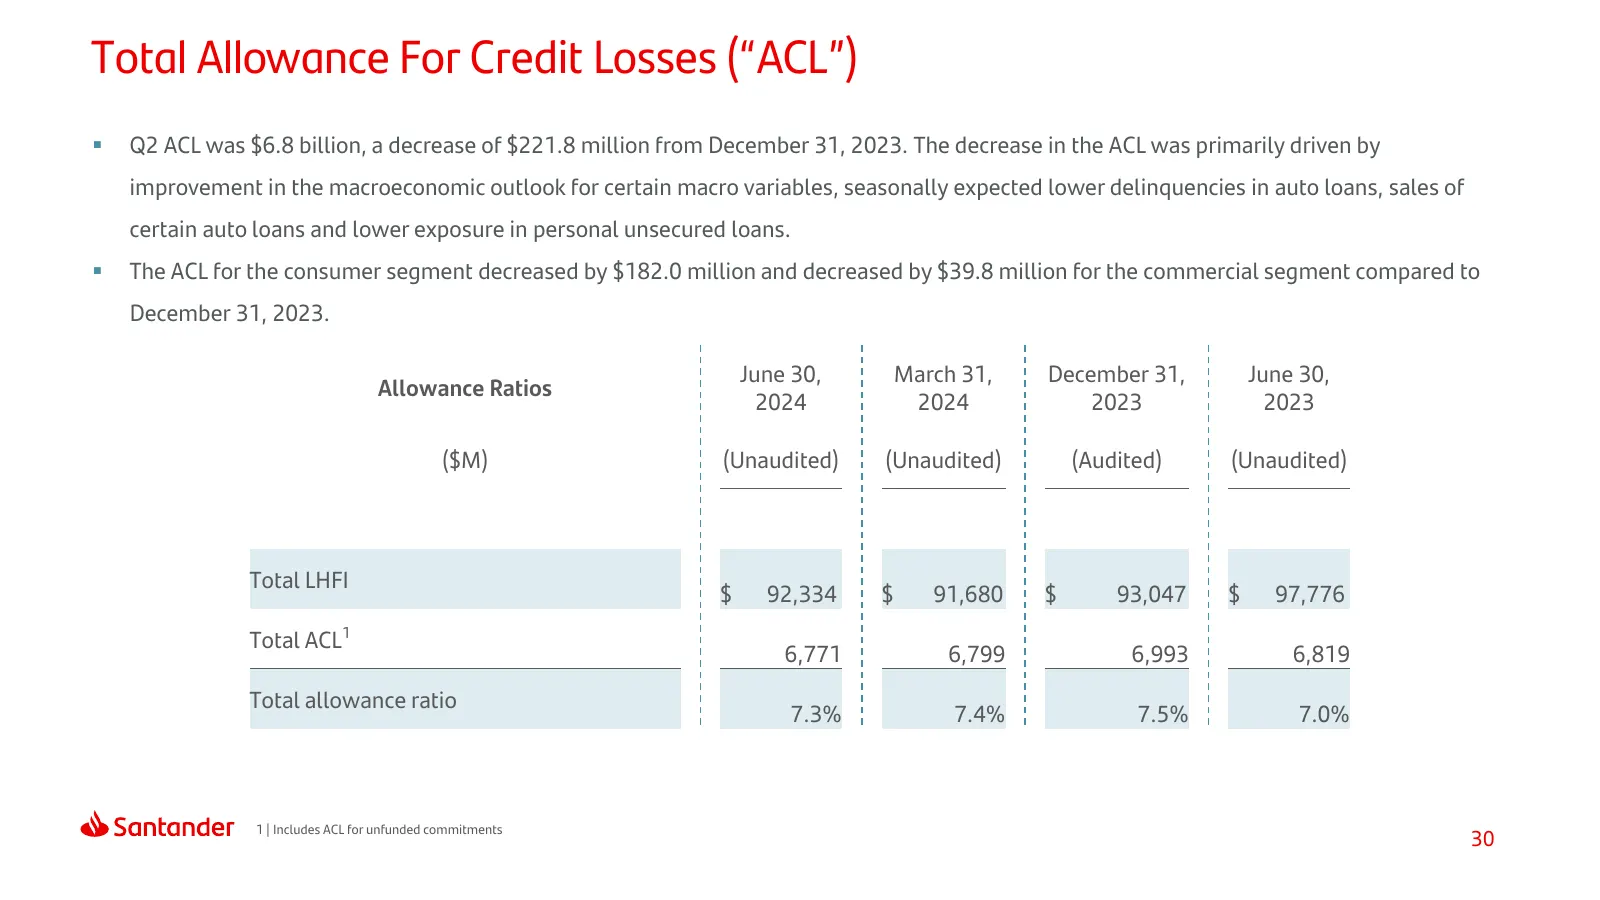
Total Allowance For Credit Losses (“ACL”) Q2 ACL was $6.8 billion, a decrease of $221.8 million from December 31, 2023. The decrease in the ACL was primarily driven by improvement in the macroeconomic outlook for certain macro variables, seasonally expected lower delinquencies in auto loans, sales
Slide 31: Rating Agencies
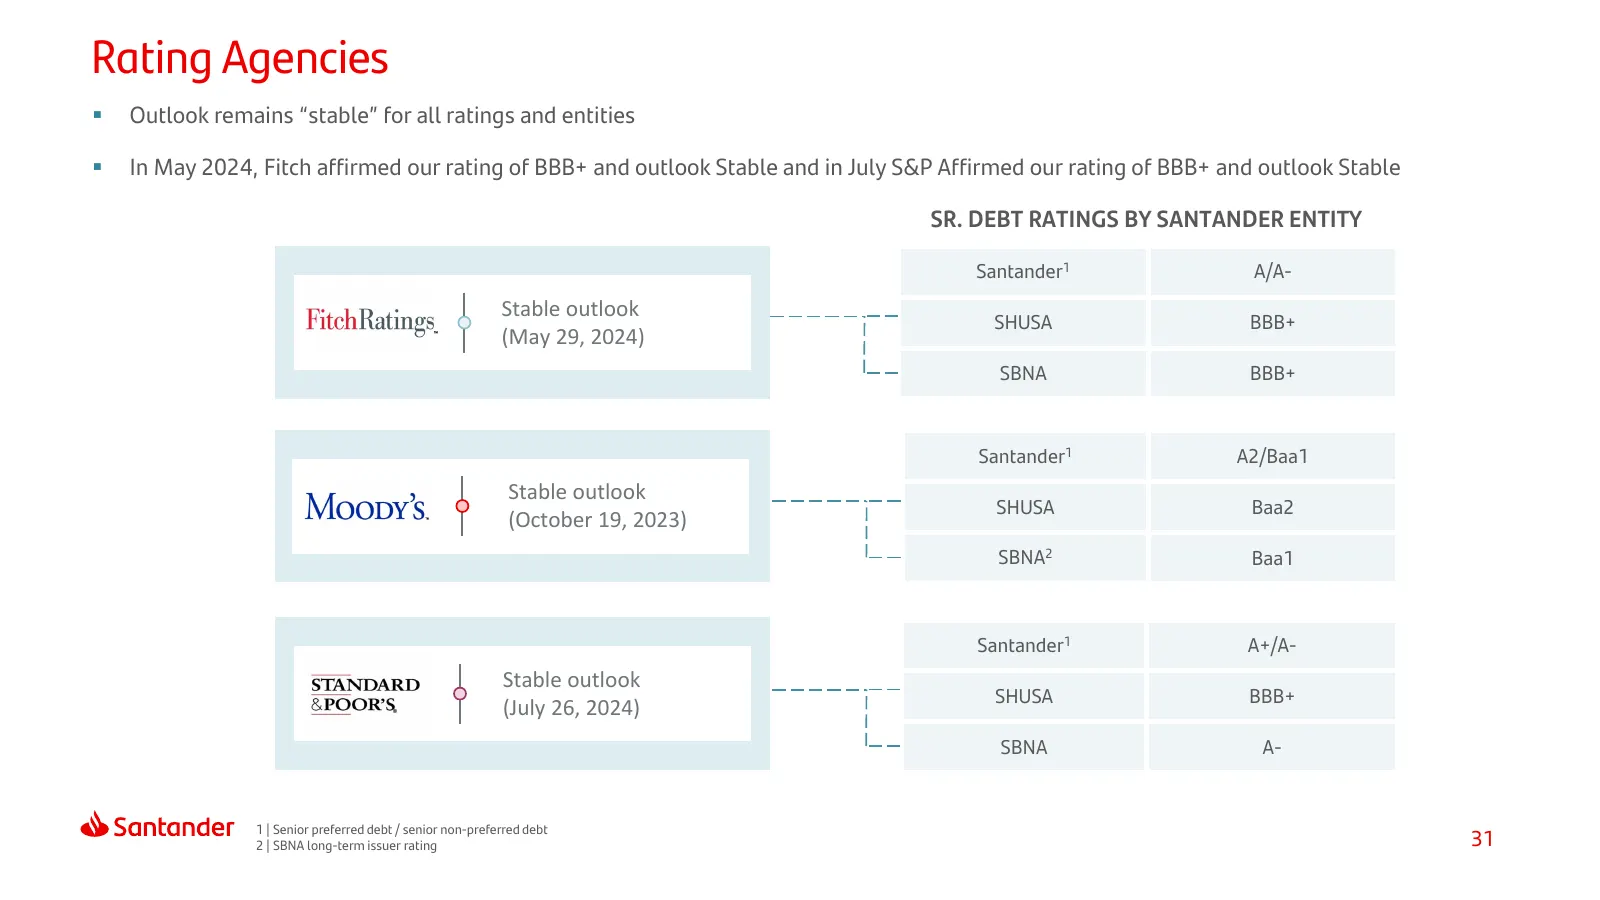
Rating Agencies Outlook remains “stable” for all ratings and entities In May 2024, Fitch affirmed our rating of BBB+ and outlook Stable and in July S&P Affirmed our rating of BBB+ and outlook Stable SR. DEBT RATINGS BY SANTANDER ENTITY Santander1 A/A- Stable outlook SHUSA BBB+ (May 29, 2024) SBN
Slide 32: Interest Rate Risk Sensitivity
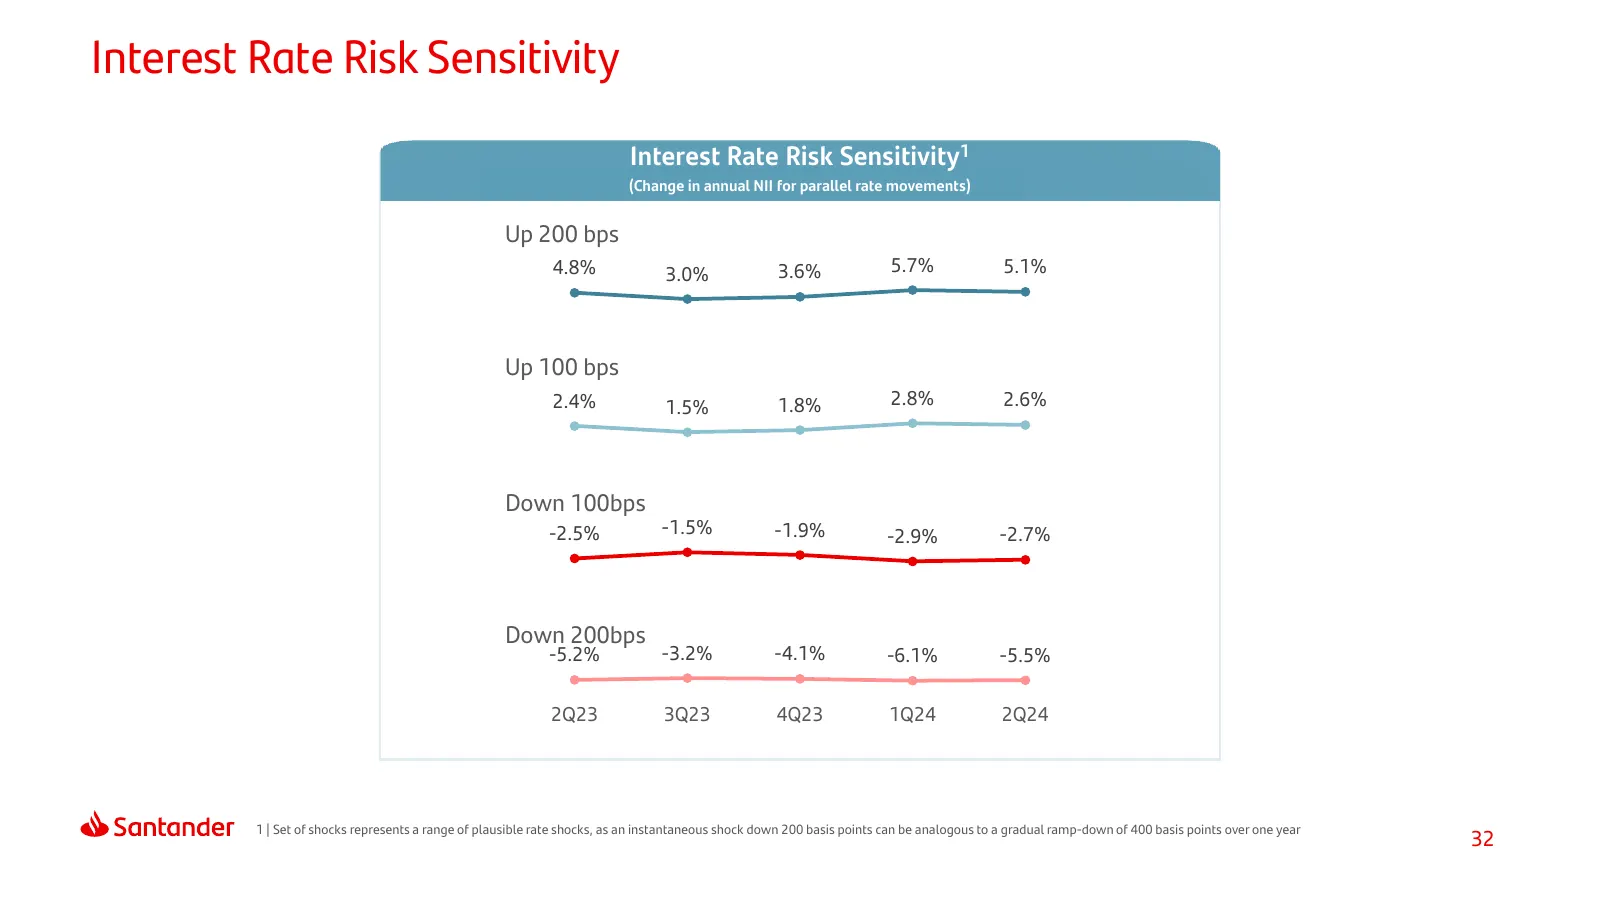
Interest Rate Risk Sensitivity Interest Rate Risk Sensitivity1 (Change in annual NII for parallel rate movements) Up 200 bps 4.8% 3.0% 3.6% 5.7% 5.1% Up 100 bps 2.4% 1.5% 1.8% 2.8% 2.6% Down 100bps -2.5% -1.5% -1.9% -2.9% -2.7% Down 200bps -5.2% -3.2% -4.1% -6.1% -5.5% 2Q23 3Q23 4Q23 1Q24 2Q24 1 | S
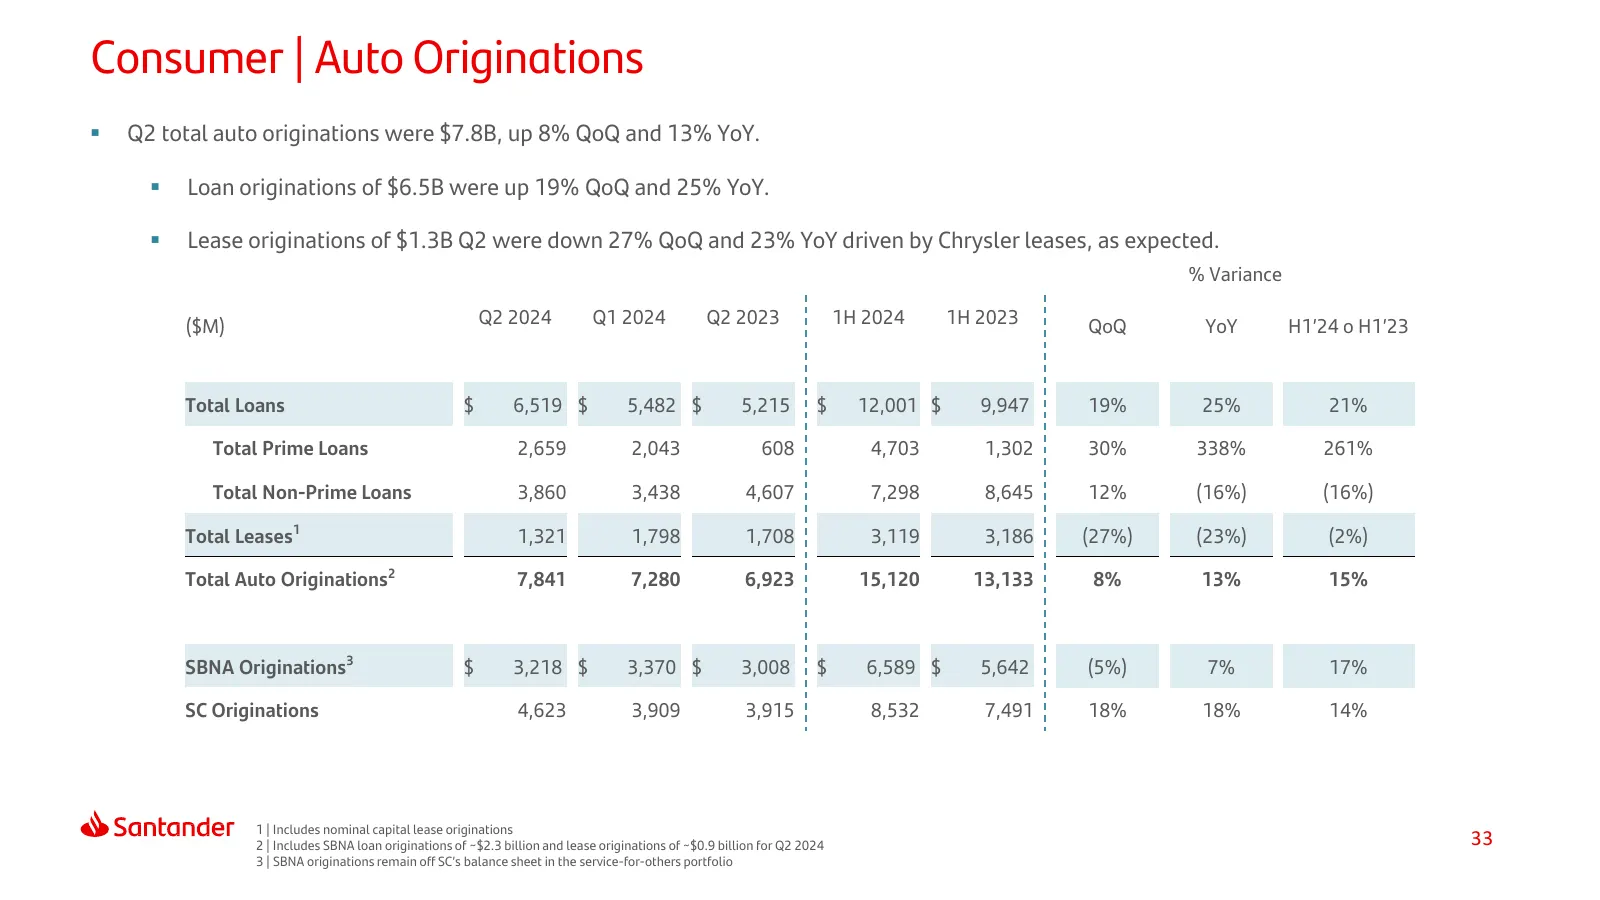
Slide 33: Consumer | Auto Originations
Consumer | Auto Originations Q2 total auto originations were $7.8B, up 8% QoQ and 13% YoY. Loan originations of $6.5B were up 19% QoQ and 25% YoY. Lease originations of $1.3B Q2 were down 27% QoQ and 23% YoY driven by Chrysler leases, as expected. % Variance ($M) Q2 2024 Q1 2024 Q2 2023 1H 202
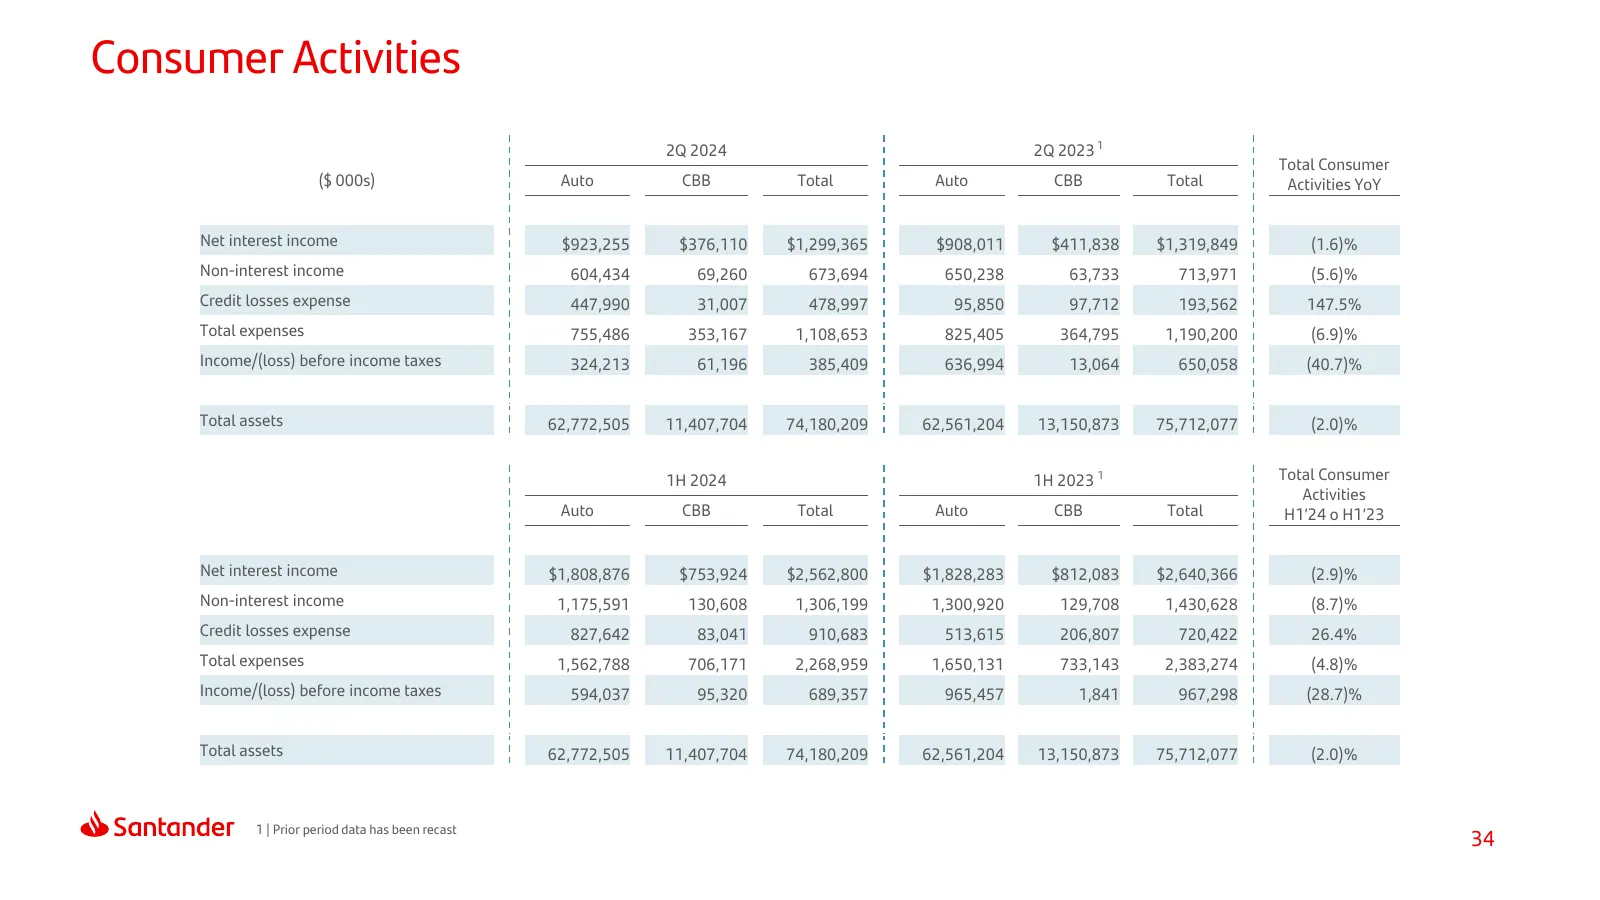
Slide 34: Consumer Activities
Consumer Activities 2Q 2024 2Q 2023 1 Total Consumer ($ 000s) Auto CBB Total Auto CBB Total Activities YoY Net interest income $923,255 $376,110 $1,299,365 $908,011 $411,838 $1,319,849 (1.6)% Non-interest income 604,434 69,260 673,694 650,238 63,733 713,971 (5.6)% Credit losses expense 447,990 31,00
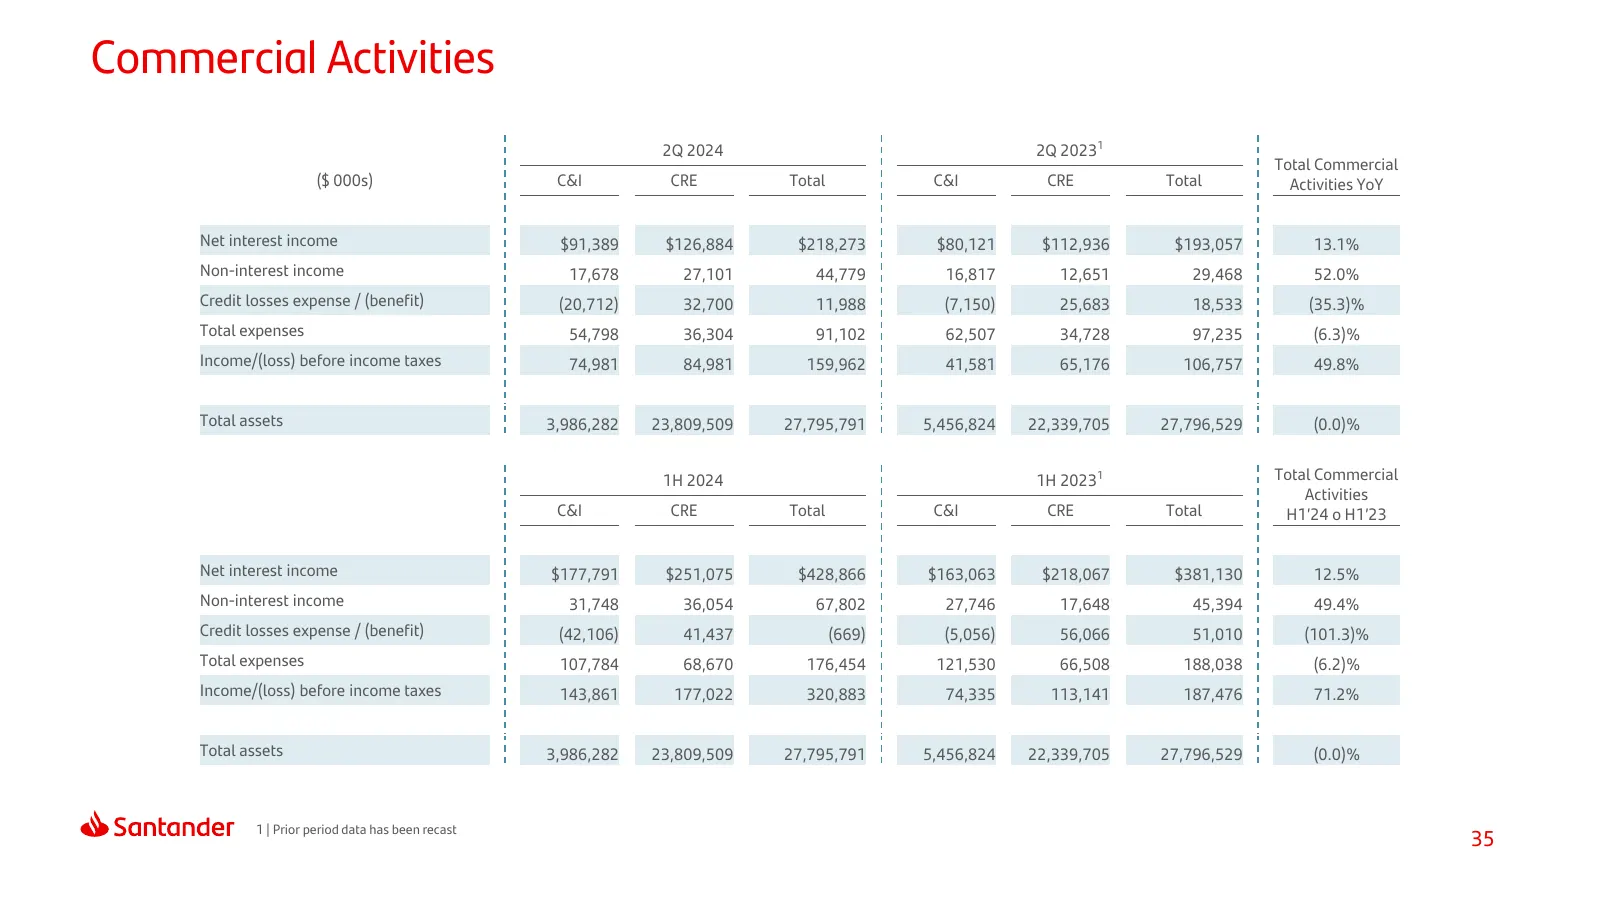
Slide 35: Commercial Activities
Commercial Activities 2Q 2024 2Q 20231 Total Commercial ($ 000s) C&I CRE Total C&I CRE Total Activities YoY Net interest income $91,389 $126,884 $218,273 $80,121 $112,936 $193,057 13.1% Non-interest income 17,678 27,101 44,779 16,817 12,651 29,468 52.0% Credit losses expense / (benefit) (20,712) 32,
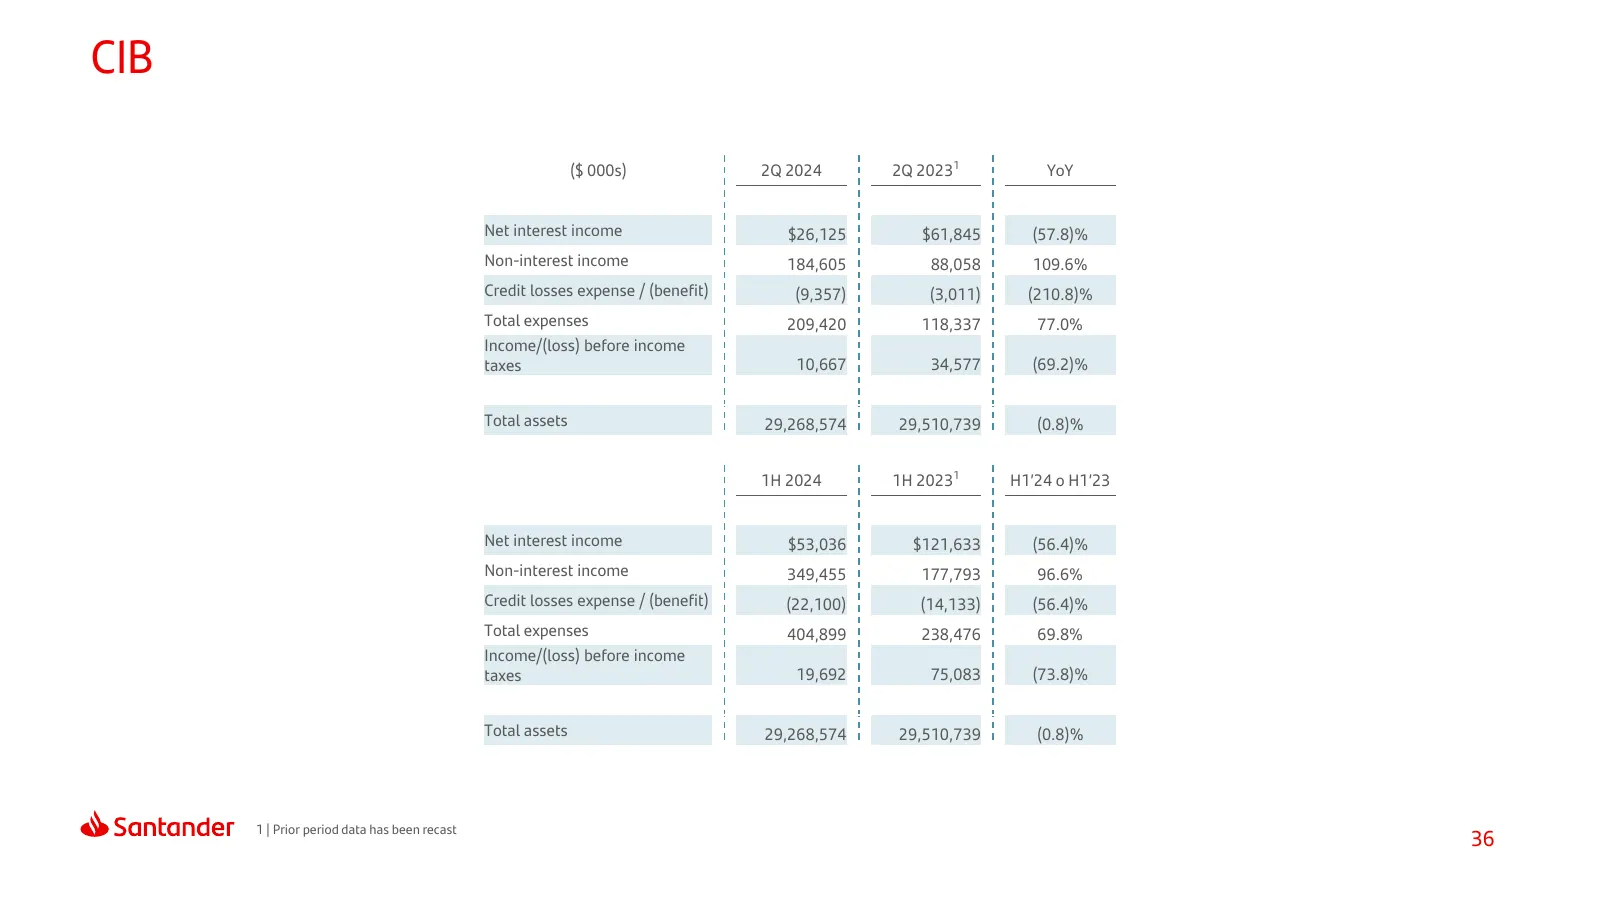
Slide 36: CIB
CIB ($ 000s) 2Q 2024 2Q 20231 YoY Net interest income $26,125 $61,845 (57.8)% Non-interest income 184,605 88,058 109.6% Credit losses expense / (benefit) (9,357) (3,011) (210.8)% Total expenses 209,420 118,337 77.0% Income/(loss) before income taxes 10,667 34,577 (69.2)% Total assets 29,268,574 29,5
Slide 37: Wealth Management
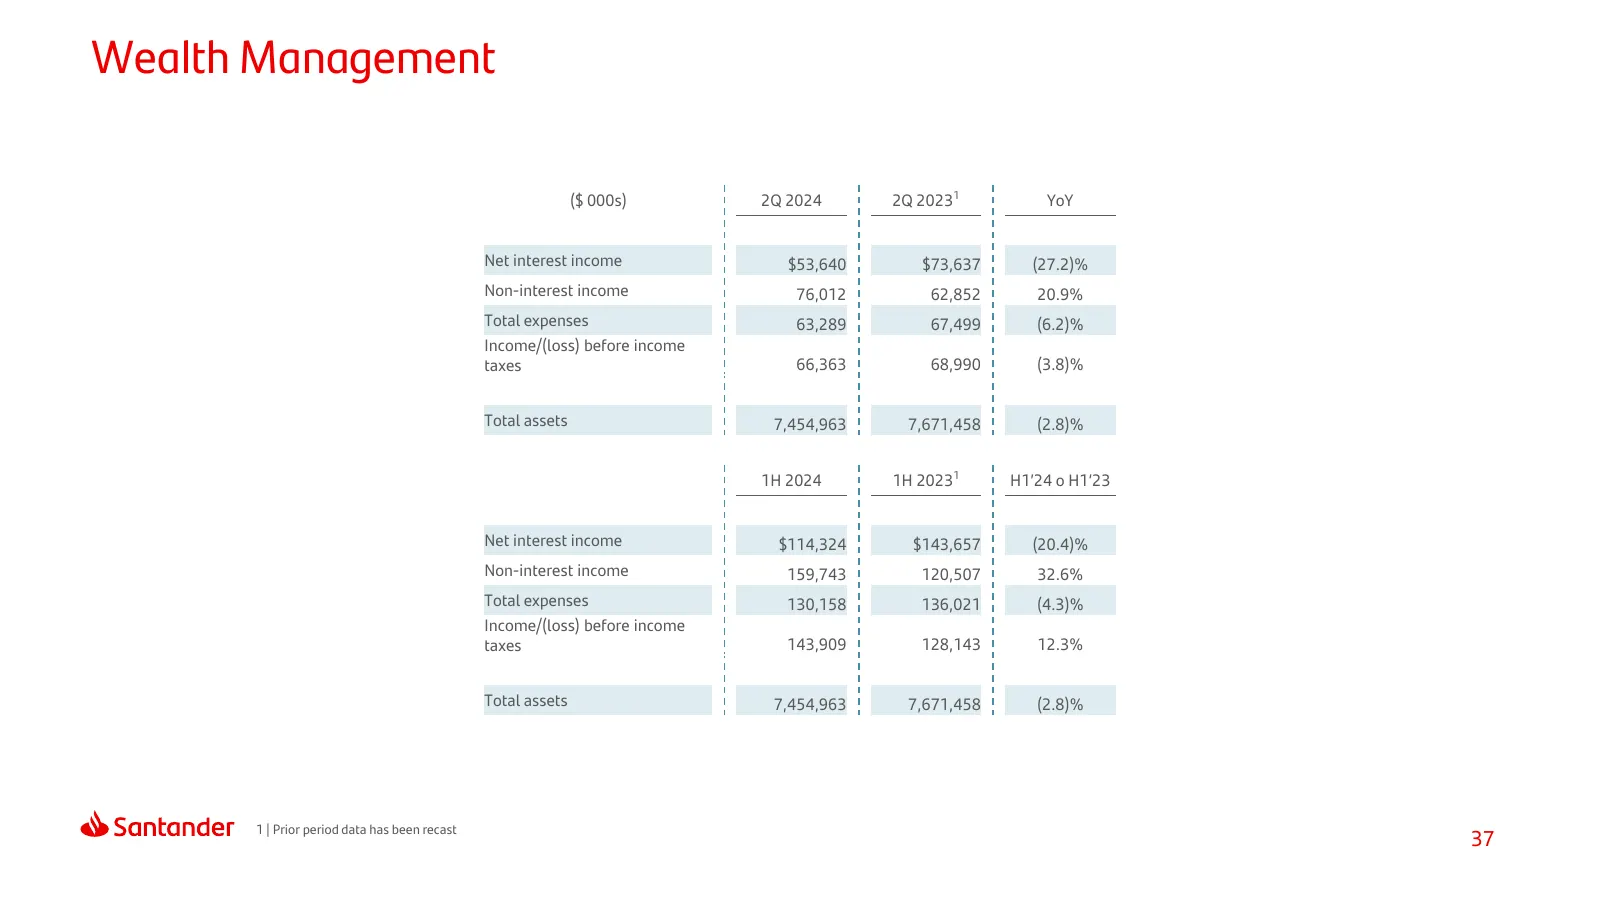
Wealth Management ($ 000s) 2Q 2024 2Q 20231 YoY Net interest income $53,640 $73,637 (27.2)% Non-interest income 76,012 62,852 20.9% Total expenses 63,289 67,499 (6.2)% Income/(loss) before income taxes 66,363 68,990 (3.8)% Total assets 7,454,963 7,671,458 (2.8)% 1H 2024 1H 20231 H1’24 o H1’23 Net in
Slide 38: Other
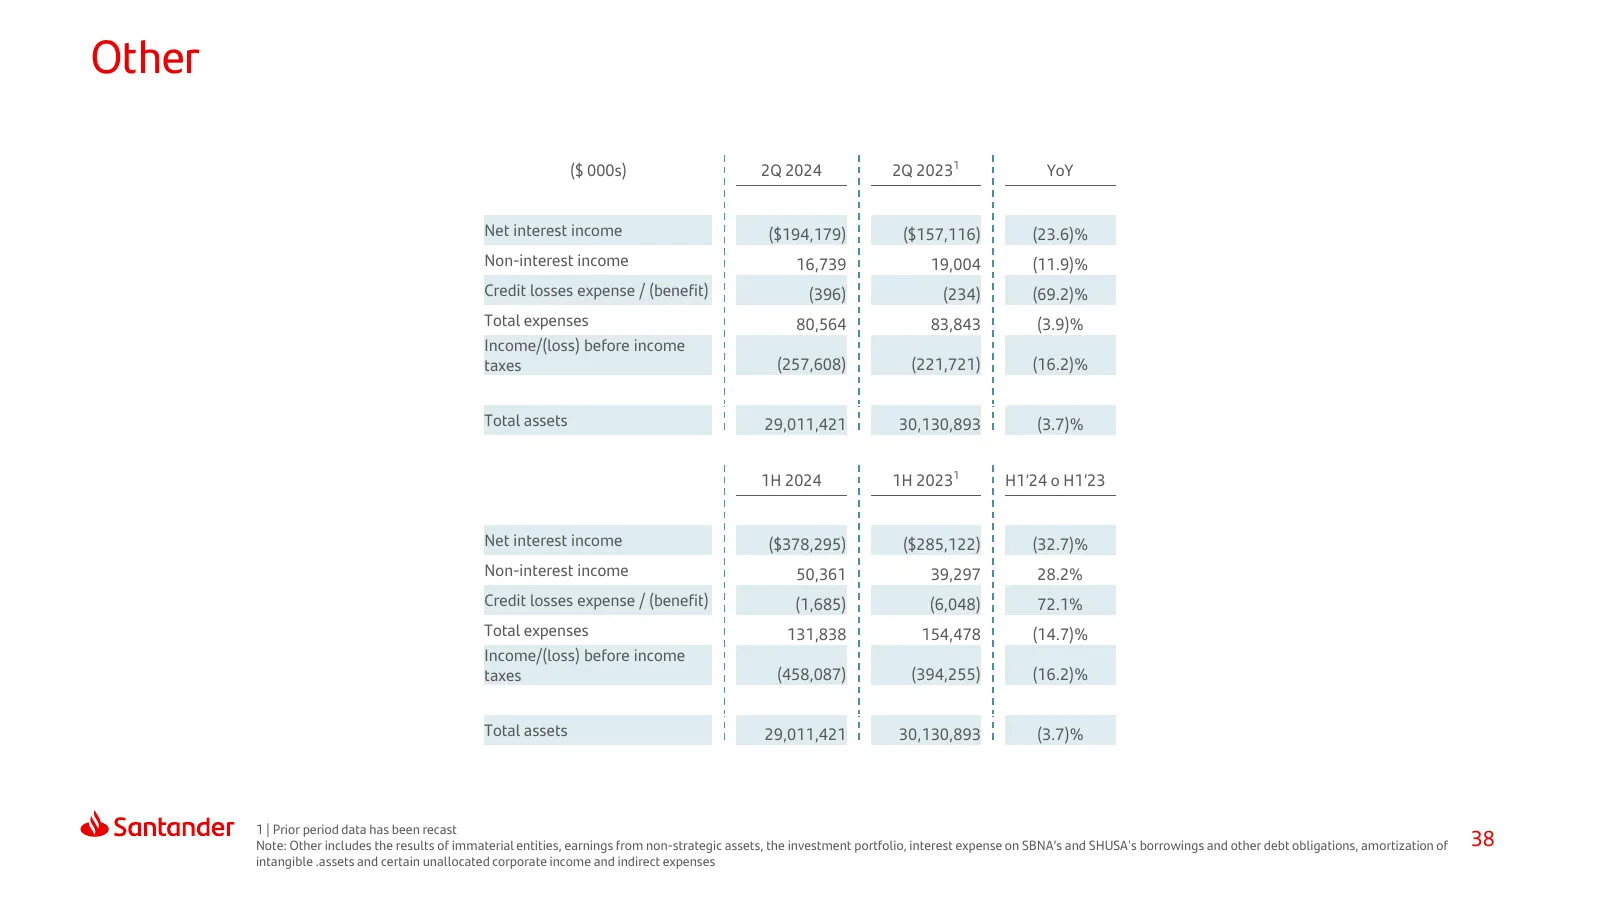
Other ($ 000s) 2Q 2024 2Q 20231 YoY Net interest income ($194,179) ($157,116) (23.6)% Non-interest income 16,739 19,004 (11.9)% Credit losses expense / (benefit) (396) (234) (69.2)% Total expenses 80,564 83,843 (3.9)% Income/(loss) before income taxes (257,608) (221,721) (16.2)% Total assets 29,011,
Slide 39: SHUSA | Quarterly Trended Statement Of Operations
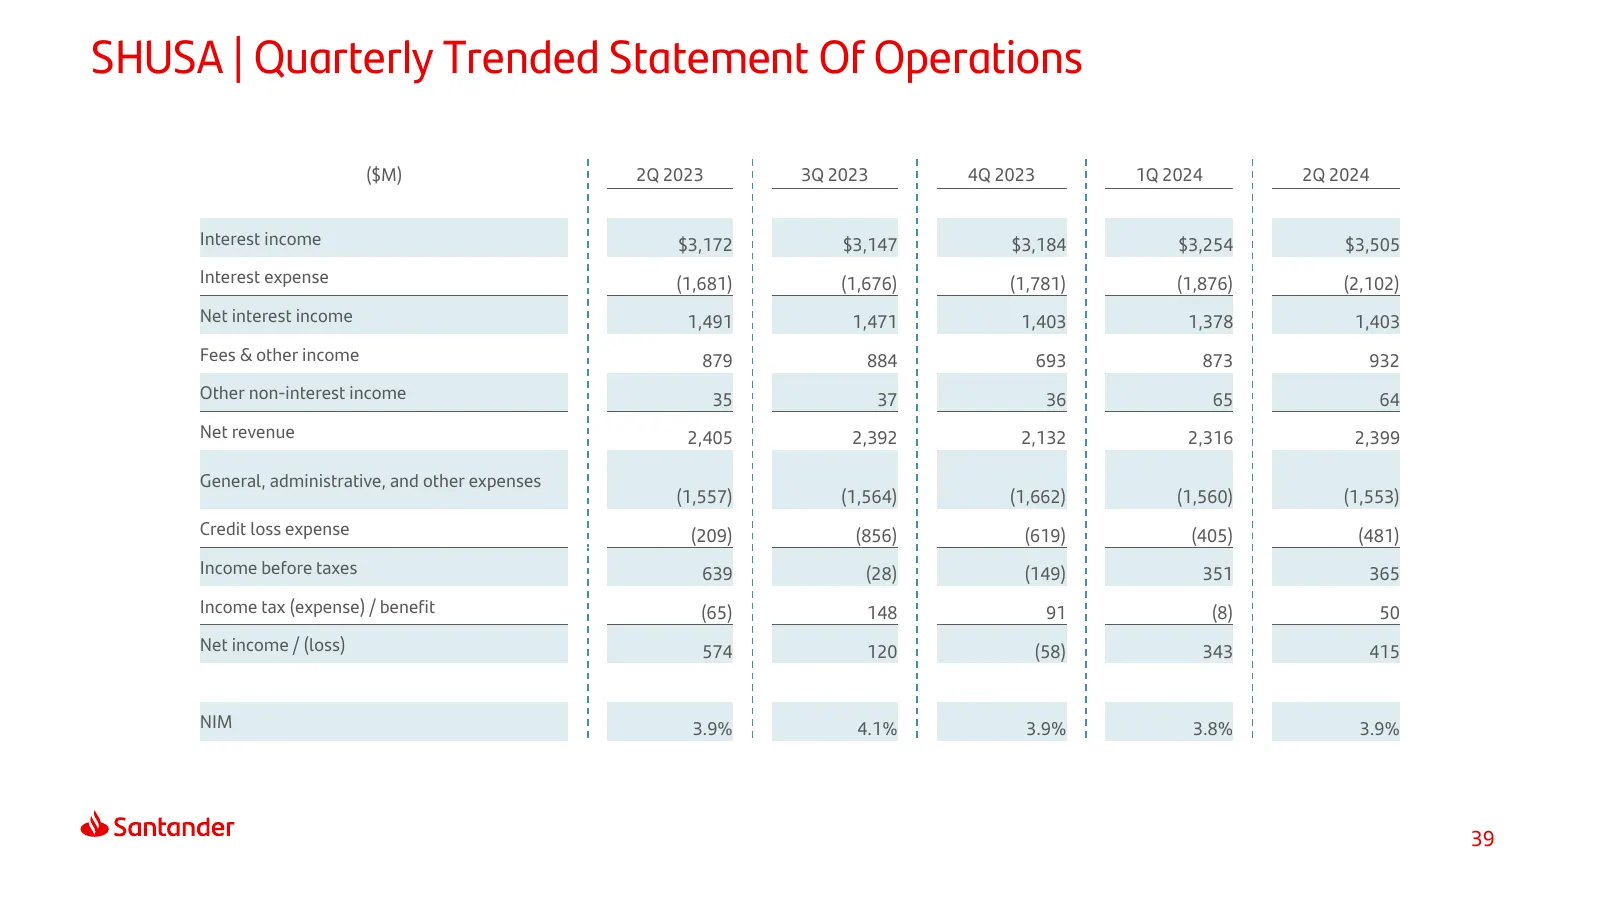
SHUSA | Quarterly Trended Statement Of Operations ($M) 2Q 2023 3Q 2023 4Q 2023 1Q 2024 2Q 2024 Interest income $3,172 $3,147 $3,184 $3,254 $3,505 Interest expense (1,681) (1,676) (1,781) (1,876) (2,102) Net interest income 1,491 1,471 1,403 1,378 1,403 Fees & other income 879 884 693 873 932 Other n
Slide 40: SHUSA | Non-GAAP Reconciliations
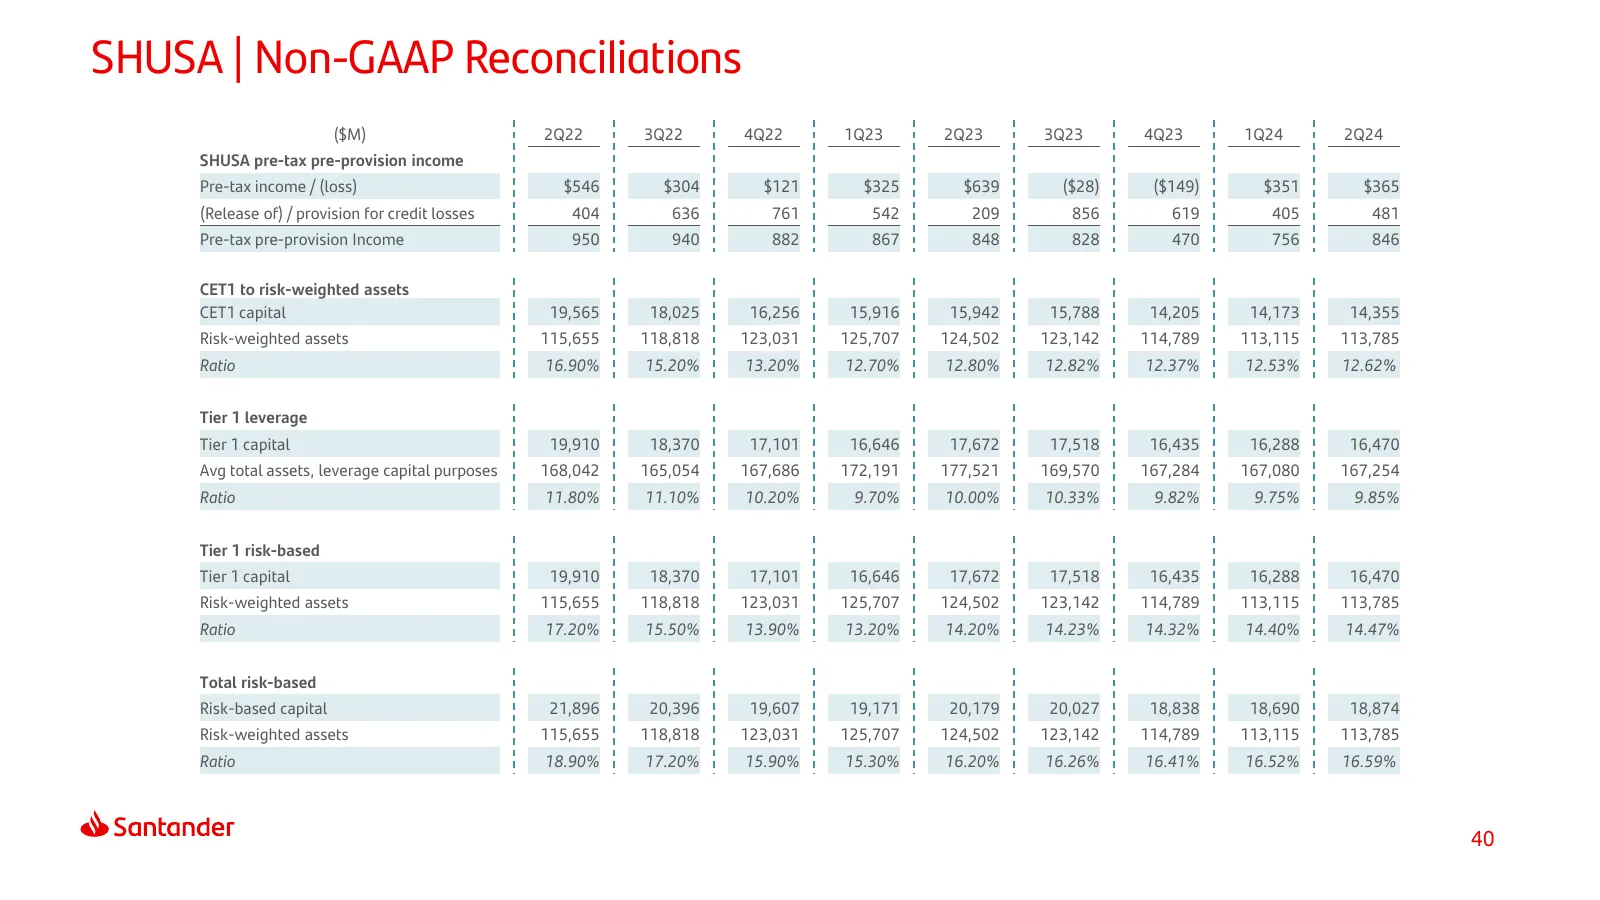
SHUSA | Non-GAAP Reconciliations ($M) 2Q22 3Q22 4Q22 1Q23 2Q23 3Q23 4Q23 1Q24 2Q24 SHUSA pre-tax pre-provision income Pre-tax income / (loss) $546 $304 $121 $325 $639 ($28) ($149) $351 $365 (Release of) / provision for credit losses 404 636 761 542 209 856 619 405 481 Pre-tax pre-provision Income 95

Slide 41: Thank You.
Thank You. Our purpose is to help people and businesses prosper. Our culture is based on believing that everything we do should be:
Source: company website
More decks from Santander Holdings USA Inc
 Debt Investor Presentation (August 2026)30 slides · Aug 12, 2026
 Debt Investor Presentation (August 2026)30 slides · Aug 12, 2026
 Debt Investor Presentation (June 2026)29 slides · Jun 12, 2026
 Debt Investor Presentation (June 2026)29 slides · Jun 12, 2026
 Debt Investor Presentation (March 2026)36 slides · Mar 6, 2026
 Debt Investor Presentation (March 2026)36 slides · Mar 6, 2026