Ucb S.A. · EURONEXT:UCB
Ucb — Q1 2016 Earnings Presentation
41 slides from Ucb's earnings presentation, Apr 25, 2016
Slide 1: 3 month 2016 interim update
3 month 2016 interim update Brussels, 25 April 2016
Slide 2: Disclaimer and safe harbor
2 Disclaimer and safe harbor Forward-looking statements This presentation contains forward-looking statements, including, without limitation, statements containing the words “believes”, “anticipates”, “expects”, “intends”, “plans”, “seeks”, “estimates”, “may”, “will”, and “continue” and similar expr
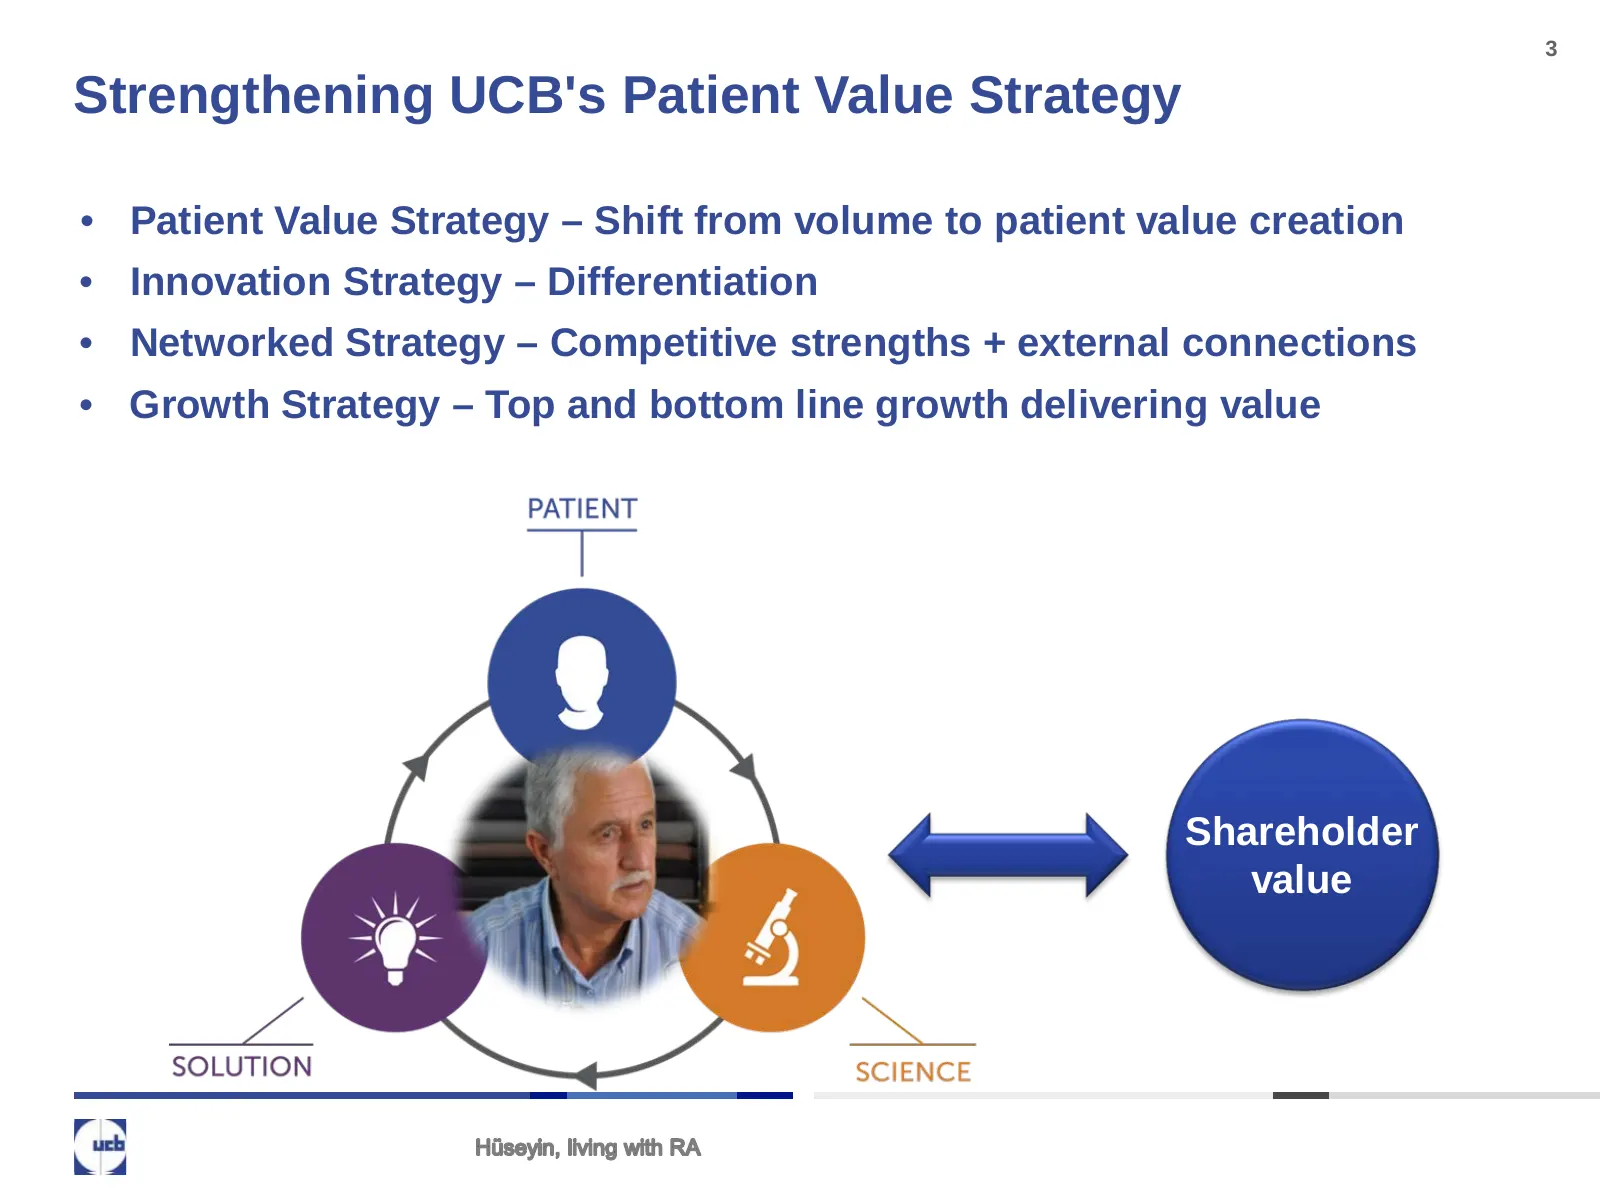
Slide 3: Strengthening UCB's Patient Value Strategy
3 Strengthening UCB's Patient Value Strategy • Patient Value Strategy – Shift from volume to patient value creation • Innovation Strategy – Differentiation • Networked Strategy – Competitive strengths + external connections • Growth Strategy – Top and bottom line growth delivering value Shareholder
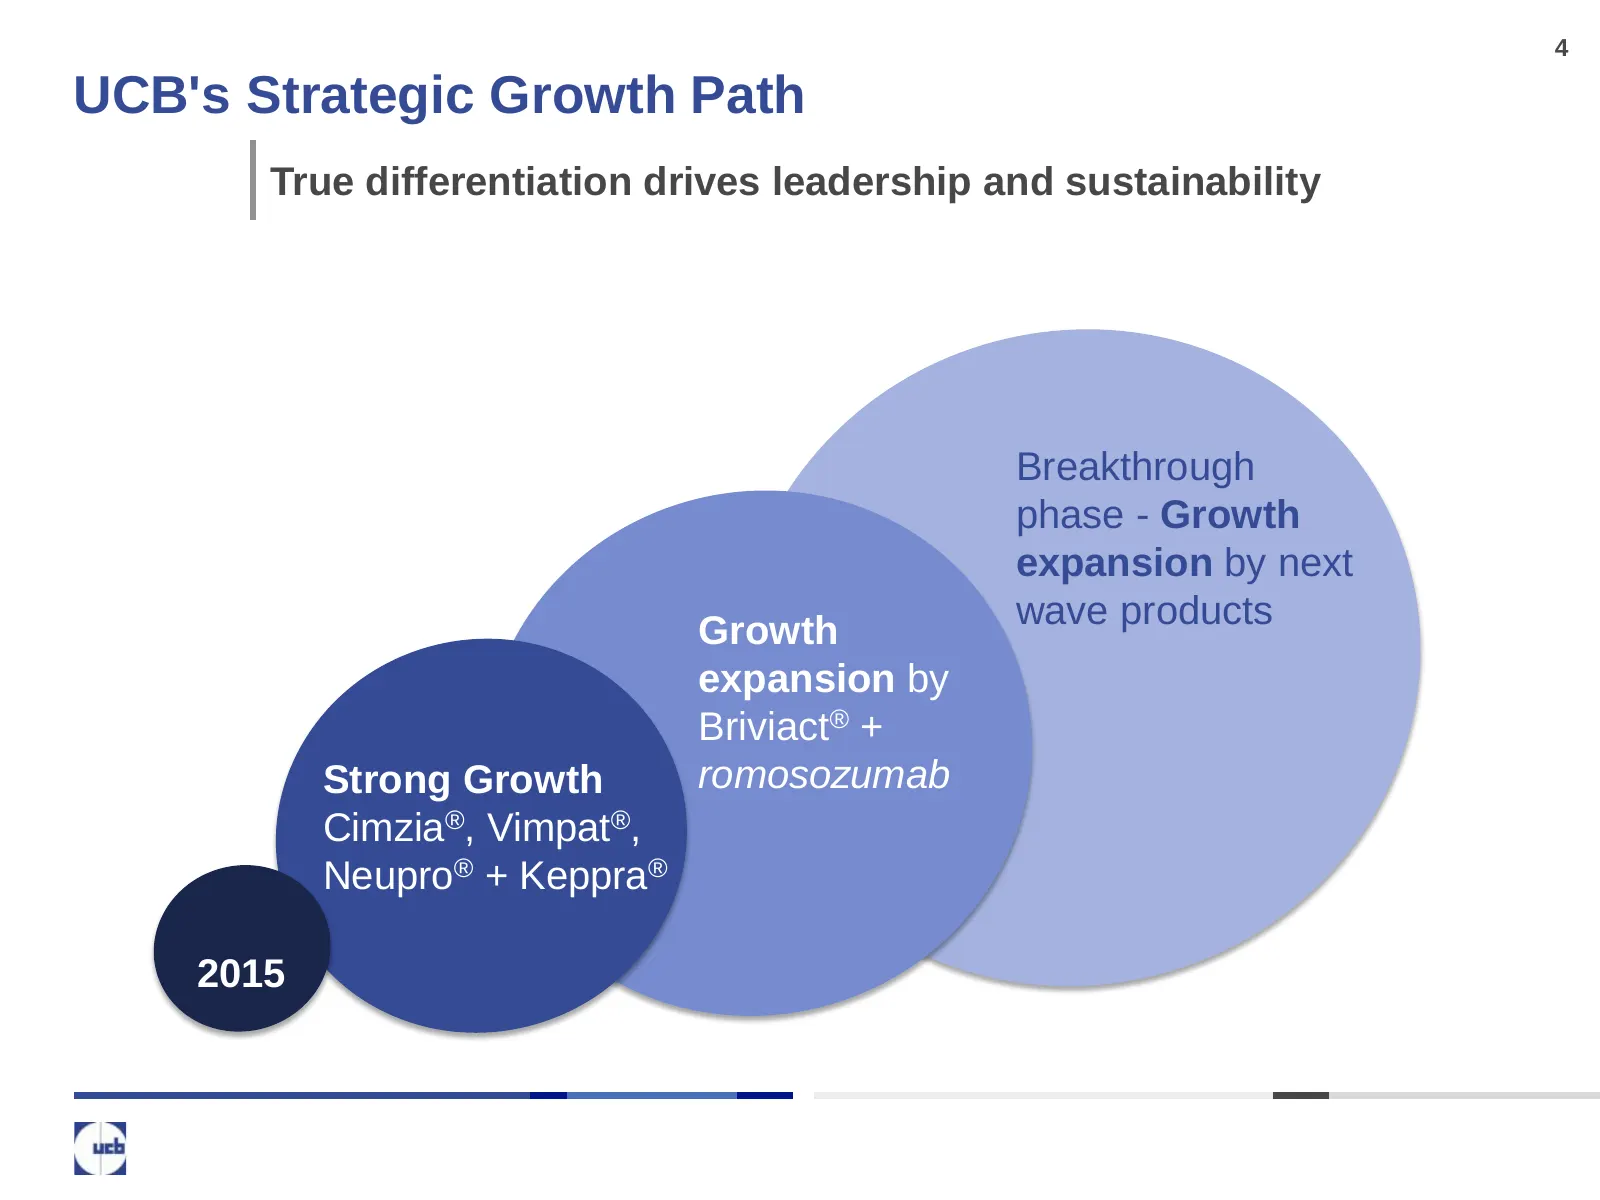
Slide 4: UCB's Strategic Growth Path
4 UCB's Strategic Growth Path True differentiation drives leadership and sustainability Breakthrough phase - Growth expansion by next wave products Growth expansion by Briviact® + Strong Growth romosozumab Cimzia®, Vimpat®, Neupro® + Keppra® 2015
Slide 5: UCB is progressing on its growth path
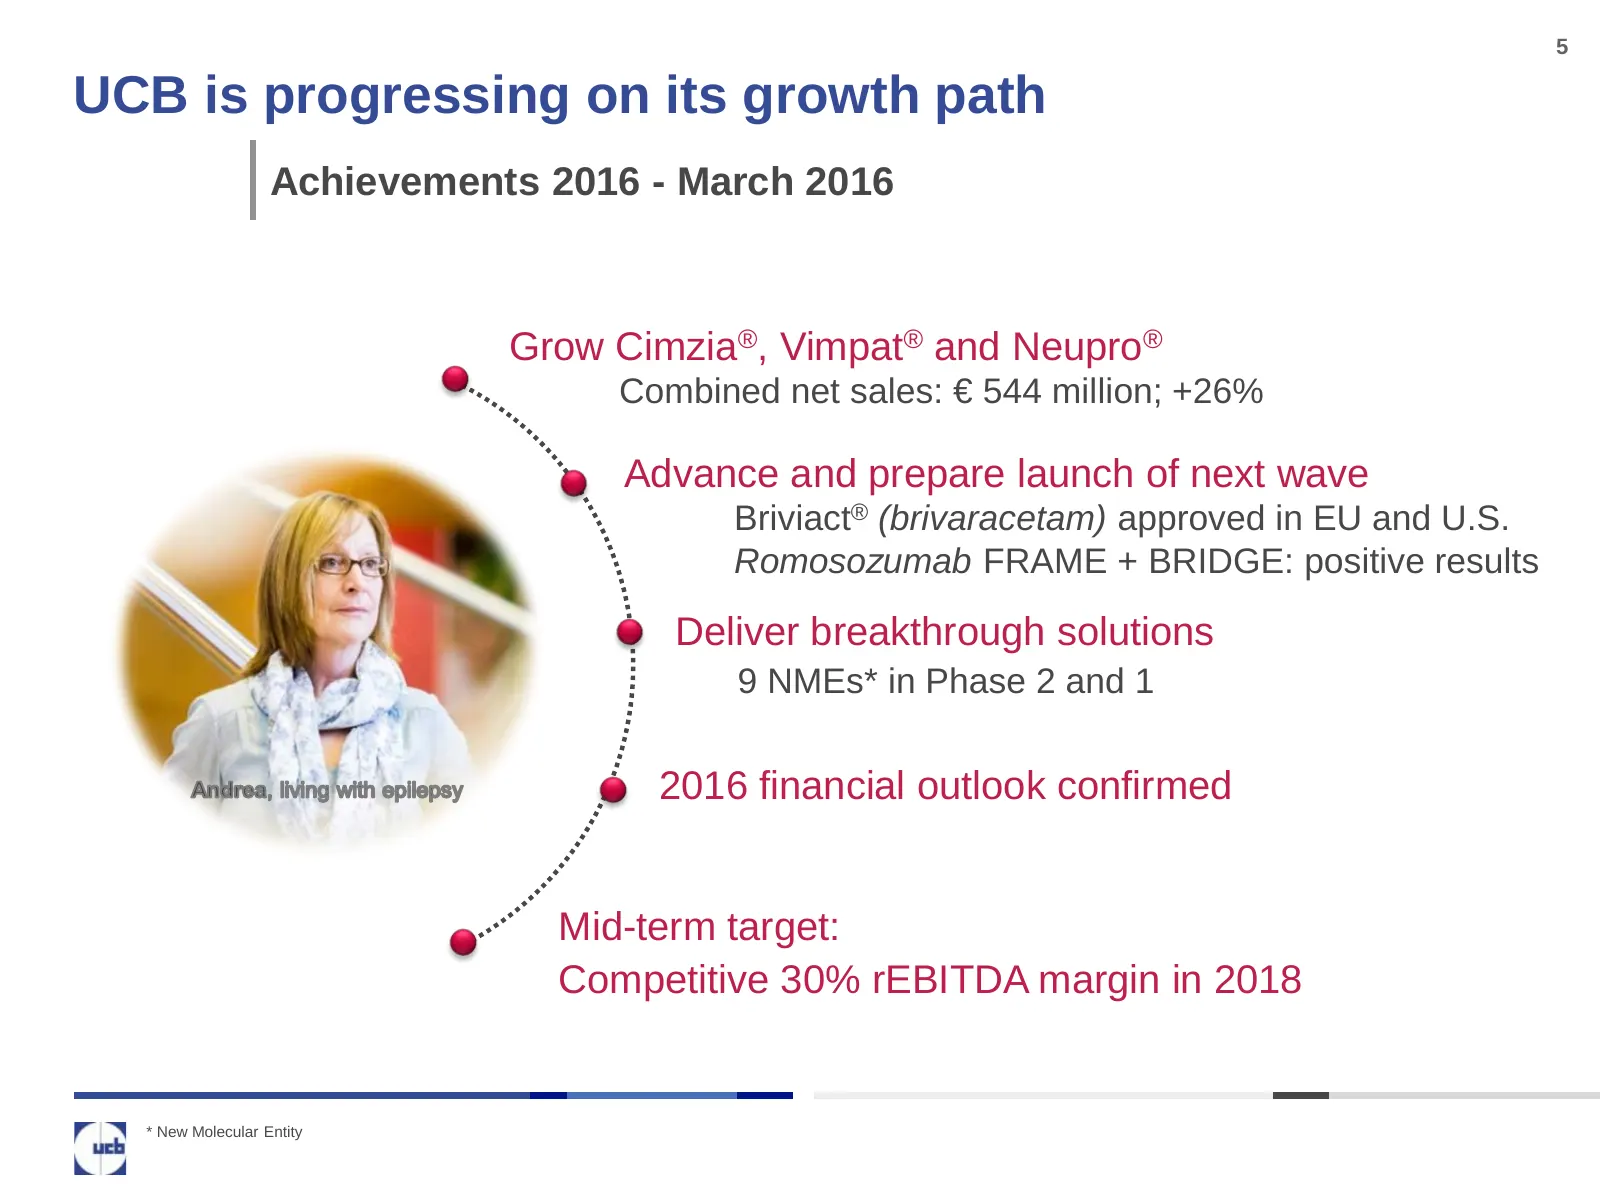
5 UCB is progressing on its growth path Achievements 2016 - March 2016 Grow Cimzia®, Vimpat® and Neupro® Combined net sales: € 544 million; +26% Advance and prepare launch of next wave Briviact® (brivaracetam) approved in EU and U.S. Romosozumab FRAME + BRIDGE: positive results Patient Deliver break
Slide 6: 3 months key financial highlights
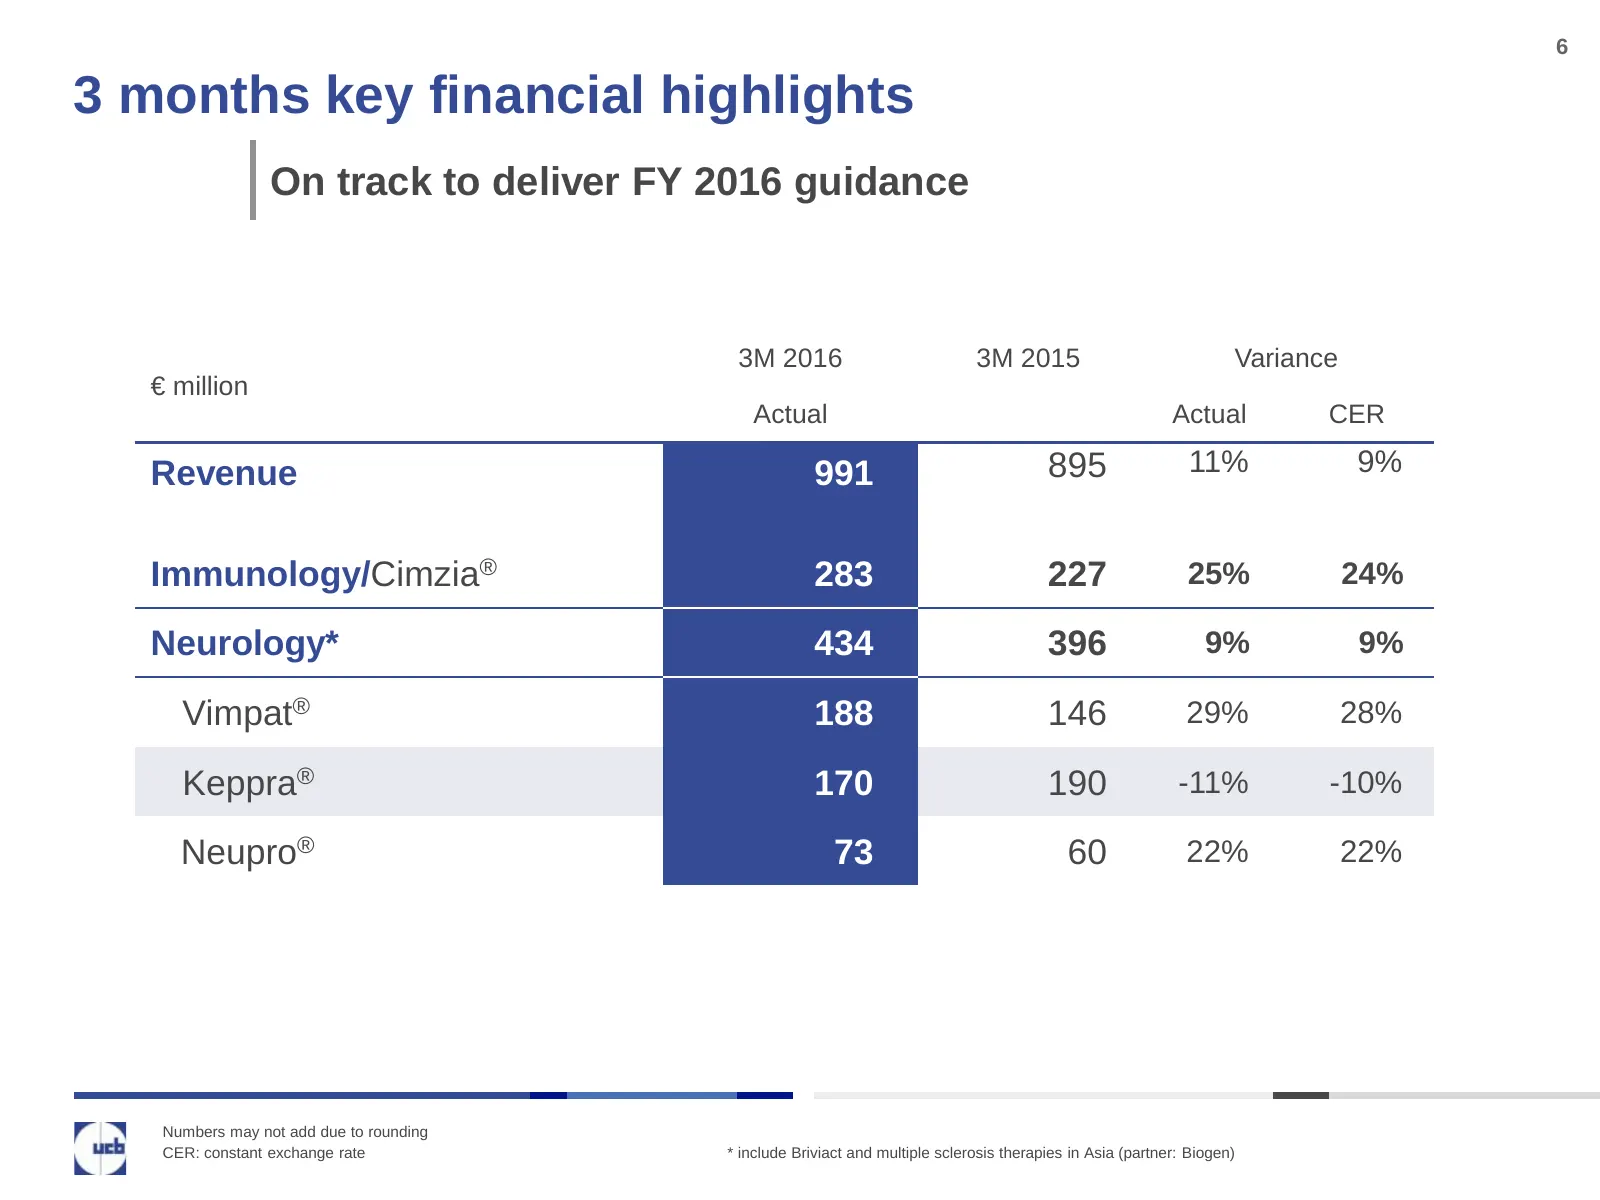
6 3 months key financial highlights On track to deliver FY 2016 guidance 3M 2016 3M 2015 Variance € million Actual Actual CER Revenue 991 895 11% 9% Immunology/Cimzia® 283 227 25% 24% Neurology* 434 396 9% 9% Vimpat® 188 146 29% 28% Keppra® 170 190 -11% -10% Neupro® 73 60 22% 22% Numbers may not add
Slide 7: Cimzia performance
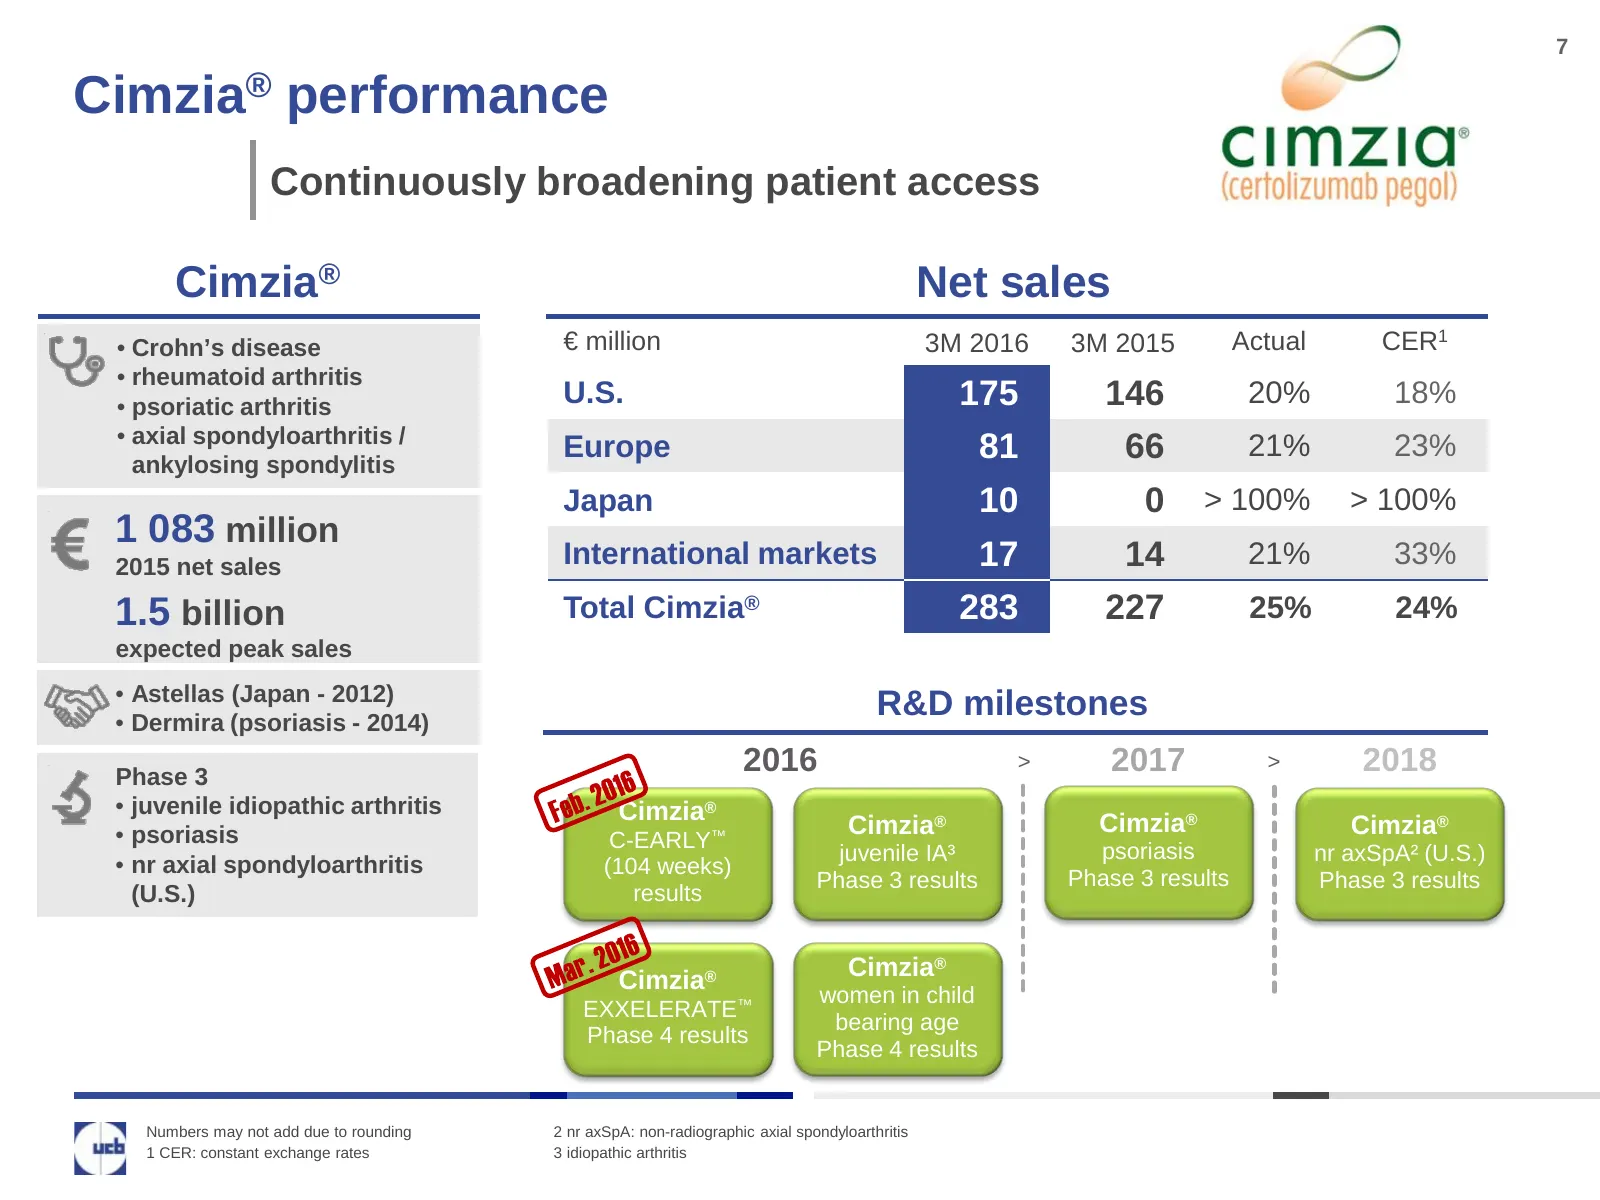
7 Cimzia® performance Continuously broadening patient access Cimzia® Net sales • Crohn’s disease € million 3M 2016 3M 2015 Actual CER1 • rheumatoid arthritis • psoriatic arthritis U.S. 175 146 20% 18% • axial spondyloarthritis / ankylosing spondylitis Europe 81 66 21% 23% Japan 10 0 > 100% > 100% 1
Slide 8: Vimpat performance
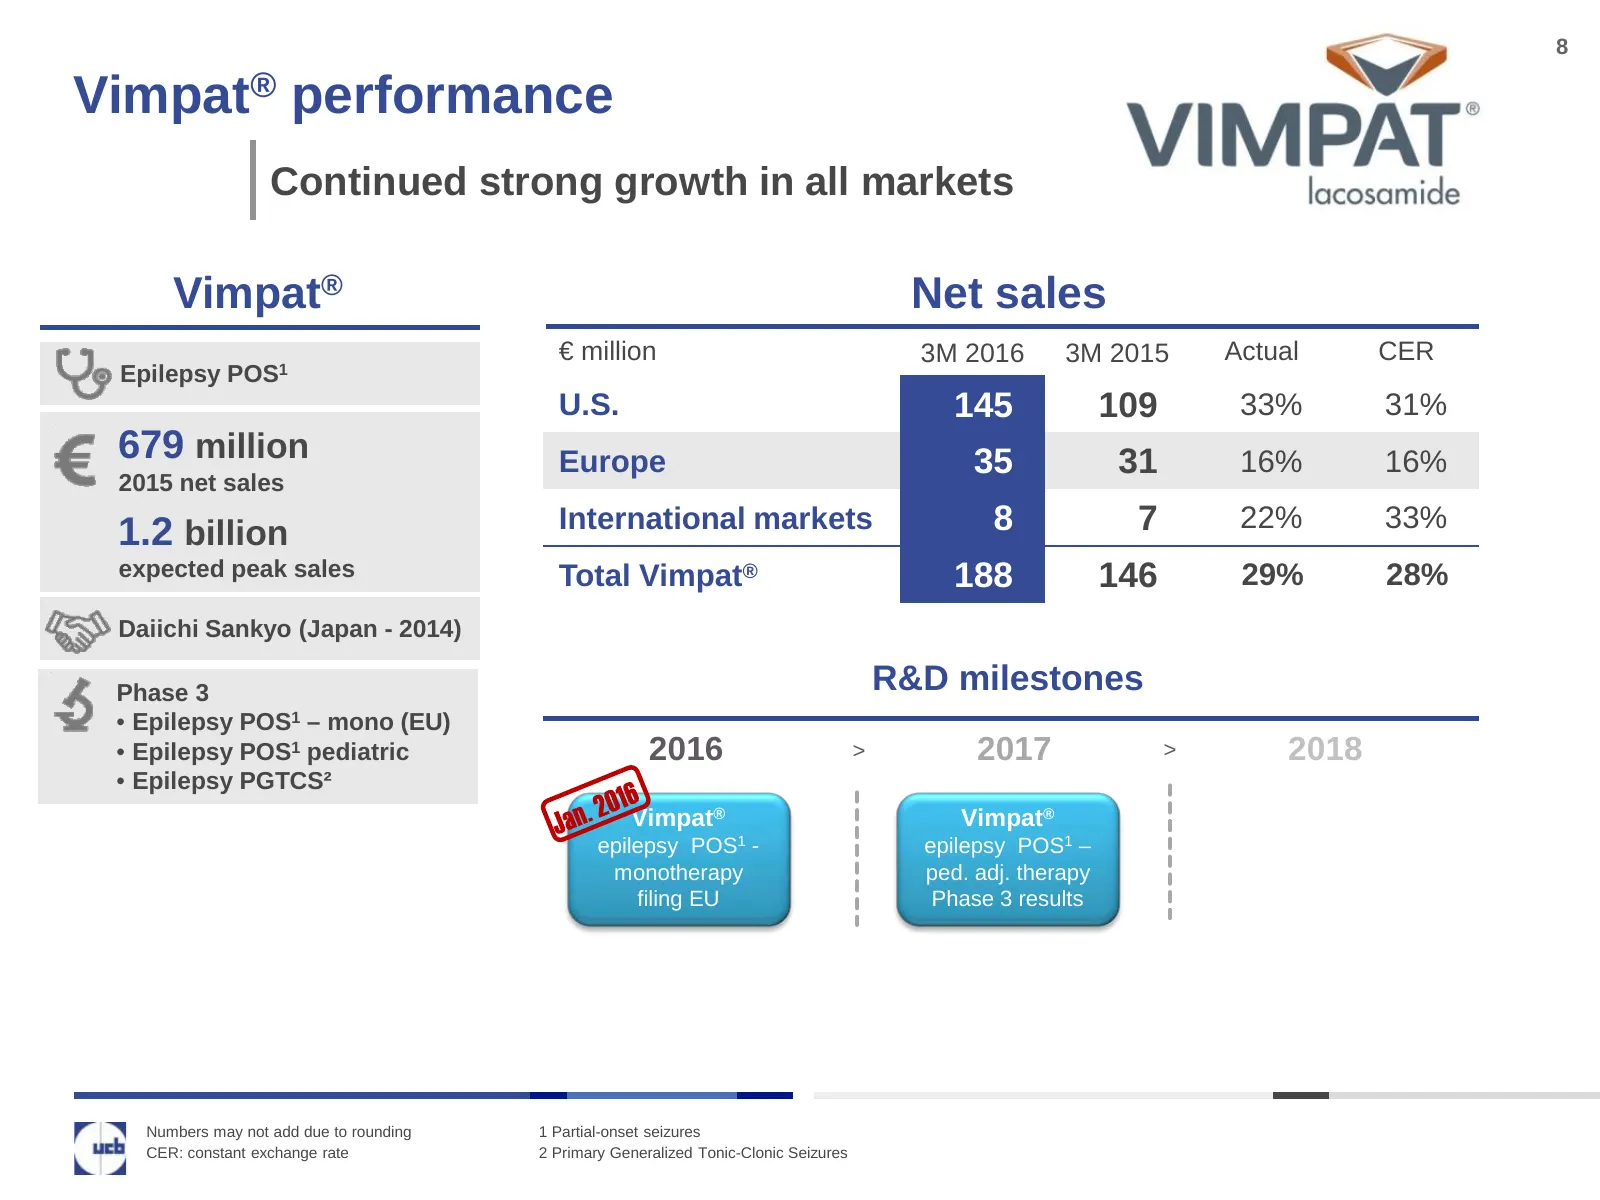
8 Vimpat® performance Continued strong growth in all markets Vimpat® Net sales € million 3M 2016 3M 2015 Actual CER Epilepsy POS1 U.S. 145 109 33% 31% 679 million Europe 35 31 16% 16% 2015 net sales 1.2 billion International markets 8 7 22% 33% expected peak sales Total Vimpat® 188 146 29% 28% Daiic
Slide 9: Keppra performance
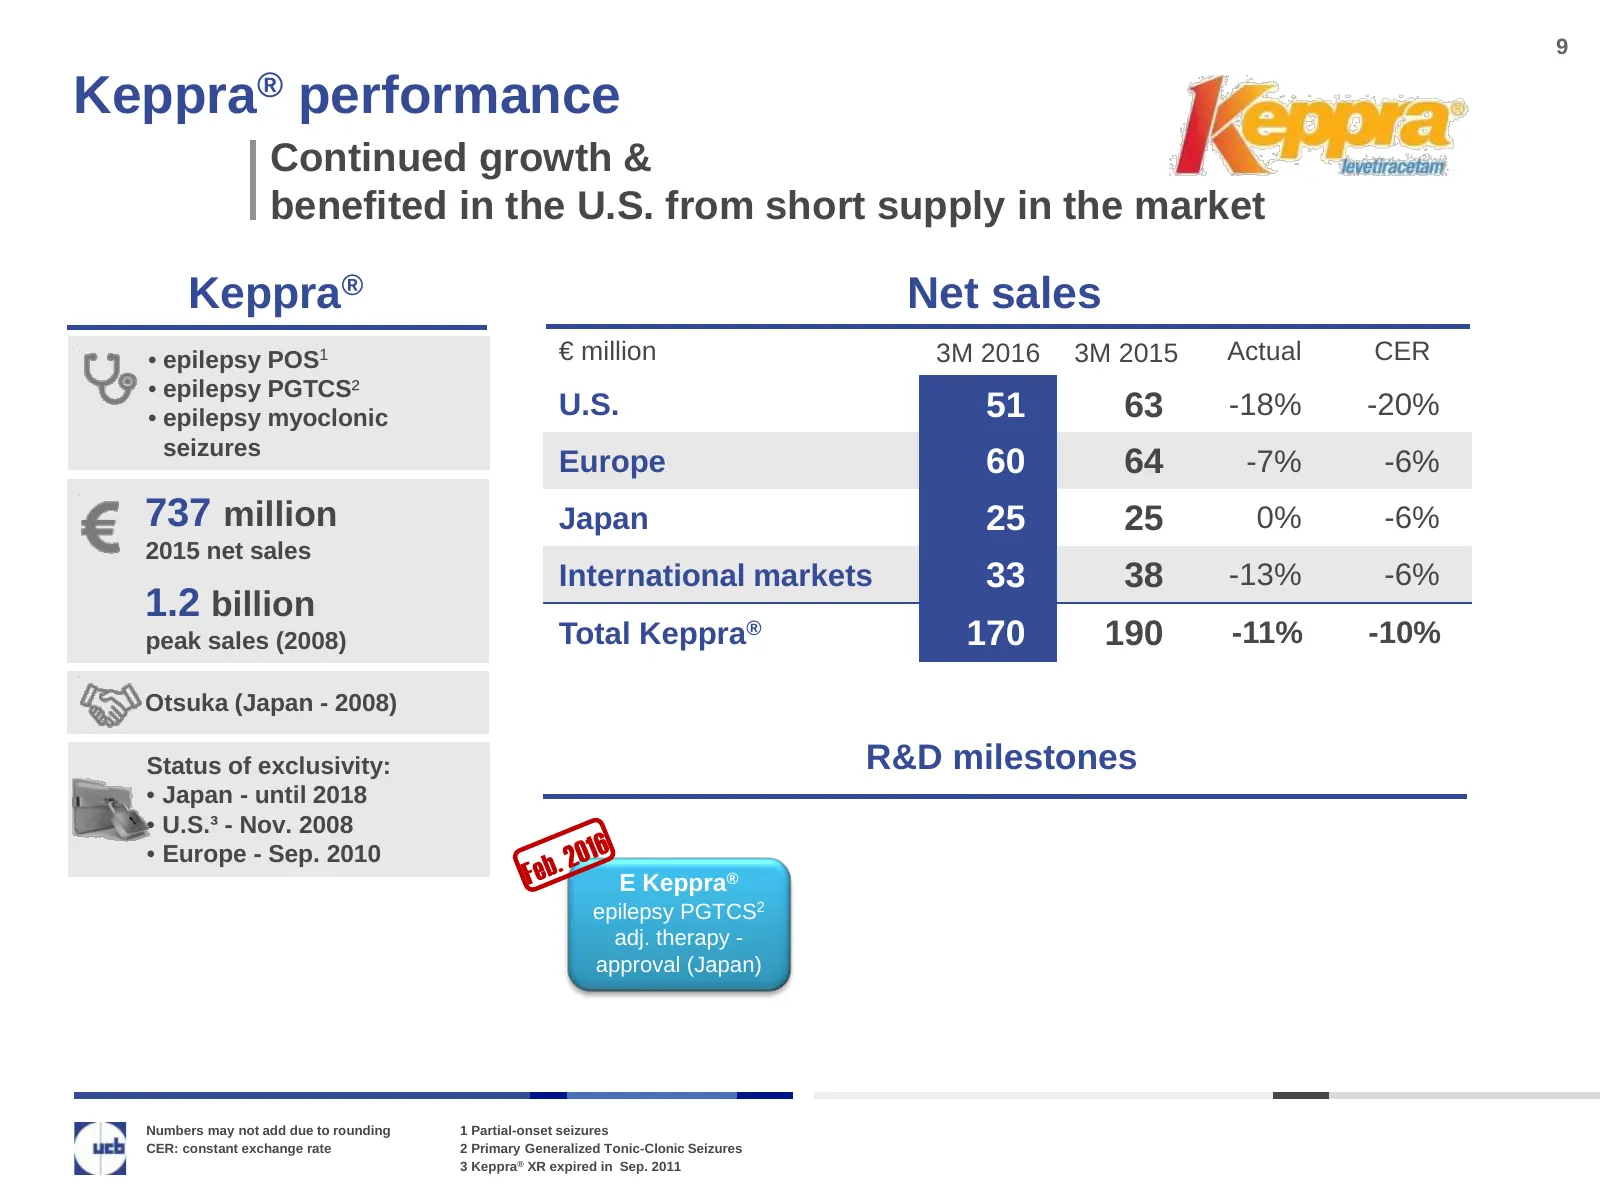
9 Keppra® performance Continued growth & benefited in the U.S. from short supply in the market Keppra® Net sales • epilepsy POS1 € million 3M 2016 3M 2015 Actual CER • epilepsy PGTCS² • epilepsy myoclonic U.S. 51 63 -18% -20% seizures Europe 60 64 -7% -6% 737 million Japan 25 25 0% -6% 2015 net sale
Slide 10: Neupro performance
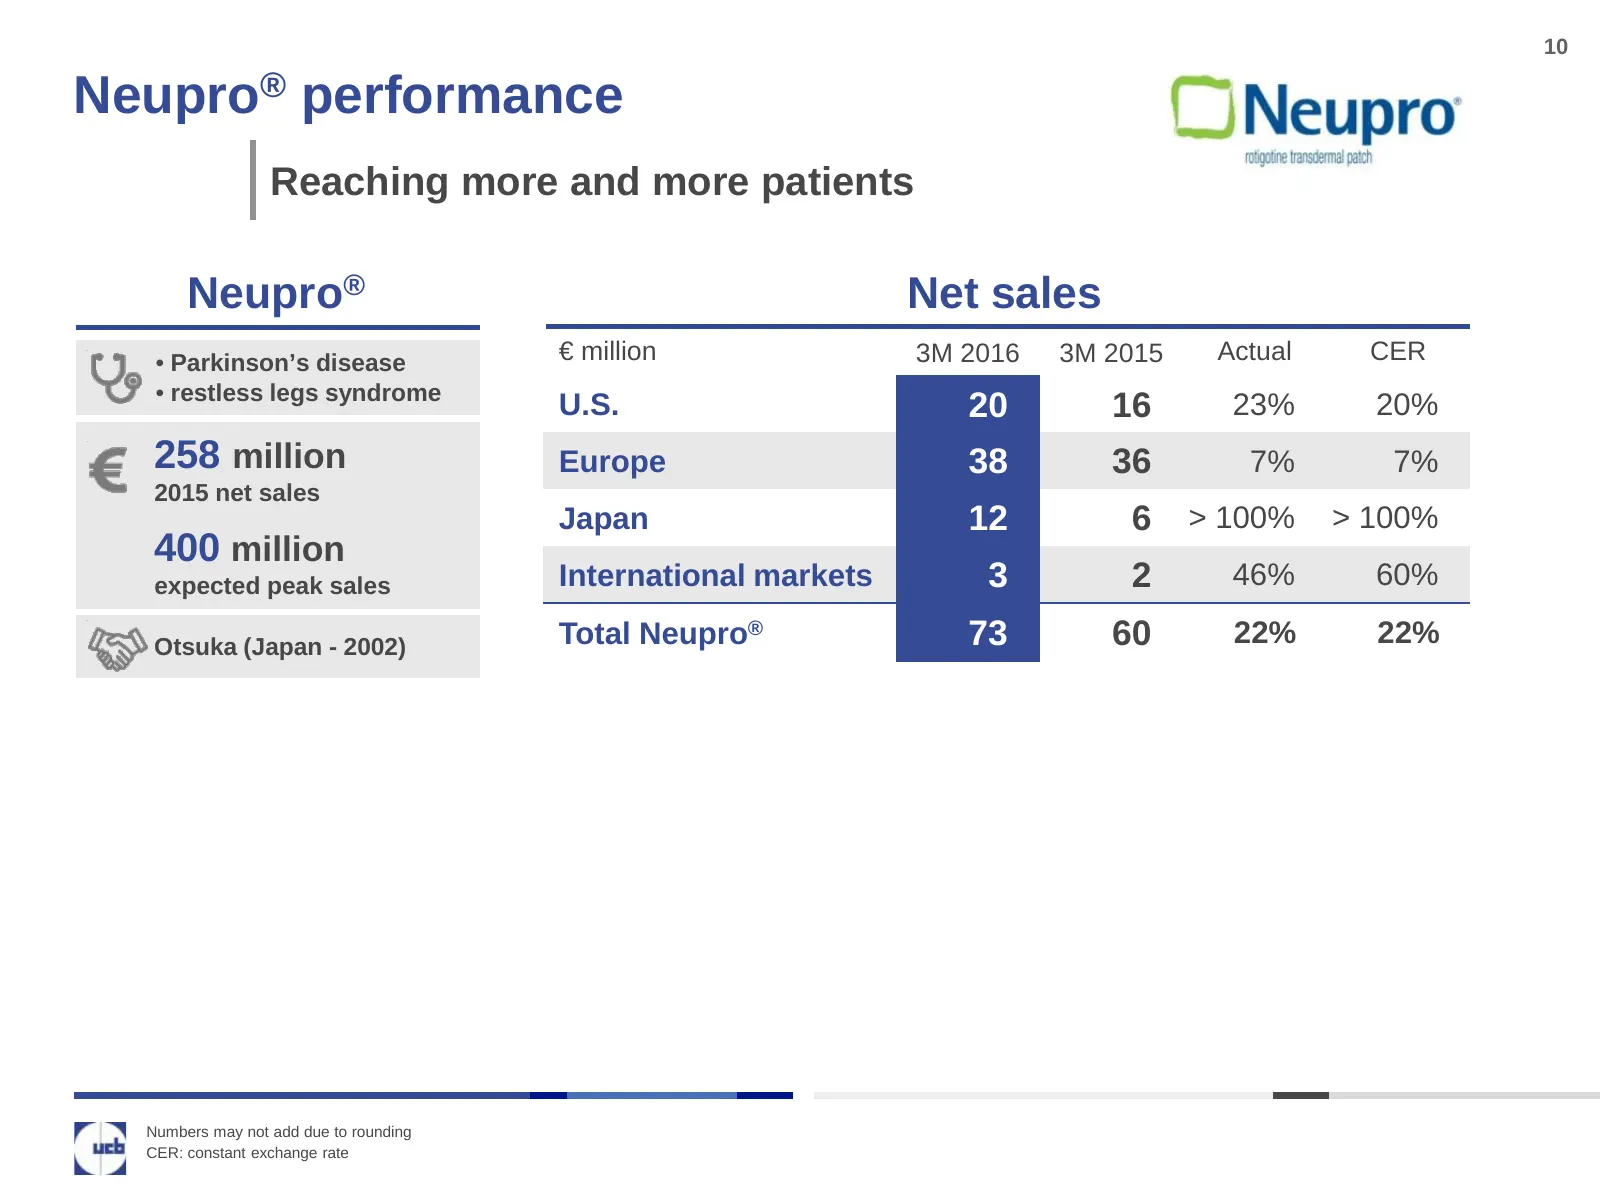
10 Neupro® performance Reaching more and more patients Neupro® Net sales • Parkinson’s disease € million 3M 2016 3M 2015 Actual CER • restless legs syndrome U.S. 20 16 23% 20% 258 million Europe 38 36 7% 7% 2015 net sales Japan 12 6 > 100% > 100% 400 million expected peak sales International markets
Slide 11: Romosozumab in bone loss disorders
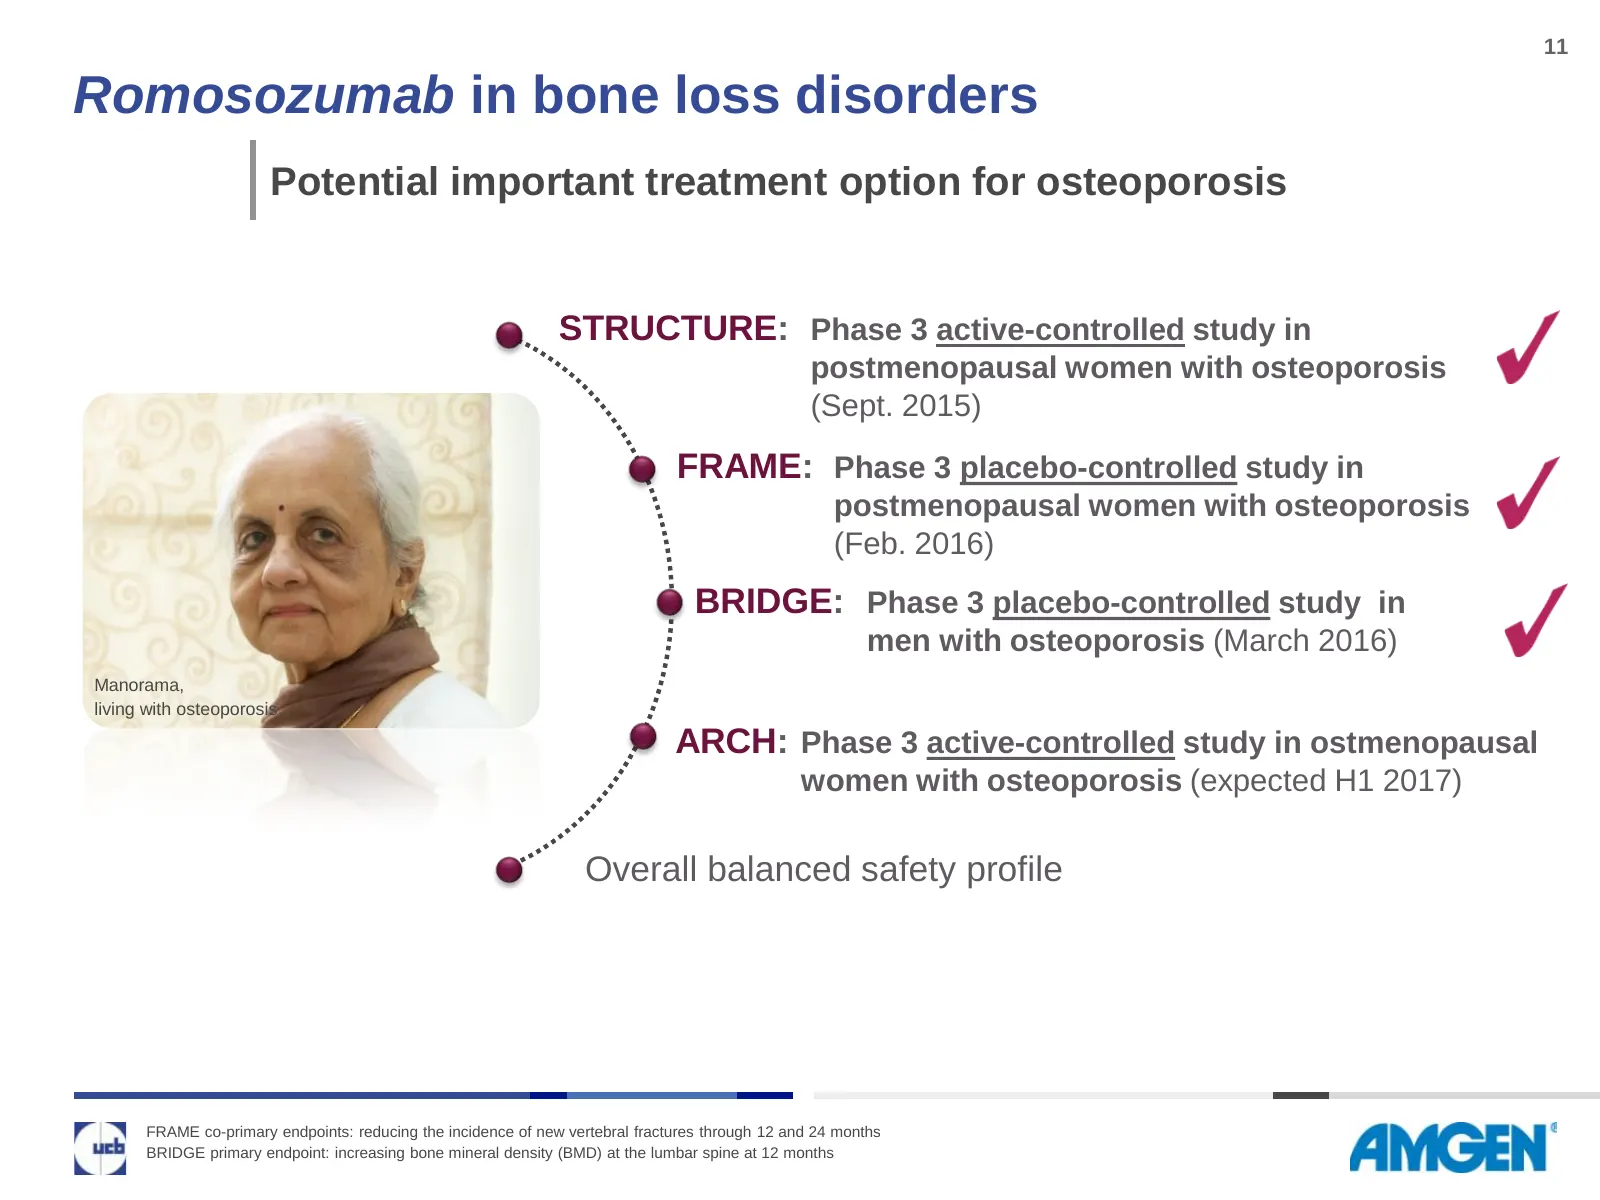
11 Romosozumab in bone loss disorders Potential important treatment option for osteoporosis STRUCTURE: Phase 3 active-controlled study in postmenopausal women with osteoporosis (Sept. 2015) FRAME: Phase 3 placebo-controlled study in postmenopausal women with osteoporosis (Feb. 2016) BRIDGE: Phase 3
Slide 12: Osteoporosis: a silent disease
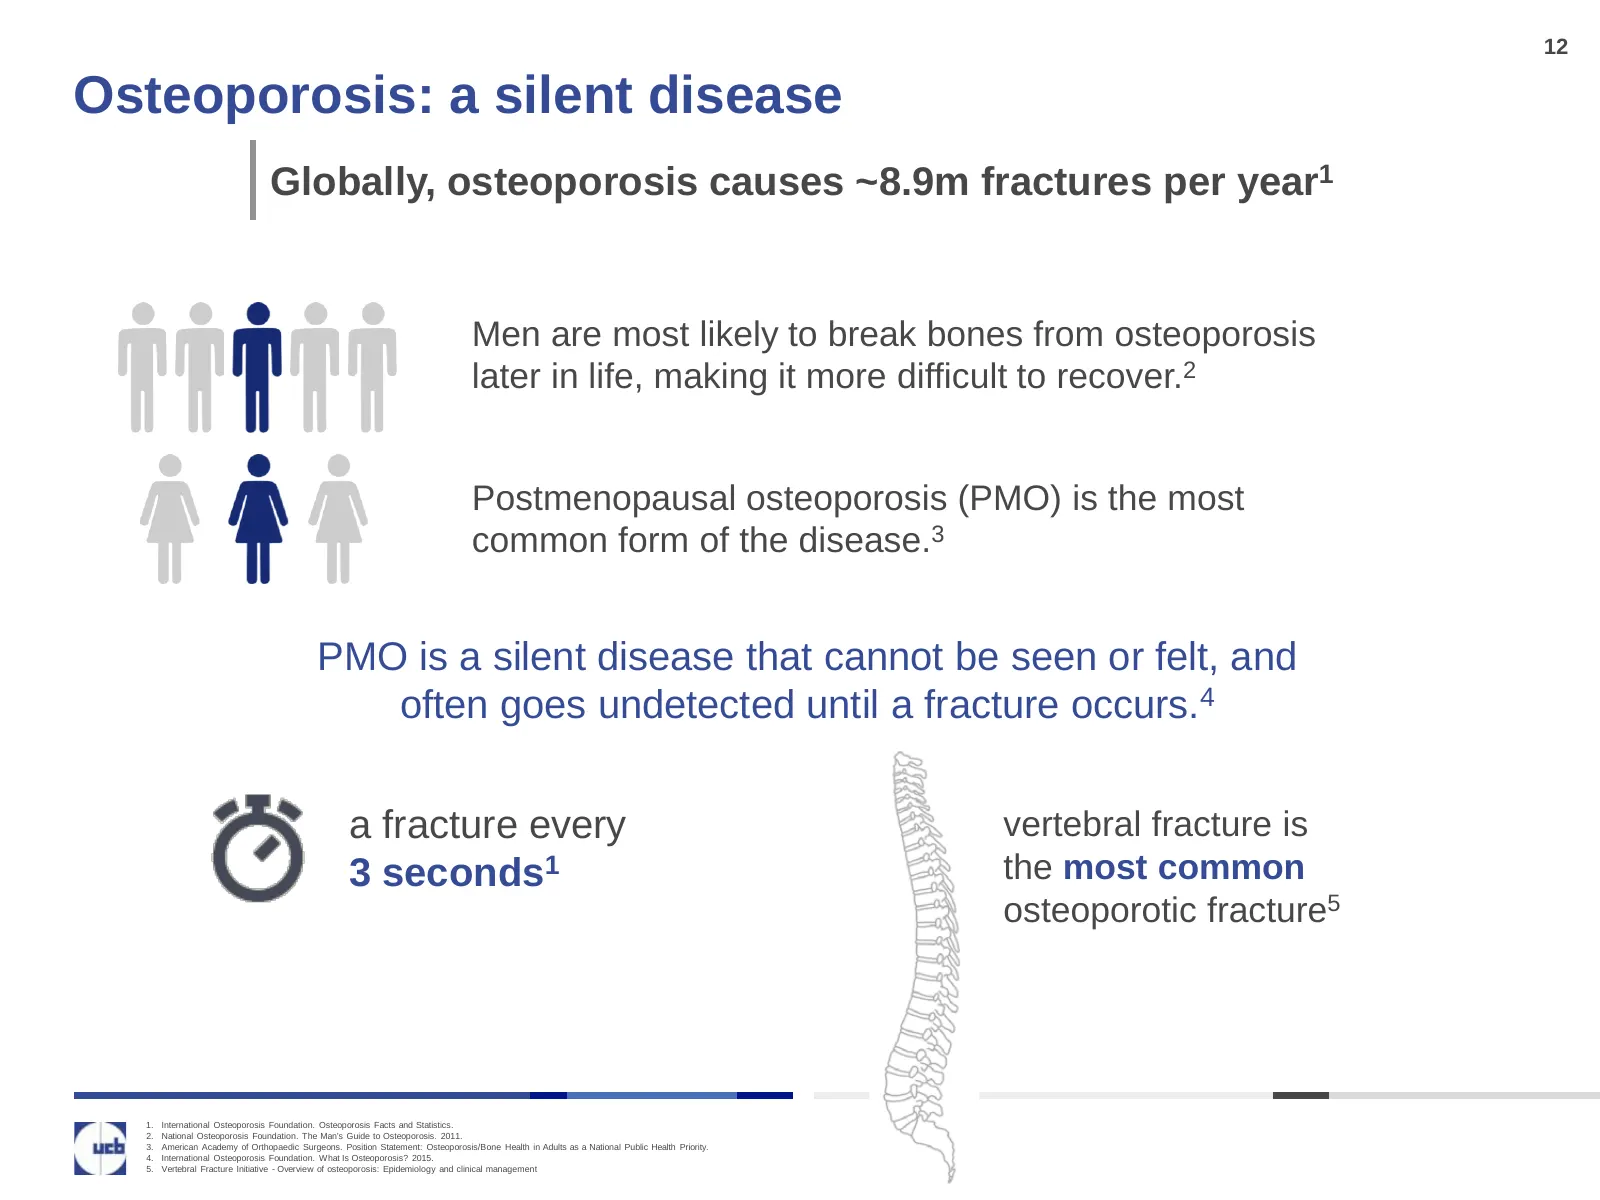
12 Osteoporosis: a silent disease Globally, osteoporosis causes ~8.9m fractures per year1 Men are most likely to break bones from osteoporosis later in life, making it more difficult to recover.2 Postmenopausal osteoporosis (PMO) is the most common form of the disease.3 PMO is a silent disease that
Slide 13: Early pipeline - Deliver breakthrough solutions
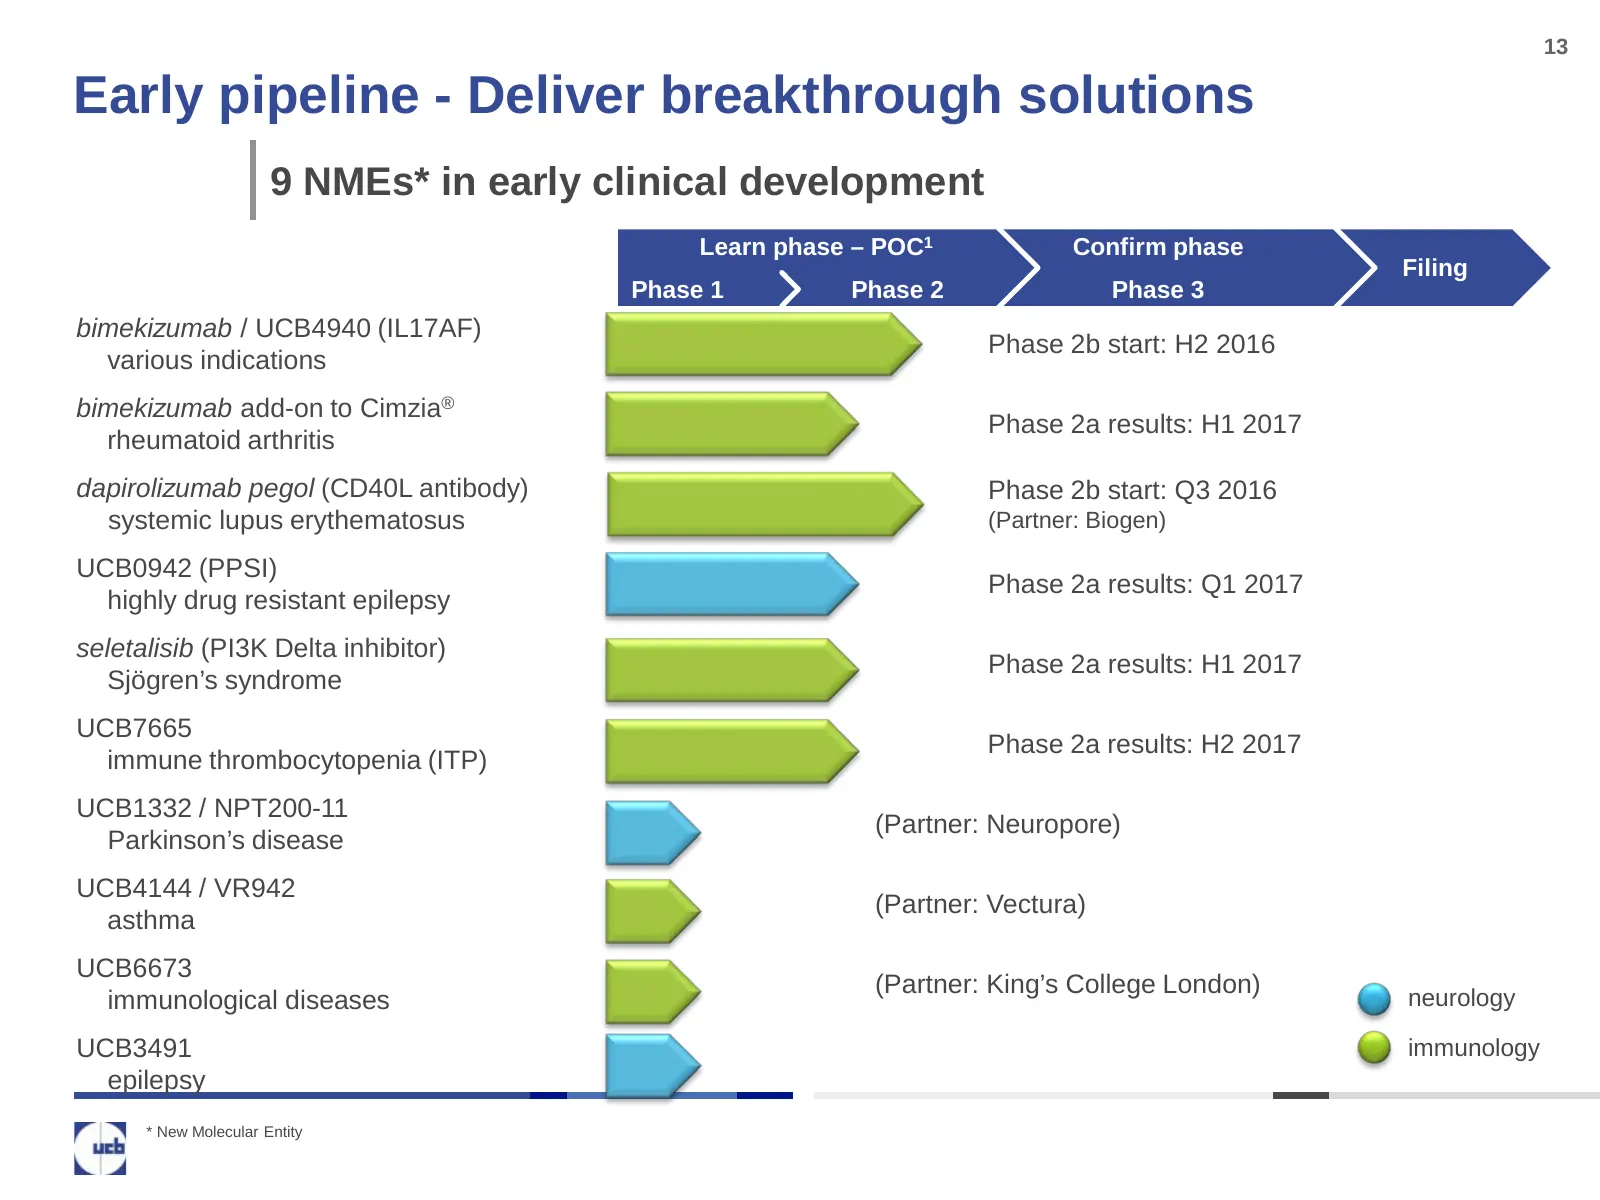
13 Early pipeline - Deliver breakthrough solutions 9 NMEs* in early clinical development Learn phase – POC1 Confirm phase Filing Phase 1 Phase 2 Phase 3 bimekizumab / UCB4940 (IL17AF) Phase 2b start: H2 2016 various indications bimekizumab add-on to Cimzia® Phase 2a results: H1 2017 rheumatoid arthr
Slide 14: Upcoming R&D milestones
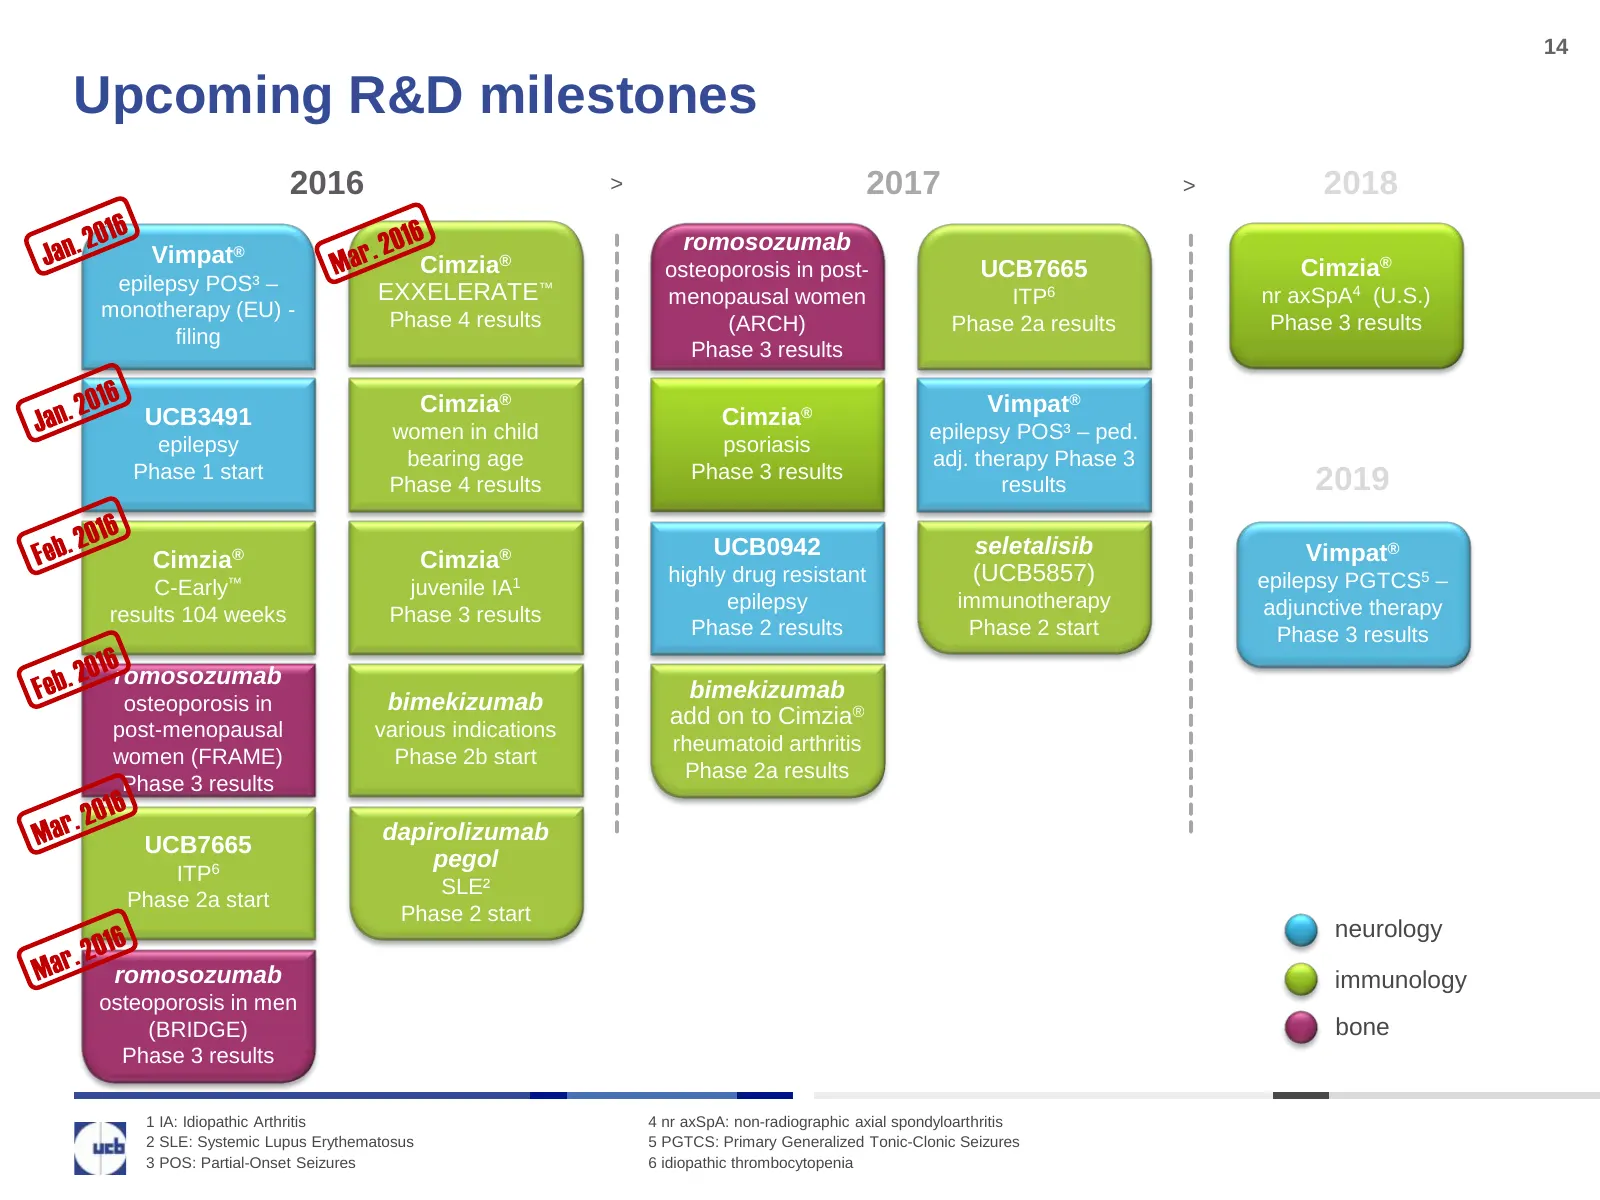
14 Upcoming R&D milestones 2016 > 2017 > 2018 romosozumab Vimpat® Cimzia® Cimzia® osteoporosis in post- UCB7665 epilepsy POS³ – EXXELERATE™ menopausal women ITP6 nr axSpA4 (U.S.) monotherapy (EU) - Phase 4 results (ARCH) Phase 2a results Phase 3 results filing Phase 3 results Cimzia® Vimpat® UCB3491
Slide 15: 2016 and mid-term financial outlook
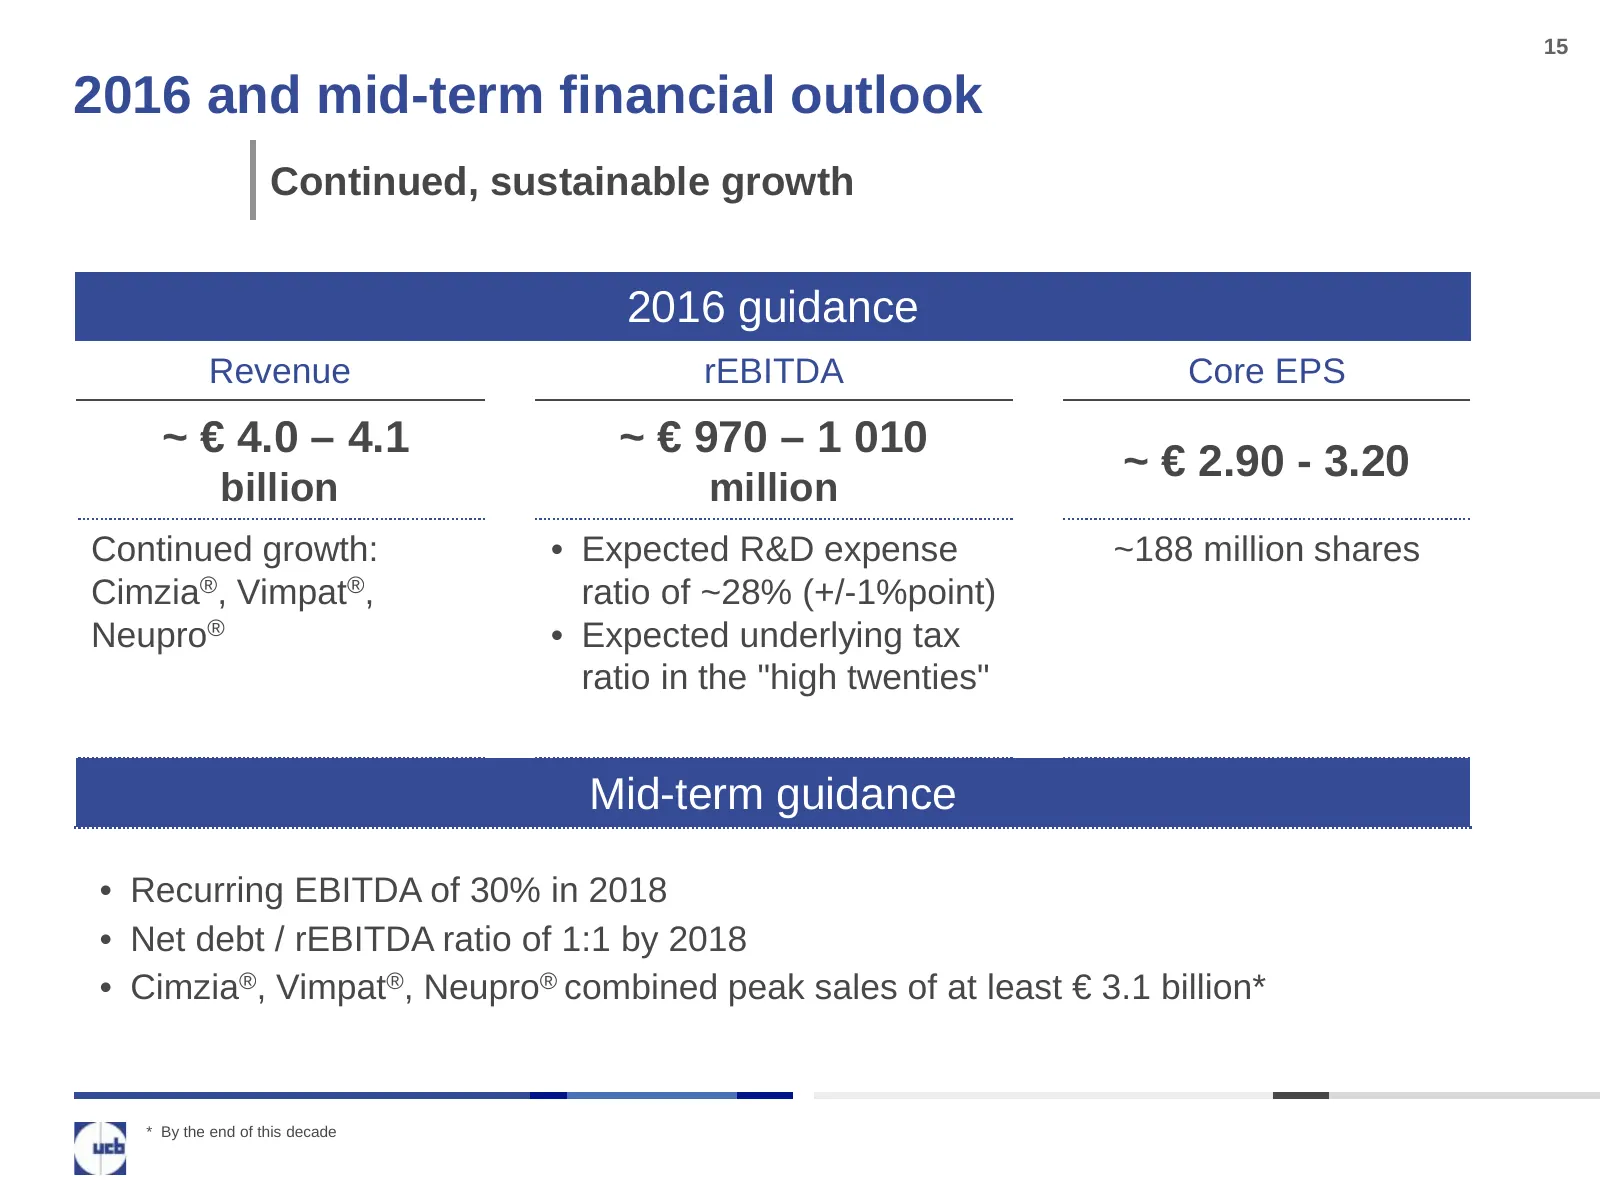
15 2016 and mid-term financial outlook Continued, sustainable growth 2016 guidance Revenue rEBITDA Core EPS ~ € 4.0 – 4.1 ~ € 970 – 1 010 ~ € 2.90 - 3.20 billion million Continued growth: • Expected R&D expense ~188 million shares Cimzia®, Vimpat®, ratio of ~28% (+/-1%point) Neupro® • Expected under
Slide 16: UCB's Strategic Growth Path
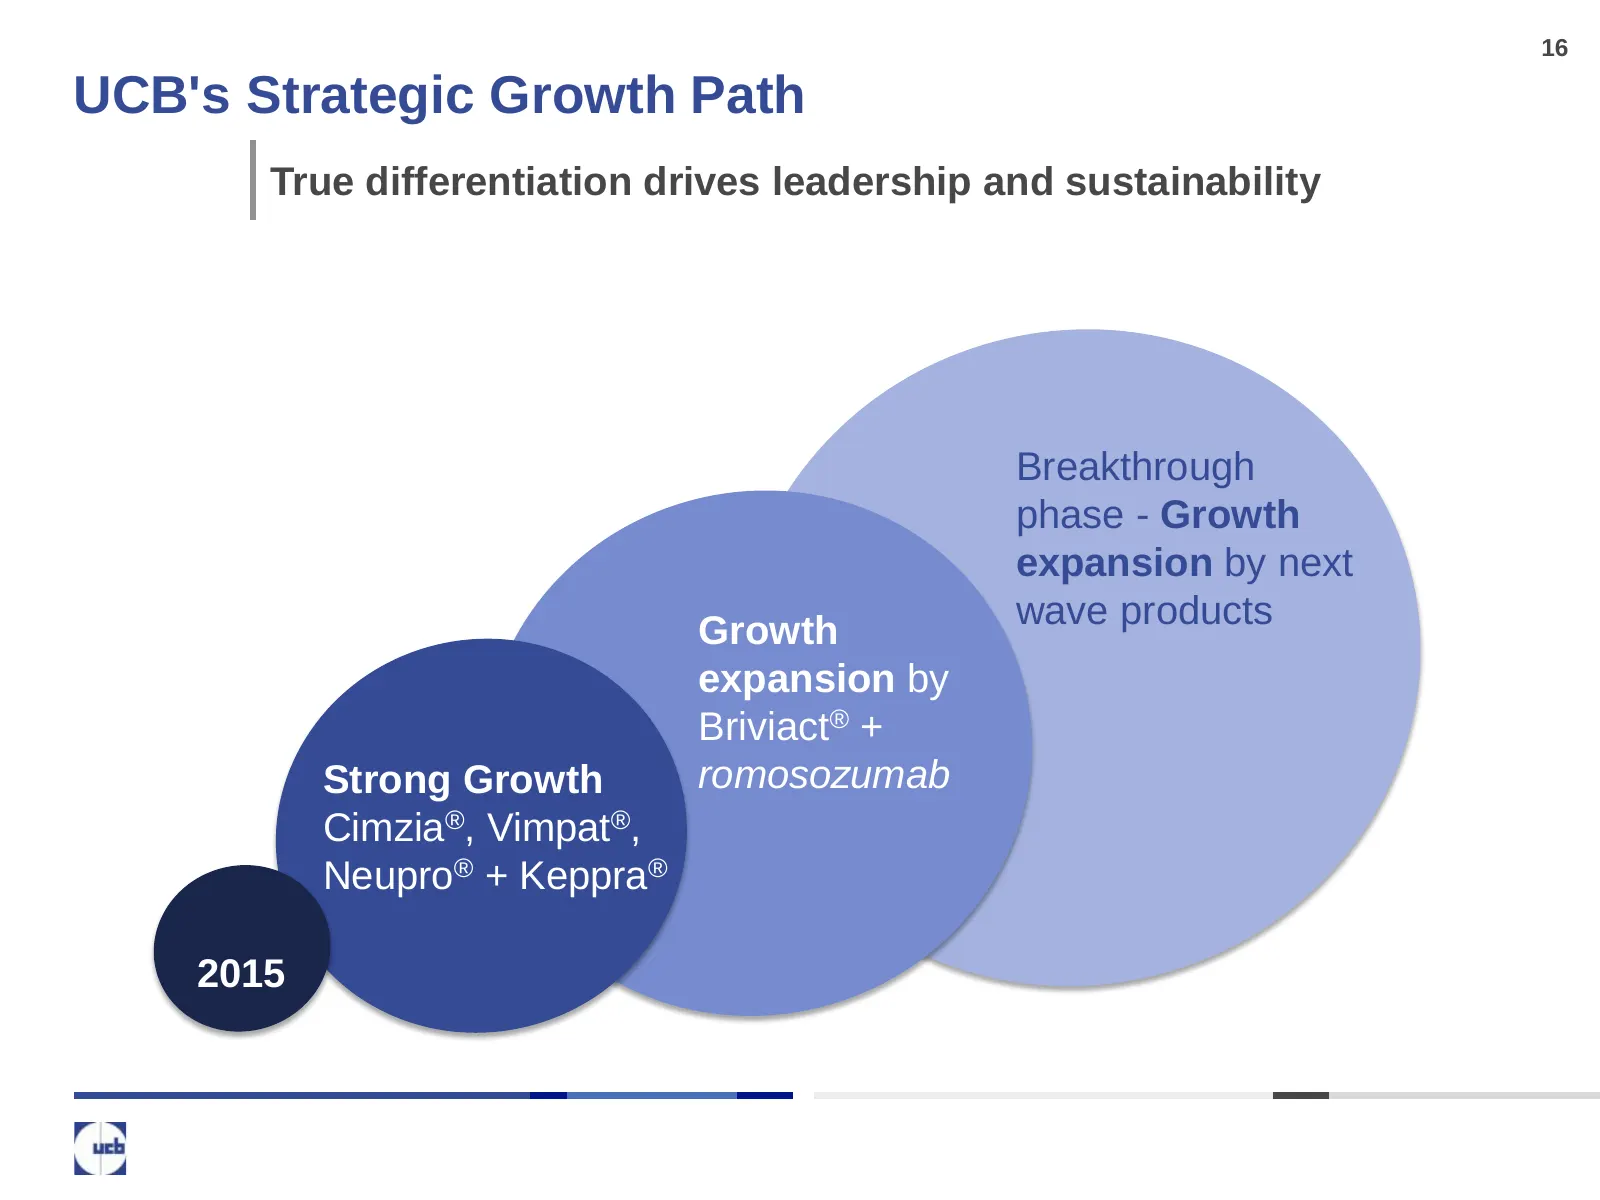
16 UCB's Strategic Growth Path True differentiation drives leadership and sustainability Breakthrough phase - Growth expansion by next wave products Growth expansion by Briviact® + Strong Growth romosozumab Cimzia®, Vimpat®, Neupro® + Keppra® 2015
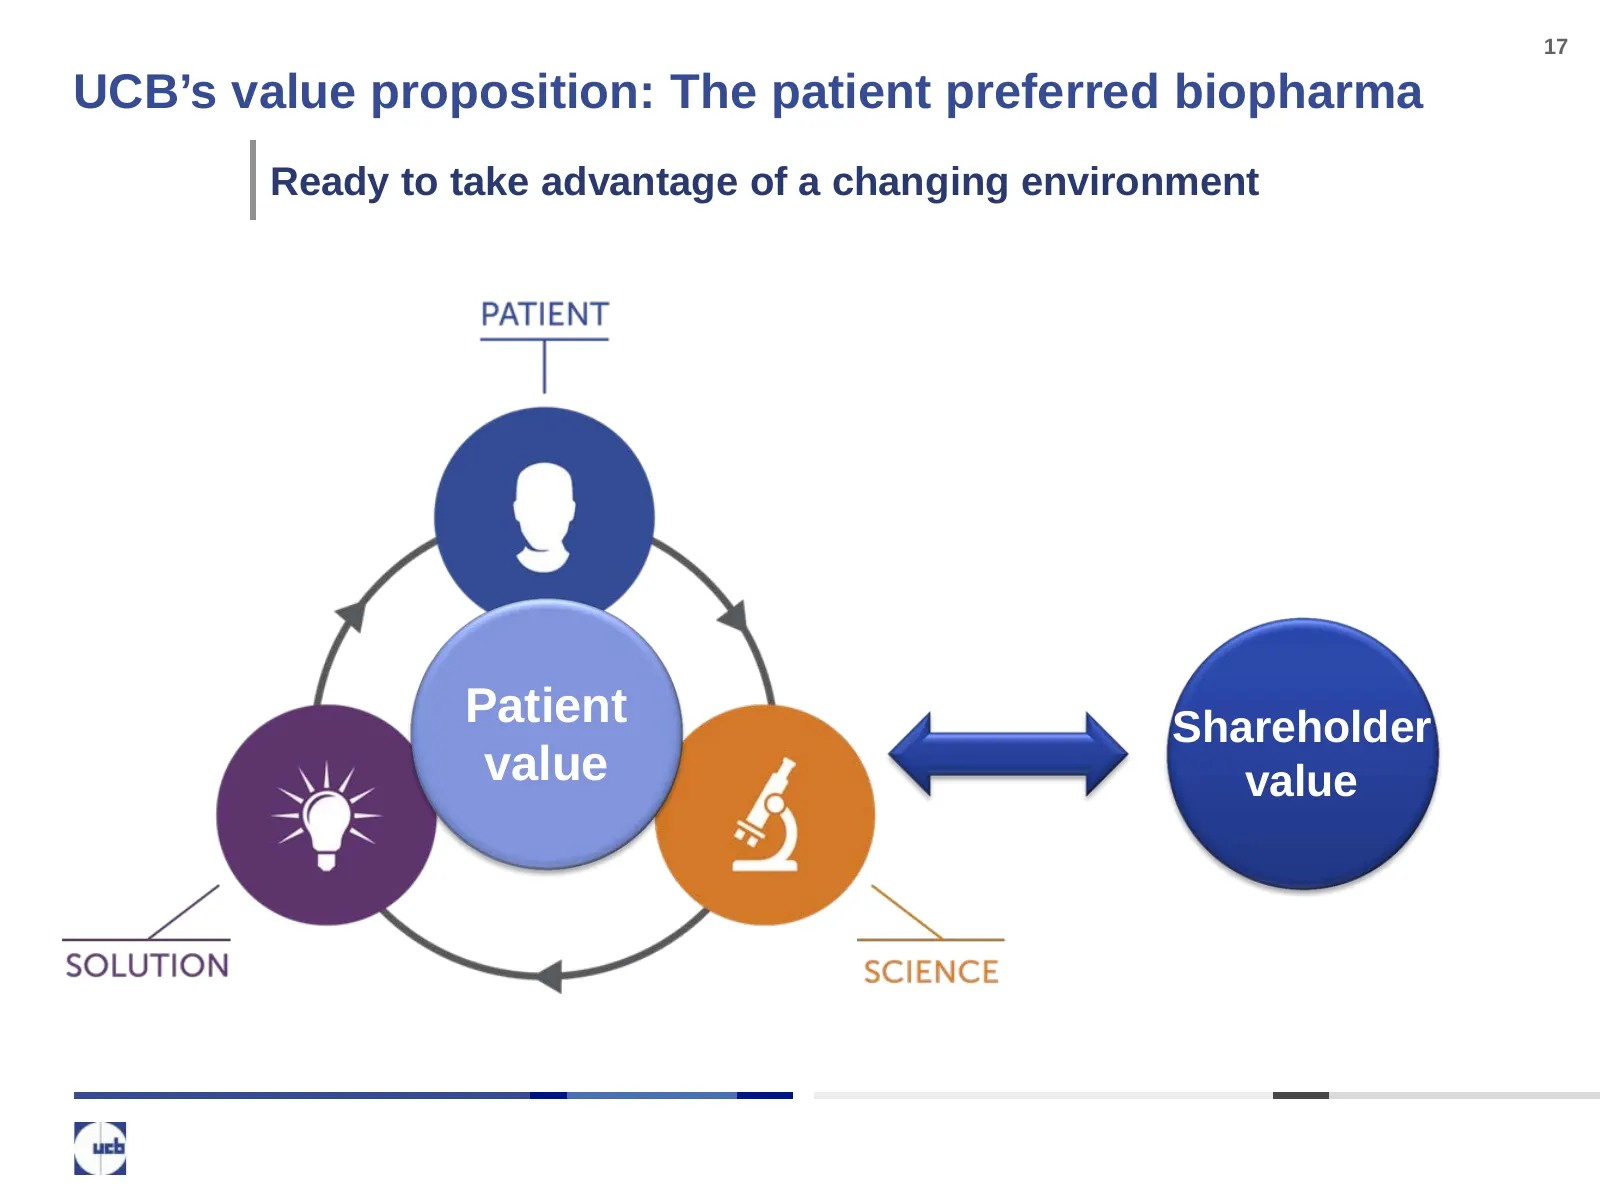
Slide 17: UCB's value proposition: The patient preferred biopharma
17 UCB’s value proposition: The patient preferred biopharma Ready to take advantage of a changing environment Patient Shareholder value value

Slide 18: Appendix
i) yo logiong, living with epilepsy Fyn Inspired by patients. 4 Driven by science.
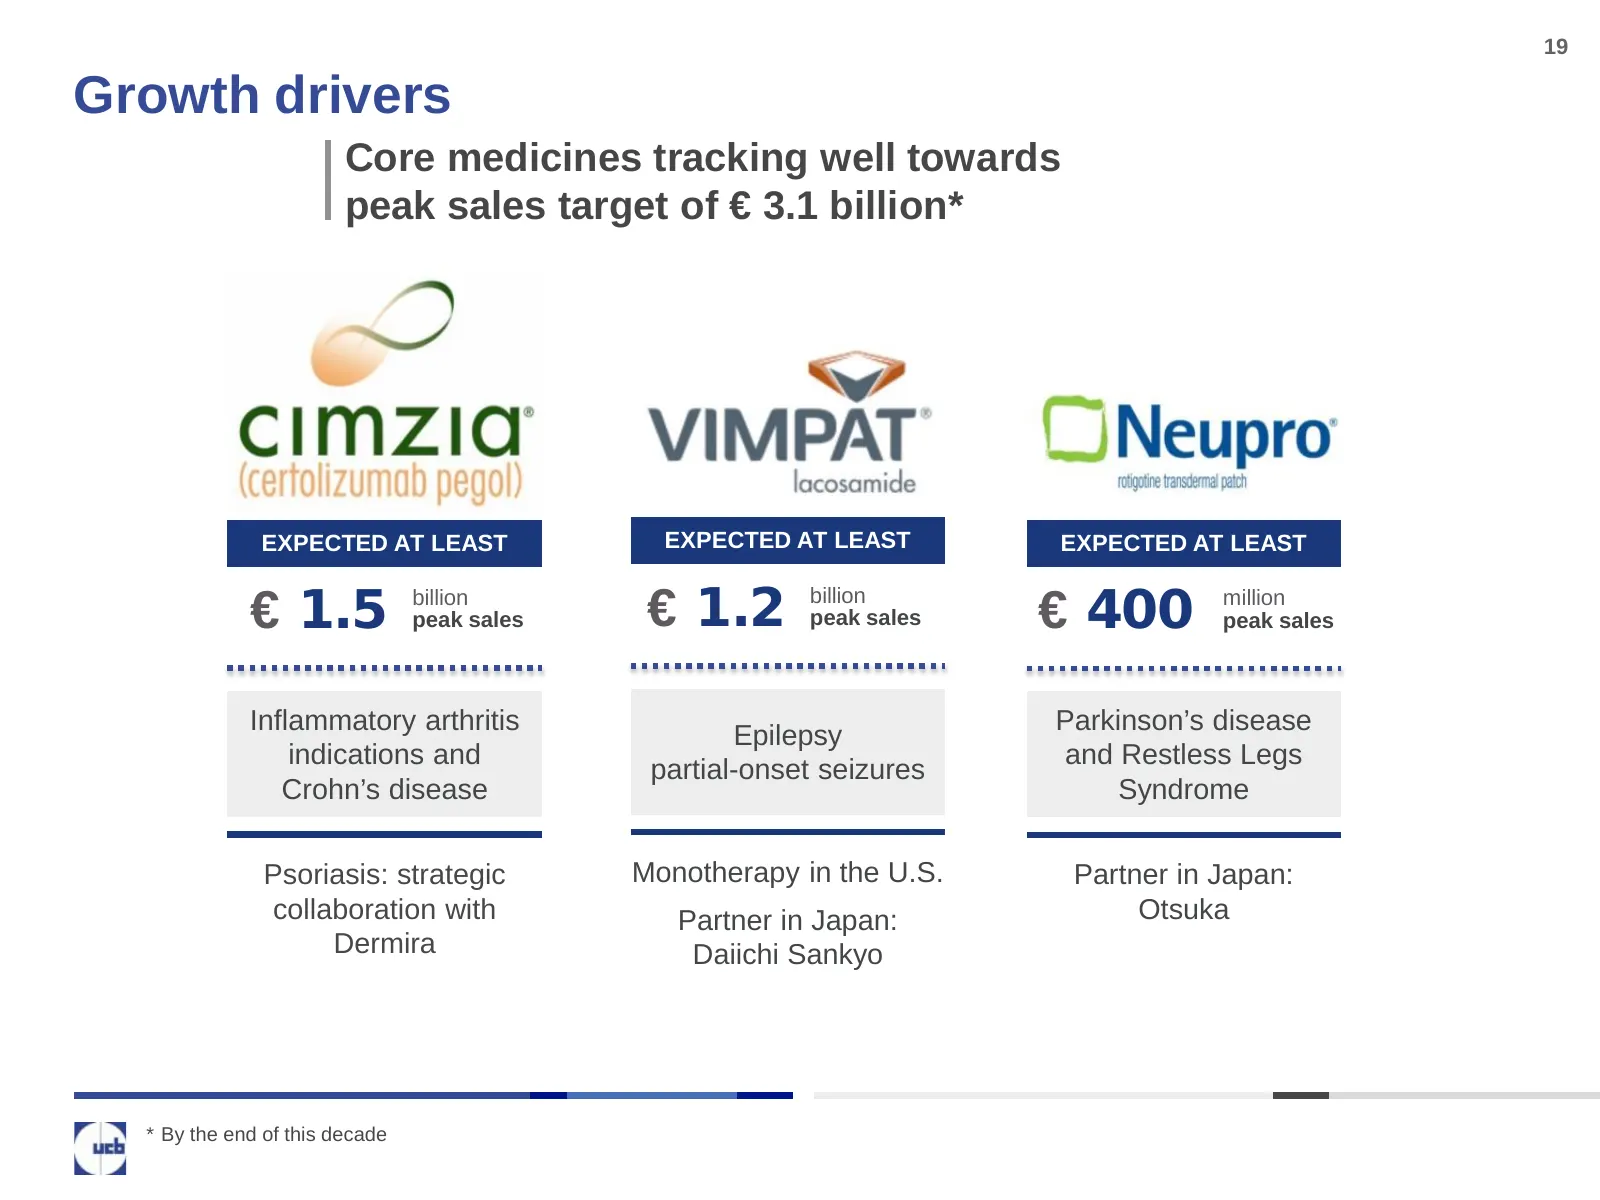
Slide 19: Growth drivers
19 Growth drivers Core medicines tracking well towards peak sales target of € 3.1 billion* EXPECTED AT LEAST EXPECTED AT LEAST EXPECTED AT LEAST € 1.5 billion peak sales € 1.2 billion peak sales € 400 million peak sales Inflammatory arthritis Parkinson’s disease Epilepsy indications and and Restless
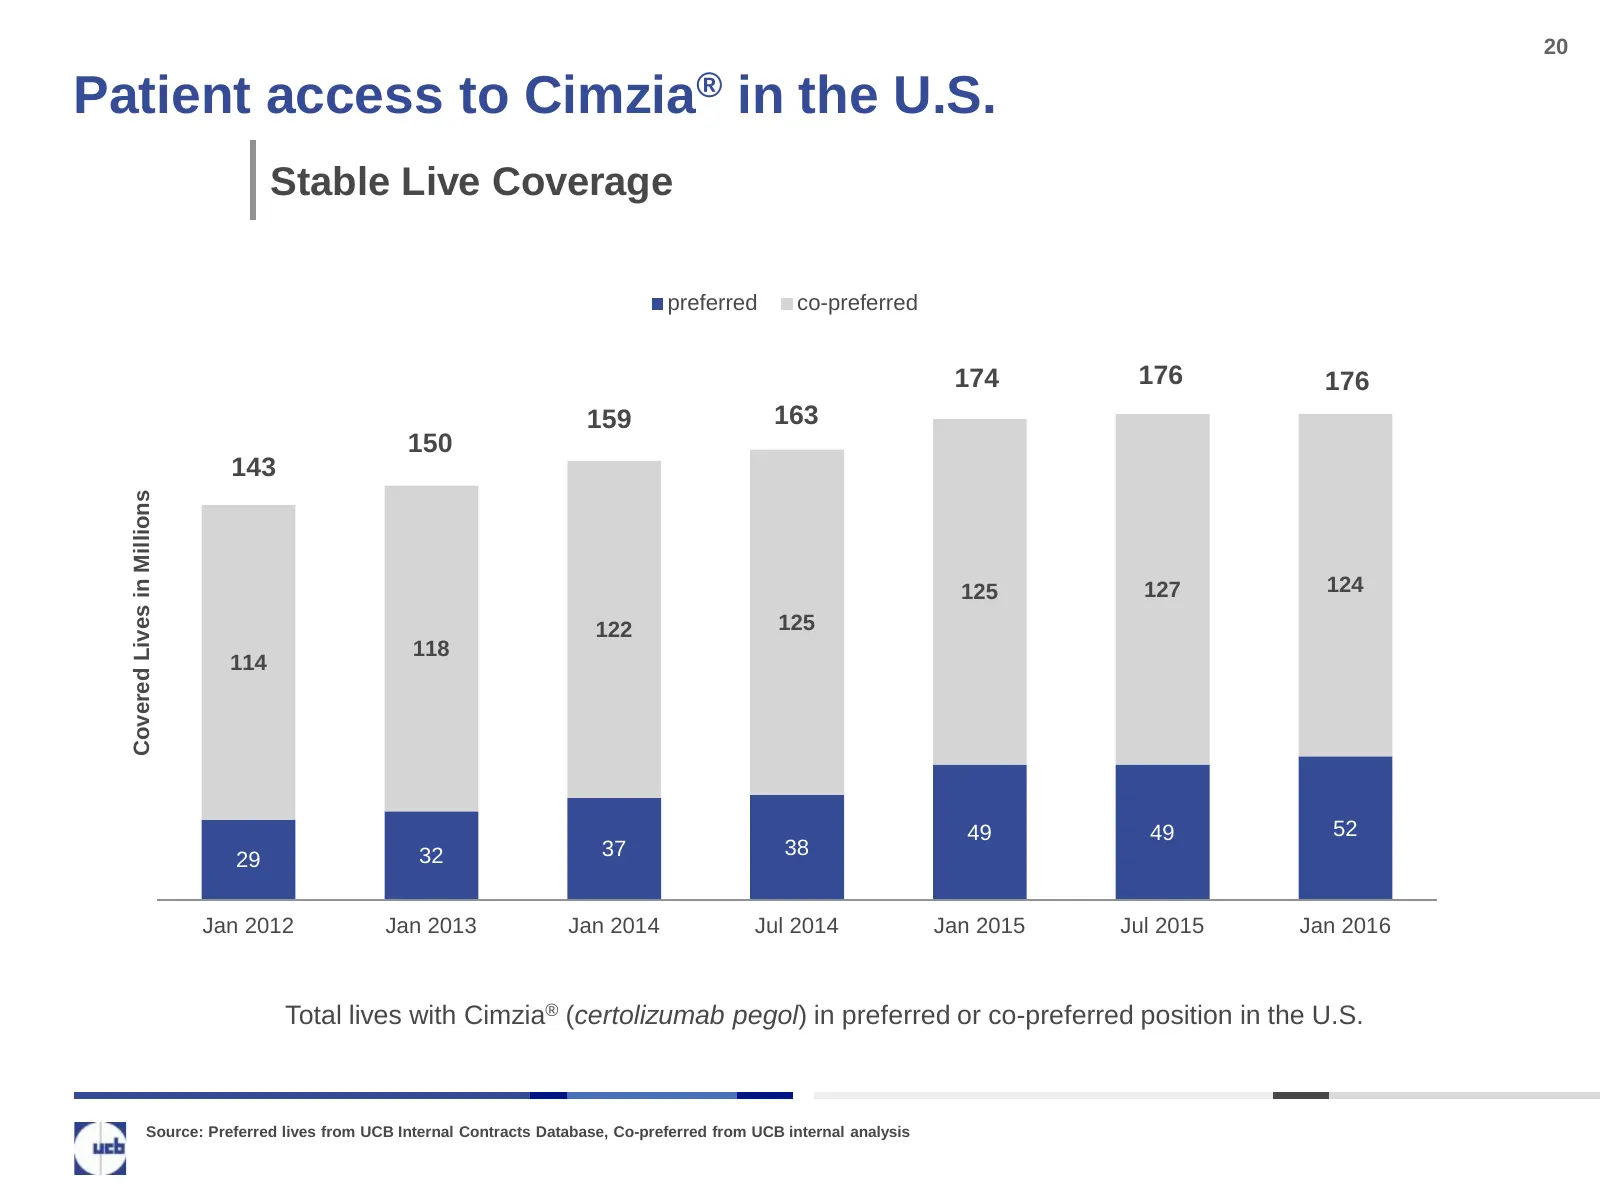
Slide 20: Patient access to Cimzia in the U.S.
20 Patient access to Cimzia® in the U.S. Stable Live Coverage preferred co-preferred 174 176 176 159 163 150 143 Covered Lives in Millions 125 127 124 122 125 118 114 49 49 52 32 37 38 29 Jan 2012 Jan 2013 Jan 2014 Jul 2014 Jan 2015 Jul 2015 Jan 2016 Total lives with Cimzia® (certolizumab pegol) in
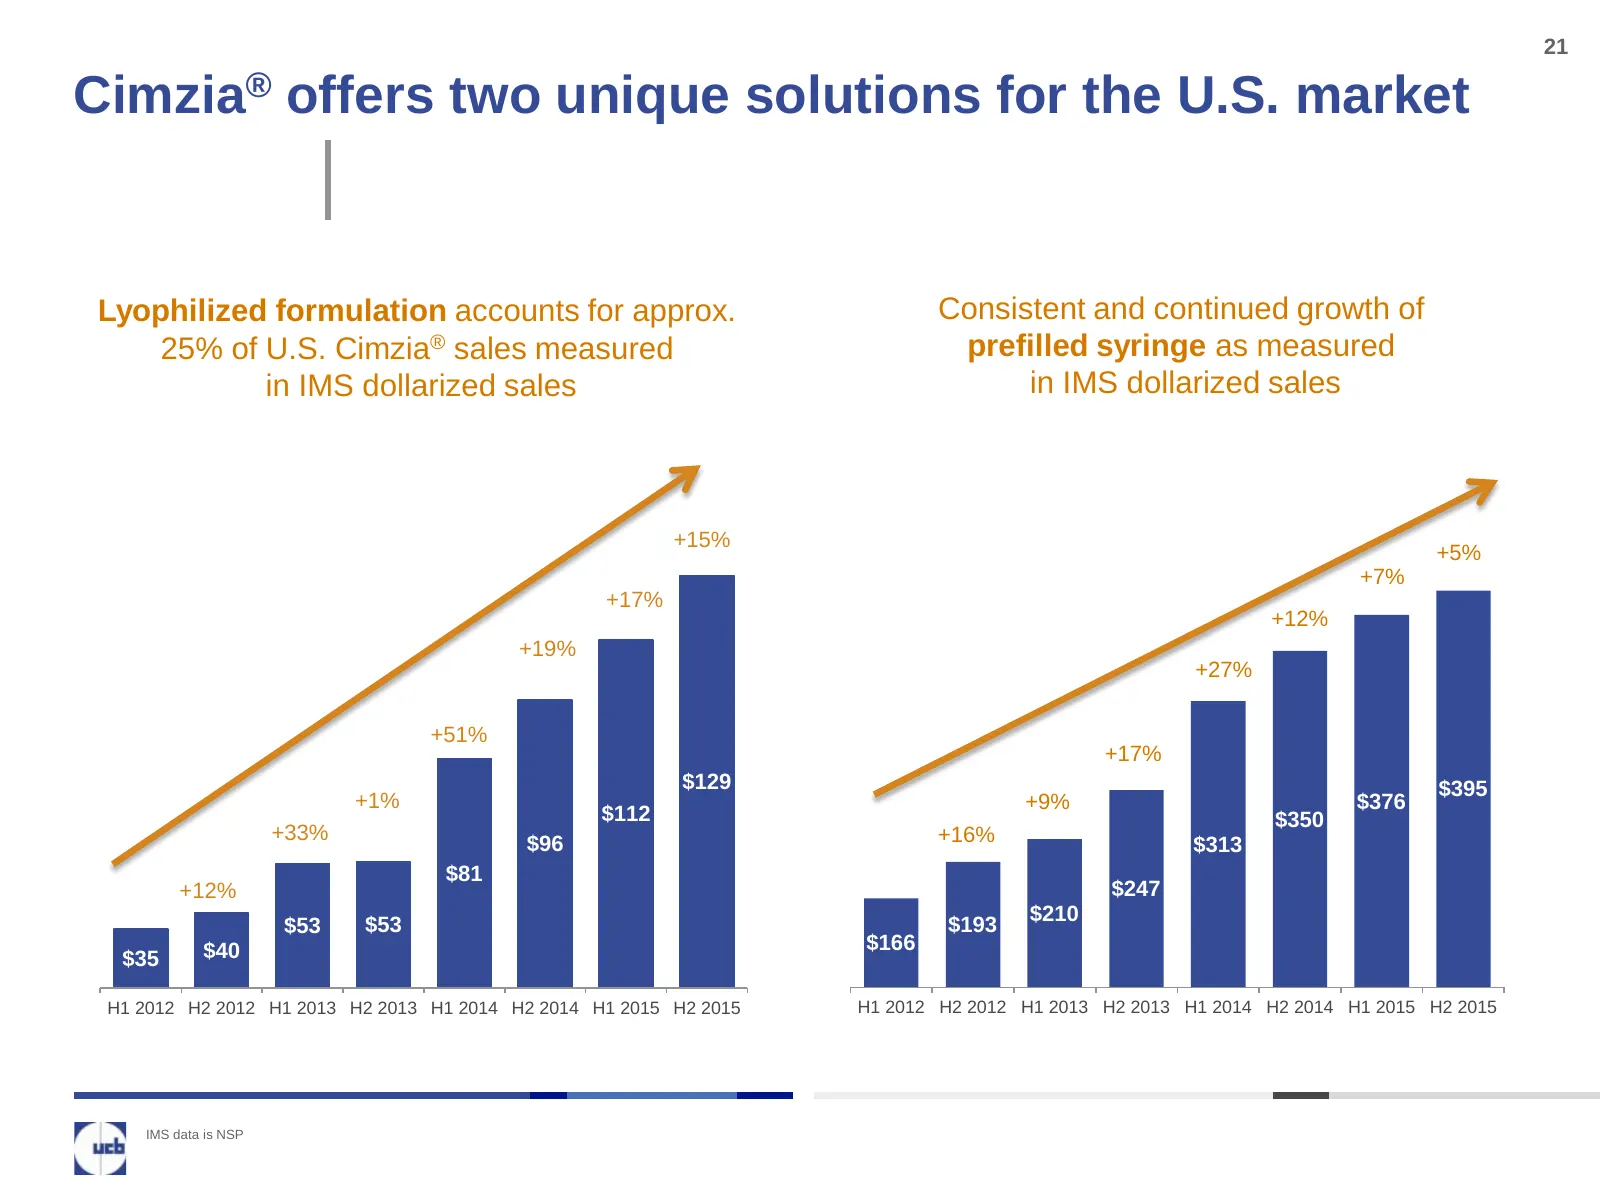
Slide 21: Cimzia offers two unique solutions for the U.S. market
21 Cimzia® offers two unique solutions for the U.S. market Lyophilized formulation accounts for approx. Consistent and continued growth of 25% of U.S. Cimzia® sales measured prefilled syringe as measured in IMS dollarized sales in IMS dollarized sales +15% +5% +7% +17% +12% +19% +27% +51% +17% $129
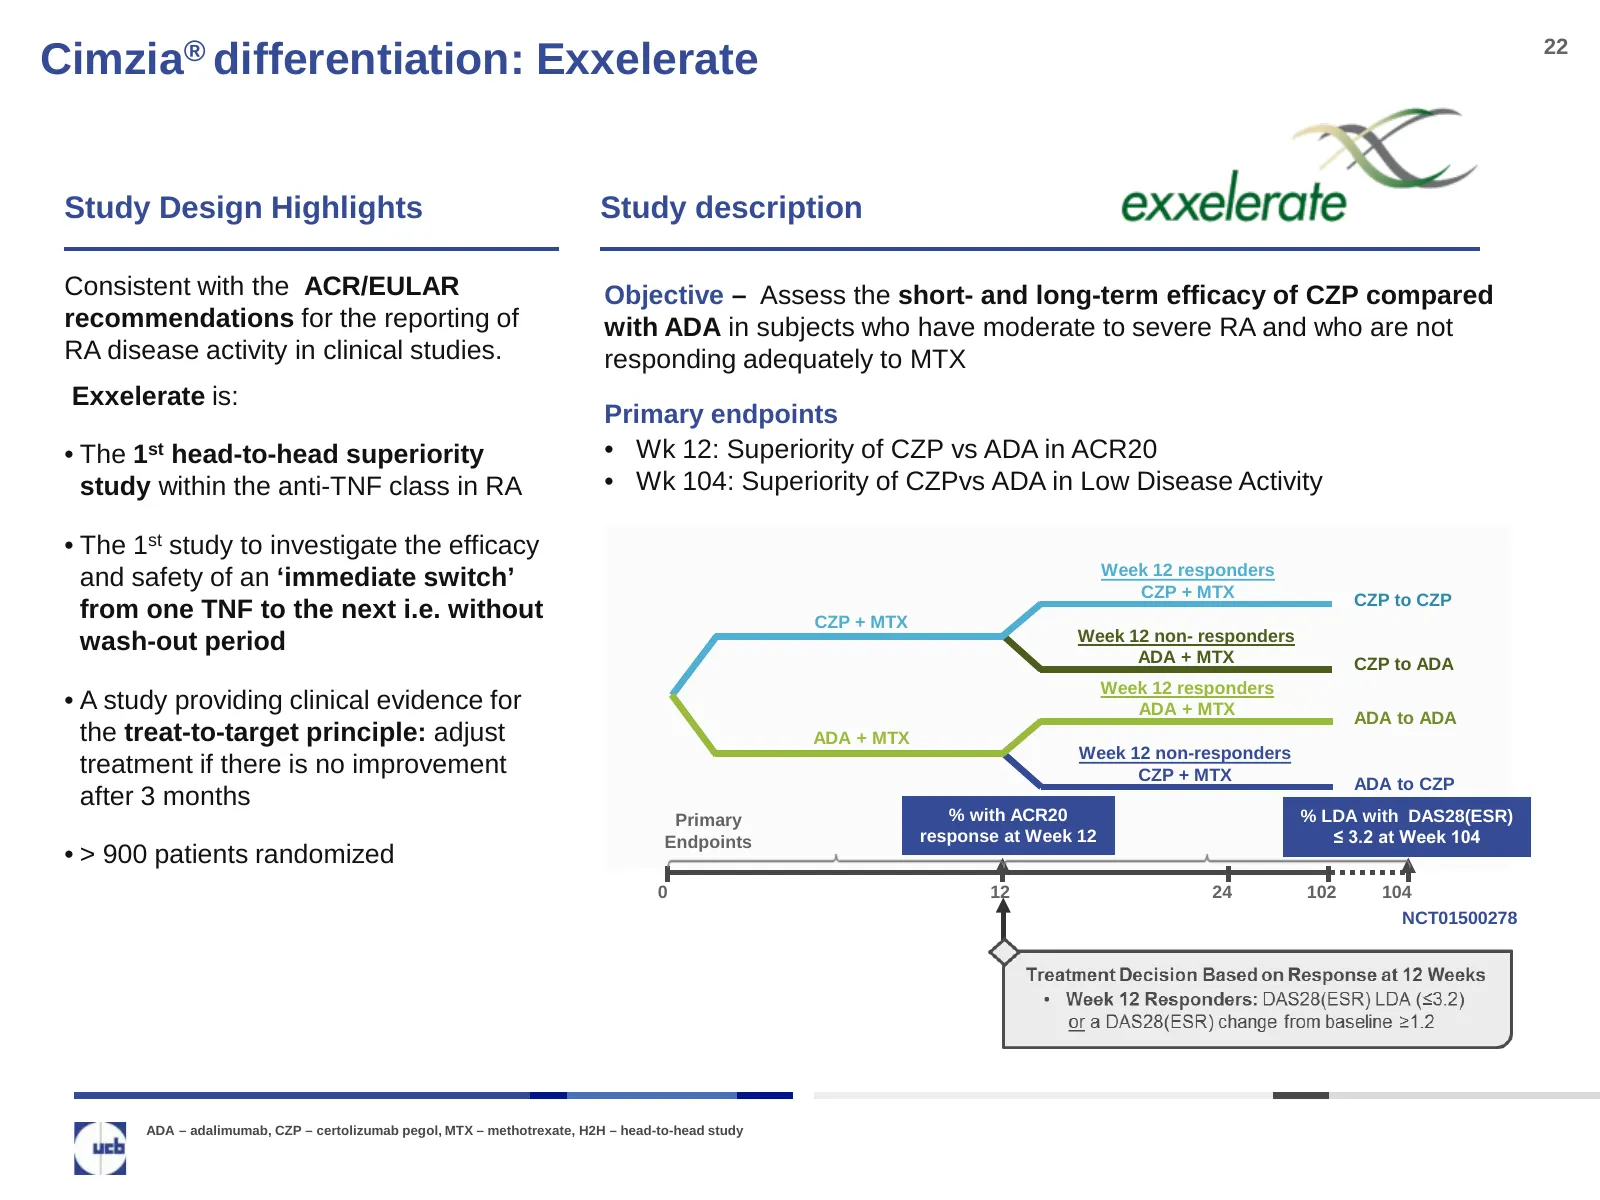
Slide 22: Cimzia differentiation: Exxelerate
22 Cimzia® differentiation: Exxelerate Study Design Highlights Study description Consistent with the ACR/EULAR Objective – Assess the short- and long-term efficacy of CZP compared recommendations for the reporting of with ADA in subjects who have moderate to severe RA and who are not RA disease acti
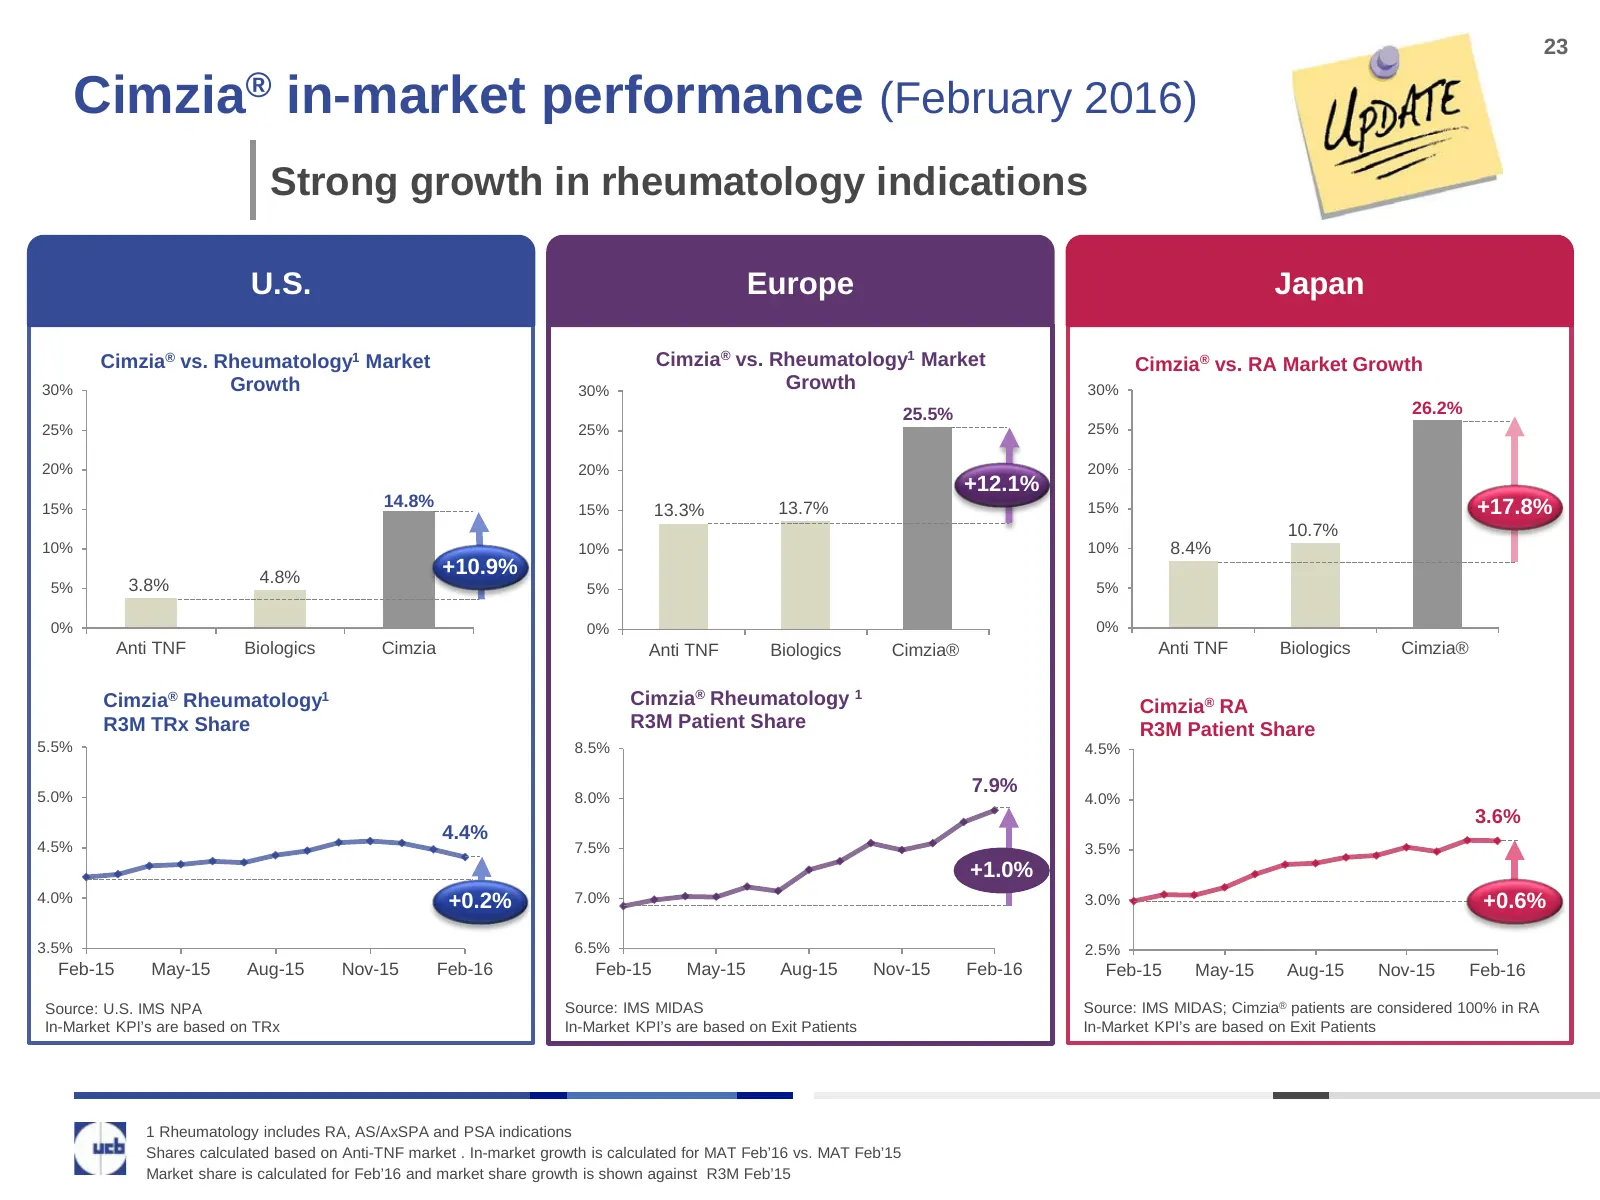
Slide 23: Cimzia in-market performance (February 2016)
23 Cimzia® in-market performance (February 2016) Strong growth in rheumatology indications U.S. Europe Japan Cimzia® vs. Rheumatology1 Market Cimzia® vs. Rheumatology1 Market Cimzia® vs. RA Market Growth 30% Growth 30% Growth 30% 25.5% 26.2% 25% 25% 25% 20% 20% 20% +12.1% 15% 14.8% 13.7% 15% +17.8%
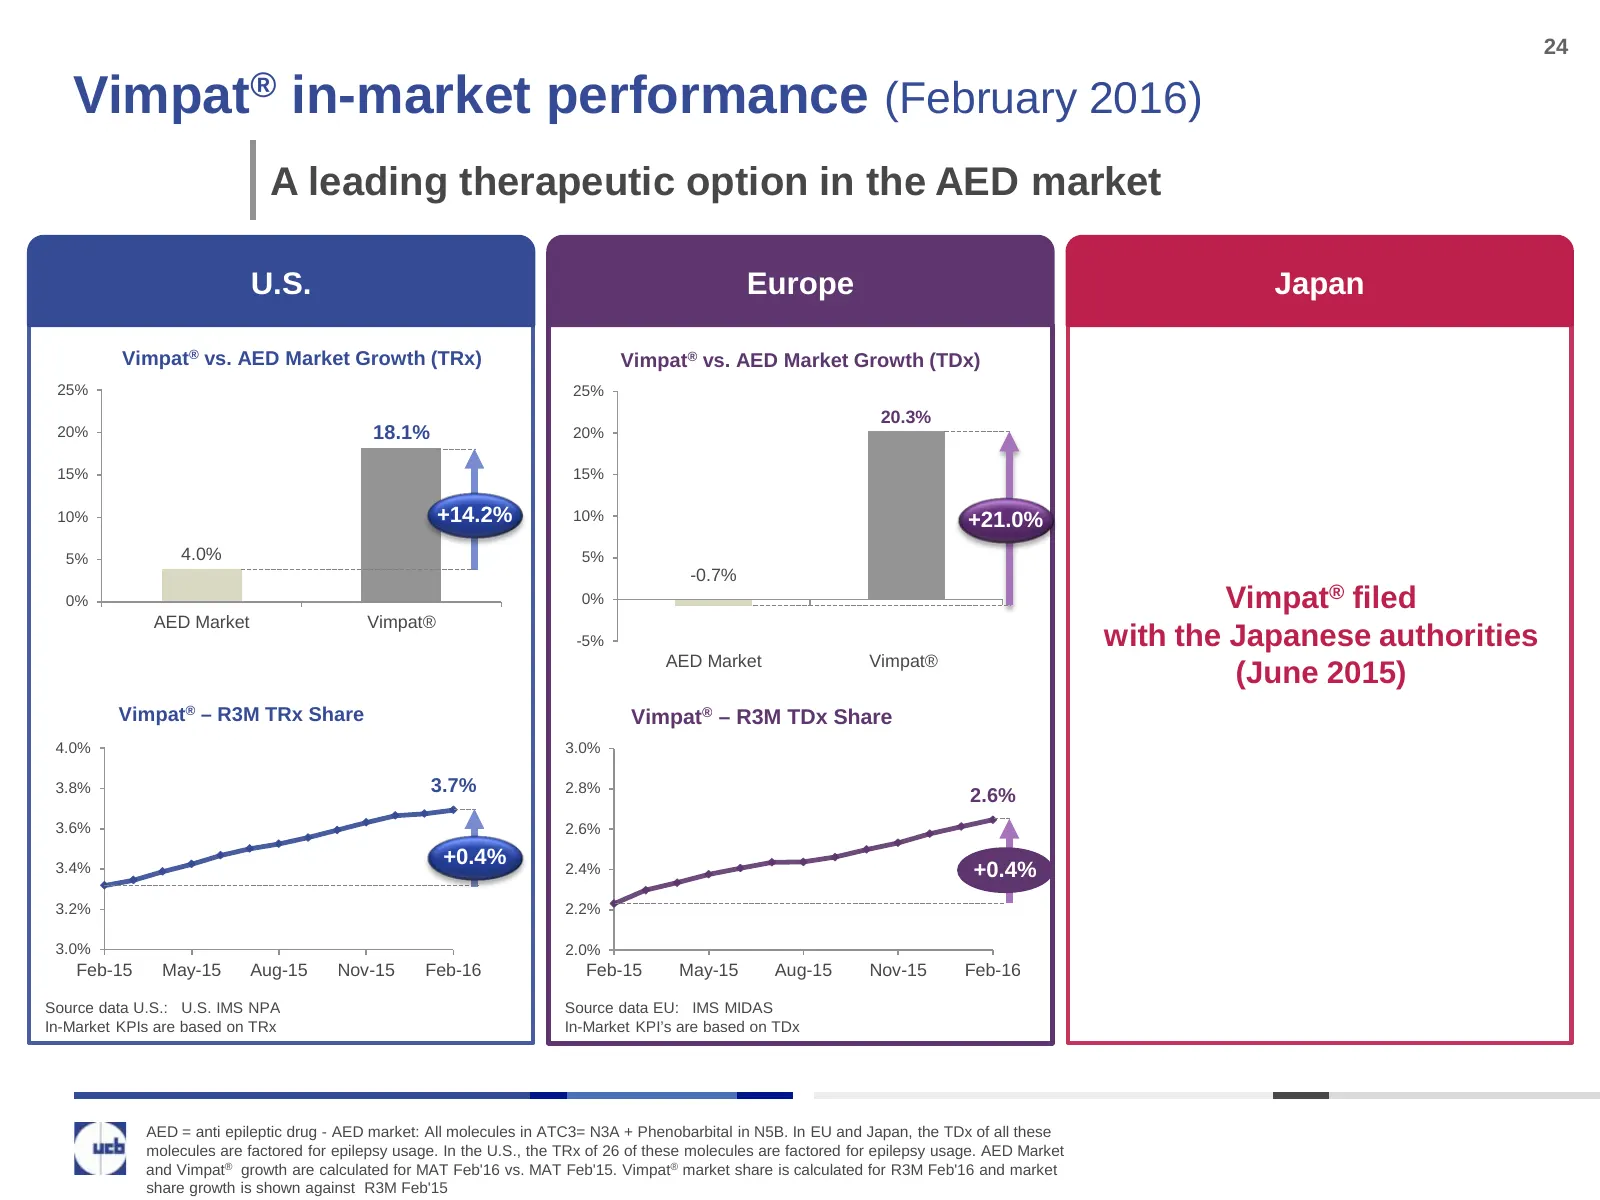
Slide 24: Vimpat in-market performance (February 2016)
24 Vimpat® in-market performance (February 2016) A leading therapeutic option in the AED market U.S. Europe Japan Vimpat® vs. AED Market Growth (TRx) Vimpat® vs. AED Market Growth (TDx) 25% 25% 20.3% 20% 18.1% 20% 15% 15% 10% +14.2% 10% +21.0% 5% 4.0% 5% -0.7% 0% 0% Vimpat® filed AED Market Vimpat®
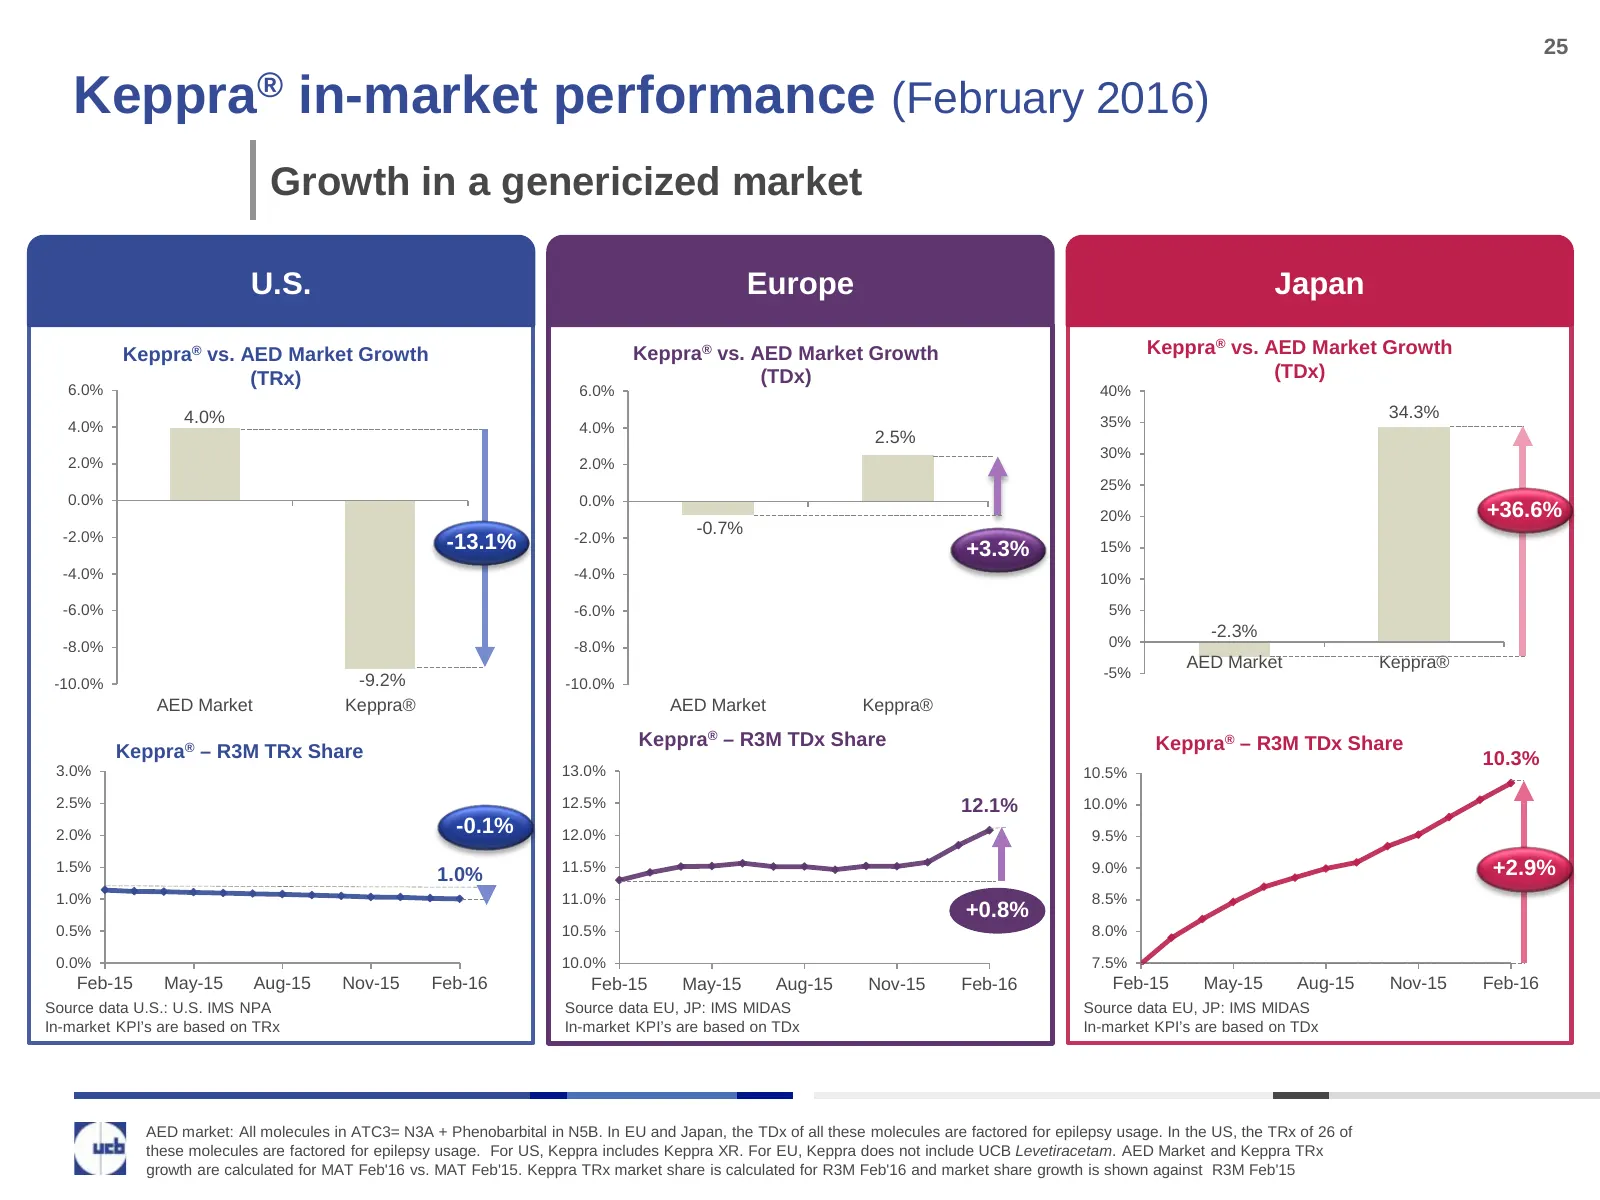
Slide 25: Keppra in-market performance (February 2016)
25 Keppra® in-market performance (February 2016) Growth in a genericized market U.S. Europe Japan Keppra® vs. AED Market Growth Keppra® vs. AED Market Growth Keppra® vs. AED Market Growth (TRx) (TDx) (TDx) 6.0% 6.0% 40% 4.0% 34.3% 4.0% 4.0% 35% 2.5% 30% 2.0% 2.0% 25% 0.0% 0.0% 20% +36.6% -2.0% -2.0%
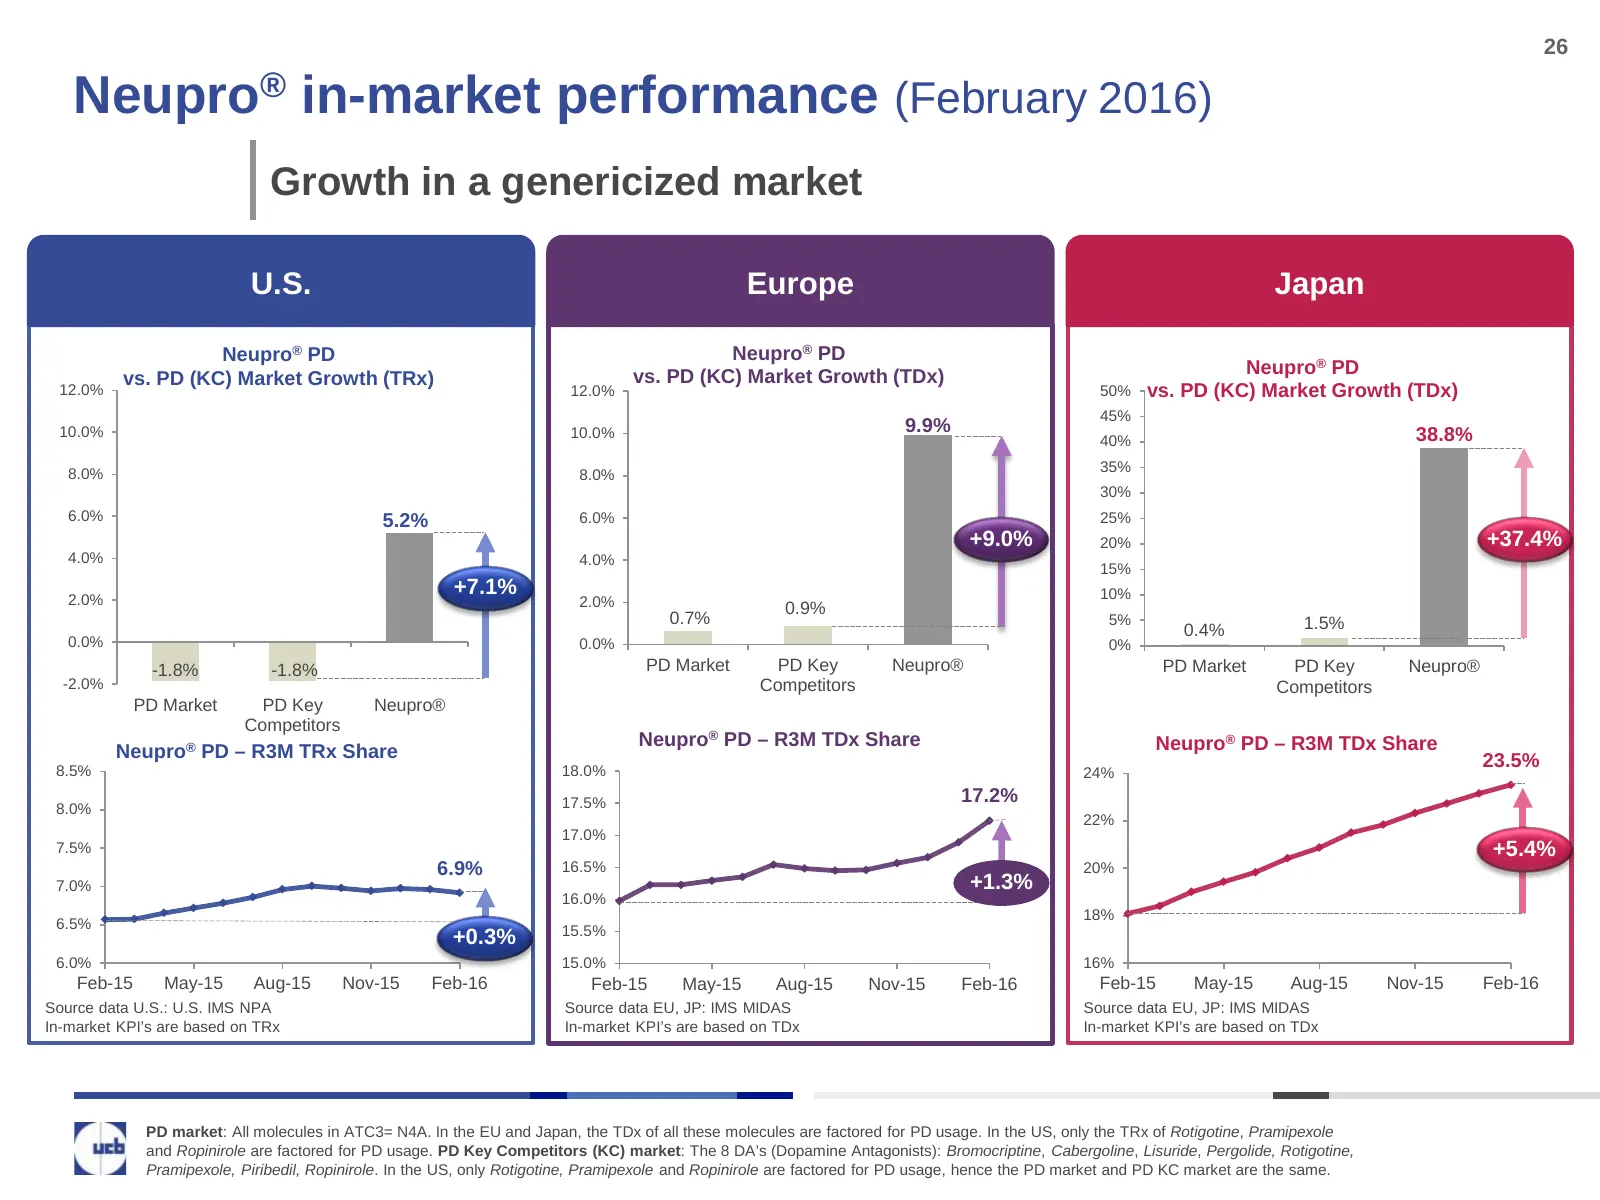
Slide 26: Neupro in-market performance (February 2016)
26 Neupro® in-market performance (February 2016) Growth in a genericized market U.S. Europe Japan Neupro® PD Neupro® PD vs. PD (KC) Market Growth (TDx) Neupro® PD vs. PD (KC) Market Growth (TRx) 12.0% 12.0% 50% vs. PD (KC) Market Growth (TDx) 45% 10.0% 10.0% 9.9% 38.8% 40% 8.0% 35% 8.0% 30% 6.0% 5.2
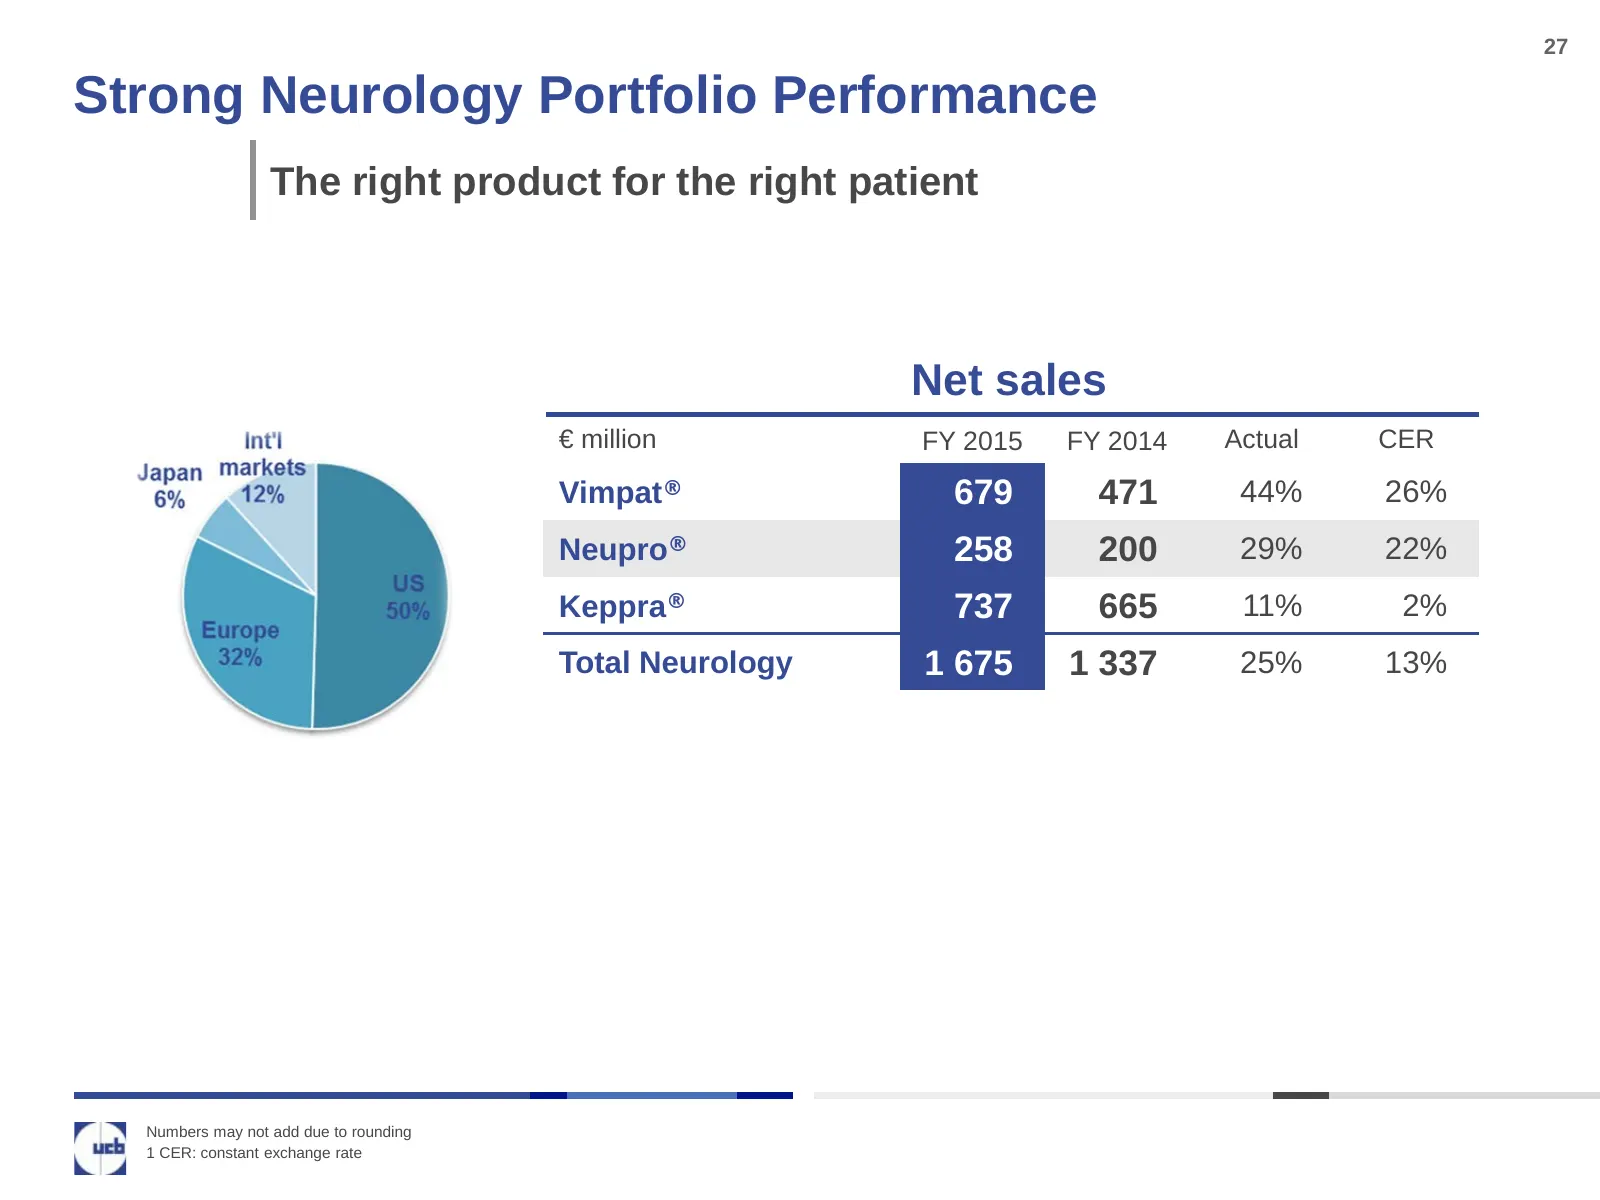
Slide 27: Strong Neurology Portfolio Performance
27 Strong Neurology Portfolio Performance The right product for the right patient Net sales € million FY 2015 FY 2014 Actual CER Vimpat® 679 471 44% 26% Neupro® 258 200 29% 22% Keppra® 737 665 11% 2% Total Neurology 1 675 1 337 25% 13% Numbers may not add due to rounding 1 CER: constant exchange rat
Slide 28: Expanding our portfolio, creating sustainable patient value
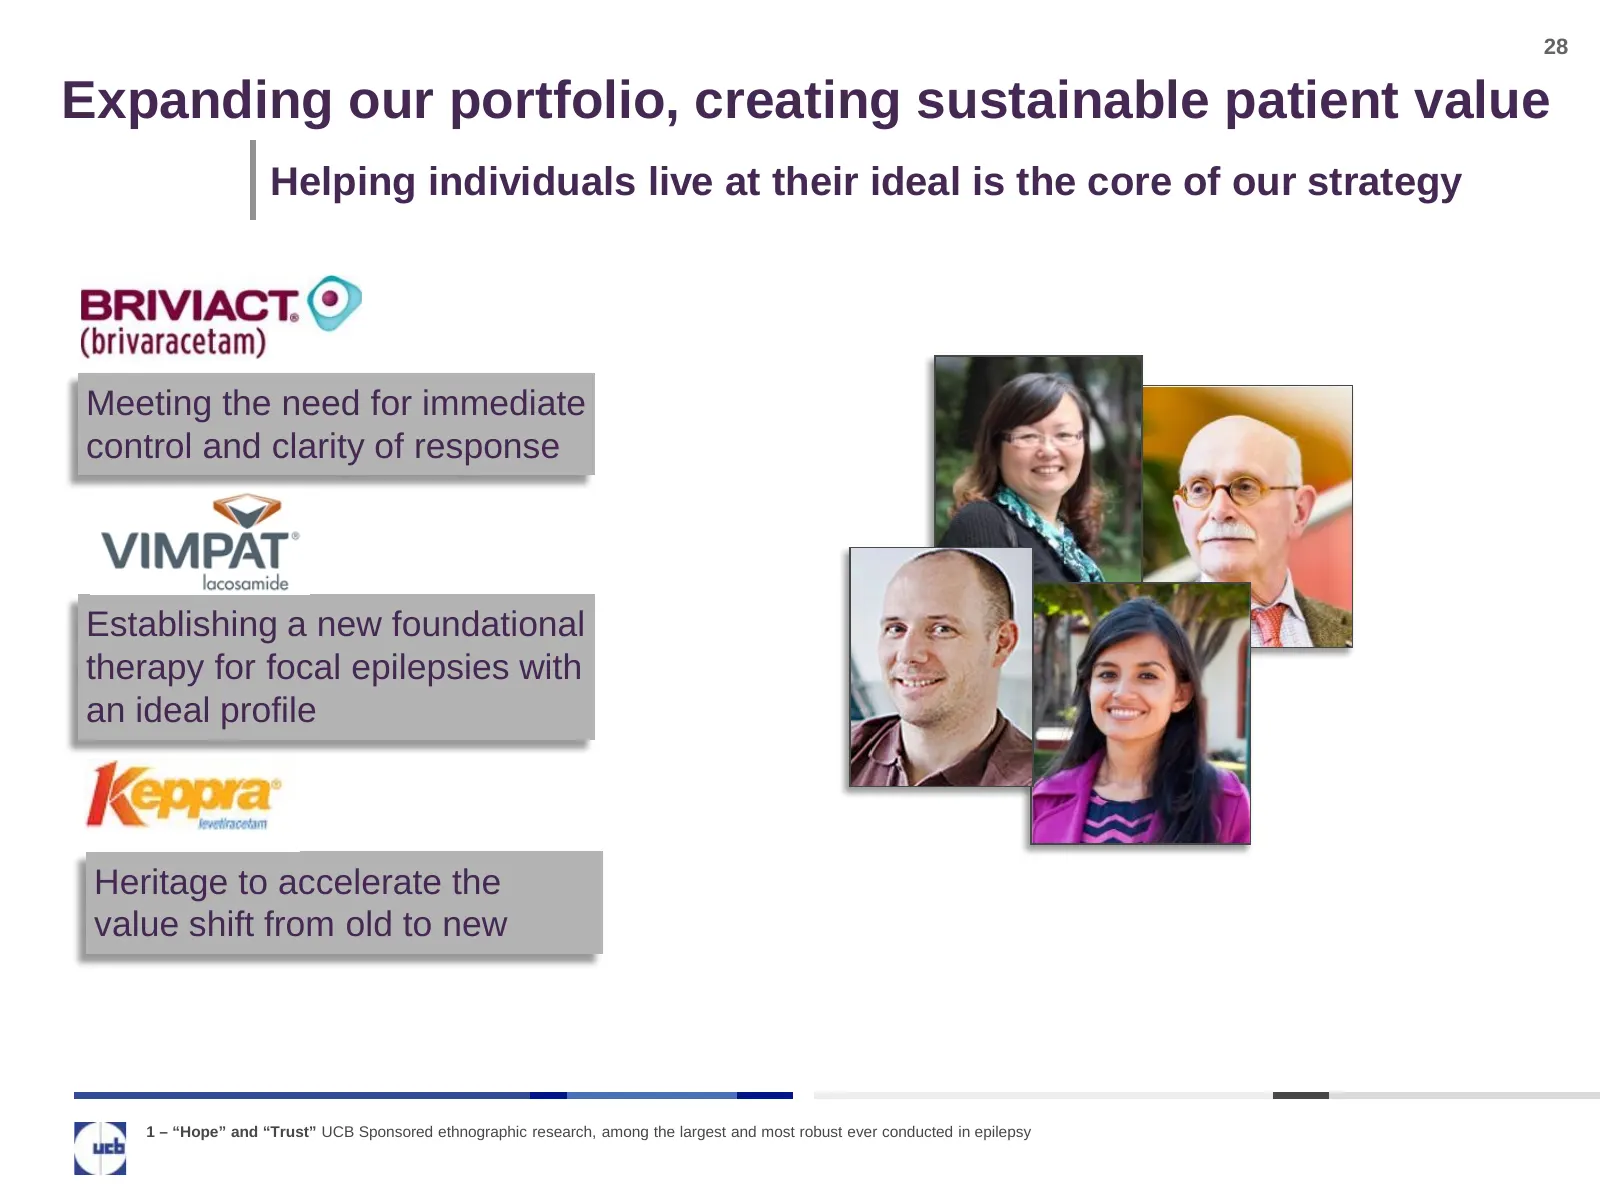
28 Expanding our portfolio, creating sustainable patient value Helping individuals live at their ideal is the core of our strategy Meeting the need for immediate control and clarity of response Establishing a new foundational therapy for focal epilepsies with an ideal profile Heritage to accelerate
Slide 29: Introducing BRIVIACT in epilepsy POS
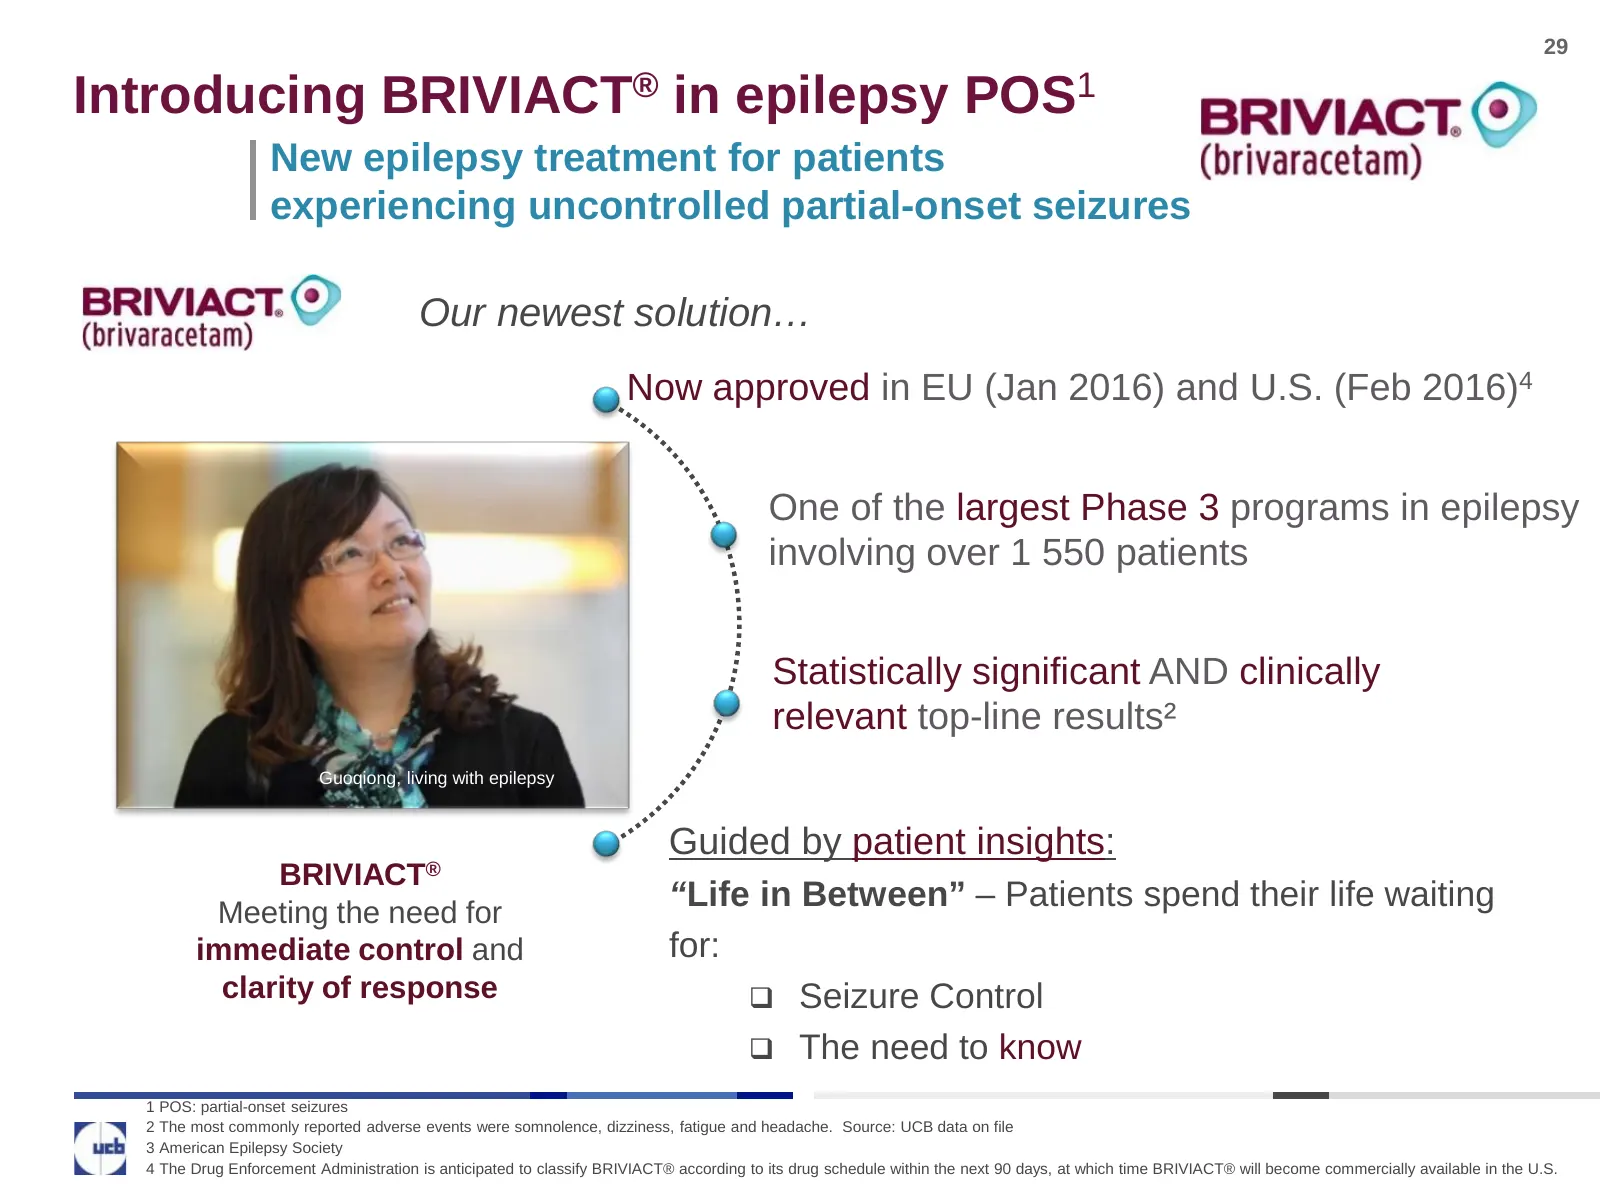
29 Introducing BRIVIACT® in epilepsy POS1 New epilepsy treatment for patients experiencing uncontrolled partial-onset seizures Our newest solution… Now approved in EU (Jan 2016) and U.S. (Feb 2016)4 One of the largest Phase 3 programs in epilepsy involving over 1 550 patients Statistically significa
Slide 30: Romosozumab development
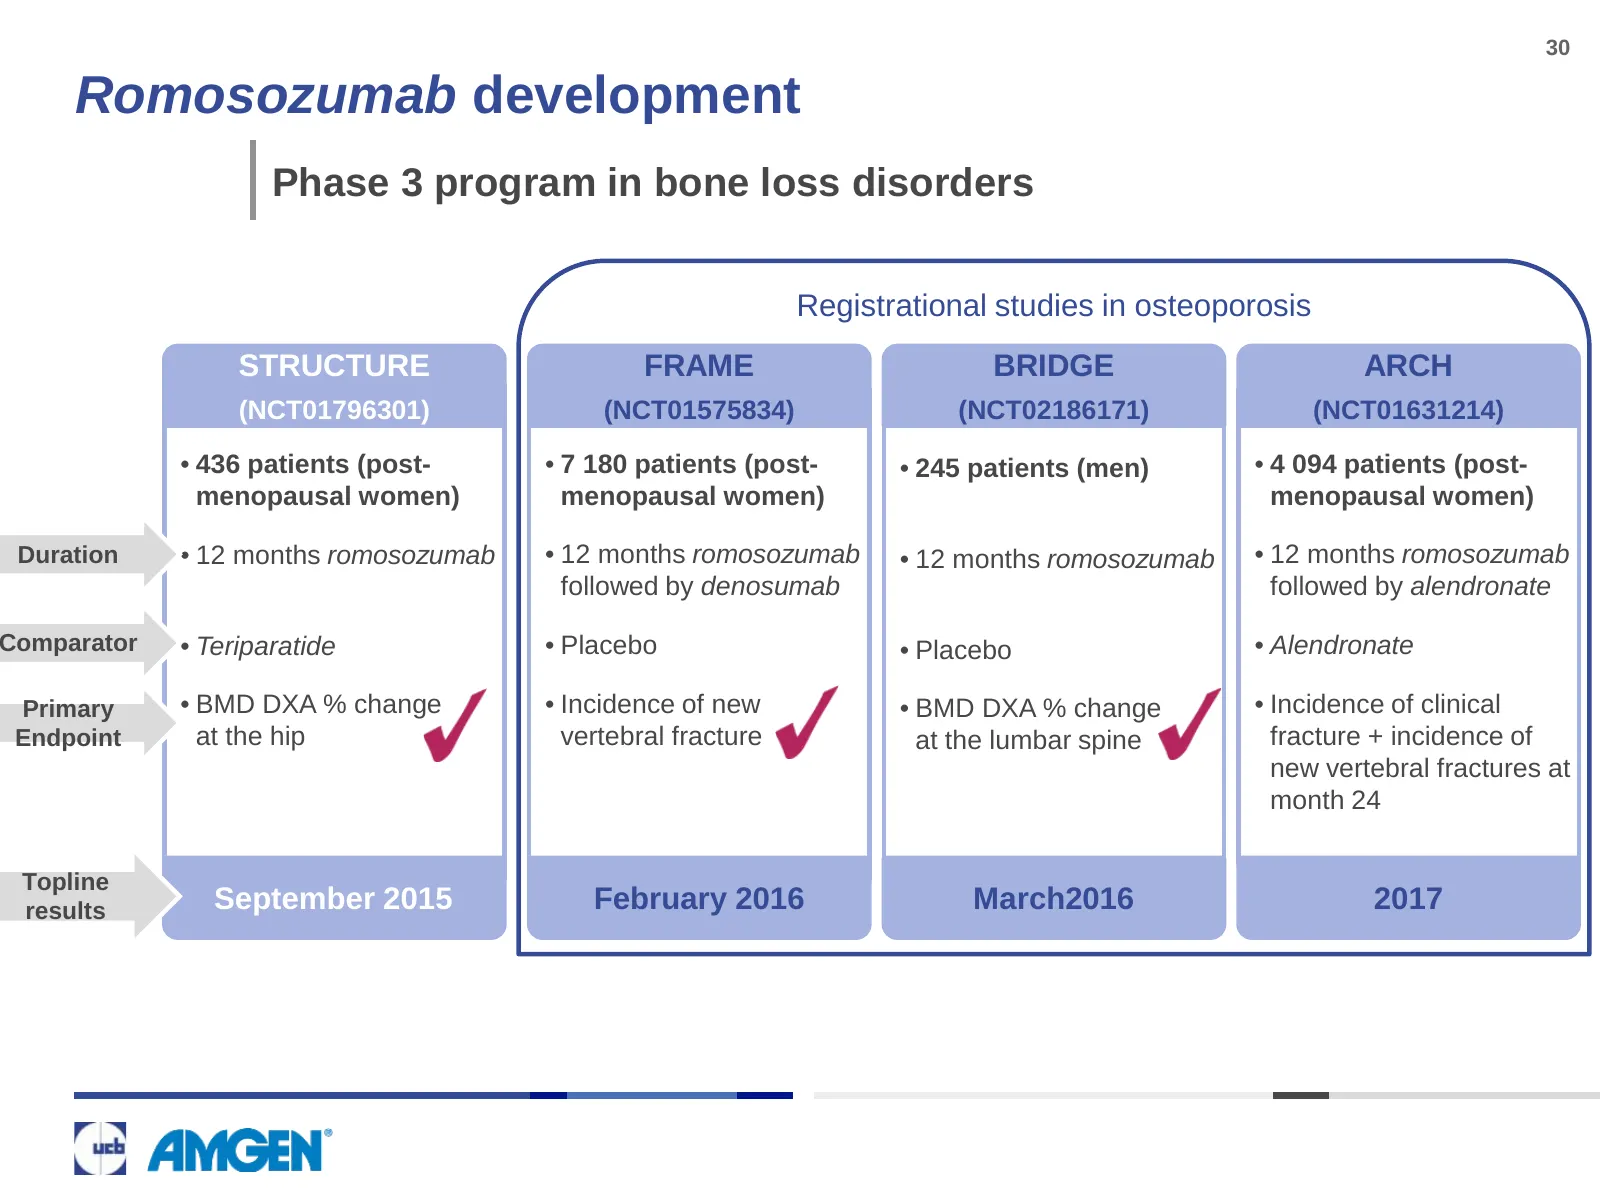
30 Romosozumab development Phase 3 program in bone loss disorders Registrational studies in osteoporosis STRUCTURE FRAME BRIDGE ARCH (NCT01796301) (NCT01575834) (NCT02186171) (NCT01631214) • 436 patients (post- • 7 180 patients (post- • 245 patients (men) • 4 094 patients (post- menopausal women) me
Slide 31: UCB FY 2015 financial highlights
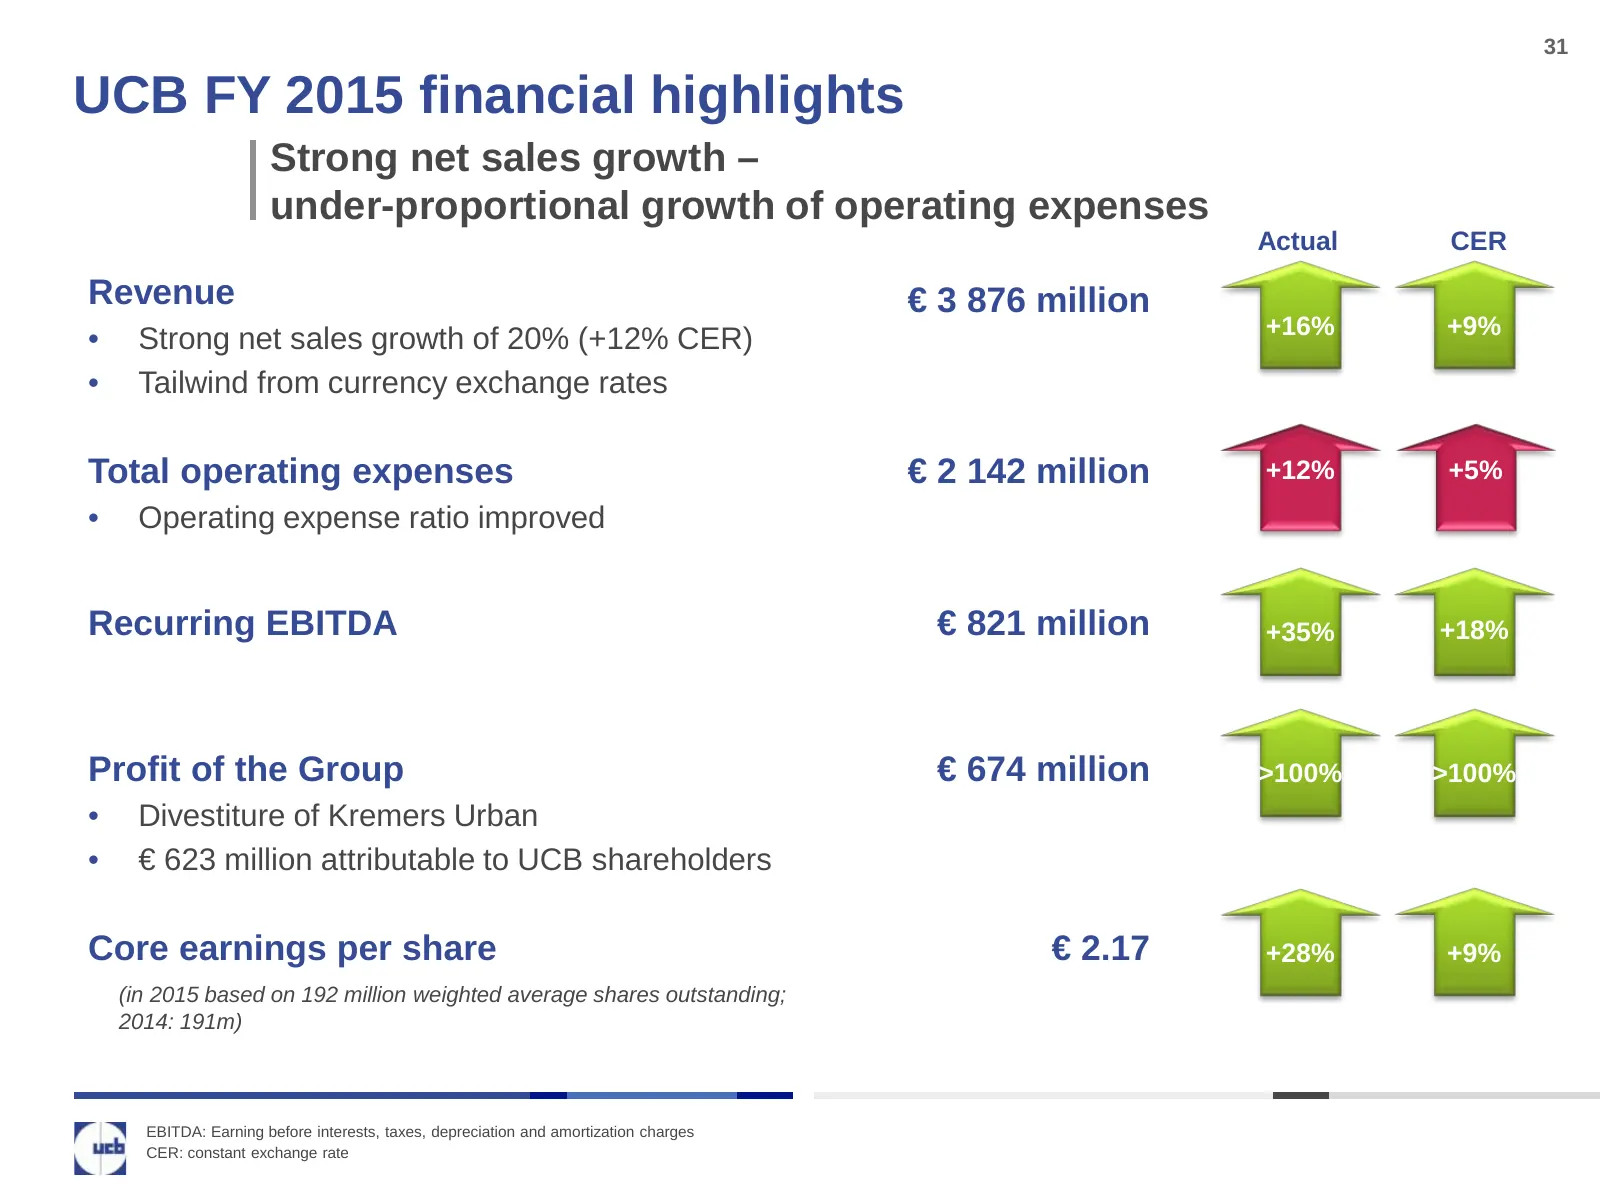
31 UCB FY 2015 financial highlights Strong net sales growth – under-proportional growth of operating expenses Actual CER Revenue € 3 876 million +16% +9% • Strong net sales growth of 20% (+12% CER) • Tailwind from currency exchange rates Total operating expenses € 2 142 million +12% +5% • Operating
Slide 32: Top and bottom line growth – improved ratios
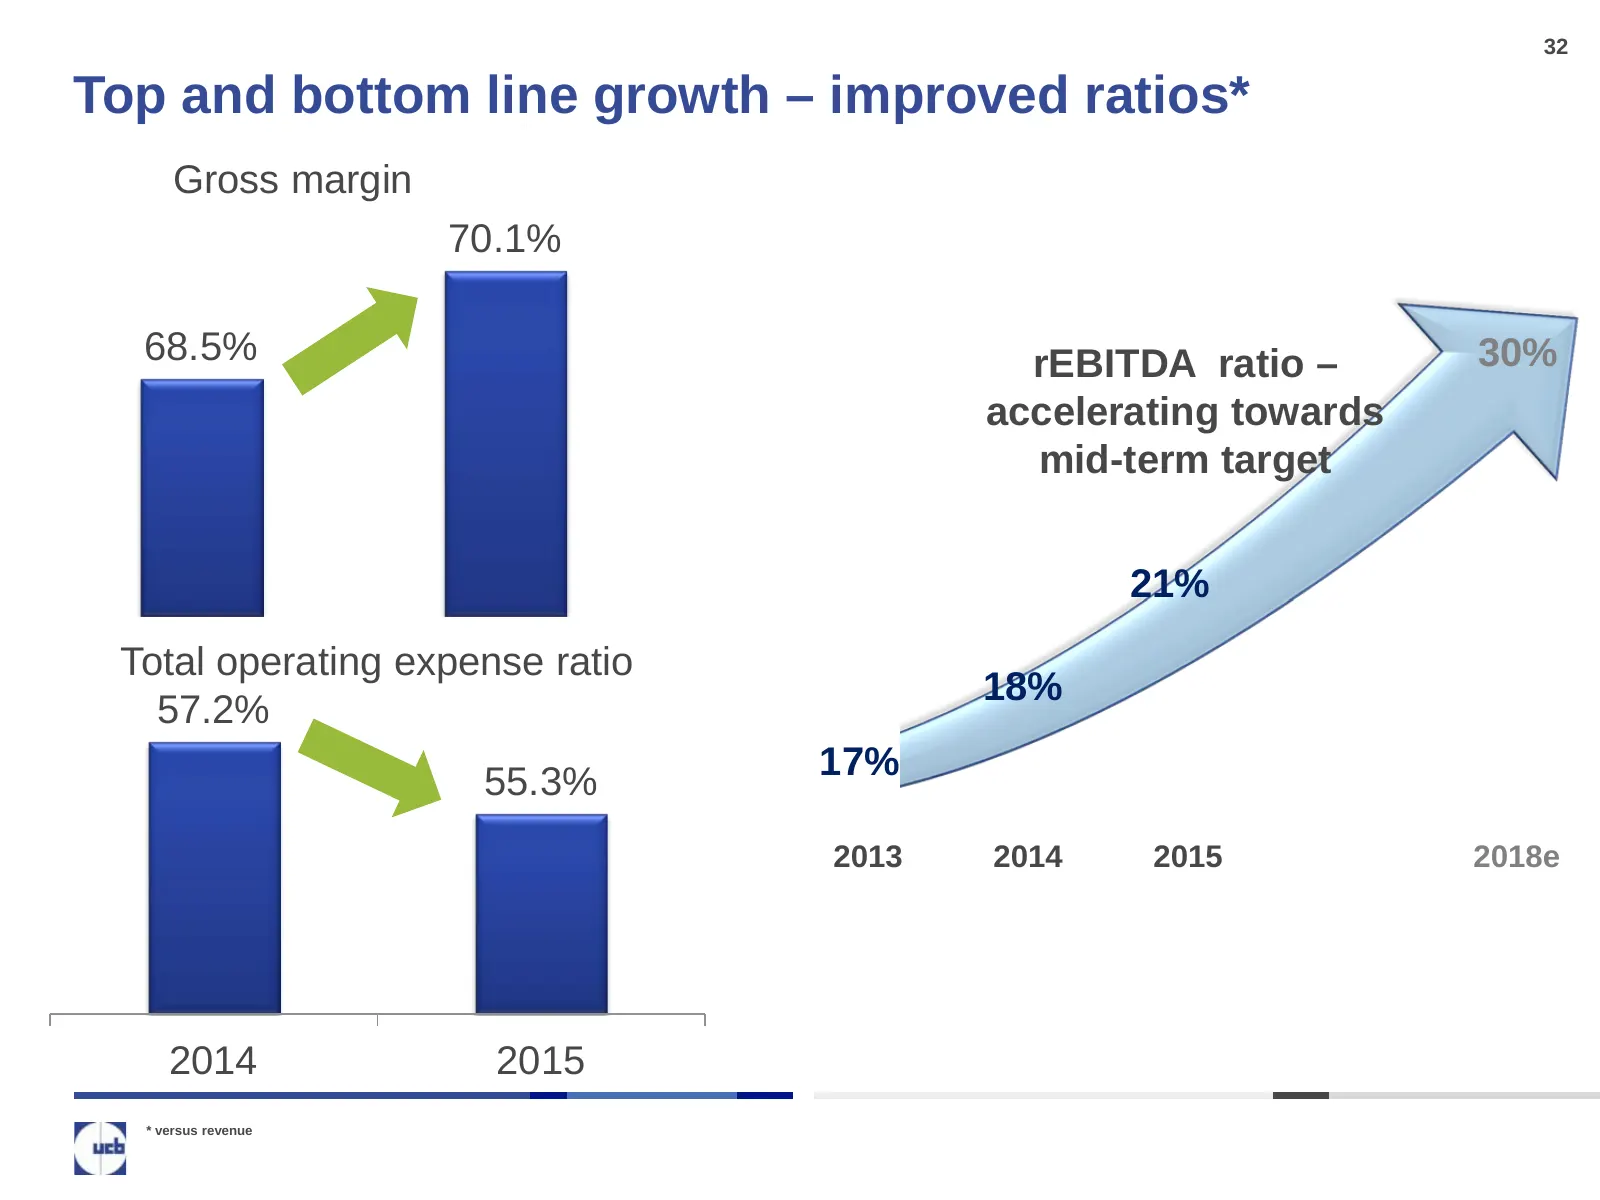
32 Top and bottom line growth – improved ratios* Gross margin 70.1% 68.5% rEBITDA ratio – 30% accelerating towards mid-term target 21% Total operating expense ratio 18% 57.2% 17% 55.3% 2013 2014 2015 2018e 2014 2015 * versus revenue
Slide 33: Topline and bottom line growth
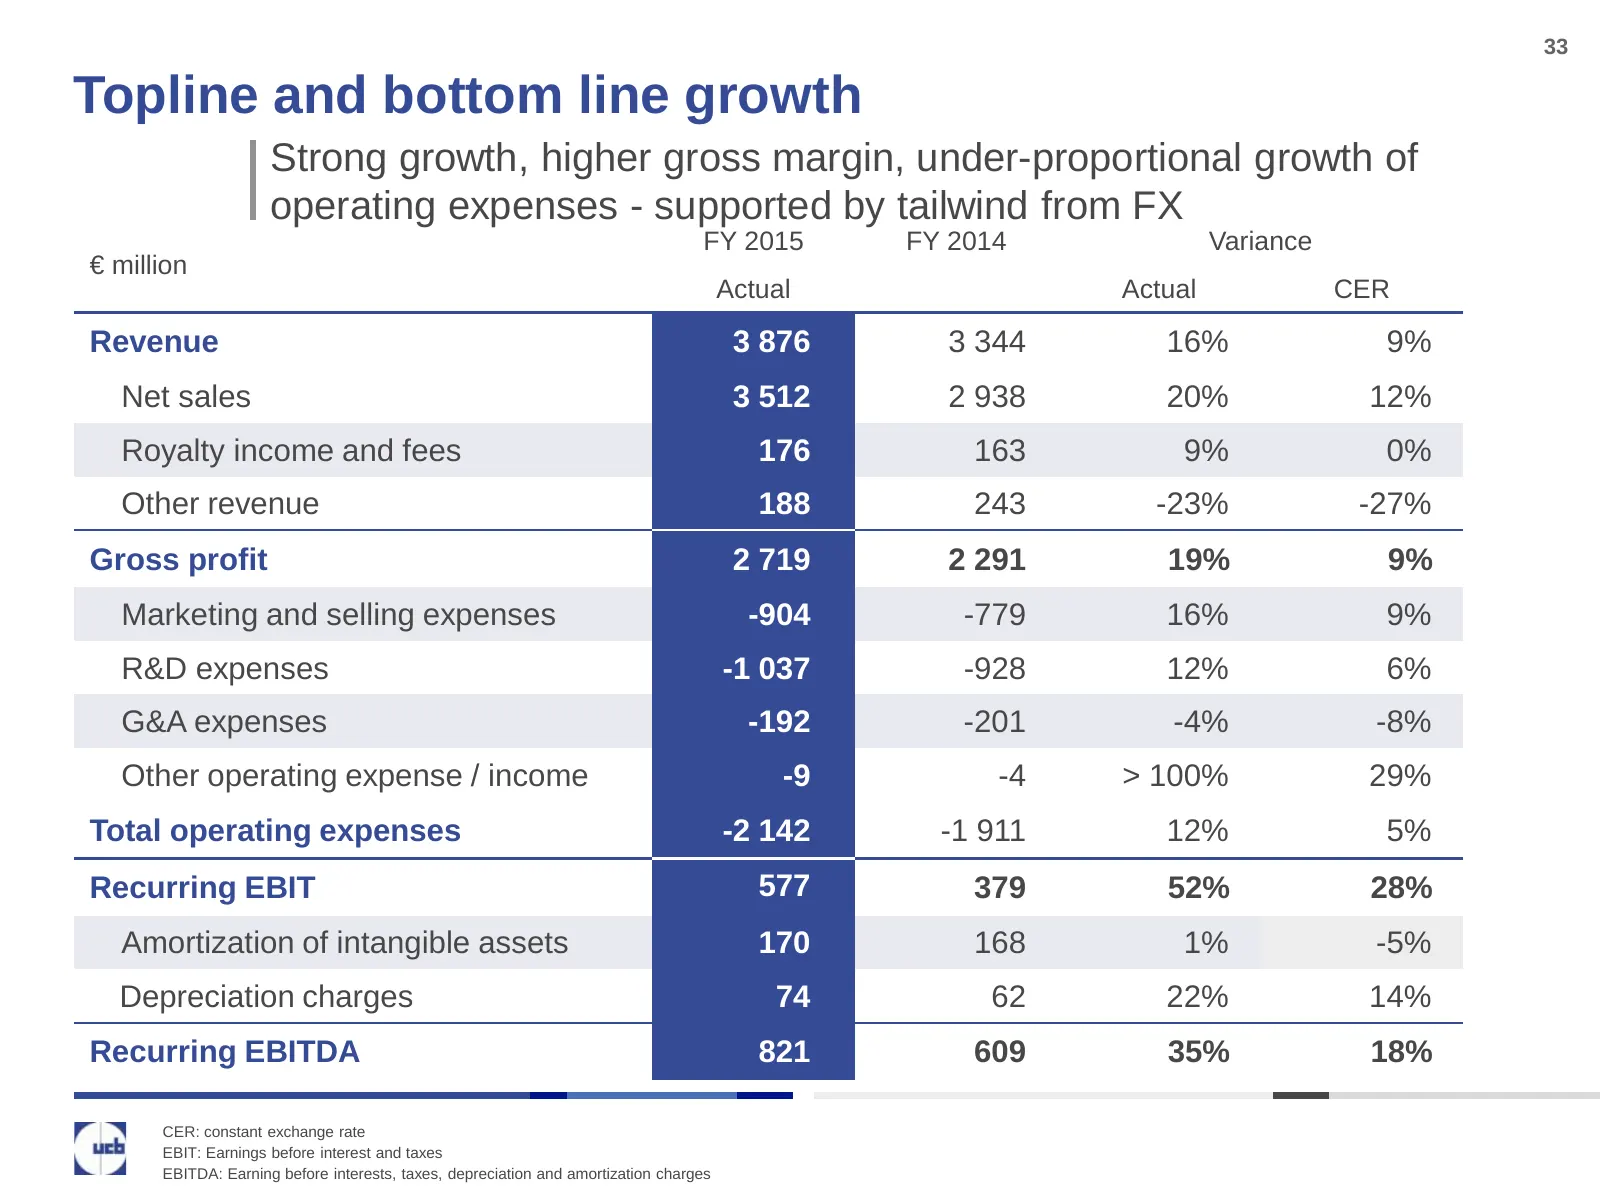
33 Topline and bottom line growth Strong growth, higher gross margin, under-proportional growth of operating expenses - supported by tailwind from FX FY 2015 FY 2014 Variance € million Actual Actual CER Revenue 3 876 3 344 16% 9% Net sales 3 512 2 938 20% 12% Royalty income and fees 176 163 9% 0% Ot
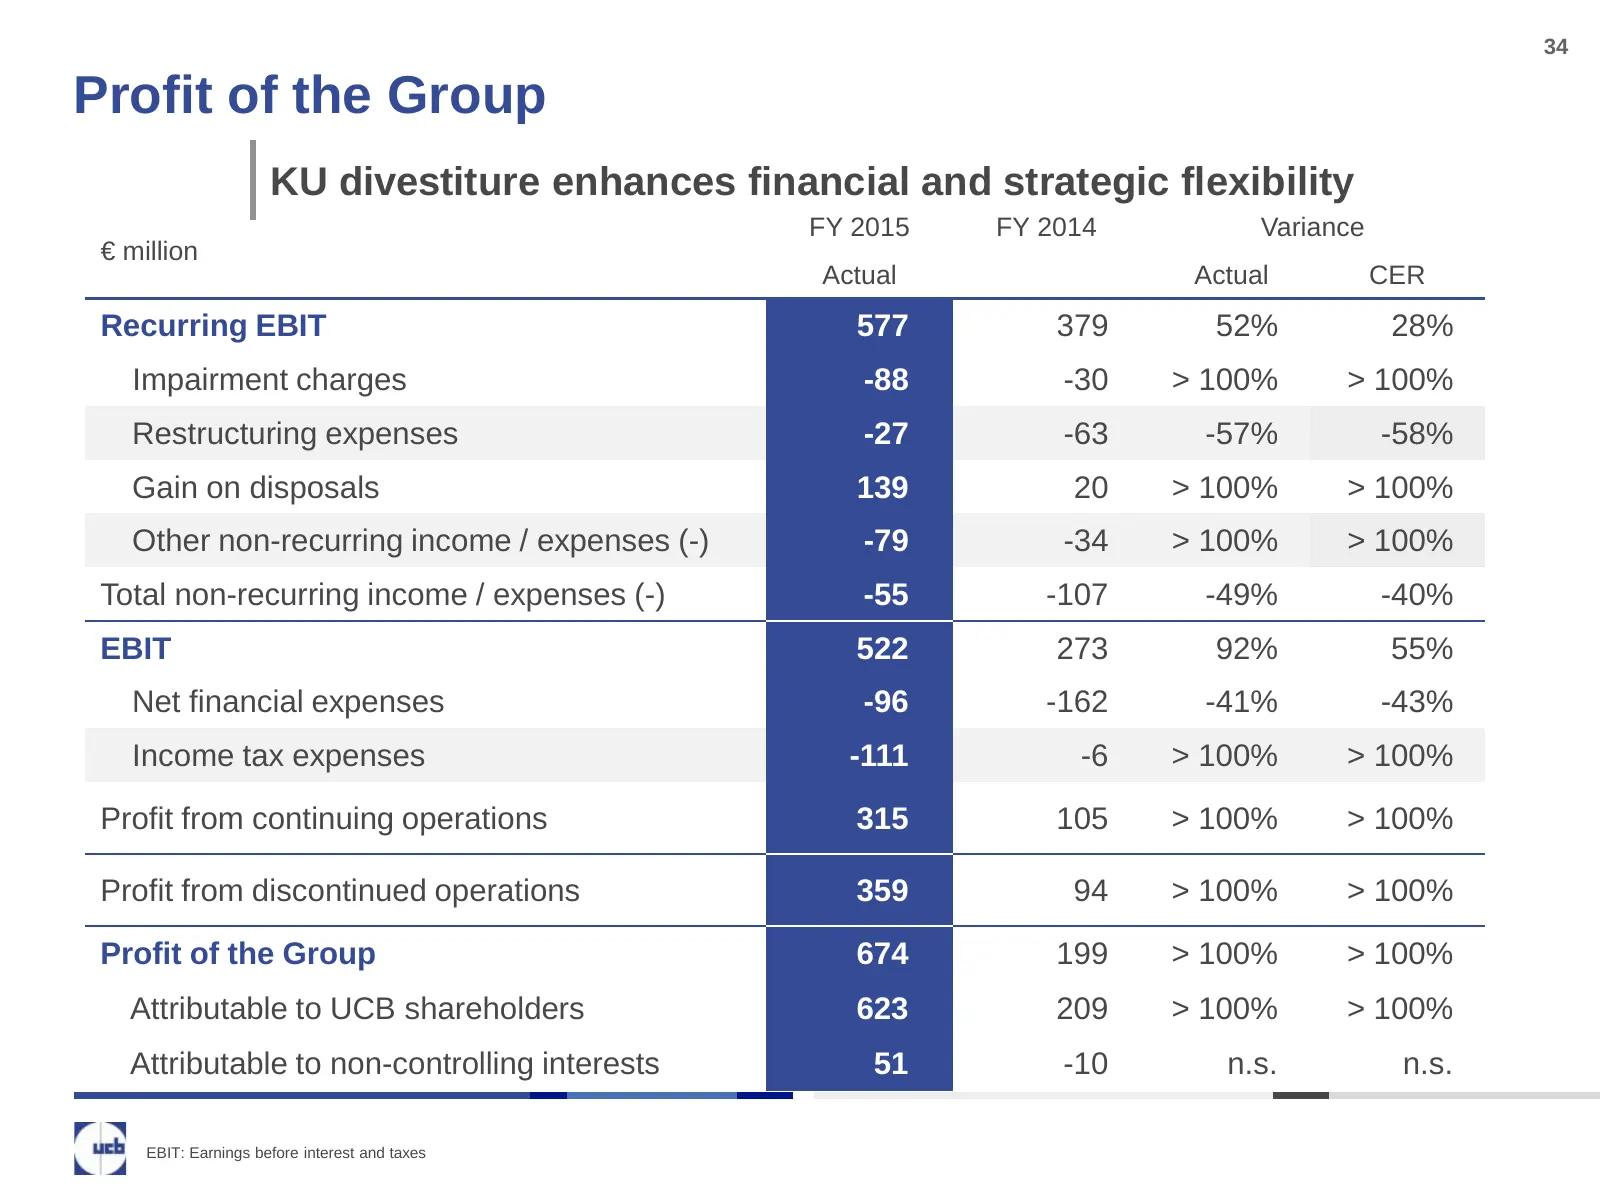
Slide 34: Profit of the Group
34 Profit of the Group KU divestiture enhances financial and strategic flexibility FY 2015 FY 2014 Variance € million Actual Actual CER Recurring EBIT 577 379 52% 28% Impairment charges -88 -30 > 100% > 100% Restructuring expenses -27 -63 -57% -58% Gain on disposals 139 20 > 100% > 100% Other non-re
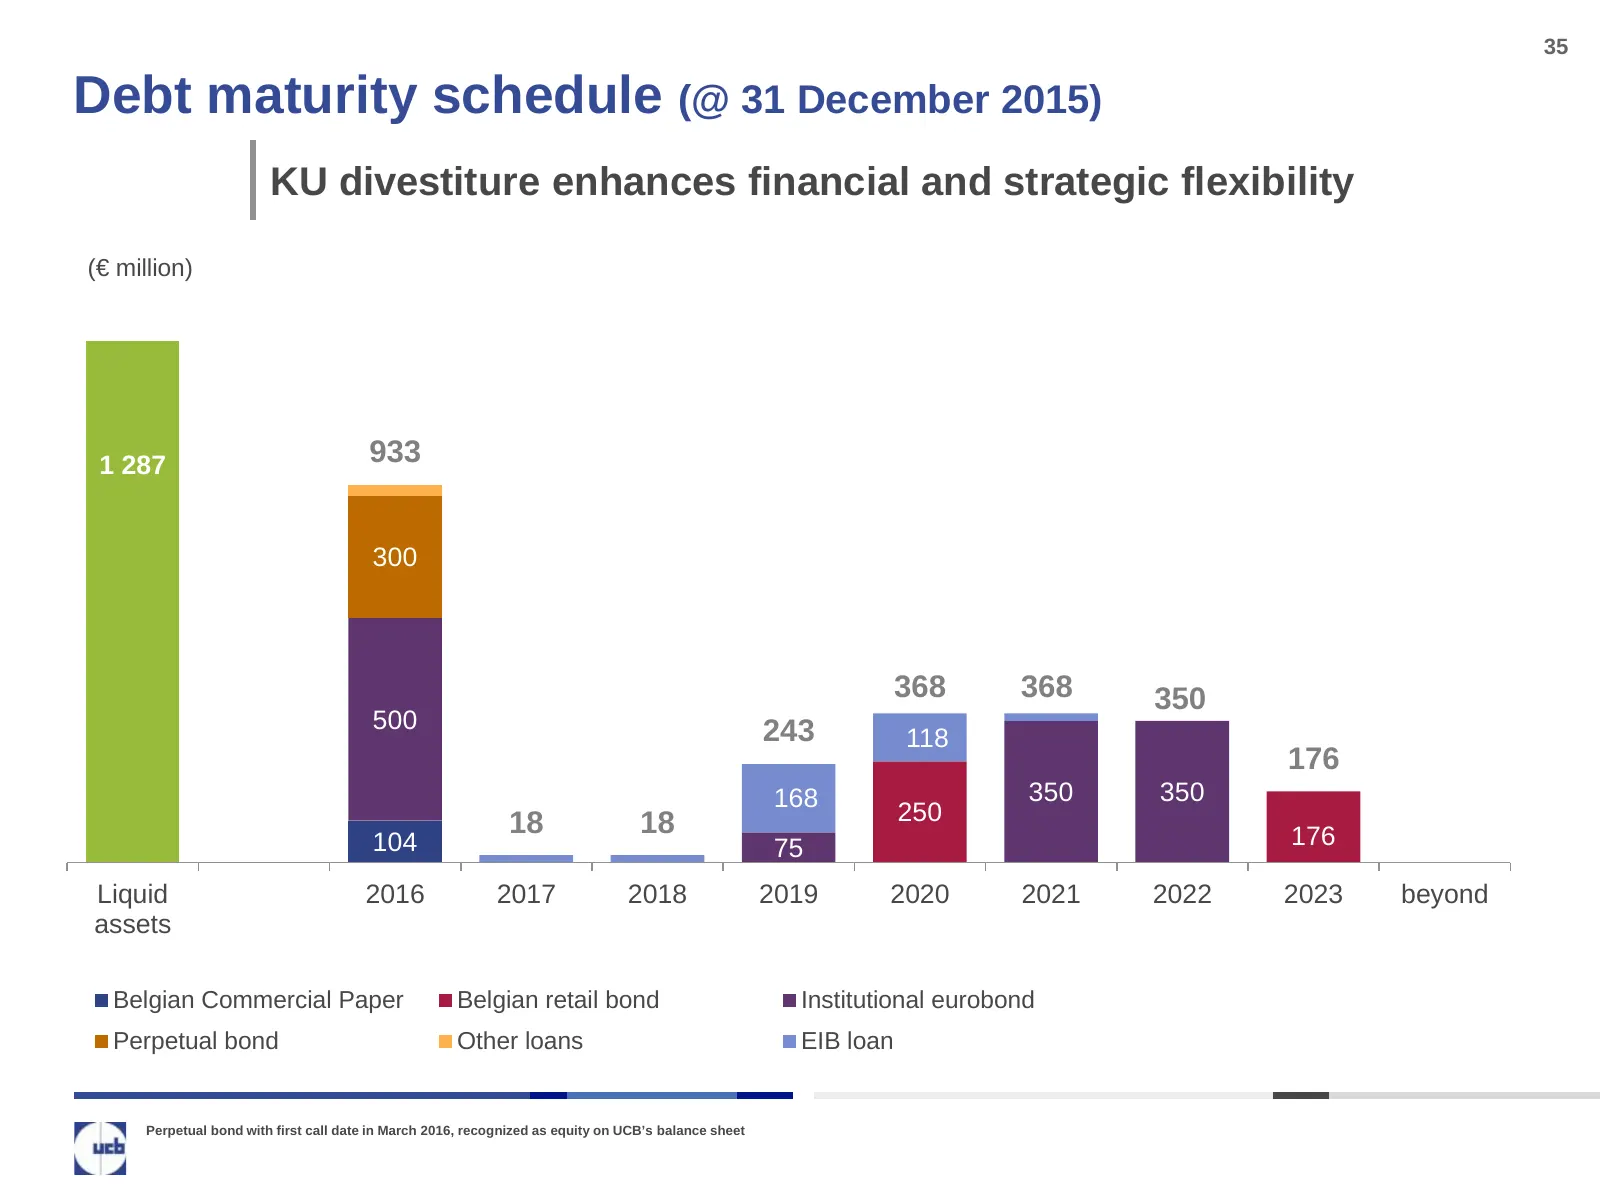
Slide 35: Debt maturity schedule (@ 31 December 2015)
35 Debt maturity schedule (@ 31 December 2015) KU divestiture enhances financial and strategic flexibility (€ million) 1 287 933 300 368 368 350 500 243 118 176 168 350 350 18 18 250 104 75 176 Liquid 2016 2017 2018 2019 2020 2021 2022 2023 beyond assets Belgian Commercial Paper Belgian retail bond
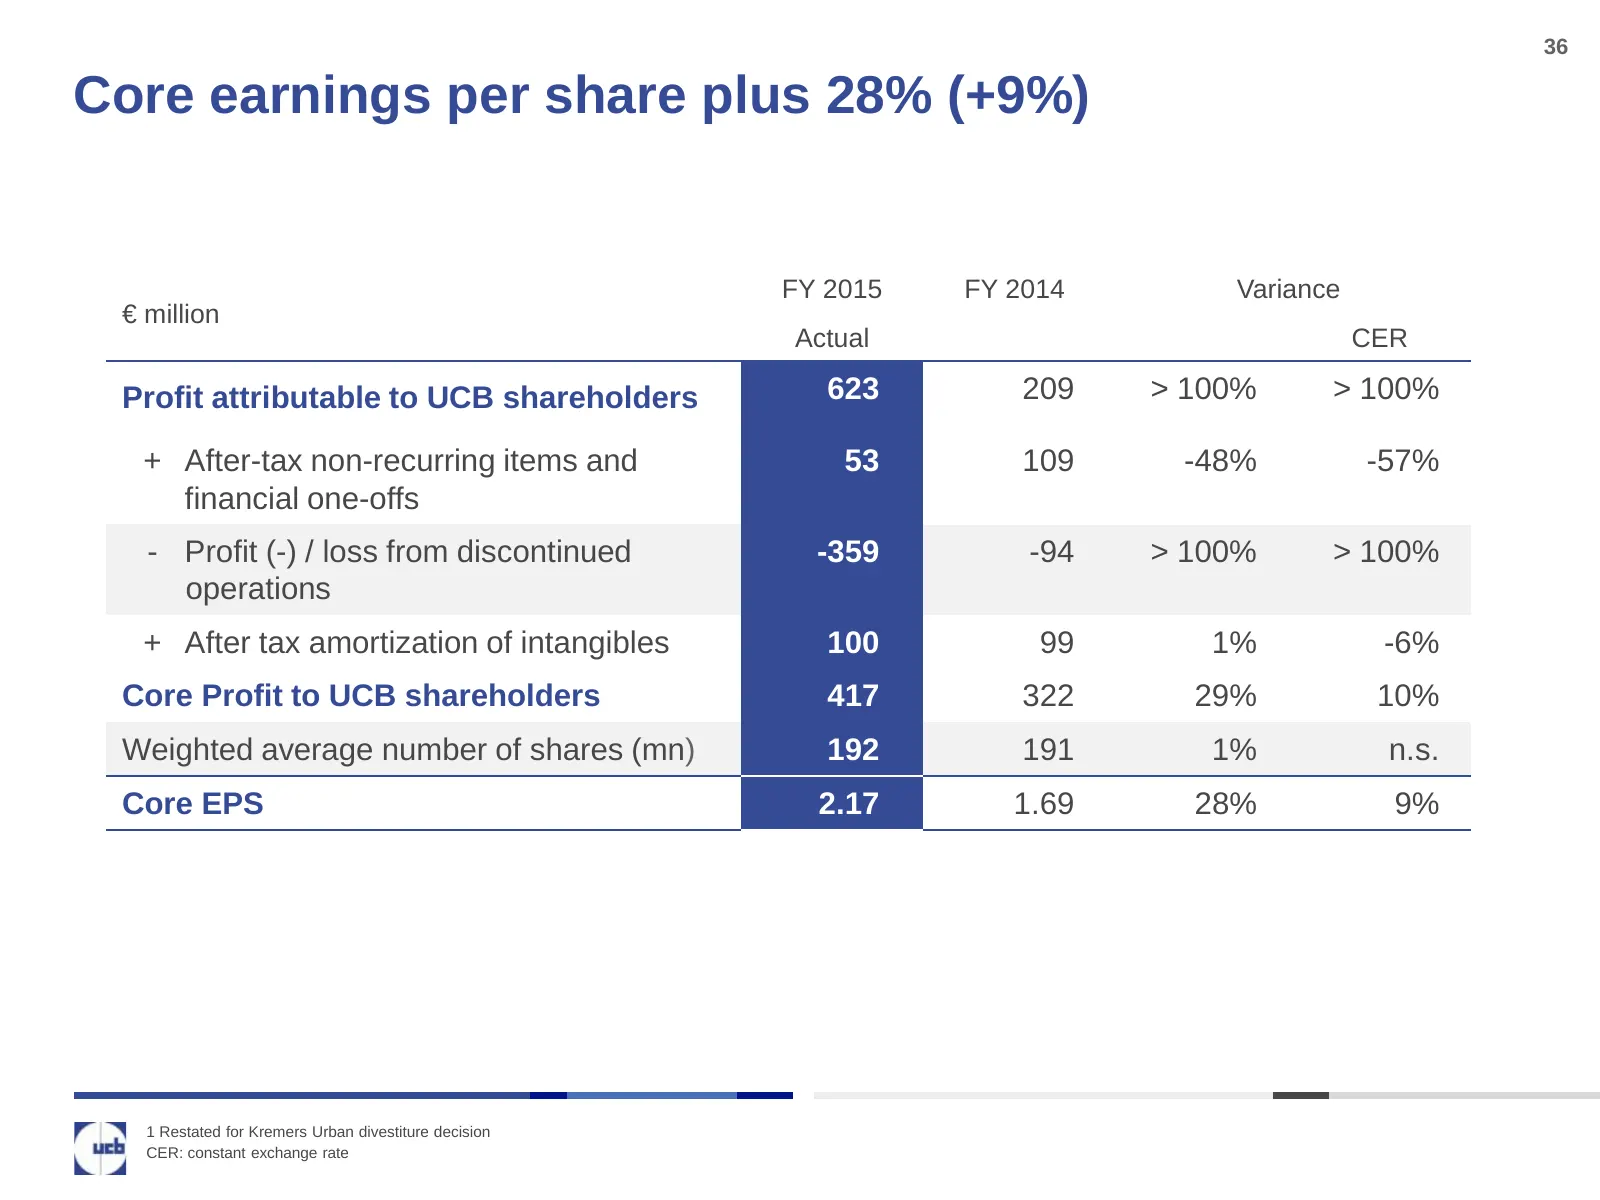
Slide 36: Core earnings per share plus 28% (+9%)
36 Core earnings per share plus 28% (+9%) FY 2015 FY 2014 Variance € million Actual CER Profit attributable to UCB shareholders 623 209 > 100% > 100% + After-tax non-recurring items and 53 109 -48% -57% financial one-offs - Profit (-) / loss from discontinued -359 -94 > 100% > 100% operations + Afte
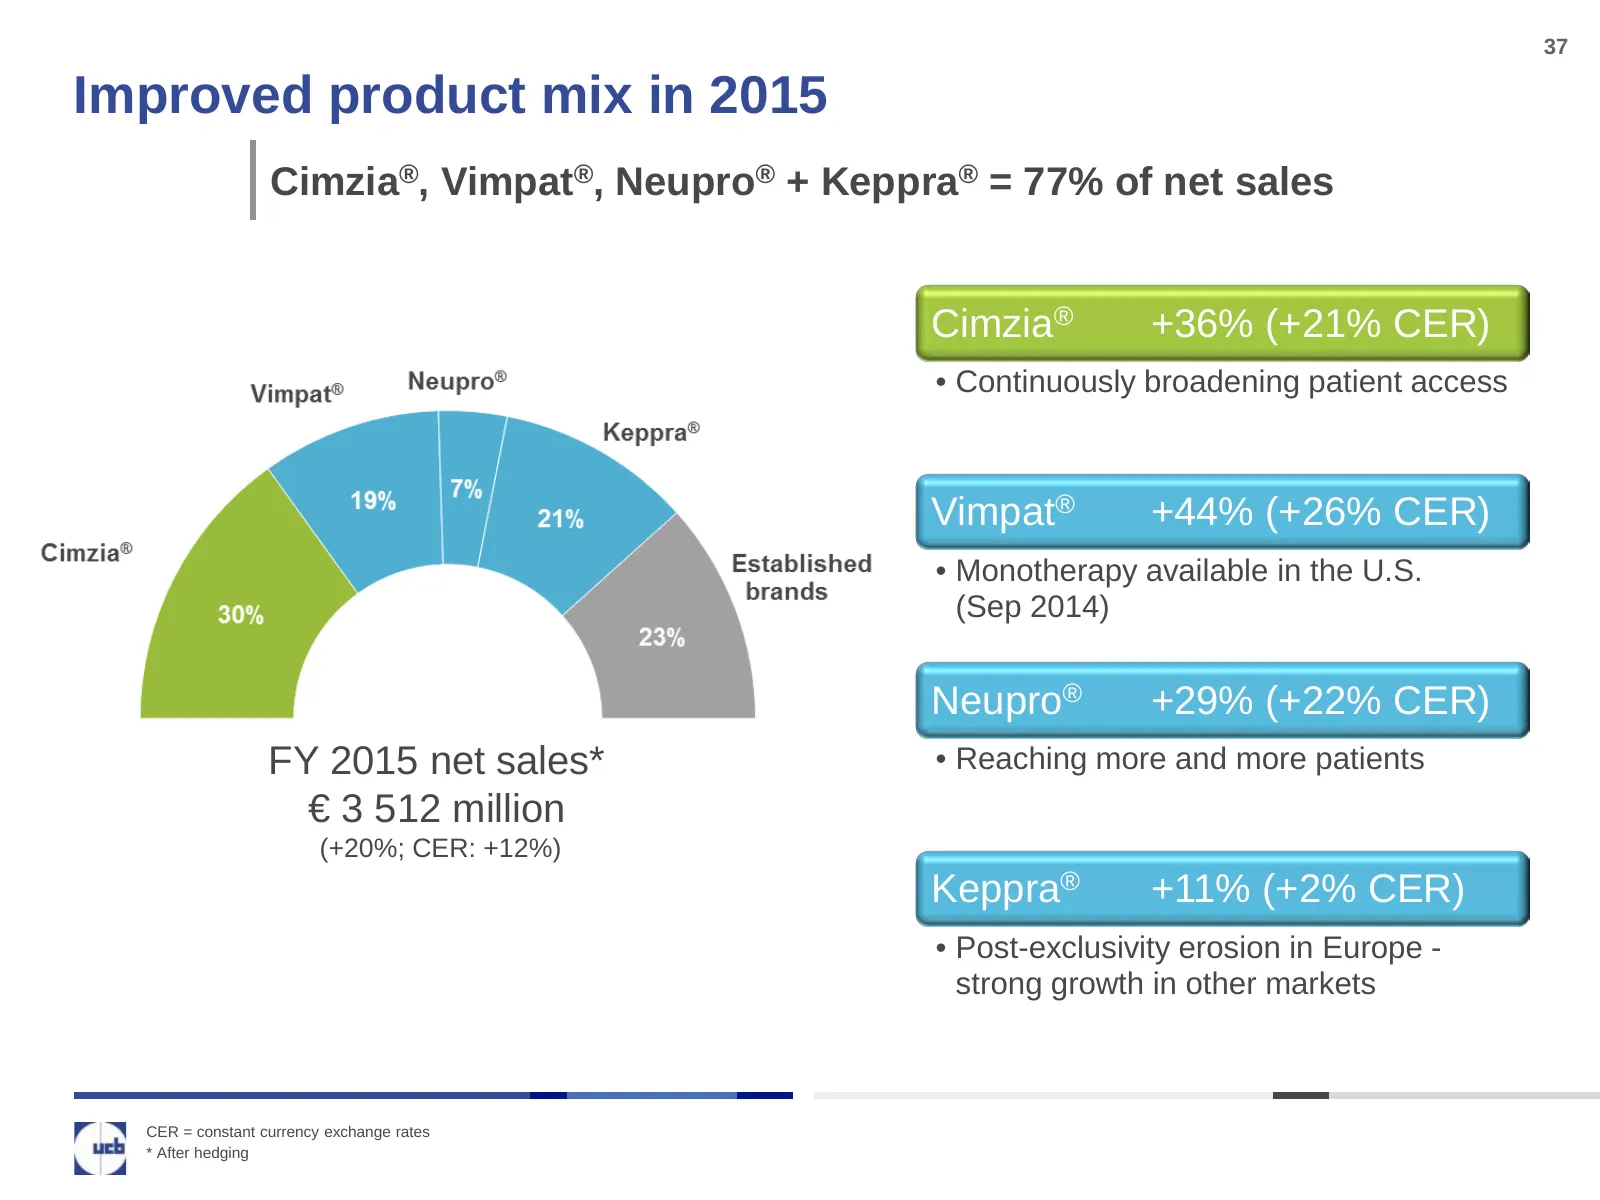
Slide 37: Improved product mix in 2015
37 Improved product mix in 2015 Cimzia®, Vimpat®, Neupro® + Keppra® = 77% of net sales Cimzia® +36% (+21% CER) • Continuously broadening patient access Vimpat® +44% (+26% CER) • Monotherapy available in the U.S. (Sep 2014) Neupro® +29% (+22% CER) FY 2015 net sales* • Reaching more and more patients
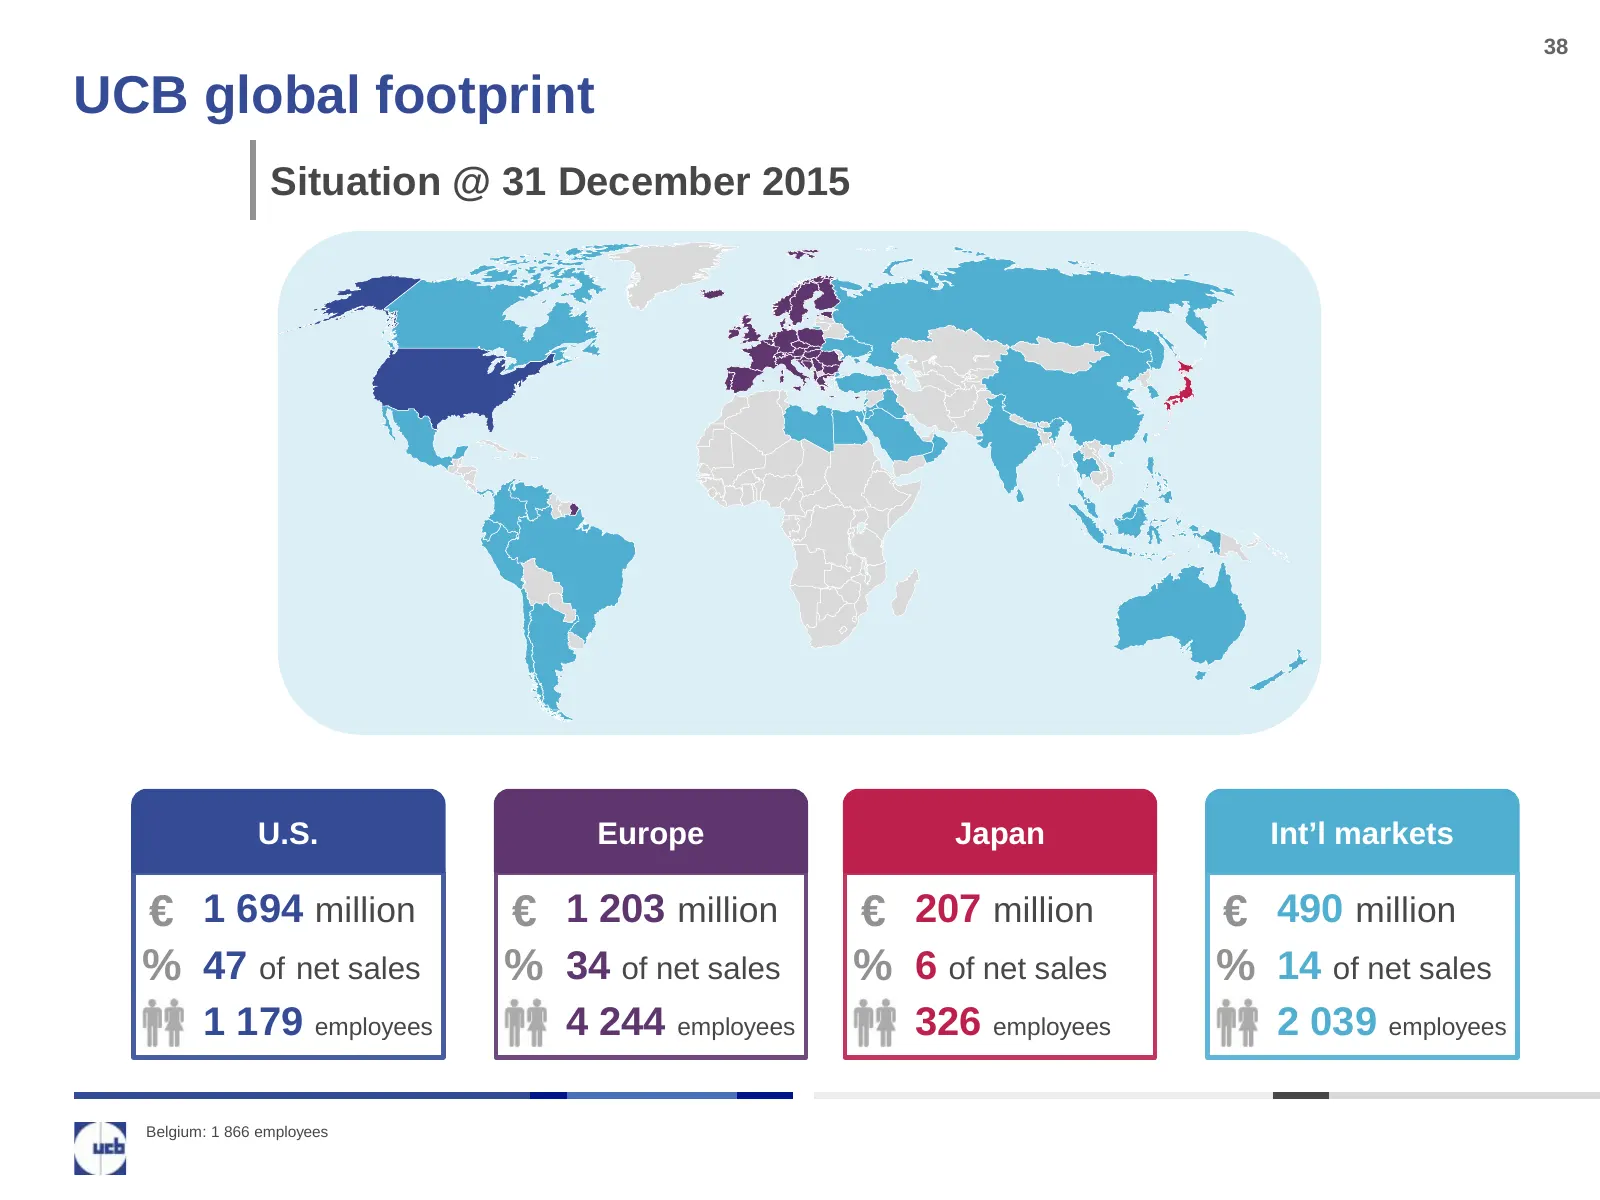
Slide 38: UCB global footprint
38 UCB global footprint Situation @ 31 December 2015 U.S. Europe Japan Int’l markets € 1 694 million € 1 203 million € 207 million € 490 million % 47 of net sales % 34 of net sales % 6 of net sales % 14 of net sales 1 179 employees 4 244 employees 326 employees 2 039 employees Belgium: 1 866 employe
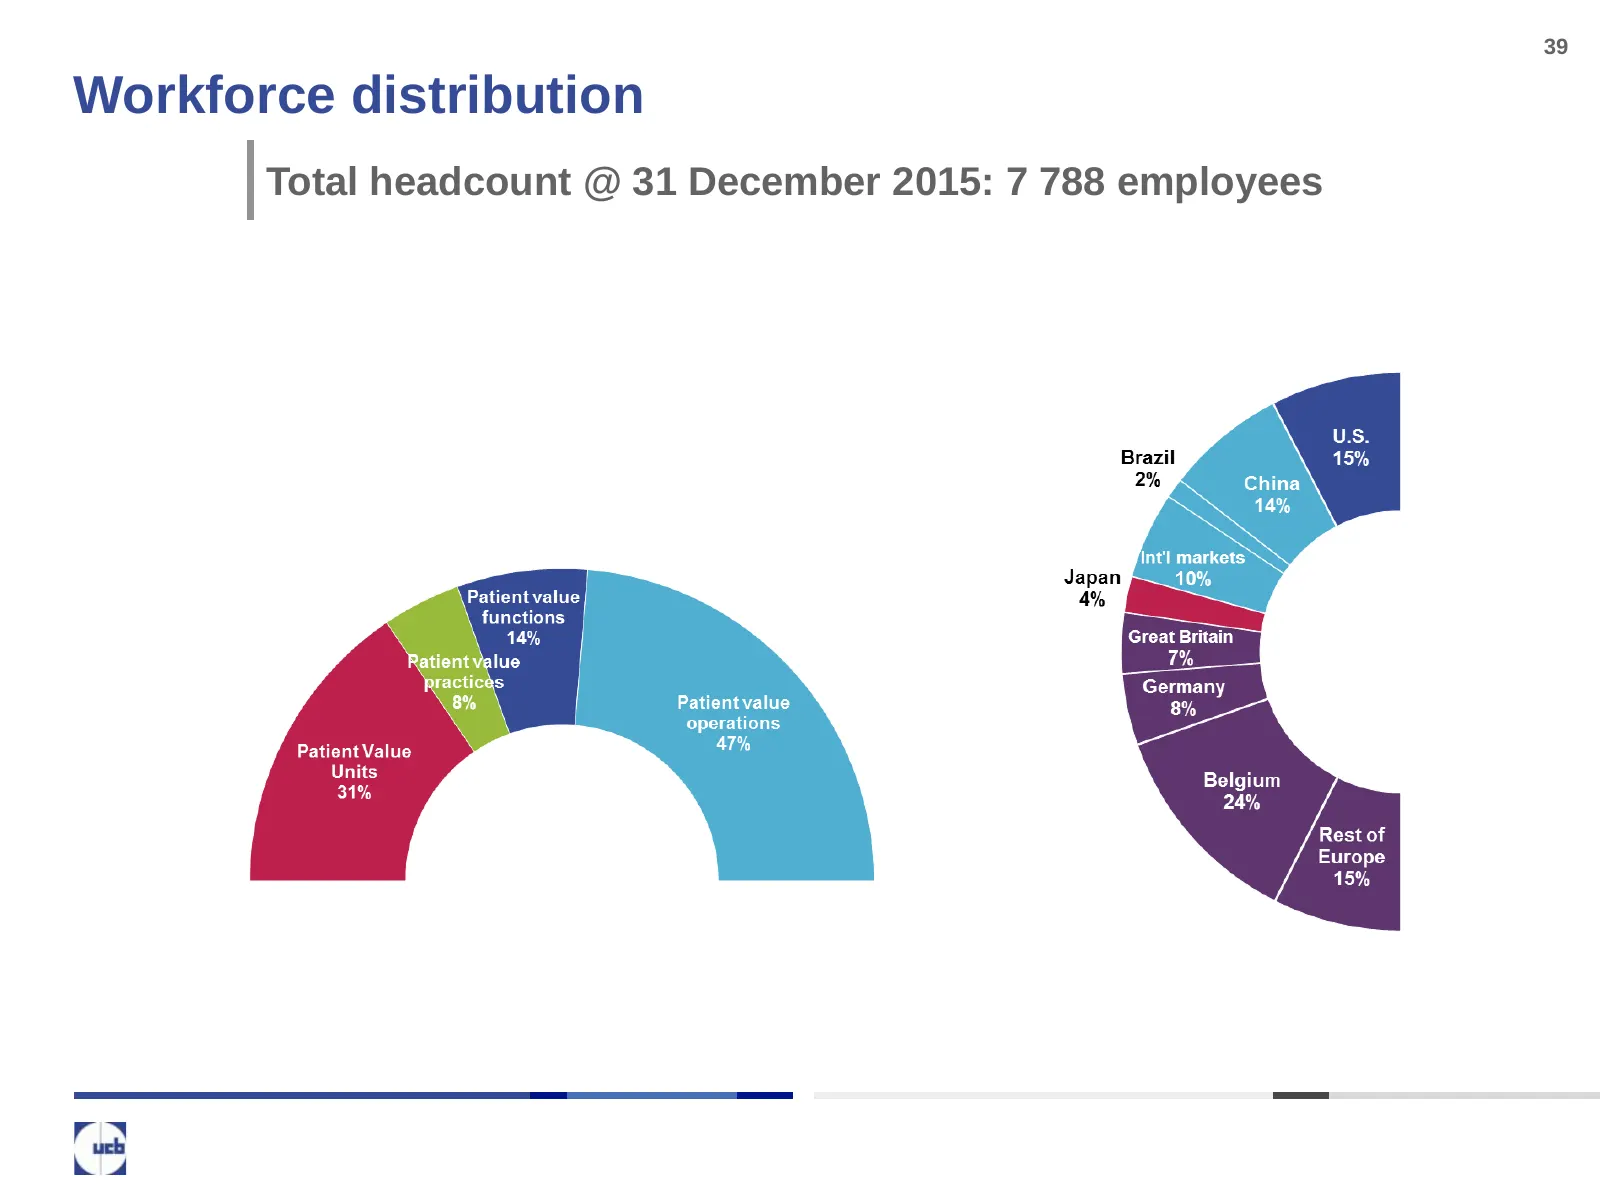
Slide 39: Workforce distribution
39 Workforce distribution Total headcount @ 31 December 2015: 7 788 employees
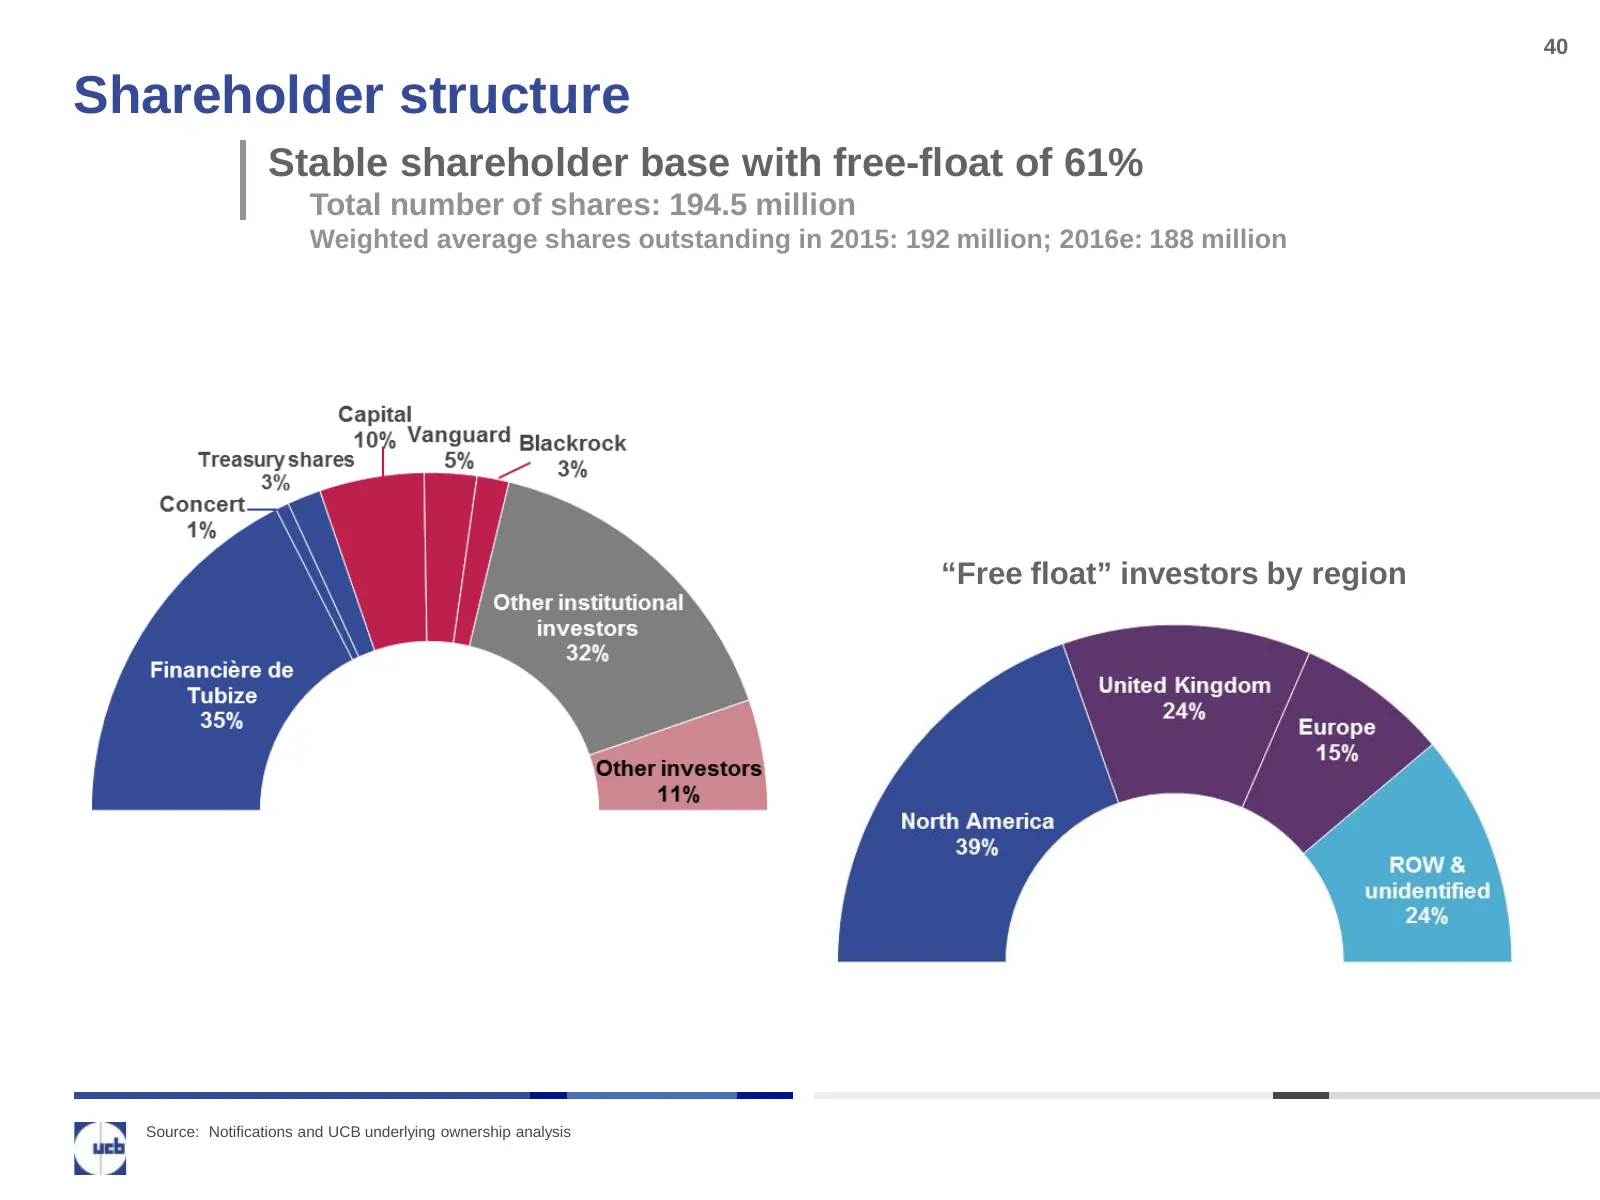
Slide 40: Shareholder structure
40 Shareholder structure Stable shareholder base with free-float of 61% Total number of shares: 194.5 million Weighted average shares outstanding in 2015: 192 million; 2016e: 188 million “Free float” investors by region Source: Notifications and UCB underlying ownership analysis
Slide 41: Your UCB Investor Relations team
41 Your UCB Investor Relations team ןAntje Witte, Vice President Investor Relations • Phone: +32 2 559 9414 • E-mail: antje.witte@ucb.com ןIsabelle Ghellynck, Director Investor Relations • Phone: +32 2 559 9588 • E-mail: isabelle.ghellynck@ucb.com ןNathalie Deldime, Investor Relations Event
Source: Internet Archive copy of ucb.com
More decks from Ucb S.A.
 H1 2026 Earnings Presentation22 slides · Jul 30, 2026
 FY2025 Earnings Presentation22 slides · Feb 26, 2026
 44th Annual J.P. Morgan Healthcare Conference 202616 slides · Jan 14, 2026
 H1 2025 Earnings Presentation21 slides · Jul 31, 2025
 FY2024 Earnings Presentation18 slides · Feb 27, 2025
 43rd Annual J.P. Morgan Healthcare Conference (January 2025)13 slides · Jan 15, 2025