Rumo SA · BMFBOVESPA:RAIL3
Rumo SA — Investor Presentation (February 2017)
23 slides from Rumo SA's investor presentation, February 2017
Slide 1: Institutional Presentation
Institutional Presentation February 2017 Caixa para descrição.
Slide 2: Disclaimer
Disclaimer This presentation contains estimates and forward-looking statements regarding our strategy and opportunities for future growth. Such information is mainly based on our current expectations and estimates or projections of future events and trends, which affect or may affect our business an
Slide 3: Agenda
Agenda 1 Rumo Overview 2 Strong Business Case 3 Turnaround Strategy in Place 4 Operational and Financial Performance 5 Closing Remarks 3
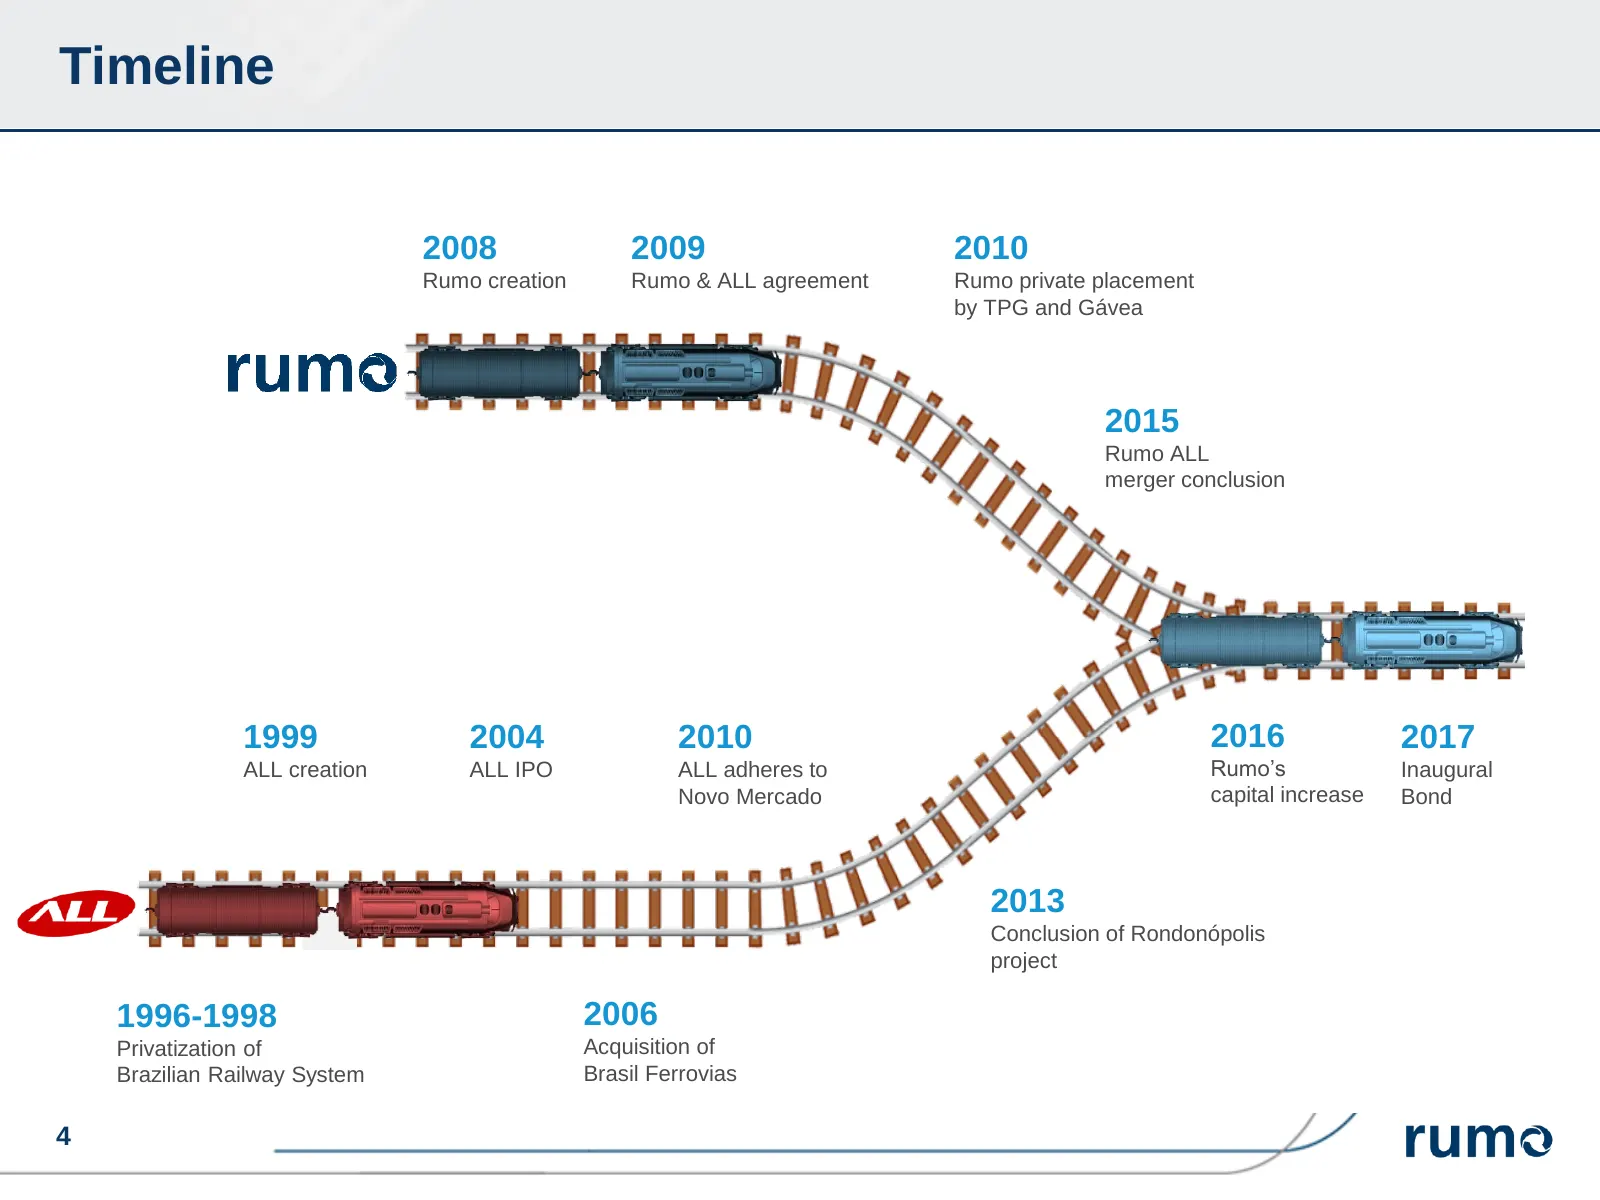
Slide 4: Timeline
Timeline 2008 2009 2010 Rumo creation Rumo & ALL agreement Rumo private placement by TPG and Gávea 2015 Rumo ALL merger conclusion 1999 2004 2010 2016 2017 ALL creation ALL IPO ALL adheres to Rumo’s Inaugural Novo Mercado capital increase Bond 2013 Conclusion of Rondonópolis project 1996-1998 2006 P
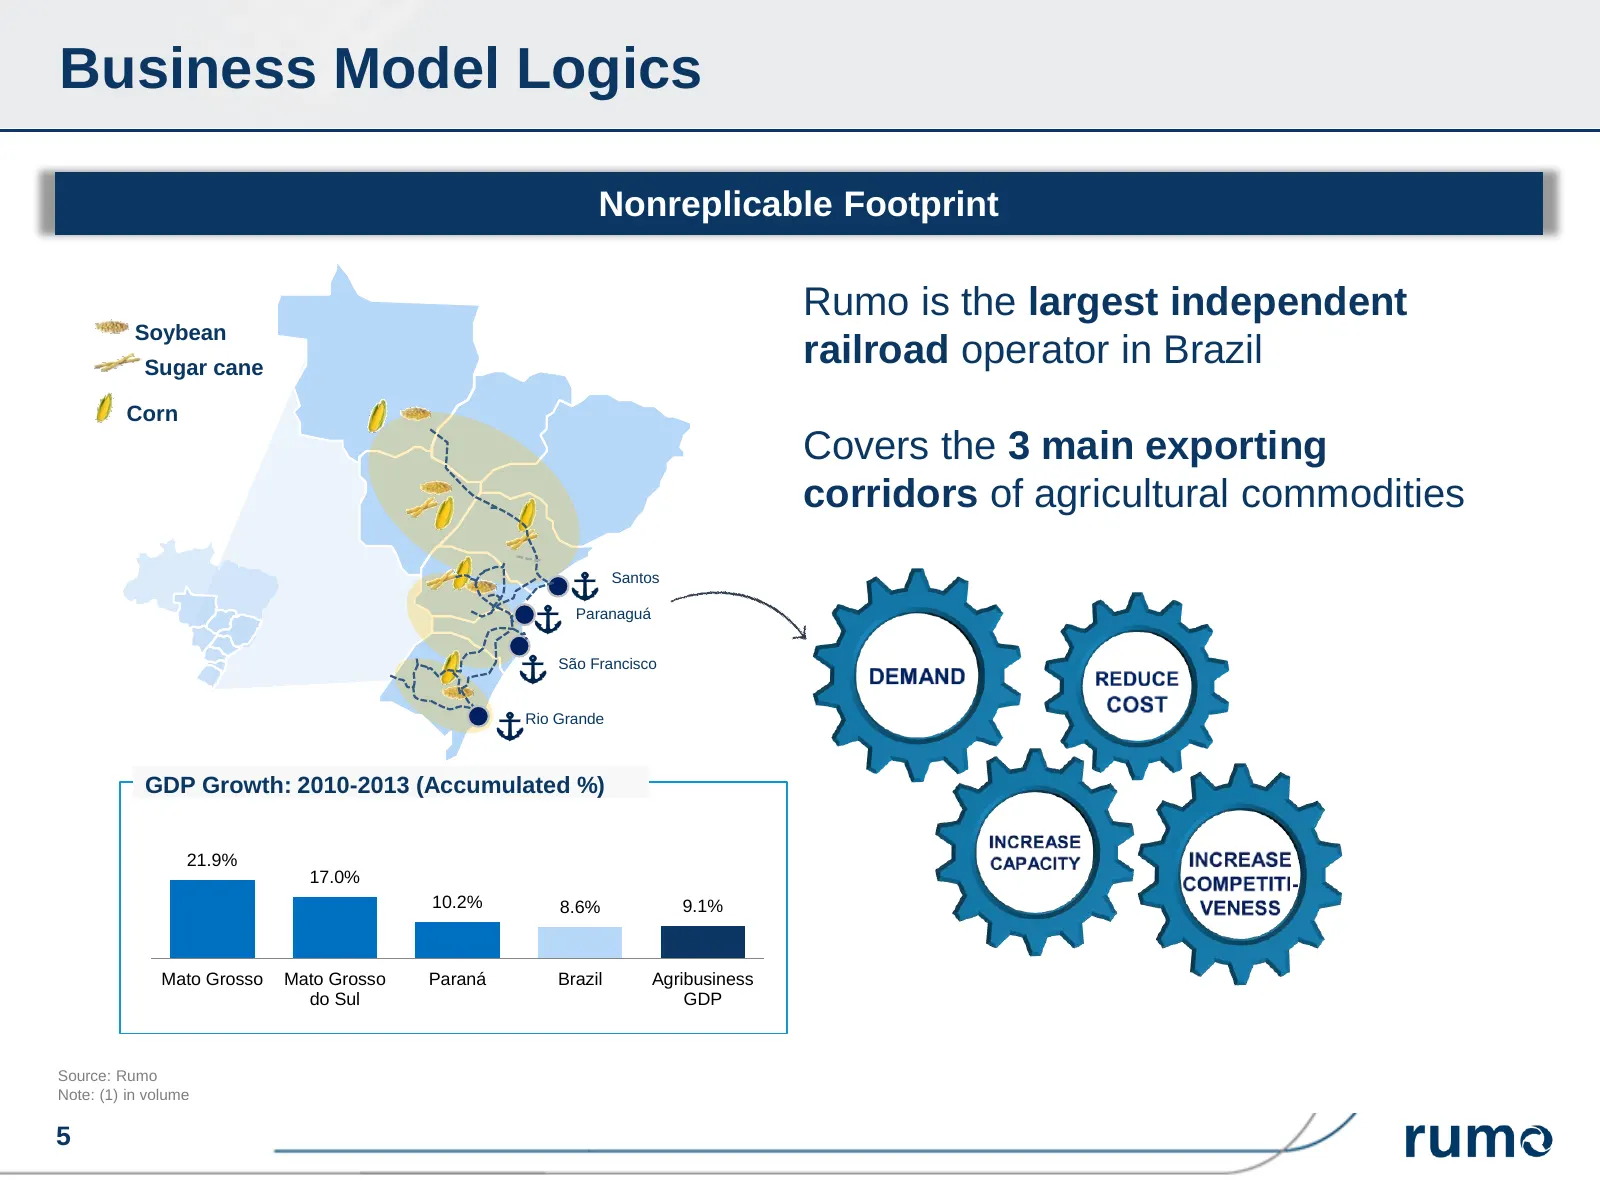
Slide 5: Business Model Logics
Business Model Logics Nonreplicable Footprint Rumo is the largest independent Soybean Sugar cane railroad operator in Brazil Corn Covers the 3 main exporting corridors of agricultural commodities Santos Paranaguá São Francisco Rio Grande GDP Growth: 2010-2013 (Accumulated %) 21.9% 17.0% 10.2% 8.6% 9
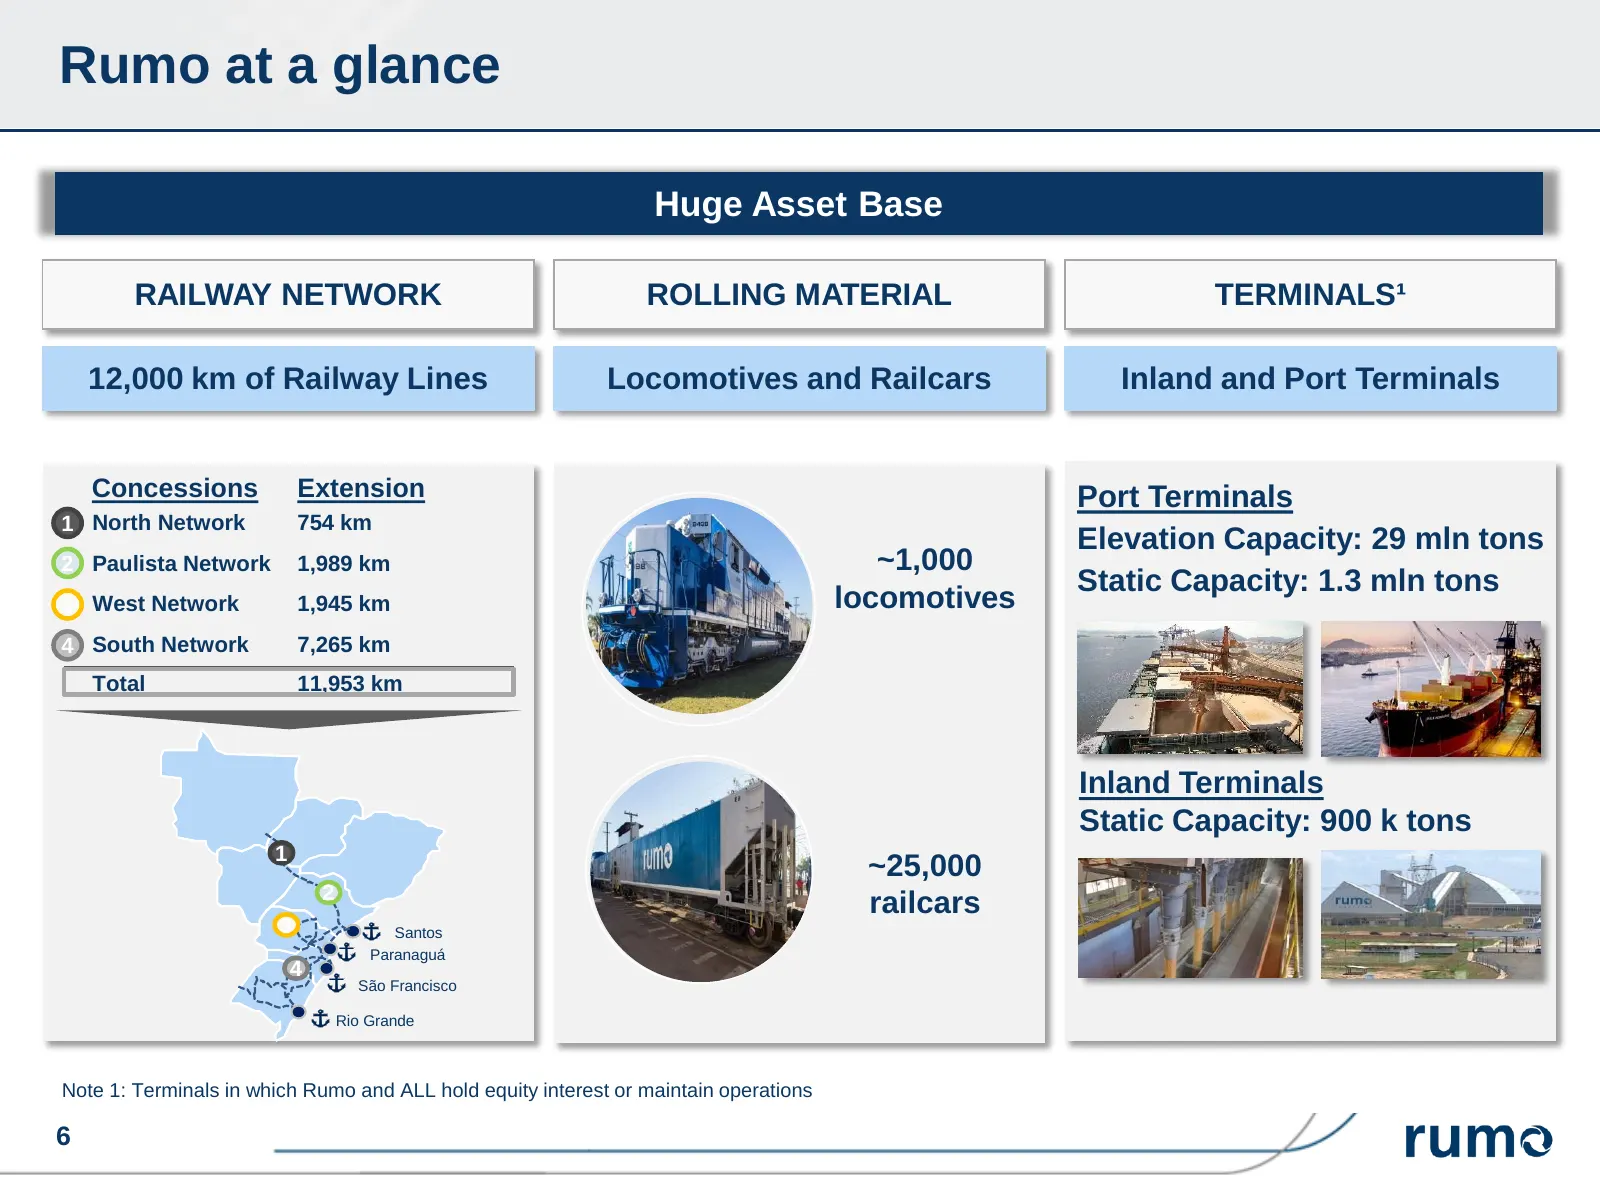
Slide 6: Rumo at a glance
Rumo at a glance Huge Asset Base RAILWAY NETWORK ROLLING MATERIAL TERMINALS¹ 12,000 km of Railway Lines Locomotives and Railcars Inland and Port Terminals Concessions Extension Port Terminals 1 North Network 754 km Elevation Capacity: 29 mln tons 2 Paulista Network 1,989 km ~1,000 Static Capacity: 1
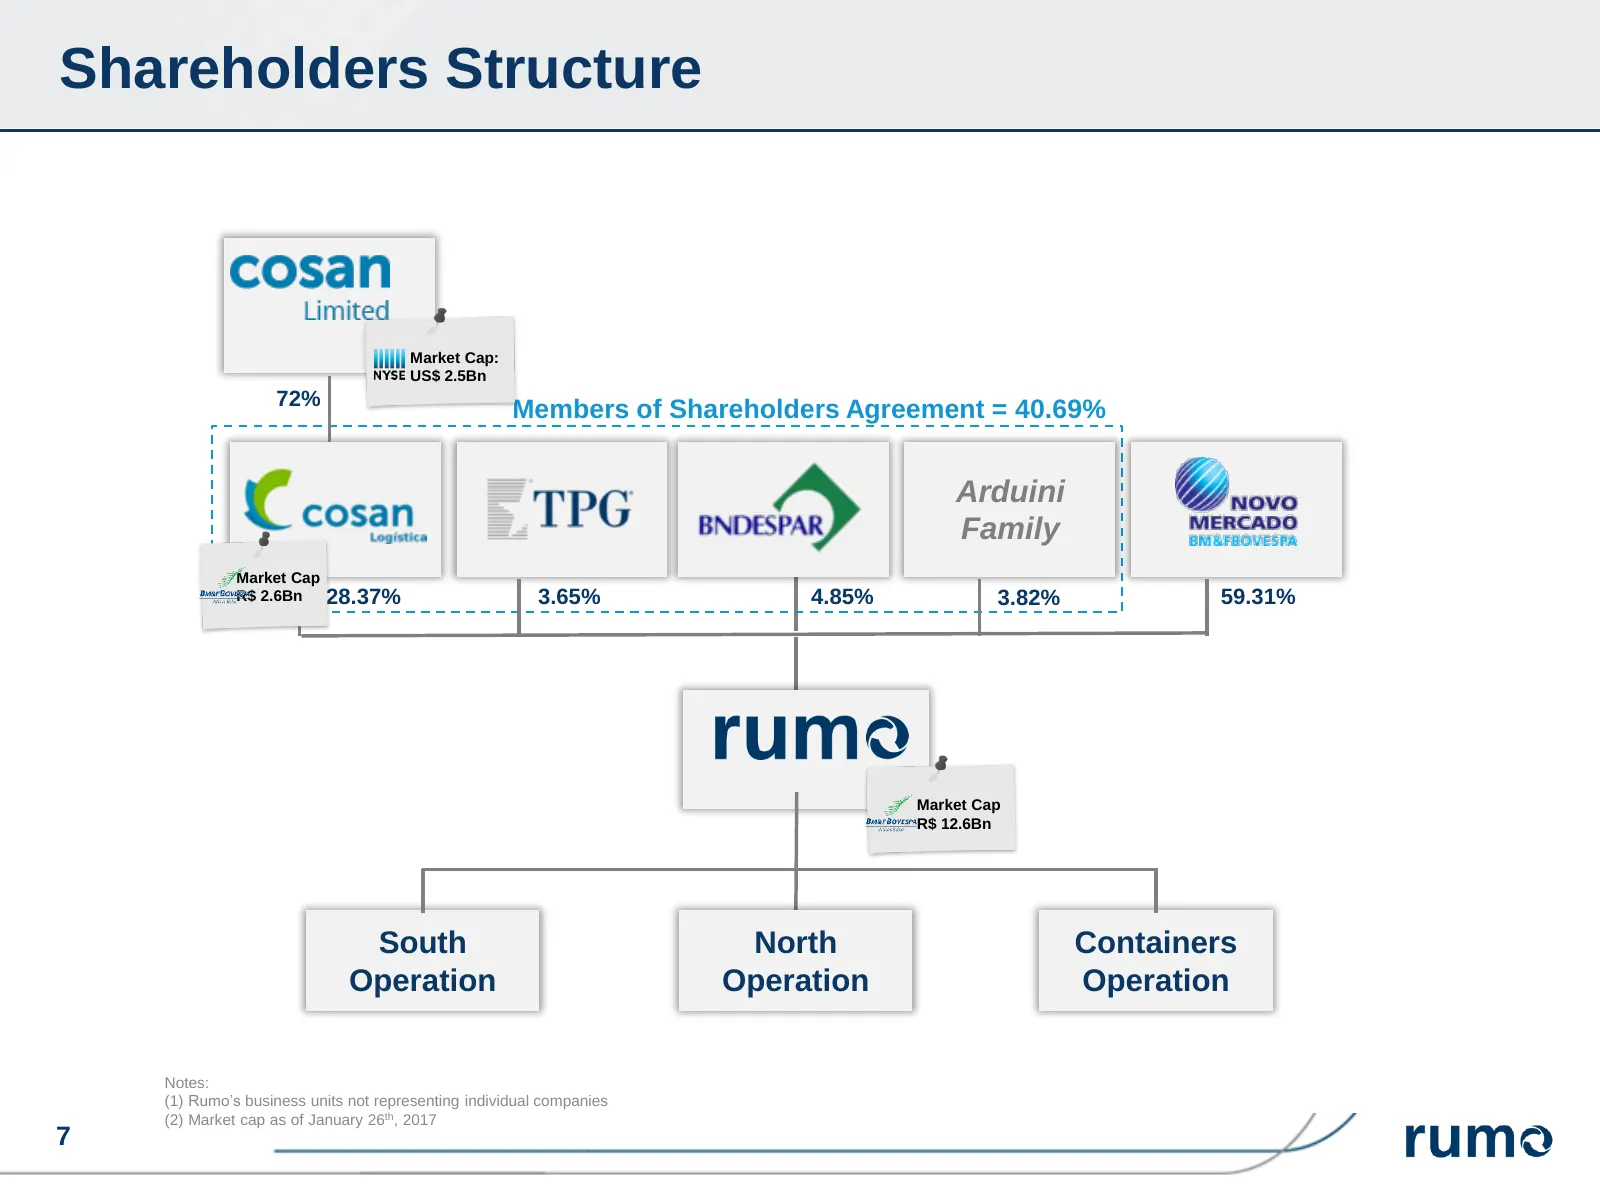
Slide 7: Shareholders Structure
Shareholders Structure Market Cap: US$ 2.5Bn 72% Members of Shareholders Agreement = 40.69% Arduini Family Market Cap R$ 2.6Bn 28.37% 3.65% 4.85% 3.82% 59.31% Market Cap R$ 12.6Bn South North Containers Operation Operation Operation Notes: (1) Rumo’s business units not representing individual compan
Slide 8: Agenda
Agenda 1 Rumo Overview 2 Strong Business Case 3 Turnaround Strategy in Place 4 Operational and Financial Performance 5 Closing Remarks 8
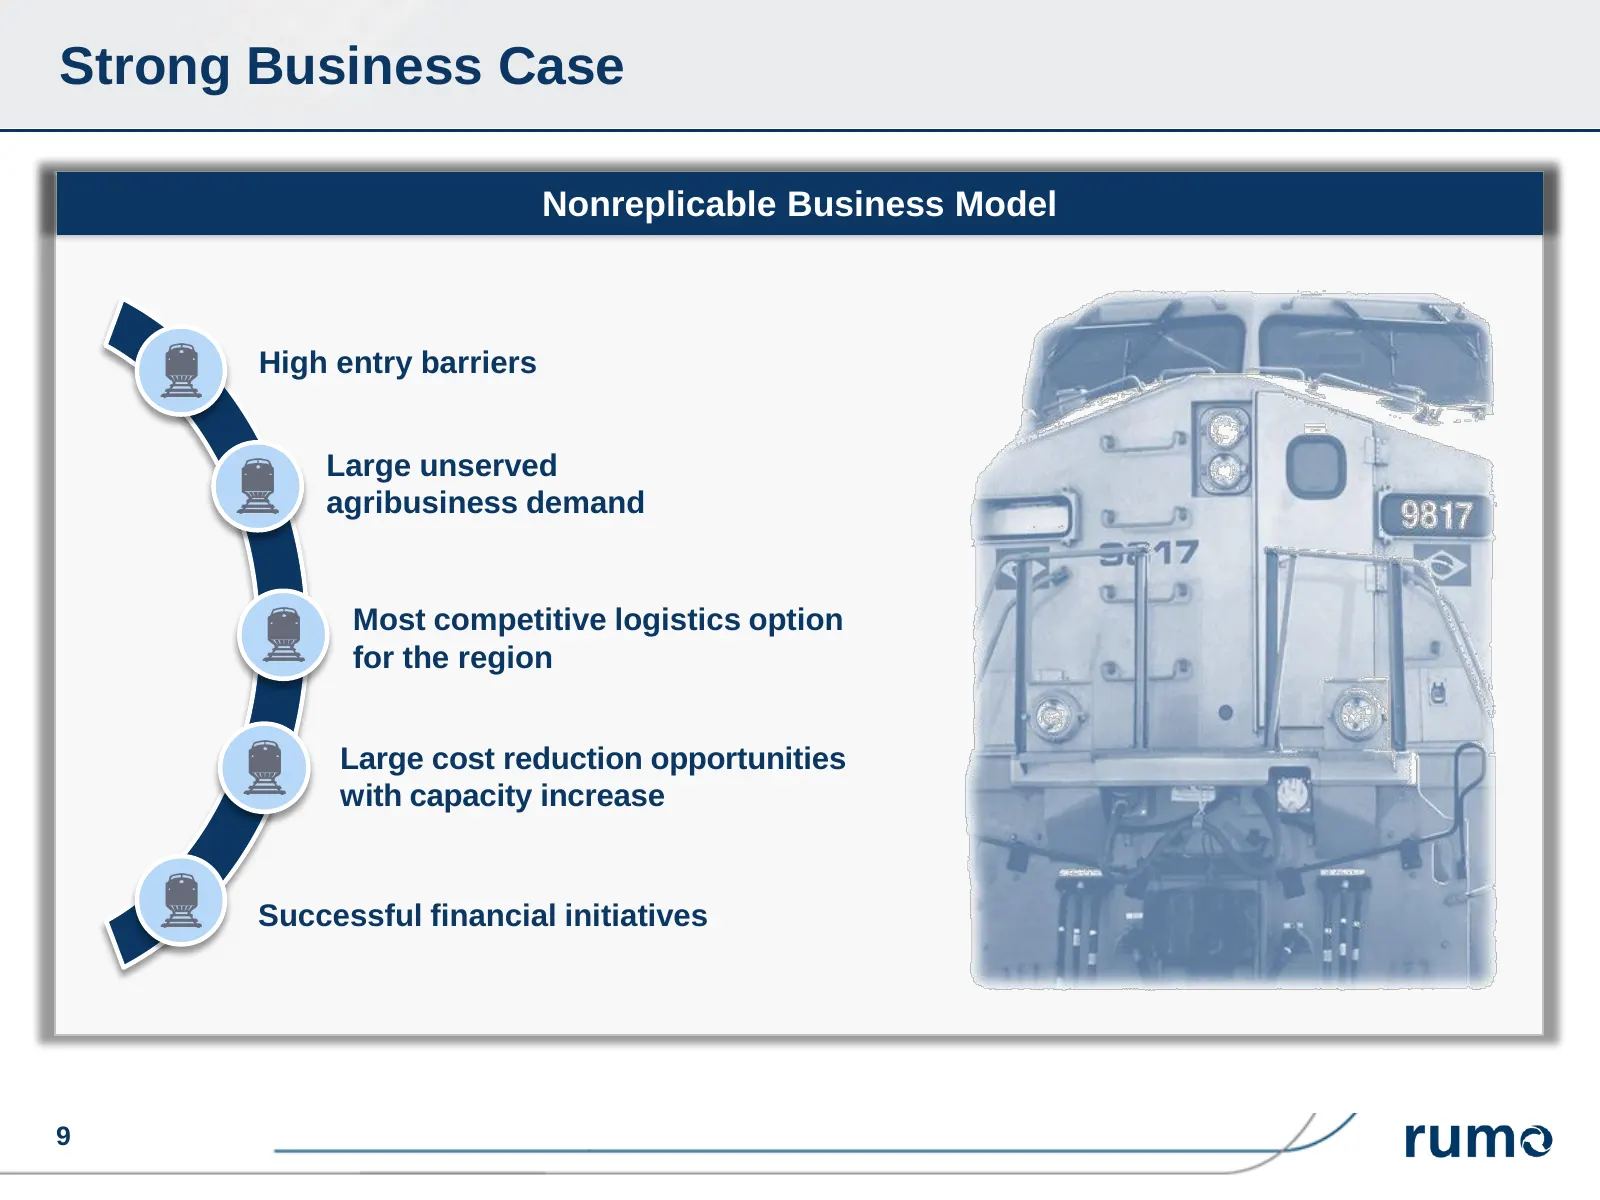
Slide 9: Strong Business Case
Strong Business Case Nonreplicable Business Model High entry barriers Large unserved agribusiness demand Most competitive logistics option for the region Large cost reduction opportunities with capacity increase Successful financial initiatives 9
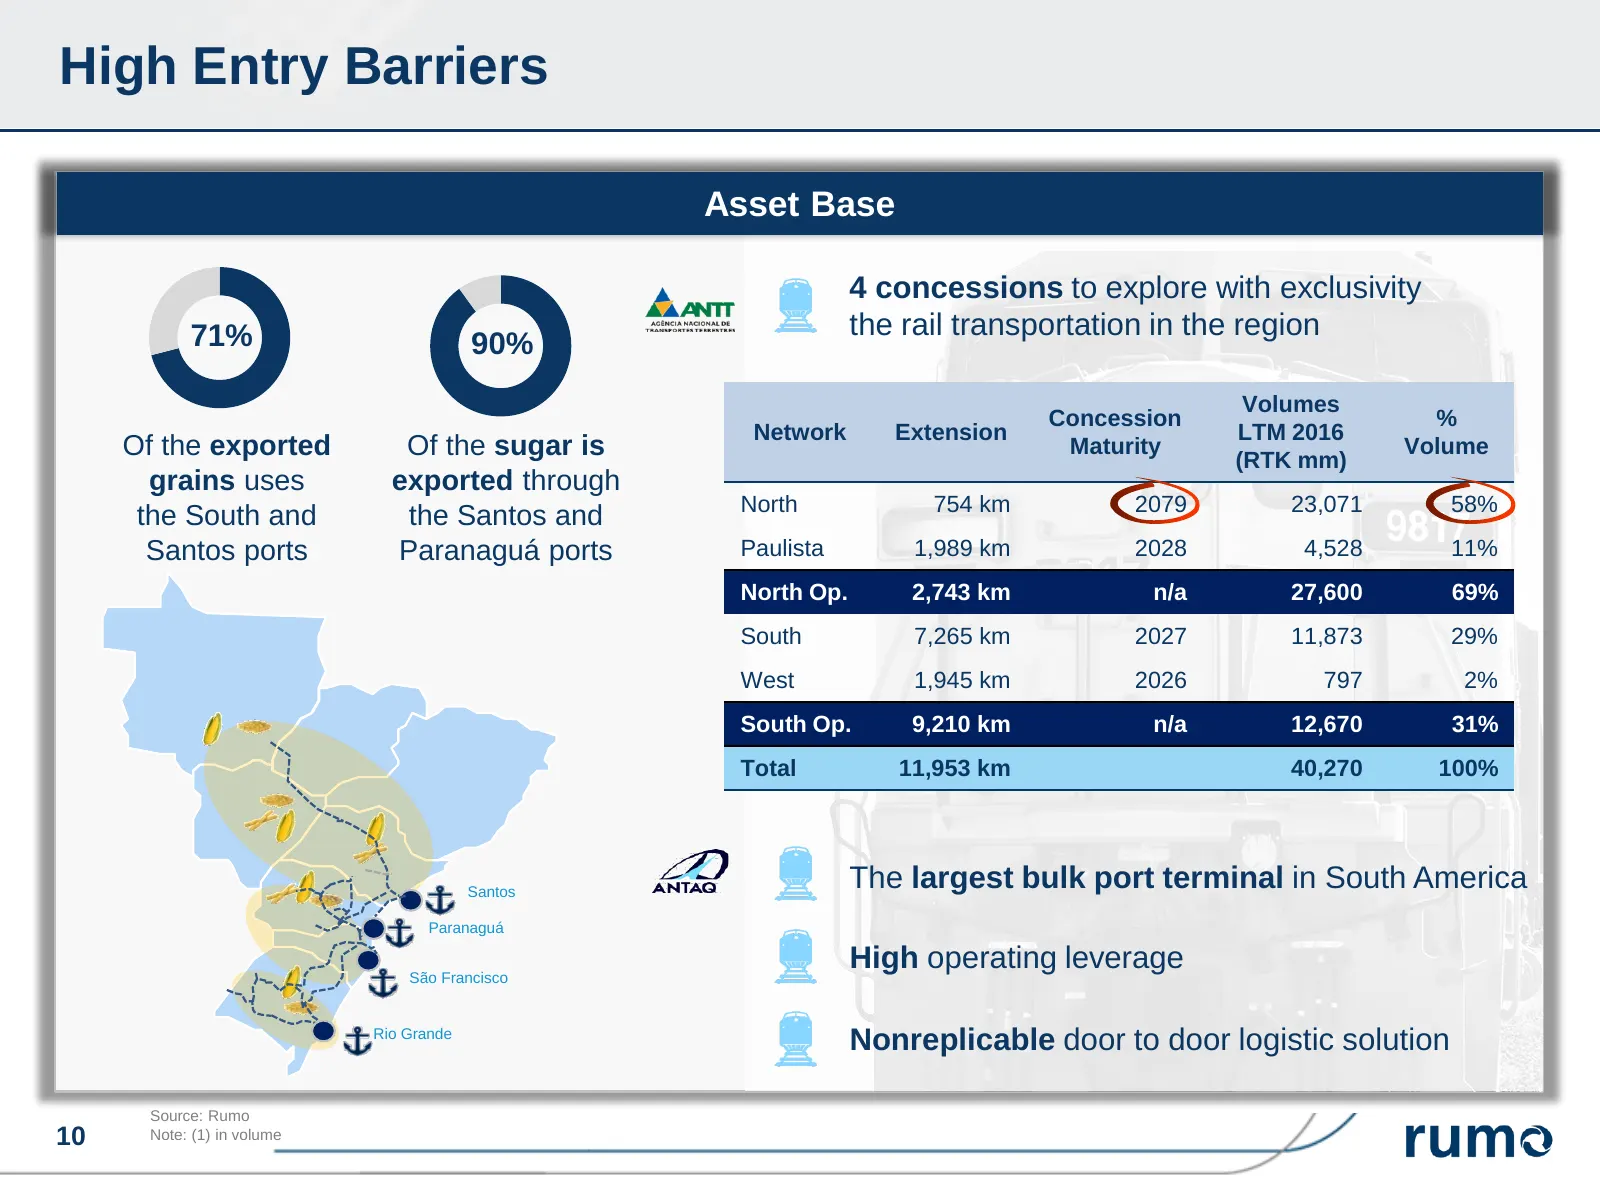
Slide 10: High Entry Barriers
High Entry Barriers Asset Base 4 concessions to explore with exclusivity 71% the rail transportation in the region 90% Volumes Concession % Network Extension LTM 2016 Of the exported Of the sugar is Maturity (RTK mm) Volume grains uses exported through North 754 km 2079 23,071 58% the South and the
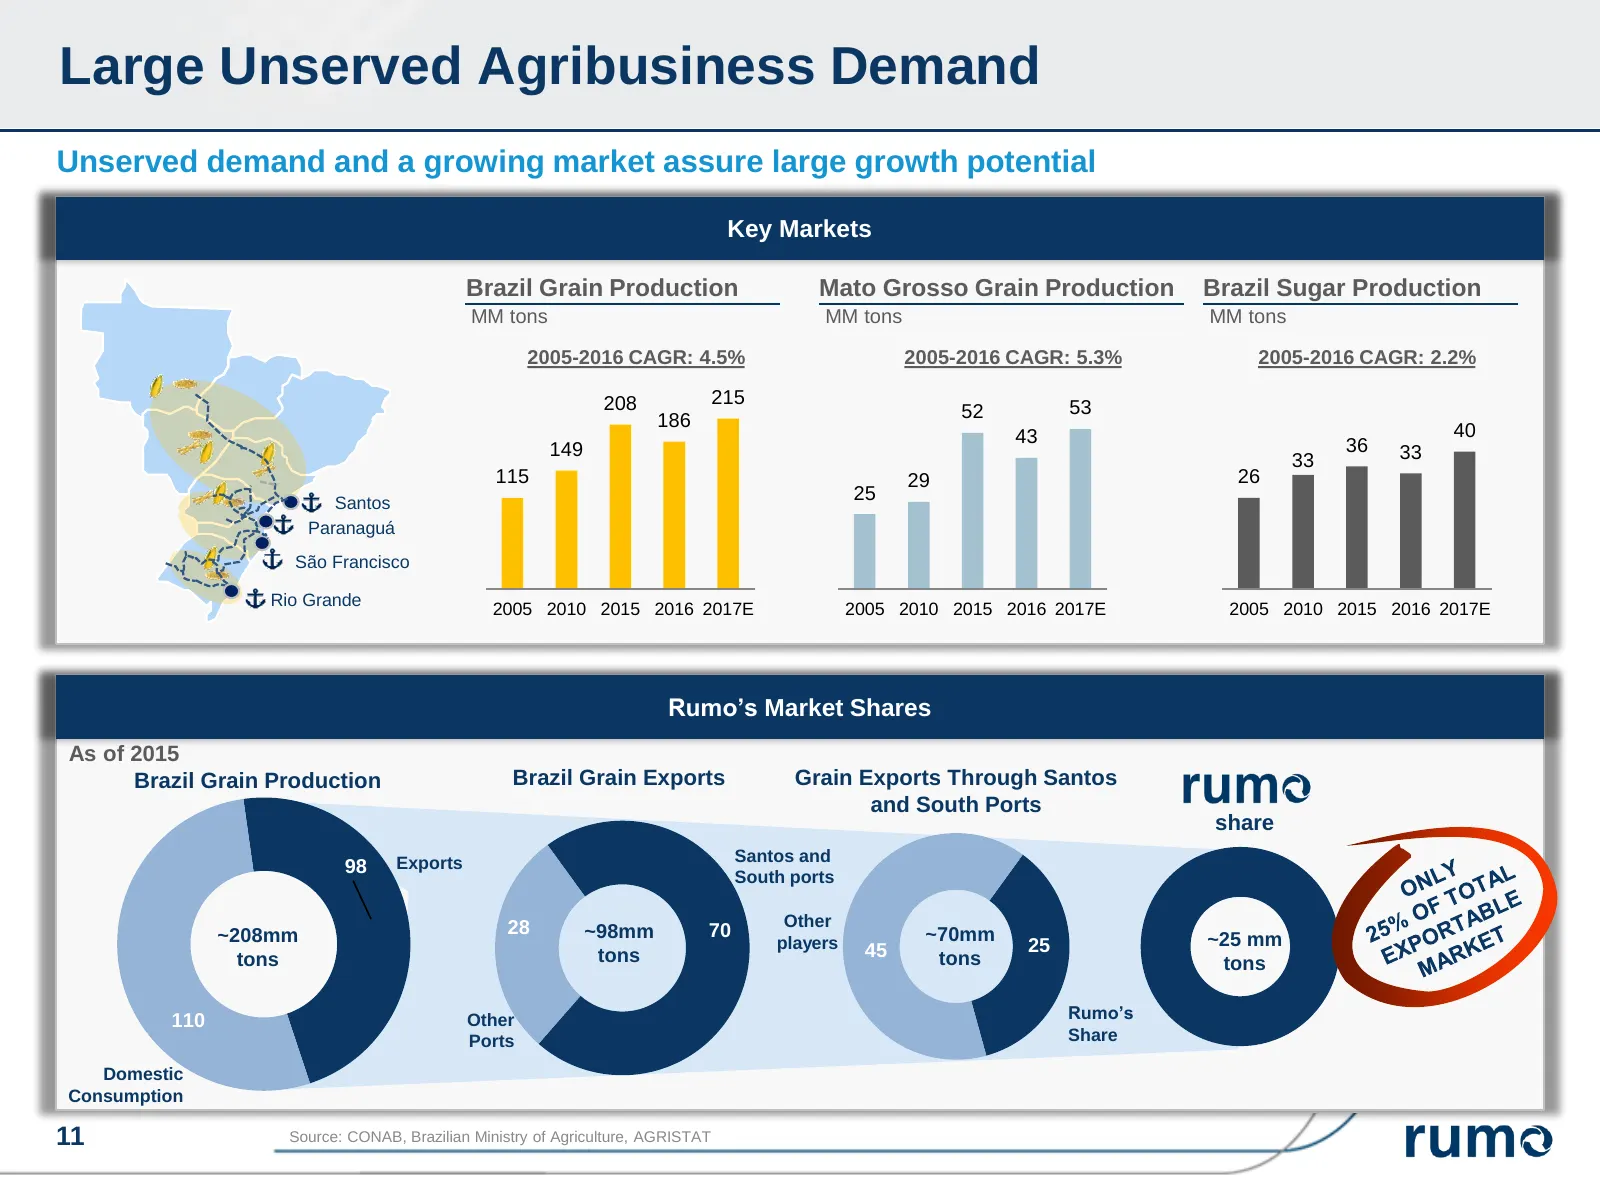
Slide 11: Large Unserved Agribusiness Demand
Large Unserved Agribusiness Demand Unserved demand and a growing market assure large growth potential Key Markets Brazil Grain Production Mato Grosso Grain Production Brazil Sugar Production MM tons MM tons MM tons 2005-2016 CAGR: 4.5% 2005-2016 CAGR: 5.3% 2005-2016 CAGR: 2.2% 208 215 52 53 186 43 4
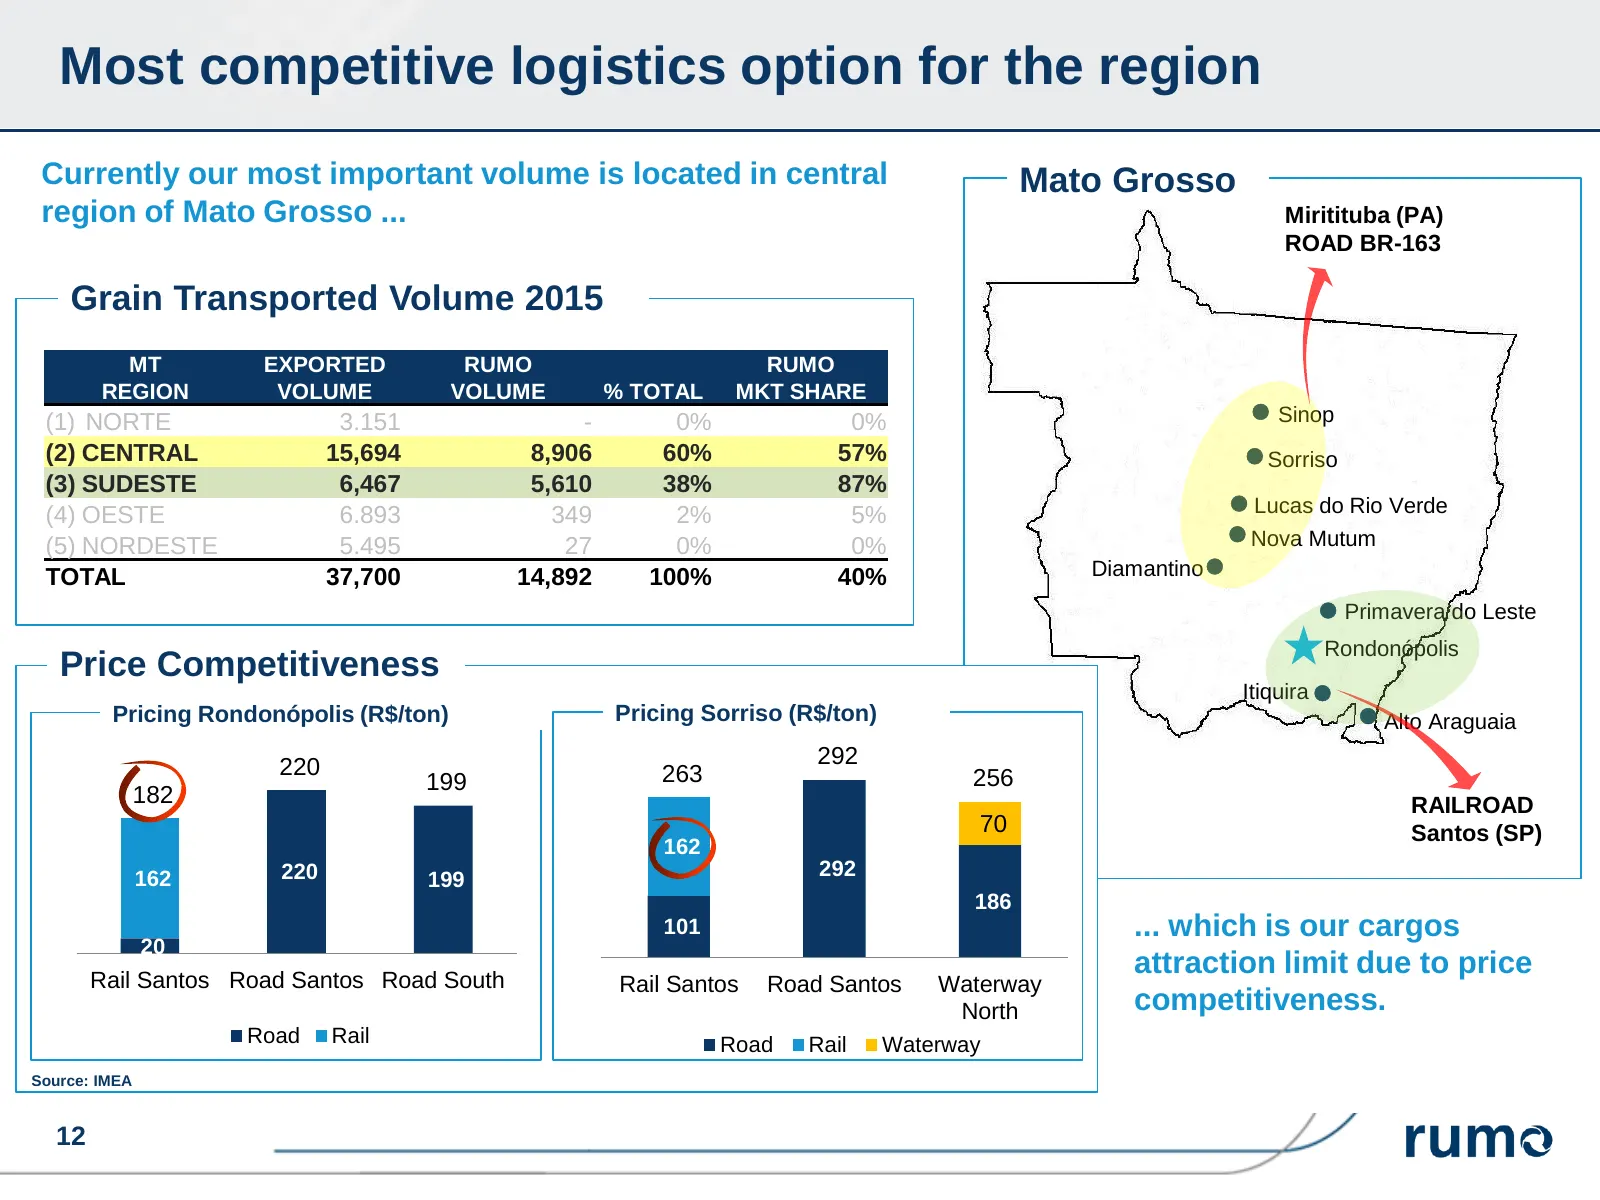
Slide 12: Most competitive logistics option for the region
Most competitive logistics option for the region Currently our most important volume is located in central Mato Grosso region of Mato Grosso ... Miritituba (PA) ROAD BR-163 Grain Transported Volume 2015 MT EXPORTED RUMO RUMO REGION VOLUME VOLUME % TOTAL MKT SHARE (1) NORTE 3.151 - 0% 0% Sinop (2) CE
Slide 13: Large Cost Reduction Opportunities With Capacity Increase
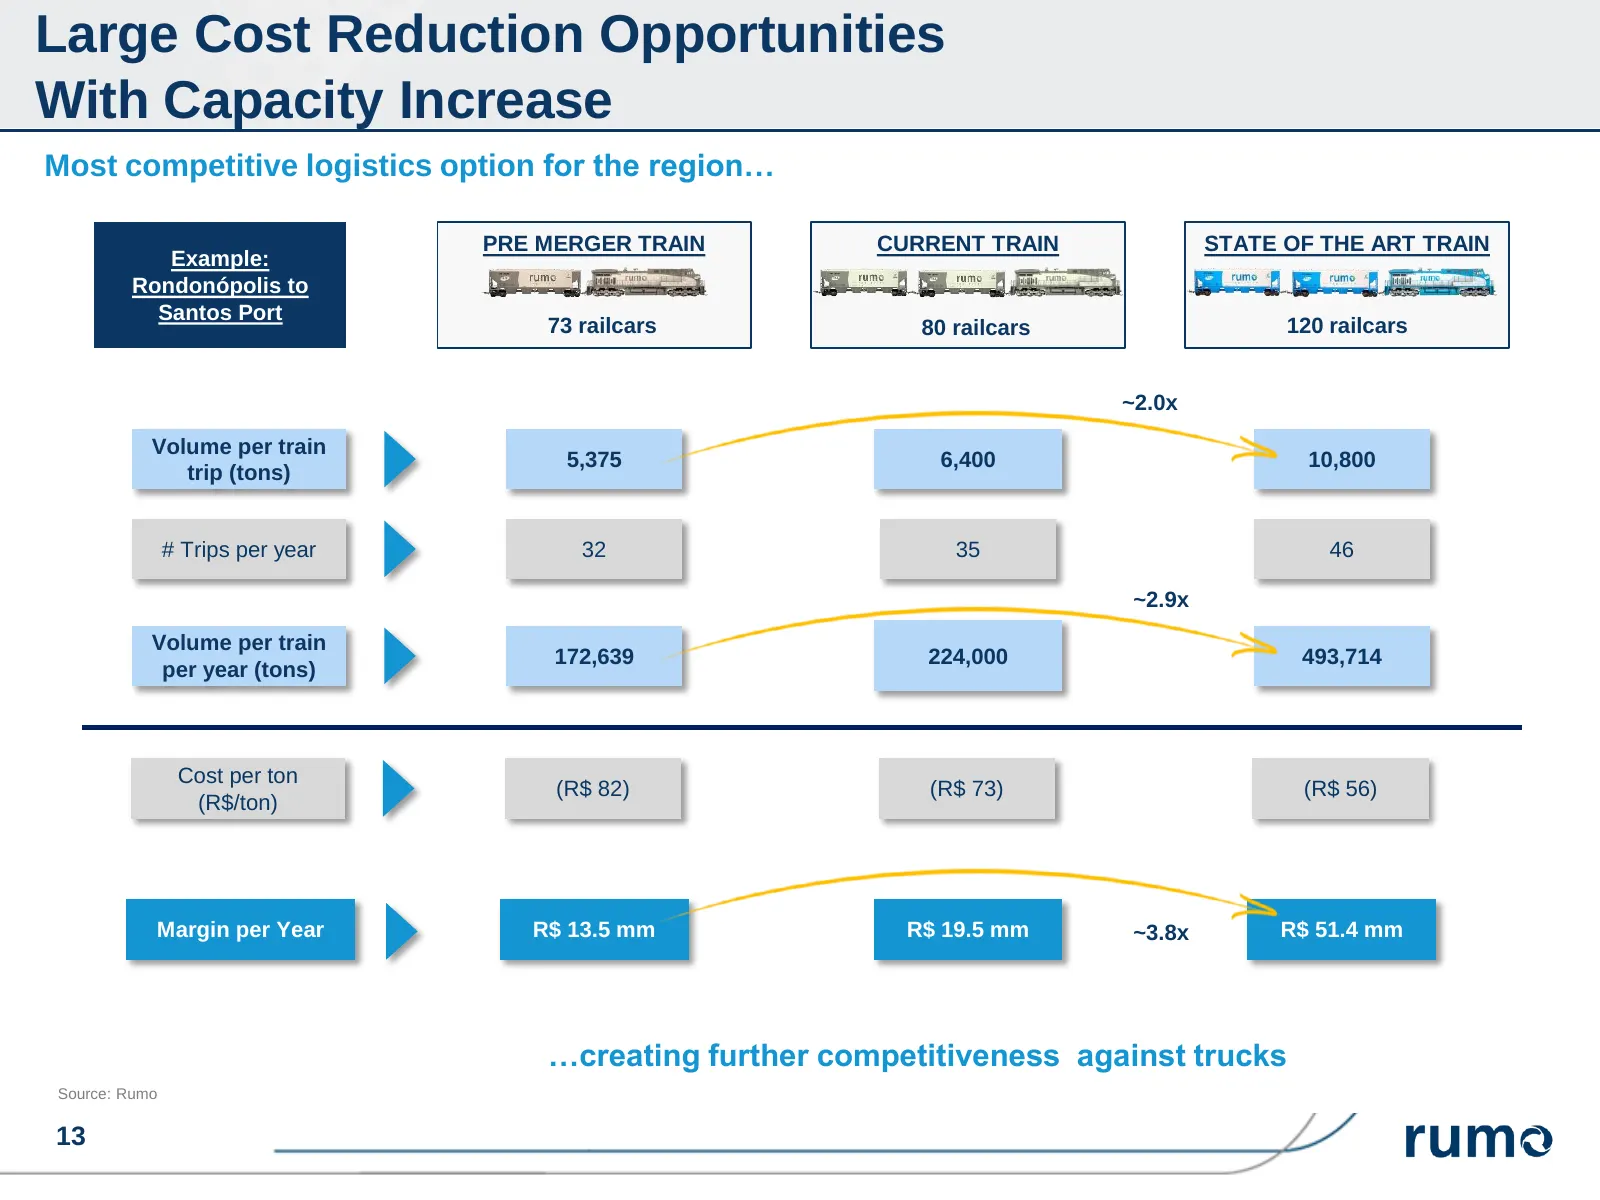
Large Cost Reduction Opportunities With Capacity Increase Most competitive logistics option for the region… PRE MERGER TRAIN CURRENT TRAIN STATE OF THE ART TRAIN Example: Rondonópolis to Santos Port 73 railcars 80 railcars 120 railcars ~2.0x Volume per train 5,375 6,400 10,800 trip (tons) # Trips pe
Slide 14: Successful financial initiatives
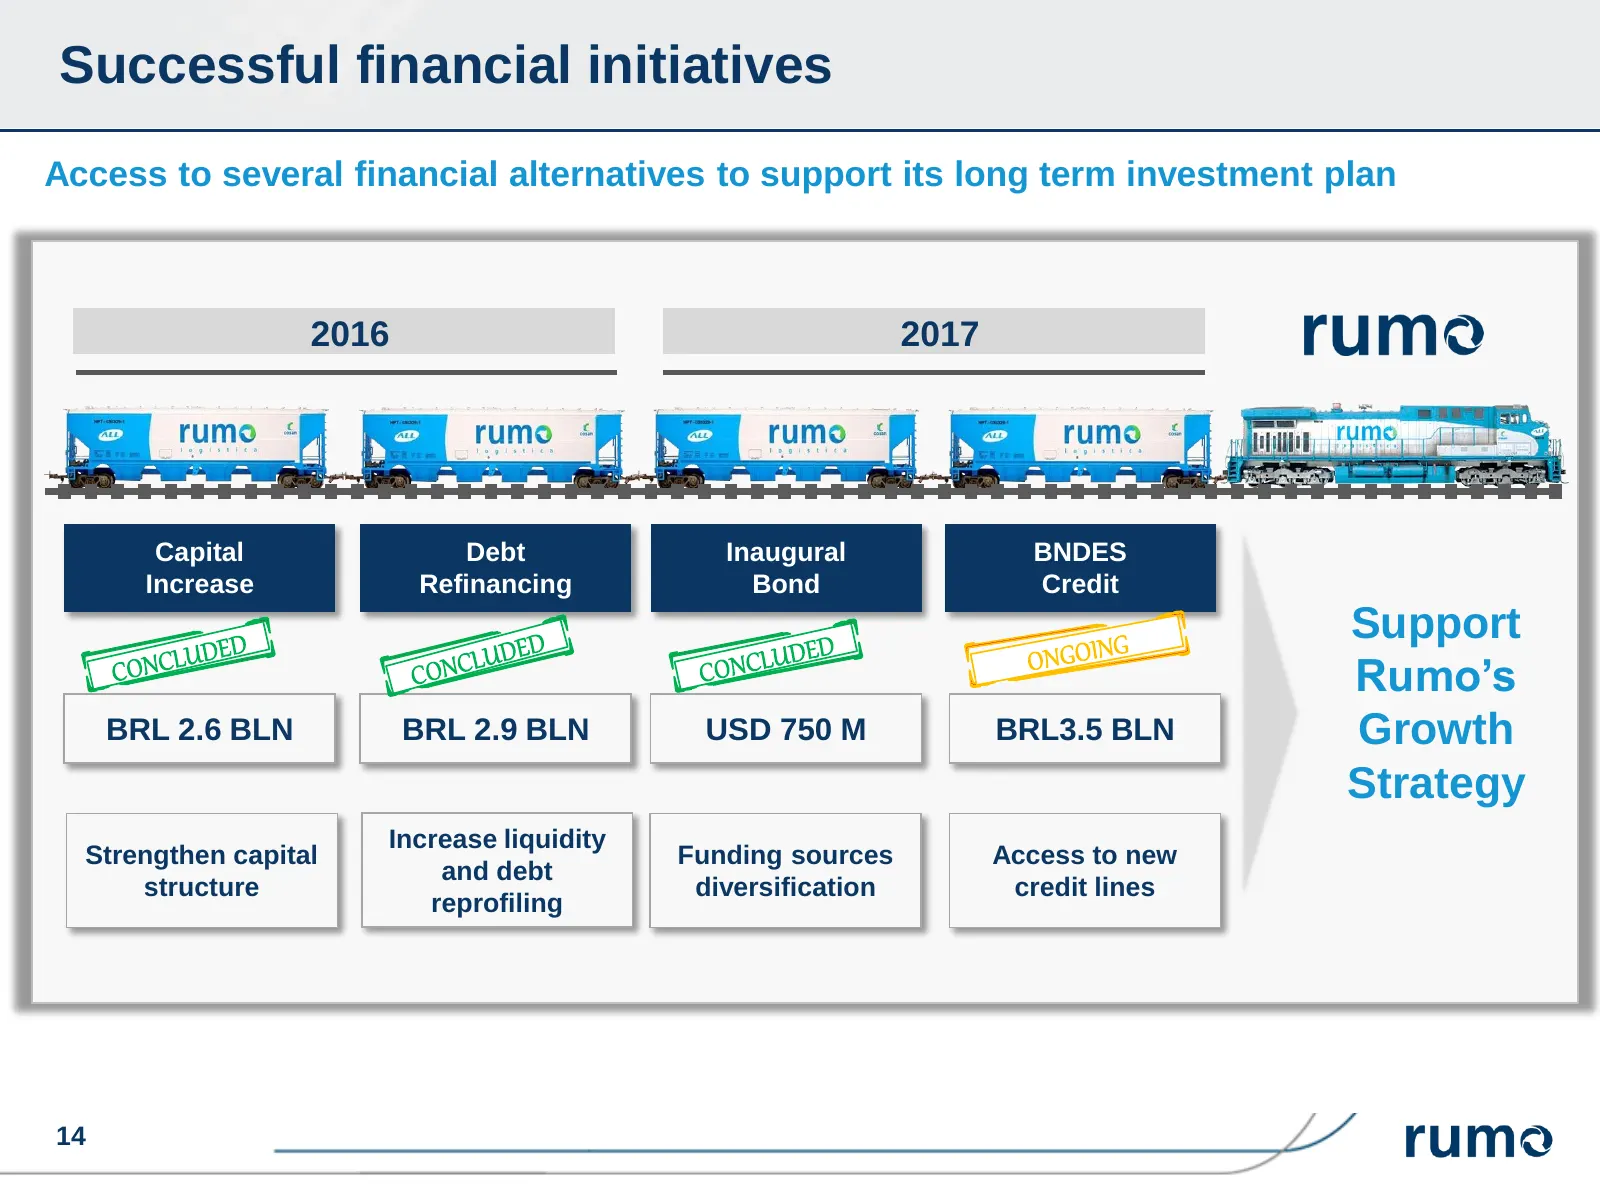
Successful financial initiatives Access to several financial alternatives to support its long term investment plan 2016 2017 Capital Debt Inaugural BNDES Increase Refinancing Bond Credit Support Rumo’s BRL 2.6 BLN BRL 2.9 BLN USD 750 M BRL3.5 BLN Growth Strategy Increase liquidity Strengthen capital
Slide 15: Agenda
Agenda 1 Rumo Overview 2 Strong Business Case 3 Turnaround Strategy in Place 4 Operational and Financial Performance 5 Closing Remarks 15
Slide 16: New commercial approach and solid client portfolio
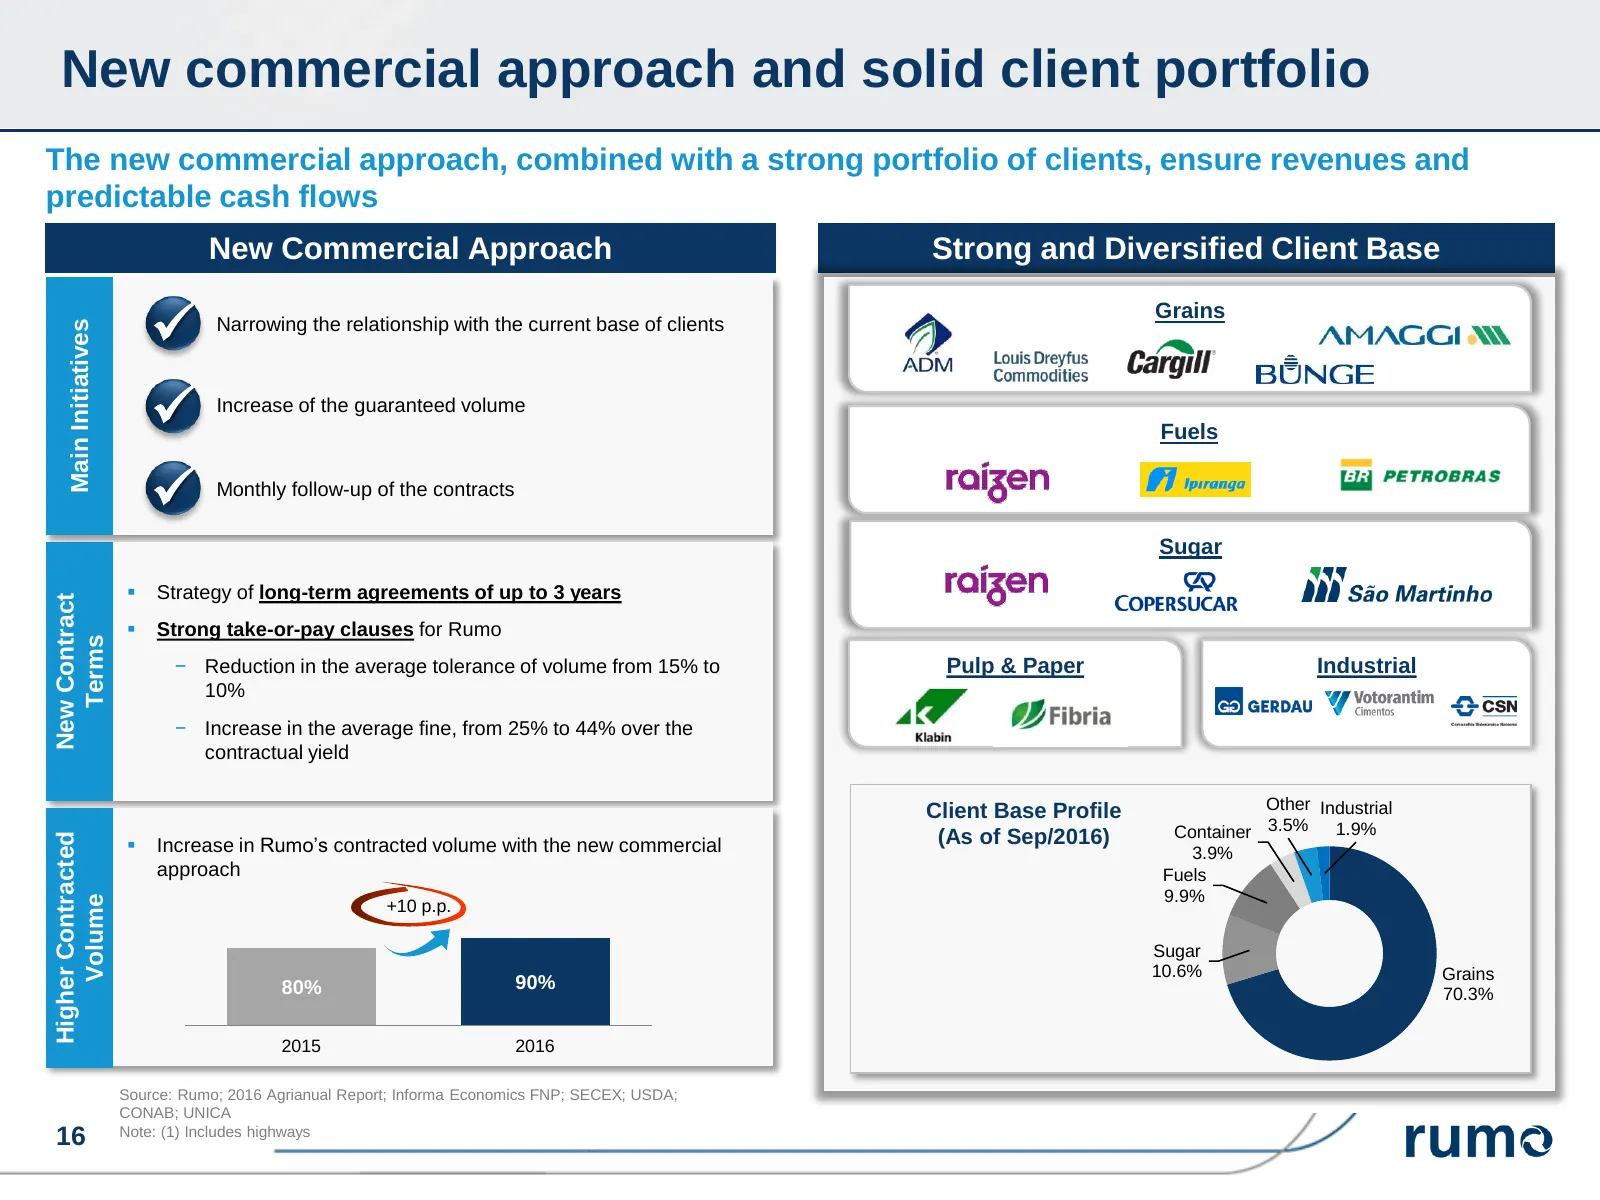
New commercial approach and solid client portfolio The new commercial approach, combined with a strong portfolio of clients, ensure revenues and predictable cash flows New Commercial Approach Strong and Diversified Client Base Grains Narrowing the relationship with the current base of clients Main
Slide 17: Cost Structure and Recent Investments
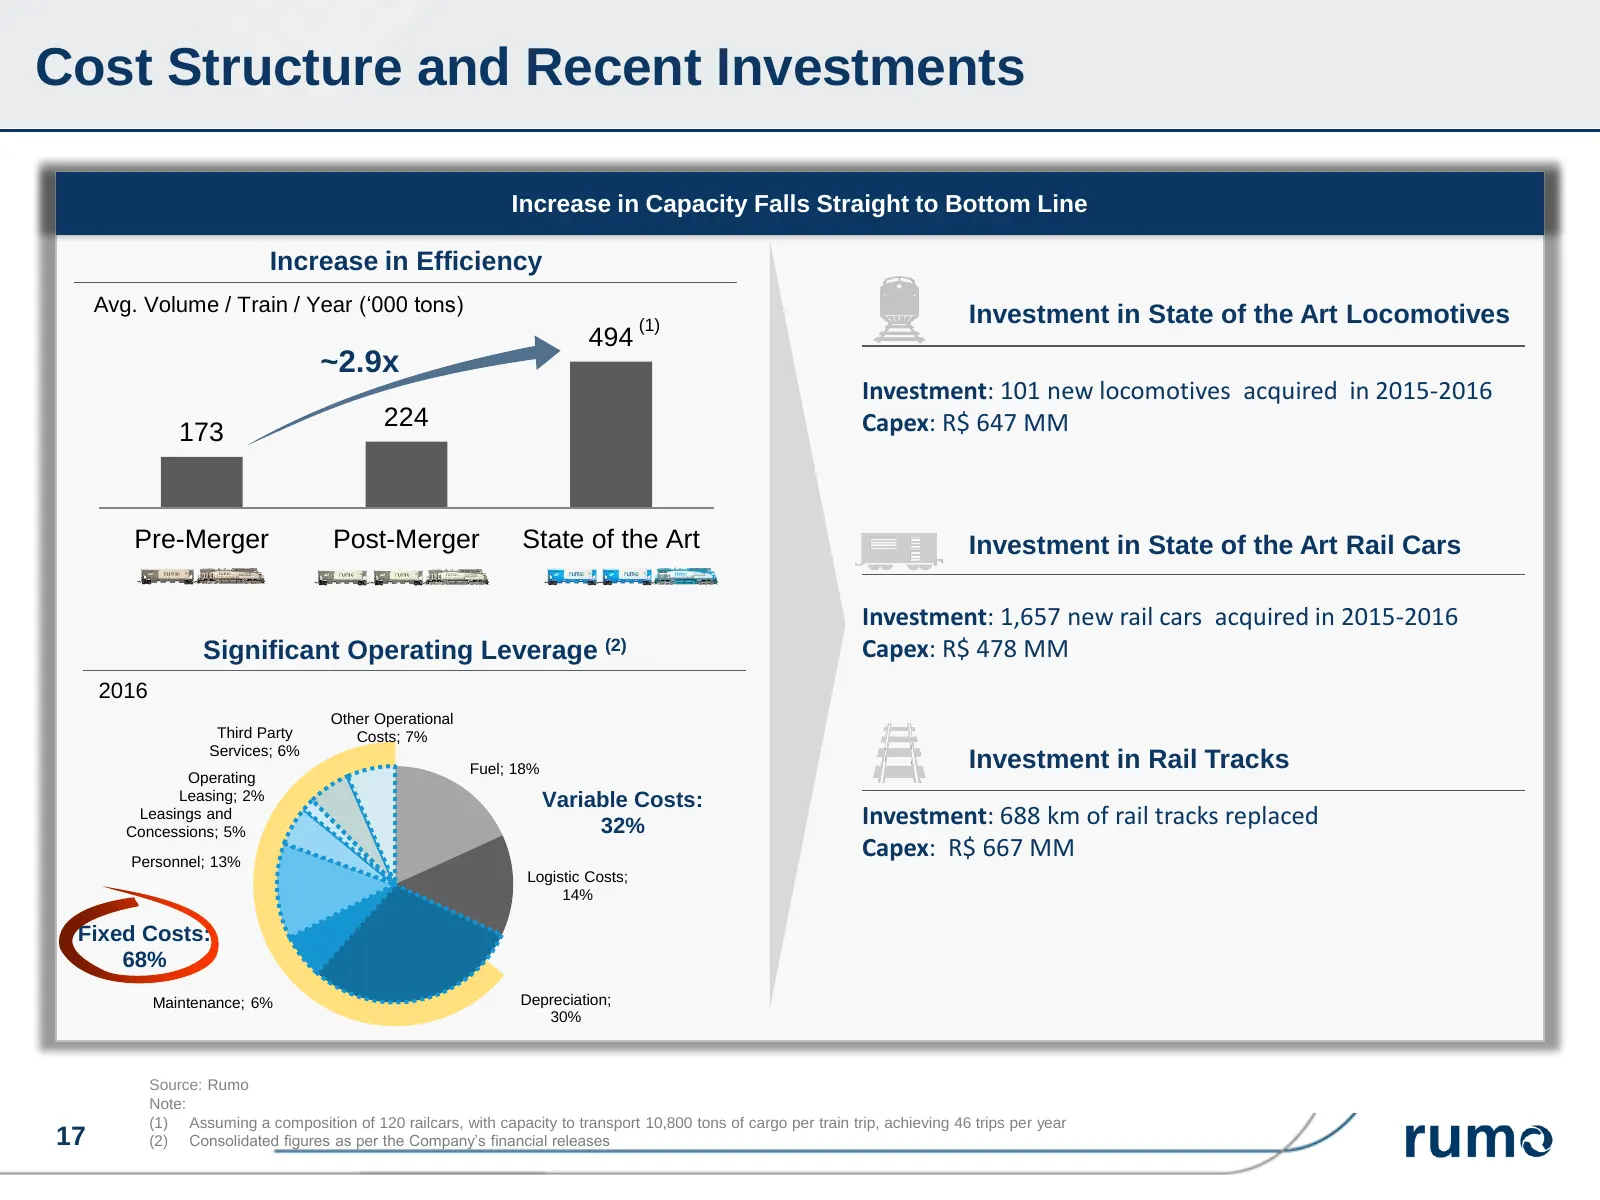
Cost Structure and Recent Investments Increase in Capacity Falls Straight to Bottom Line Increase in Efficiency Avg. Volume / Train / Year (‘000 tons) Investment in State of the Art Locomotives (1) 494 ~2.9x Investment: 101 new locomotives acquired in 2015-2016 224 Capex: R$ 647 MM 173 Pre-Merger Po
Slide 18: Agenda
Agenda 1 Rumo Overview 2 Strong Business Case 3 Turnaround Strategy in Place 4 Operational and Financial Update 5 Closing Remarks 18
Slide 19: Operational Performance
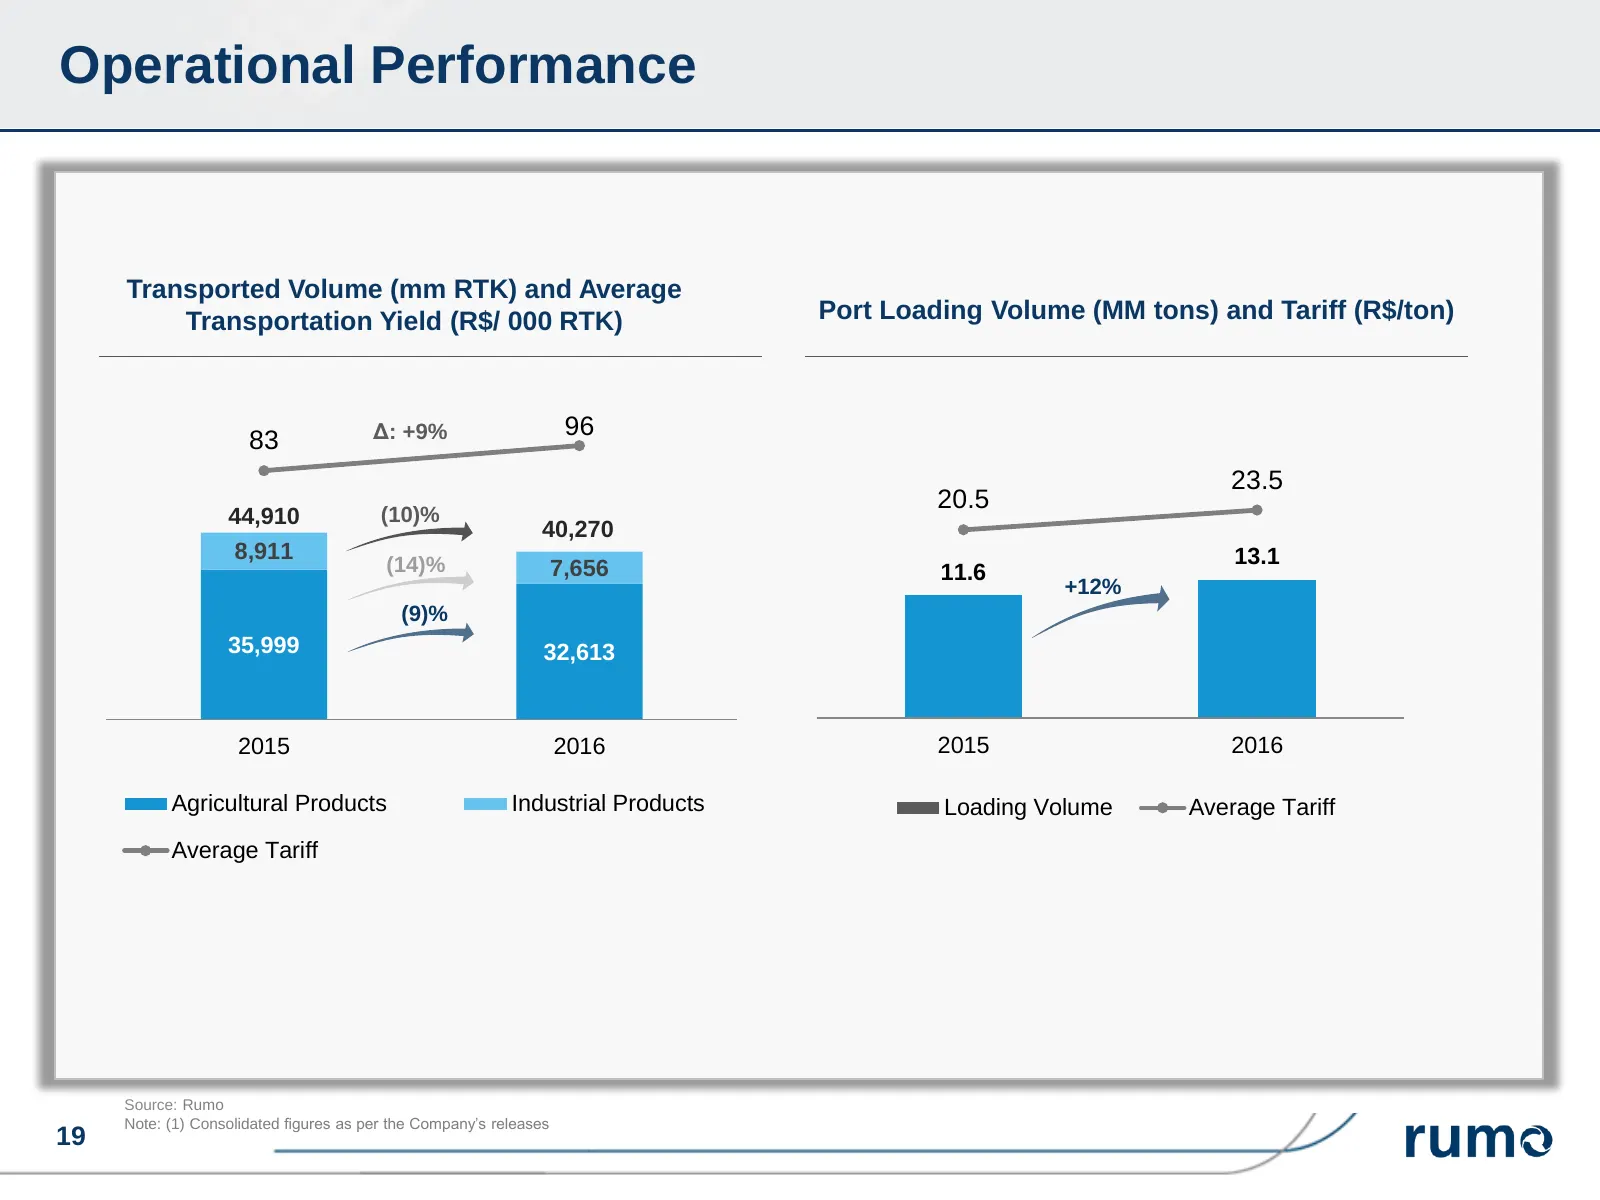
Operational Performance Transported Volume (mm RTK) and Average Transportation Yield (R$/ 000 RTK) Port Loading Volume (MM tons) and Tariff (R$/ton) Δ: +9% 96 83 23.5 20.5 44,910 (10)% 40,270 8,911 13.1 (14)% 7,656 11.6 +12% (9)% 35,999 32,613 2015 2016 2015 2016 Agricultural Products Industrial Pro
Slide 20: Consolidated Financial Performance
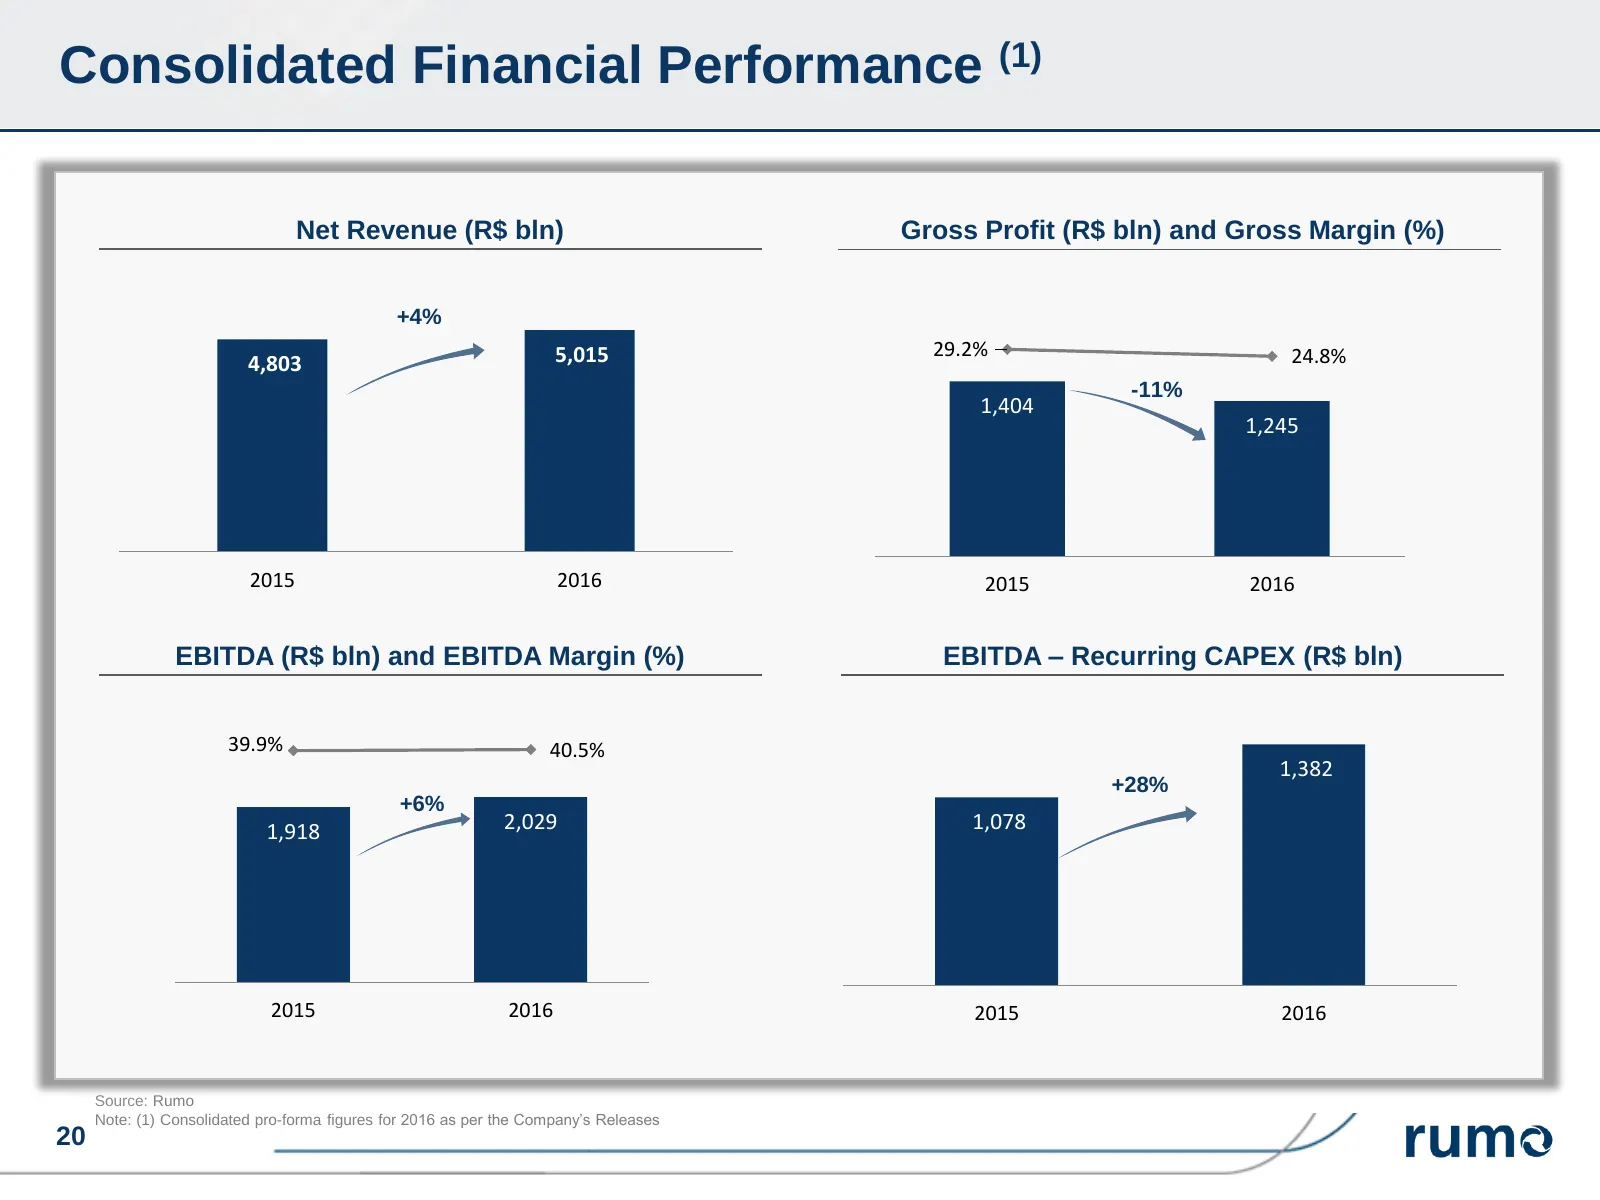
Consolidated Financial Performance (1) Net Revenue (R$ bln) Gross Profit (R$ bln) and Gross Margin (%) +4% 1800 40.0% 5,015 1600 29.2% 24.8% 4,803 20.0% 1400 -11% 1200 1,404 0.0% 1000 1,245 -20.0% 800 -40.0% 600 -60.0% 400 200 -80.0% 0 -100.0% 2015 2016 2015 2016 EBITDA (R$ bln) and EBITDA Margin (%
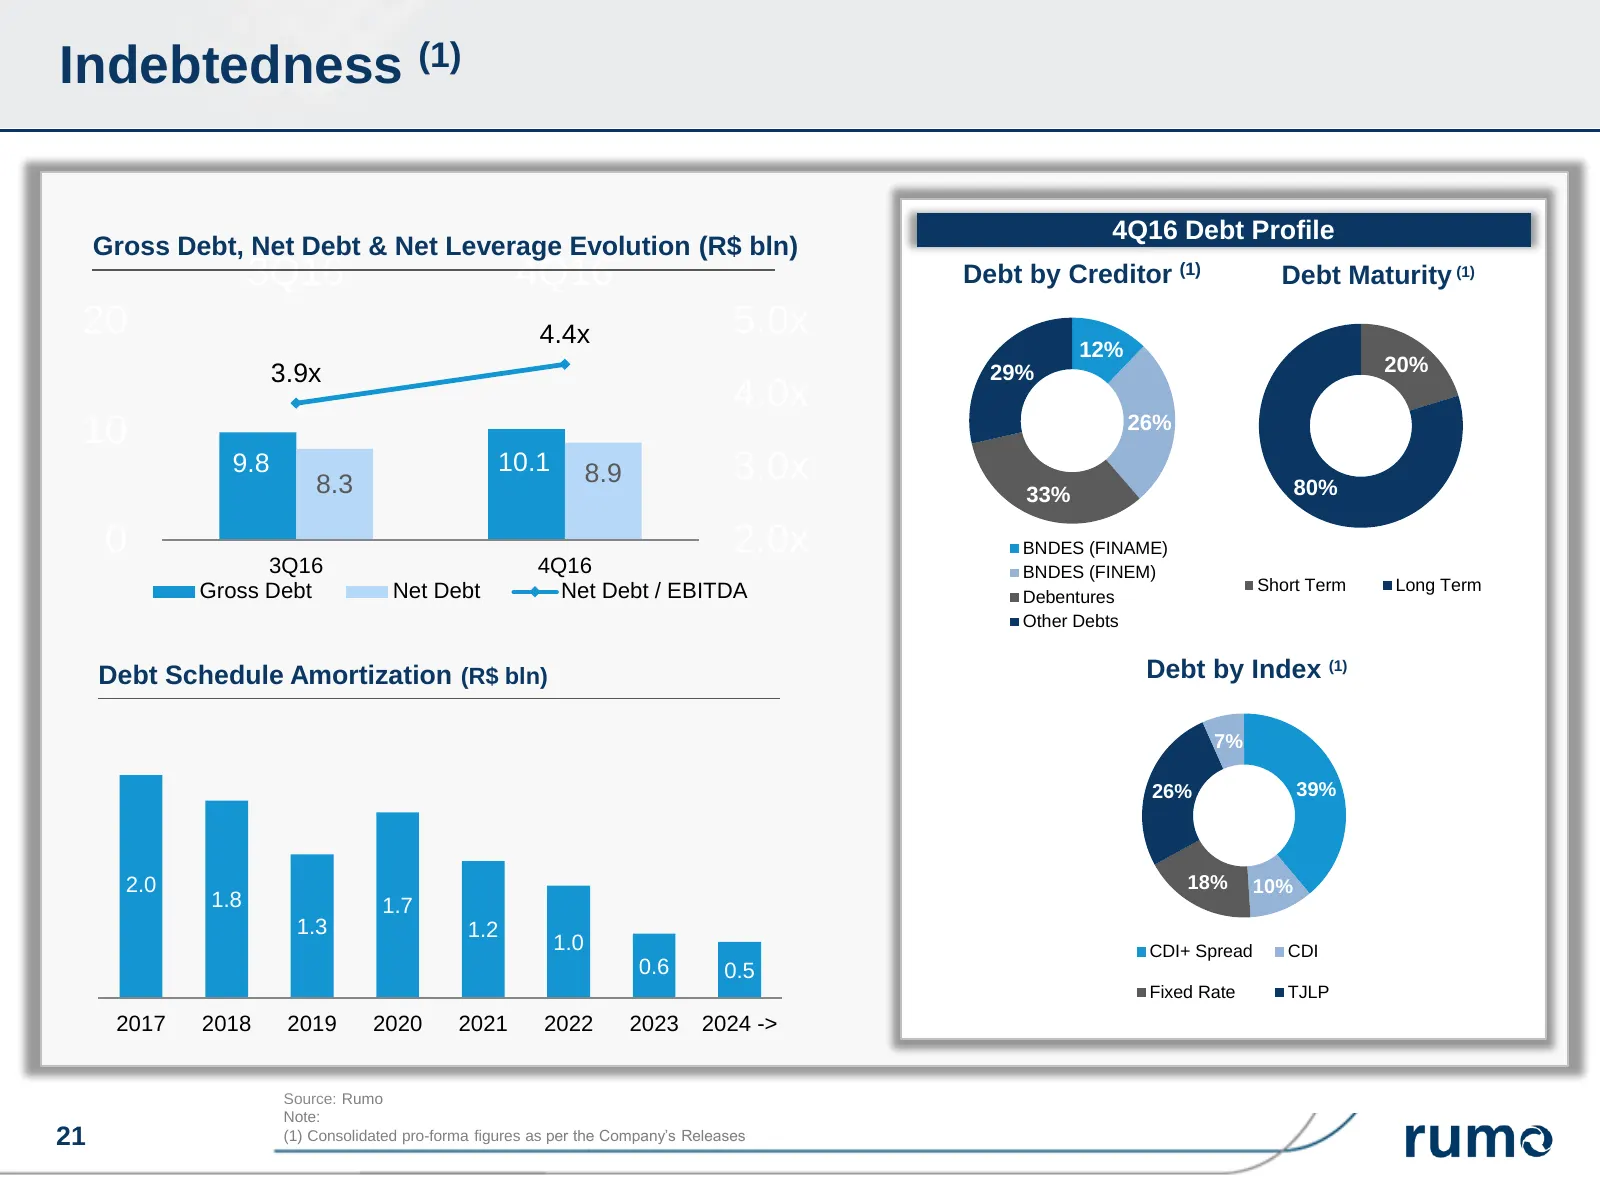
Slide 21: Indebtedness
Indebtedness (1) 4Q16 Debt Profile Gross Debt, Net Debt & Net Leverage Evolution (R$ bln) 3Q16 4Q16 Debt by Creditor (1) Debt Maturity (1) 20 4.4x 5.0x 12% 3.9x 29% 20% 4.0x 10 26% 9.8 8.3 10.1 8.9 3.0x 80% 33% 0 2.0x BNDES (FINAME) 3Q16 4Q16 BNDES (FINEM) Gross Debt Net Debt Net Debt / EBITDA Short
Slide 22: Agenda
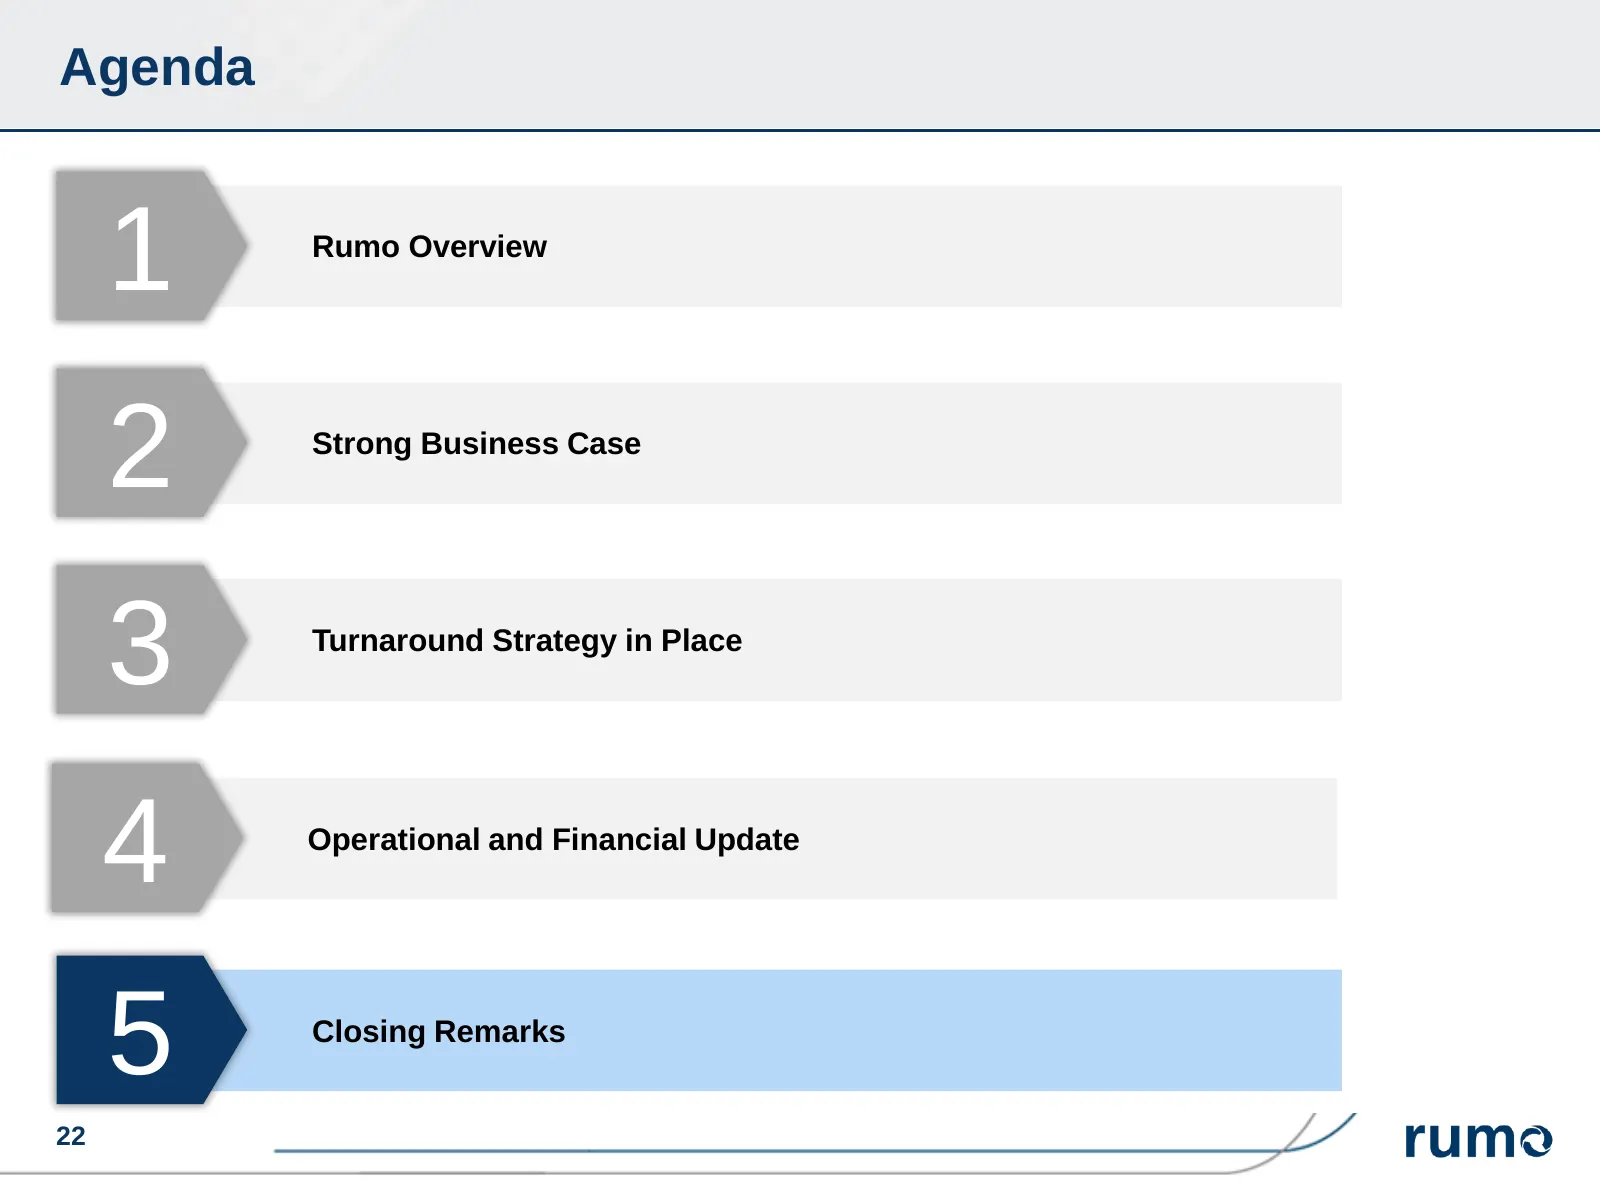
Agenda 1 Rumo Overview 2 Strong Business Case 3 Turnaround Strategy in Place 4 Operational and Financial Update 5 Closing Remarks 22
Slide 23: Investment Highlights
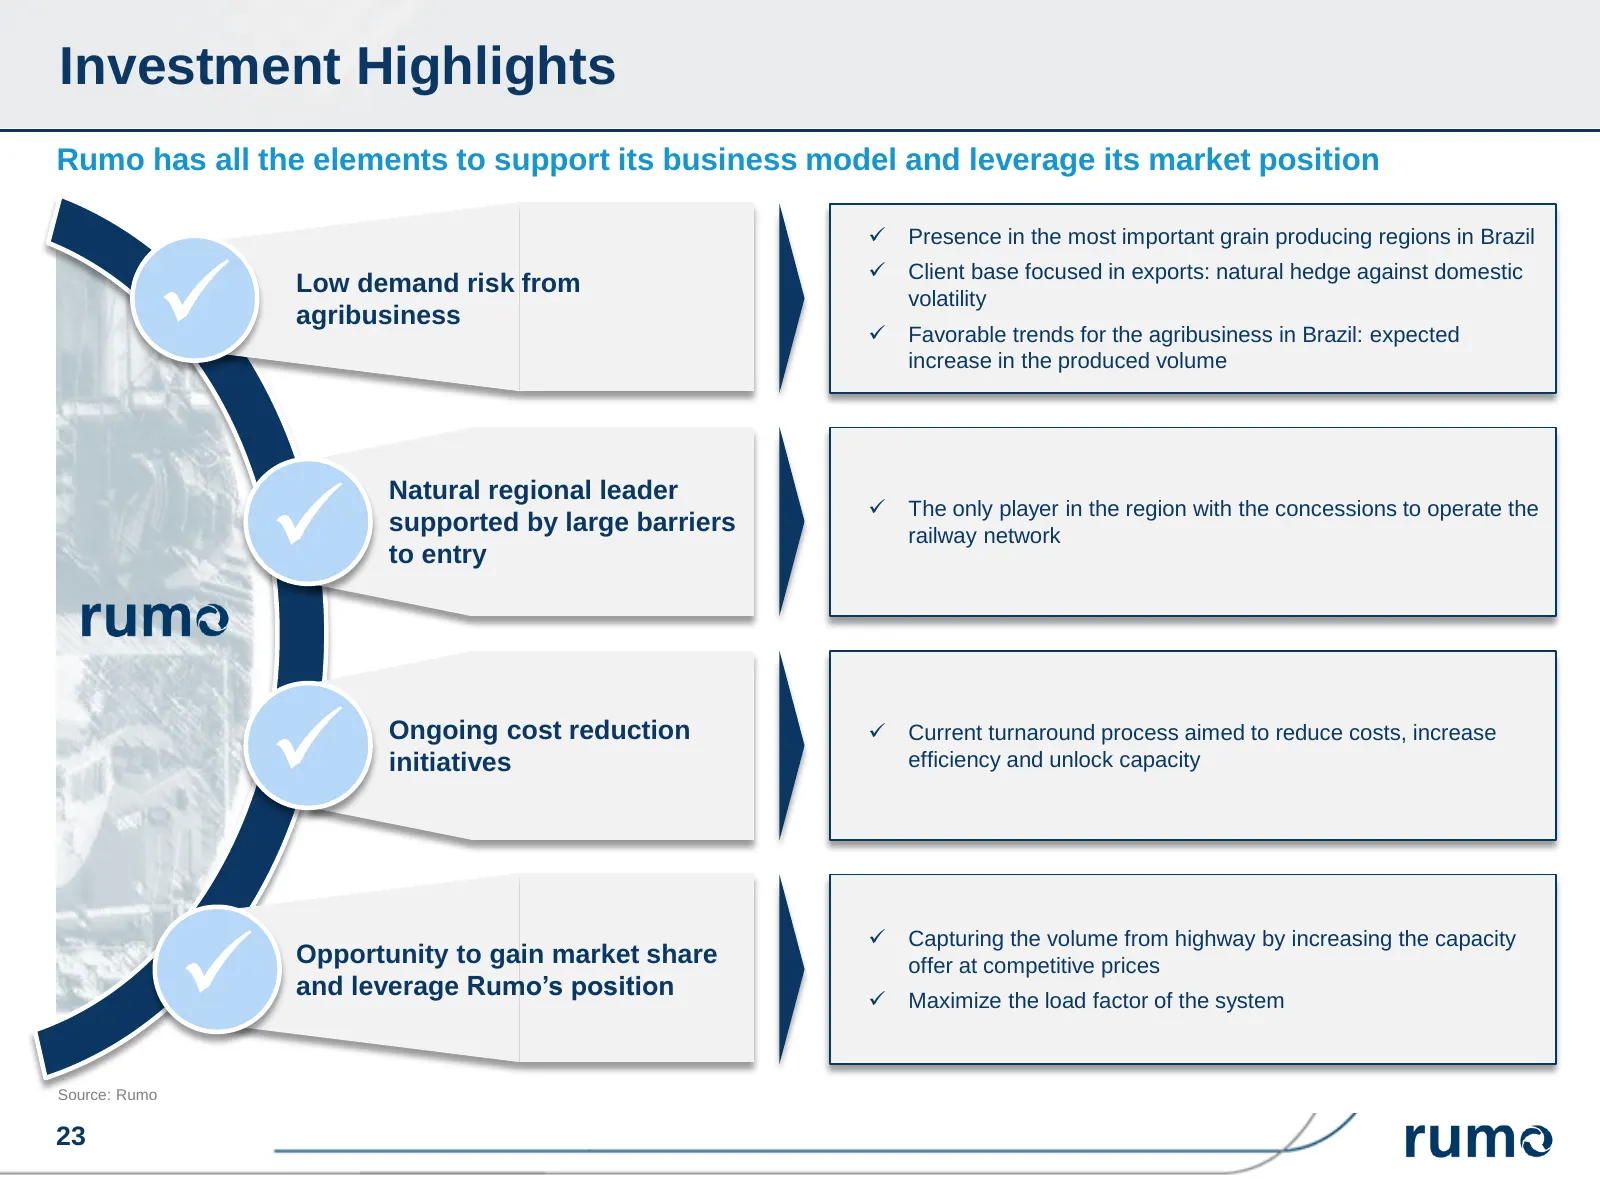
Investment Highlights Rumo has all the elements to support its business model and leverage its market position Presence in the most important grain producing regions in Brazil Client base focused in exports: natural hedge against domestic Low demand risk from volatility agribusiness Favorabl
Source: Internet Archive copy of ri.rumolog.com
More decks from Rumo SA
 Q2 2026 Earnings Presentation14 slides · Aug 13, 2026
 Q4 2025 Earnings Presentation15 slides · Mar 5, 2026
 Q3 2025 Earnings Presentation15 slides · Nov 17, 2025
 Investor Presentation (October 2017)26 slides · October 2017
 Investor Presentation (August 2017)27 slides · August 2017
 Investor Presentation (March 2017)24 slides · March 2017