Southern Union — Morgan Stanley Corporate Access Day (March 2010)
32 slides from Southern Union's conference presentation, Mar 16, 2010
Slide 1: Morgan Stanley Corporate Access Day
Morgan Stanley Corporate Access Day March 16, 2010 www.sug.com
Slide 2: Forward-Looking Statements
Forward-Looking Statements Statements contained in this presentation that include company expectations or predictions of the future are forward-looking statements intended to be covered by the safe harbor provisions of the Securities Act of 1933 and the Securities Exchange Act of 1934. It is importa
Slide 3: Company Overview
Company Overview • Focus on natural gas infrastructure – Attractive industry outlook – Natural gas is key to America’s energy future – High-quality assets with diverse supply and strong markets • Principally regulated asset base – Provides earnings and cash flow stability through long-term contracts
Slide 4: Map of Operations
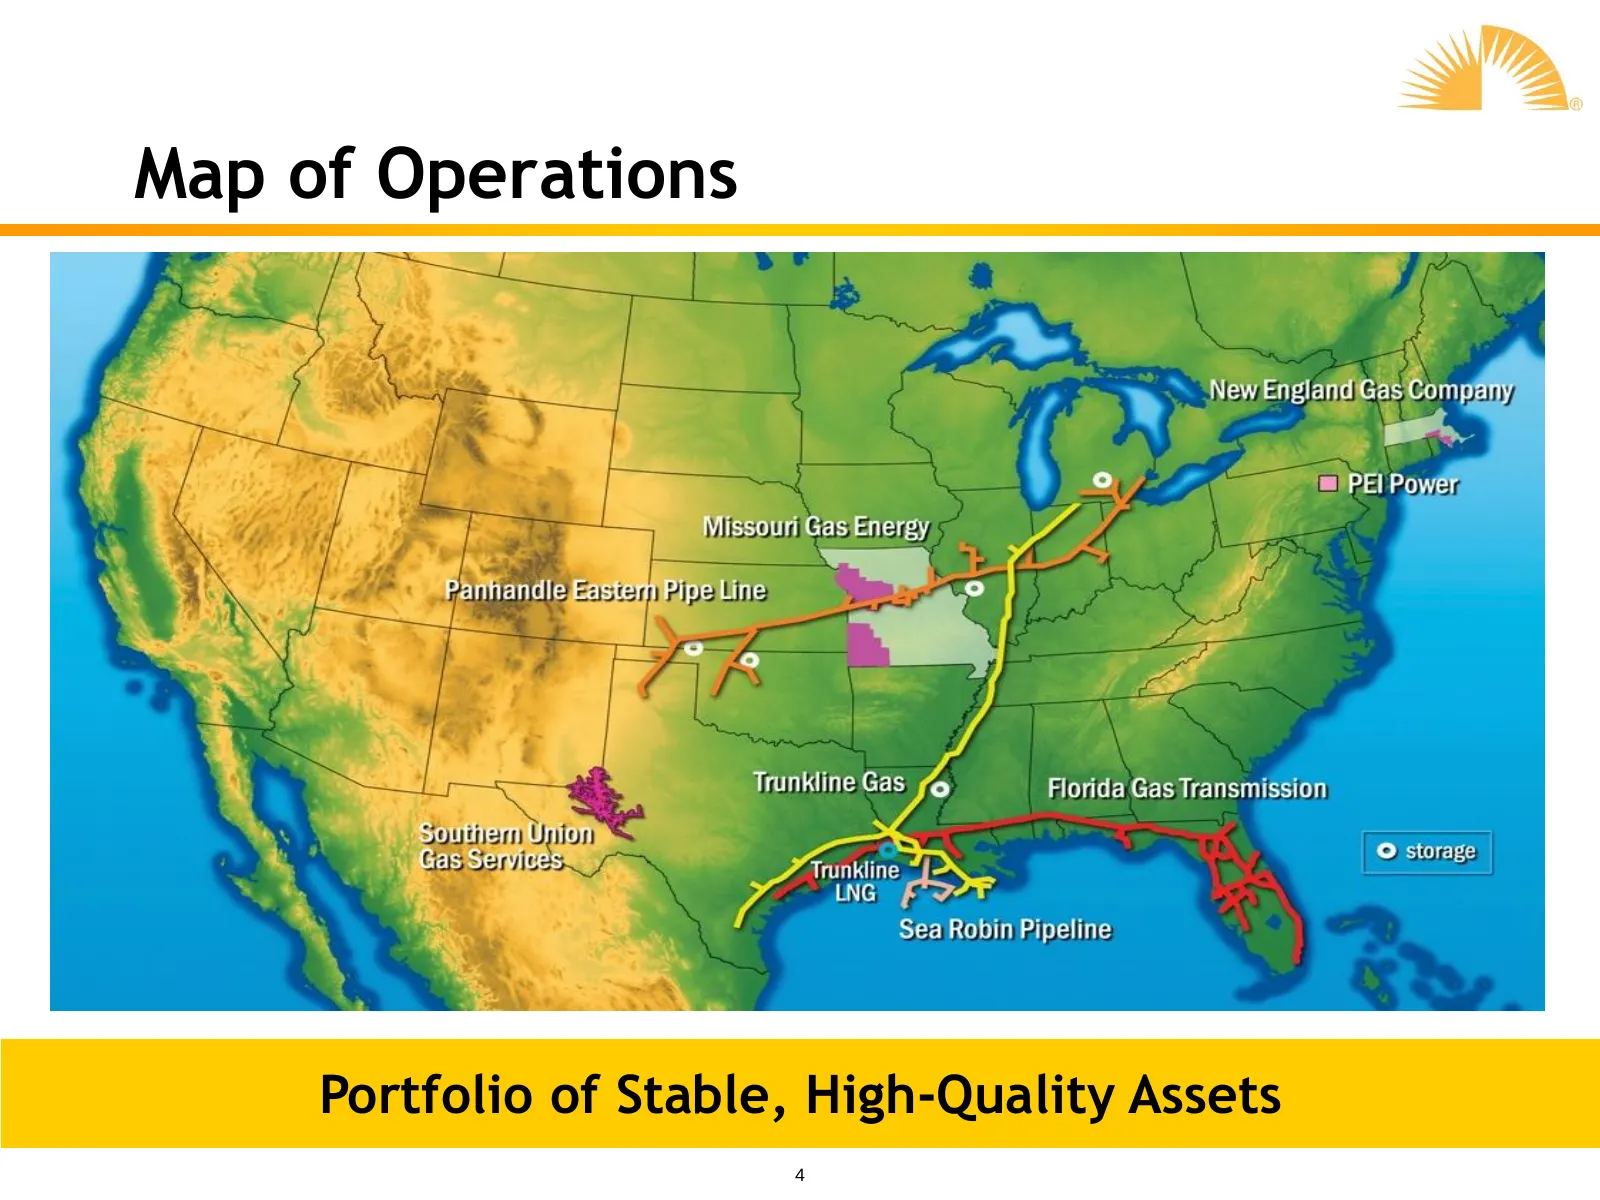
Map of Operations Portfolio of Stable, High-Quality Assets 4
Slide 5: Company Facts
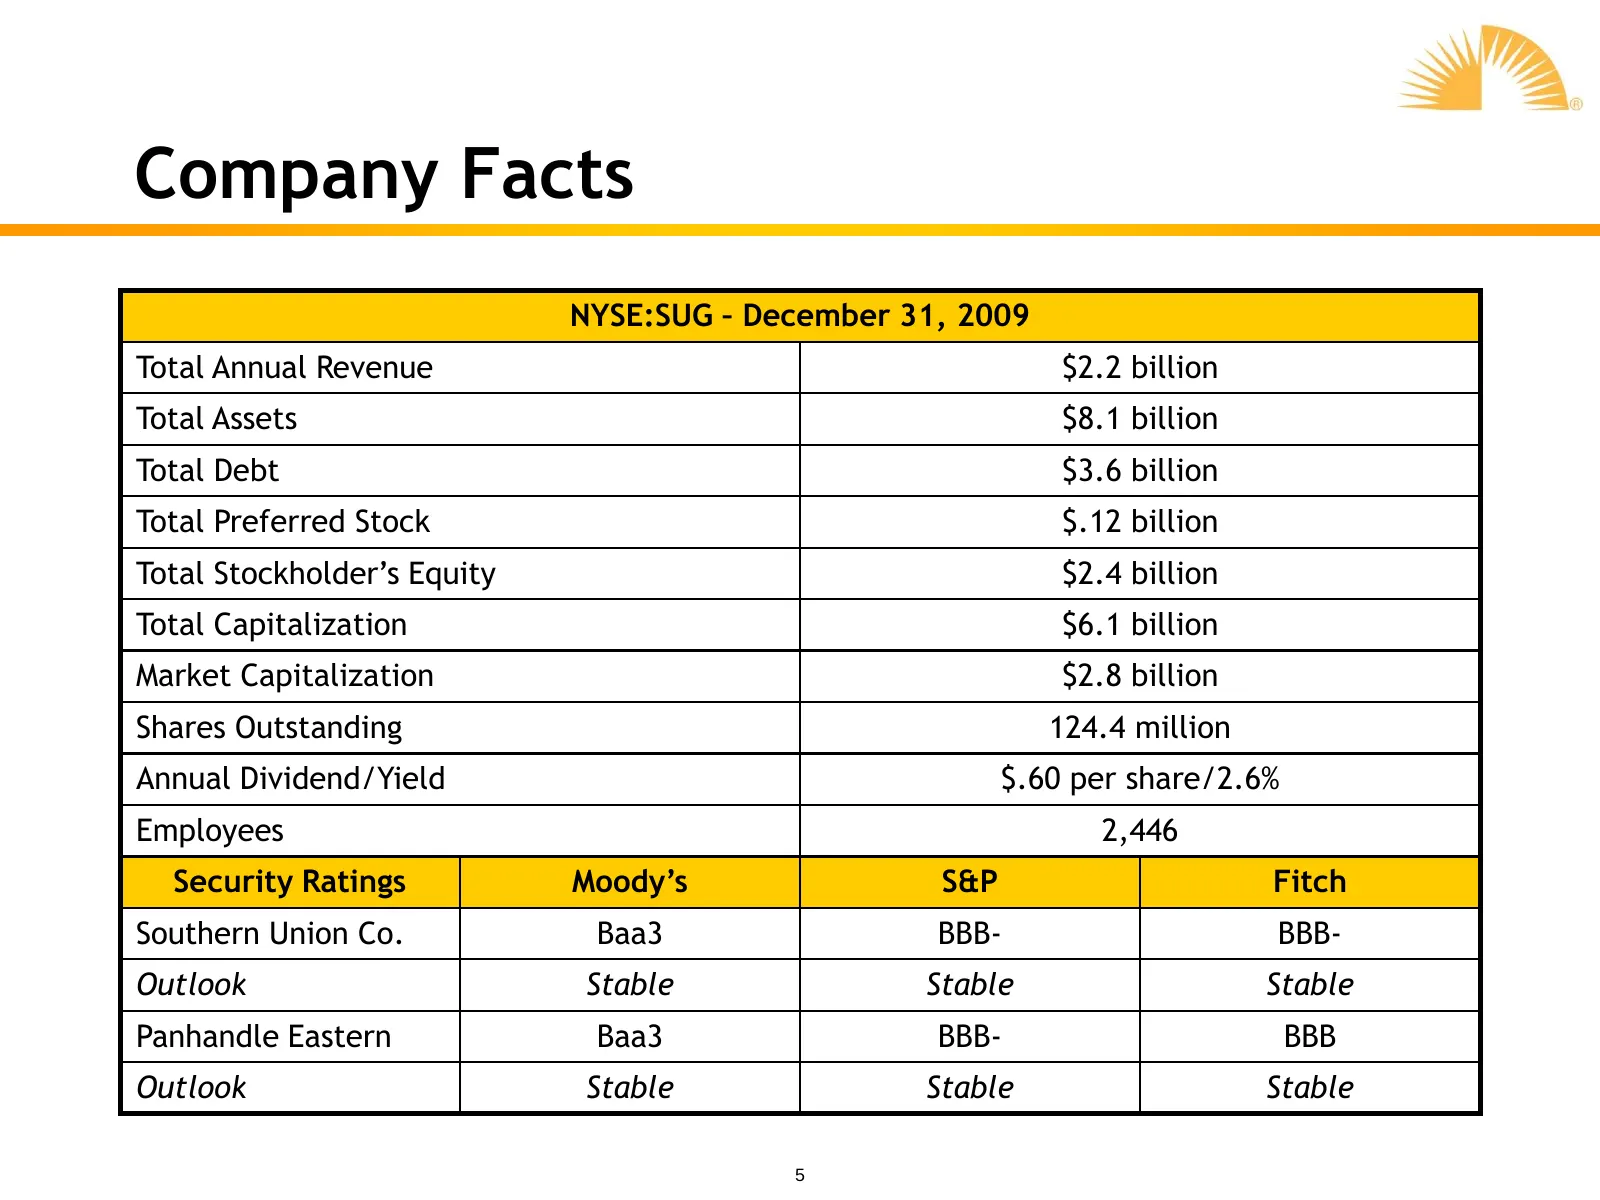
Company Facts NYSE:SUG – December 31, 2009 Total Annual Revenue $2.2 billion Total Assets $8.1 billion Total Debt $3.6 billion Total Preferred Stock $.12 billion Total Stockholder’s Equity $2.4 billion Total Capitalization $6.1 billion Market Capitalization $2.8 billion Shares Outstanding 124.4 mill
Slide 6: Transportation & Storage
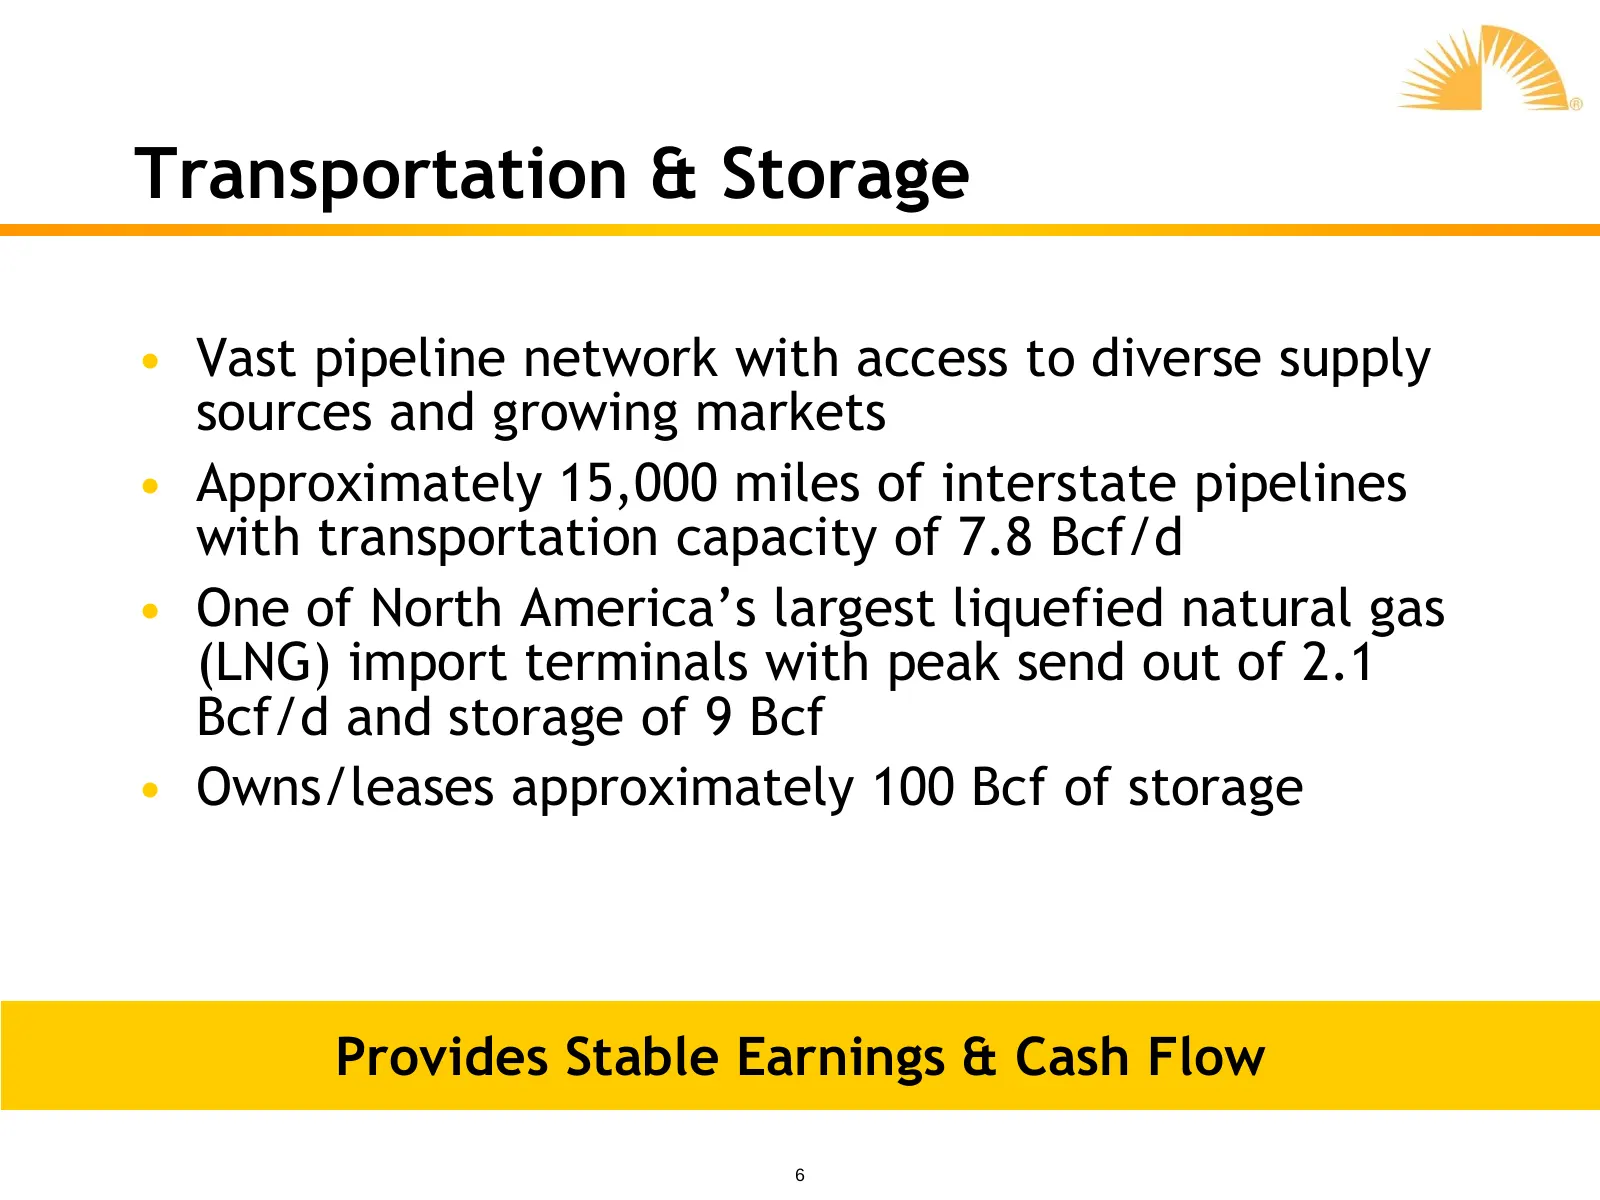
Transportation & Storage • Vast pipeline network with access to diverse supply sources and growing markets • Approximately 15,000 miles of interstate pipelines with transportation capacity of 7.8 Bcf/d • One of North America’s largest liquefied natural gas (LNG) import terminals with peak send out o
Slide 7: Transportation & Storage Assets
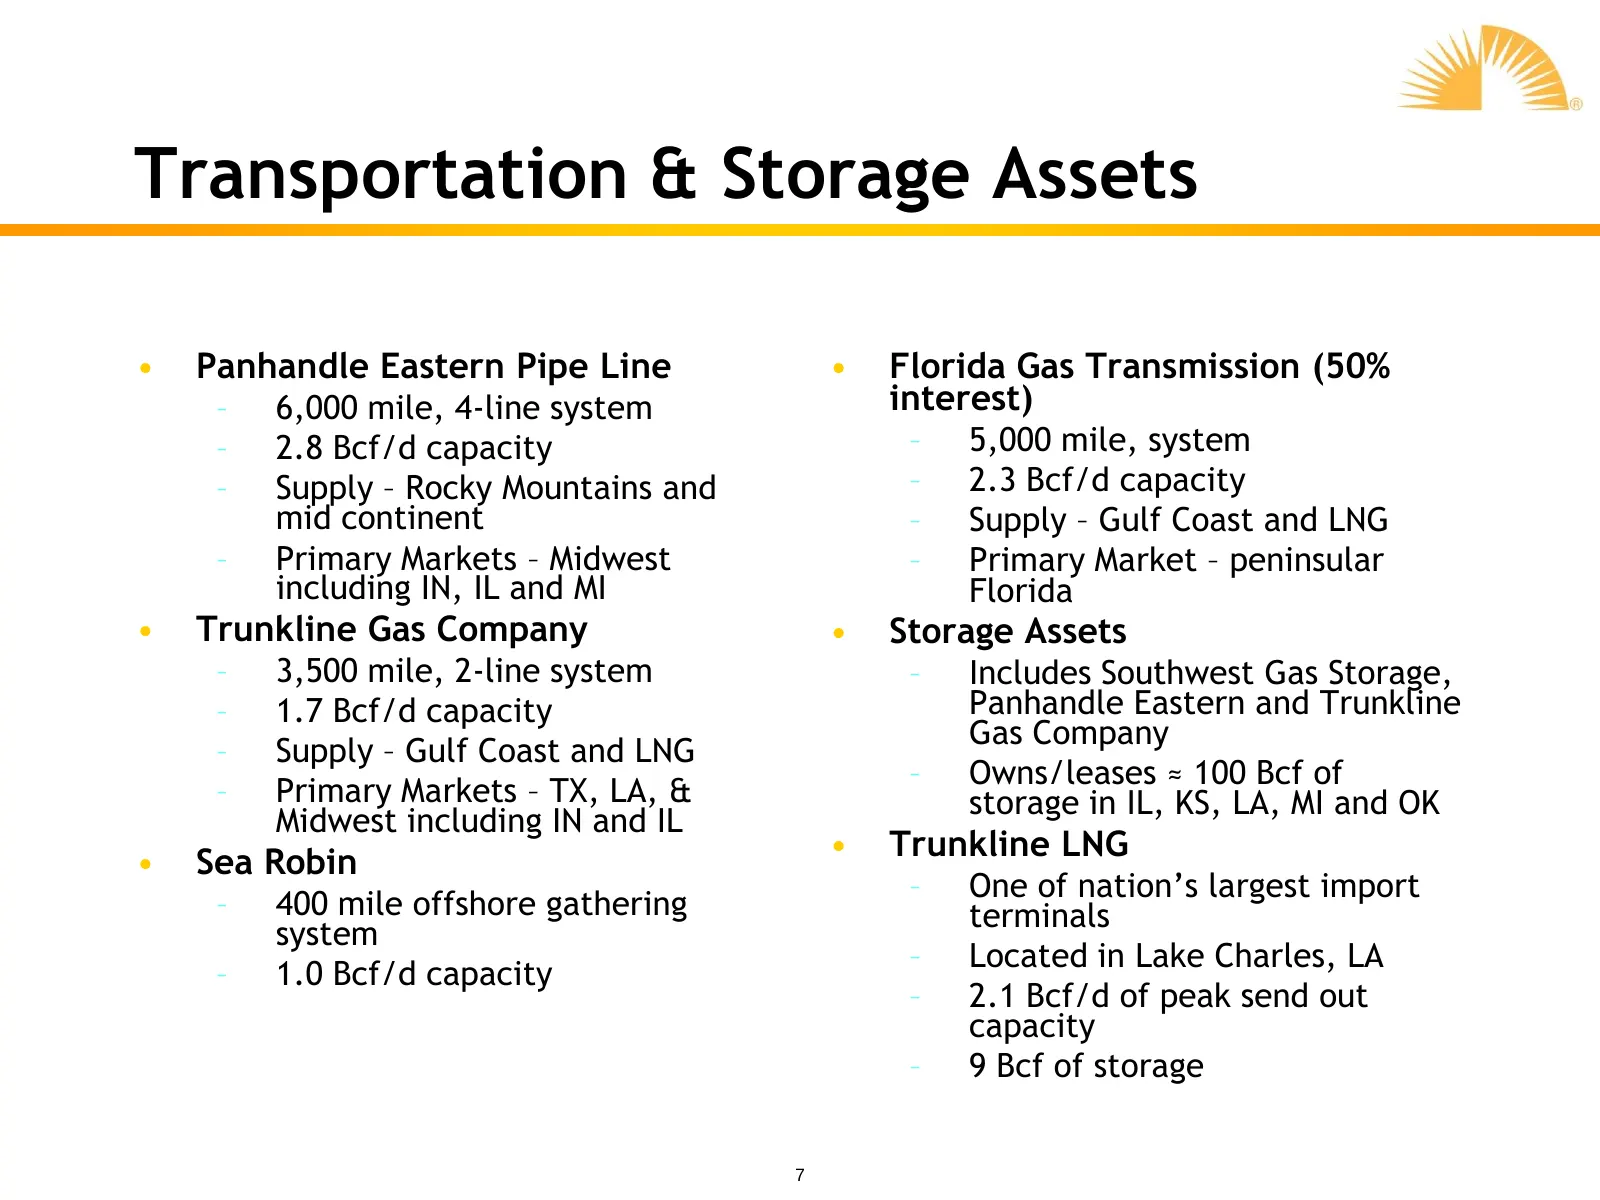
Transportation & Storage Assets • Panhandle Eastern Pipe Line • Florida Gas Transmission (50% – 6,000 mile, 4-line system interest) – 2.8 Bcf/d capacity – 5,000 mile, system – Supply – Rocky Mountains and – 2.3 Bcf/d capacity mid continent – Supply – Gulf Coast and LNG – Primary Markets – Midwest –
Slide 8: Trunkline LNG: Infrastructure Enhancement Project
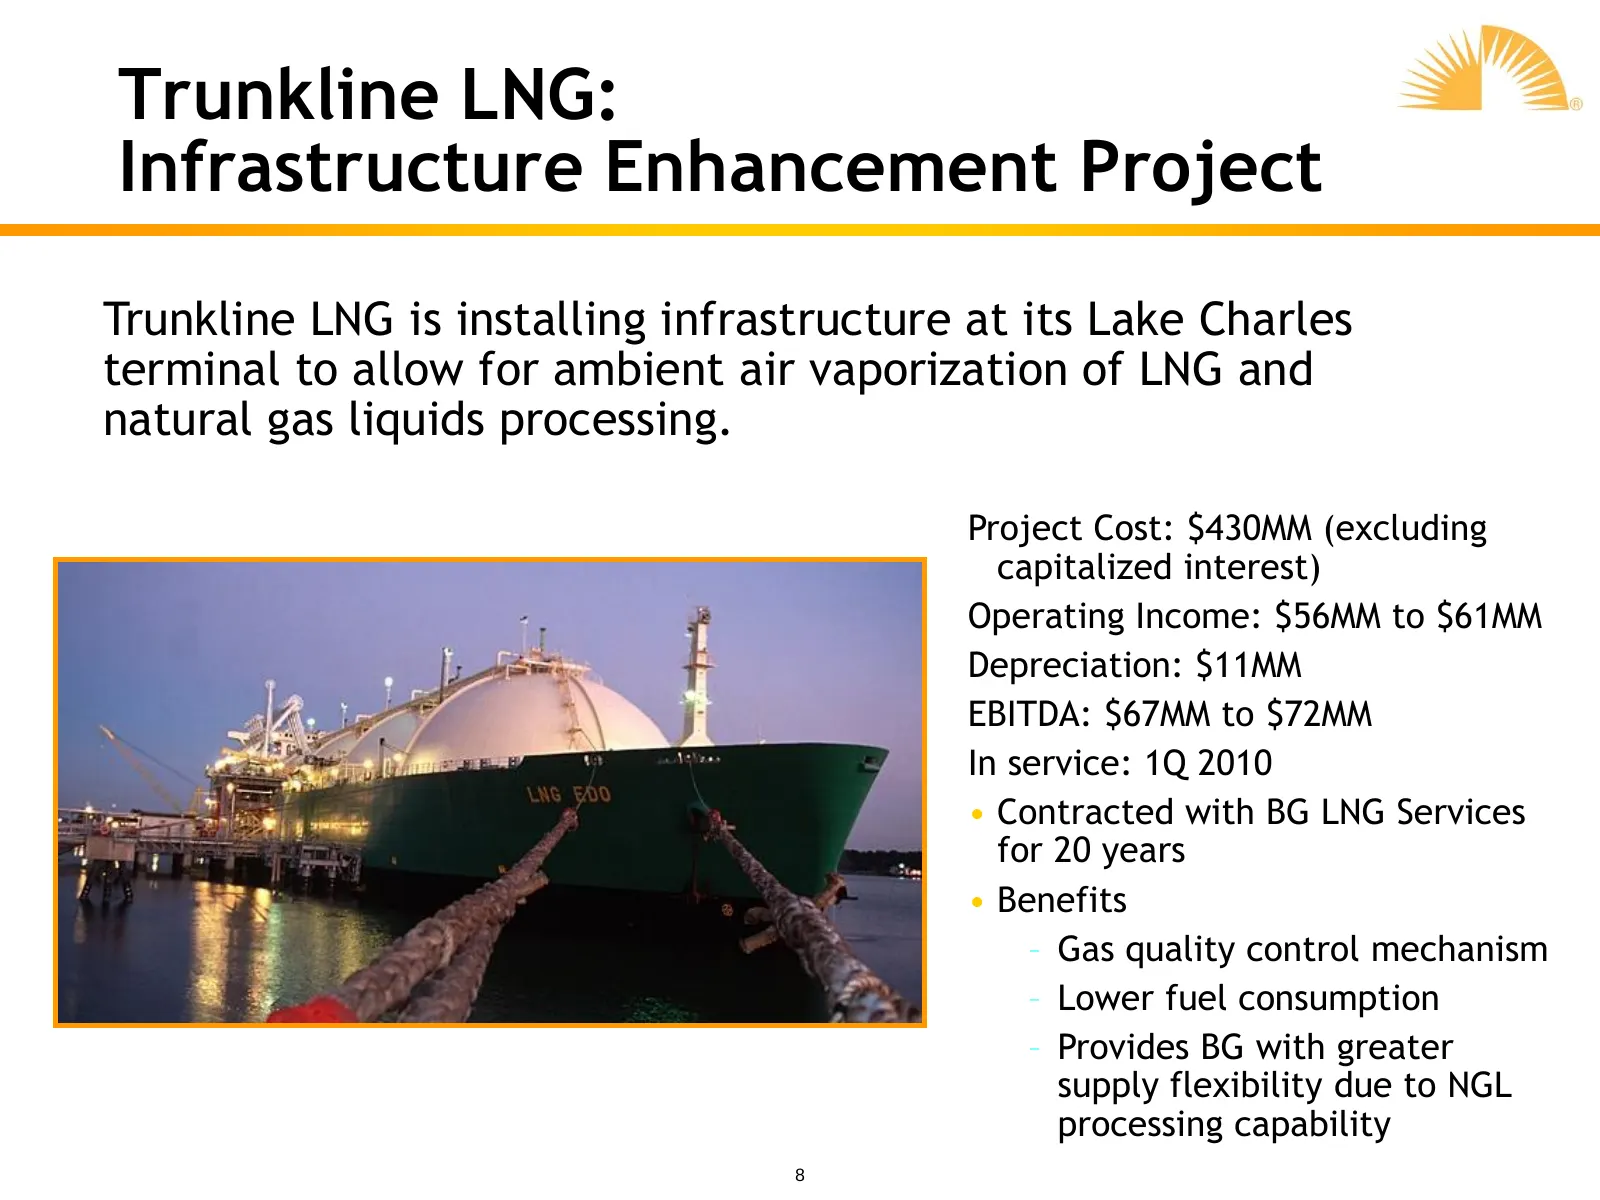
Trunkline LNG: Infrastructure Enhancement Project Trunkline LNG is installing infrastructure at its Lake Charles terminal to allow for ambient air vaporization of LNG and natural gas liquids processing. Project Cost: $430MM (excluding capitalized interest) Operating Income: $56MM to $61MM Depreciati
Slide 9: FGT Phase VIII Expansion
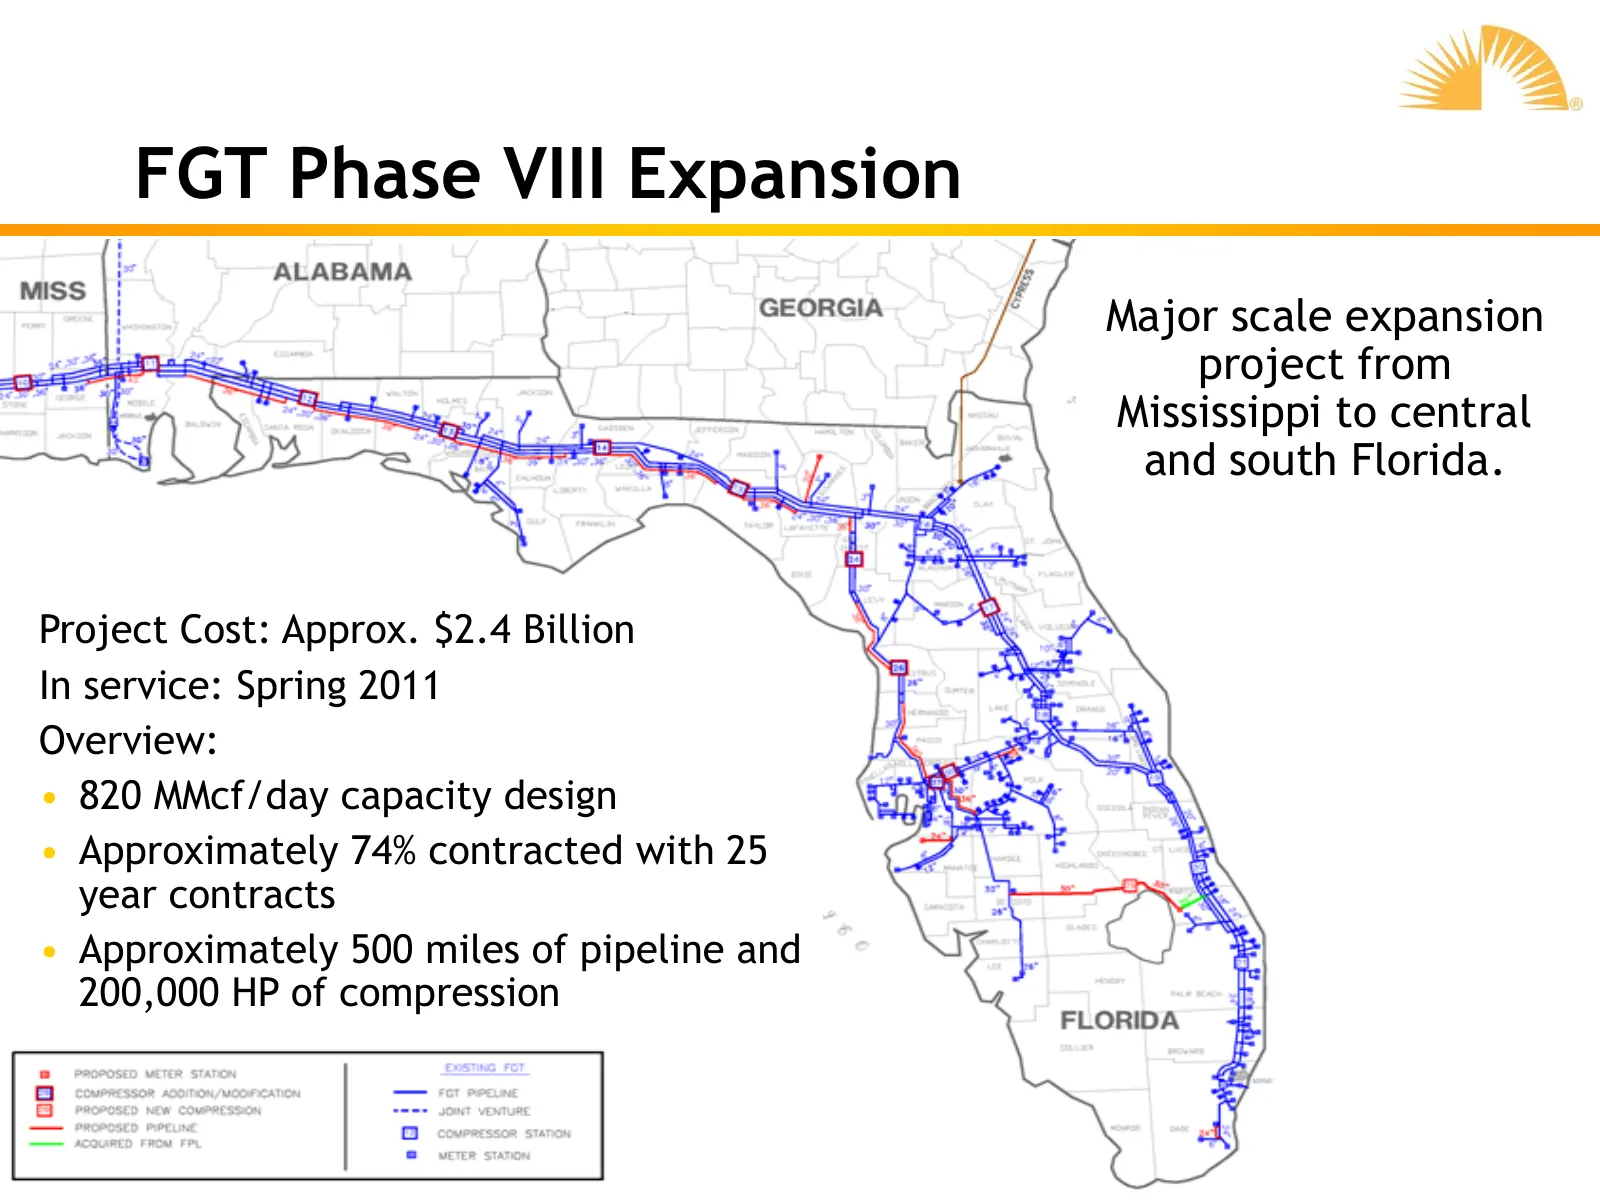
FGT Phase VIII Expansion Major scale expansion project from Mississippi to central and south Florida. Project Cost: Approx. $2.4 Billion In service: Spring 2011 Overview: • 820 MMcf/day capacity design • Approximately 74% contracted with 25 year contracts • Approximately 500 miles of pipeline and 20
Slide 10: FGT Phase VIII Expansion Timeline
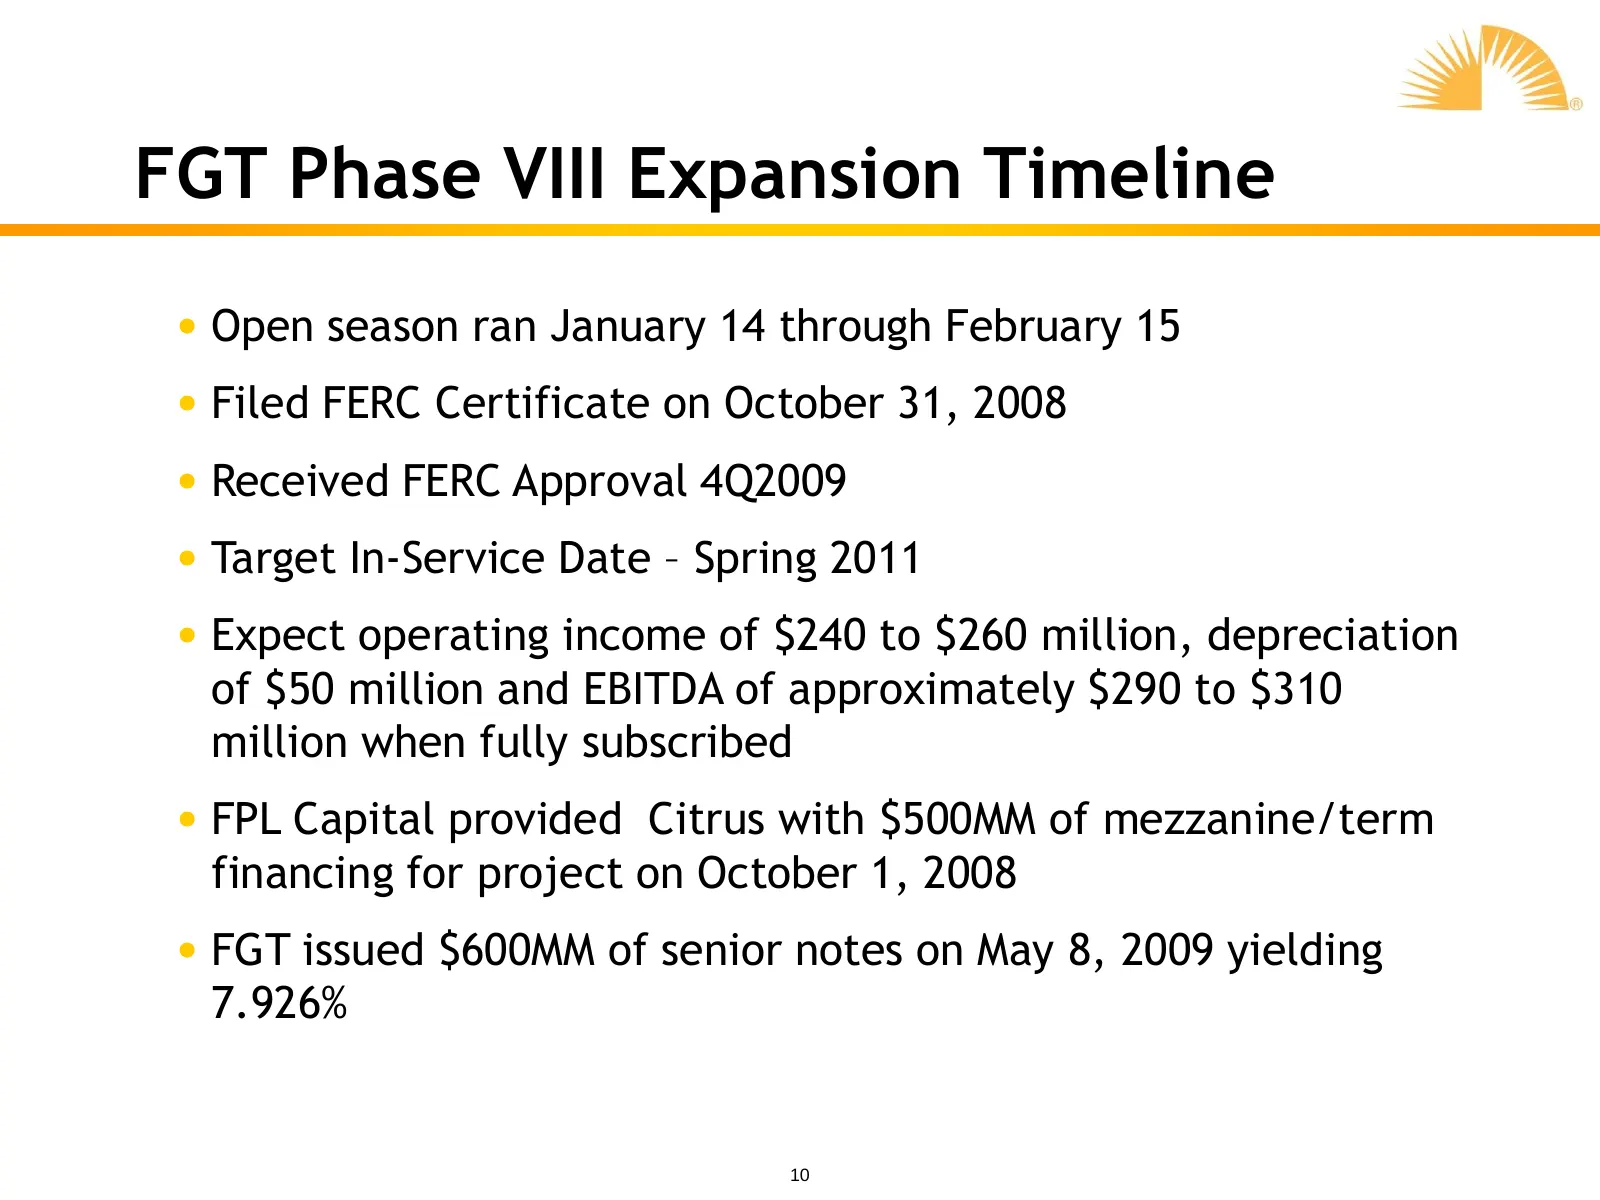
FGT Phase VIII Expansion Timeline • Open season ran January 14 through February 15 • Filed FERC Certificate on October 31, 2008 • Received FERC Approval 4Q2009 • Target In-Service Date – Spring 2011 • Expect operating income of $240 to $260 million, depreciation of $50 million and EBITDA of approxim
Slide 11: FGT Pascagoula Lateral
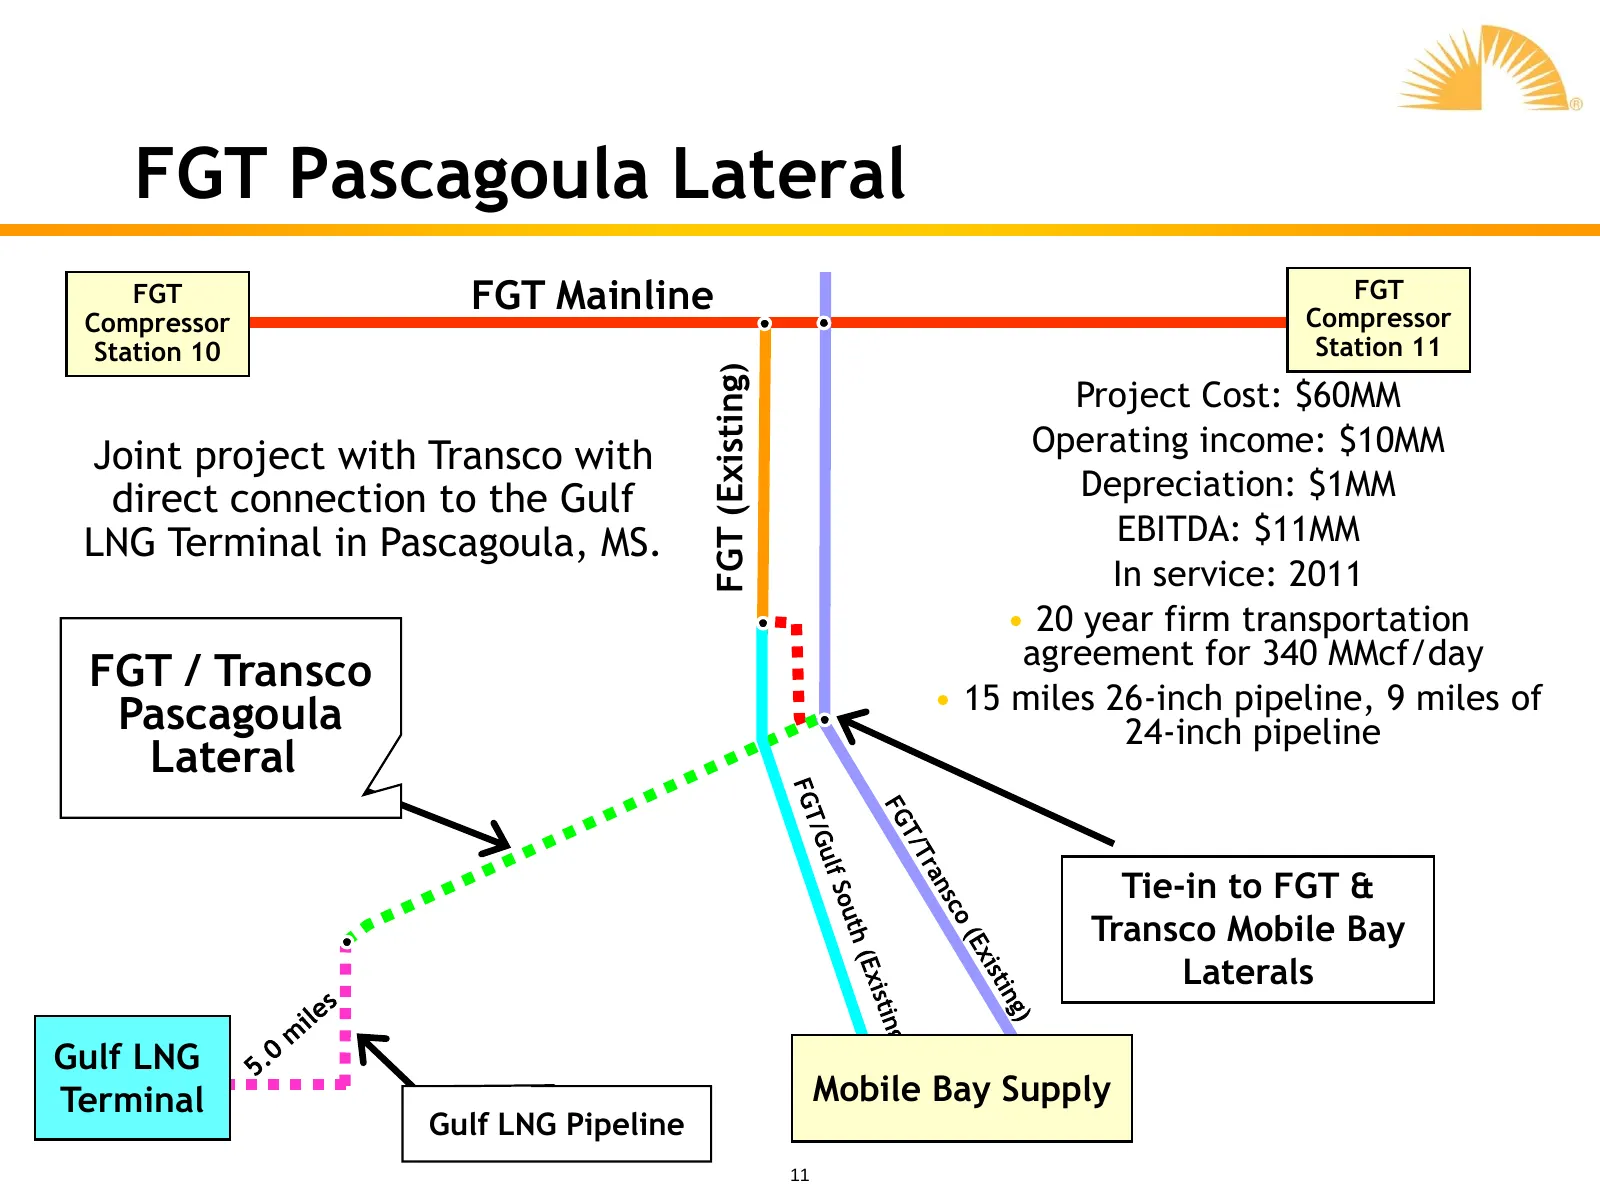
FGT Pascagoula Lateral FGT FGT Mainline FGT Compressor Compressor Station 10 Station 11 FGT (Existing) Project Cost: $60MM Joint project with Transco with Operating income: $10MM direct connection to the Gulf Depreciation: $1MM LNG Terminal in Pascagoula, MS. EBITDA: $11MM In service: 2011 • 20 year
Slide 12: Gathering & Processing
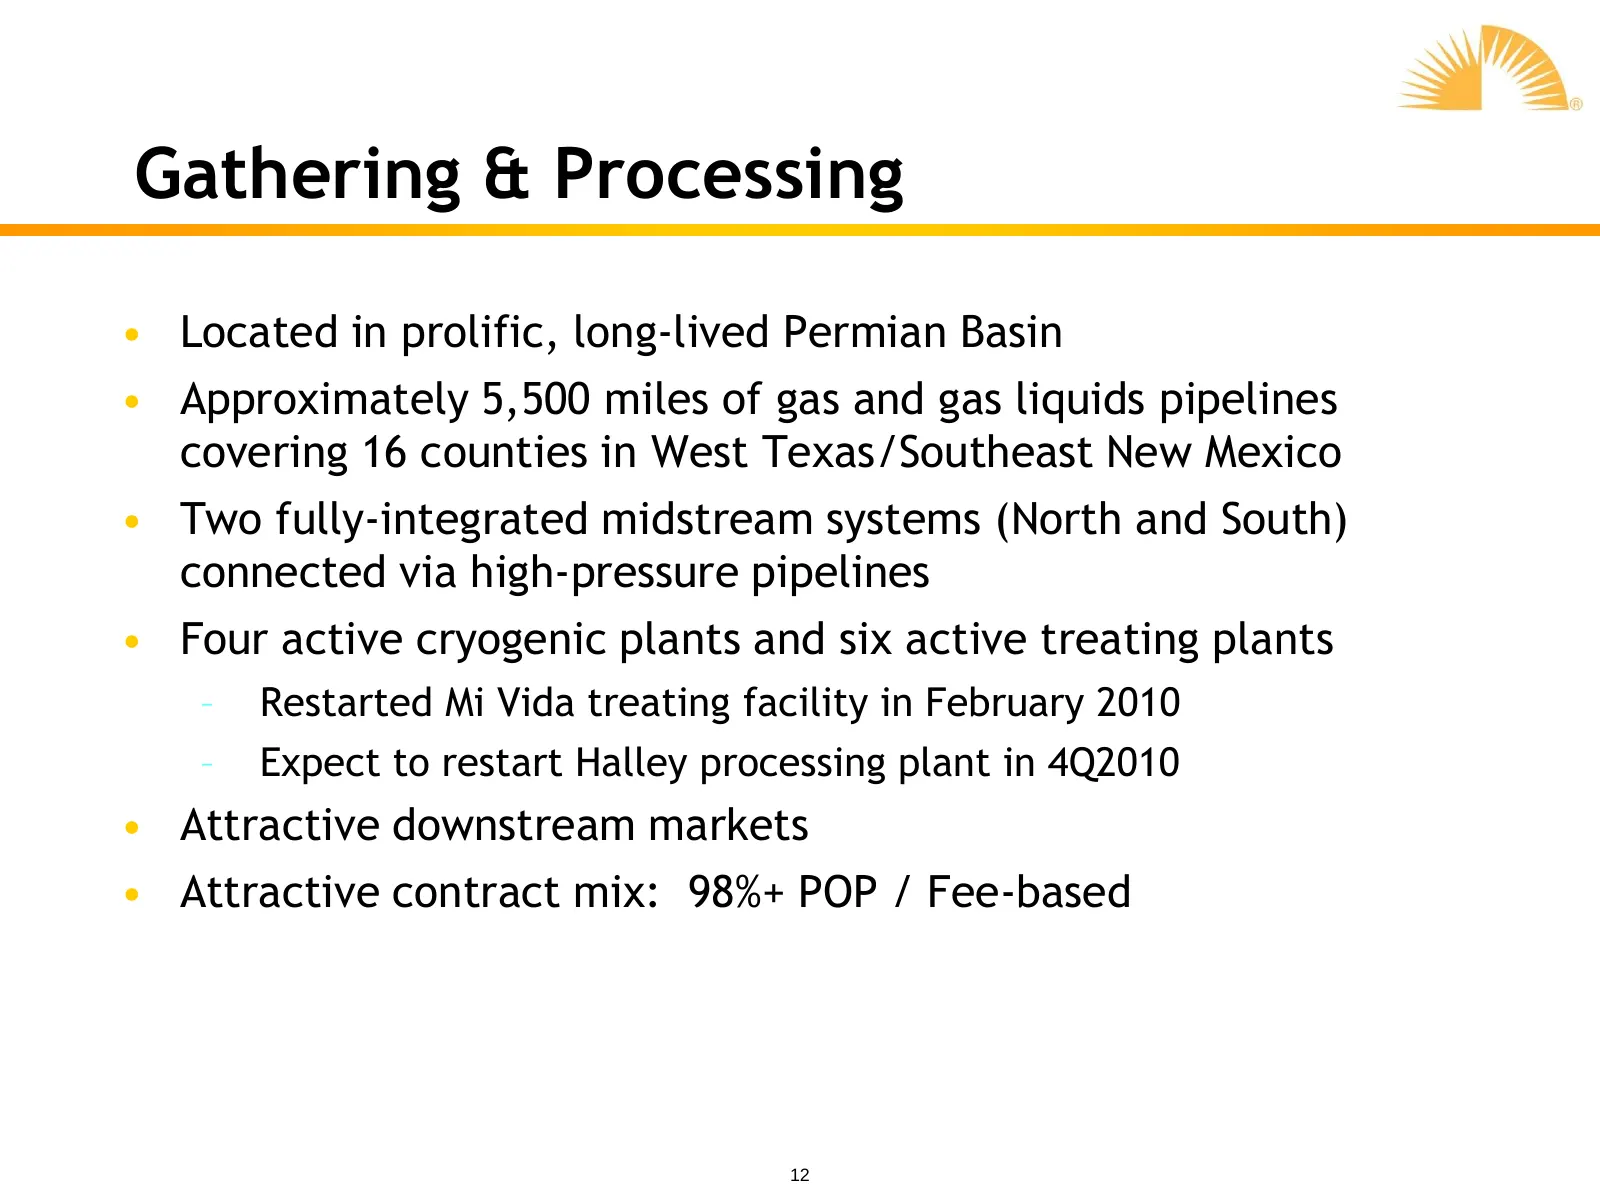
Gathering & Processing • Located in prolific, long-lived Permian Basin • Approximately 5,500 miles of gas and gas liquids pipelines covering 16 counties in West Texas/Southeast New Mexico • Two fully-integrated midstream systems (North and South) connected via high-pressure pipelines • Four active c
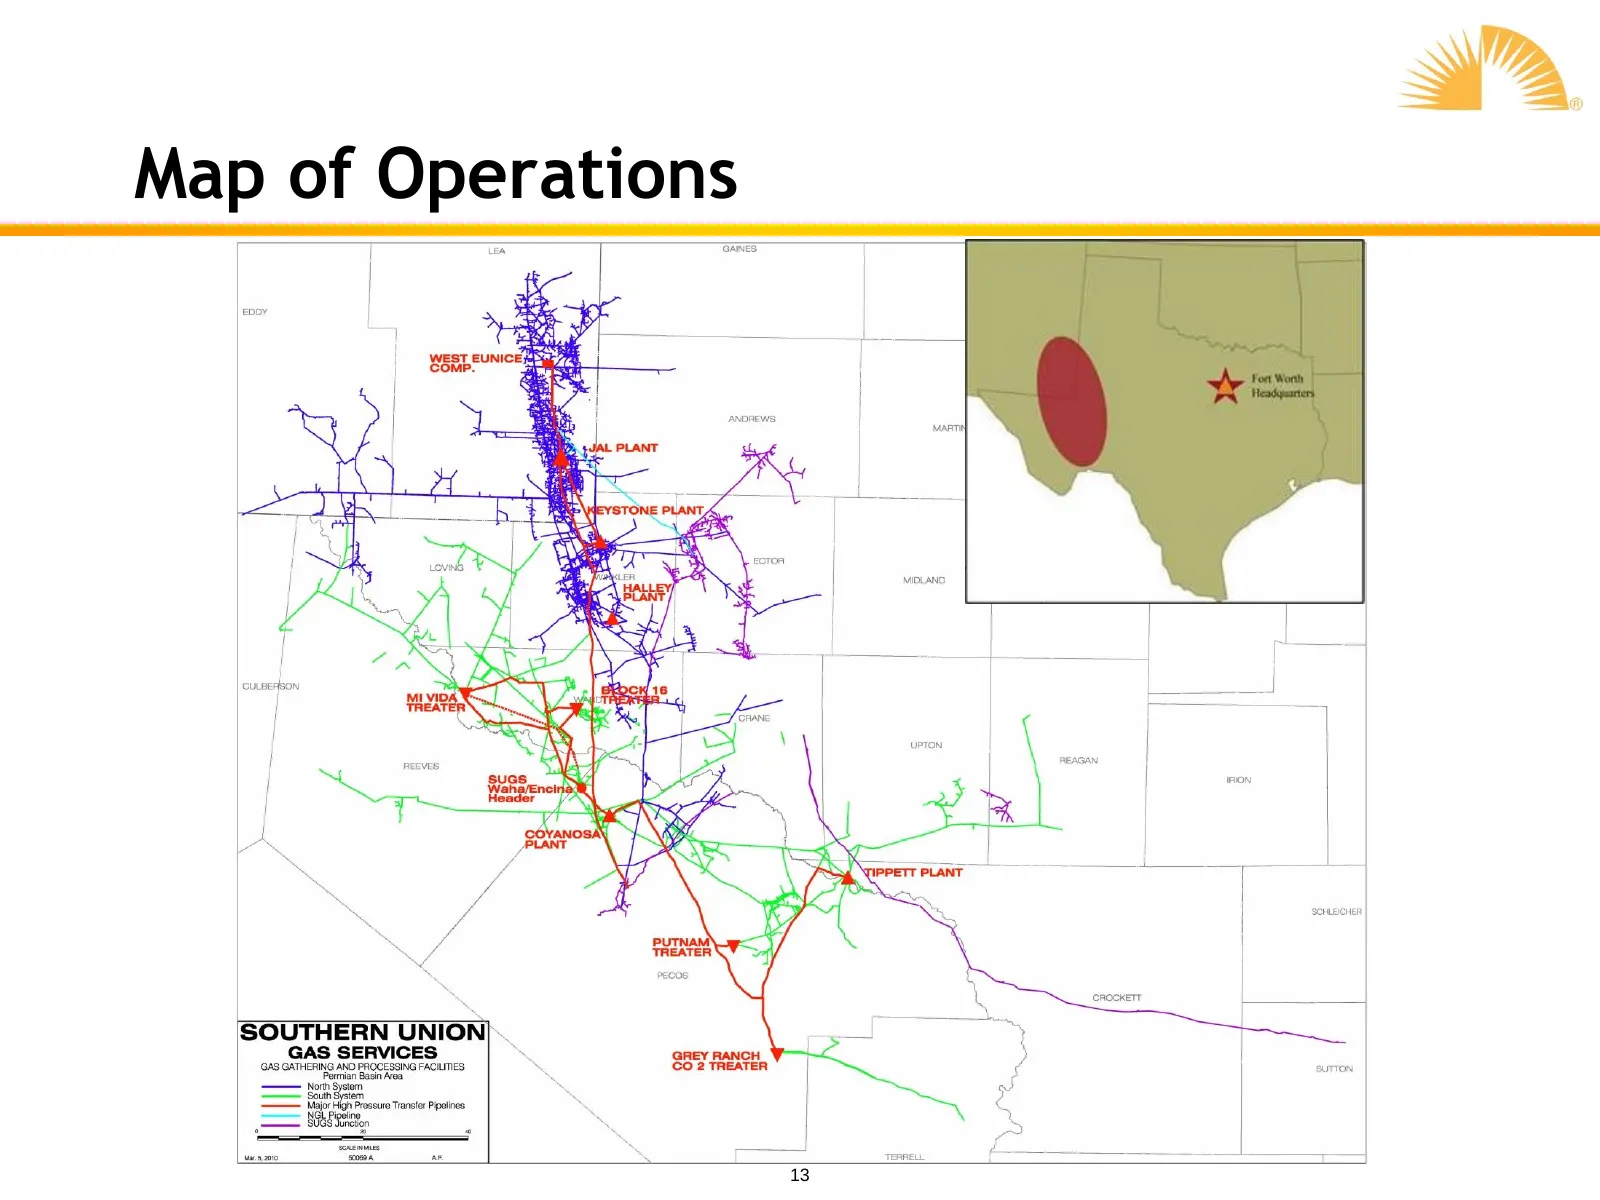
Slide 13: Map of Operations
Map of Operations = Canes | | \, cRocKETT || SOUTHERN UNION]. ae ; GAS SERVICES a Sy. / | os CES \ S62 Taearen ie surron : 5S * ¢ = a om TERREL a — 13
Slide 14: North System
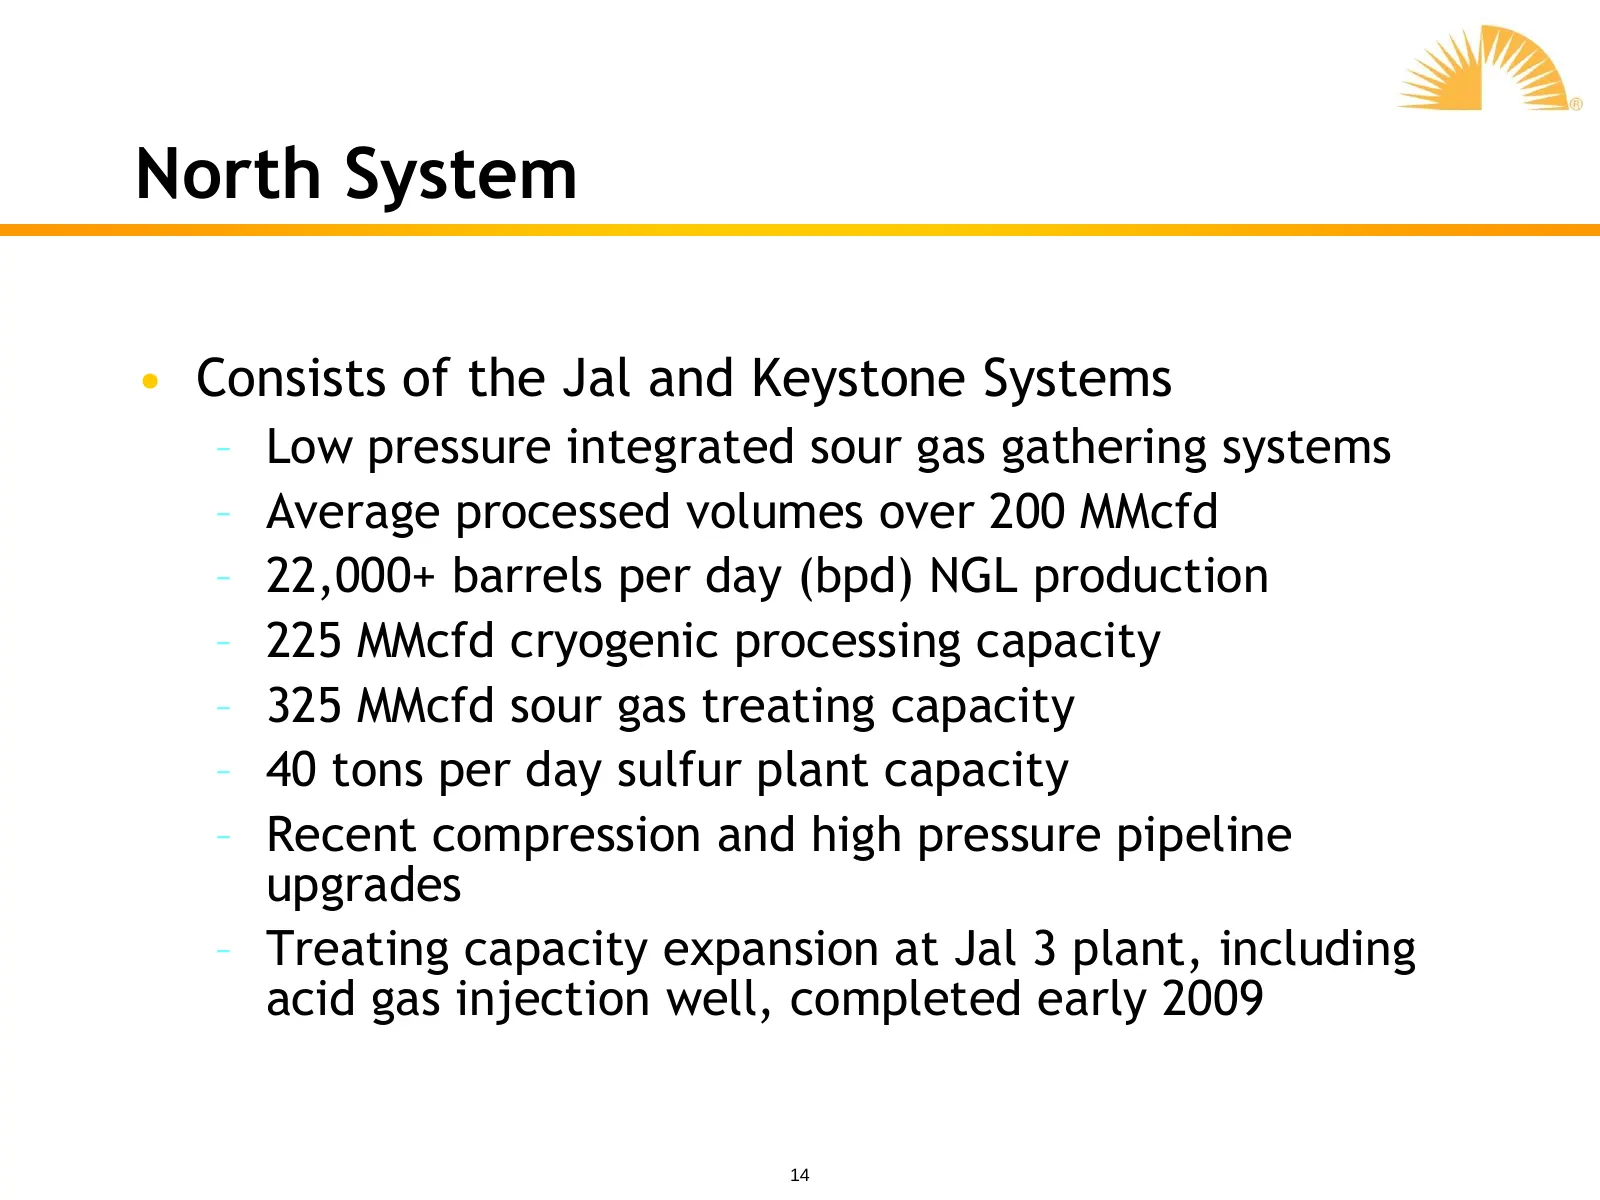
North System • Consists of the Jal and Keystone Systems – Low pressure integrated sour gas gathering systems – Average processed volumes over 200 MMcfd – 22,000+ barrels per day (bpd) NGL production – 225 MMcfd cryogenic processing capacity – 325 MMcfd sour gas treating capacity – 40 tons per day su
Slide 15: South System
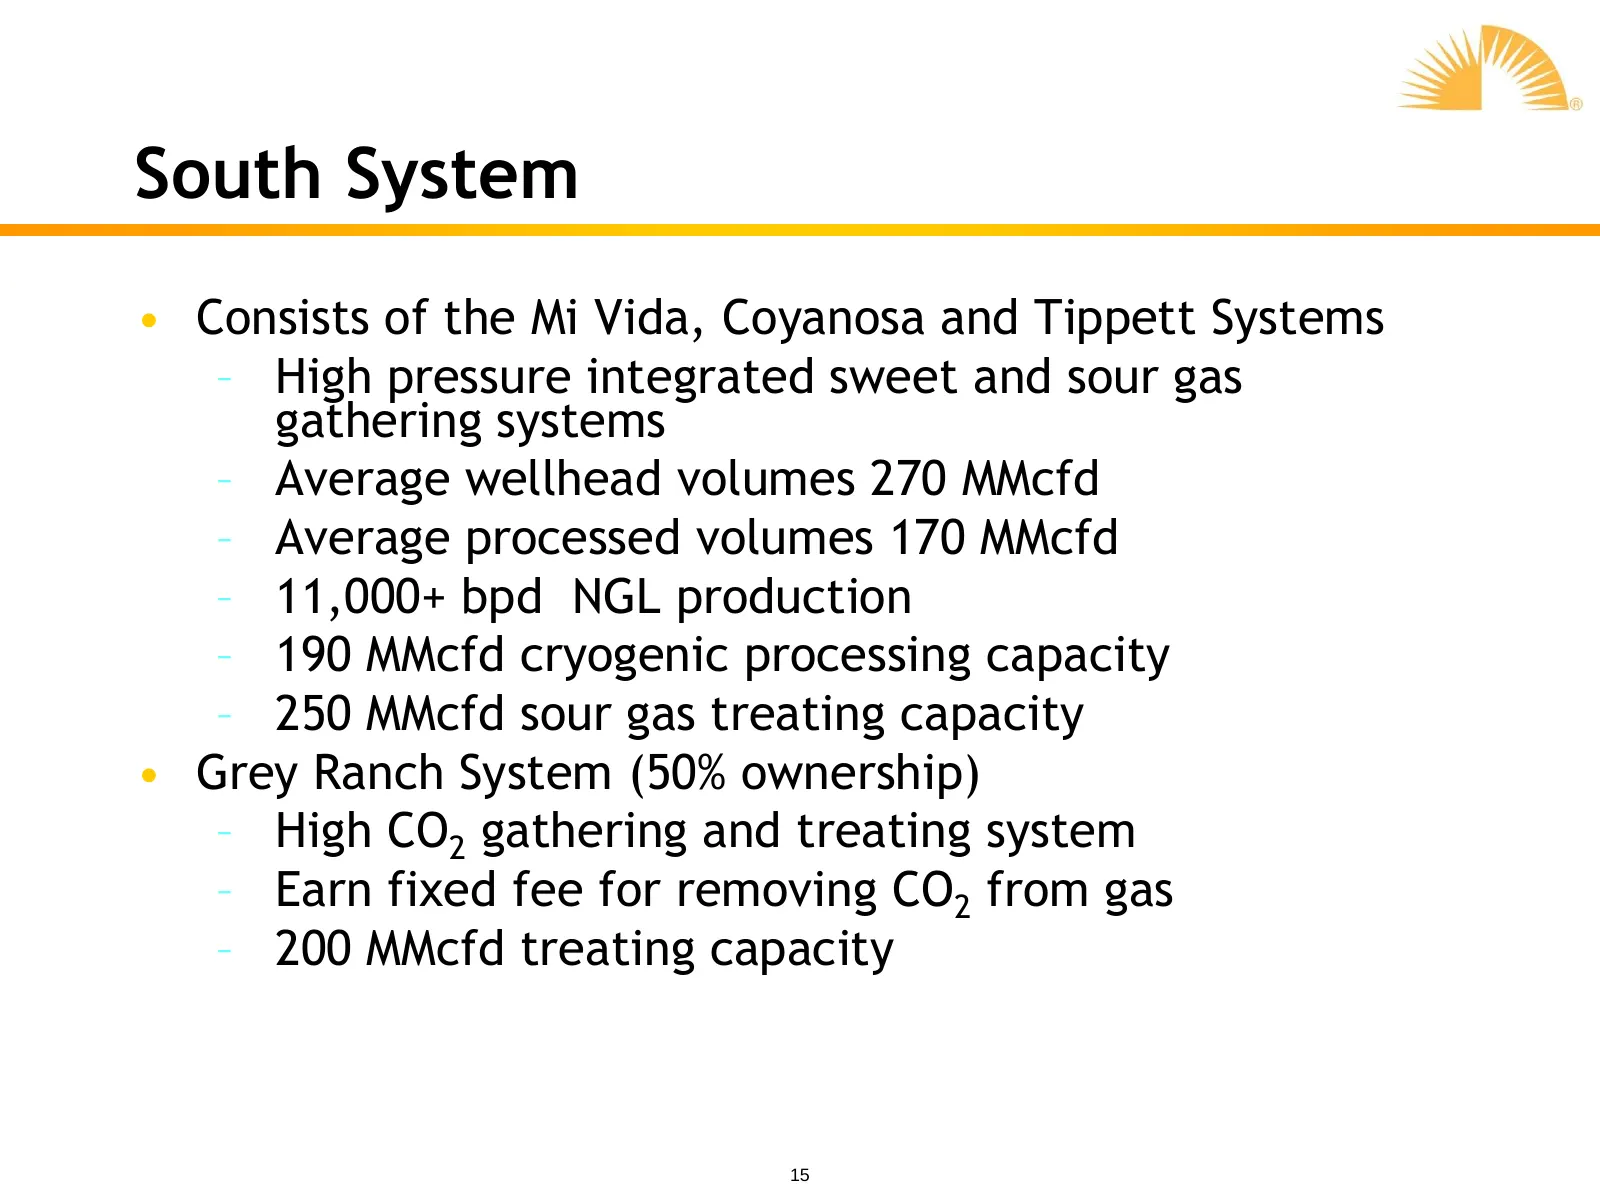
South System • Consists of the Mi Vida, Coyanosa and Tippett Systems – High pressure integrated sweet and sour gas gathering systems – Average wellhead volumes 270 MMcfd – Average processed volumes 170 MMcfd – 11,000+ bpd NGL production – 190 MMcfd cryogenic processing capacity – 250 MMcfd sour gas
Slide 16: High Pressure Transfer System
High Pressure Transfer System • Consists of 84 miles of 16-inch and 24-inch pipelines • Provides operational flexibility – Transfer processable gas between plants – Move sour, lean gas between treaters • Options available to increase residue gas value – Capture basis differential between Permian and
Slide 17: Gas Supply
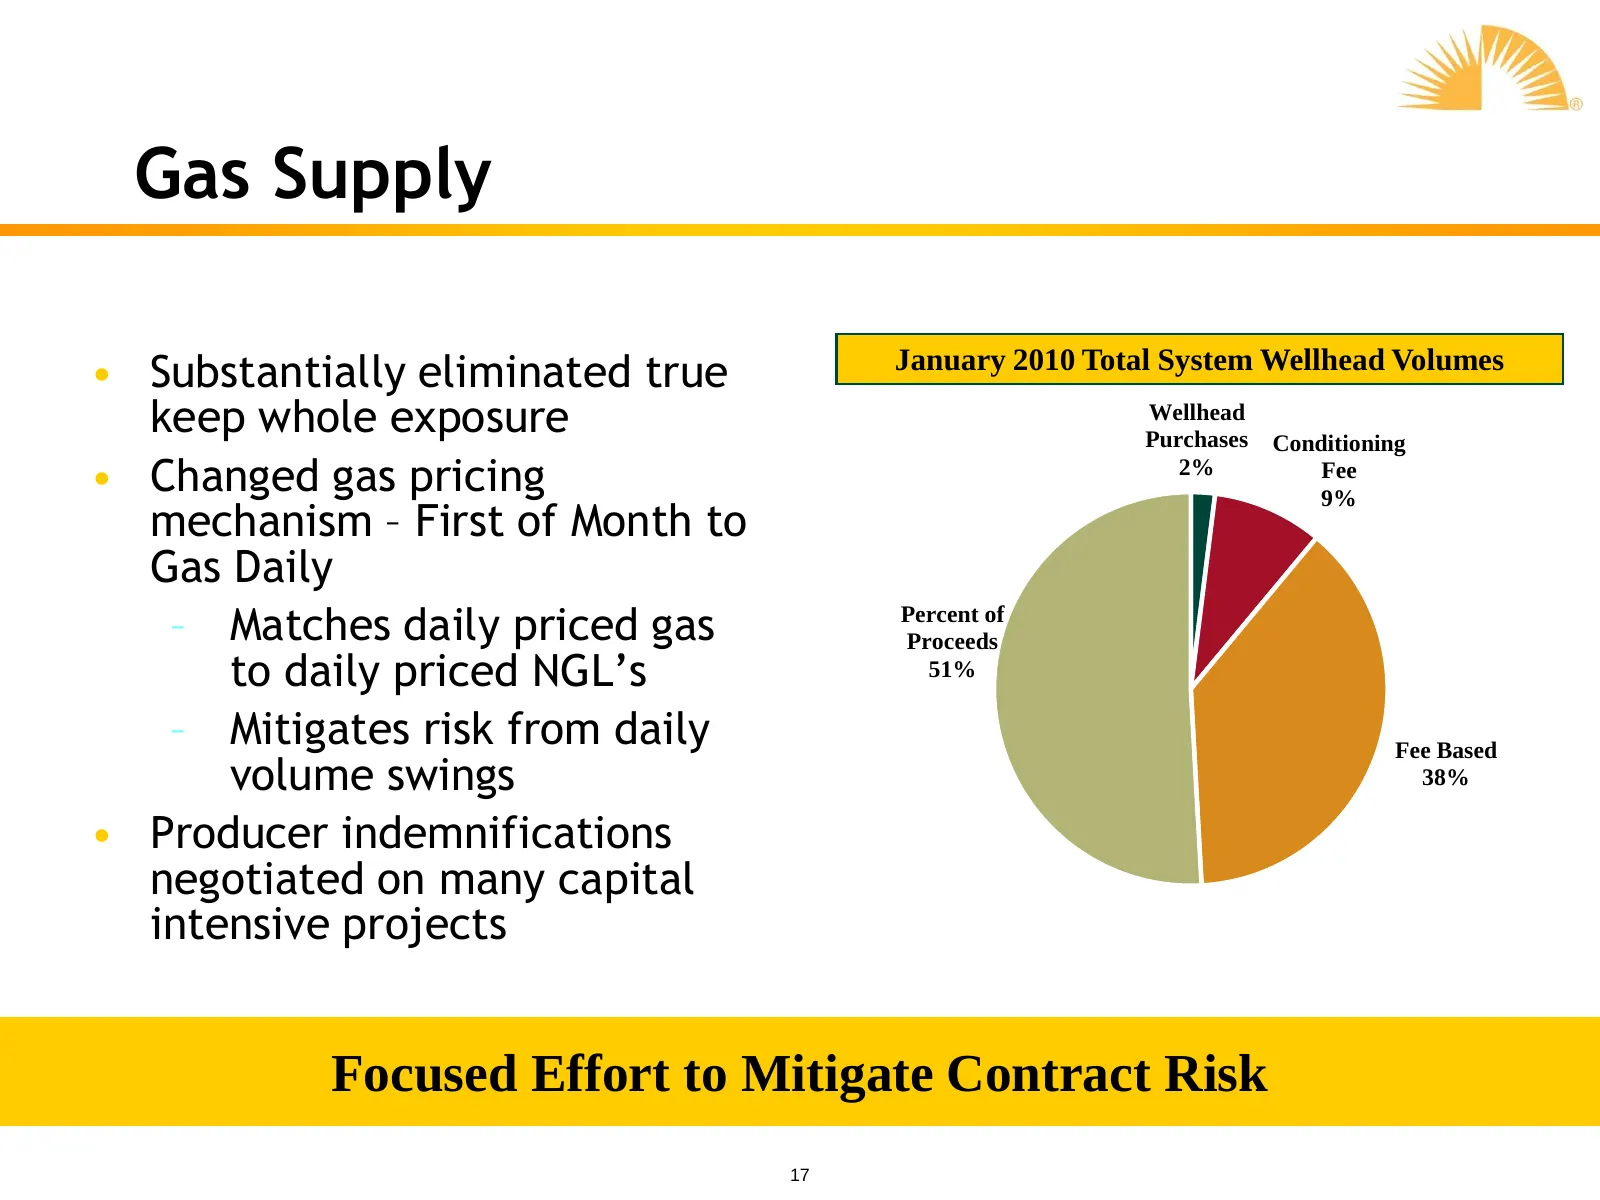
Gas Supply • Substantially eliminated true January 2010 Total System Wellhead Volumes keep whole exposure Wellhead Purchases Conditioning • Changed gas pricing 2% Fee 9% mechanism – First of Month to Gas Daily – Matches daily priced gas Percent of Proceeds to daily priced NGL’s 51% – Mitigates risk
Slide 18: 2010 Growth Opportunities
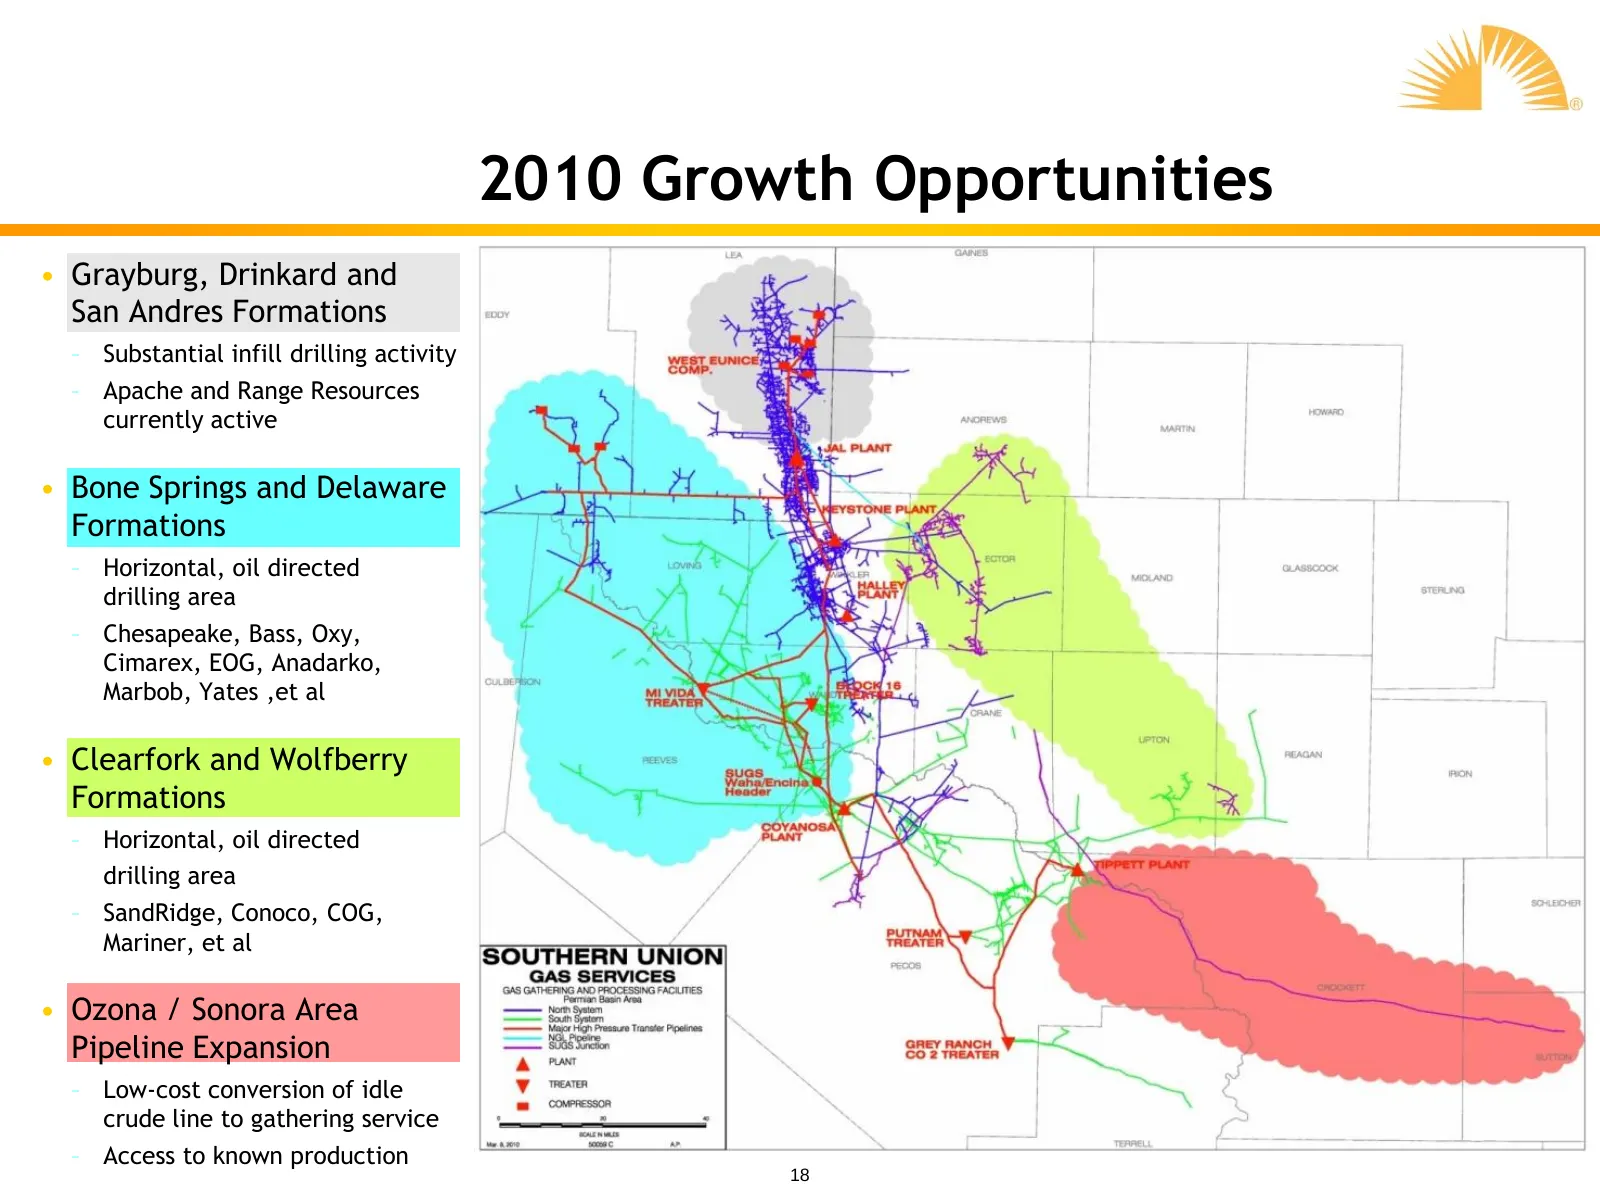
2010 Growth Opportunities • Grayburg, Drinkard and San Andres Formations – Substantial infill drilling activity – Apache and Range Resources currently active • Bone Springs and Delaware Formations – Horizontal, oil directed drilling area – Chesapeake, Bass, Oxy, Cimarex, EOG, Anadarko, Marbob, Yates
Slide 19: Gathering & Processing Assumptions
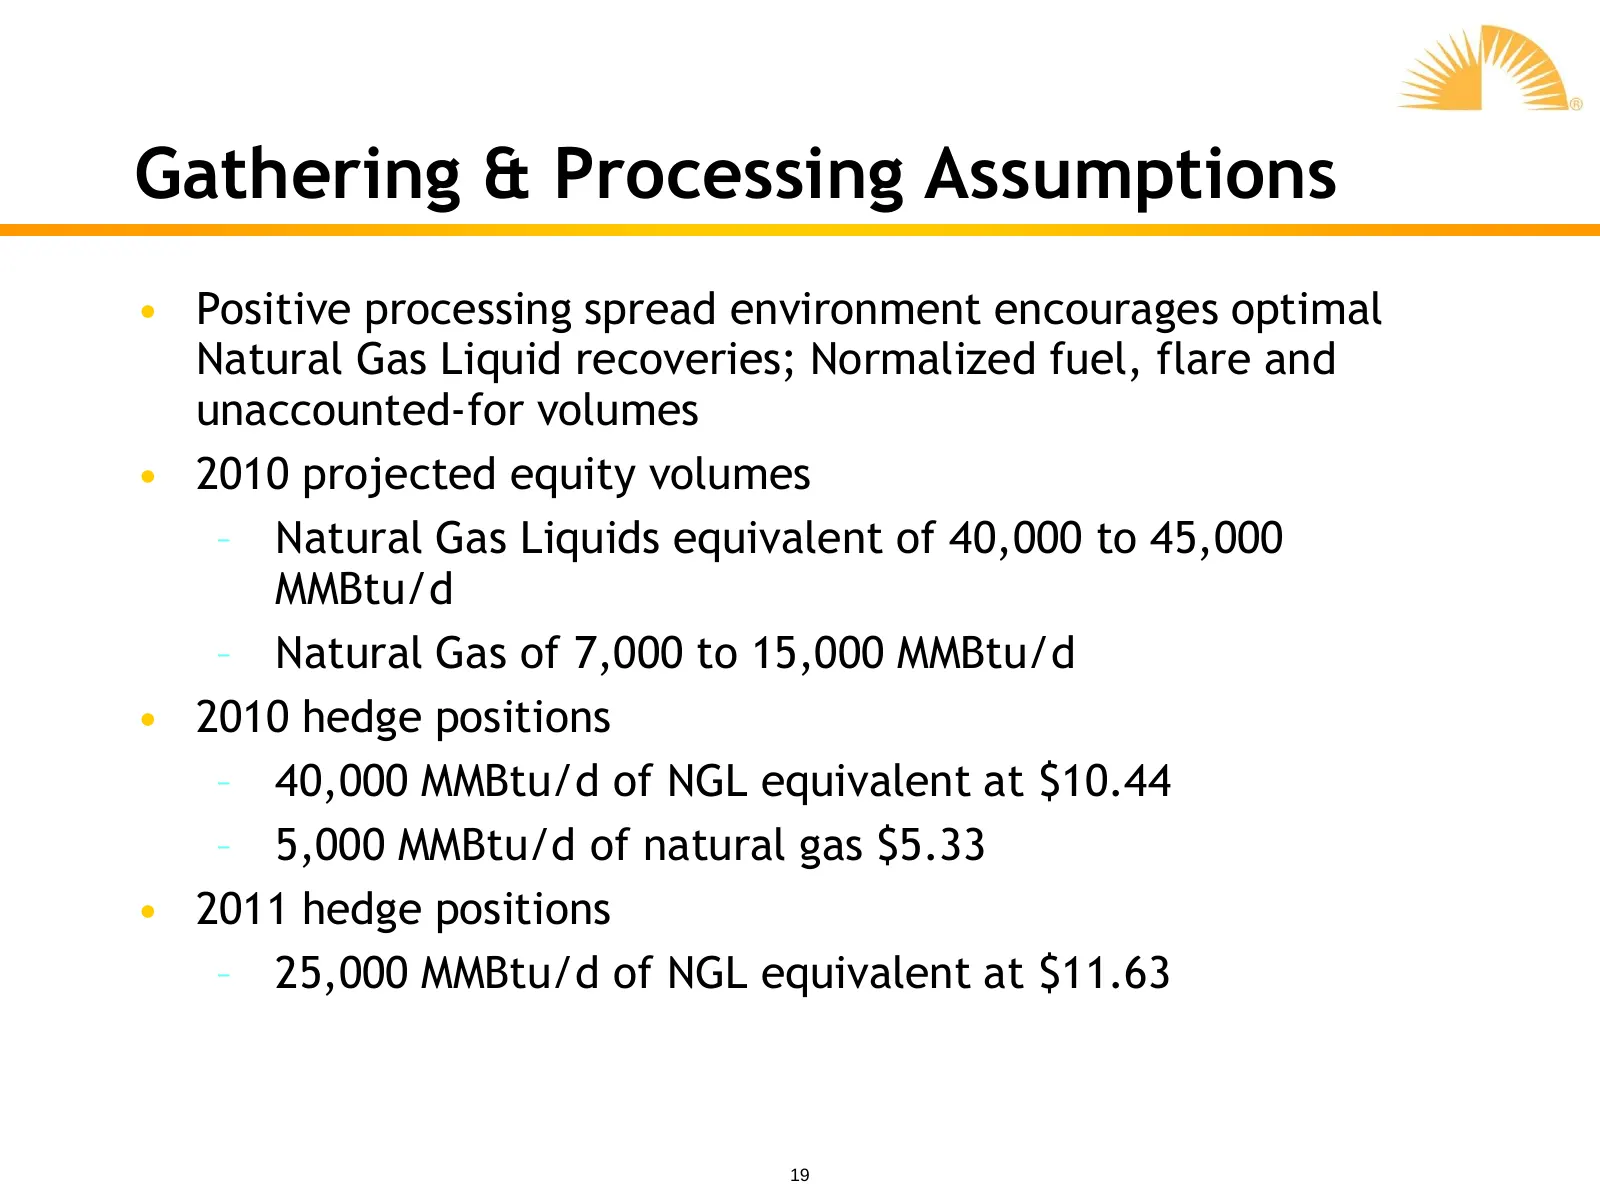
Gathering & Processing Assumptions • Positive processing spread environment encourages optimal Natural Gas Liquid recoveries; Normalized fuel, flare and unaccounted-for volumes • 2010 projected equity volumes – Natural Gas Liquids equivalent of 40,000 to 45,000 MMBtu/d – Natural Gas of 7,000 to 15,0
Slide 20: Distribution
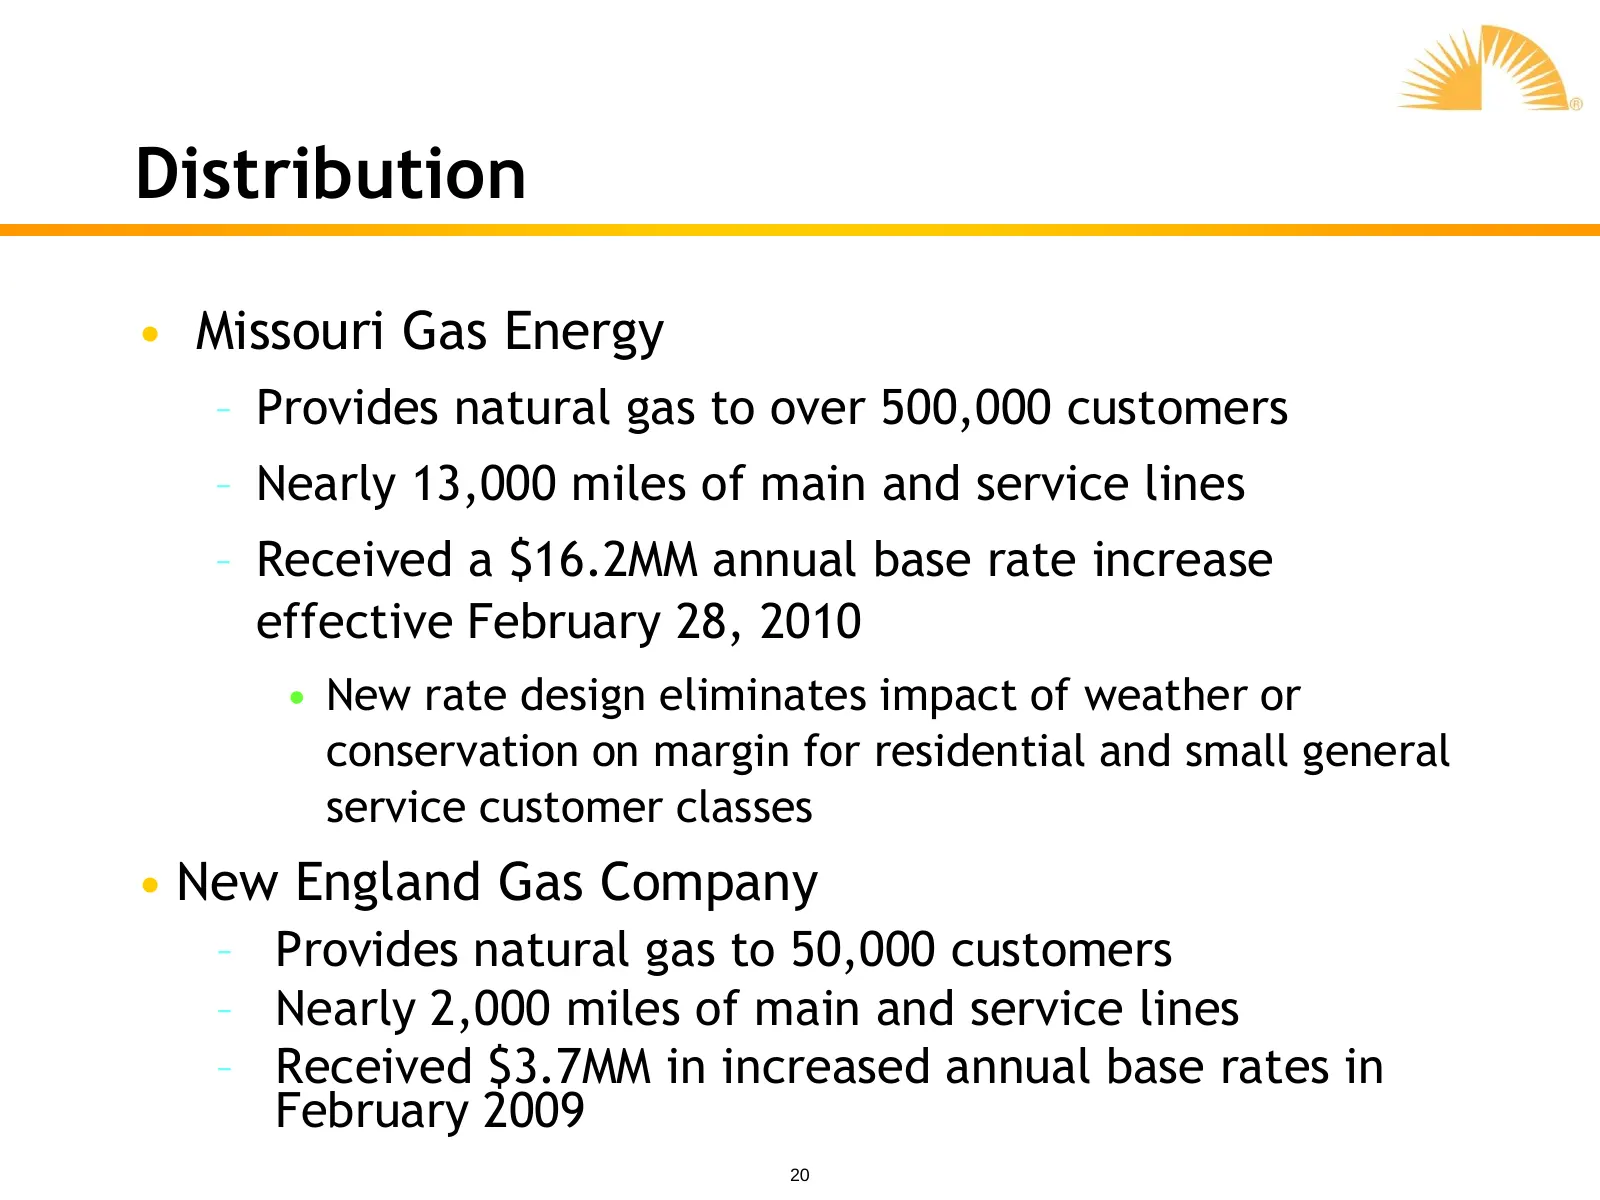
Distribution • Missouri Gas Energy – Provides natural gas to over 500,000 customers – Nearly 13,000 miles of main and service lines – Received a $16.2MM annual base rate increase effective February 28, 2010 • New rate design eliminates impact of weather or conservation on margin for residential and
Slide 21: Corporate & Other
Corporate & Other • Corporate segment provides administrative and support functions to business segments and allocates expenses as appropriate • Other segment primarily consists of PEI Power Corporation which owns interests in and operates 75 MW of generating assets in the PJM ISO and Fall River Gas
Slide 22: Summary
Summary • Focus on natural gas related infrastructure • Actively managed hedging program helps mitigate volatility in NGL margins • Organic growth projects with clear visibility towards earnings and cash flow growth • Balance preservation of investment grade credit ratings and return of capital to s

Slide 23: 2010 Financial Outlook
2010 Financial Outlook Ni
Slide 24: Adjusted EPS
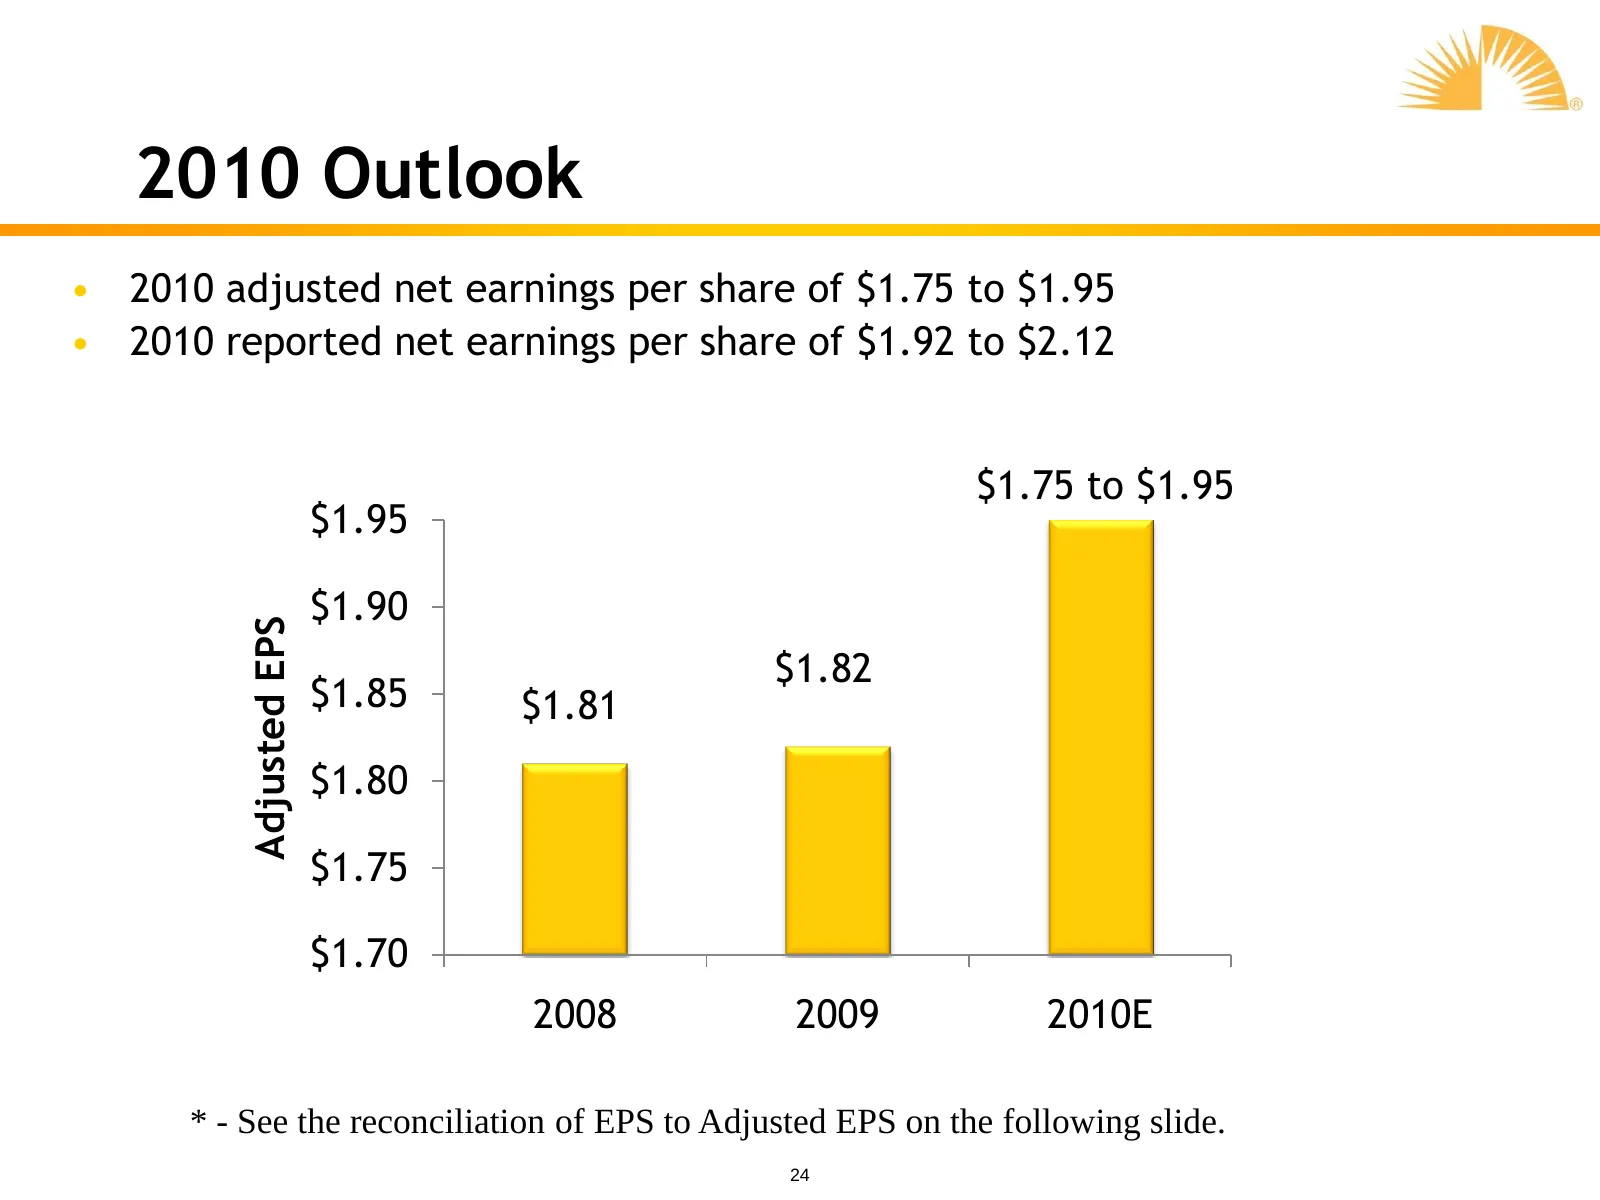
2010 Outlook • 2010 adjusted net earnings per share of $1.75 to $1.95 • 2010 reported net earnings per share of $1.92 to $2.12 $1.75 to $1.95 $1.95 $1.90 Adjusted EPS $1.82 $1.85 $1.81 $1.80 $1.75 $1.70 2008 2009 2010E * - See the reconciliation of EPS to Adjusted EPS on the following slide. 24
Slide 25: EPS Reconciliation
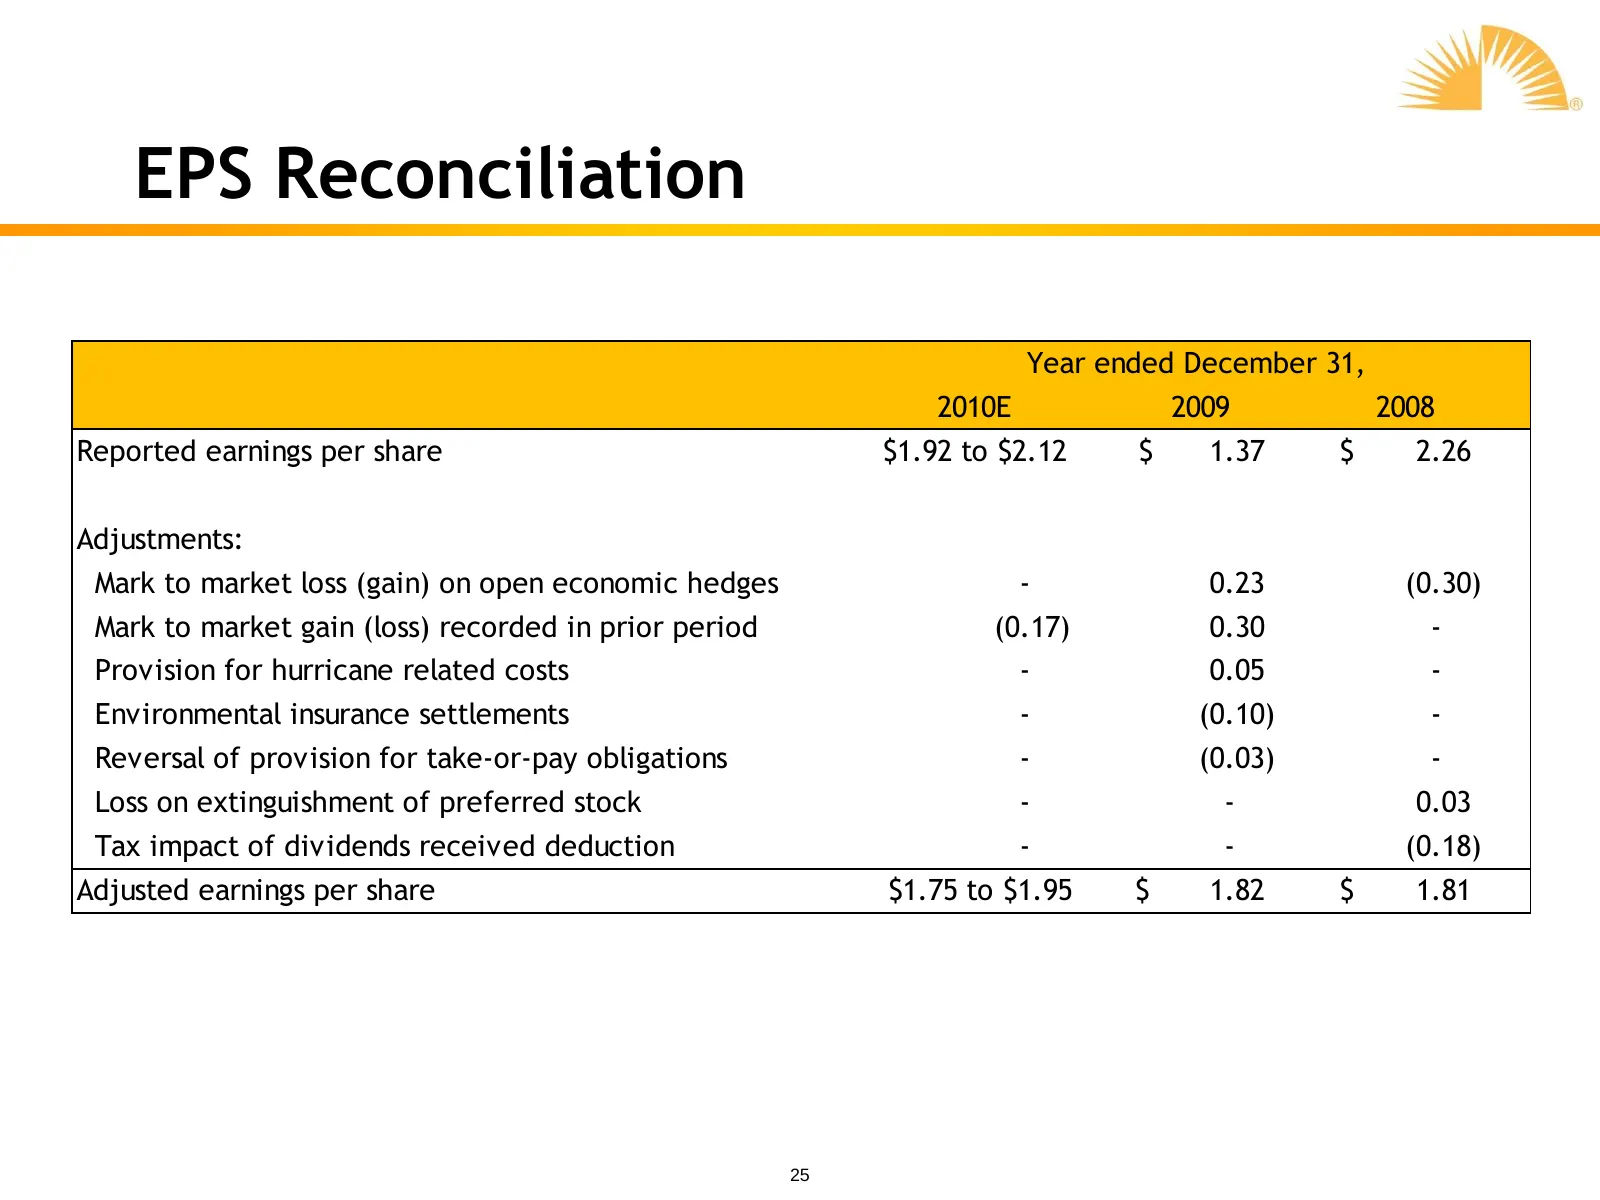
EPS Reconciliation Year ended December 31, 2010E 2009 2008 Reported earnings per share $1.92 to $2.12 $ 1.37 $ 2.26 Adjustments: Mark to market loss (gain) on open economic hedges - 0.23 (0.30) Mark to market gain (loss) recorded in prior period (0.17) 0.30 - Provision for hurricane related costs -
Slide 26: 2010 Consolidated Adjusted EBITDA
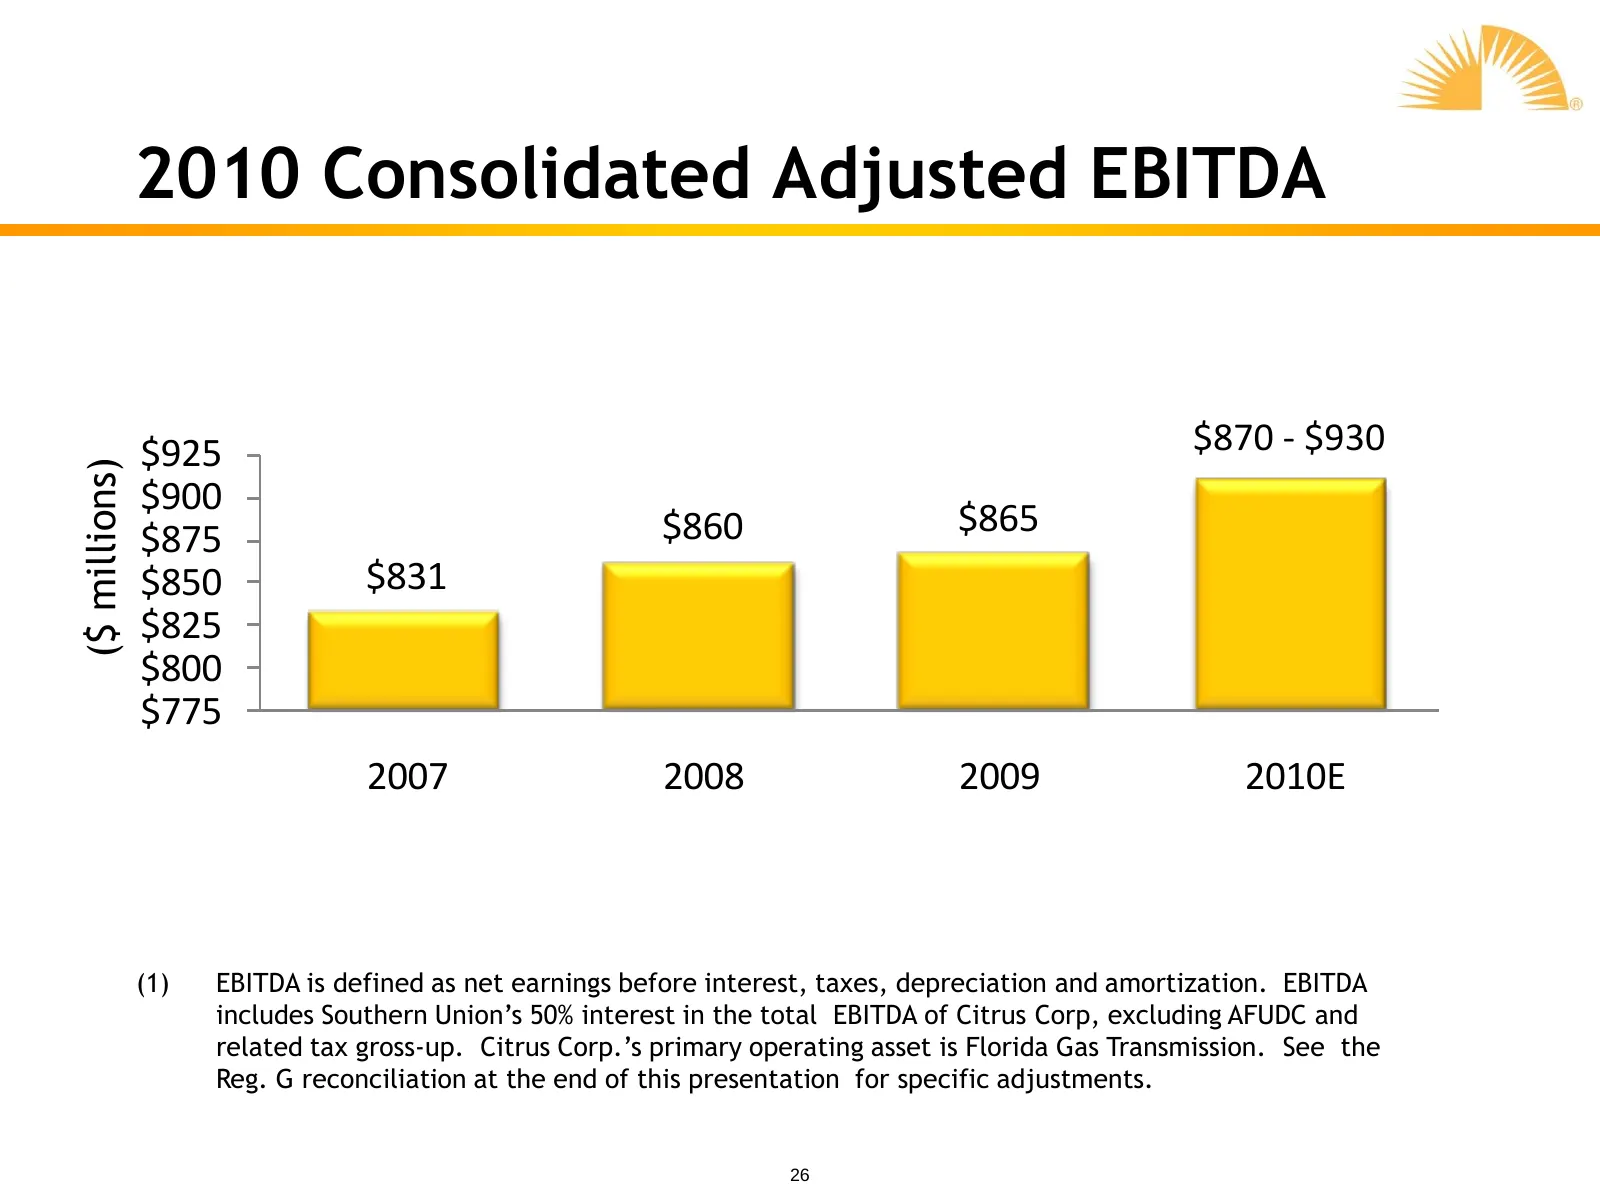
2010 Consolidated Adjusted EBITDA $925 $870 - $930 ($ millions) $900 $860 $865 $875 $850 $831 $825 $800 $775 2007 2008 2009 2010E (1) EBITDA is defined as net earnings before interest, taxes, depreciation and amortization. EBITDA includes Southern Union’s 50% interest in the total EBITDA of Citrus C
Slide 27: 2010 Adjusted Segment EBITDA
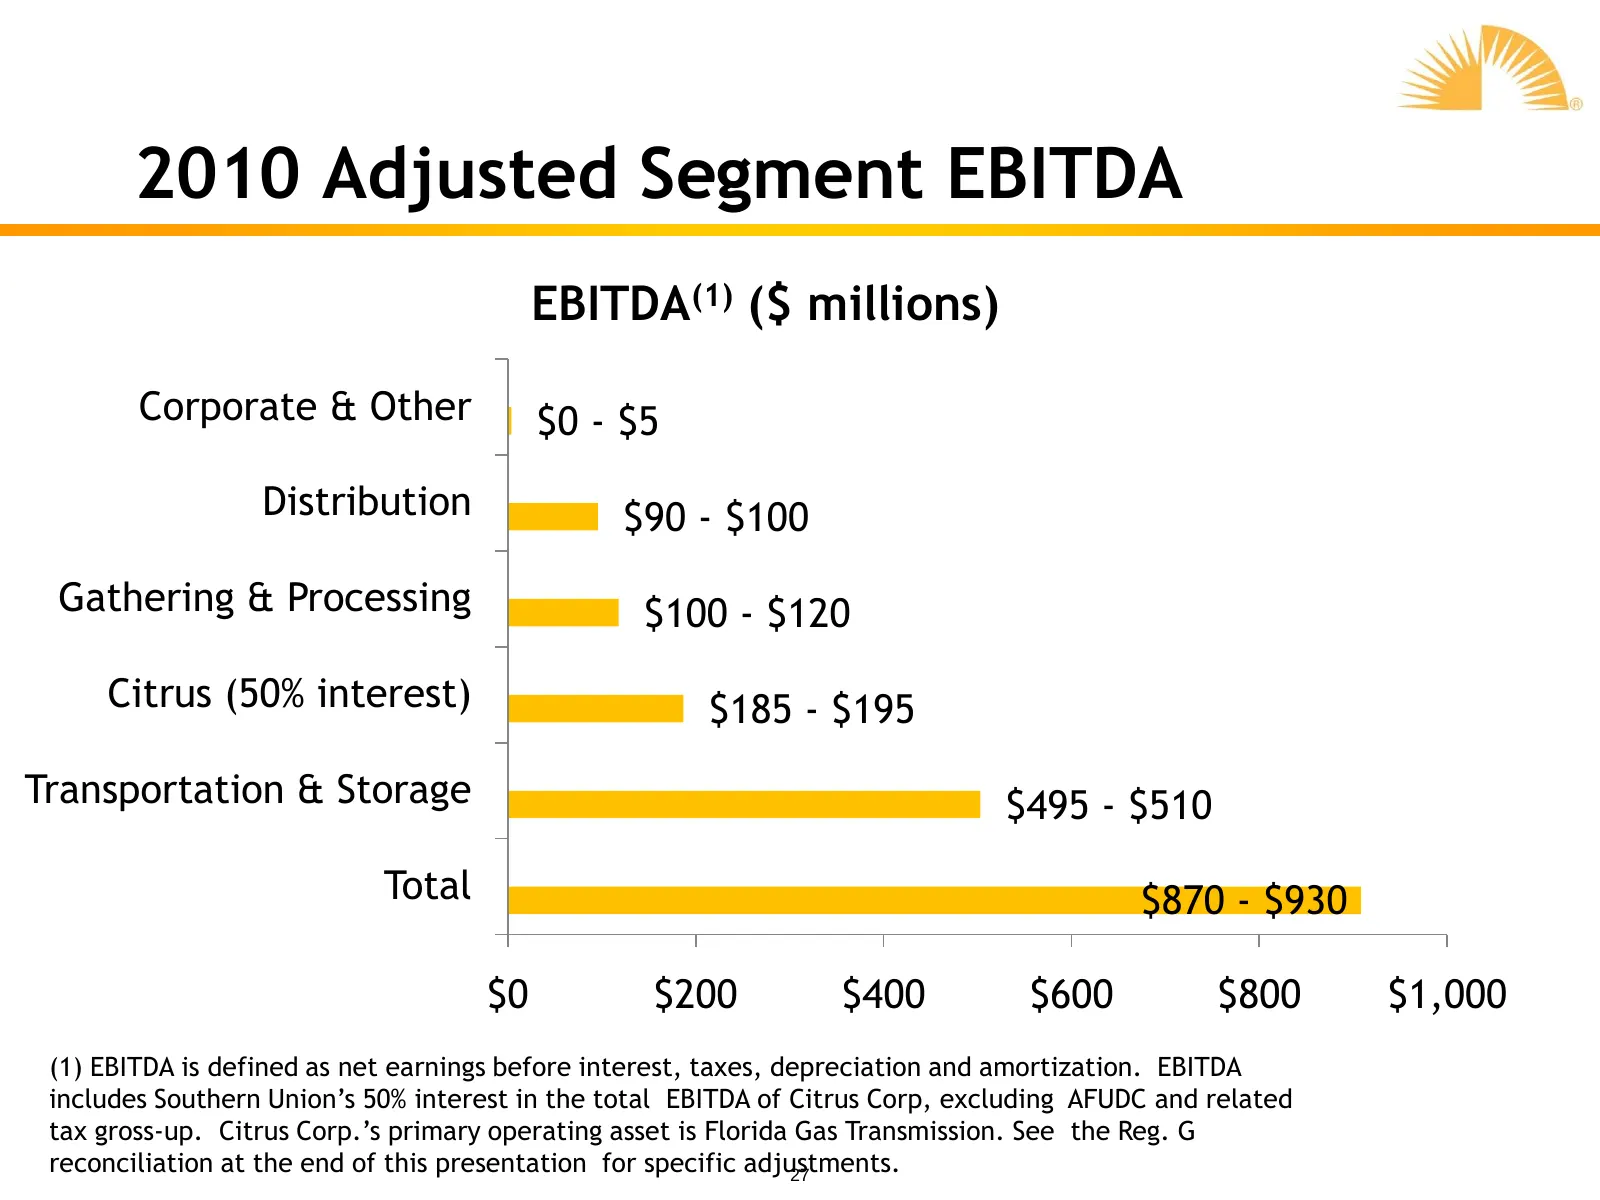
2010 Adjusted Segment EBITDA EBITDA(1) ($ millions) Corporate & Other $0 - $5 Distribution $90 - $100 Gathering & Processing $100 - $120 Citrus (50% interest) $185 - $195 Transportation & Storage $495 - $510 Total $870 - $930 $0 $200 $400 $600 $800 $1,000 (1) EBITDA is defined as net earnings before
Slide 28: 2010 Adjusted EBITDA by Segment
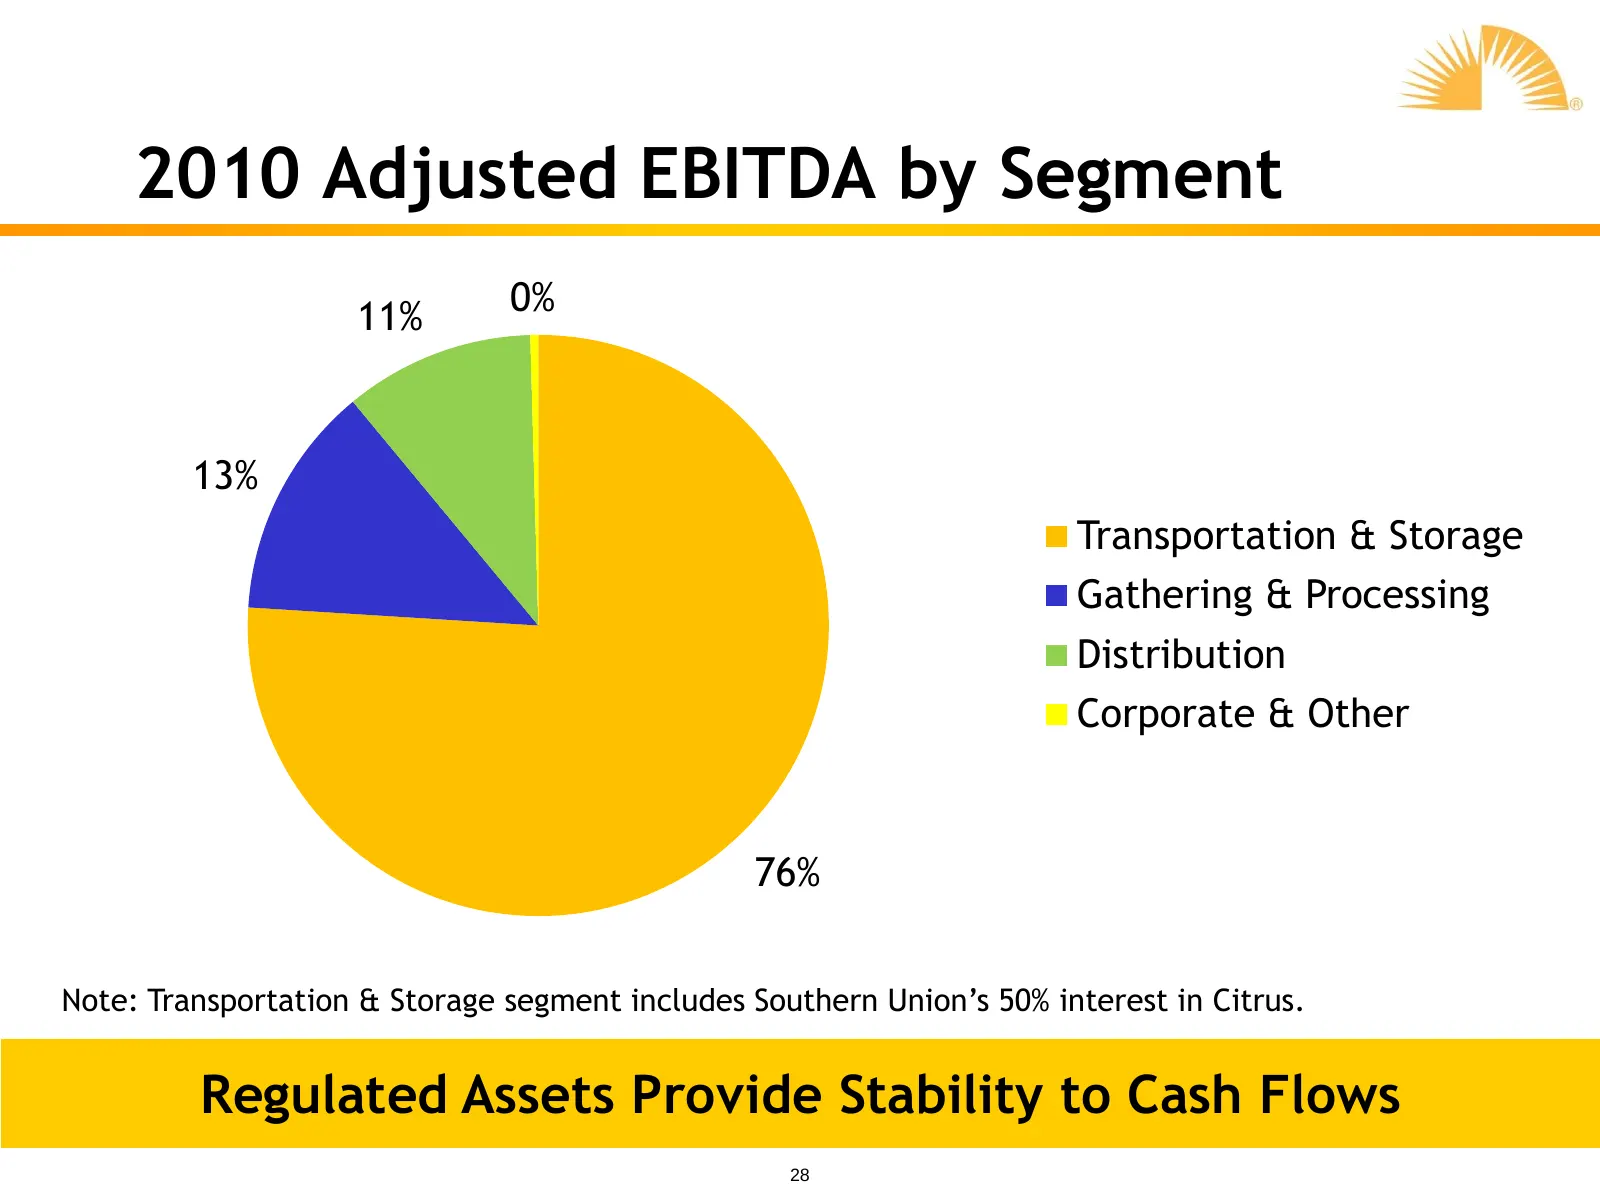
2010 Adjusted EBITDA by Segment 11% 0% 13% Transportation & Storage Gathering & Processing Distribution Corporate & Other 76% Note: Transportation & Storage segment includes Southern Union’s 50% interest in Citrus. Regulated Assets Provide Stability to Cash Flows 28
Slide 29: 2010 Net Capital Expenditure Guidance
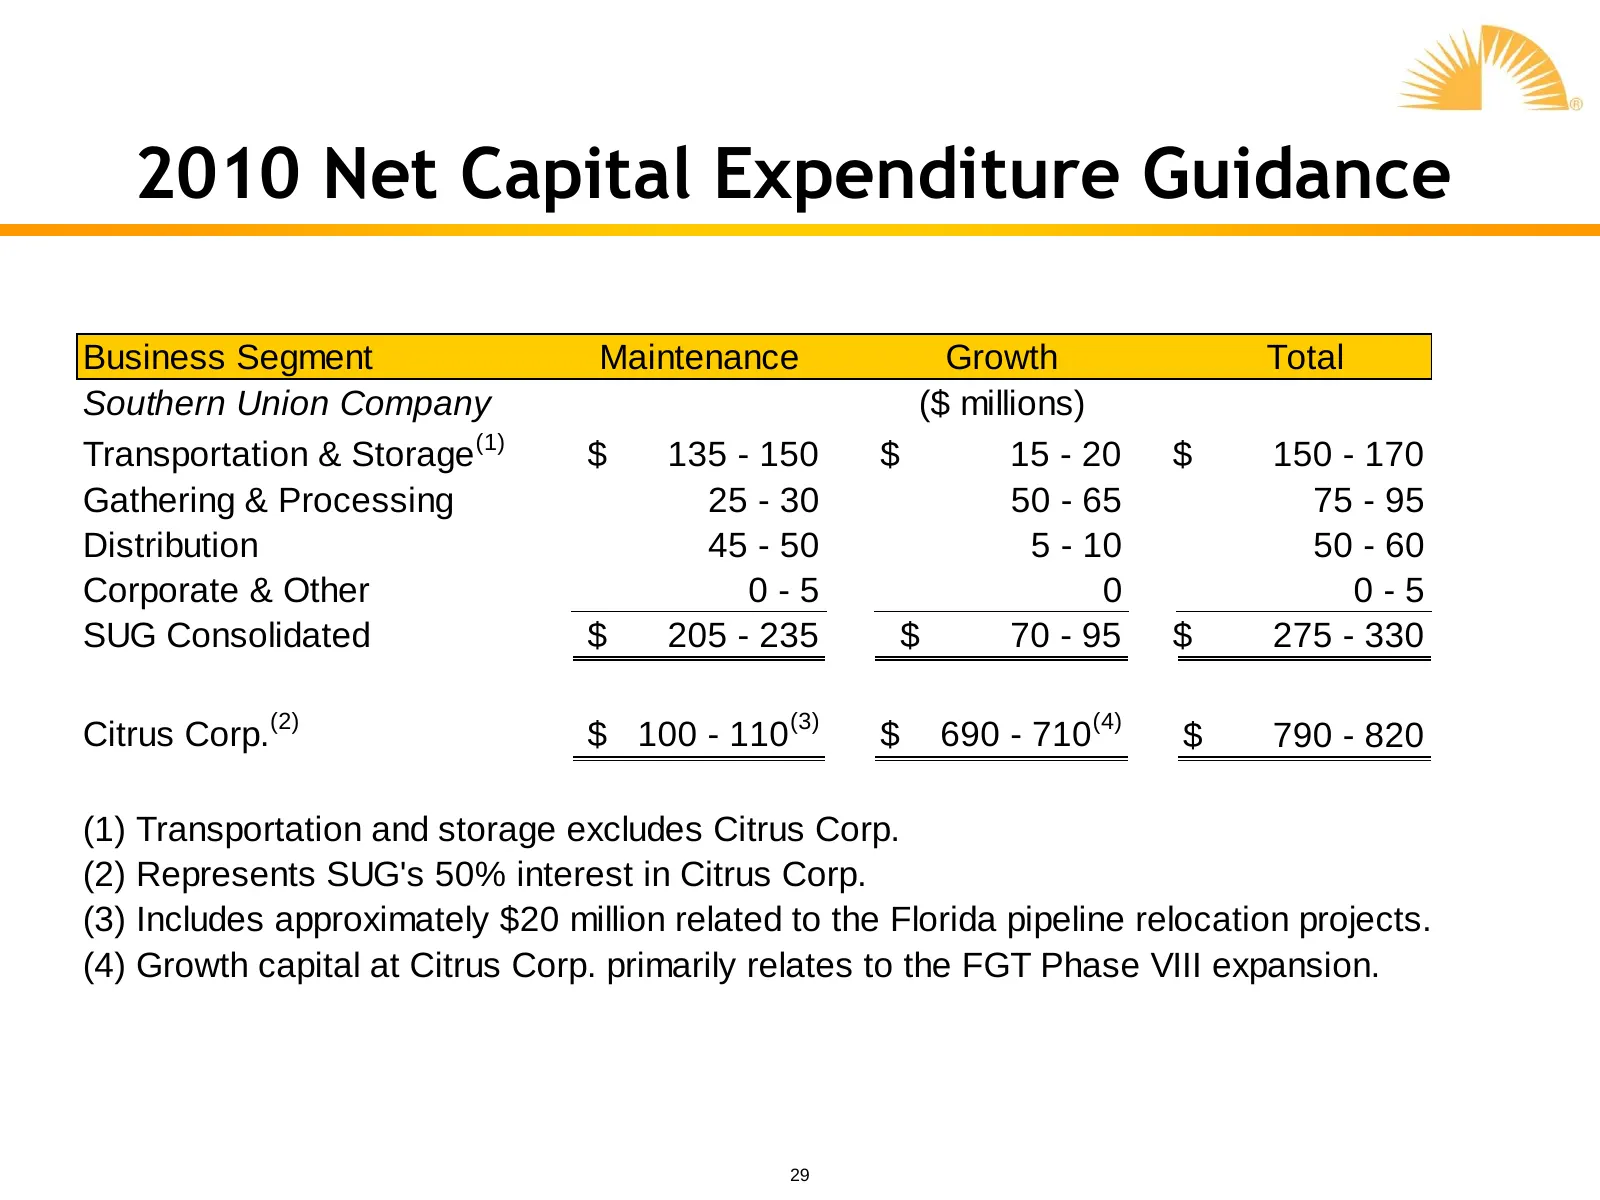
2010 Net Capital Expenditure Guidance Business Segment Maintenance Growth Total Southern Union Company ($ millions) Transportation & Storage (1) $ 135 - 150 $ 15 - 20 $ 150 - 170 Gathering & Processing 25 - 30 50 - 65 75 - 95 Distribution 45 - 50 5 - 10 50 - 60 Corporate & Other 0-5 0 0-5 SUG Consol
Slide 30: SUG General Assumptions
SUG General Assumptions • Approximately 125 million weighted average diluted shares outstanding • Effective income tax rate of 30.3% • Interest expense, net of capitalized interest, approximately $225 to $235 million 30
Slide 31: Reg. G Reconciliation
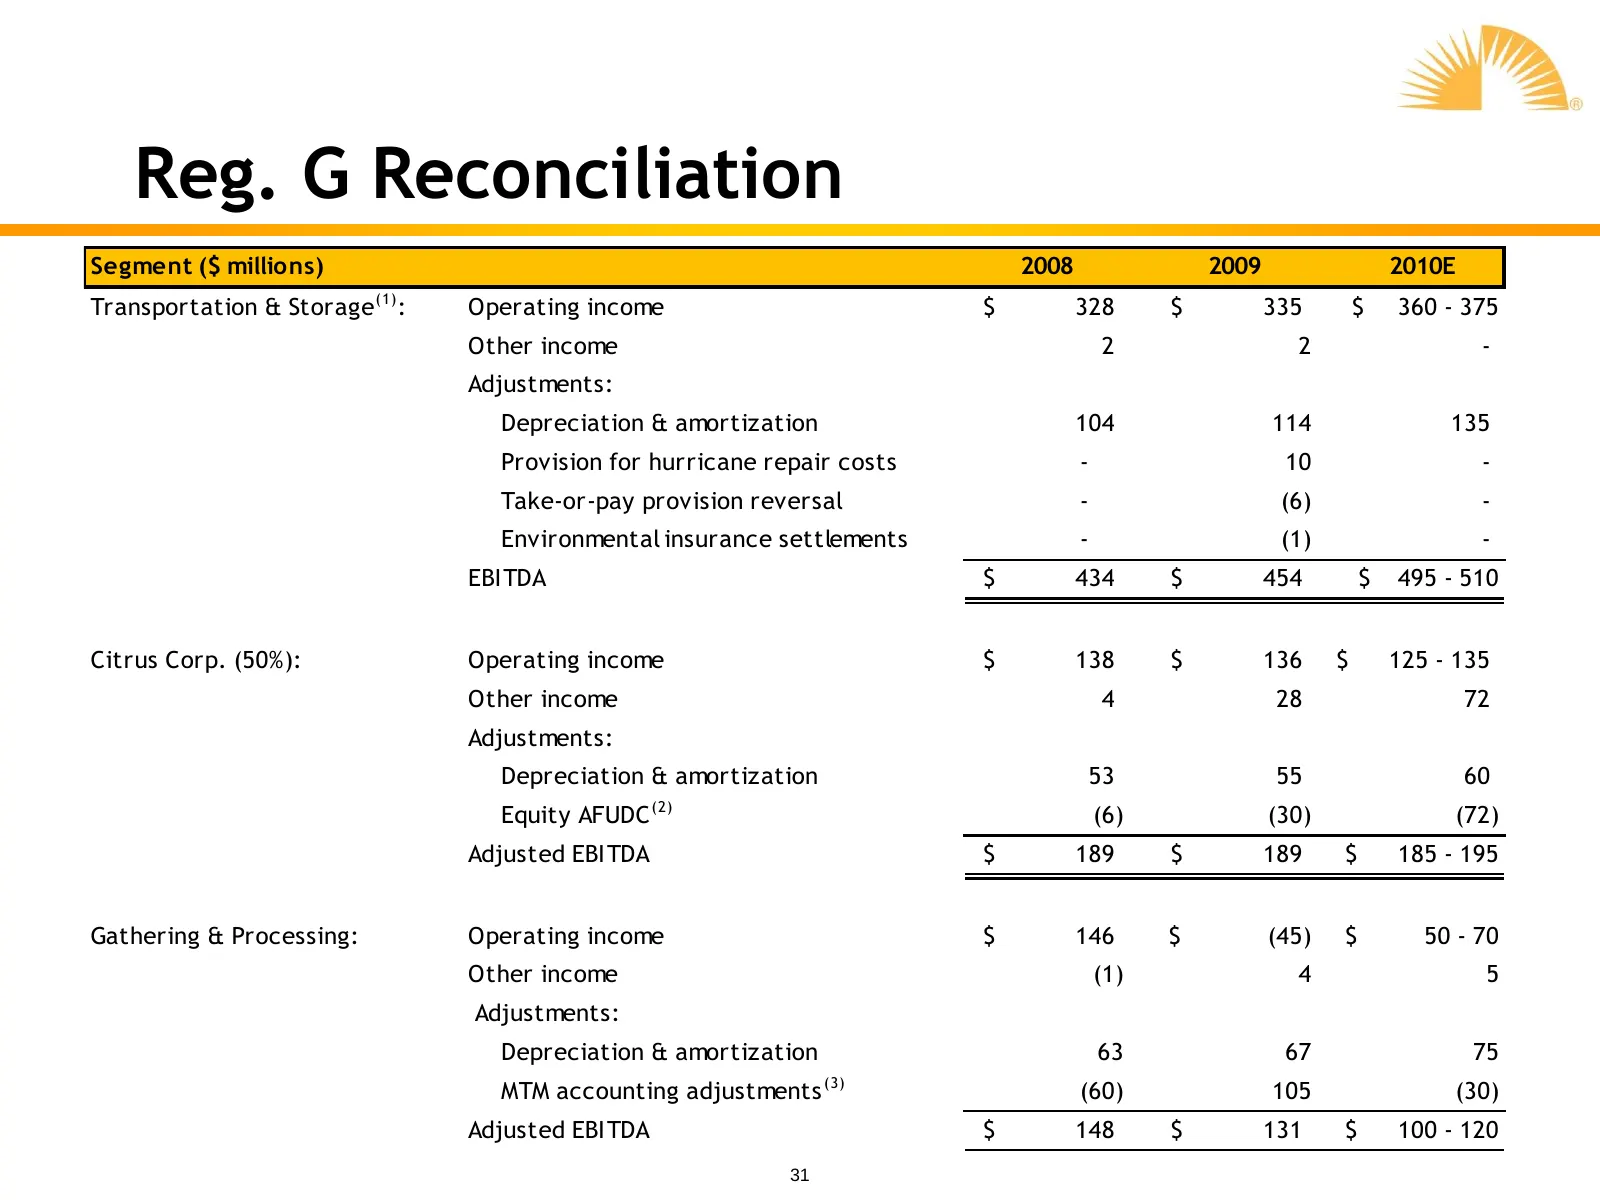
Reg. G Reconciliation Segment ($ millions) 2008 2009 2010E Transportation & Storage (1) : Operating income $ 328 $ 335 $ 360 - 375 Other income 2 2 - Adjustments: Depreciation & amortization 104 114 135 Provision for hurricane repair costs - 10 - Take-or-pay provision reversal - (6) - Environmental
Slide 32: Reg. G Reconciliation – continued
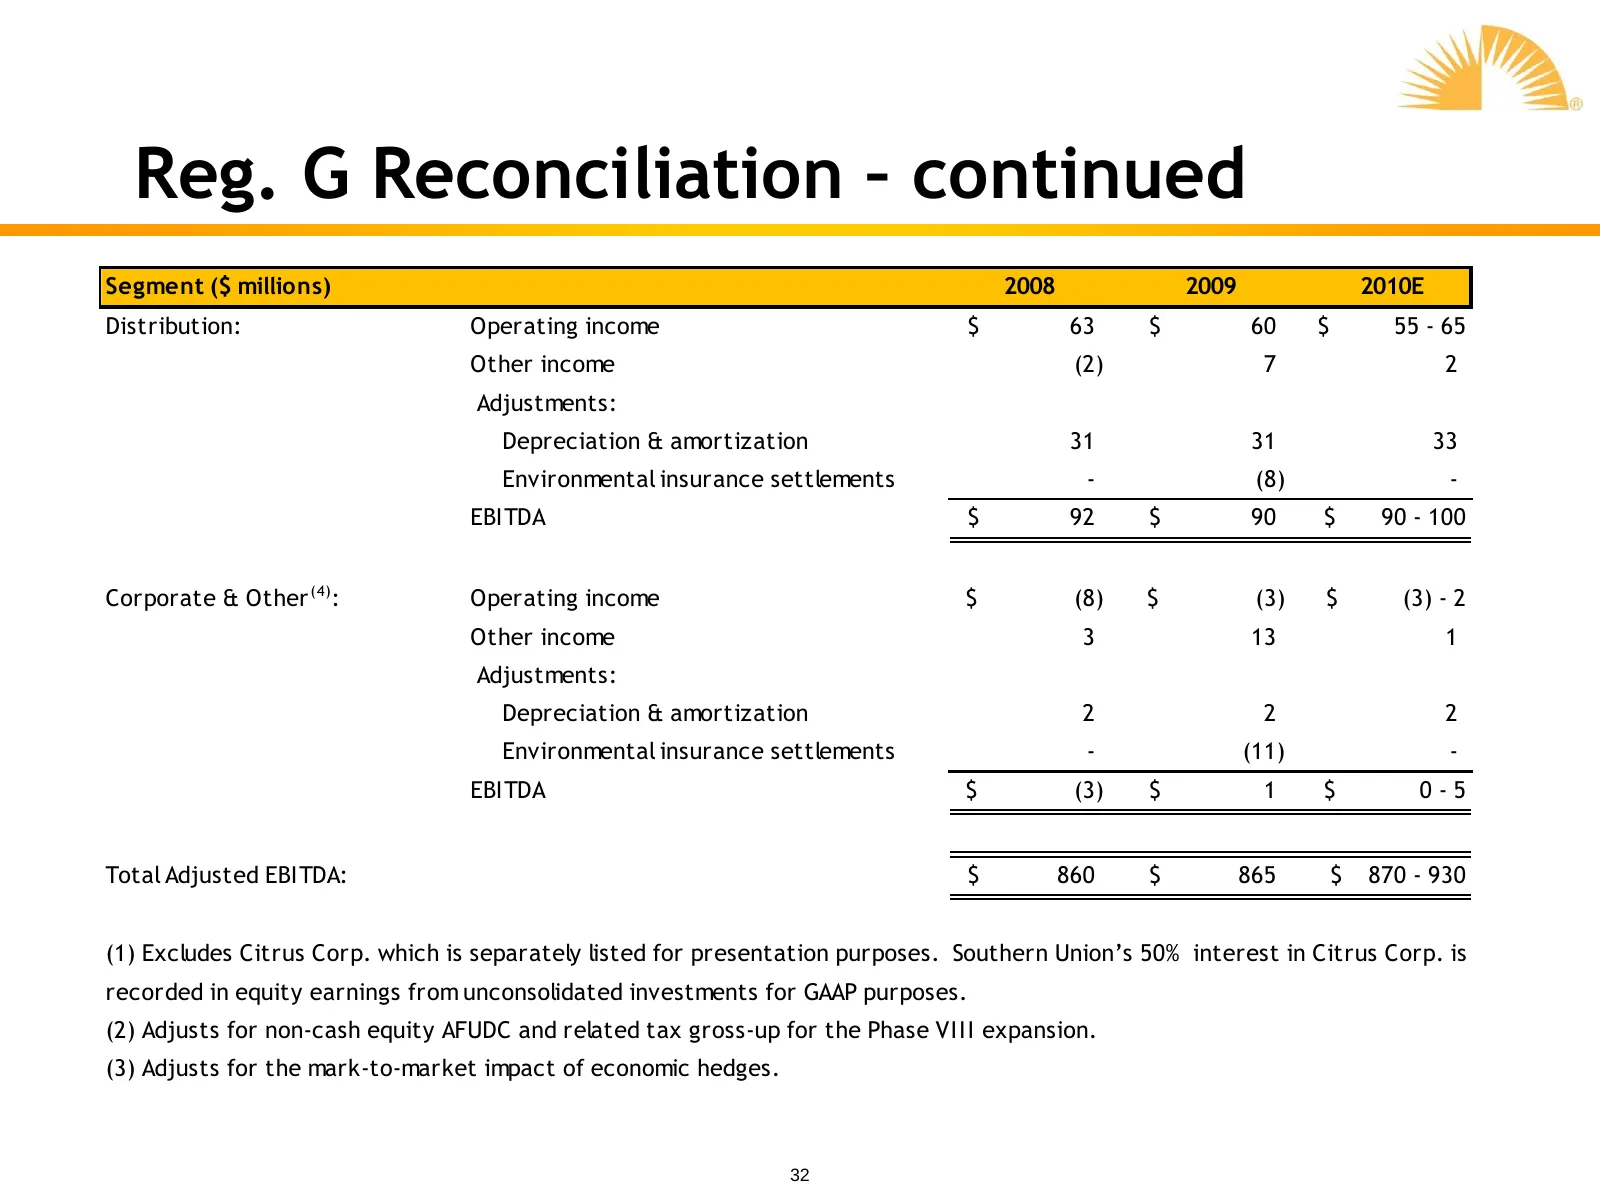
Reg. G Reconciliation – continued Segment ($ millions) 2008 2009 2010E Distribution: Operating income $ 63 $ 60 $ 55 - 65 Other income (2) 7 2 Adjustments: Depreciation & amortization 31 31 33 Environmental insurance settlements - (8) - EBITDA $ 92 $ 90 $ 90 - 100 Corporate & Other (4) : Operating i
Source: SEC EDGAR · 8-K filed Mar 16, 2010
More decks from Southern Union Co
 Barclays Capital Investment Grade Energy and Pipeline Conference 201232 slides · Mar 8, 2012
 Debt Investor Presentation (February 2012)33 slides · Feb 22, 2012
 Merger or Acquisition (July 2011)11 slides · Jul 5, 2011
 Merger or Acquisition (June 2011)22 slides · Jun 16, 2011
 Investor Presentation (February 2011)37 slides · Feb 25, 2011
 BMO Capital Markets 2010 Utilities and Pipelines Day23 slides · Nov 30, 2010