Monarch Financial Holdings Inc
Monarch Financial — Investor Presentation (March 2011)
30 slides from Monarch Financial's investor presentation, Mar 22, 2011
Slide 1: Investor Presentation
Exhibit 99.1 Investor Presentation As of December 31, 2010 March 22, 2011
Slide 2: Forward-Looking Statements
Forward-Looking Statements Certain information contained in this discussion may include “forward-looking statements” within the meaning of Section 27A of the Securities Act of 1933, as amended, and Section 21E of the Securities Exchange Act of 1934, as amended. These forward-looking statements relat
Slide 3: Introduction
Introduction Brad E. Schwartz Chief Executive Officer, Monarch Financial Holdings, Inc. & Monarch Bank E. Neal Crawford, Jr. President, Monarch Bank Andrew N. Lock Executive Vice President and Chief Risk Officer, Monarch Bank Page 3
Slide 4: Corporate Profile
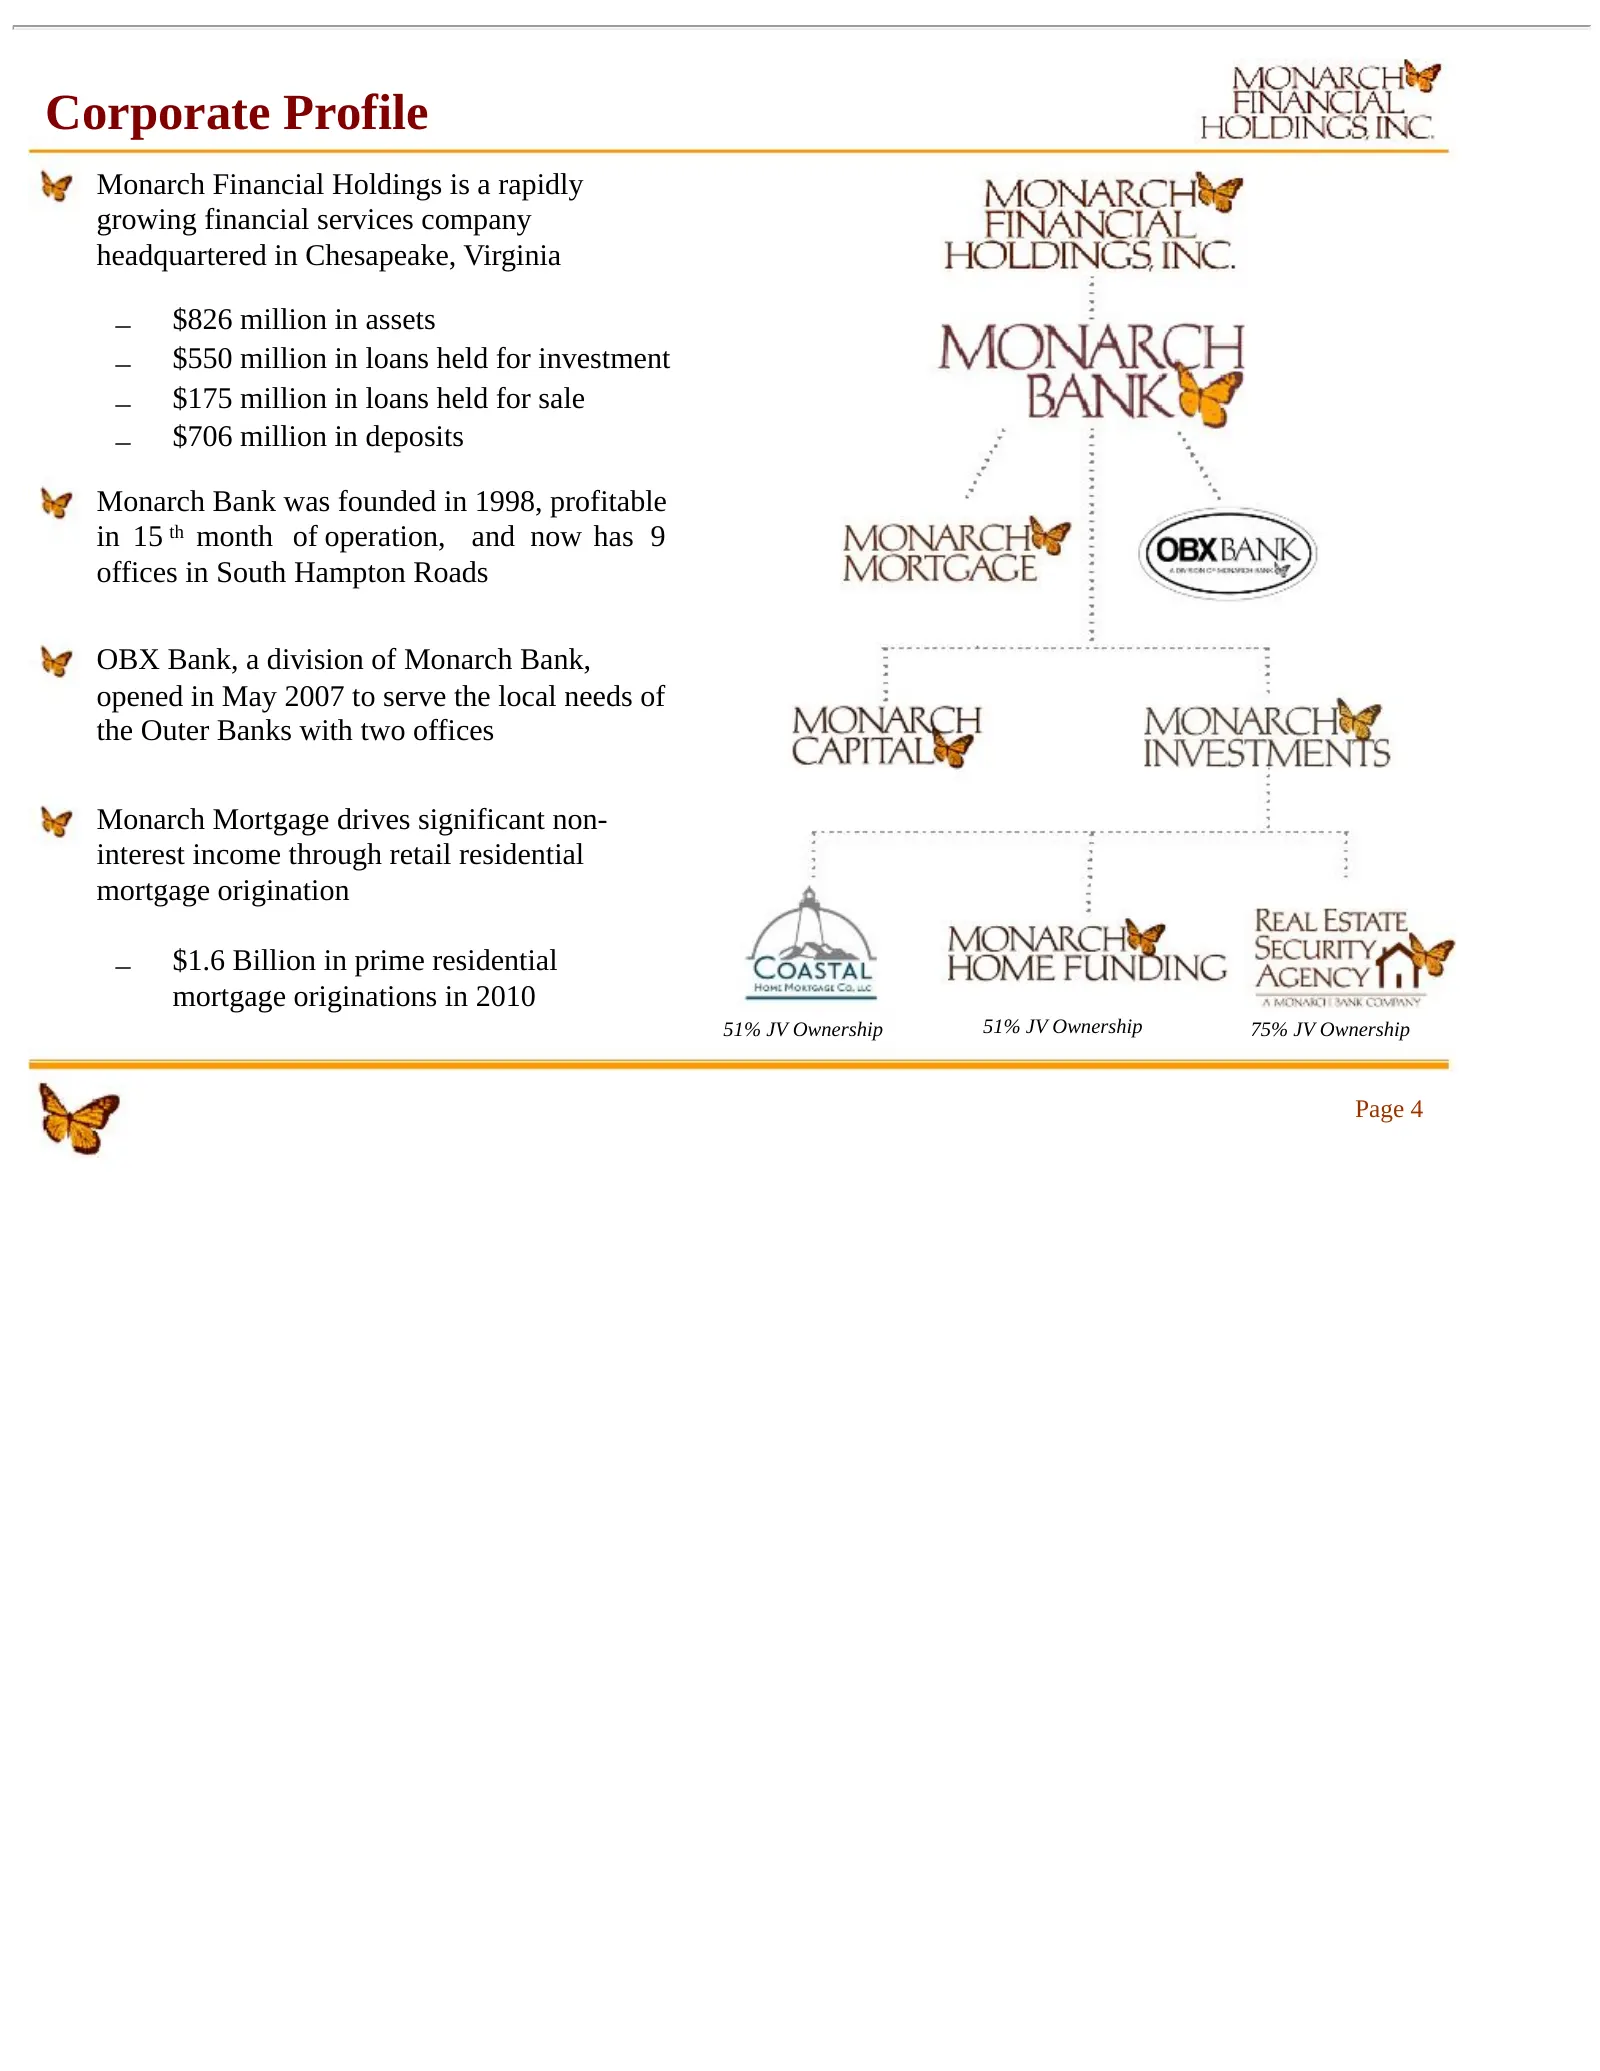
Corporate Profile Monarch Financial Holdings is a rapidly growing financial services company headquartered in Chesapeake, Virginia – $826 million in assets – $550 million in loans held for investment – $175 million in loans held for sale – $706 million in deposits Monarch Bank was founded in 1998, p
Slide 5: Monarch Franchise
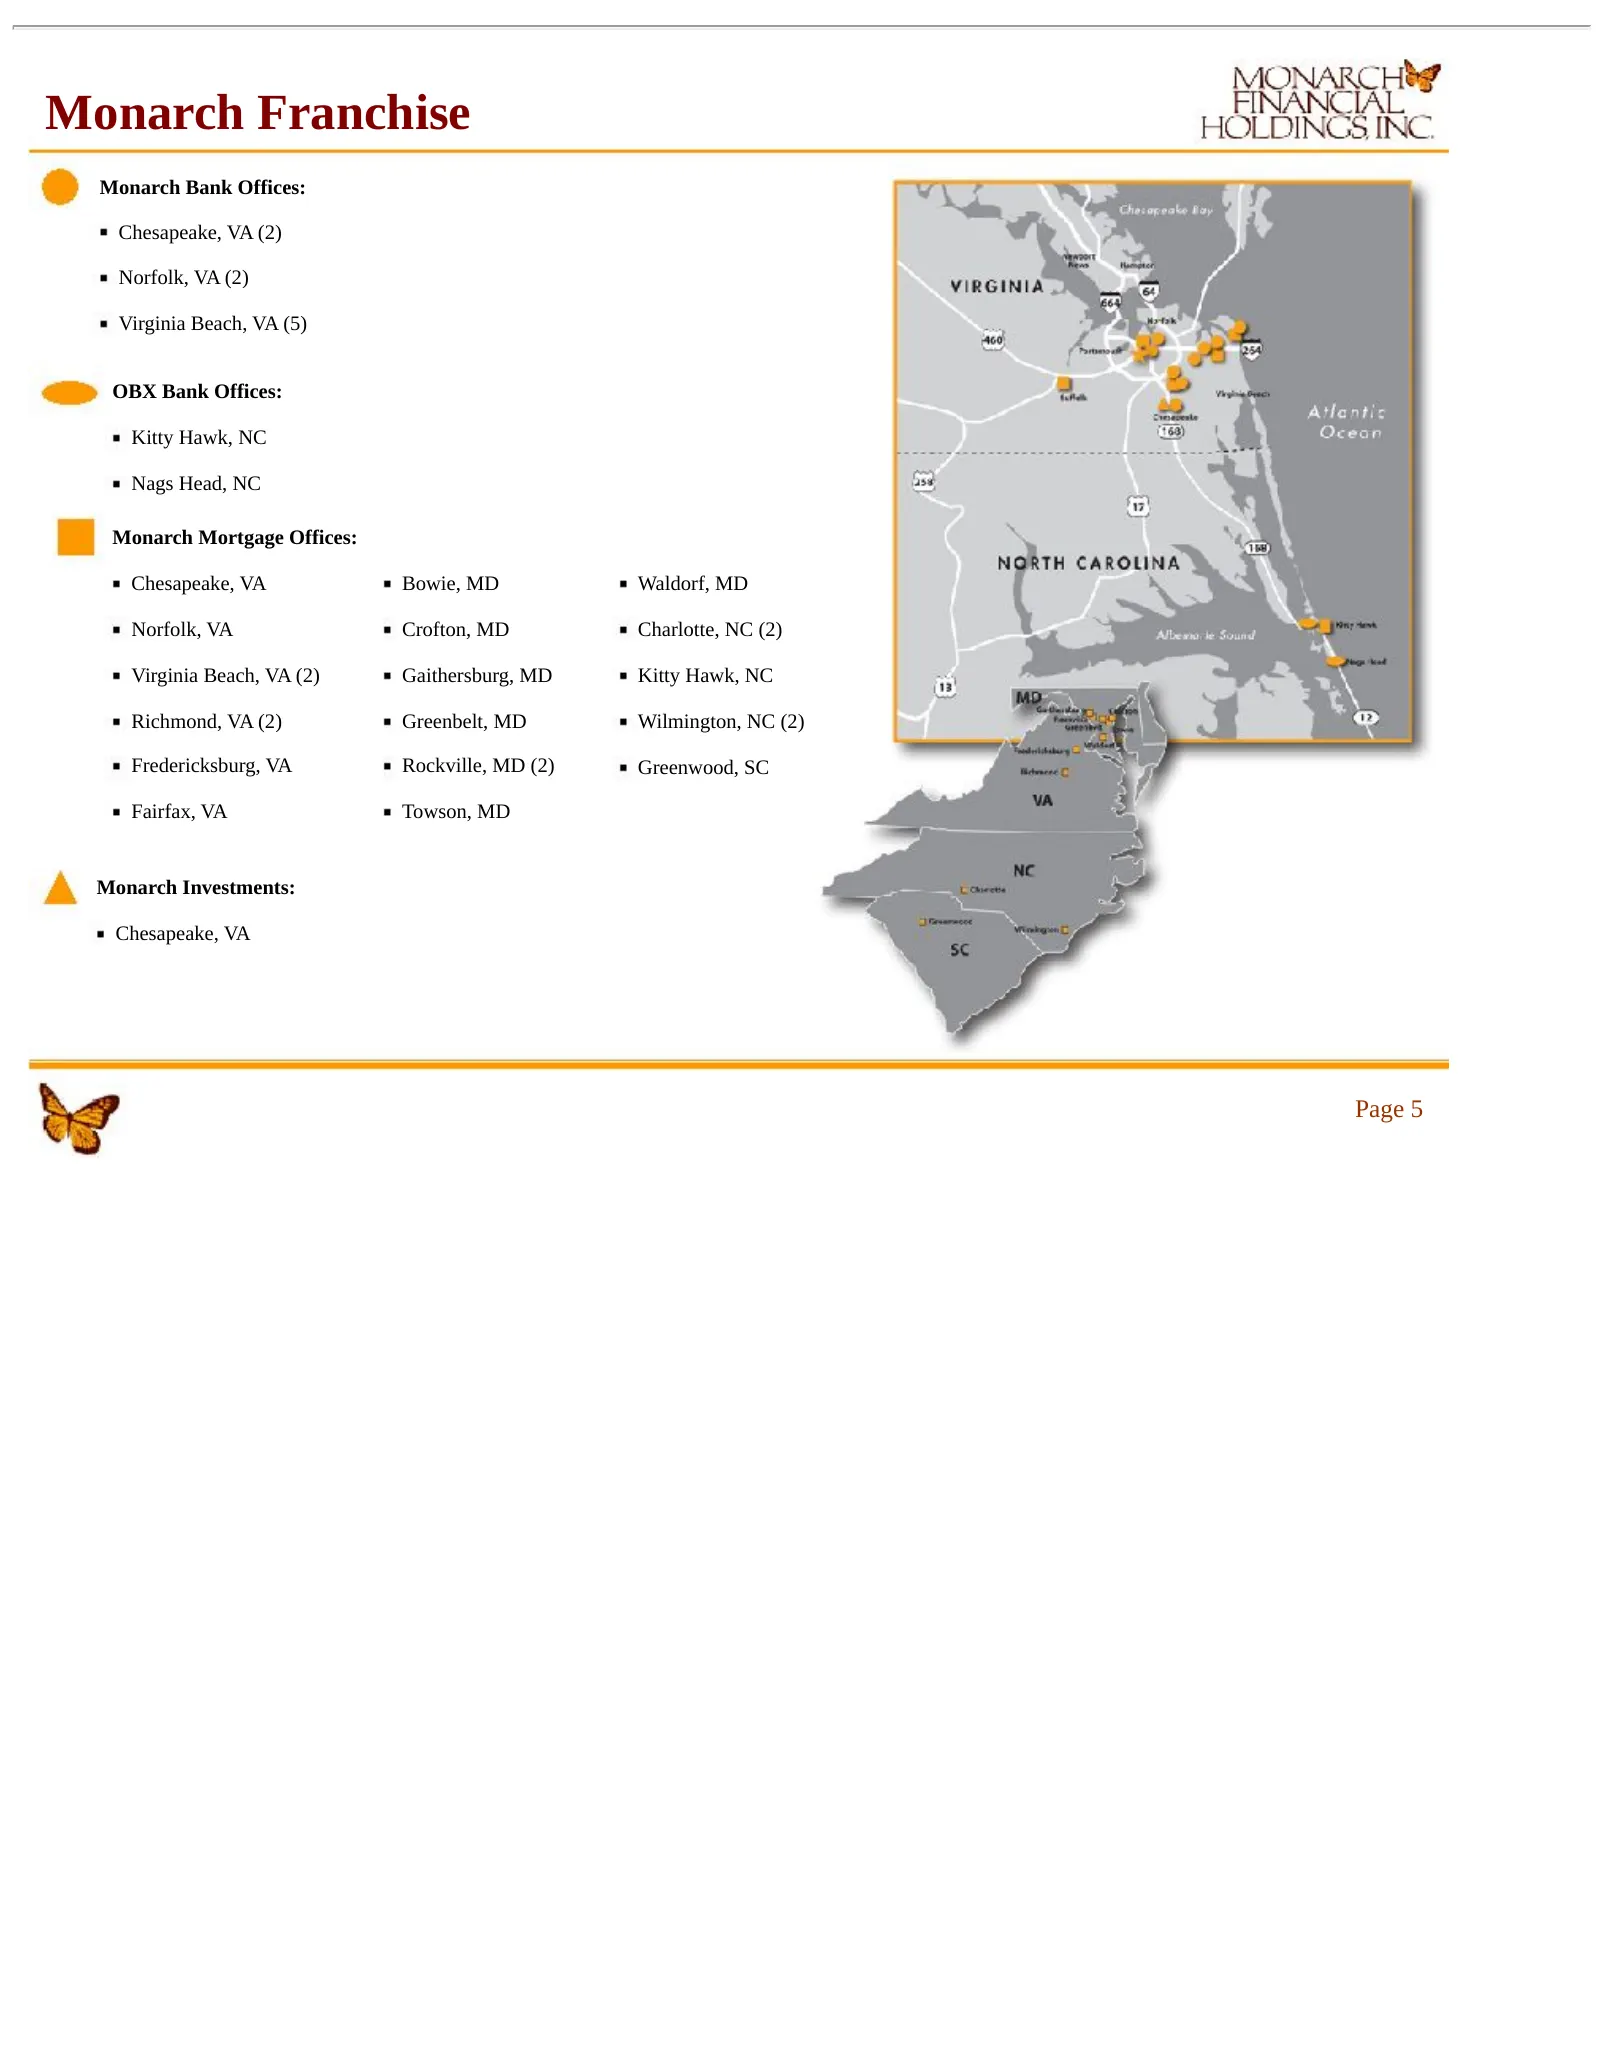
Monarch Franchise Monarch Bank Offices: Chesapeake, VA (2) Norfolk, VA (2) Virginia Beach, VA (5) OBX Bank Offices: Kitty Hawk, NC Nags Head, NC Monarch Mortgage Offices: Chesapeake, VA Bowie, MD Waldorf, MD Norfolk, VA Crofton, MD Charlotte, NC (2) Virginia Beach, VA (2) Gaithersburg, MD Kitty Hawk
Slide 6: Experienced Management Team
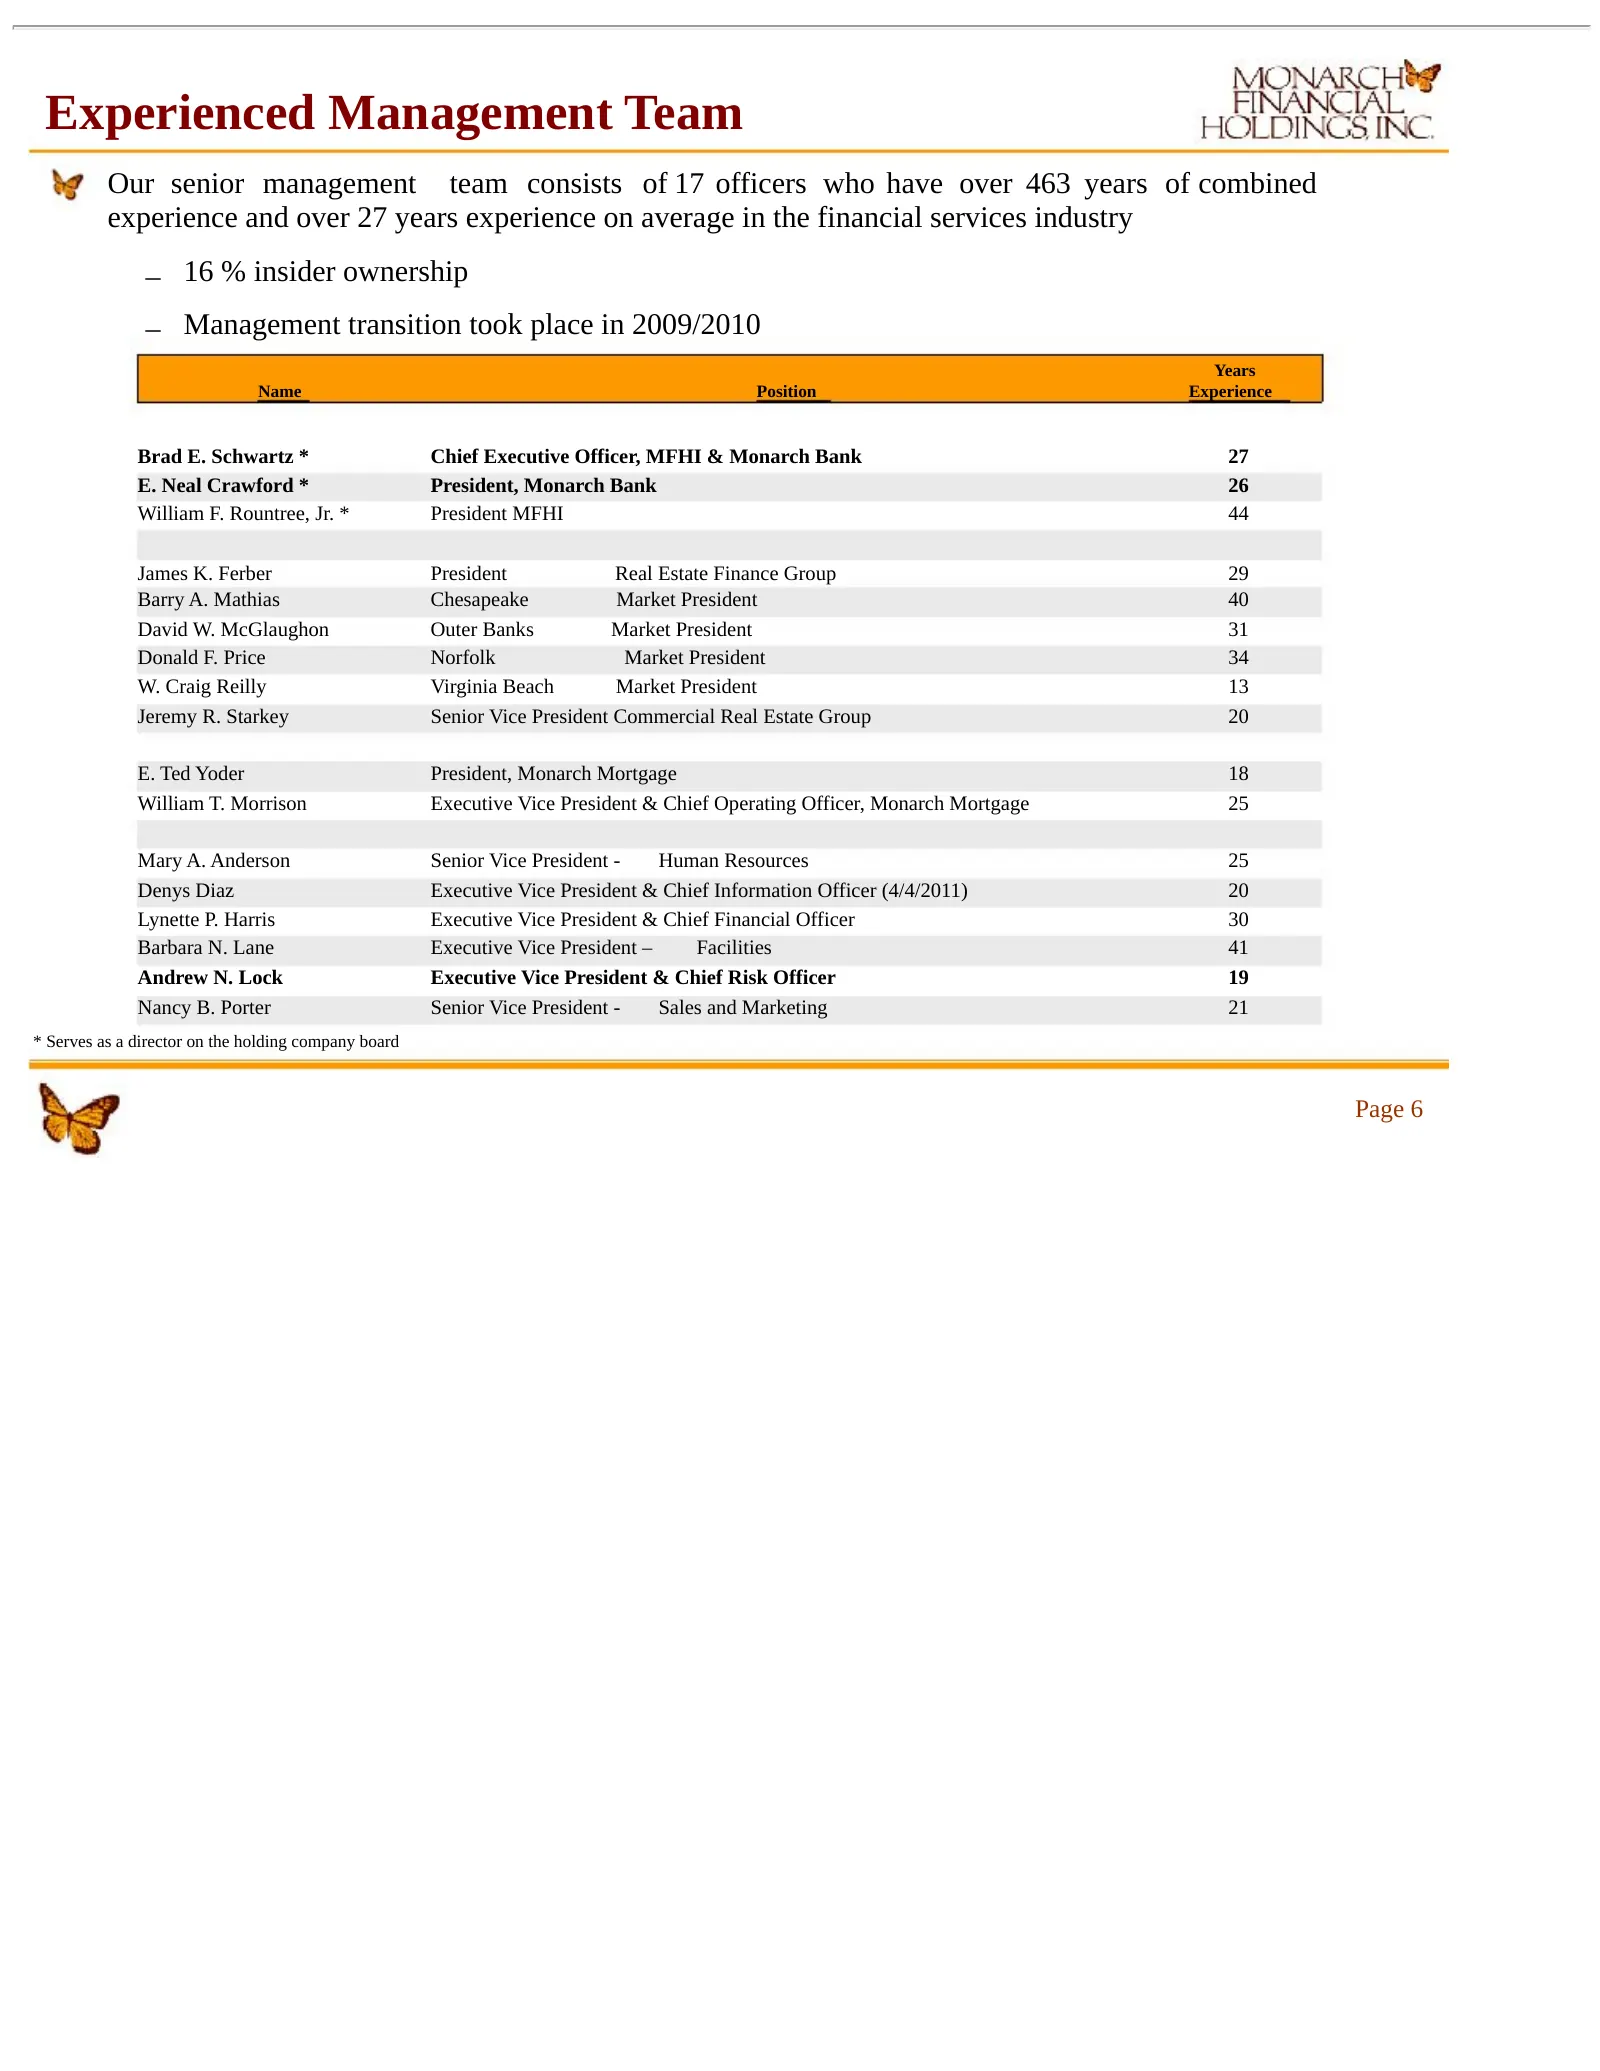
Experienced Management Team Our senior management team consists of 17 officers who have over 463 years of combined experience and over 27 years experience on average in the financial services industry – 16 % insider ownership – Management transition took place in 2009/2010 Years Name Position Experi
Slide 7: Monarch Mortgage
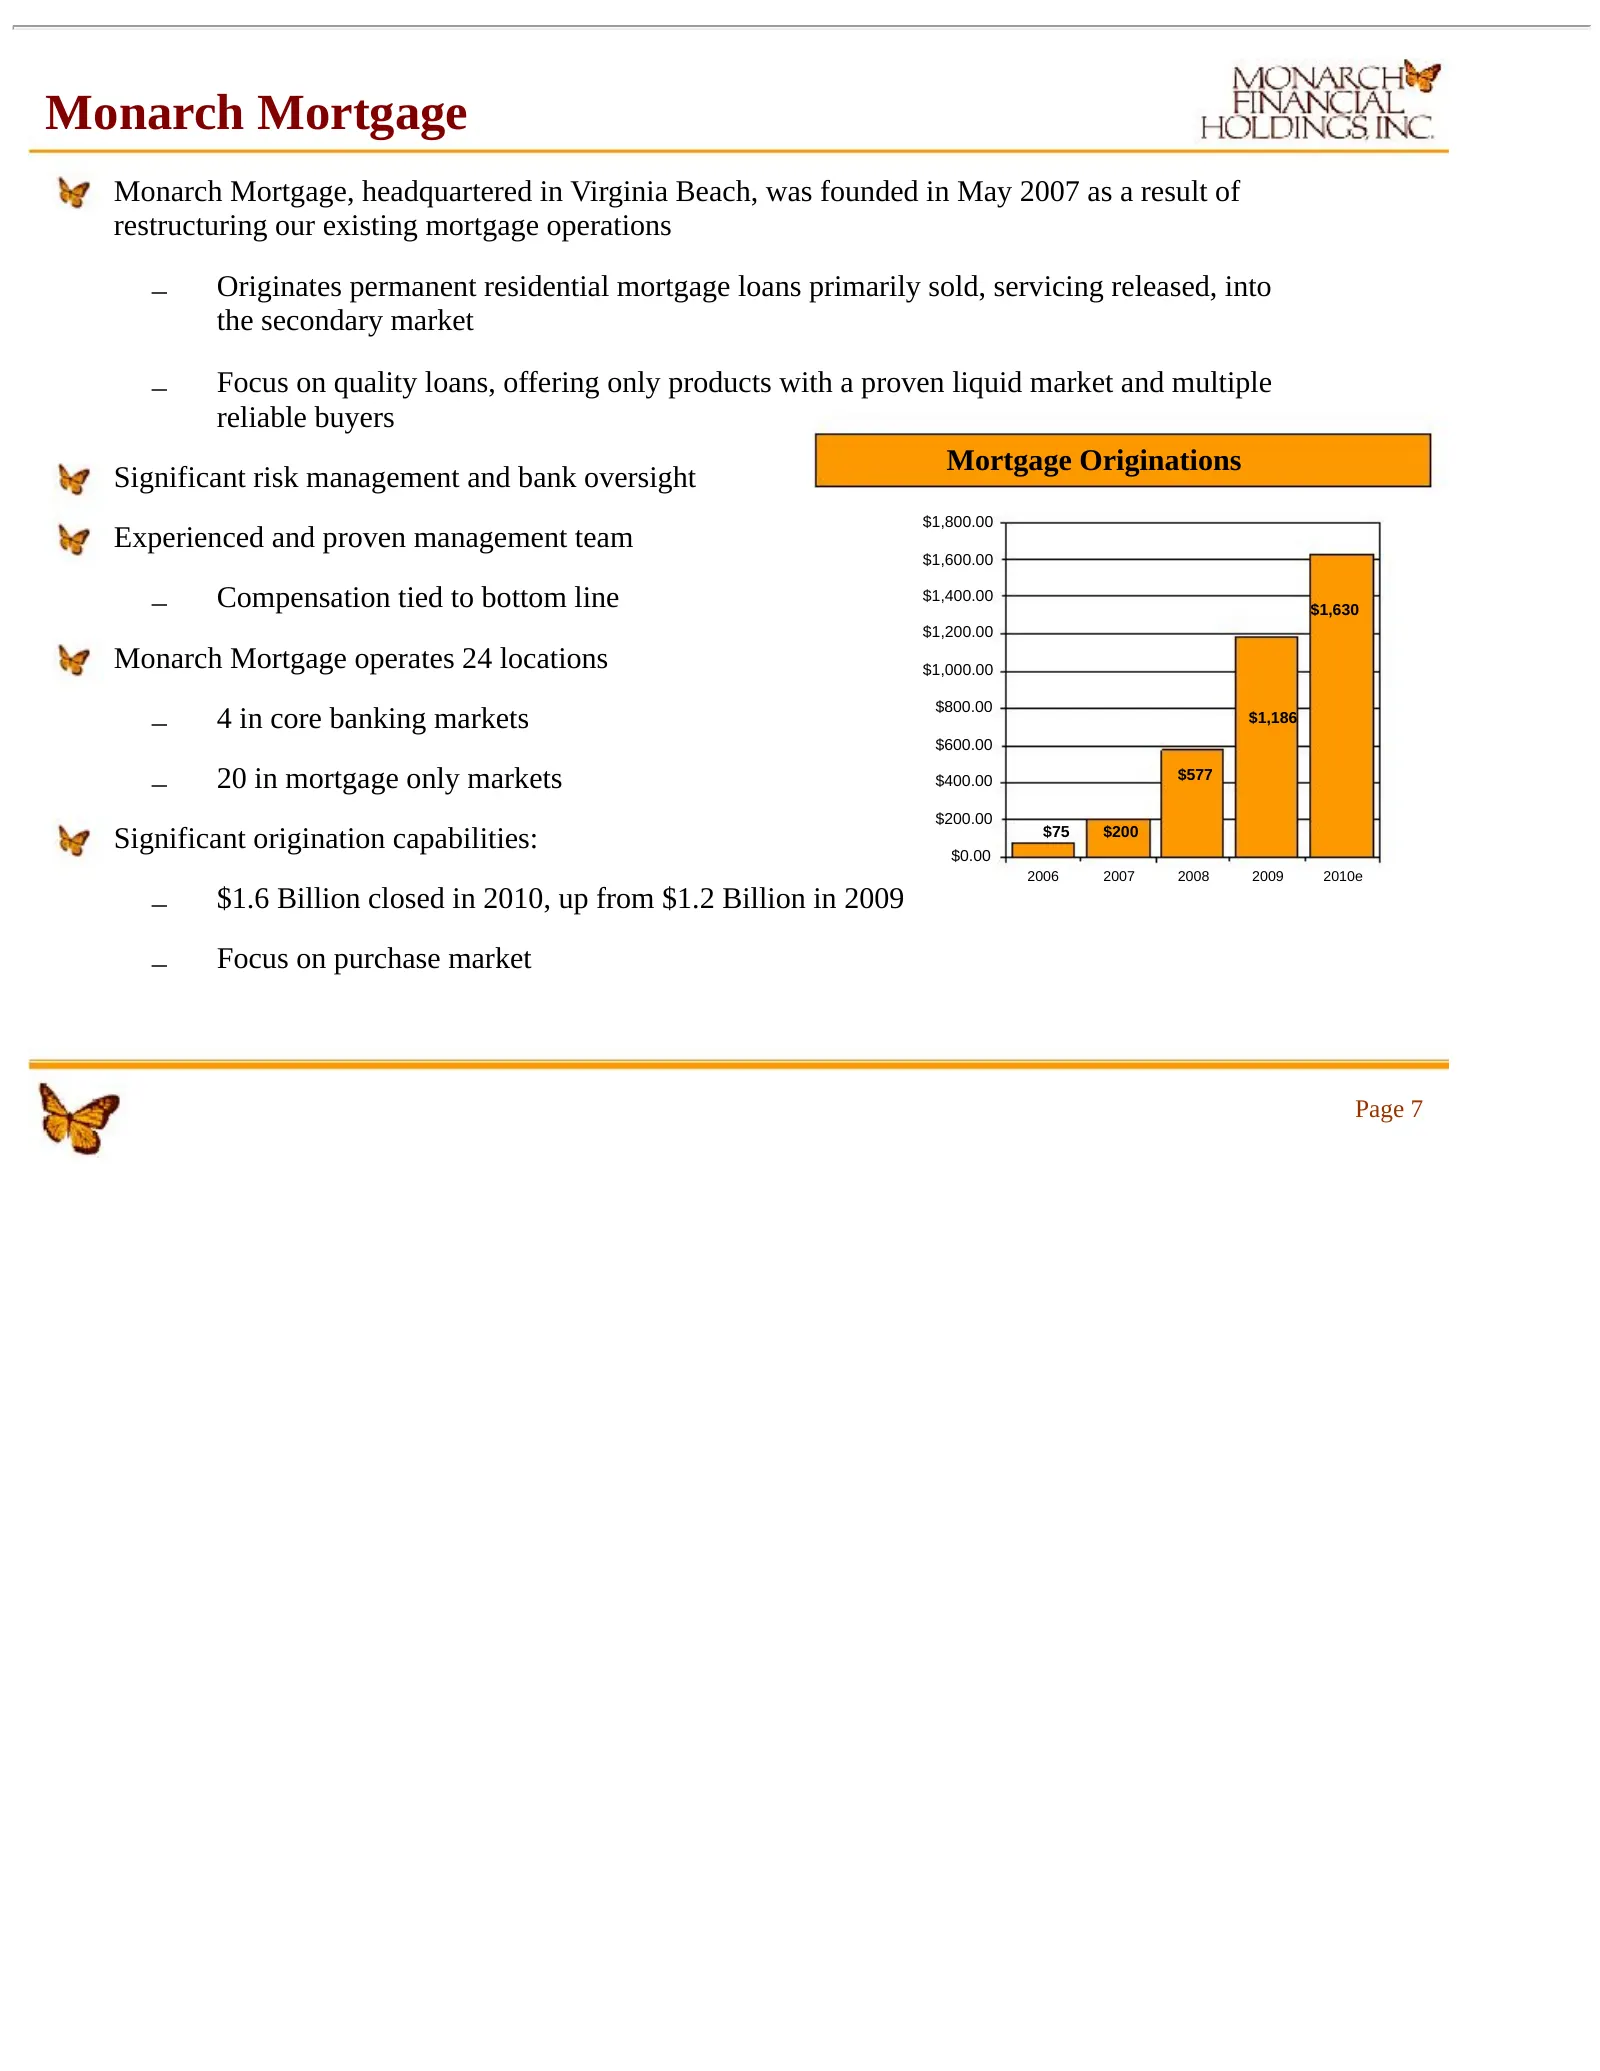
Monarch Mortgage Monarch Mortgage, headquartered in Virginia Beach, was founded in May 2007 as a result of restructuring our existing mortgage operations – Originates permanent residential mortgage loans primarily sold, servicing released, into the secondary market – Focus on quality loans, offering
Slide 8: Capital Events
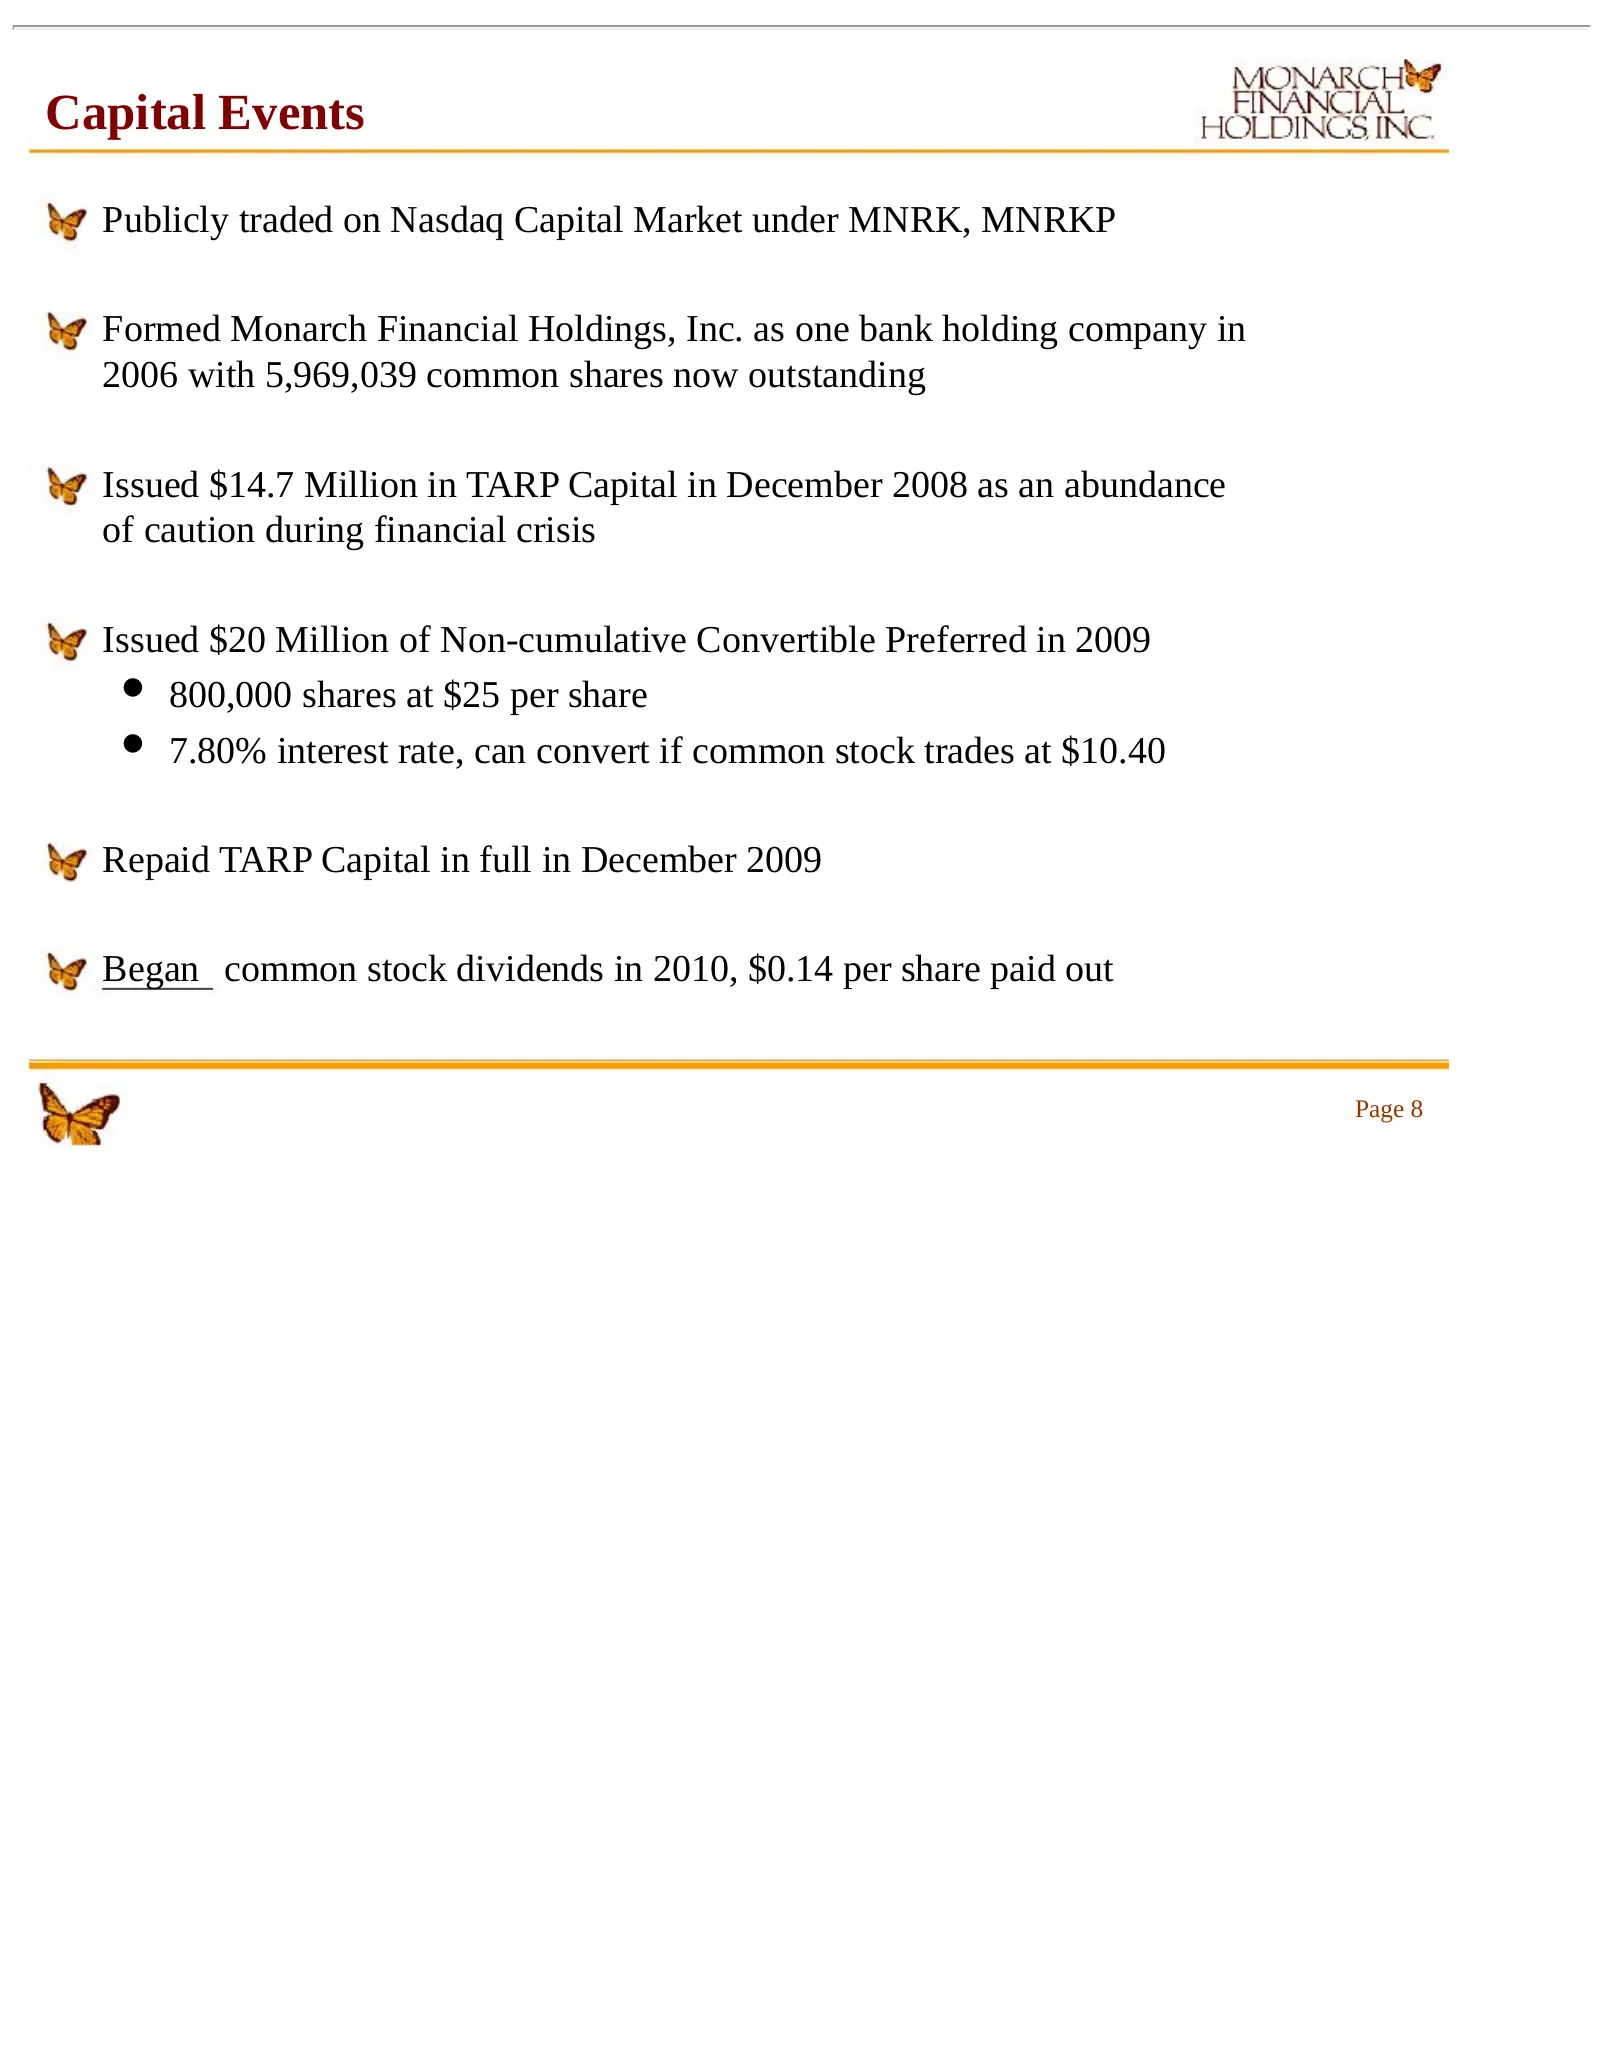
Capital Events Publicly traded on Nasdaq Capital Market under MNRK, MNRKP Formed Monarch Financial Holdings, Inc. as one bank holding company in 2006 with 5,969,039 common shares now outstanding Issued $14.7 Million in TARP Capital in December 2008 as an abundance of caution during financial crisis

Slide 9: Outside Recognition
Outside Recognition Received Bauer top 5-STAR rating for 5 th Quarter in a row Scott and Stringfellow “Buy” recommendation Recognized as “Rising 20” top growth company in Hampton Roads Recognized by Inside Business as one of the “Best Places to Work” in Hampton Roads in 2007 and 2009 January 4, 2011
Slide 10: Our “Smart Growth” Business Strategy
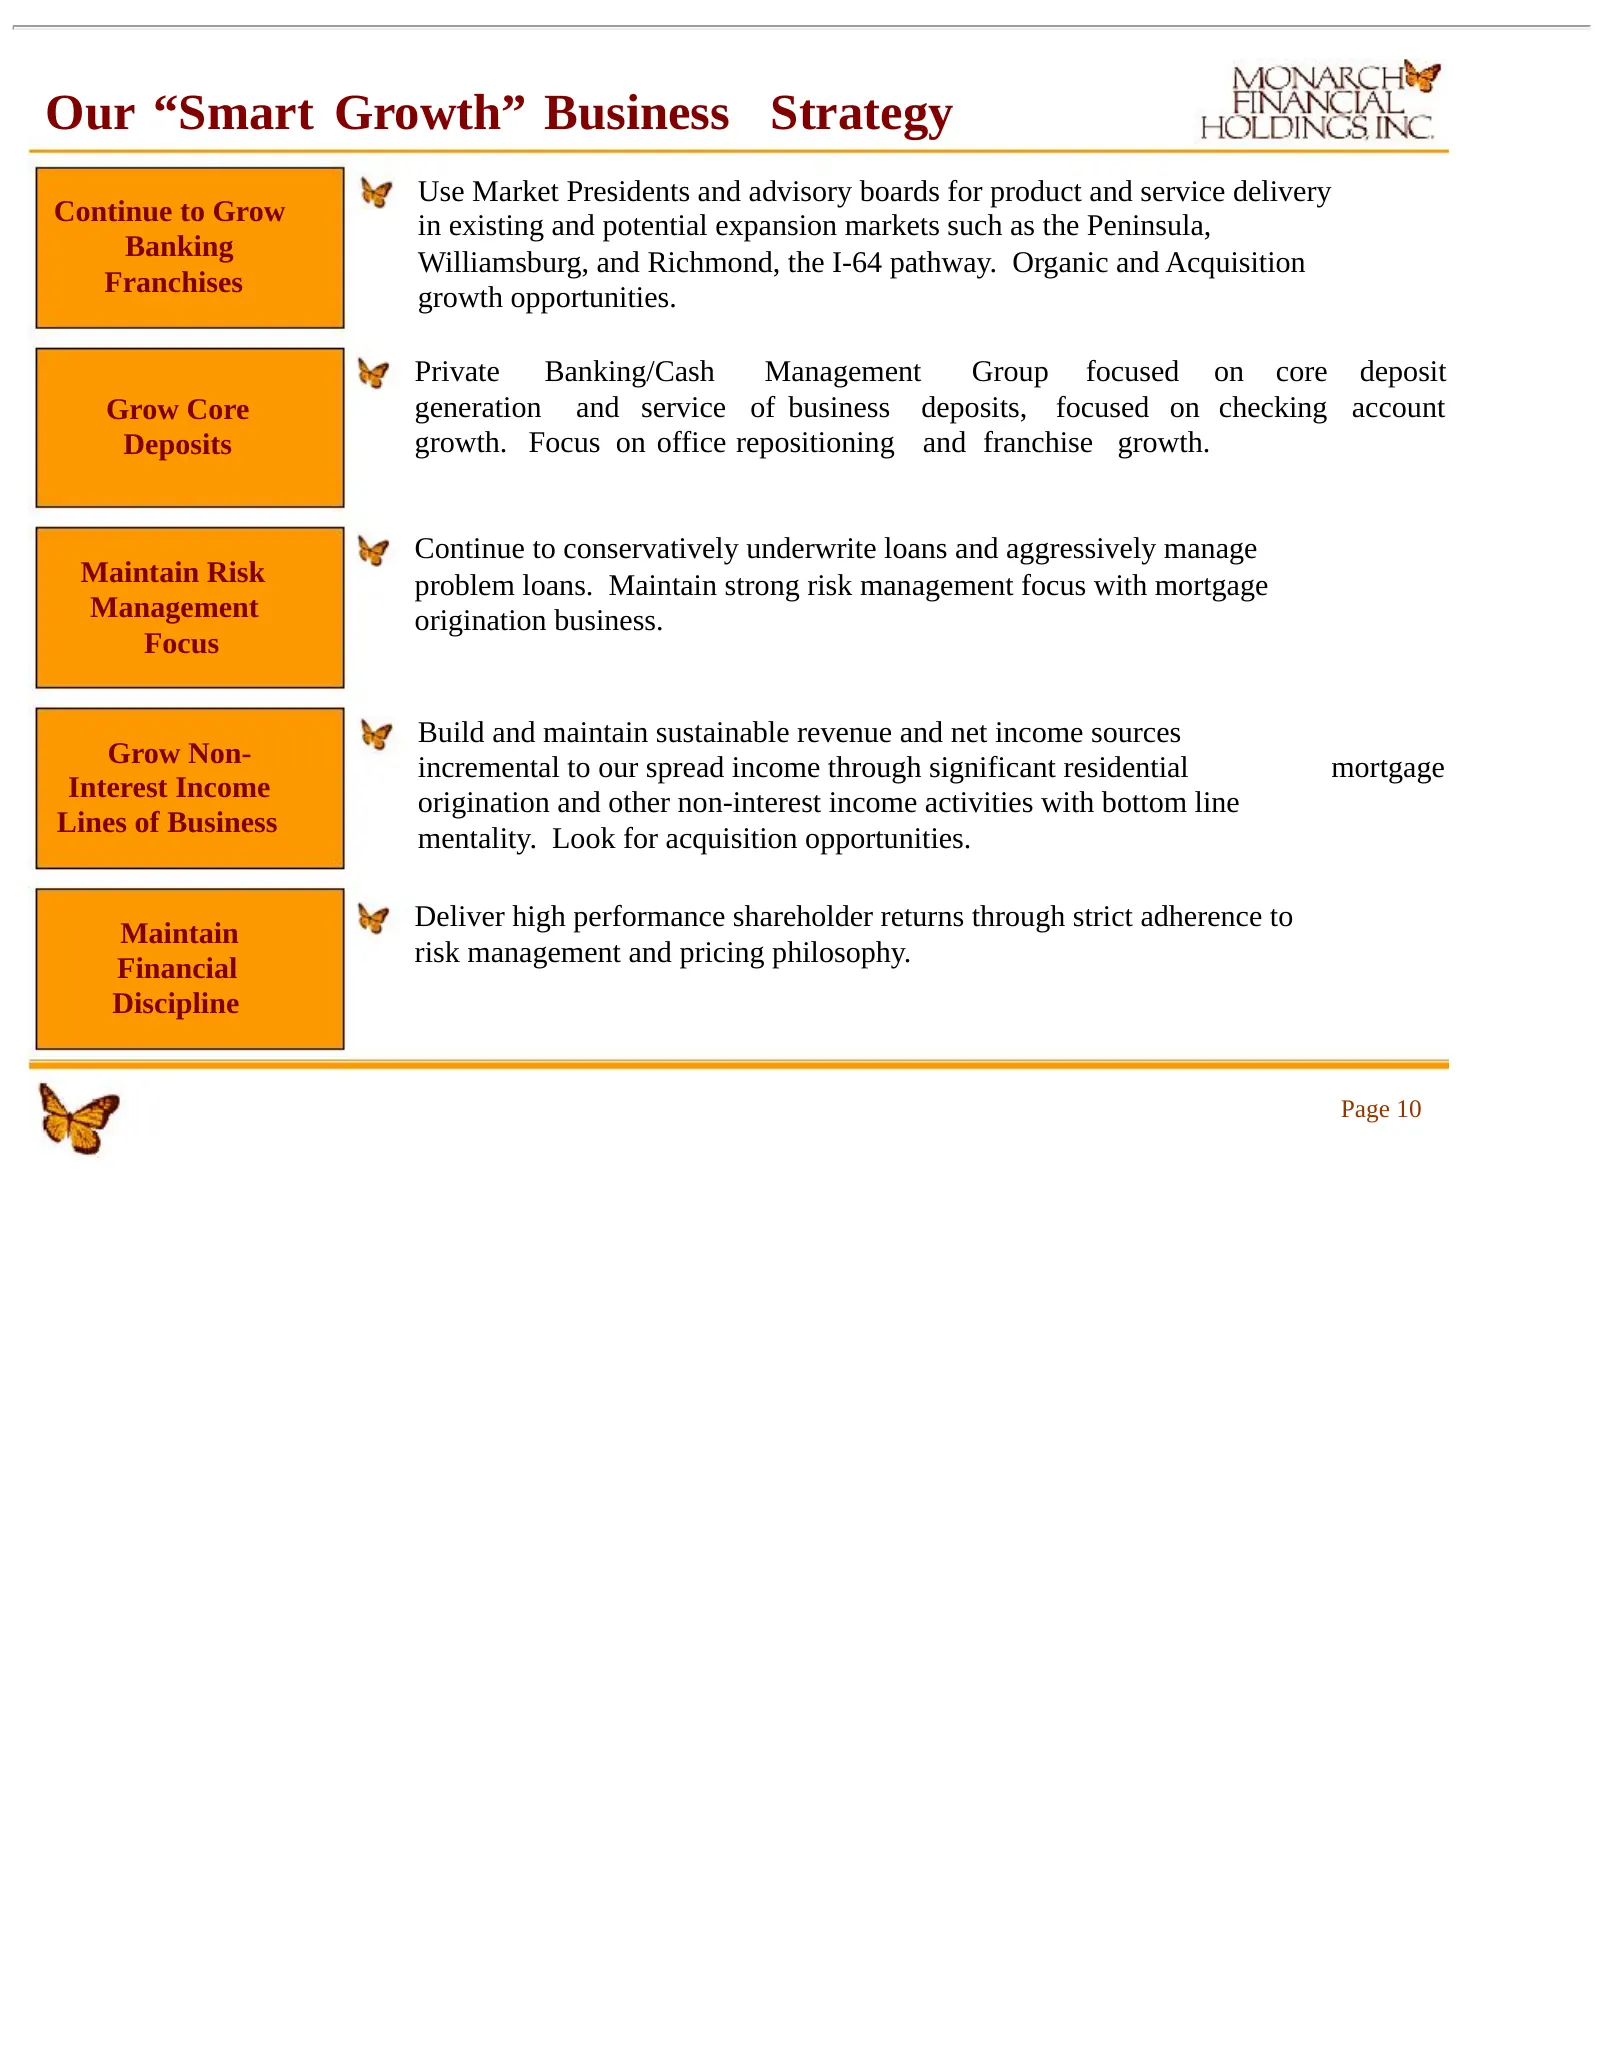
Our “Smart Growth” Business Strategy Use Market Presidents and advisory boards for product and service delivery Continue to Grow in existing and potential expansion markets such as the Peninsula, Banking Williamsburg, and Richmond, the I-64 pathway. Organic and Acquisition Franchises growth opportun
Slide 11: Financial Highlights
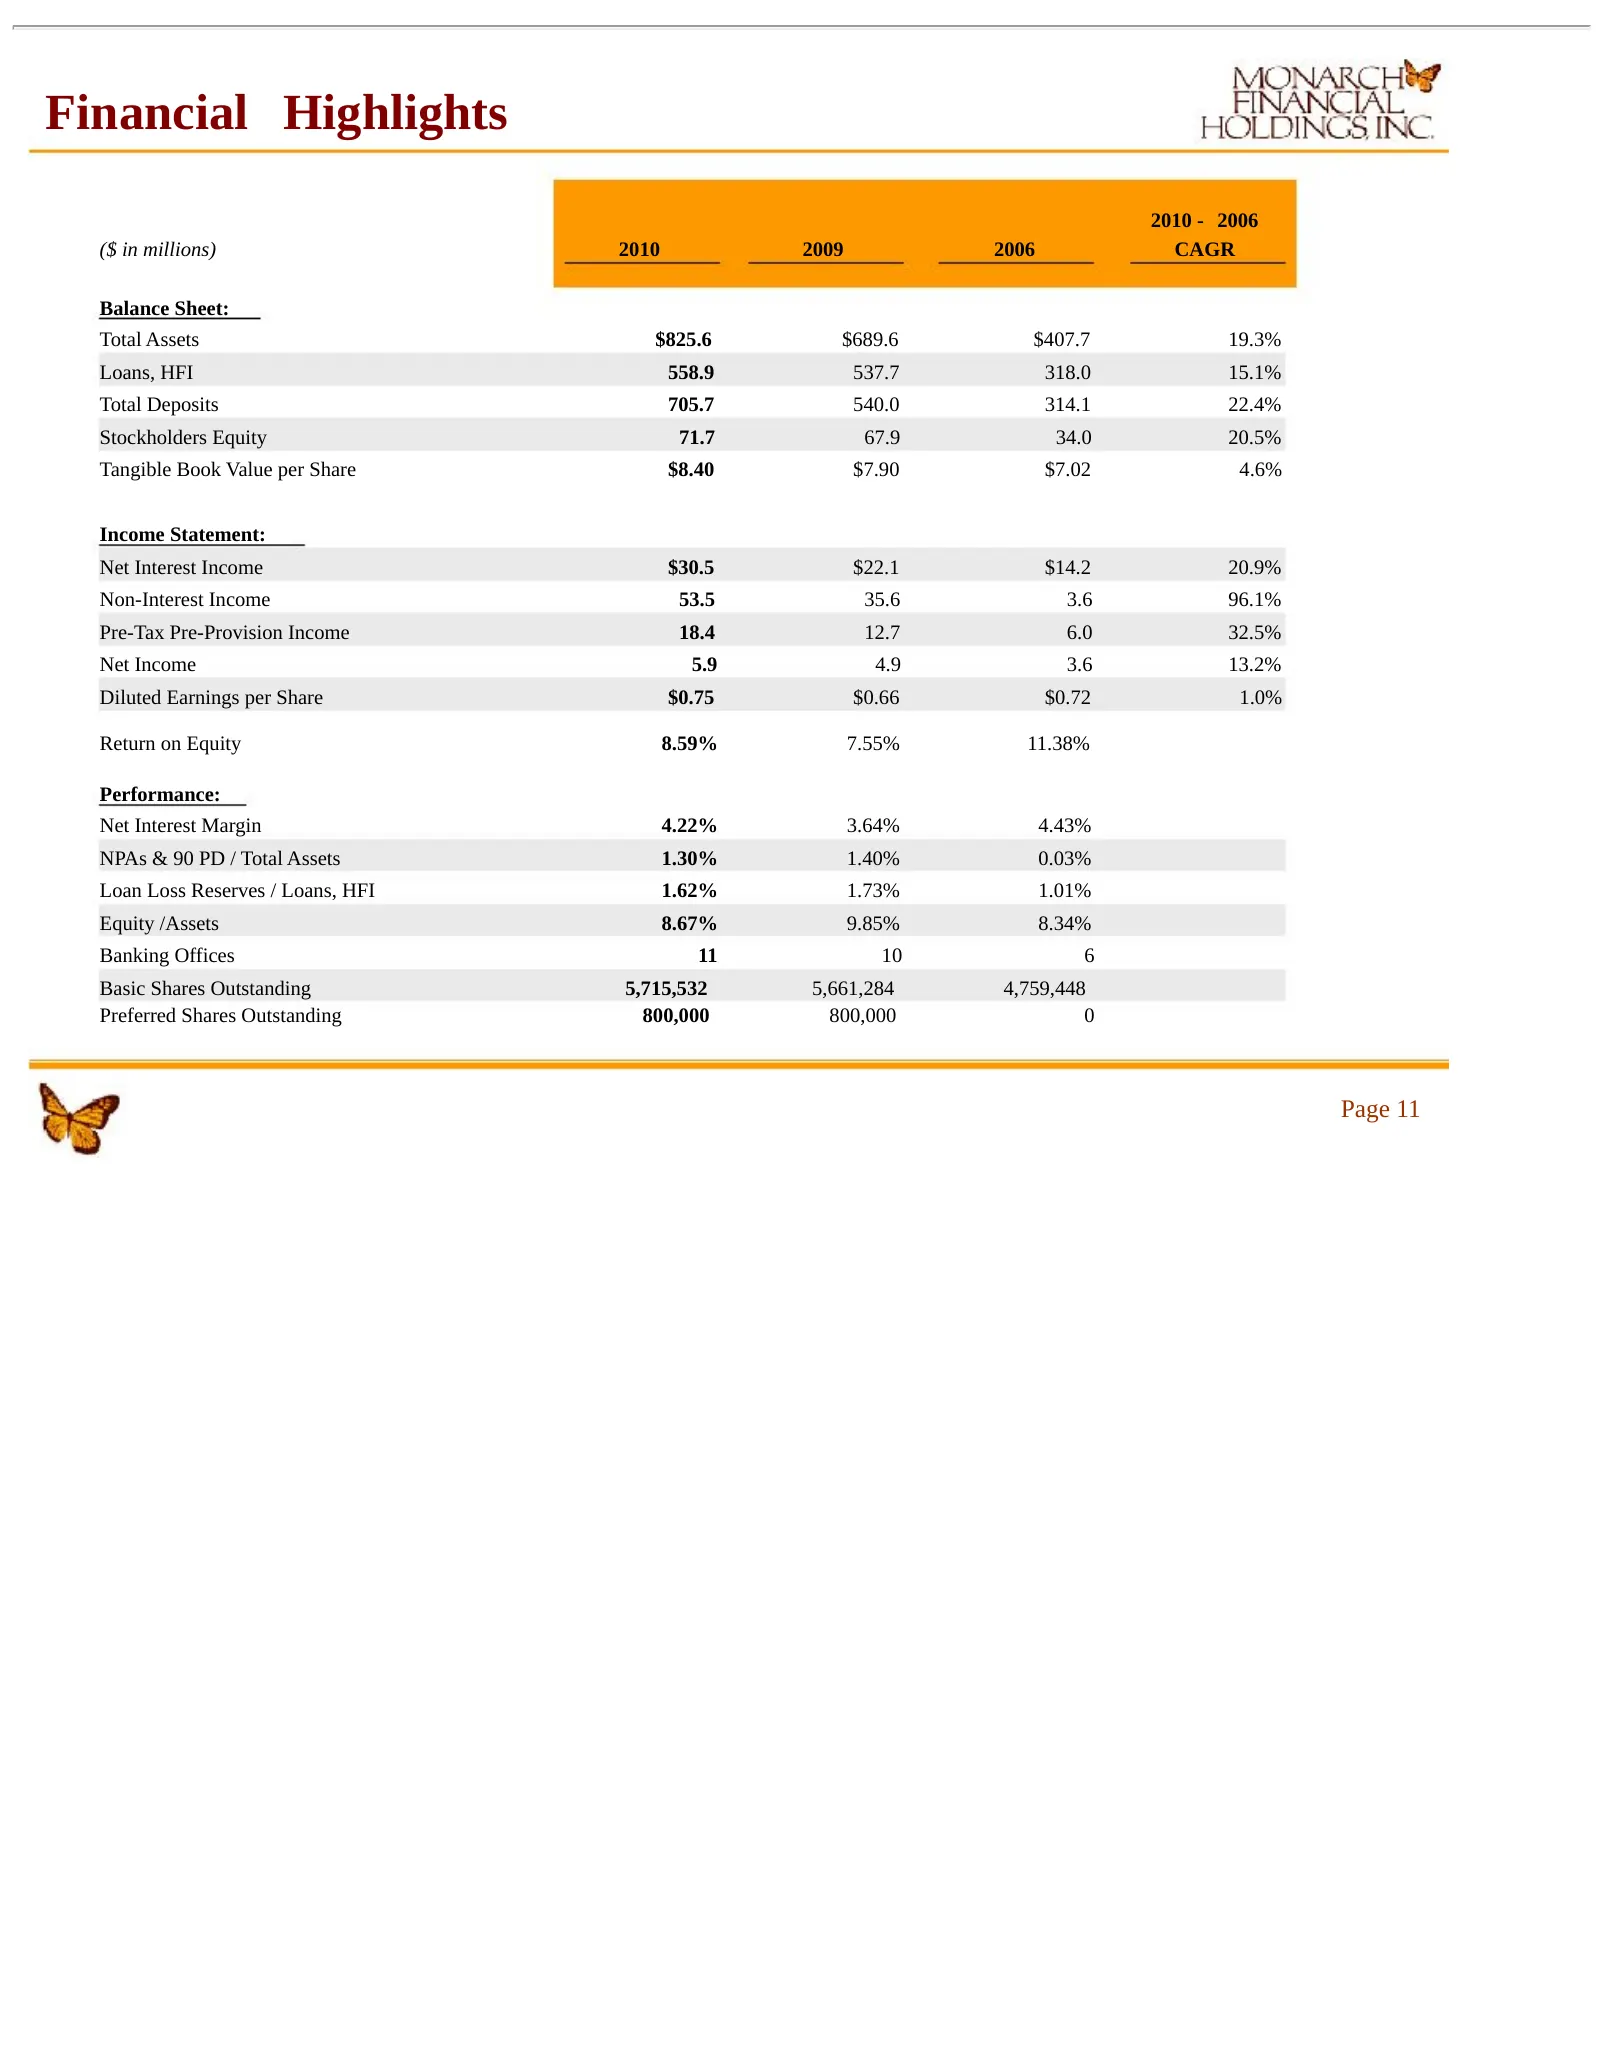
Financial Highlights 2010 - 2006 ($ in millions) 2010 2009 2006 CAGR Balance Sheet: Total Assets $825.6 $689.6 $407.7 19.3% Loans, HFI 558.9 537.7 318.0 15.1% Total Deposits 705.7 540.0 314.1 22.4% Stockholders Equity 71.7 67.9 34.0 20.5% Tangible Book Value per Share $8.40 $7.90 $7.02 4.6% Income S
Slide 12: Strong Balance Sheet Growth – Total Assets
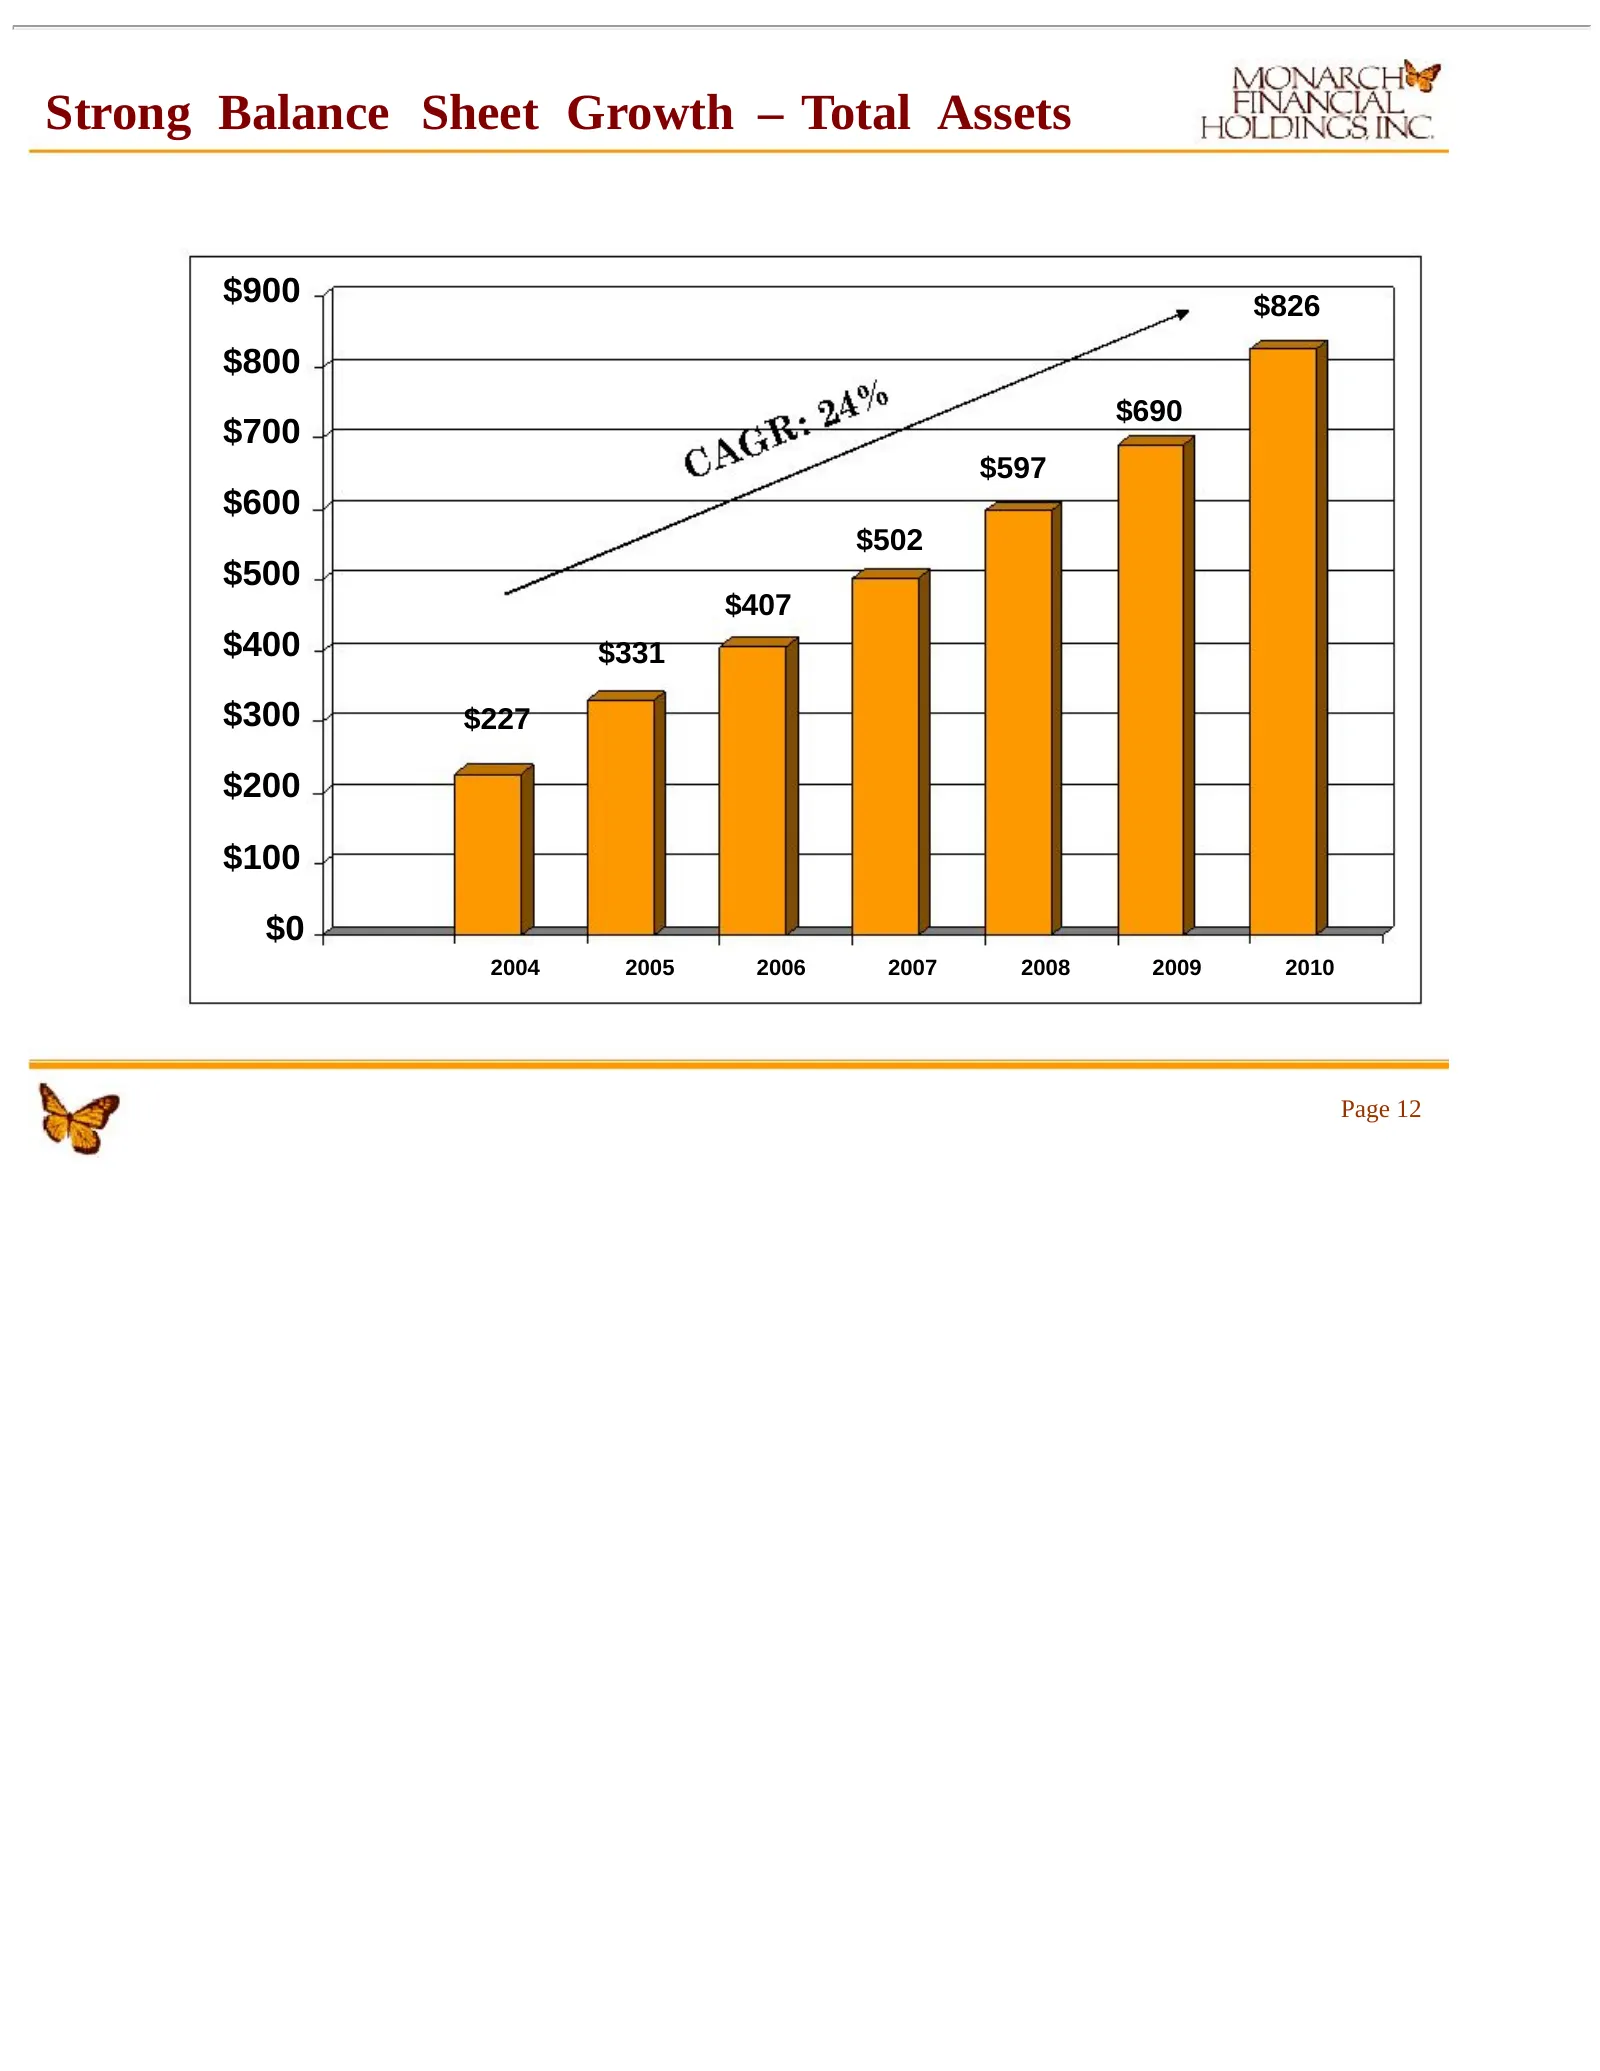
Strong Balance Sheet Growth – Total Assets $900 $826 $800 $690 $700 $597 $600 $502 $500 $407 $400 $331 $300 $227 $200 $100 $0 2004 2005 2006 2007 2008 2009 2010 Page 12
Slide 13: Strong Balance Sheet Growth – Loans
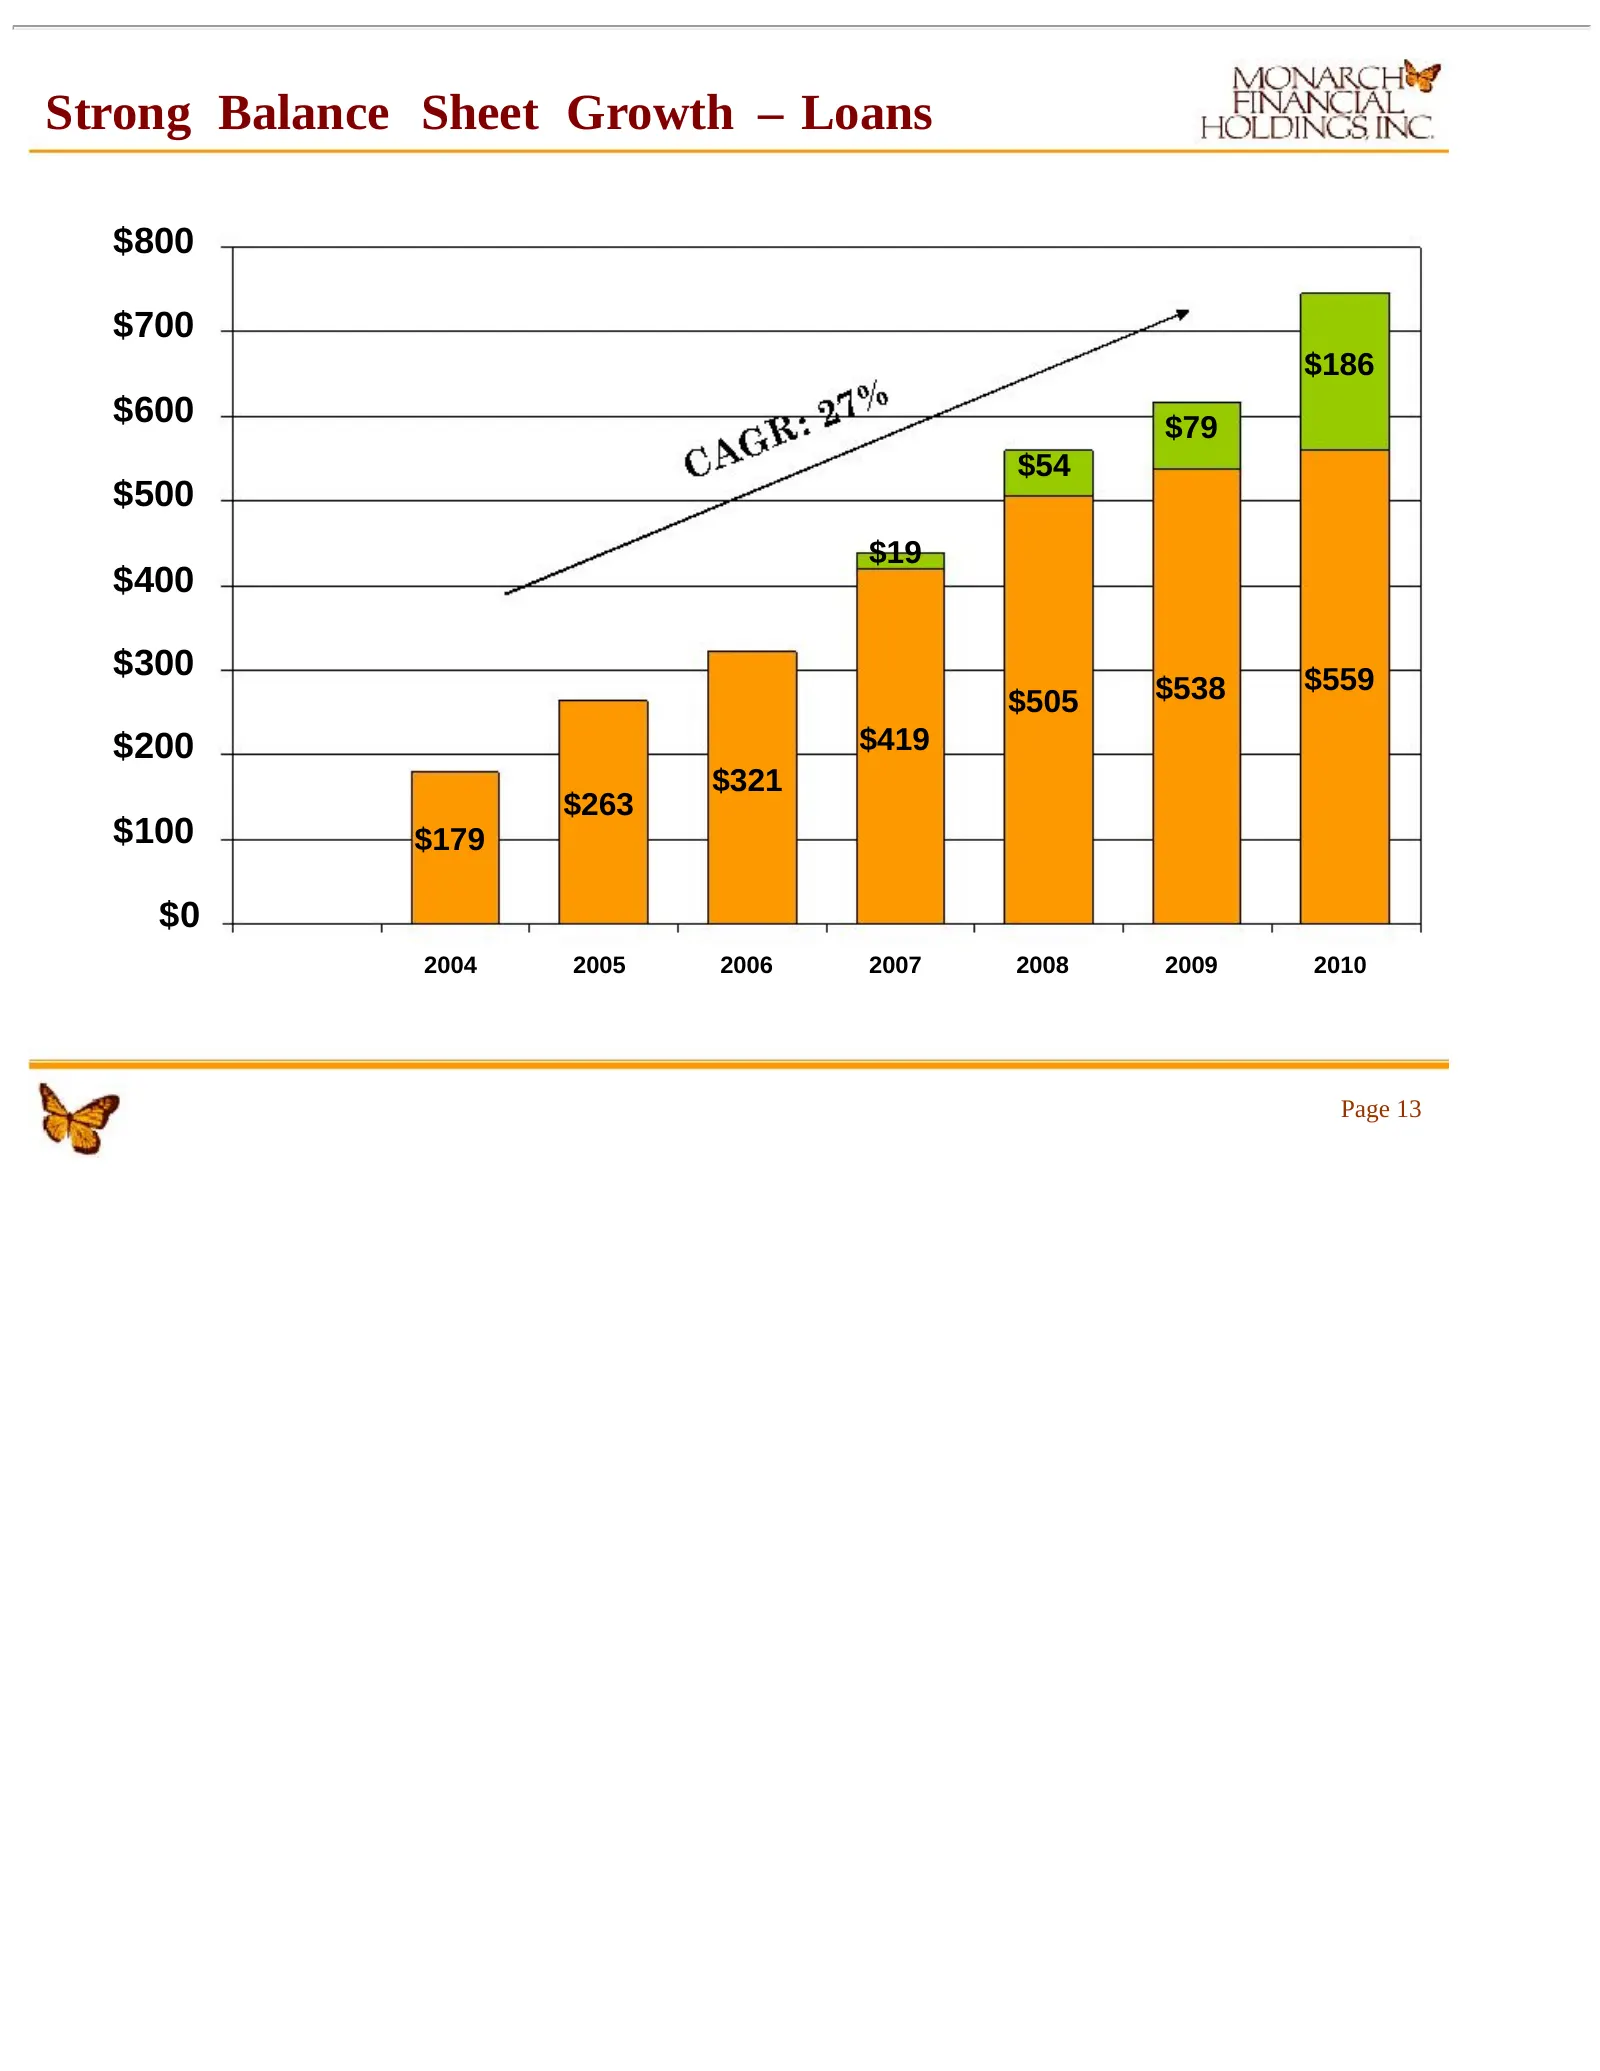
Strong Balance Sheet Growth – Loans $800 $700 $186 $600 $79 $54 $500 $19 $400 $300 $559 $505 $538 $200 $419 $321 $263 $100 $179 $0 2004 2005 2006 2007 2008 2009 2010 Page 13
Slide 14: Diversified Loan Portfolio
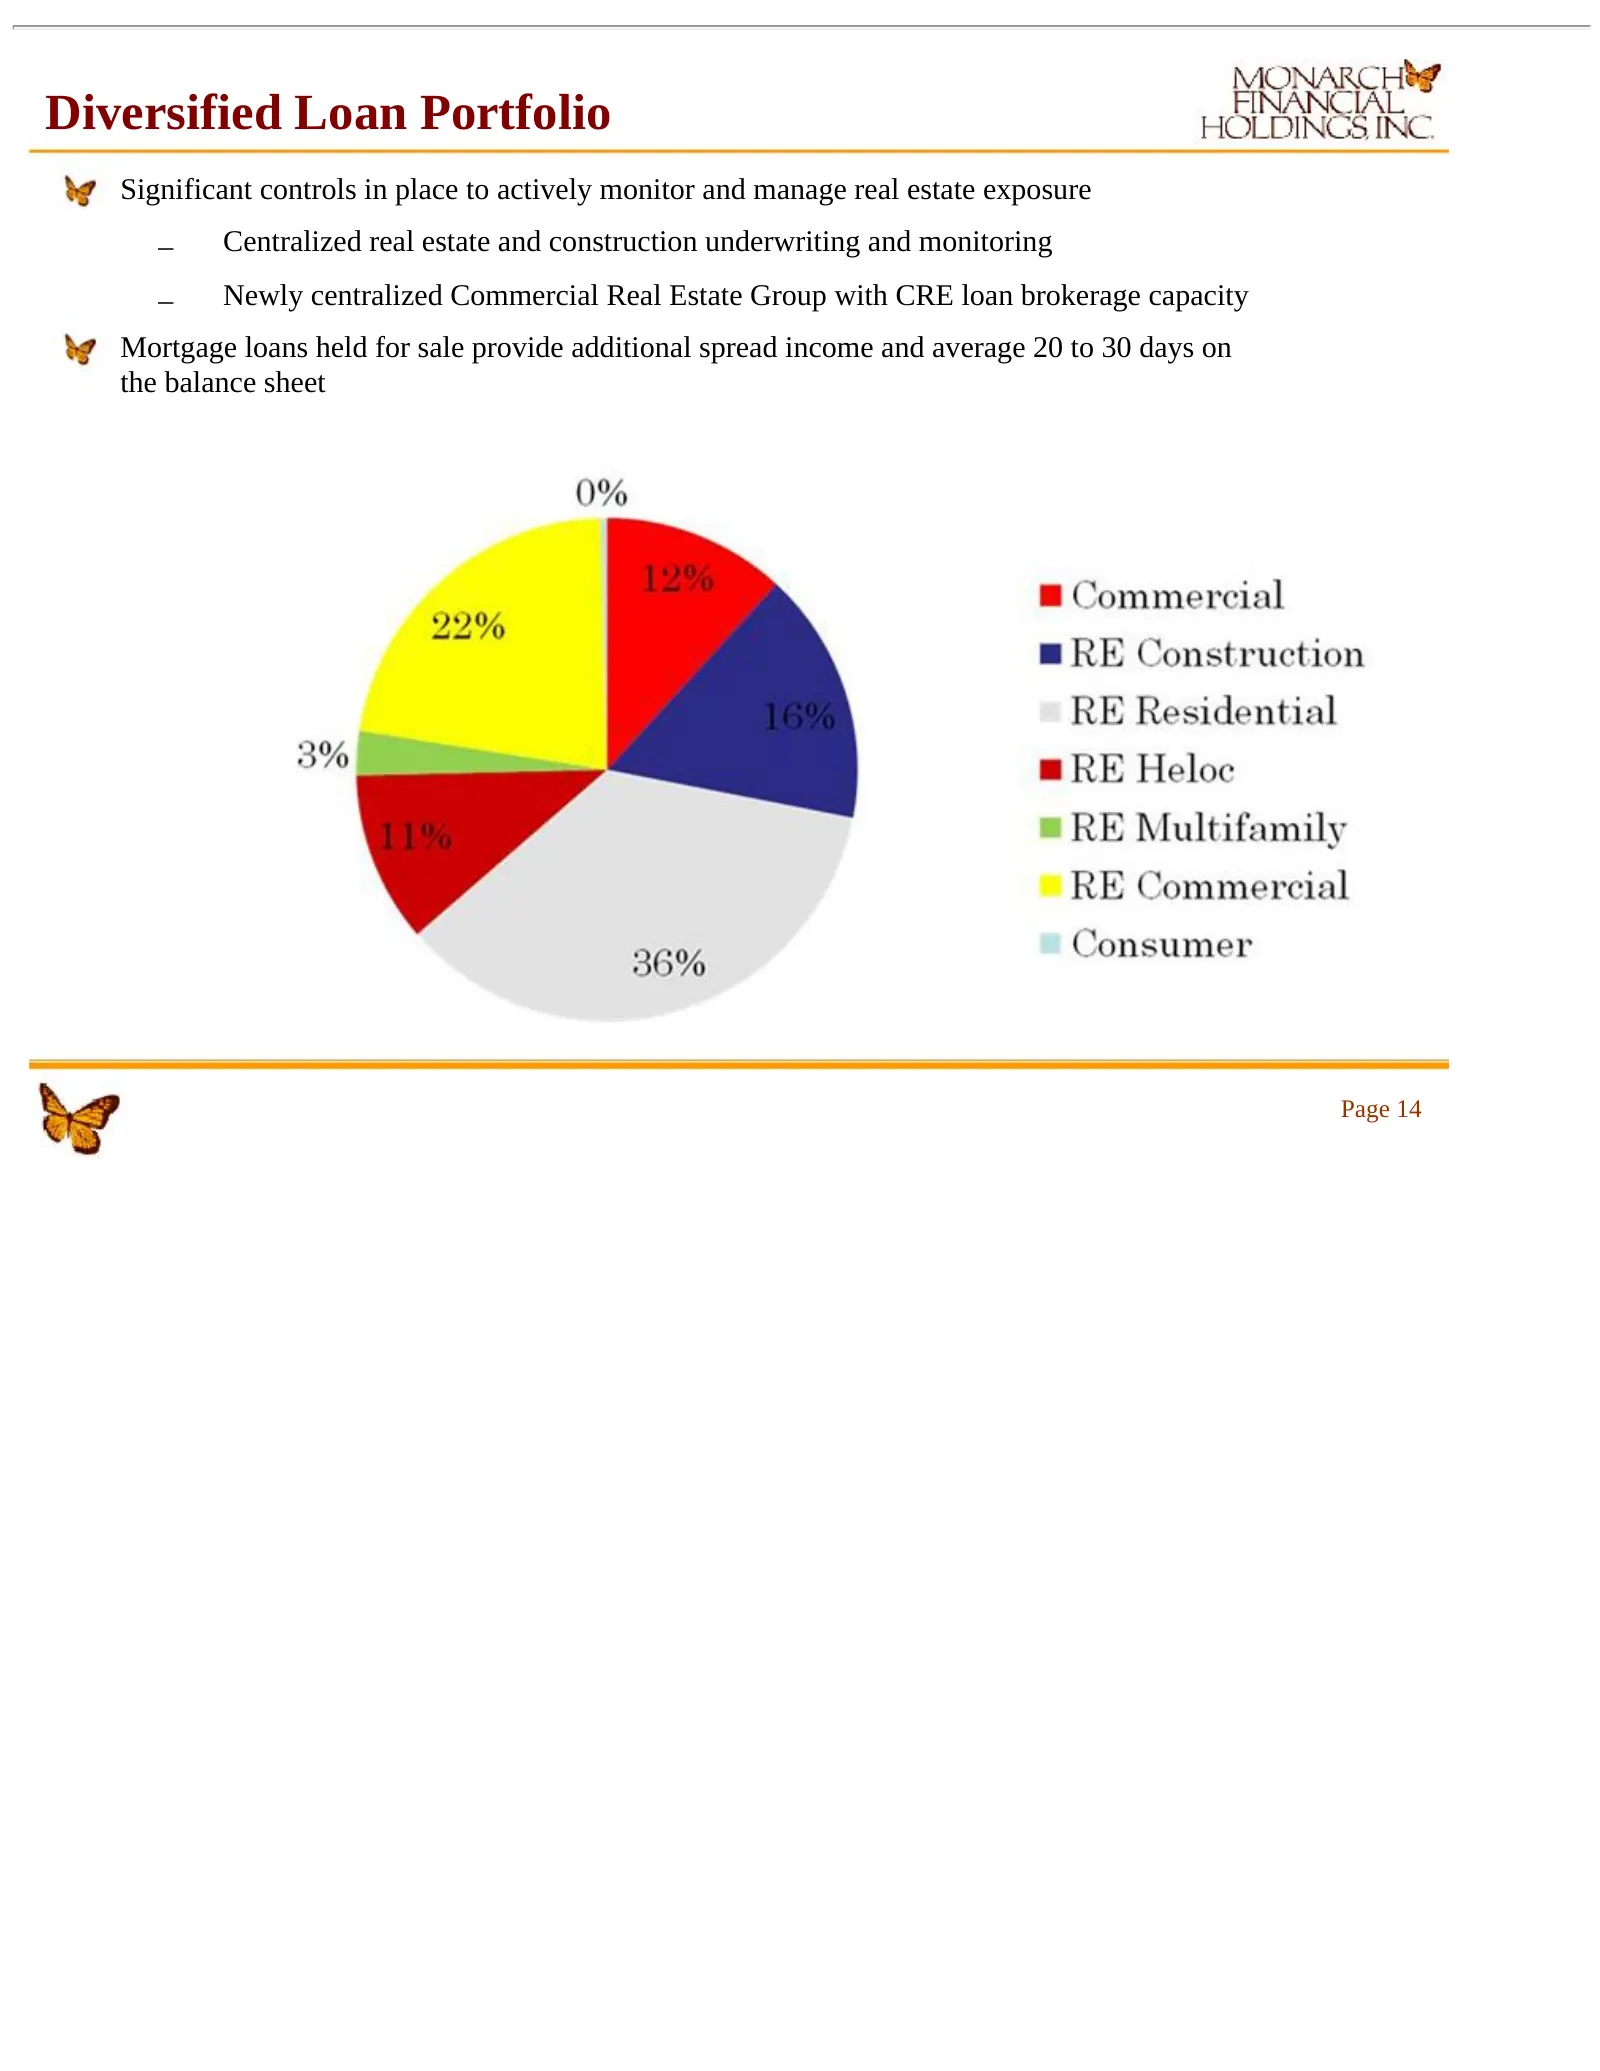
Diversified Loan Portfolio Significant controls in place to actively monitor and manage real estate exposure – Centralized real estate and construction underwriting and monitoring – Newly centralized Commercial Real Estate Group with CRE loan brokerage capacity Mortgage loans held for sale provide a
Slide 15: Strong Balance Sheet Growth - Deposits
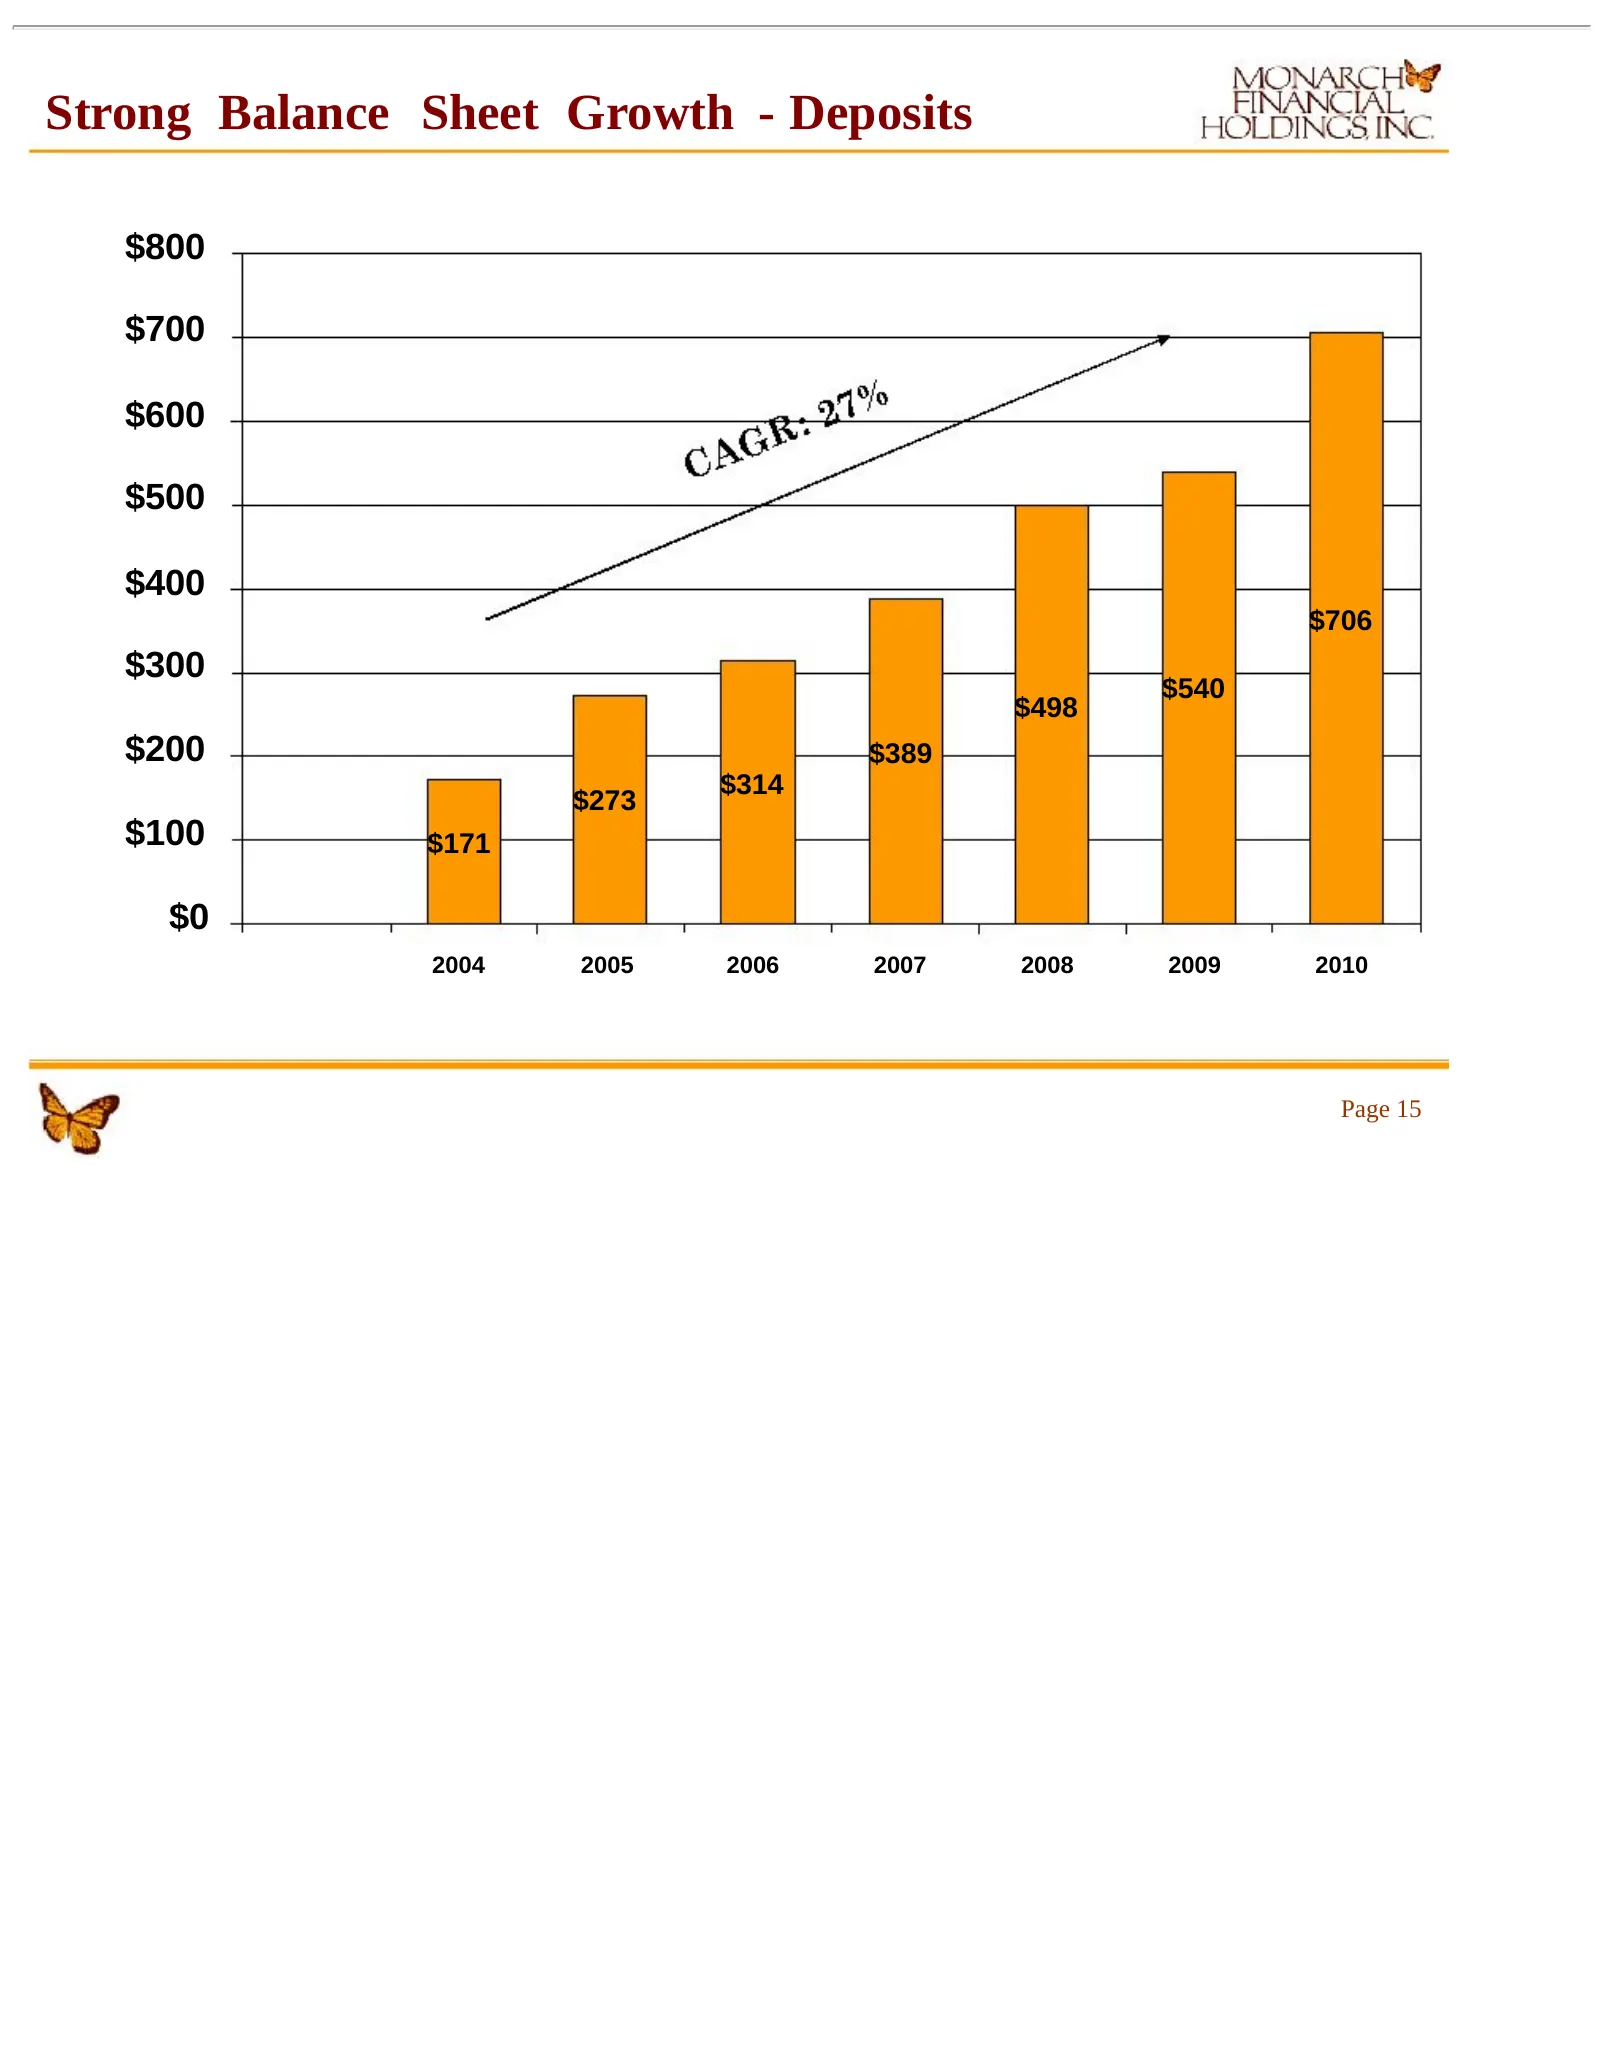
Strong Balance Sheet Growth - Deposits $800 $700 $600 $500 $400 $706 $300 $540 $498 $200 $389 $314 $273 $100 $171 $0 2004 2005 2006 2007 2008 2009 2010 Page 15
Slide 16: Grow Core Deposits
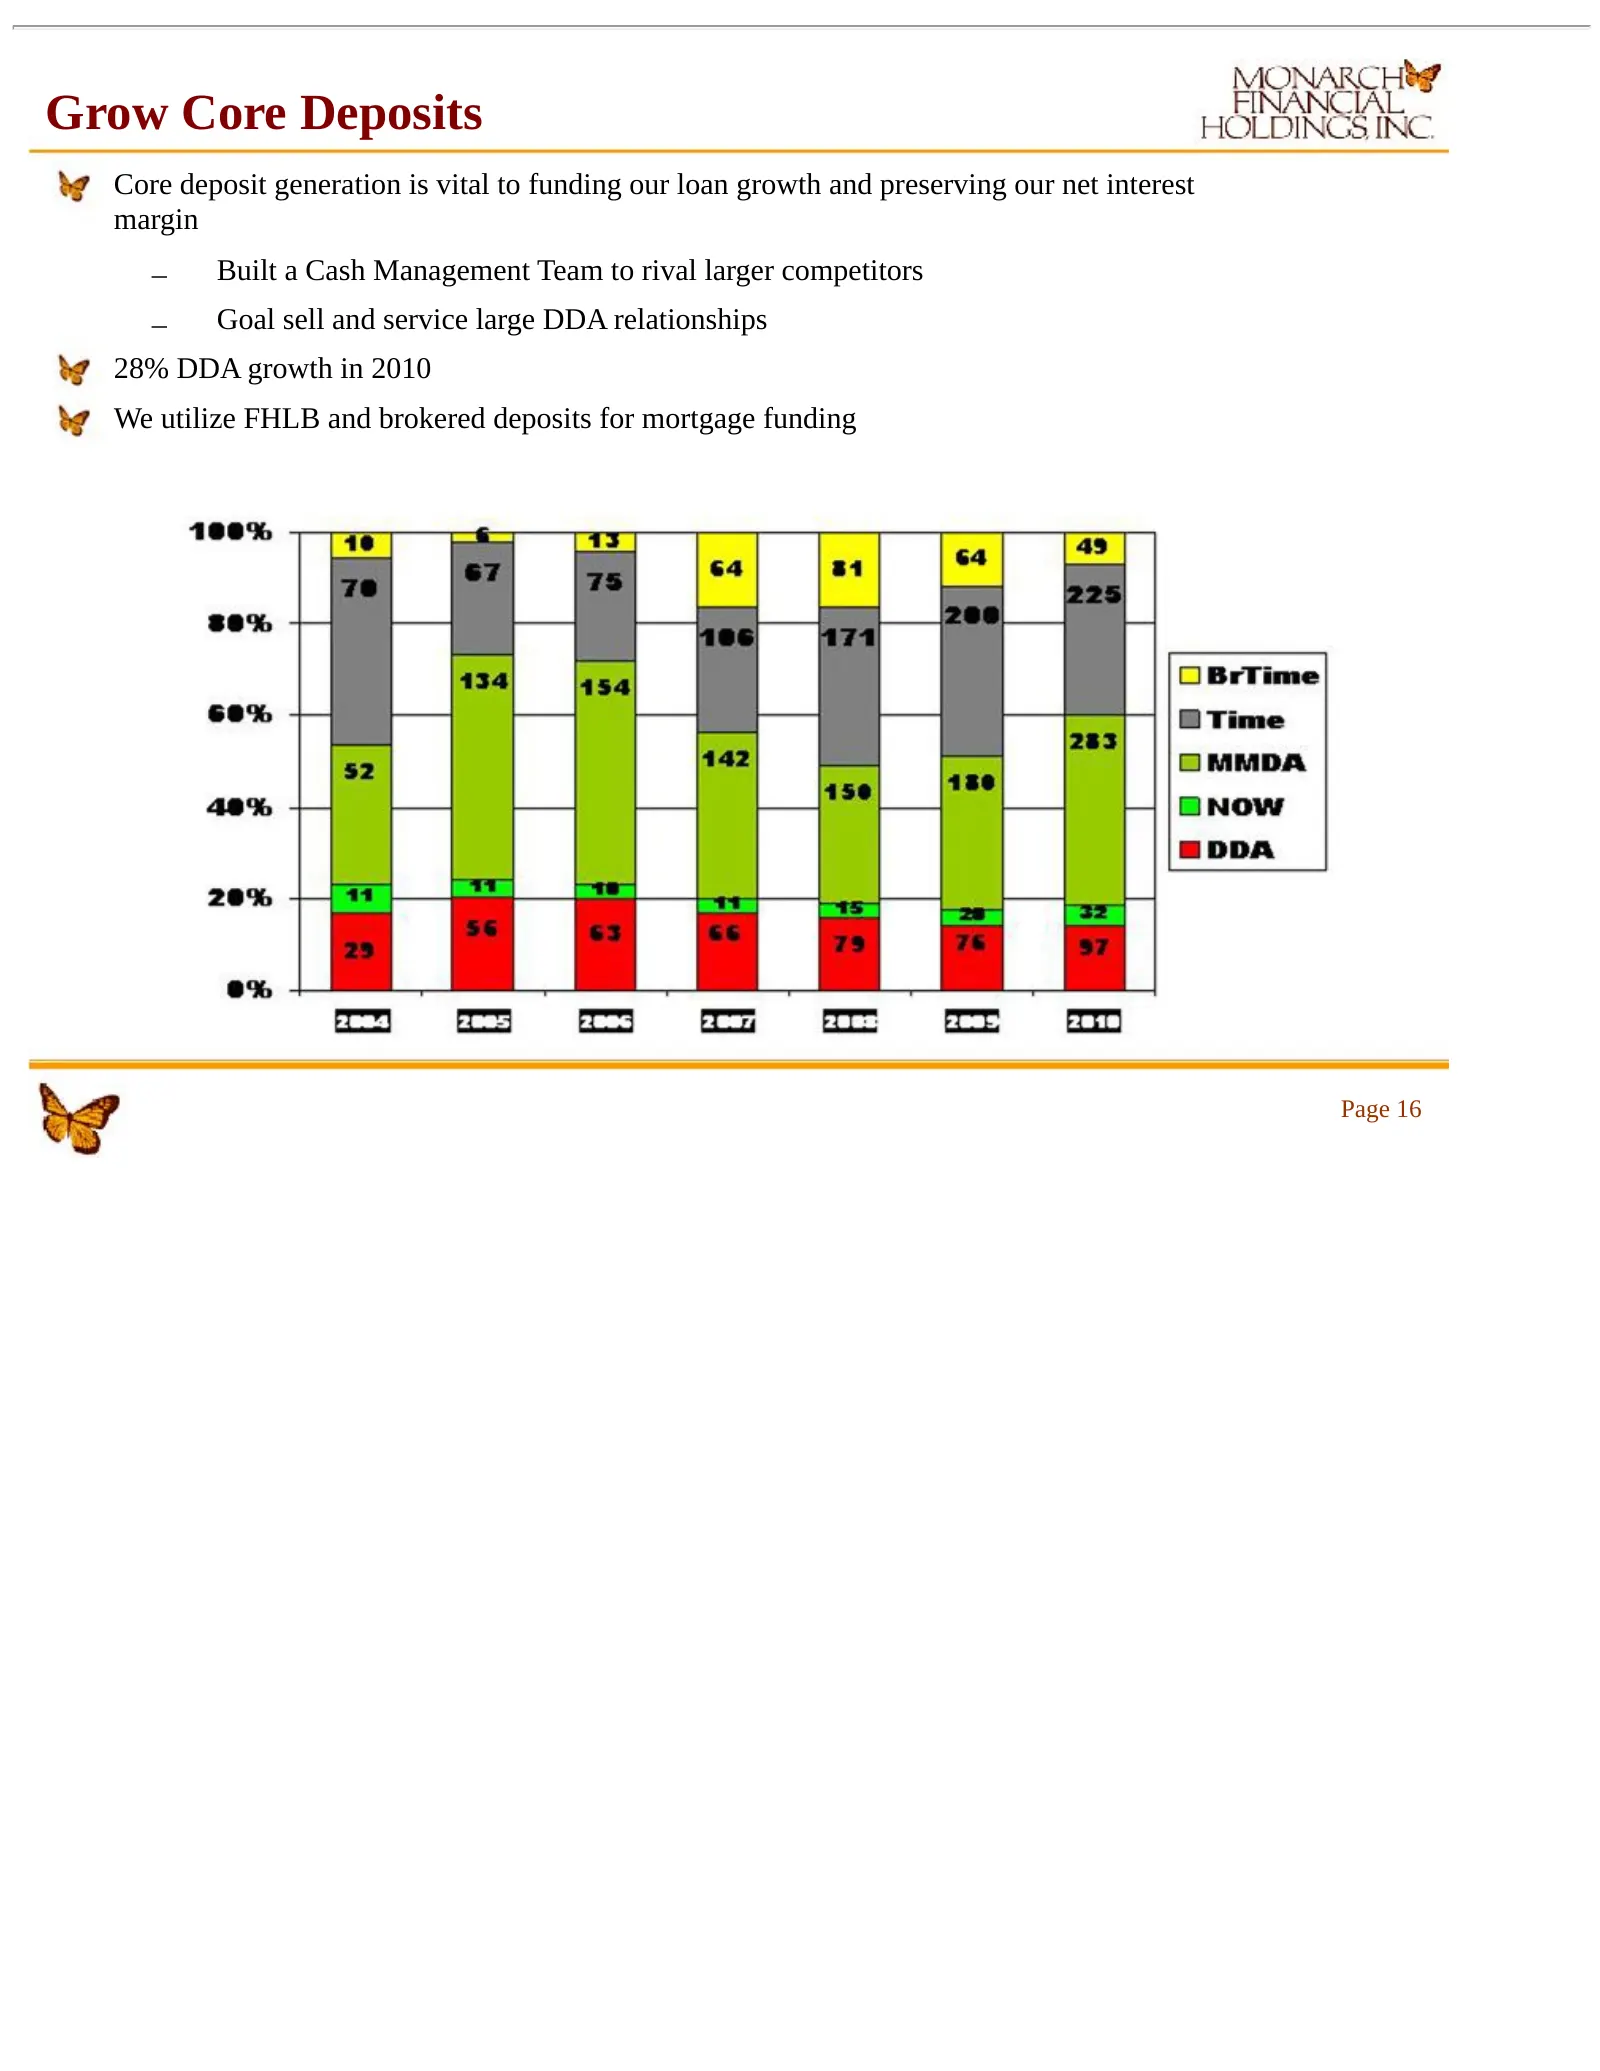
Grow Core Deposits Core deposit generation is vital to funding our loan growth and preserving our net interest margin – Built a Cash Management Team to rival larger competitors – Goal sell and service large DDA relationships 28% DDA growth in 2010 We utilize FHLB and brokered deposits for mortgage f
Slide 17: Deposit Market Share – Greater Hampton Roads
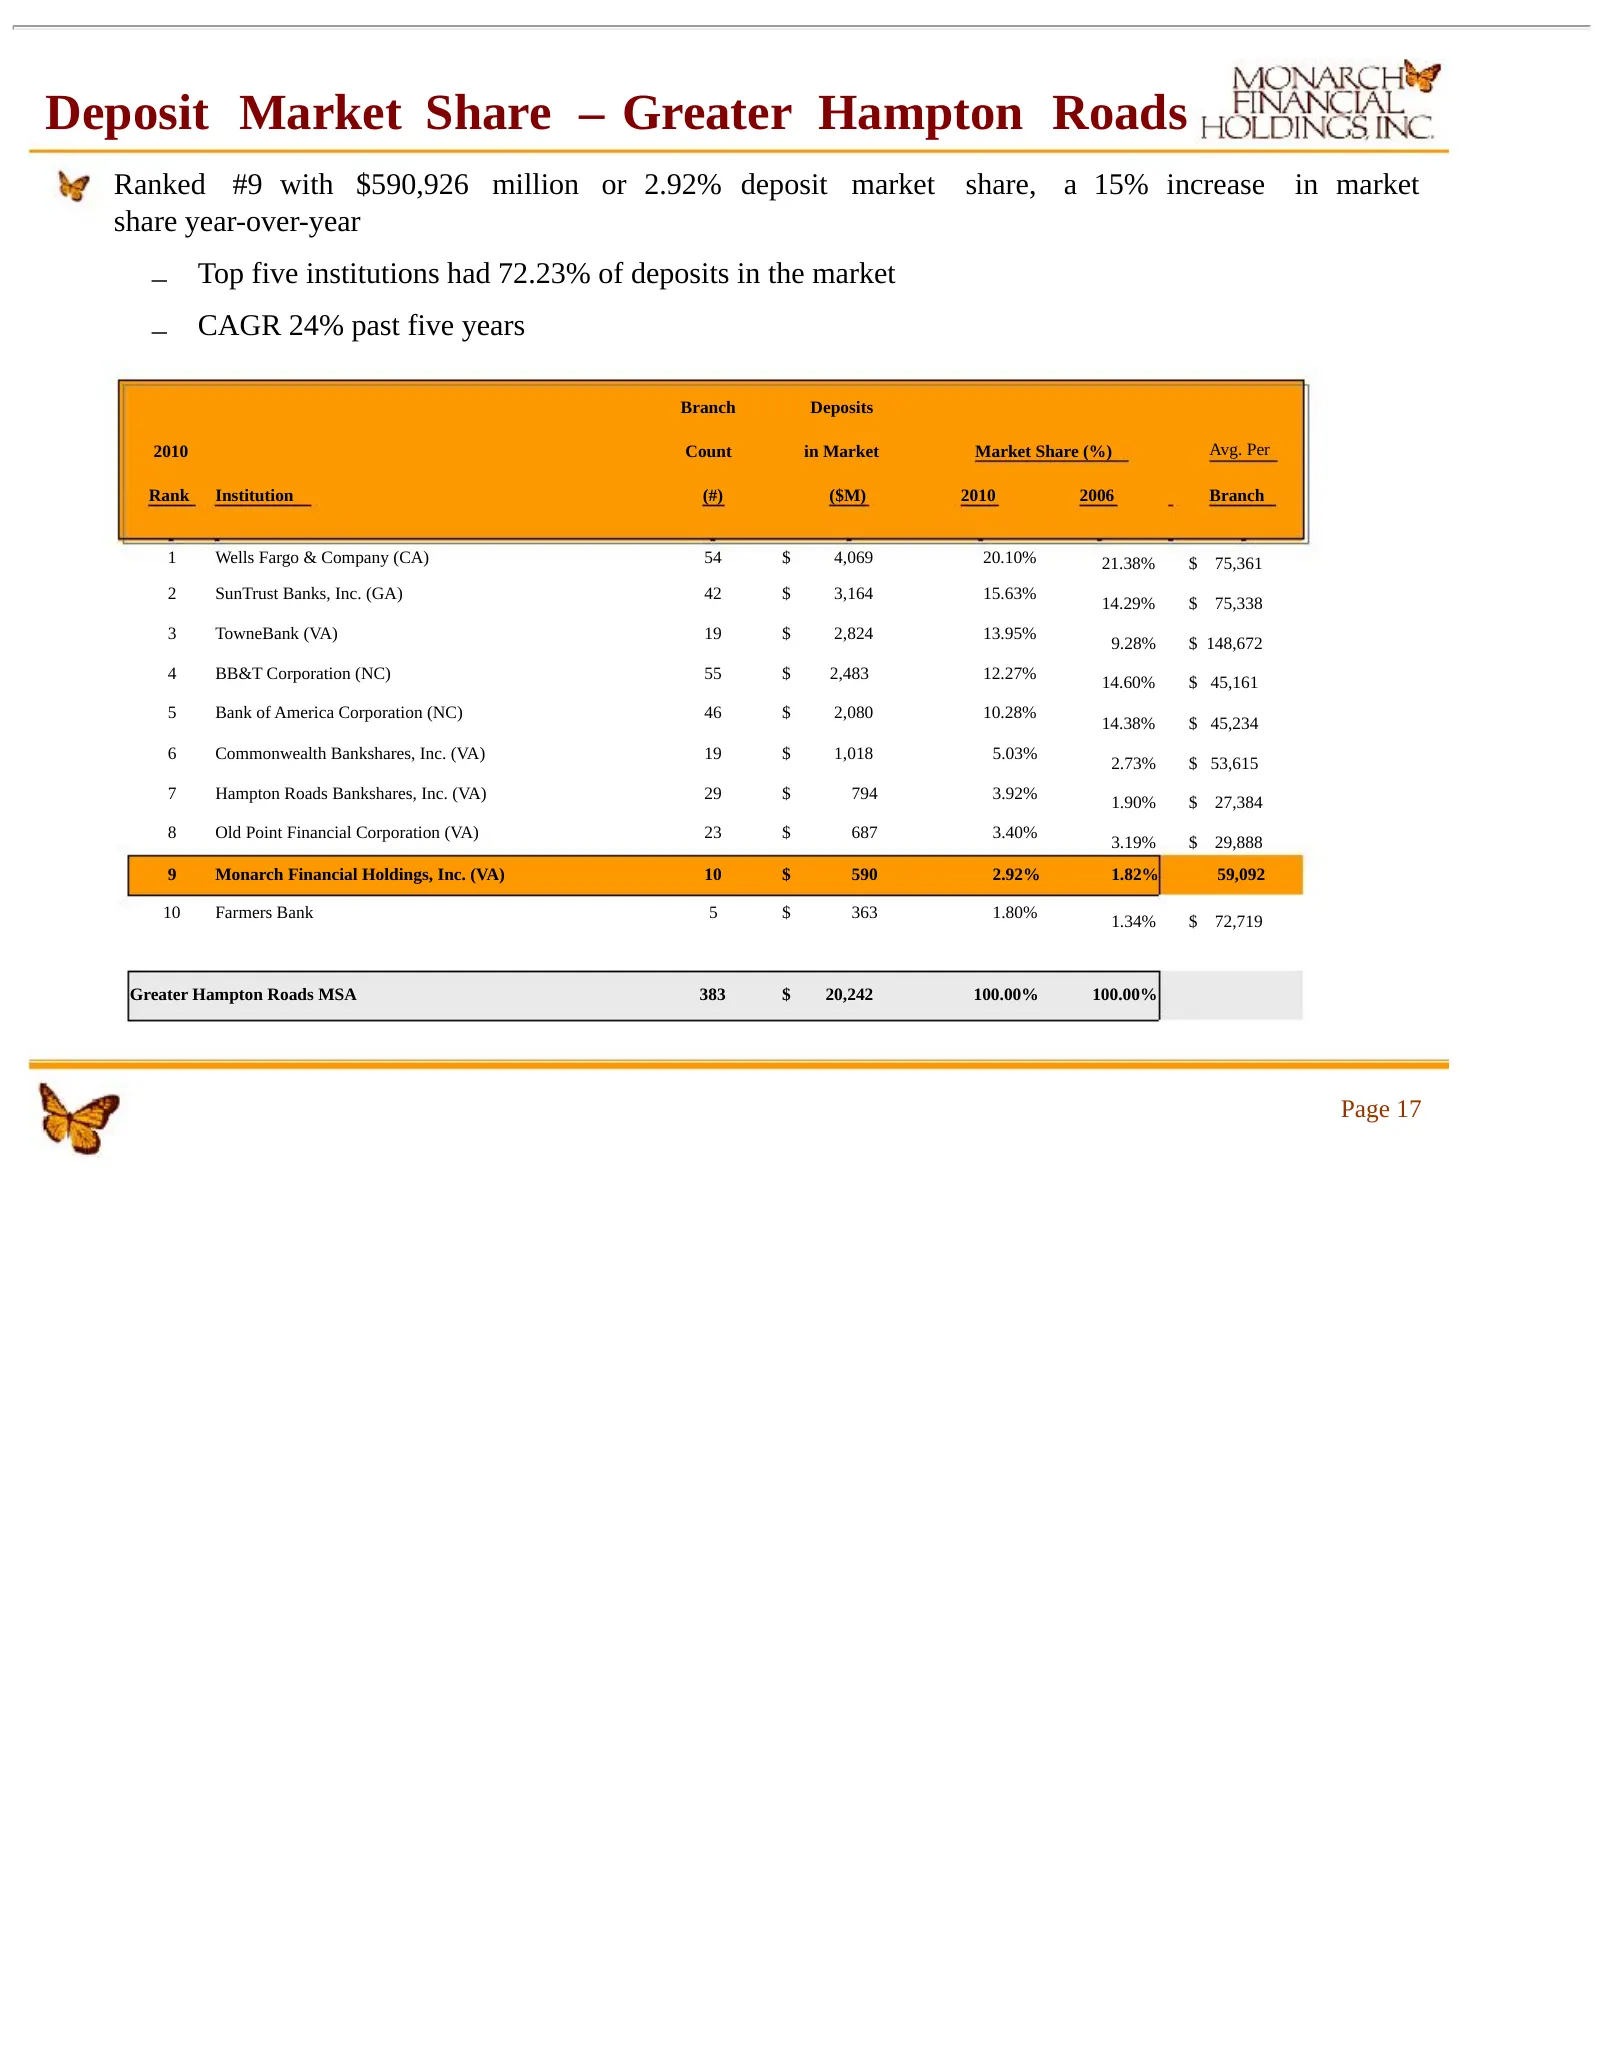
Deposit Market Share – Greater Hampton Roads Ranked #9 with $590,926 million or 2.92% deposit market share, a 15% increase in market share year-over-year – Top five institutions had 72.23% of deposits in the market – CAGR 24% past five years Branch Deposits 2010 Count in Market Market Share (%) Avg.
Slide 18: 2009 and 2010 were Record Years
2009 and 2010 were Record Years First Quarter 2009– Record 1 st Quarter profits Second Quarter 2009 – Record 2 nd Quarter profits Third Quarter 2009 – Record 3 rd Quarter profits Fourth Quarter 2009 – Record 4 th Quarter profits 2009 – Record Annual profits First Quarter 2010 – Record 1 st Quarter p
Slide 19: Profitability Performance Trends
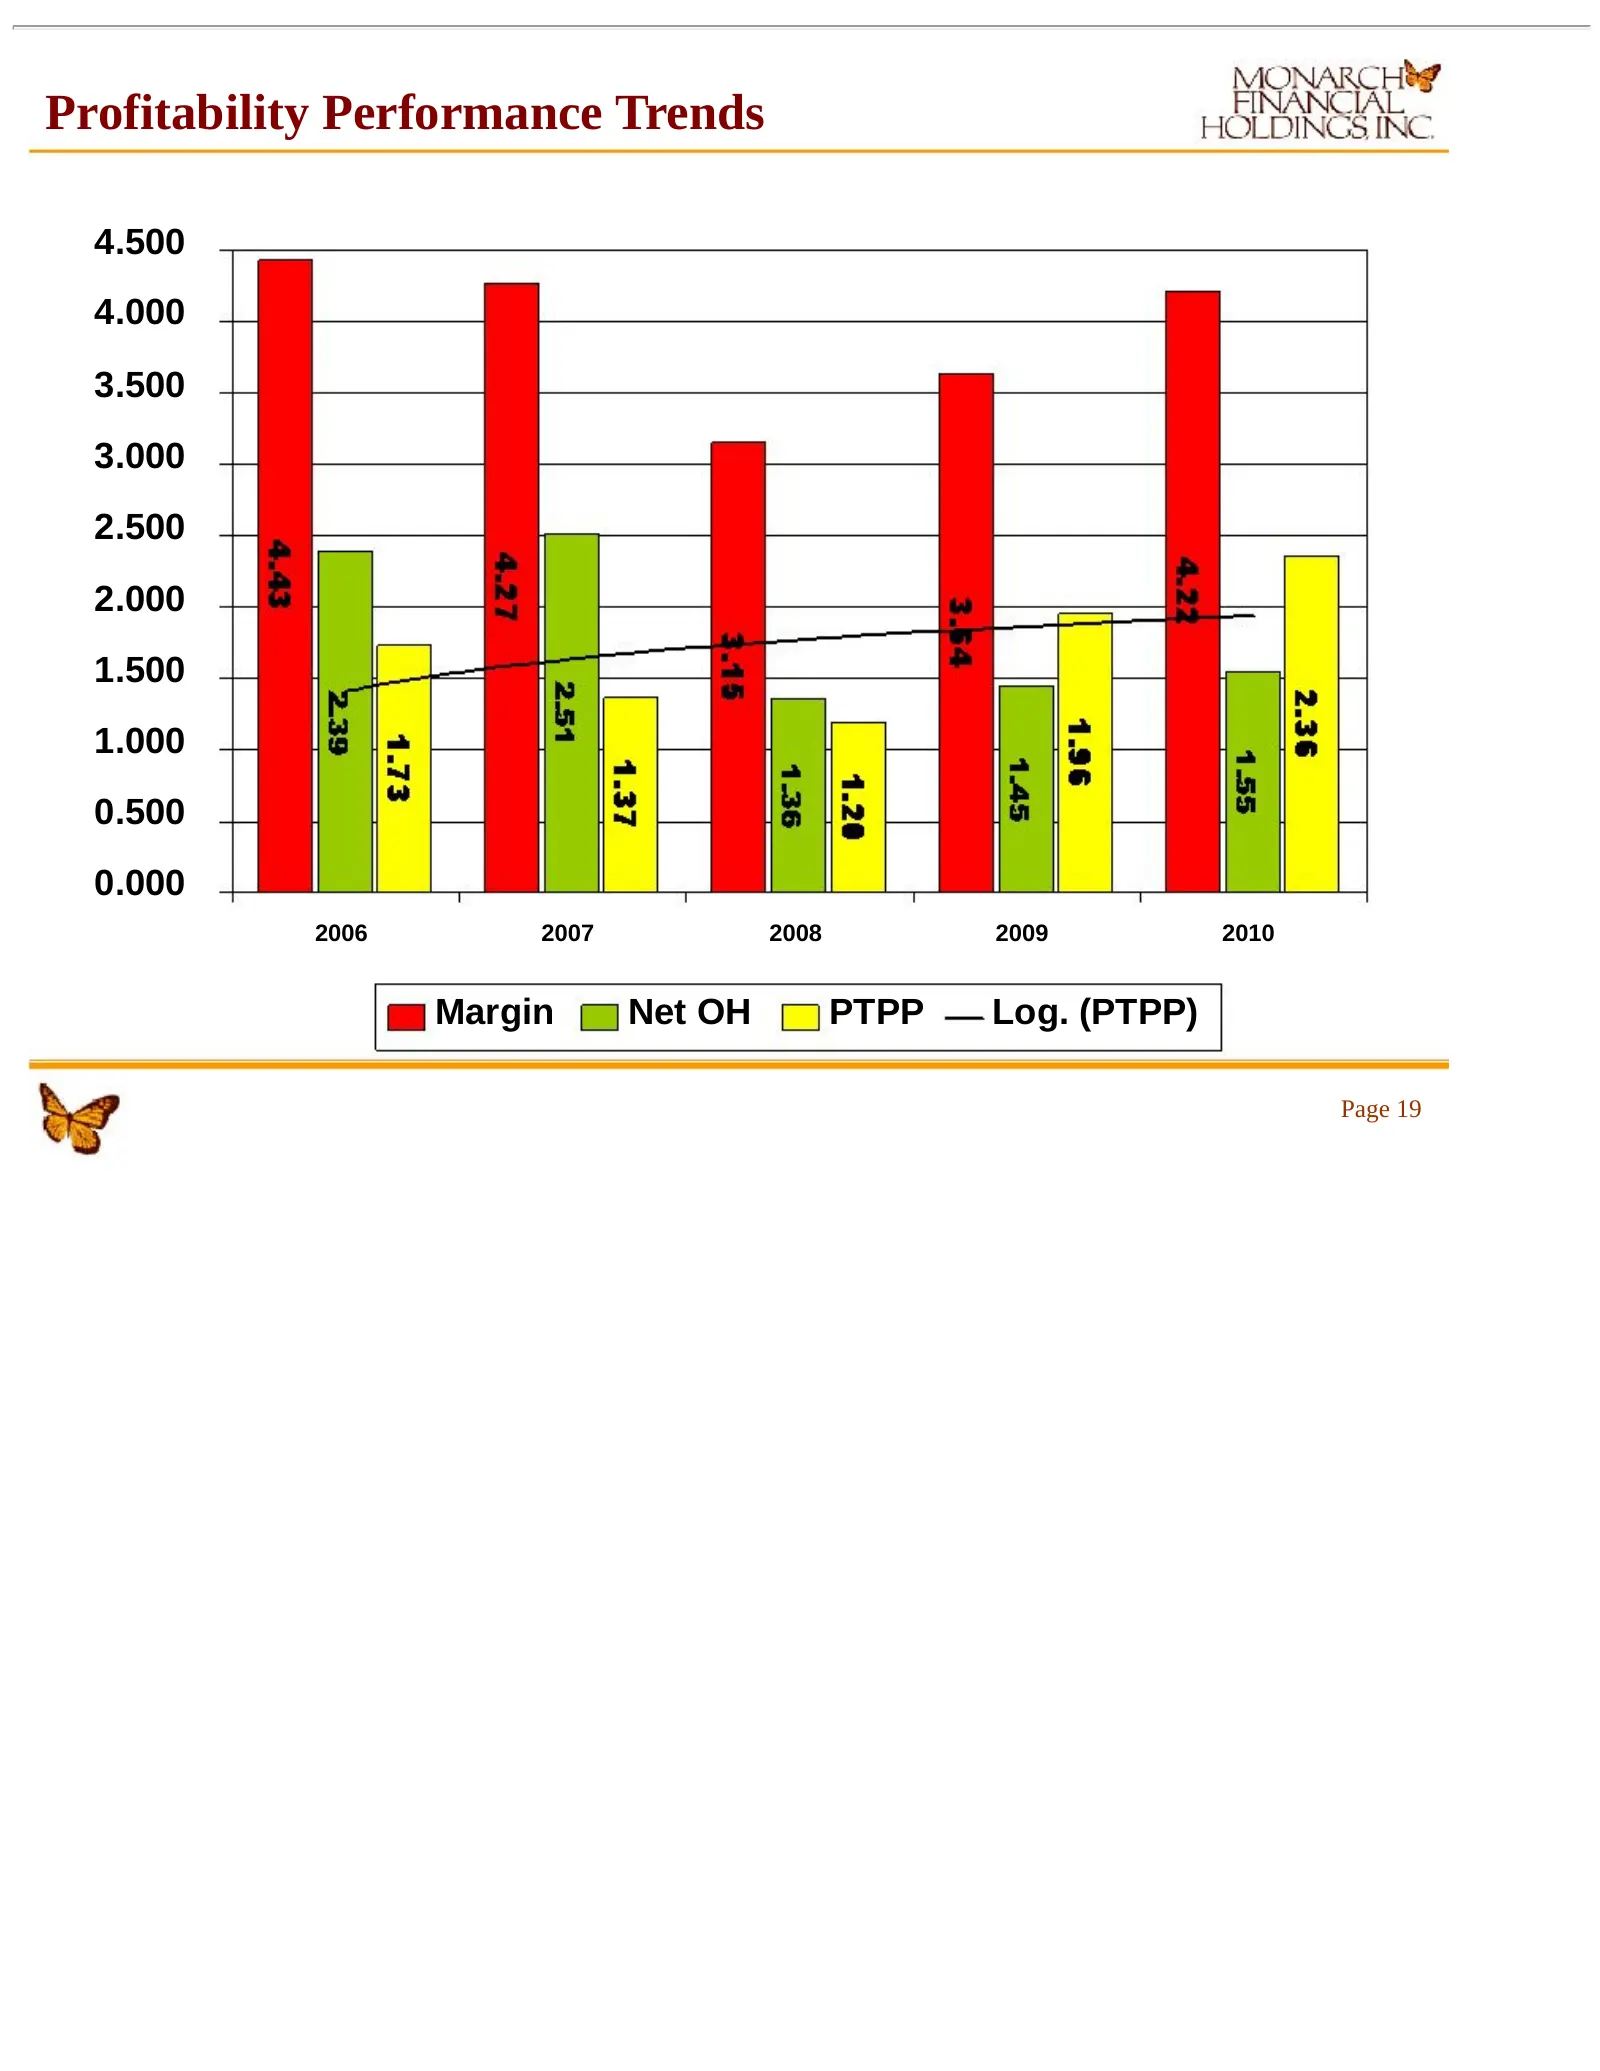
Profitability Performance Trends 4.500 4.000 3.500 3.000 2.500 2.000 1.500 1.000 0.500 0.000 2006 2007 2008 2009 2010 Margin Net OH PTPP Log. (PTPP) Page 19
Slide 20: Net Interest Income – Peer Comparison
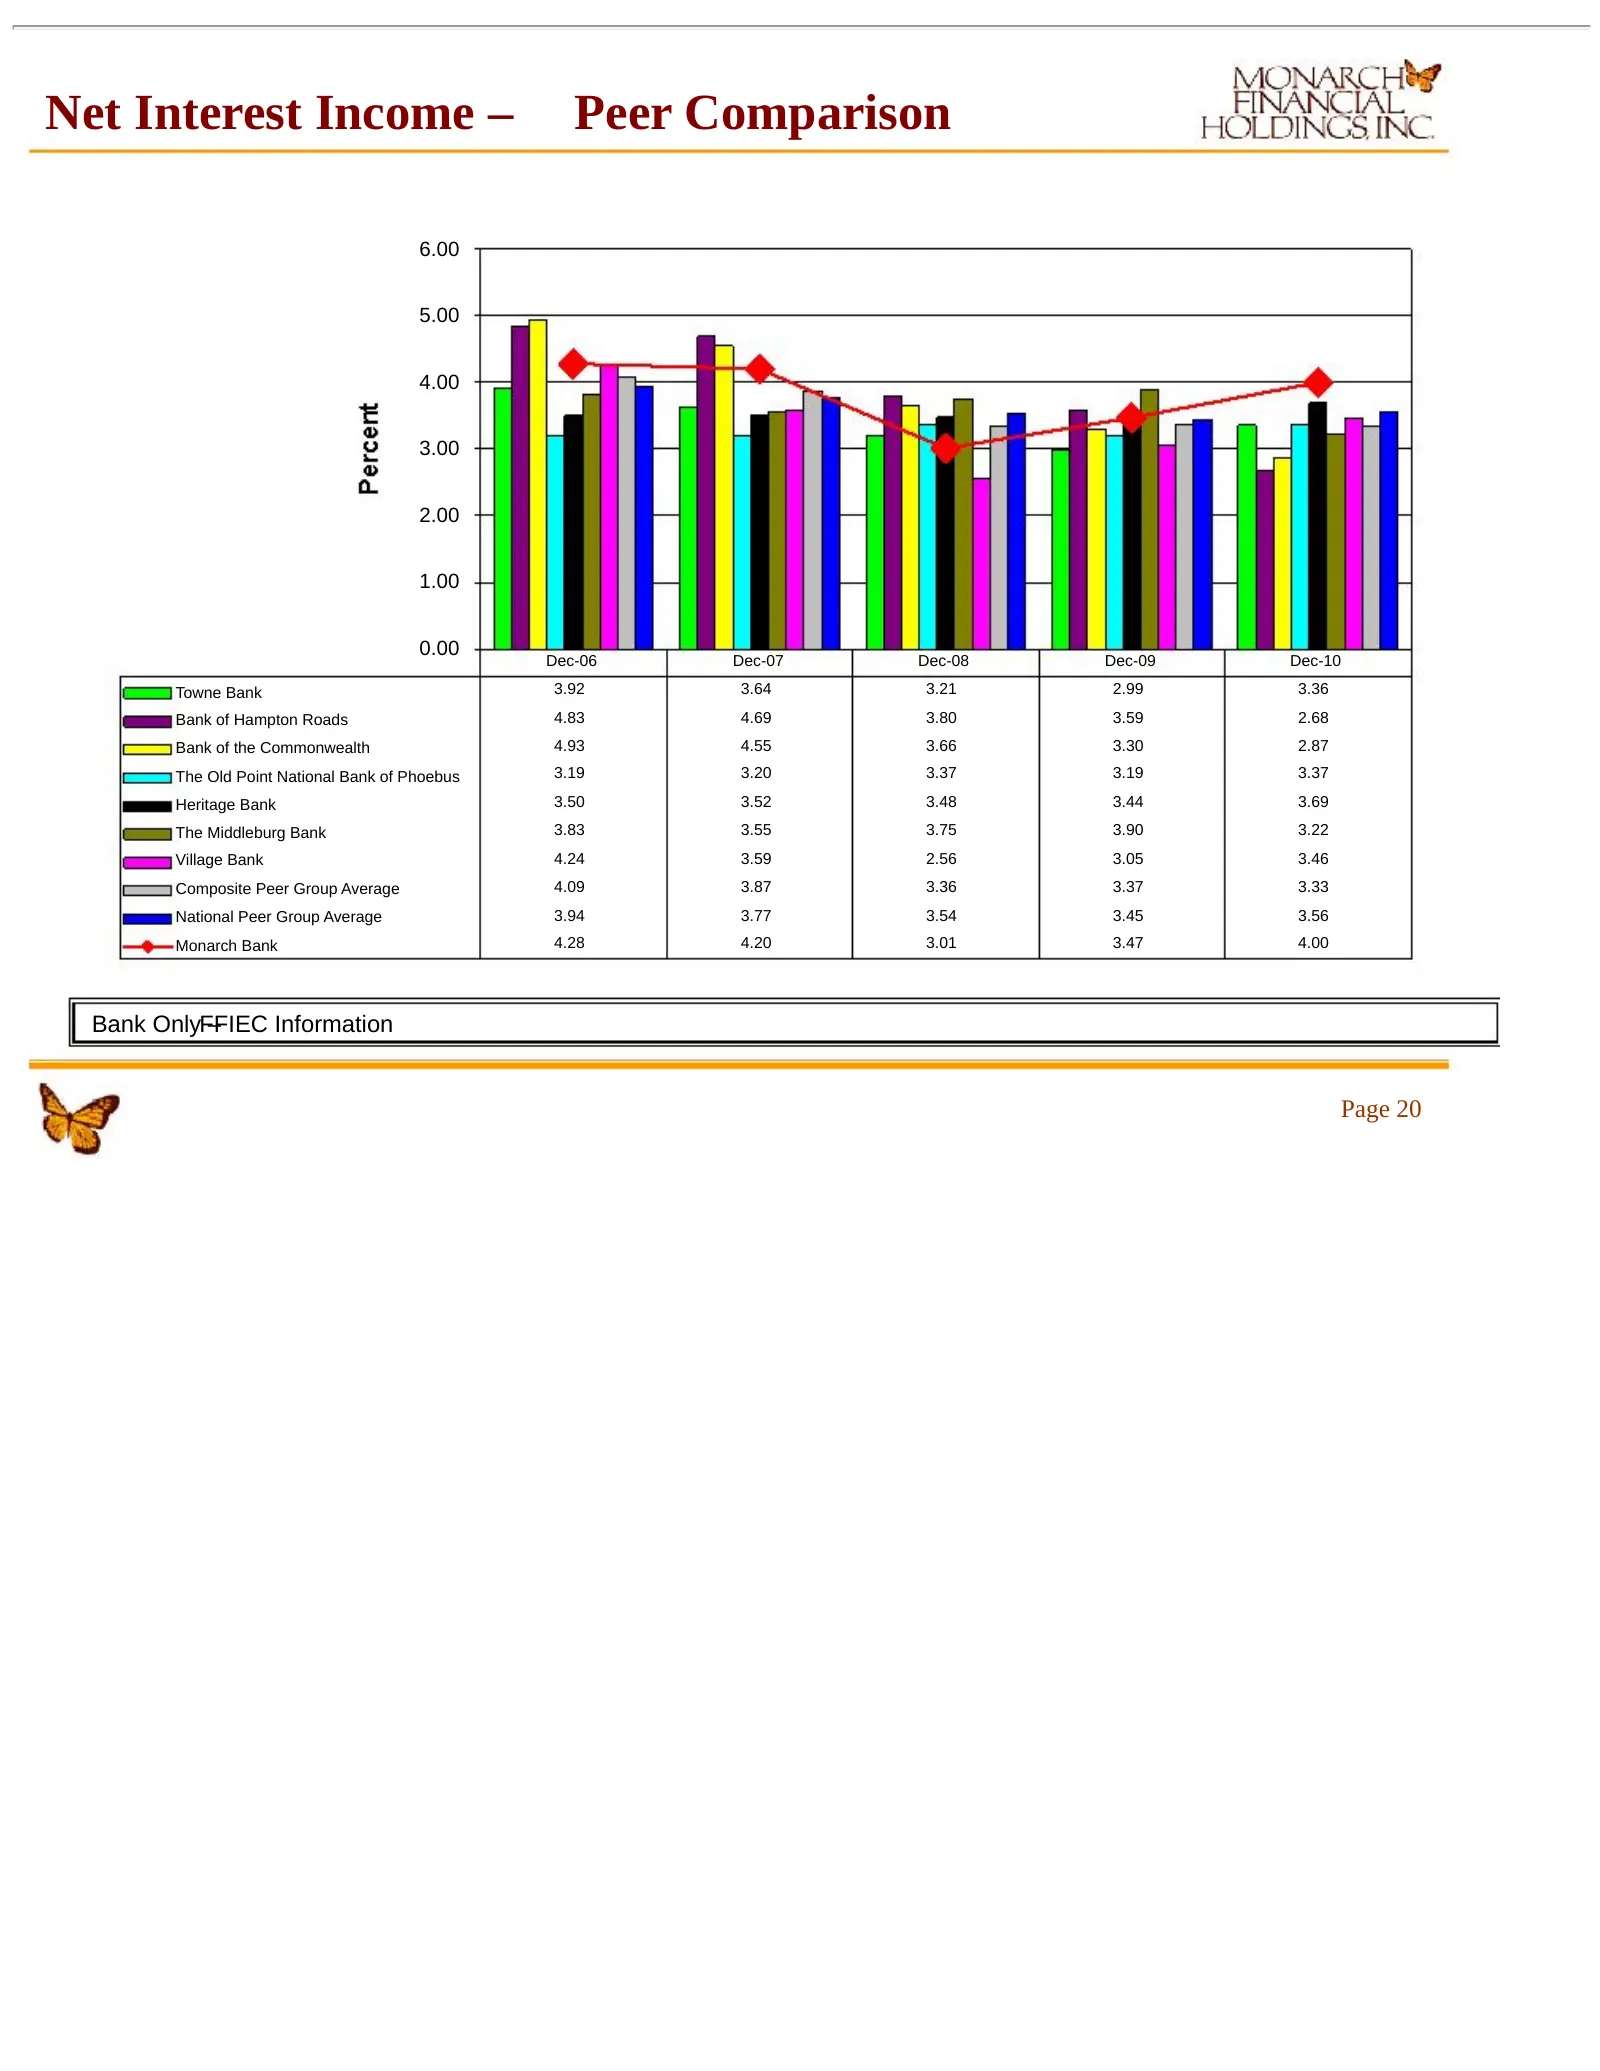
Net Interest Income – Peer Comparison 6.00 5.00 4.00 3.00 2.00 1.00 0.00 Dec-06 Dec-07 Dec-08 Dec-09 Dec-10 Towne Bank 3.92 3.64 3.21 2.99 3.36 Bank of Hampton Roads 4.83 4.69 3.80 3.59 2.68 Bank of the Commonwealth 4.93 4.55 3.66 3.30 2.87 The Old Point National Bank of Phoebus 3.19 3.20 3.37 3.19
Slide 21: Net Overhead – Peer Comparison
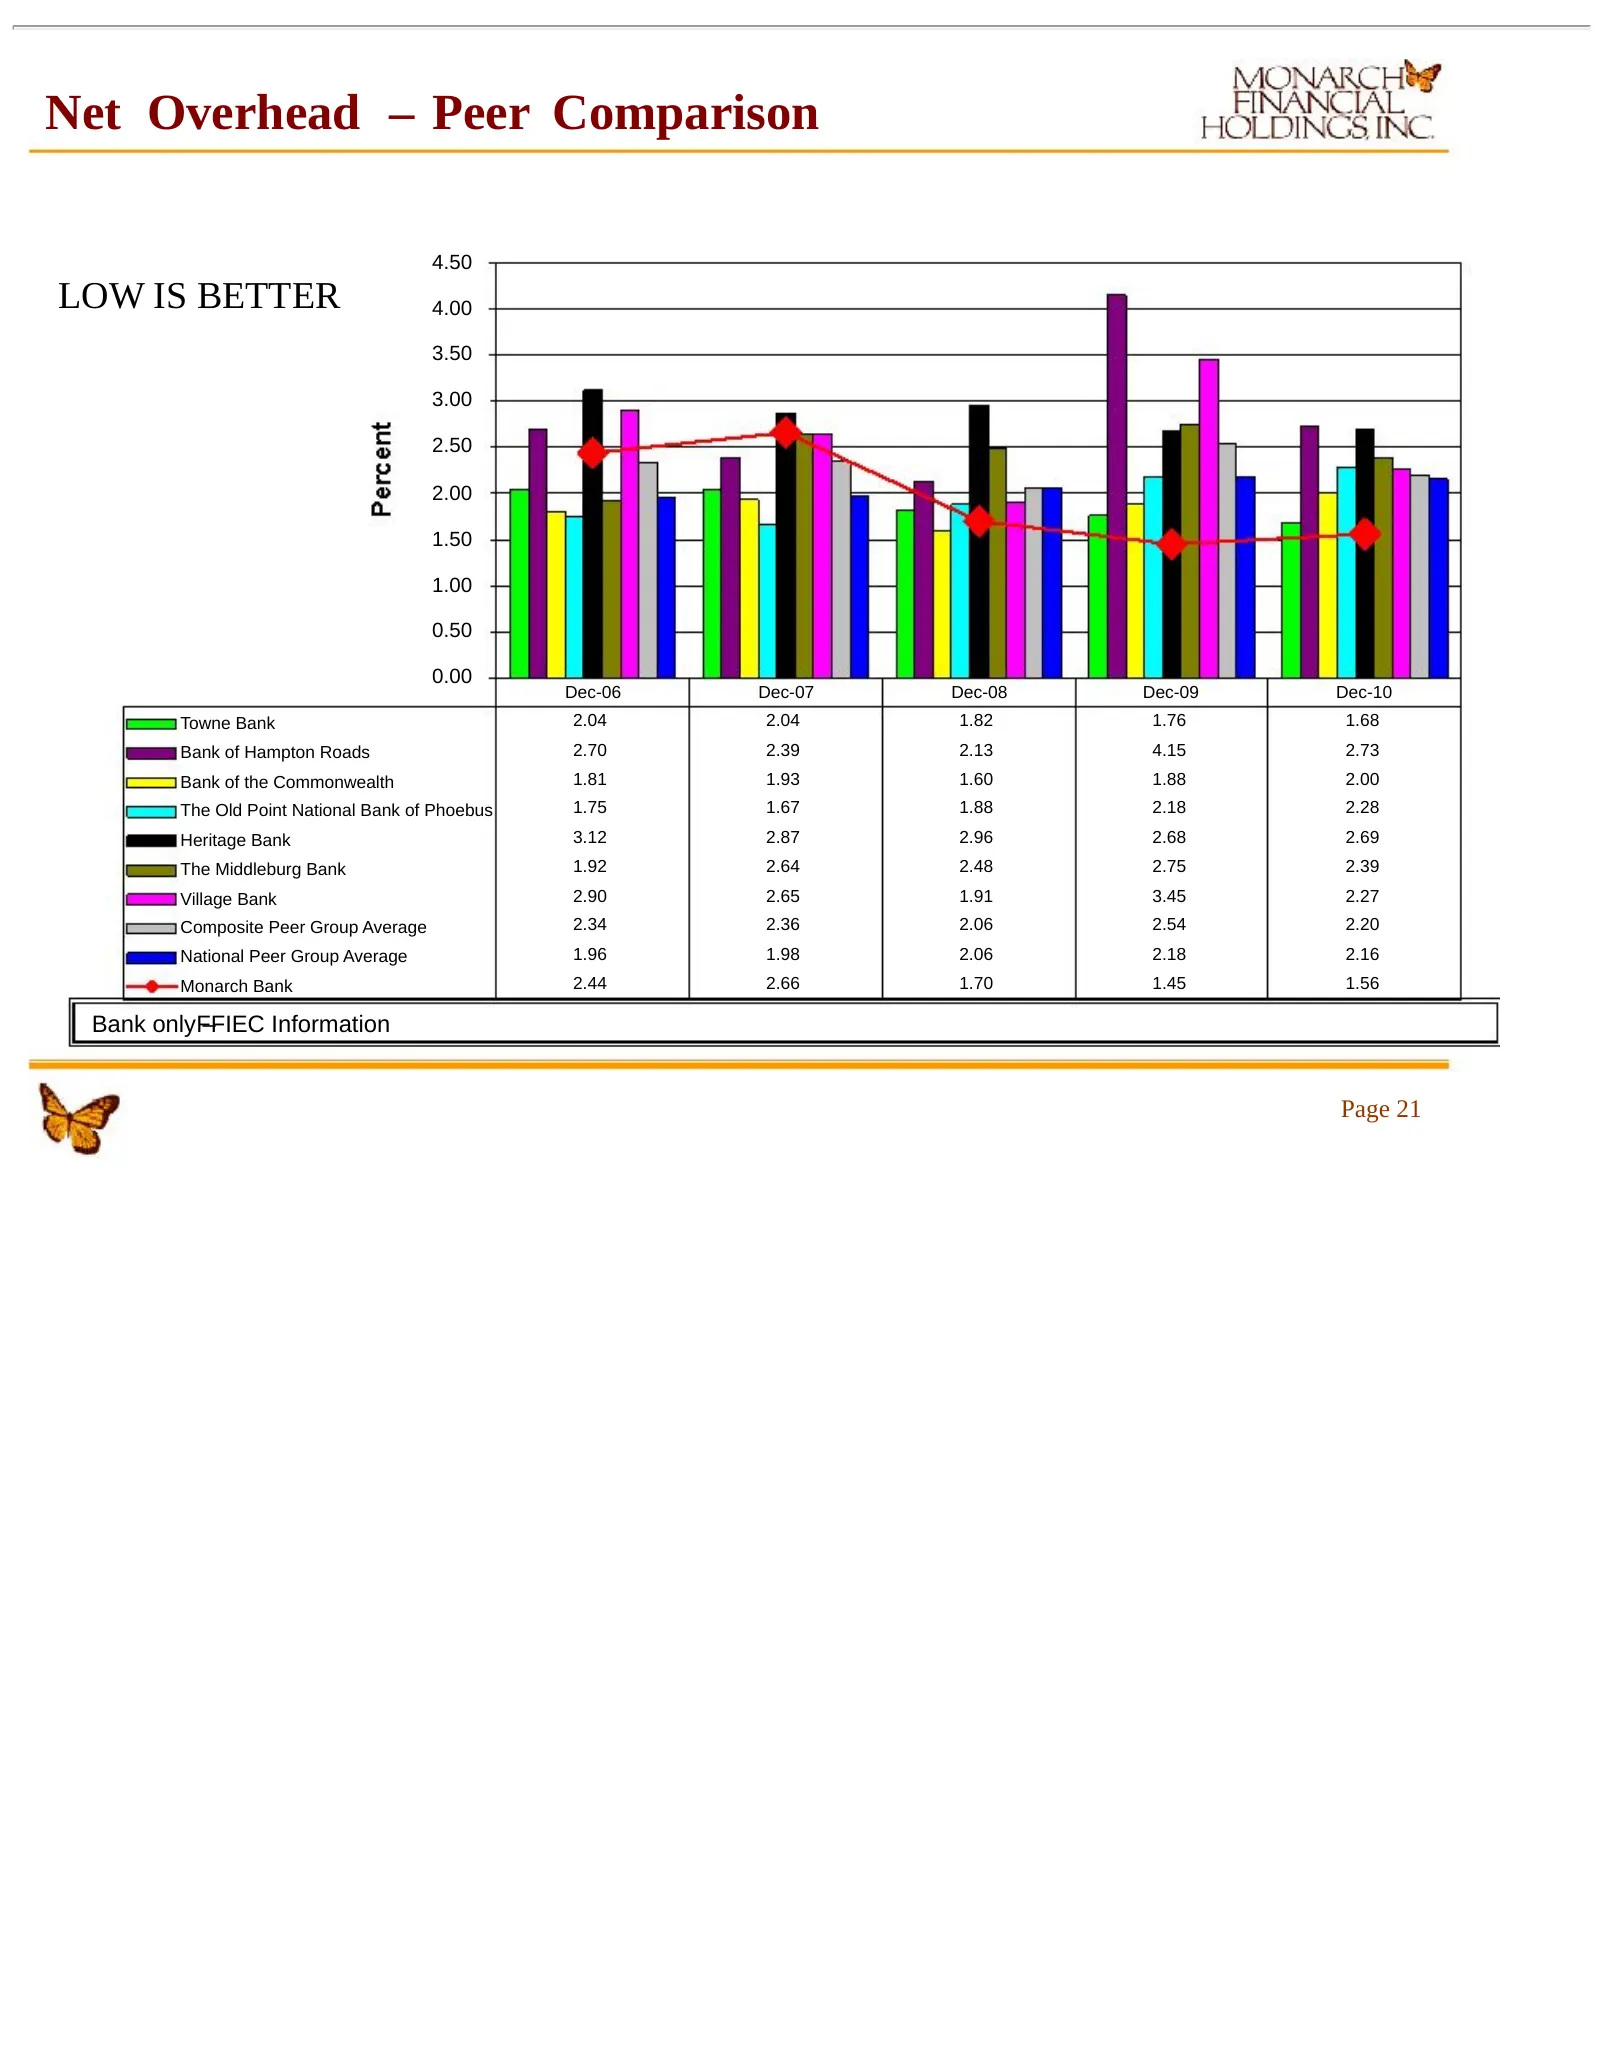
Net Overhead – Peer Comparison 4.50 LOW IS BETTER 4.00 3.50 3.00 2.50 2.00 1.50 1.00 0.50 0.00 Dec-06 Dec-07 Dec-08 Dec-09 Dec-10 Towne Bank 2.04 2.04 1.82 1.76 1.68 Bank of Hampton Roads 2.70 2.39 2.13 4.15 2.73 Bank of the Commonwealth 1.81 1.93 1.60 1.88 2.00 The Old Point National Bank of Phoebu
Slide 22: Non-Interest Income Growth
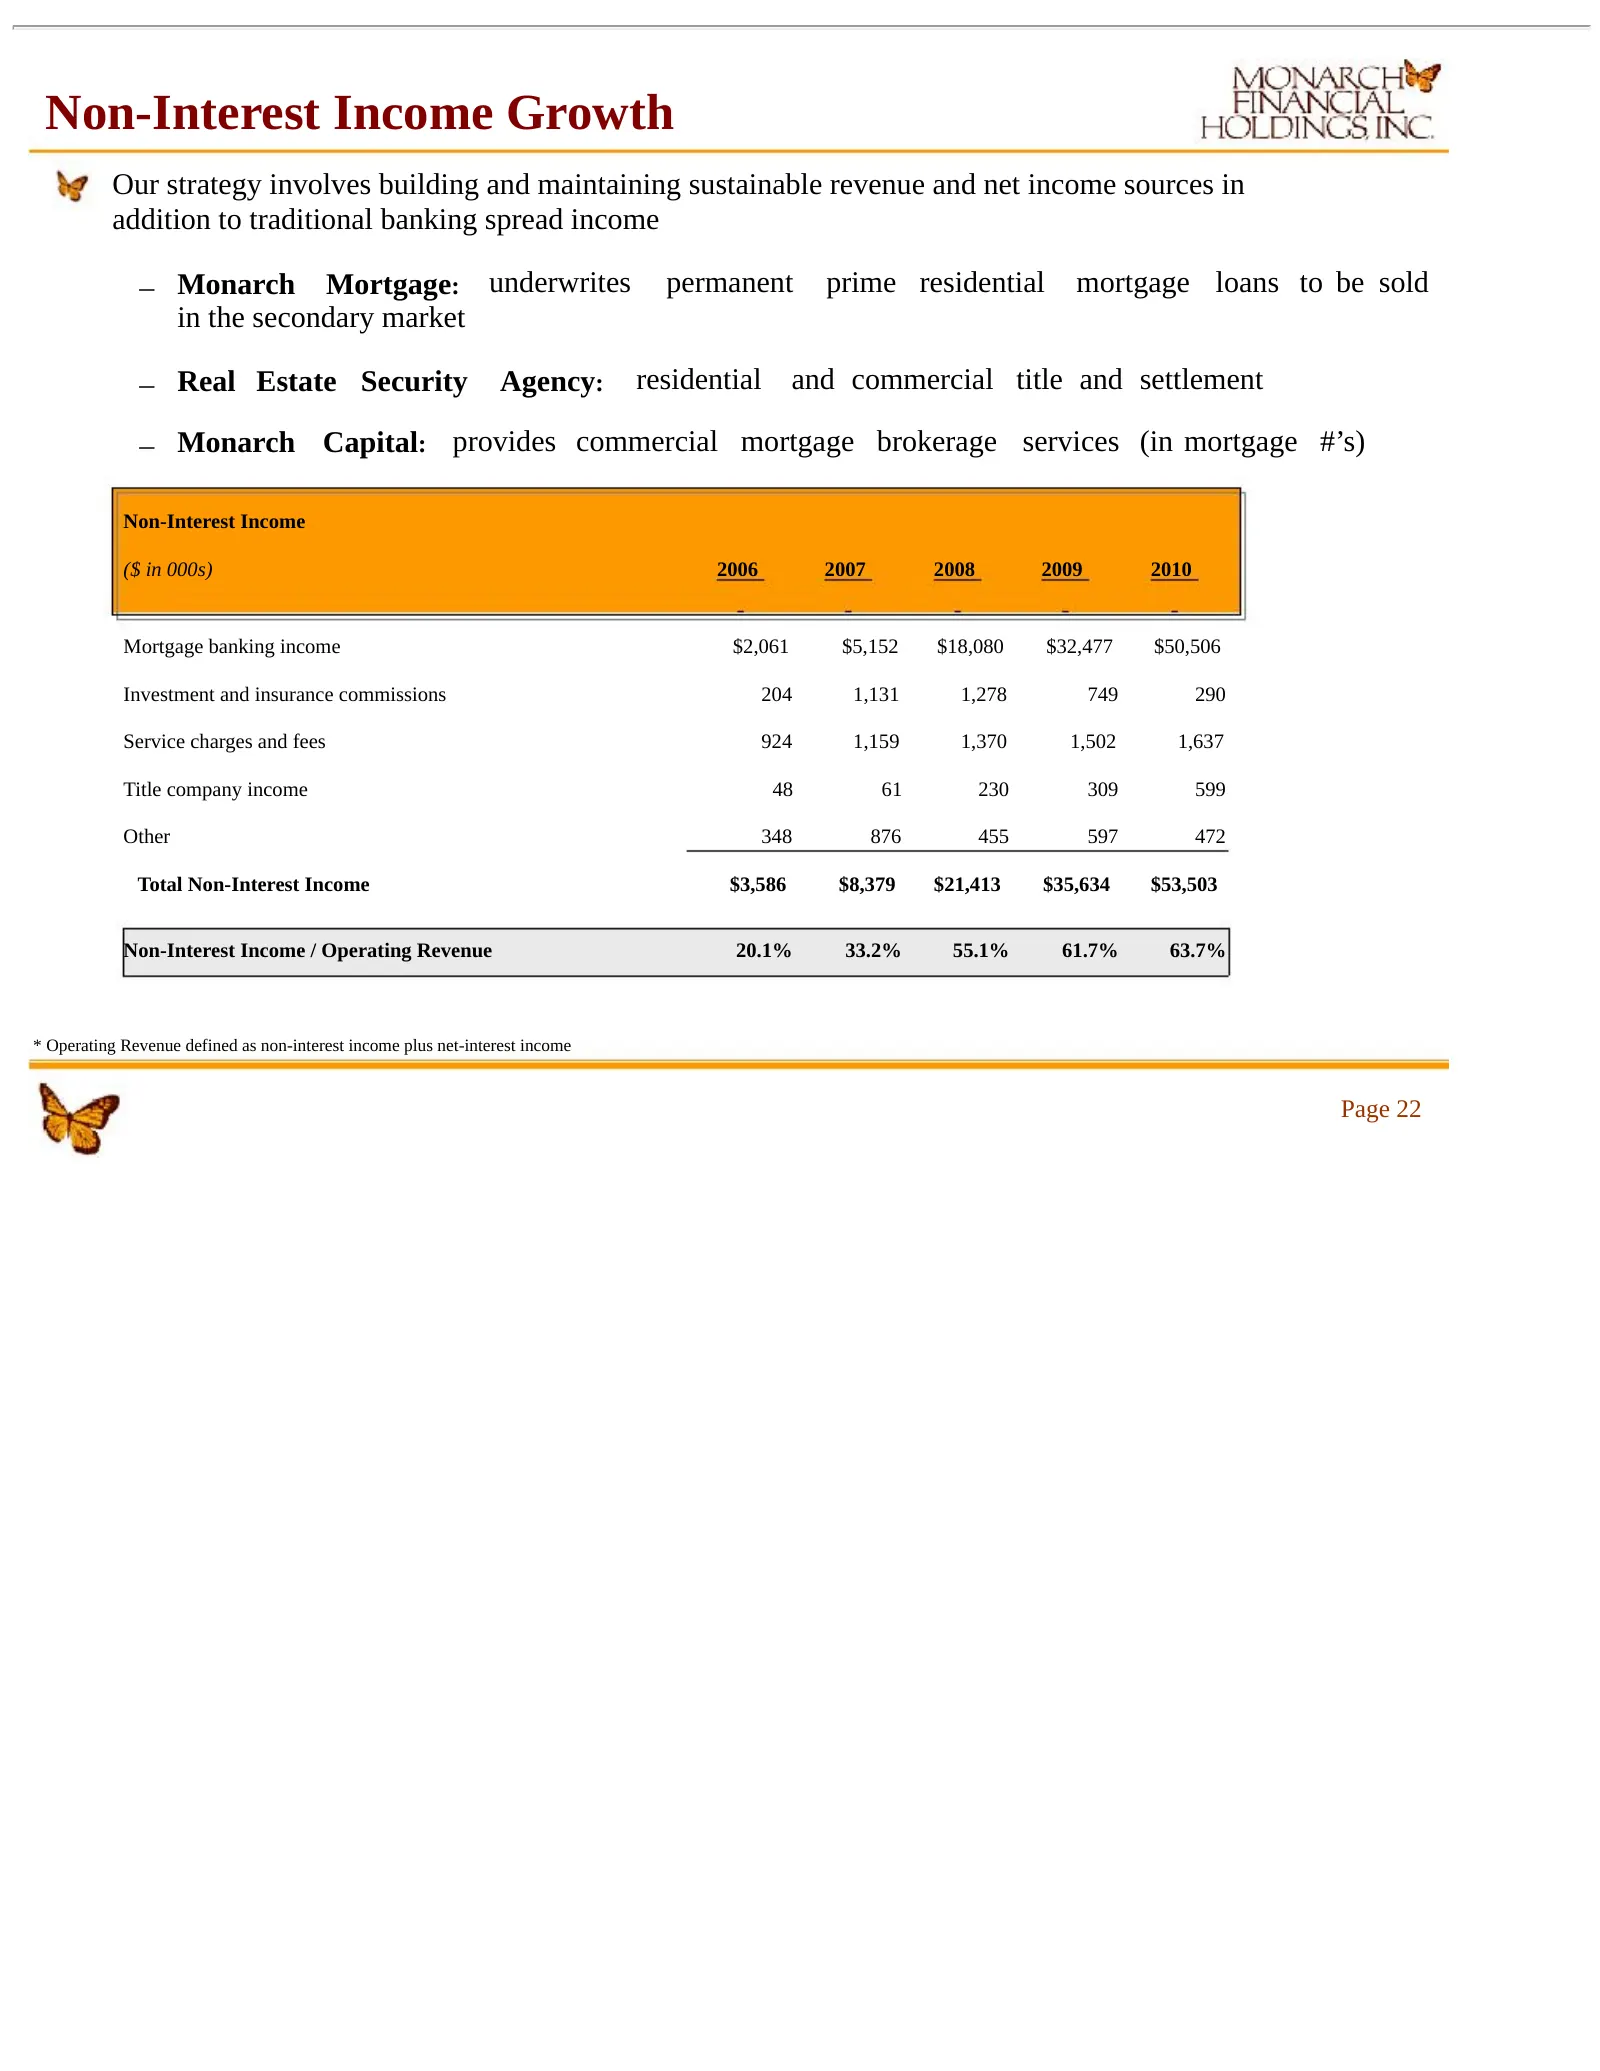
Non-Interest Income Growth Our strategy involves building and maintaining sustainable revenue and net income sources in addition to traditional banking spread income – Monarch Mortgage: underwrites permanent prime residential mortgage loans to be sold in the secondary market – Real Estate Security A
Slide 23: Our Risk Management Focus Pays Off
Our Risk Management Focus Pays Off The credit risk within the company is overseen by Andy Lock, our Chief Risk Officer All loans are reviewed and loan relationships that exceed $1,500,000 are approved by either a management loan committee or a board of directors’ loan committee All loans are risk ra
Slide 24: Historically Low Non-performing Assets
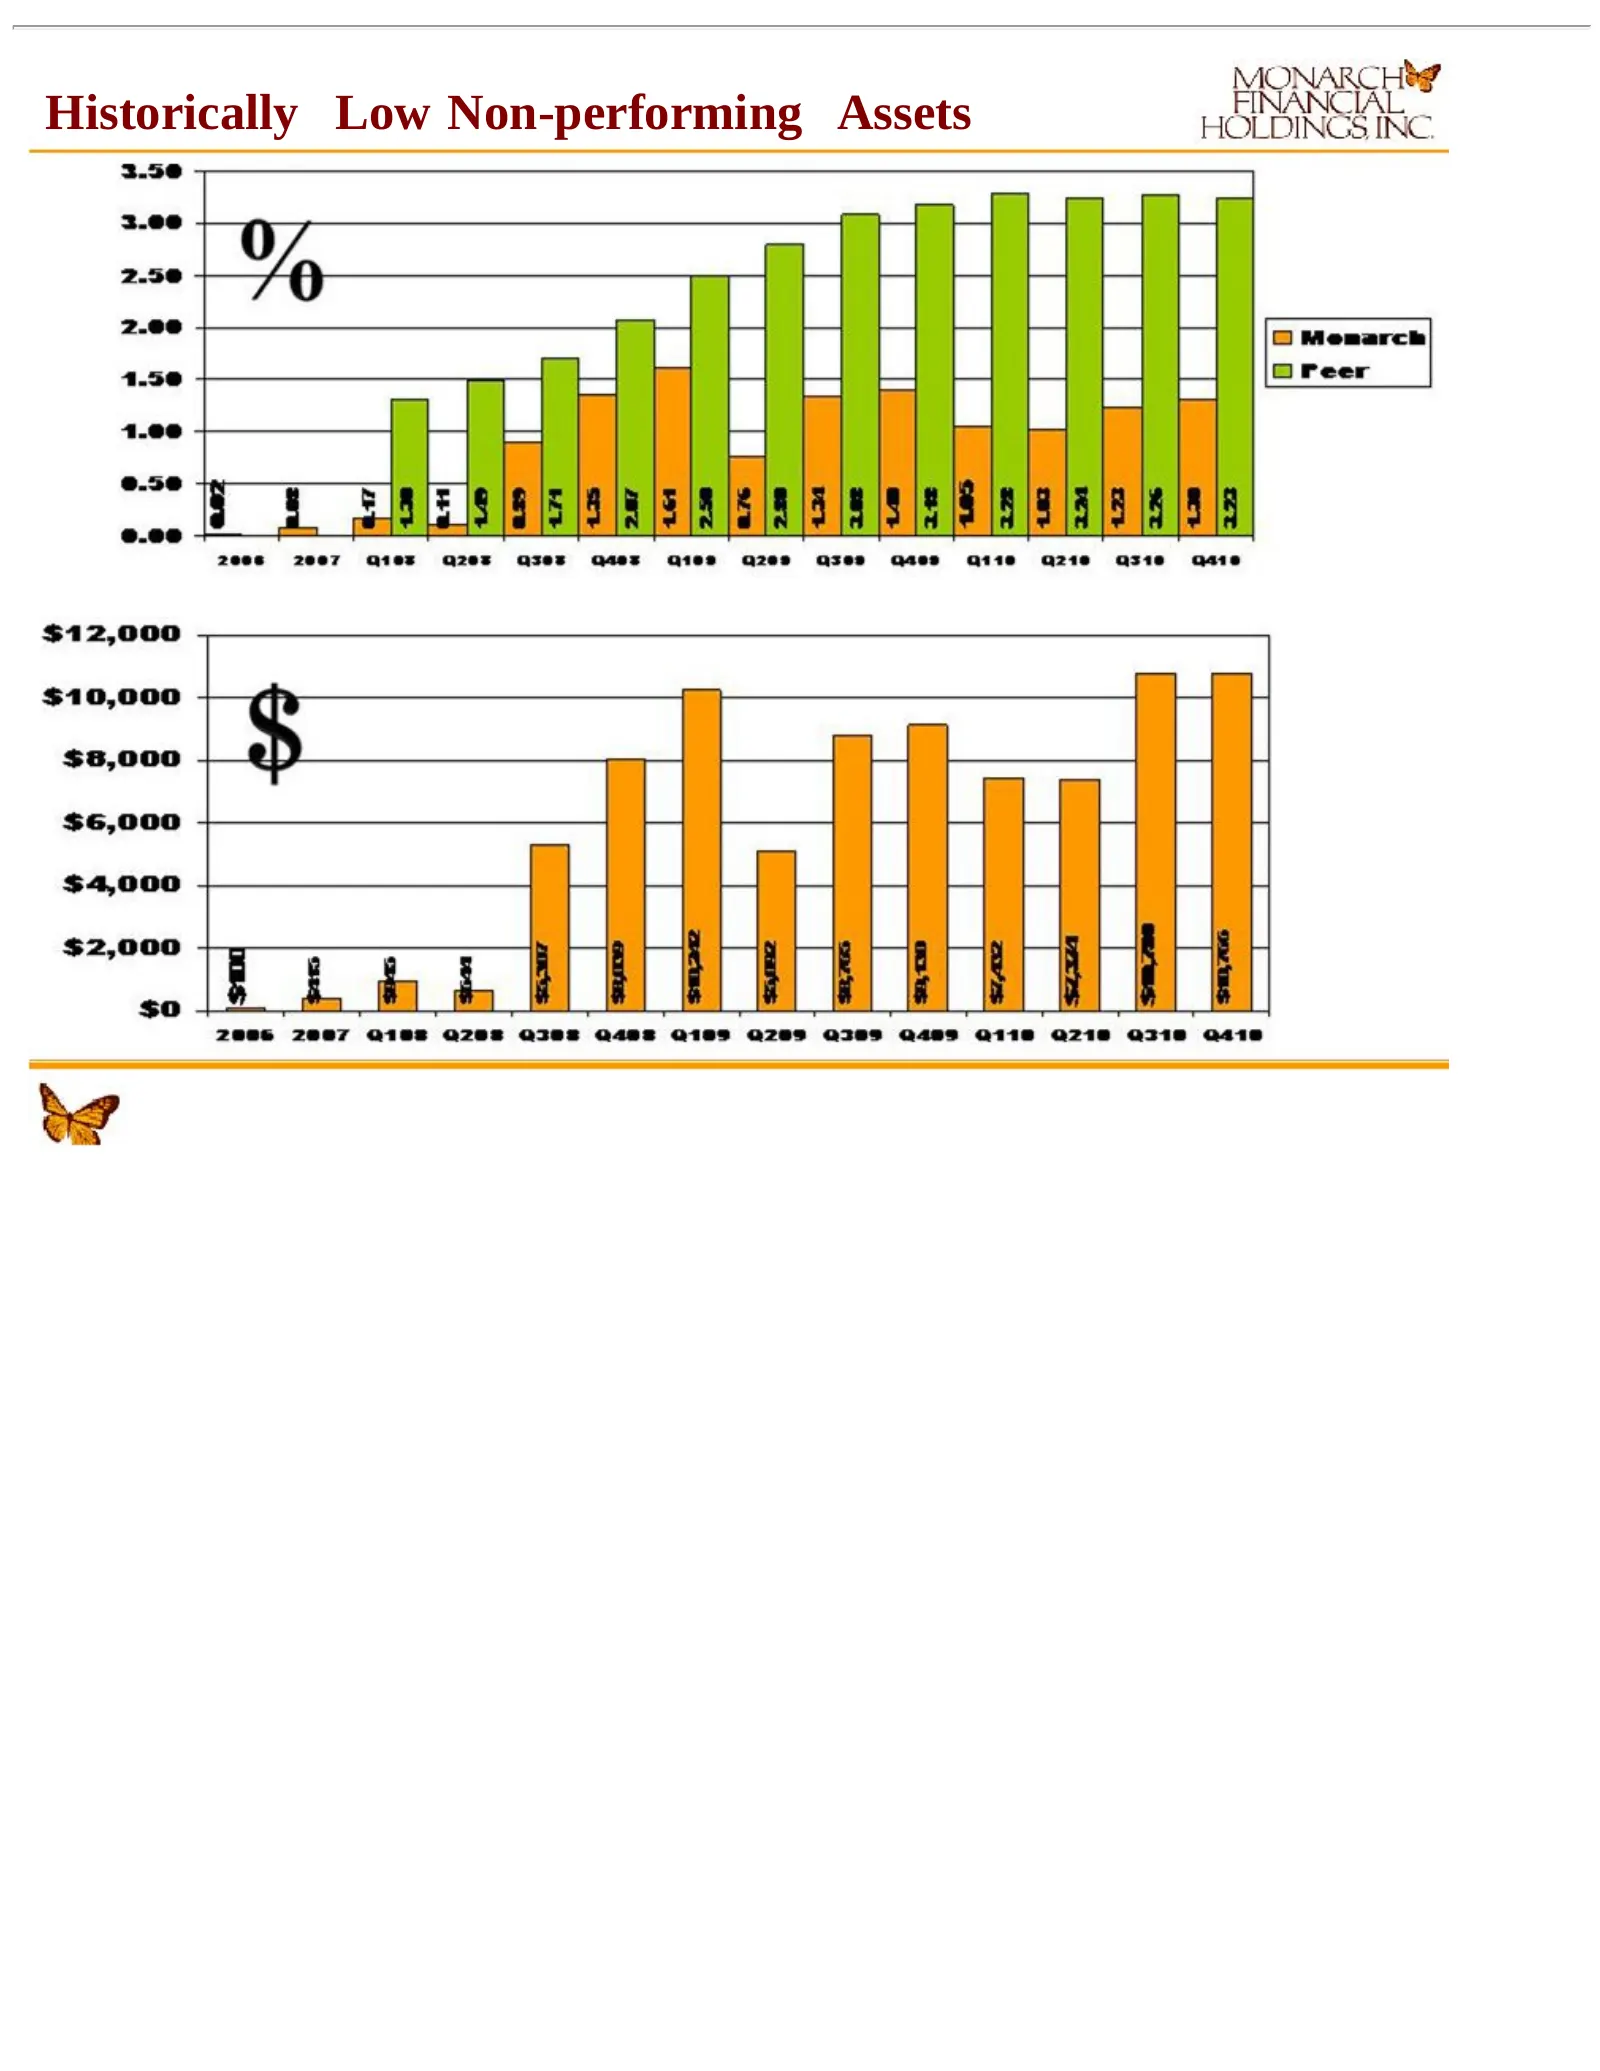
Historically Low Non-performing Assets
Slide 25: Aggressive Provision & Charge-off History
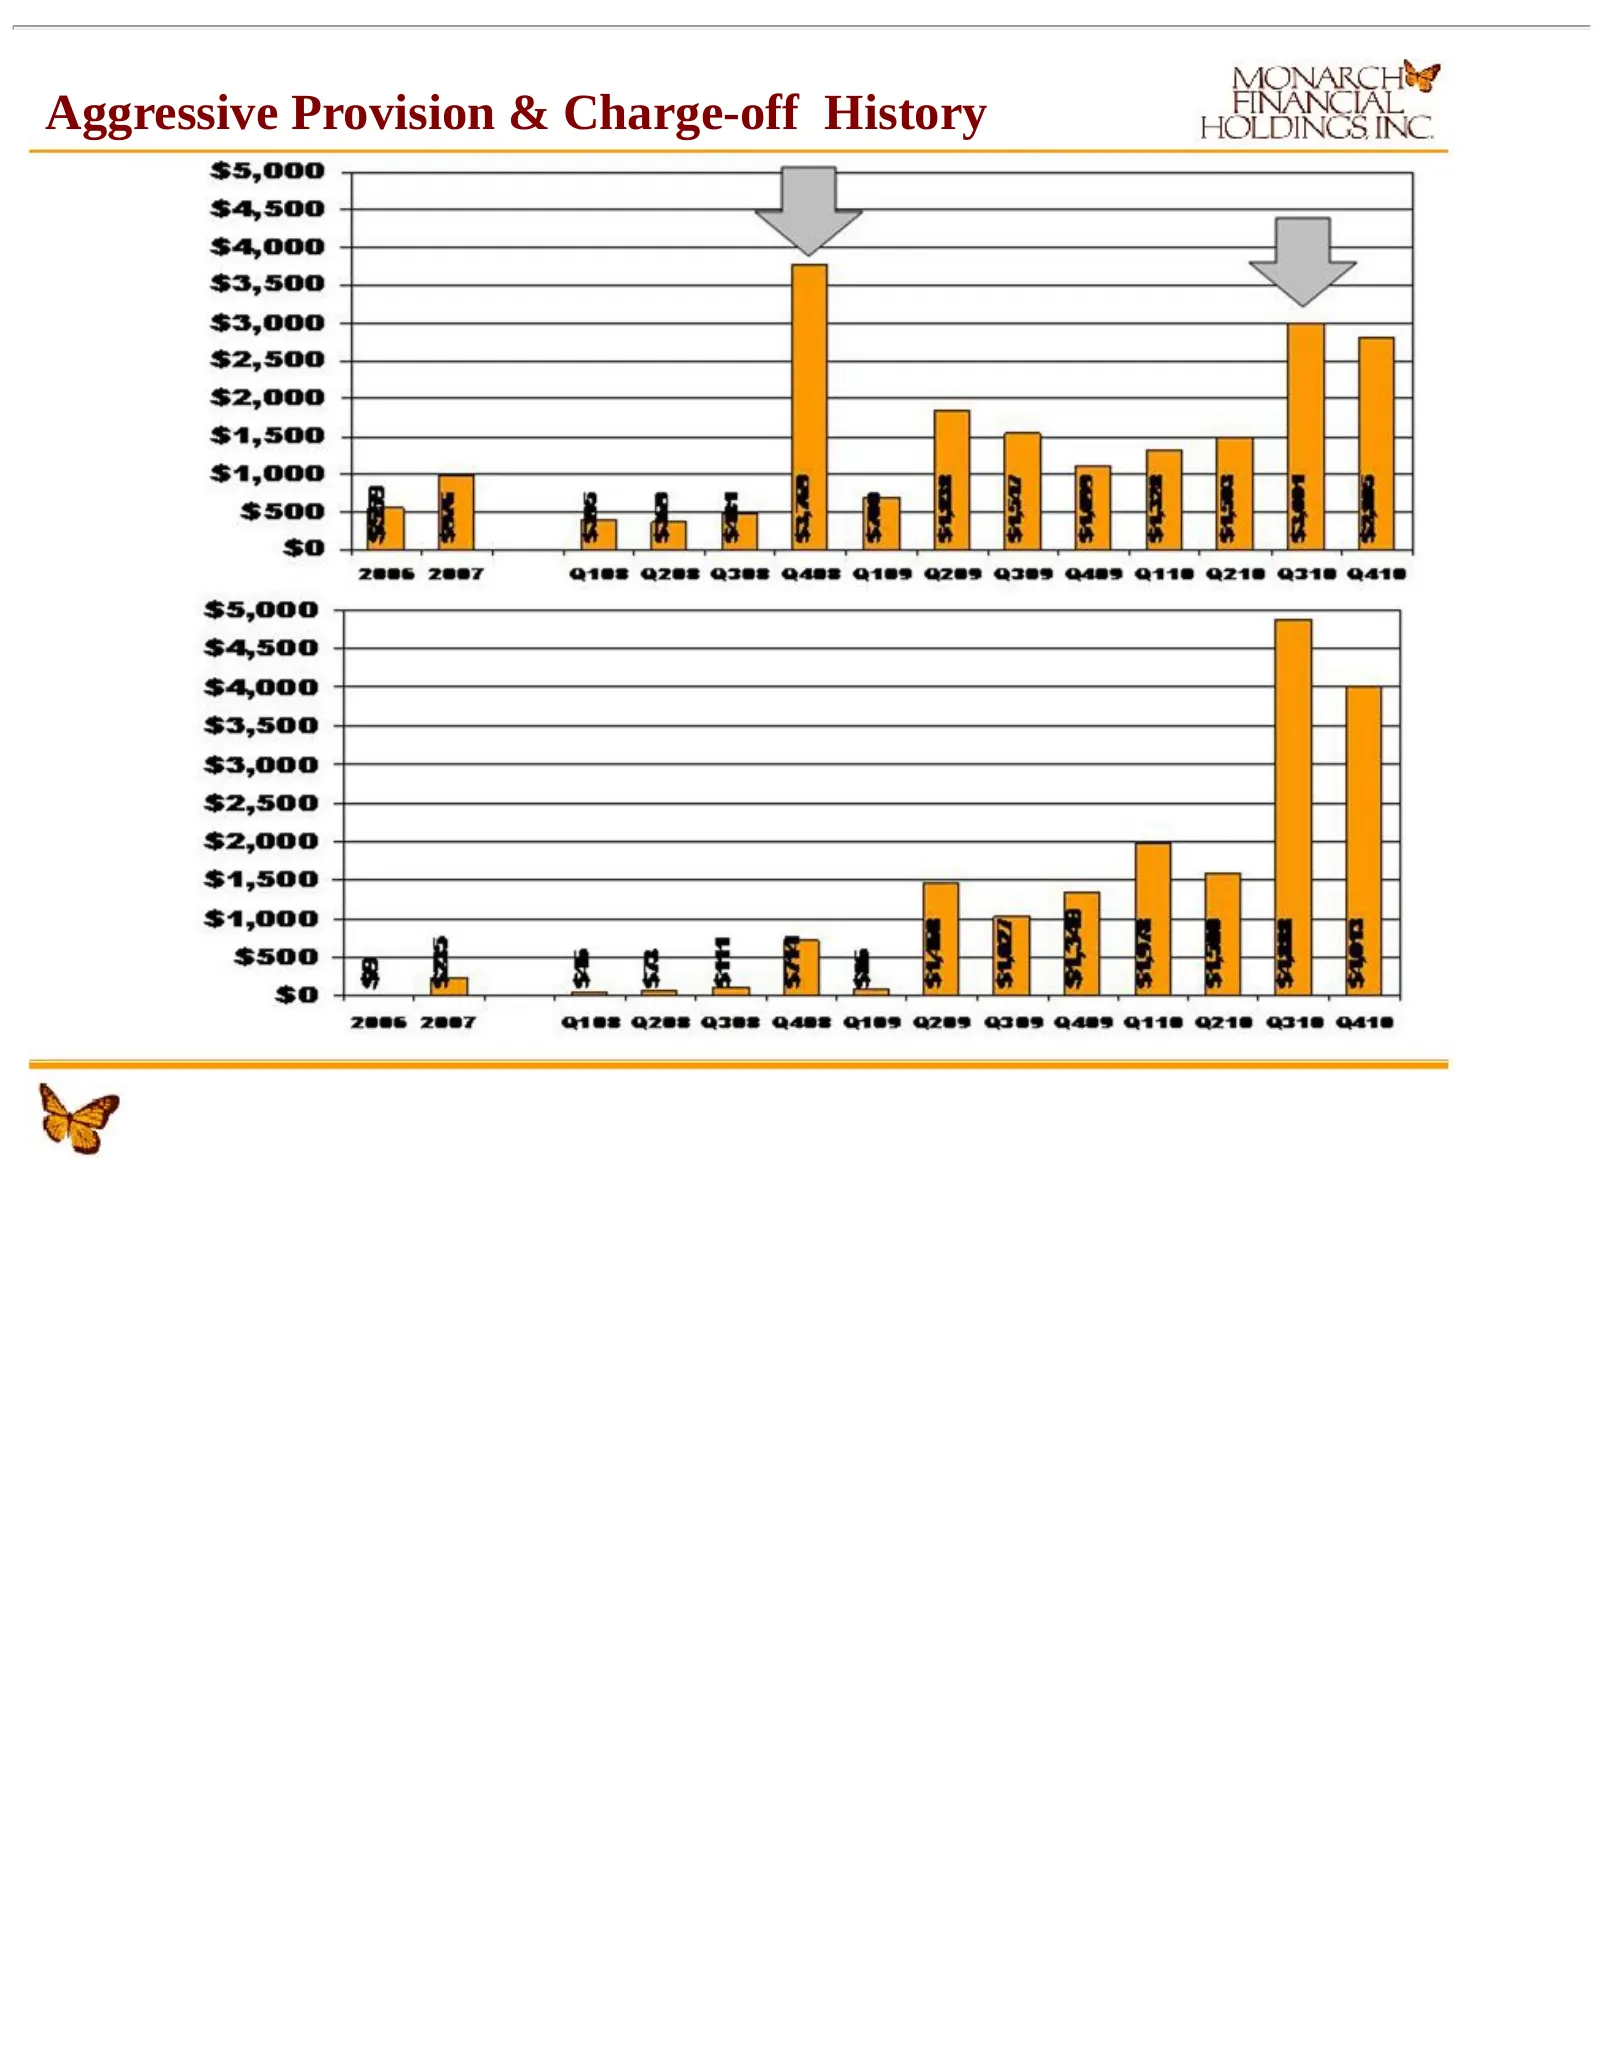
Aggressive Provision & Charge-off History
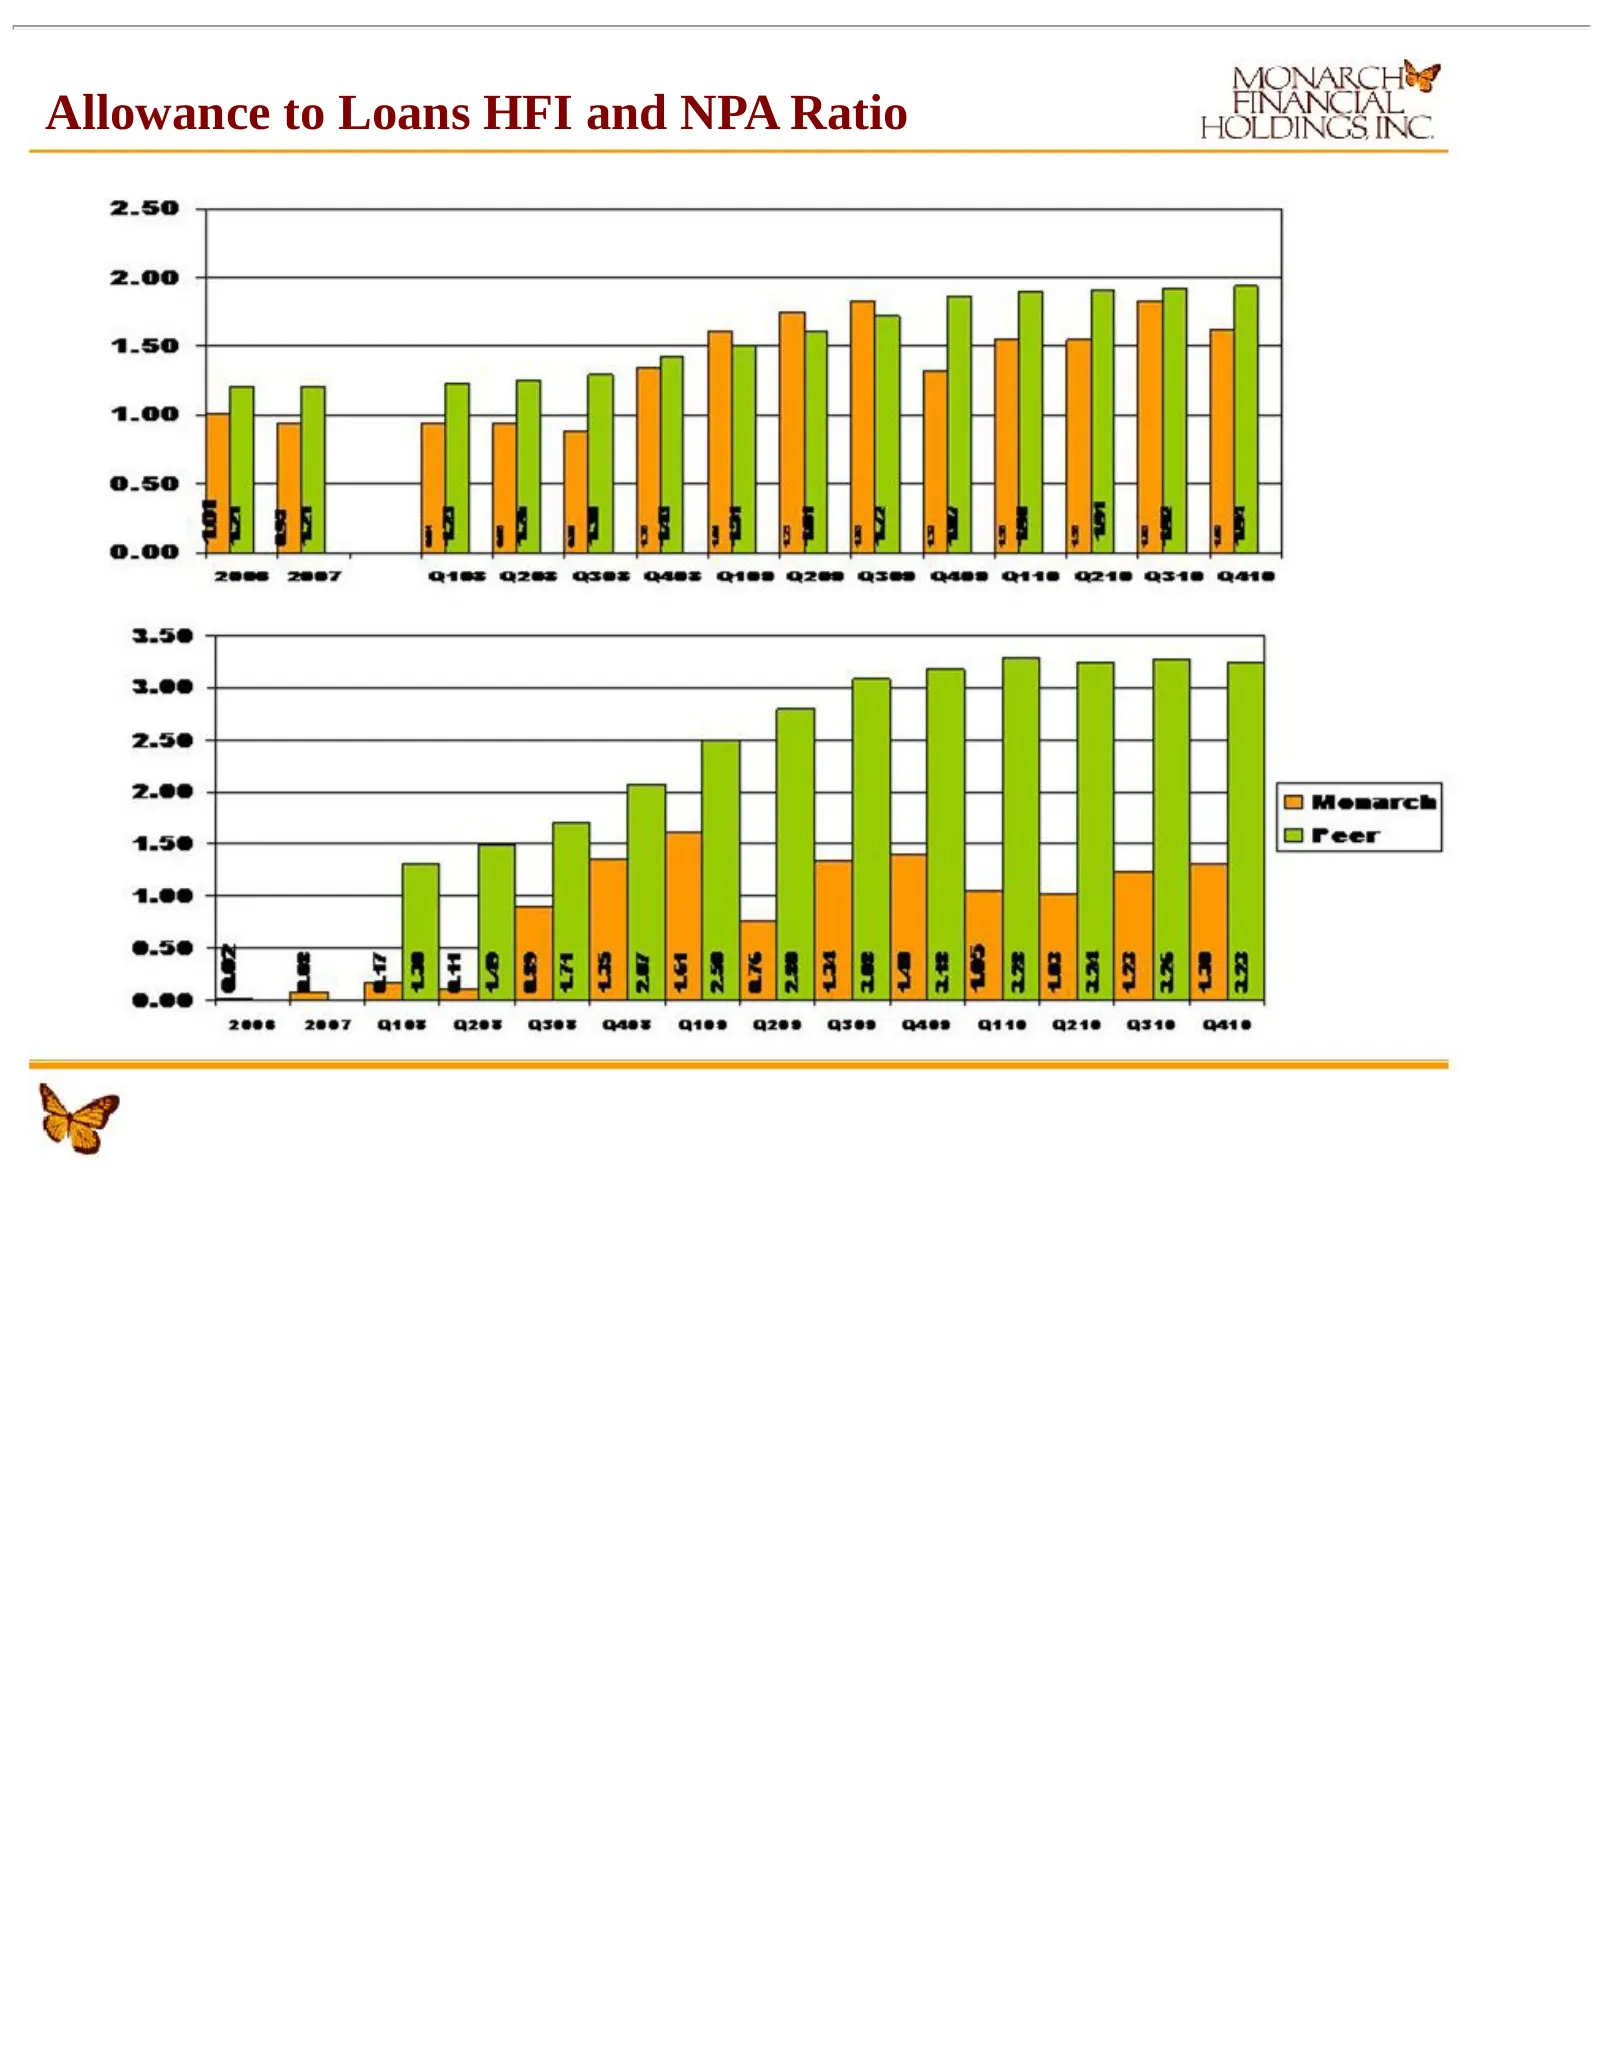
Slide 26: Allowance to Loans HFI and NPA Ratio
Allowance to Loans HFI and NPA Ratio
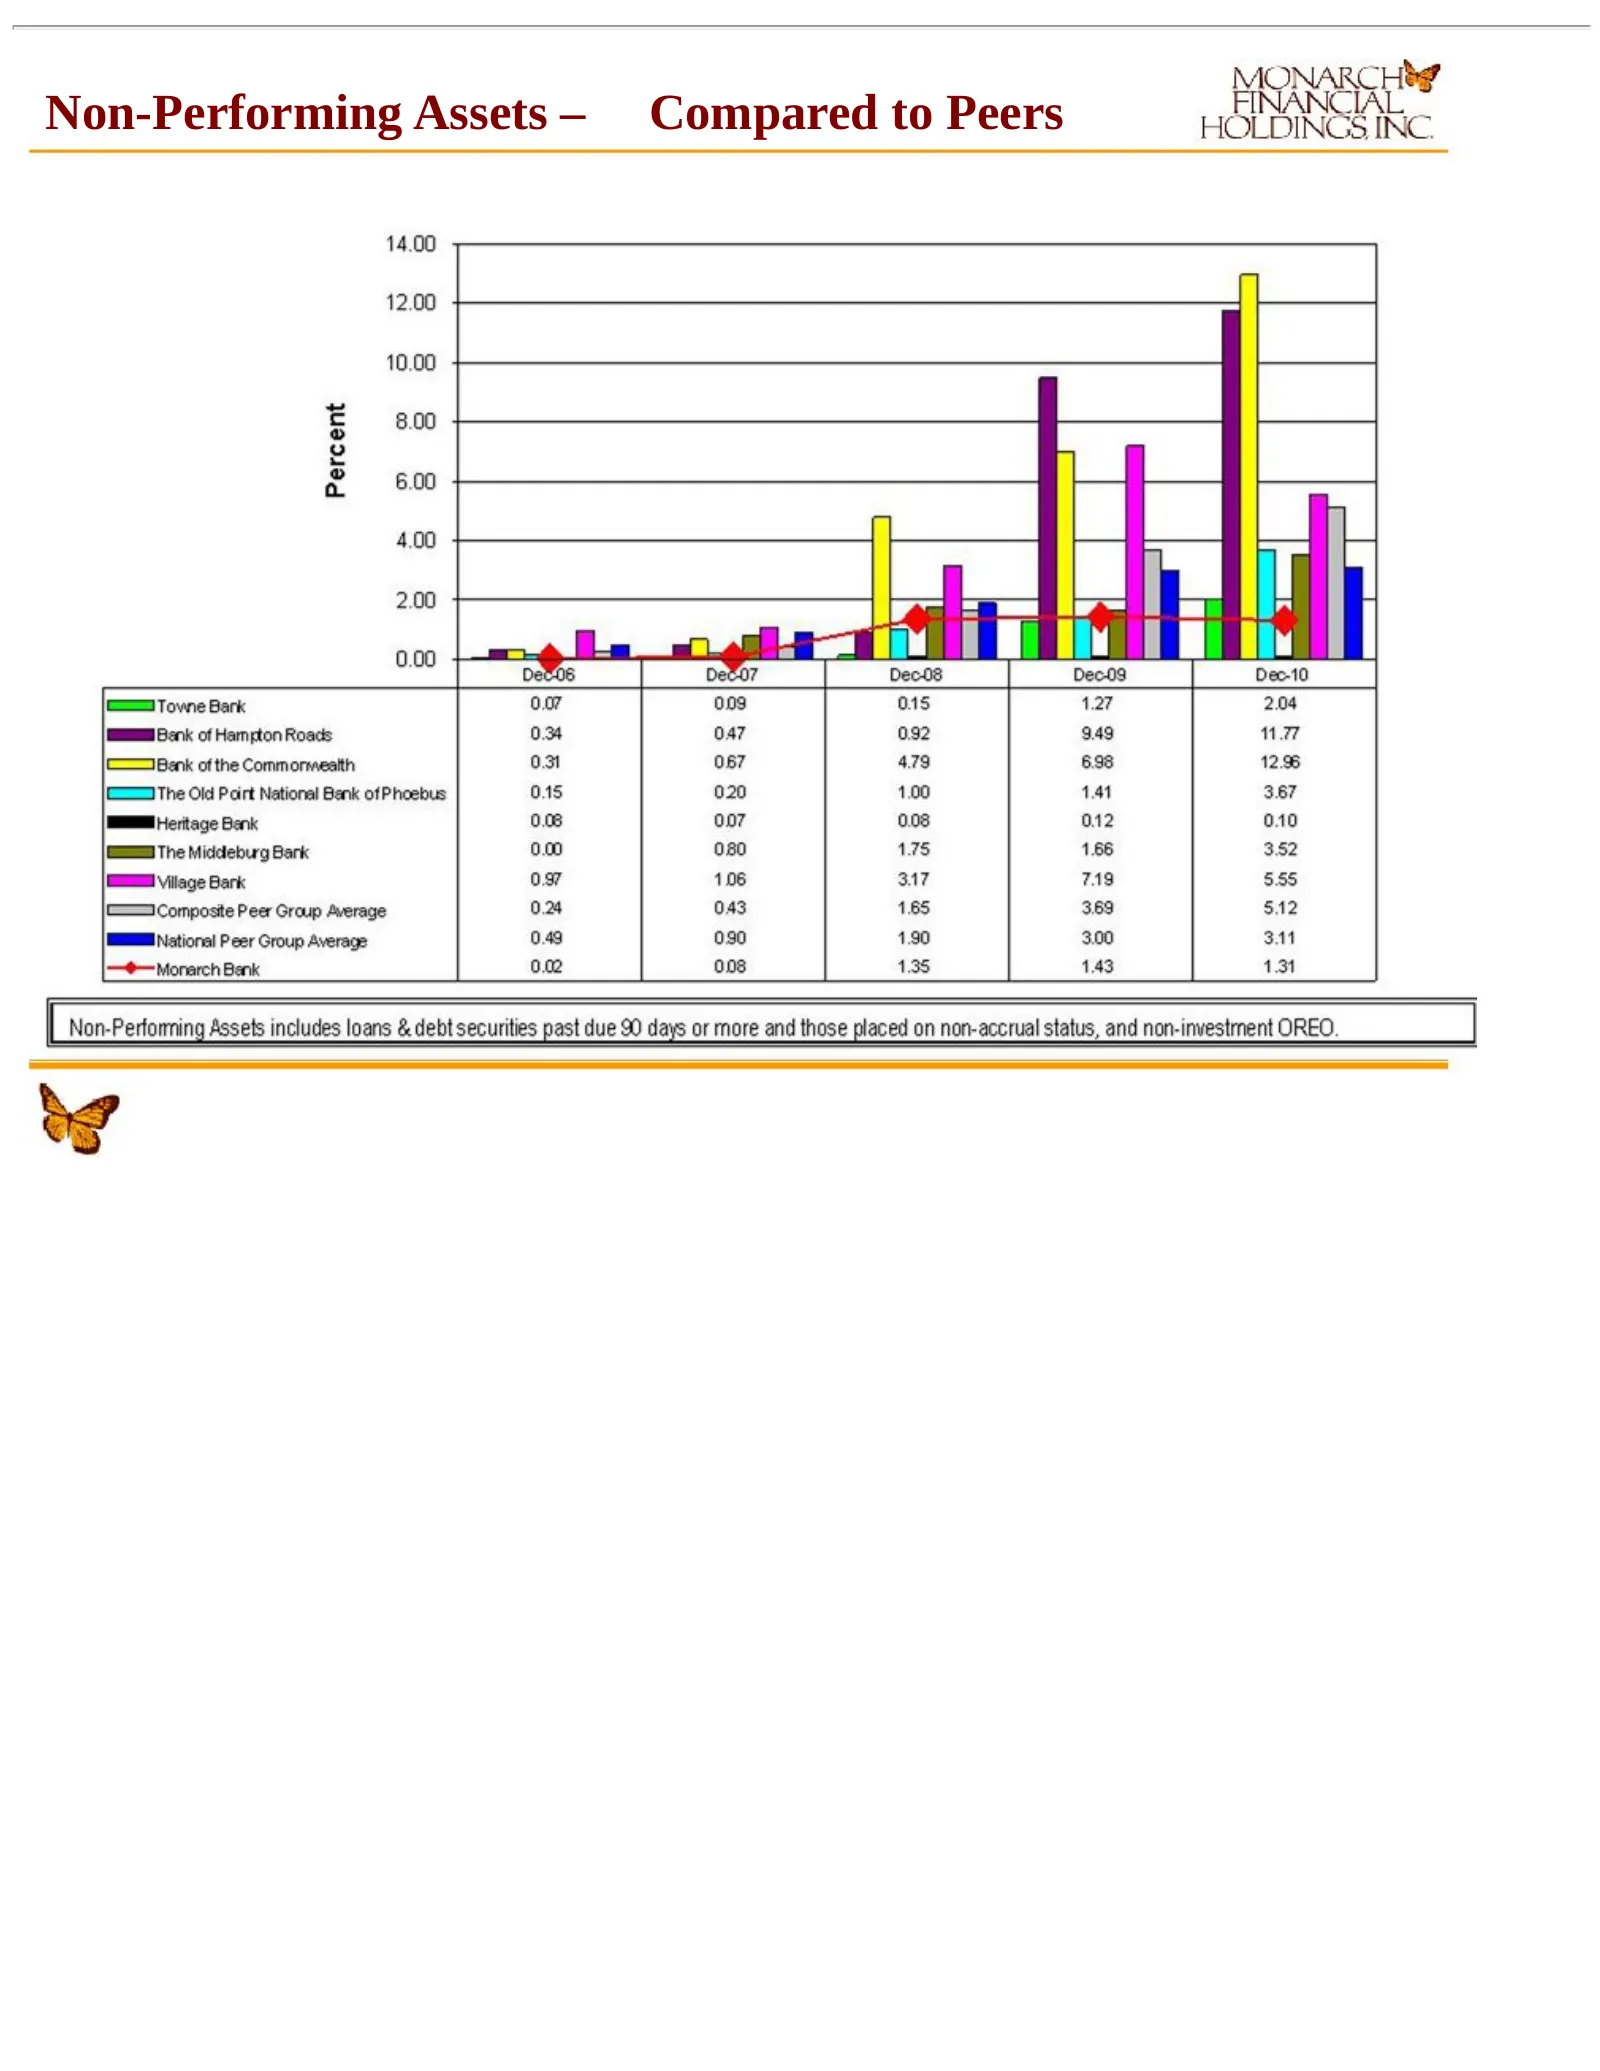
Slide 27: Non-Performing Assets – Compared to Peers
Non-Performing Assets – Compared to Peers
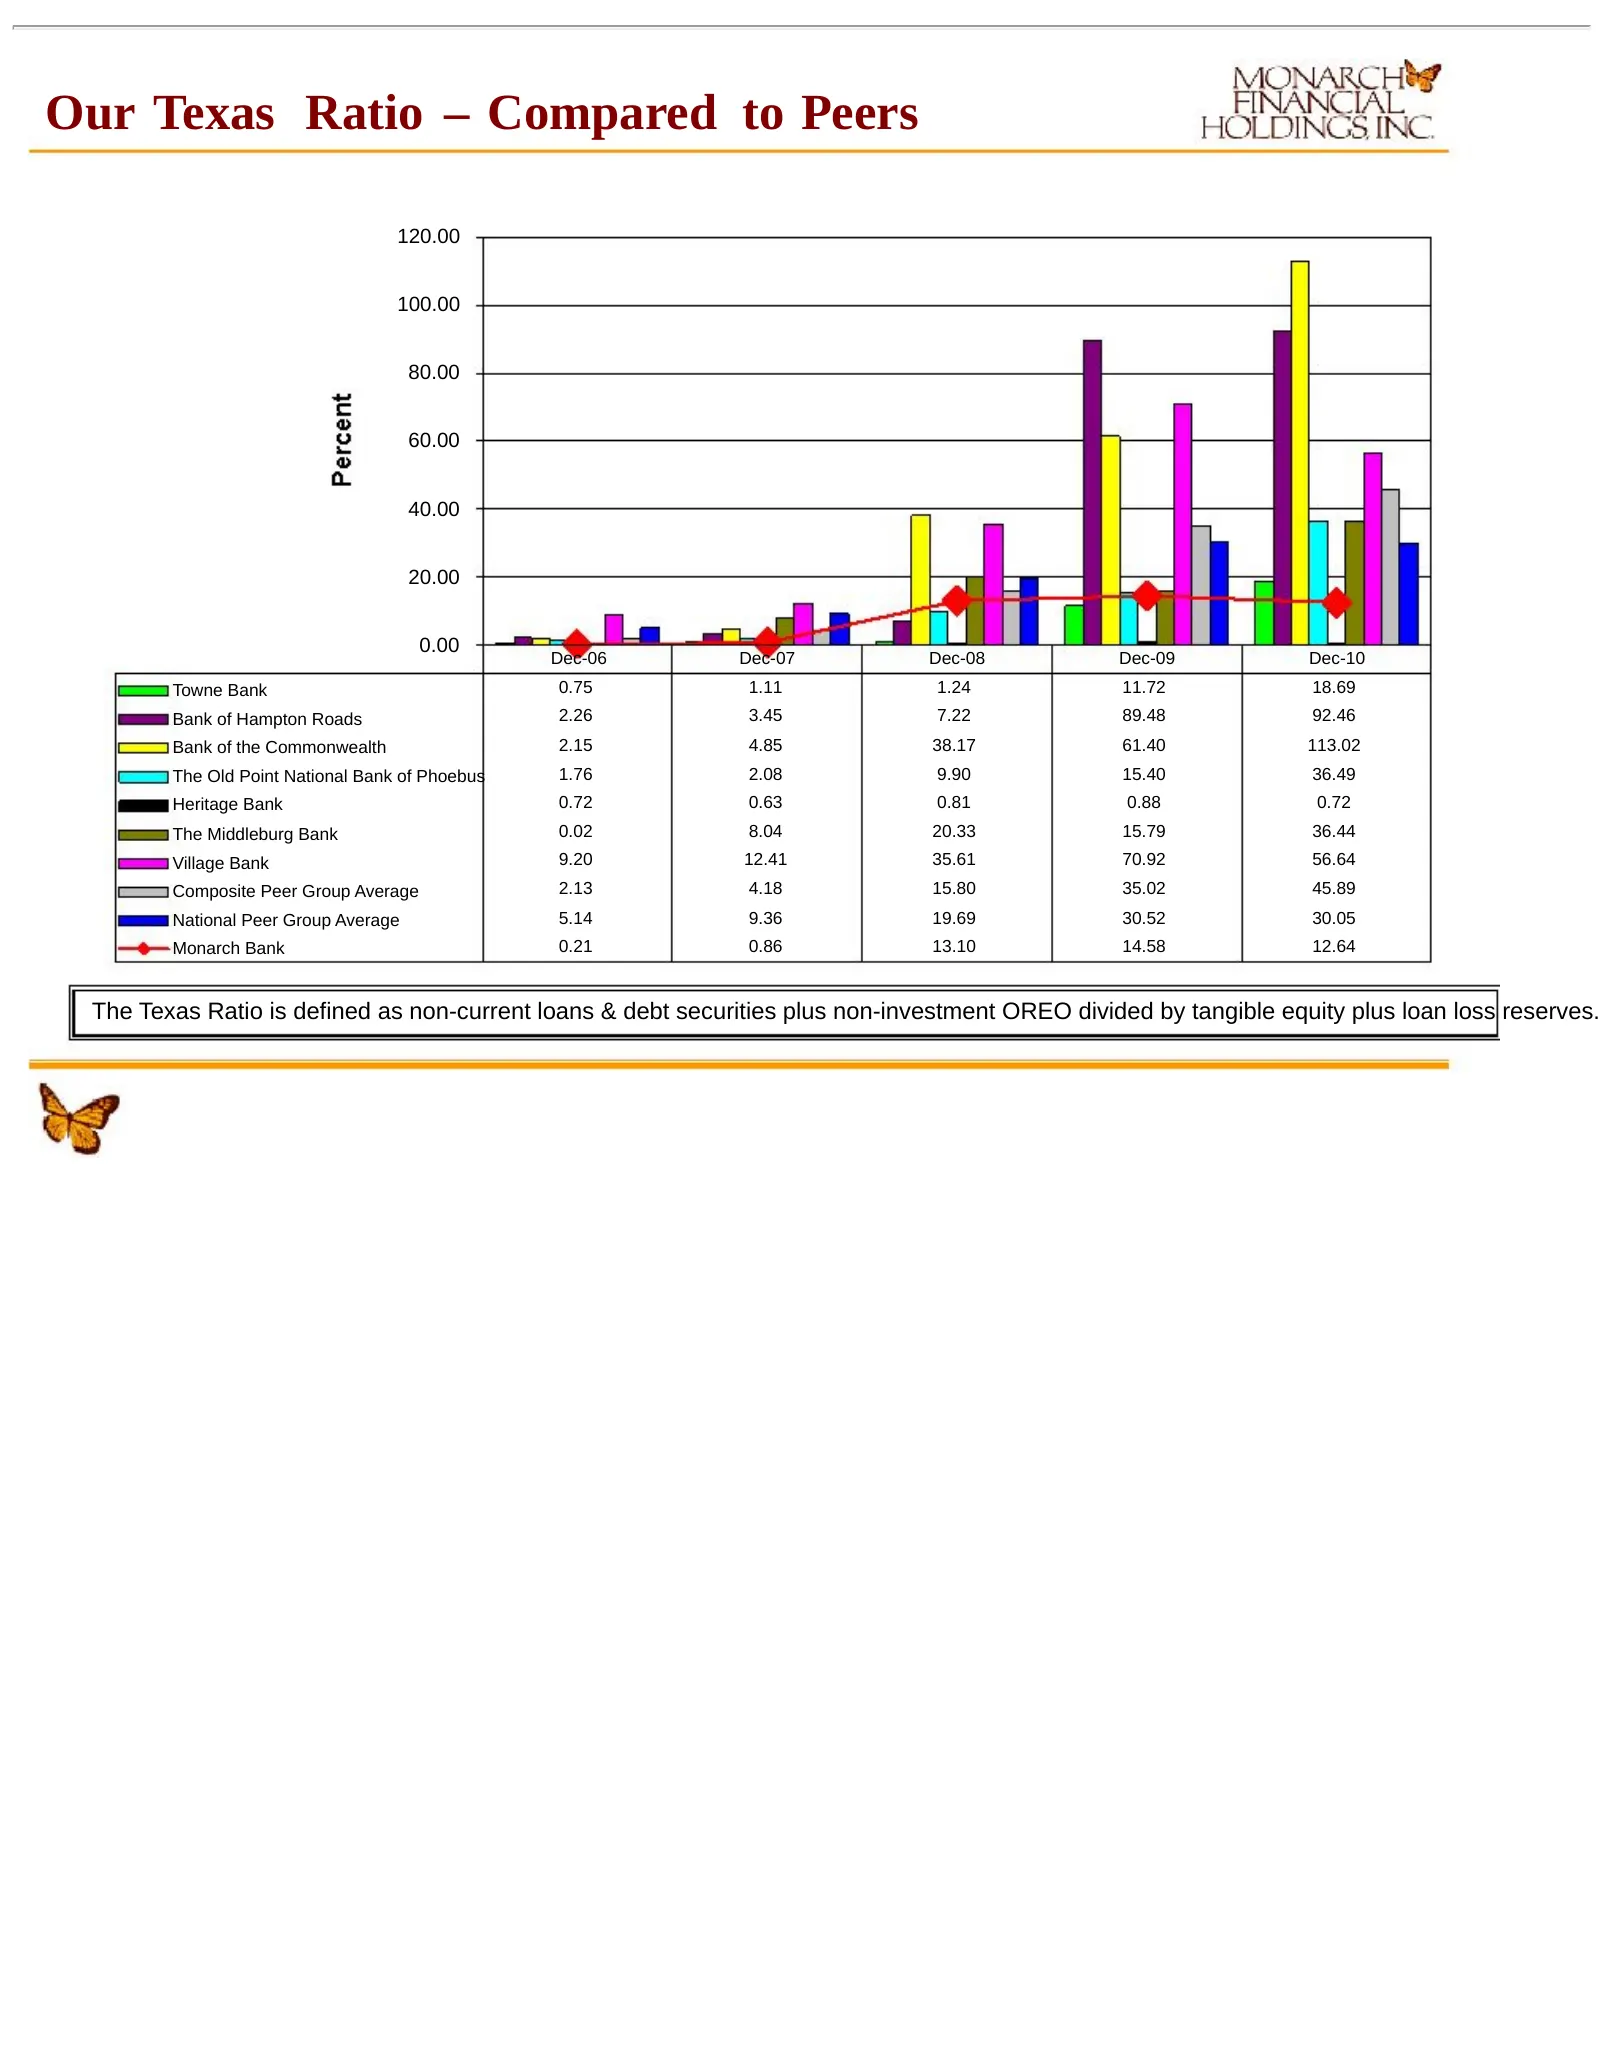
Slide 28: Our Texas Ratio – Compared to Peers
Our Texas Ratio – Compared to Peers 120.00 100.00 80.00 60.00 40.00 20.00 0.00 Dec-06 Dec-07 Dec-08 Dec-09 Dec-10 Towne Bank 0.75 1.11 1.24 11.72 18.69 Bank of Hampton Roads 2.26 3.45 7.22 89.48 92.46 Bank of the Commonwealth 2.15 4.85 38.17 61.40 113.02 The Old Point National Bank of Phoebus 1.76 2
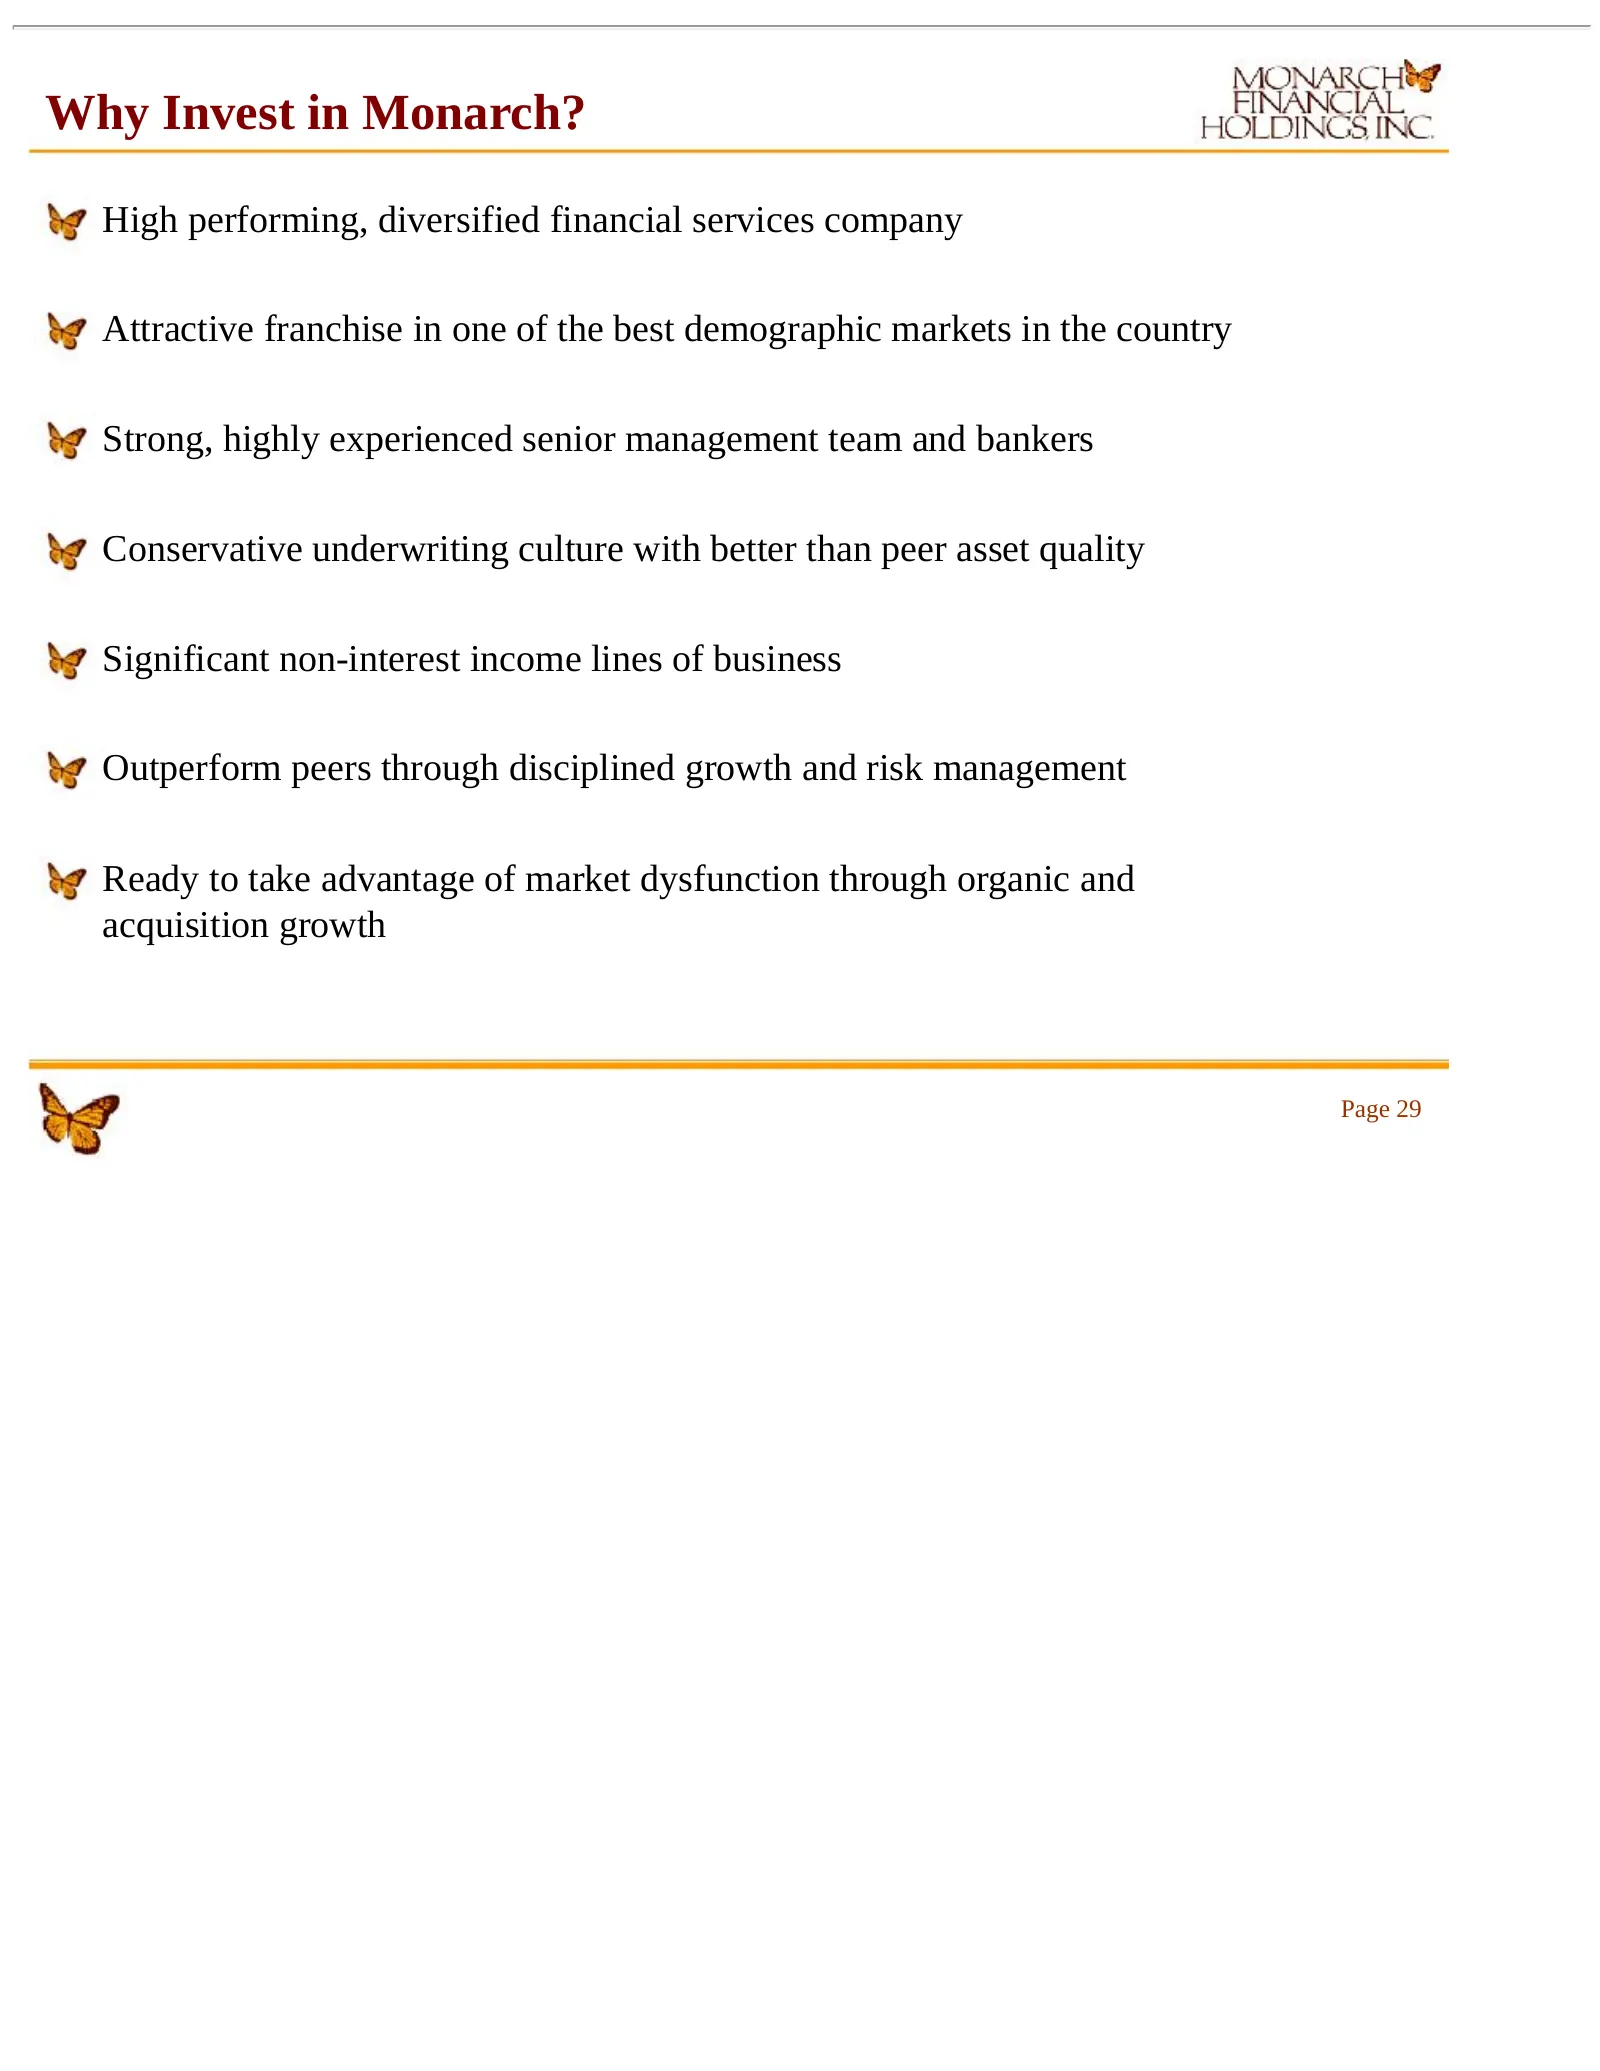
Slide 29: Why Invest in Monarch?
Why Invest in Monarch? High performing, diversified financial services company Attractive franchise in one of the best demographic markets in the country Strong, highly experienced senior management team and bankers Conservative underwriting culture with better than peer asset quality Significant no

Slide 30: Thank You
* * * * * * * * * * * * * * * * * * * * * * * * * * * Thank You
Source: SEC EDGAR · 8-K filed Mar 22, 2011
More decks from Monarch Financial Holdings Inc
 Merger or Acquisition (December 2015)13 slides · Dec 17, 2015
 Investor Presentation (September 2015)24 slides · Sep 9, 2015
 Investor Presentation (February 2015)32 slides · Feb 20, 2015
 Investor Presentation (December 2013)31 slides · Dec 4, 2013
 Investor Presentation (November 2012)32 slides · Nov 8, 2012
 Investor Presentation (September 2012)33 slides · Sep 19, 2012