Green Earth Technologies — Investor Presentation (October 2011)
30 slides from Green Earth Technologies's investor presentation, Oct 5, 2011

Slide 1: September 2011 Investor Presentation
\ / GREEN EARTH " TECHNOLOGIES a September 2011 Investor Presentation
Slide 2: Safe Harbor Statement
Safe Harbor Statement Forward Looking Statements Statements made in this presentation that relate to future plans, events, financial results or performance are forward-looking statements as defined under the Private Securities Litigation Reform Act of 1995. These statements are based upon current in
Slide 3: Key Statistics
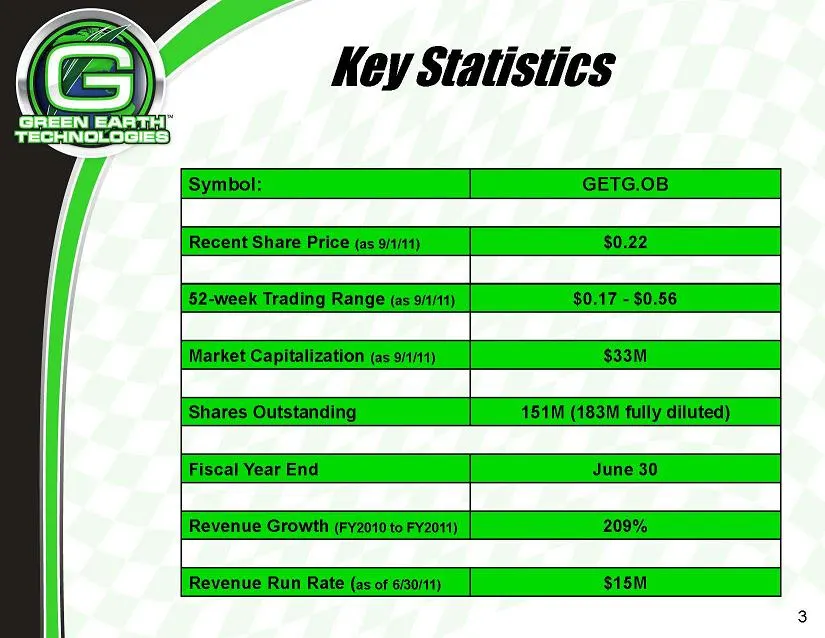
KeySi listics Symbol: GETG.OB Recent Share Price (as 9/1/11) $0.22 52-week Trading Range (as 9/1/11) $0.17 - $0.56 Market Capitalization (as 9/1/11) $33M Shares Outstanding 151M (183M fully diluted) Fiscal Year End June 30 Revenue Growth (Fy2010 to FY2011) 209% Revenue Run Rate (as of 6/30/11) $15M
Slide 4: Investment Highlights
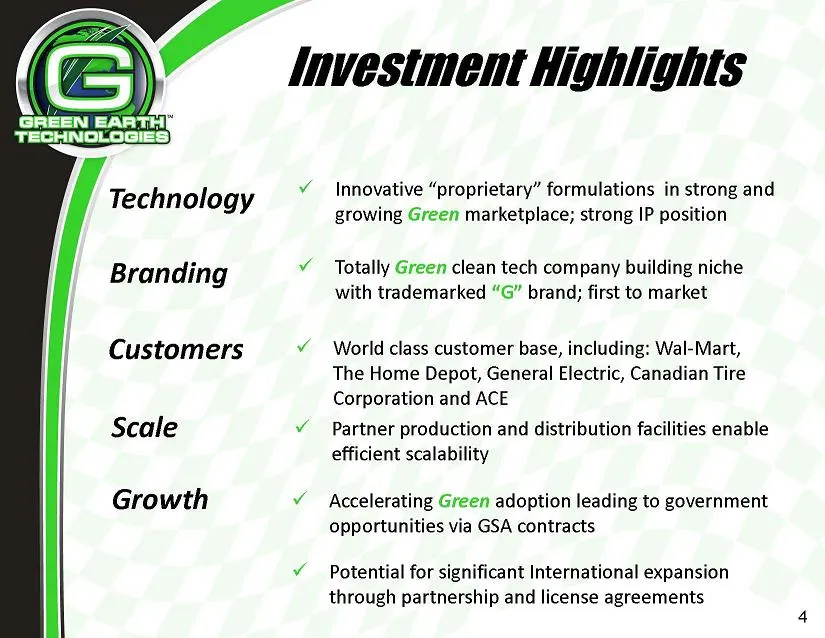
Technology Branding Customers a Scale v Growth 4 Highlights VES Innovative “proprietary” formulations in strong and growing Green marketplace; strong IP position Totally Green clean tech company building niche with trademarked “G” brand; first to market World class customer base, including: Wal-Mart
Slide 5: Green Earth Technologies is a "totally green" clean tech company
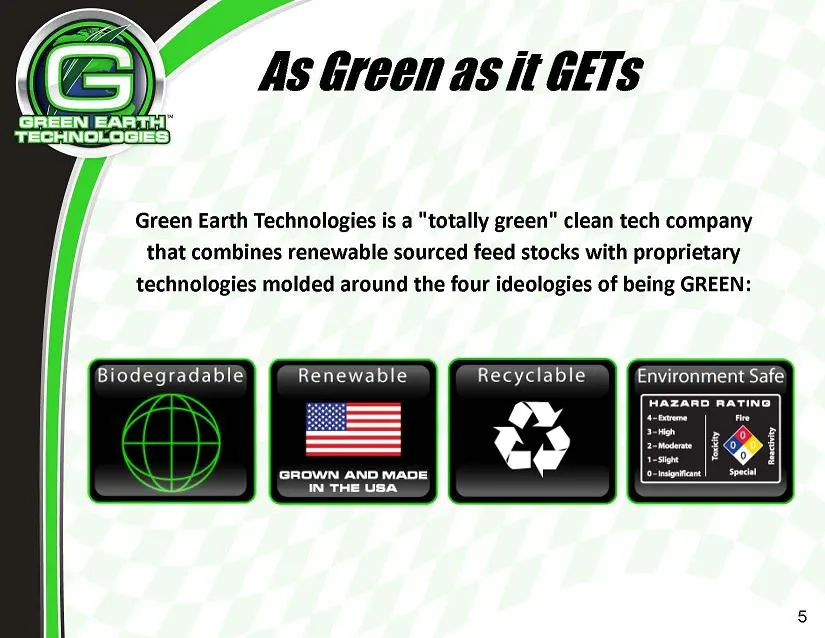
Green Earth Technologies is a "totally green" clean tech company that combines renewable sourced feed stocks with proprietary technologies molded around the four ideologies of being GREEN: GROWN AND MADE IN THE USA,
Slide 6: Eco-Friendly + Hazard Free
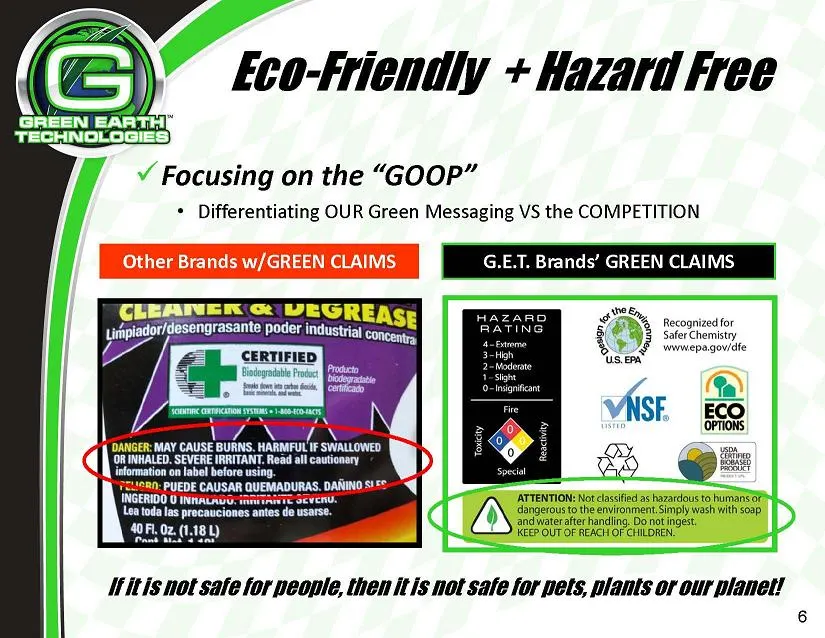
Feo-Frienty + Hazard Free Focusing on the “GOOP” * Differentiating OUR Green Messaging VS the COMPETITION Other Brands w/GREEN CLAIMS G.E.T. Brands’ GREEN CLAIMS A ome 5 tecoazedte 3 Safer Chemistry py easeny, NSF. Eco andwater after handling. Do not ingest [ATTENTION Not elasified as hazardous to h
Slide 7: Petroleum molecules never wear out
v Petroleum molecules never wear out * Oil does not dissolve in water and it lasts a long time, sticking to everything from beach sand to bird feathers * Only about 16% (estimated 1.3 billion quarts of motor vehicle engine oil generated yearly) of used oil is re-refined into new oil ¥ Used motor oil
Slide 8: Increase of bio-content as a lubricant
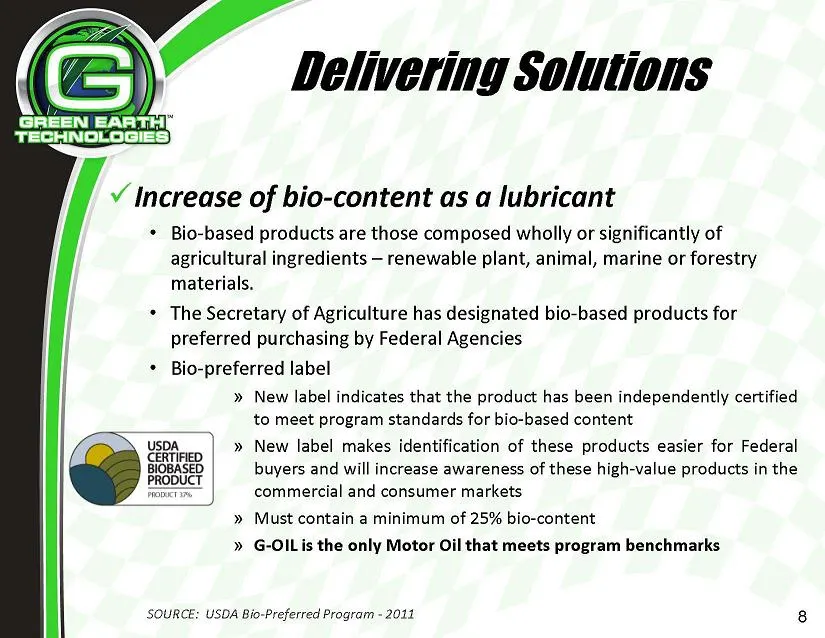
¥ Increase of bio-content as a lubricant * Bio-based products are those composed wholly or significantly of agricultural ingredients — renewable plant, animal, marine or forestry materials. * The Secretary of Agriculture has designated bio-based products for preferred purchasing by Federal Agencies
Slide 9: Market Opportunity
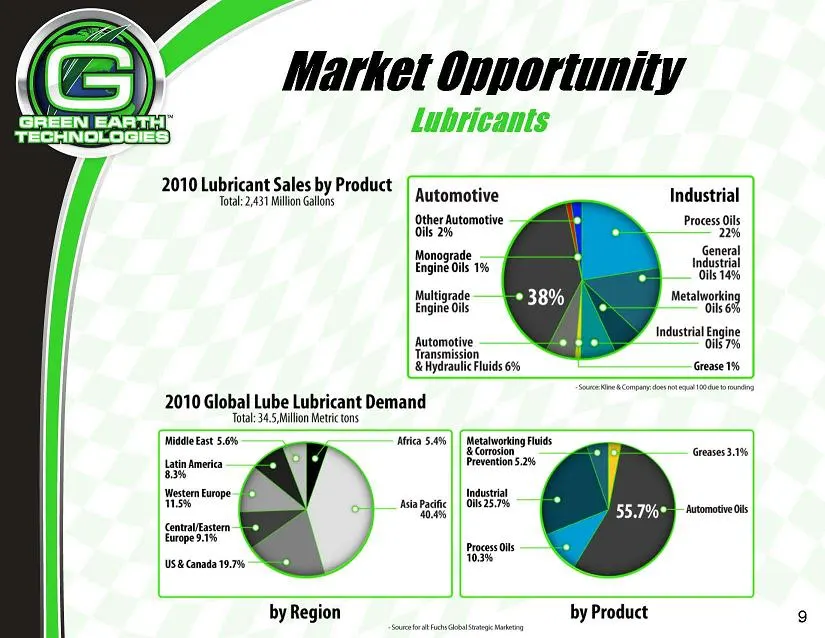
¢ Market Opportunity rN Lubricants 2010 Lubricant Sales by Pt . ater pe oneted roduct / jutomotive Other Automotive Oils 2% Industrial Process Oils General Monograe Industral ane —"tils 14% Metalworking Industrial Engine 118 7% Grease 1% 2010 Global Lube Lubricant Demand Total: 34.5 Million Meticton
Slide 10: Market Opportunity
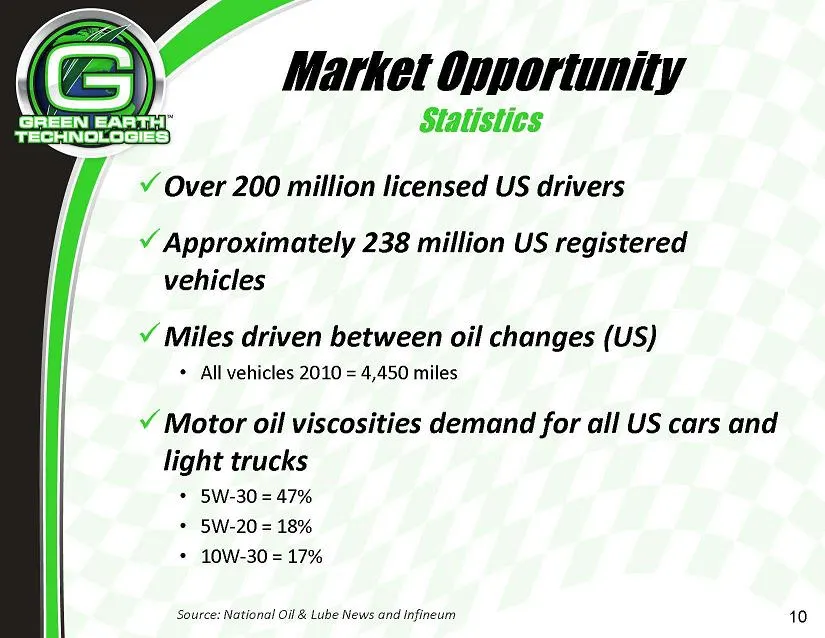
¢ Market Opportunity Statistics ¥ Over 200 million licensed US drivers ¥ Approximately 238 million US registered vehicles Y¥ Miles driven between oil changes (US) * All vehicles 2010 = 4,450 miles ¥ Motor oil viscosities demand for all US cars and light trucks * 5W-30= 47% * SW-20 = 18% * 10W-30= 17
Slide 11: Green Drivers
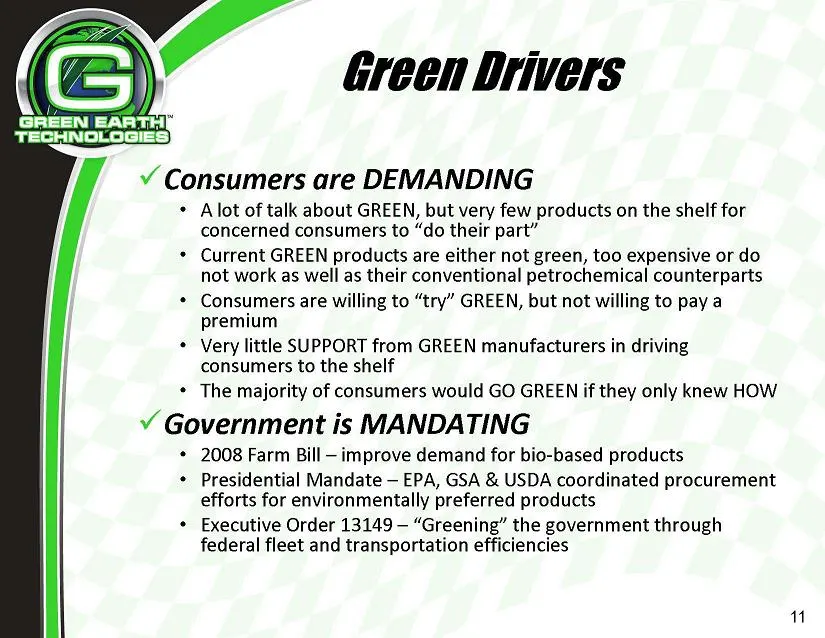
een Drivers ¥ Consumers are DEMANDING * Alot of talk about GREEN, but very few products on the shelf for concerned consumers to “do their part” * Current GREEN products are either not green, too expensive or do not work as well as their conventional petrochemical counterparts * Consumers are willing
Slide 12: Motor Oil
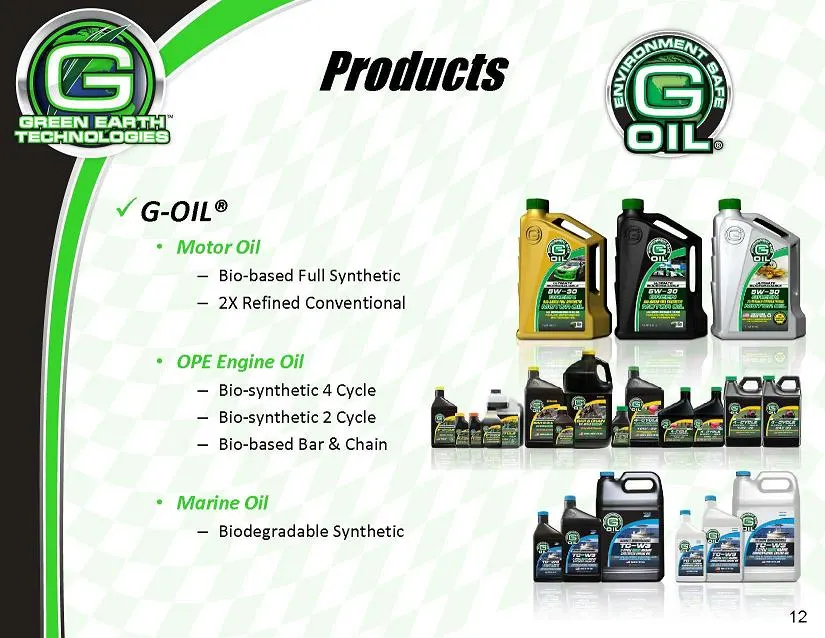
* Motor Oil — Bio-based Full Synthetic — 2X Refined Conventional * OPE Engine Oil — Bio-synthetic 4 Cycle — Bio-synthetic 2 Cycle — Bio-based Bar & Chain * Marine Oil = Biodegradable Synthetic
Slide 13: Products
Slide 14: Brand Positioning
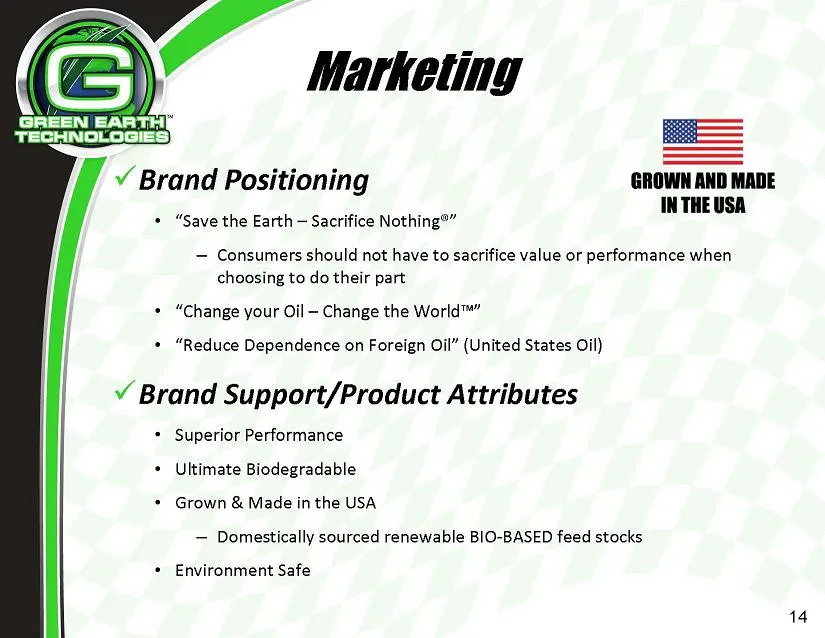
¥ Brand Positioning GROWN AND _ INTHE U * “Save the Earth — Sacrifice Nothing®” — Consumers should not have to sacrifice value or performance when choosing to do their part + “Change your Oil — Change the World™” + “Reduce Dependence on Foreign Oil” (United States Oil) ¥ Brand Support/Product Attrib
Slide 15: Certifications
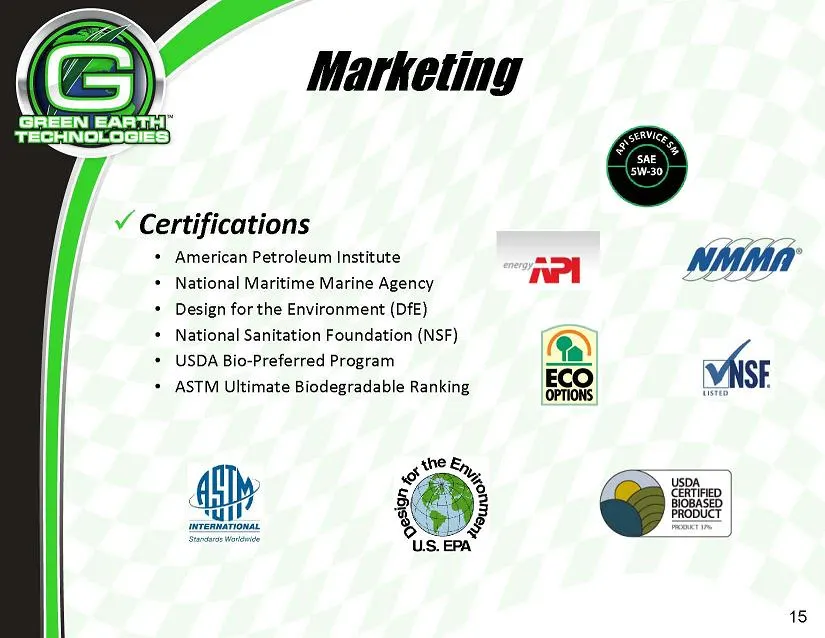
Y Certifications + American Petroleum Institute - + National Maritime Marine Agency nl * Design for the Environment (DfE) + National Sanitation Foundation (NSF) @\ + USDA Bio-Preferred Program — + ASTM Ultimate Biodegradable Ranking ECO 15
Slide 16: Marketing
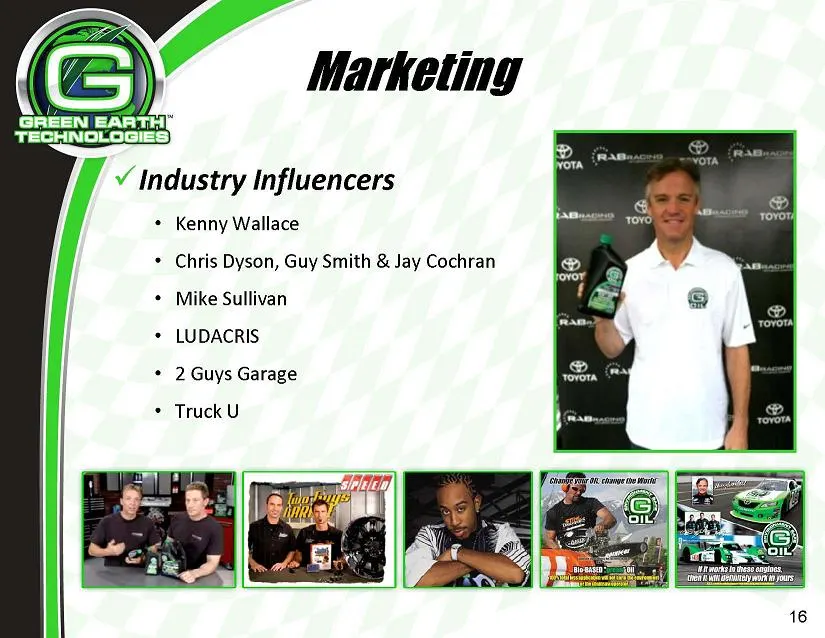
Marketing Industry Influencers * Kenny Wallace * Chris Dyson, Guy Smith & Jay Cochran * Mike Sullivan * LUDACRIS * 2 Guys Garage * Truck U “aerate were 16
Slide 17: Your Engine, The Earth
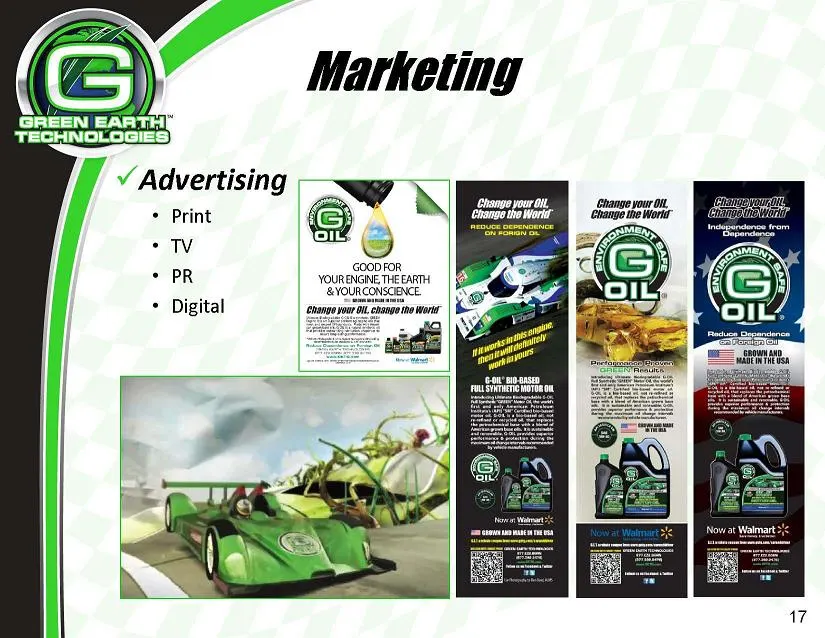
YOURENGINE THEEARTH | y3 YO E
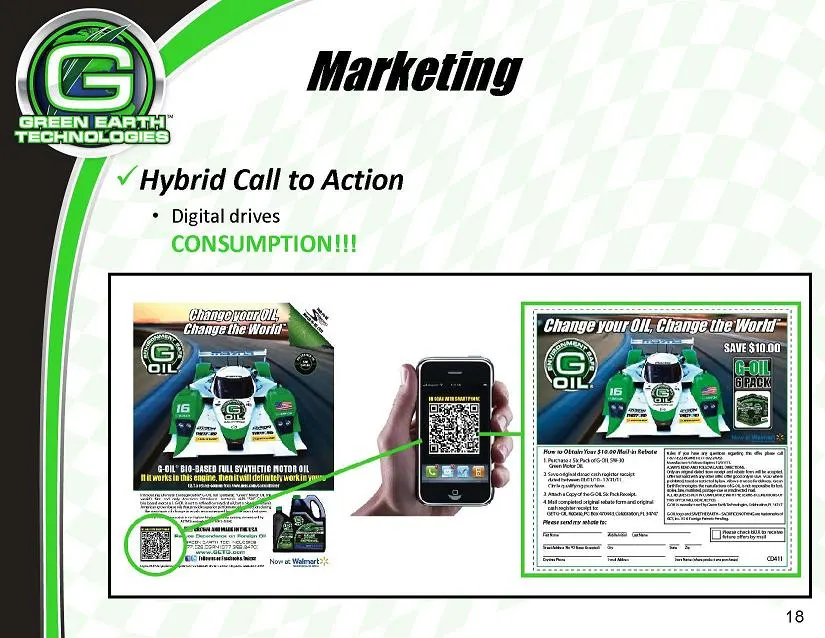
Slide 18: Hybrid Call to Action
‘Hybrid Call to Action * Digital drives eau neon 18
Slide 19: LivingGuy
4 LivingGuy™ _ CAREDRIVER UE | TODAY OPE AU TOWEEK 1 > = fe => a \ Hatley Earth Friendly Ei CG. an
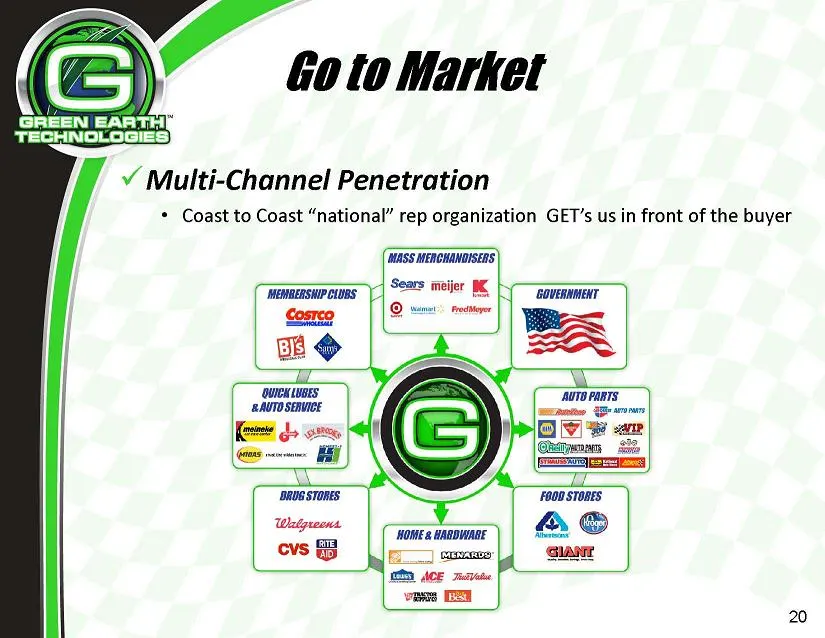
Slide 20: Multi-Channel Penetration
¥ Multi-Channel Penetration * Coast to Coast “national” rep organization GET’s us in front of the buyer [ ‘HOWE @ HABDVIABE i) some SD ACE mavite vere
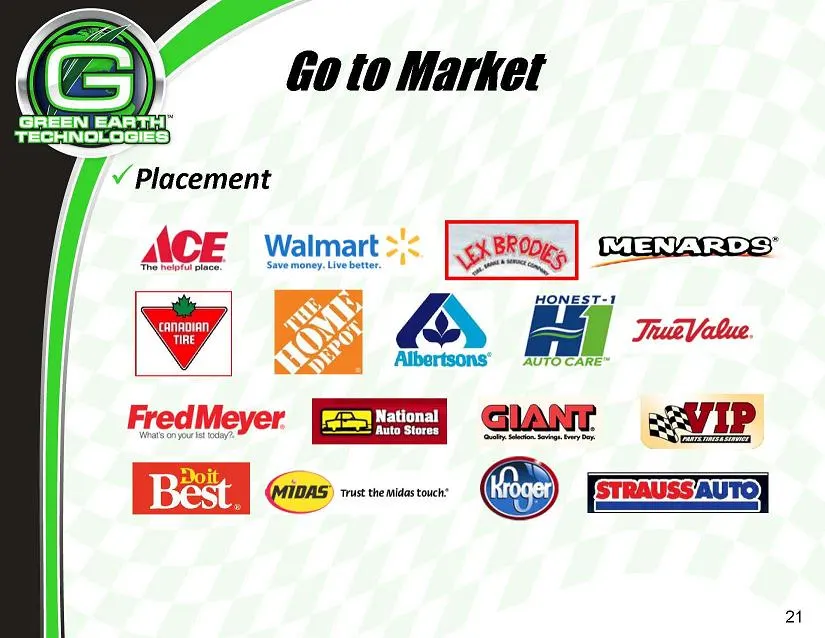
Slide 21: Retail customers
HONEST-1 CANADIAN, TIRE TruieValue Albertsons’ = auTocare~ " Ww ———— Sco 21
Slide 22: Highly Scalable
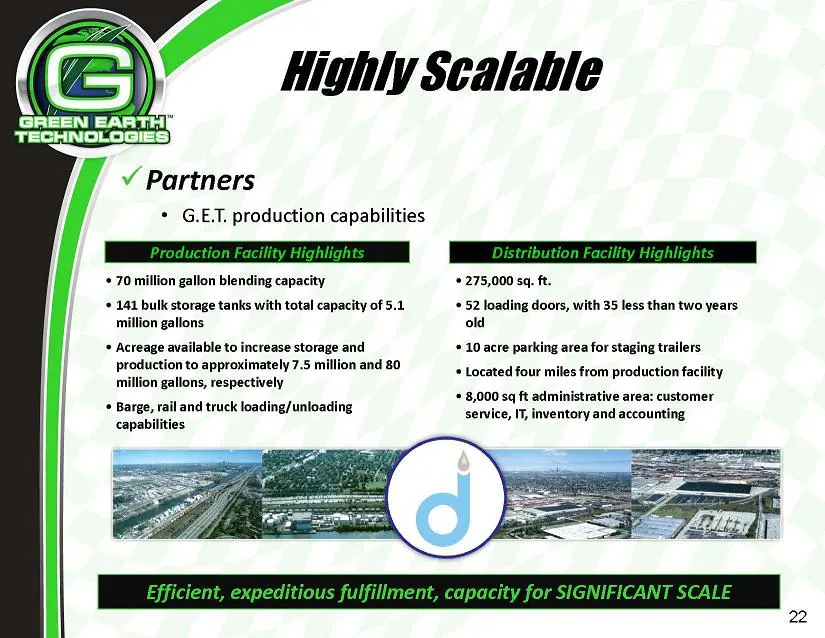
Highly Scalable Partners * G.ET. production capabilities Production Facility Highlights Distribution Facility Highlights + 70 million gallon blending capacity ++ 275,000 sq. ft. ‘+ 141 bulk storage tanks with total capacity of 5.1 +52 loading doors, with 35 less than two years. million gallons old +
Slide 23: Growth Opportunities
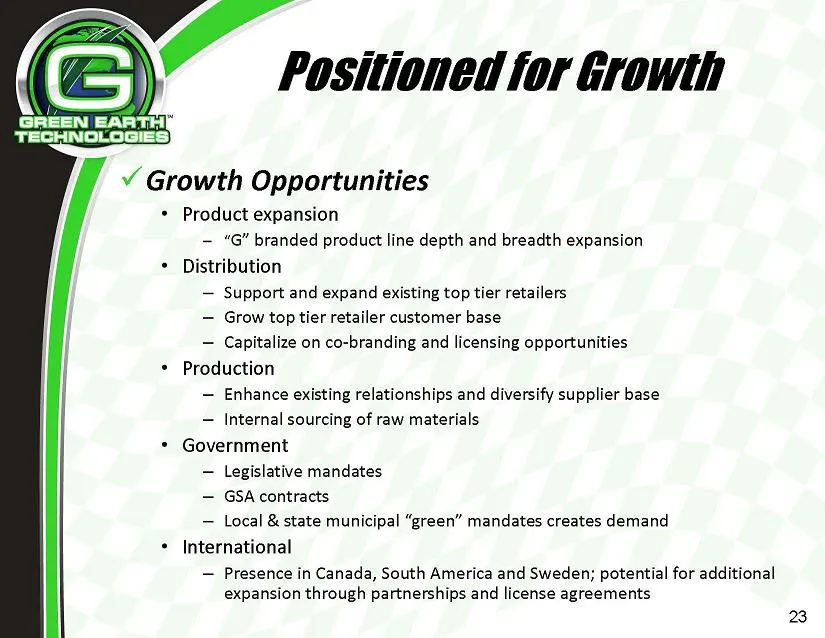
Y Growth Opportunities * Product expansion — “G” branded product line depth and breadth expansion Distribution — Support and expand existing top tier retailers — Grow top tier retailer customer base — Capitalize on co-branding and licensing opportunities Production — Enhance existing relationships a
Slide 24: Quarterly net sales
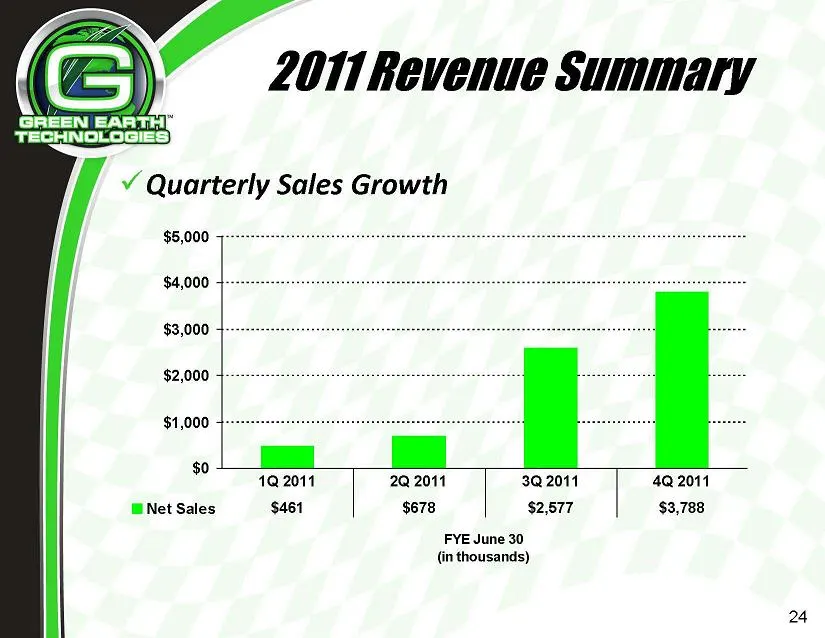
2Q 2011 $678 3Q 2011 $2,577 FYE June 30 (in thousands) 4Q 2011 $3,788 24
Slide 25: Net Sales FY2010 to FY2011
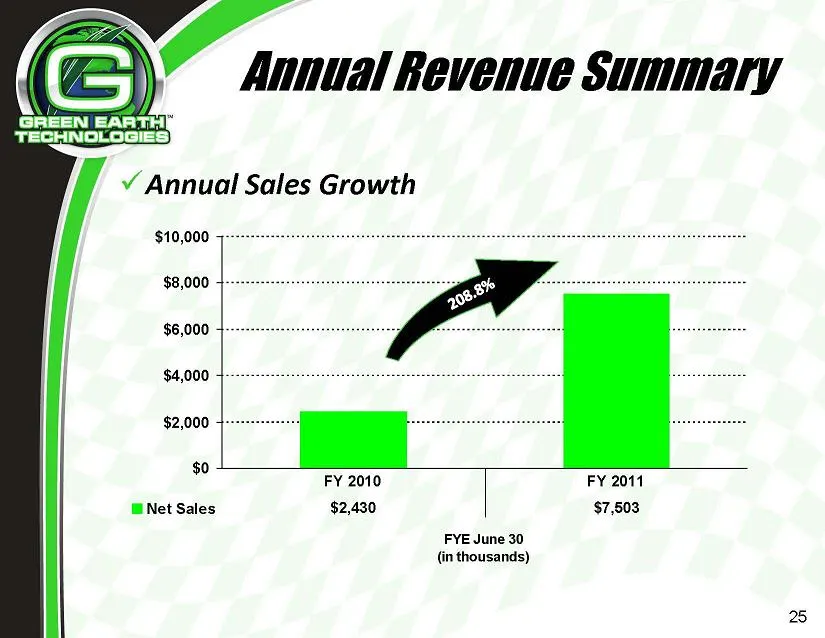
FY 2010 Net Sales $2,430 FY 2011 $7,503 FYE June 30 (in thousands)
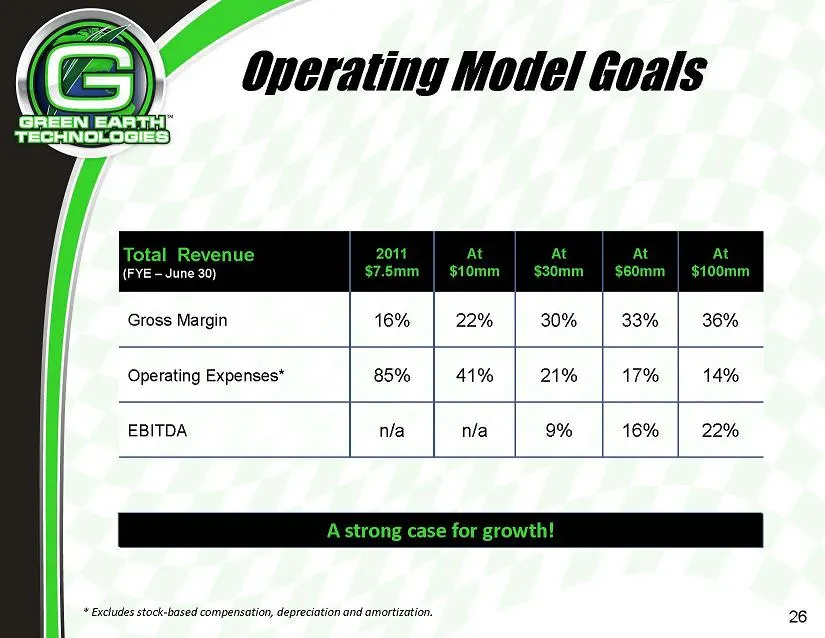
Slide 26: Total Revenue targets and margins
Total Revenue At At At (FYE - June 30) 1omm | $30mm | $60mm Gross Margin 16% 22% 30% 33% 36% | Operating Expenses* 85% 41% 21% 17% 14% EBITDA nla nla 9% 16% 22% A strong case for growth! * Excludes stock-based compensation, depreciation and amortization.
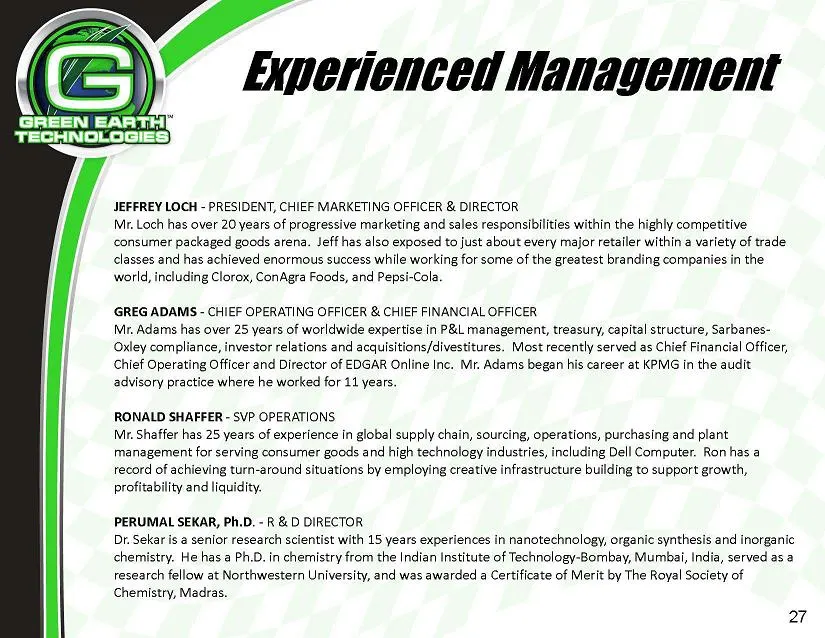
Slide 27: Experienced Management
3S Experienced Management GREEN EARTH JEFFREY LOCH - PRESIDENT, CHIEF MARKETING OFFICER & DIRECTOR Mr. Loch has over 20 years of progressive marketing and sales responsibilities within the highly competitive consumer packaged goods arena. Jeff has also exposed to just about every major retailer with
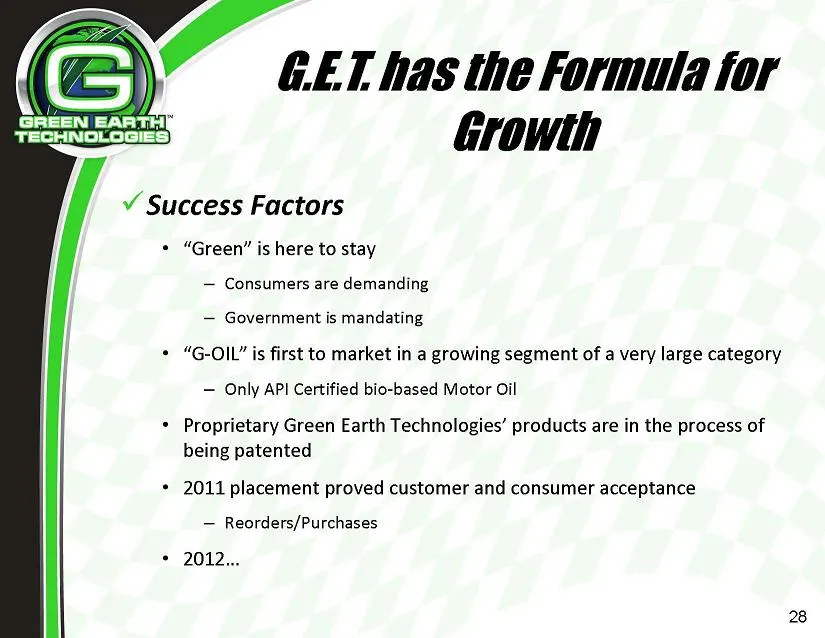
Slide 28: GET has the Formula for Growth
, GET has the Formuta for 5 Growth v Success Factors + “Green” is here to stay — Consumers are demanding — Government is mandating + “G-OIL’ is first to market in a growing segment of a very large category — Only API Certified bio-based Motor Oil * Proprietary Green Earth Technologies’ products are
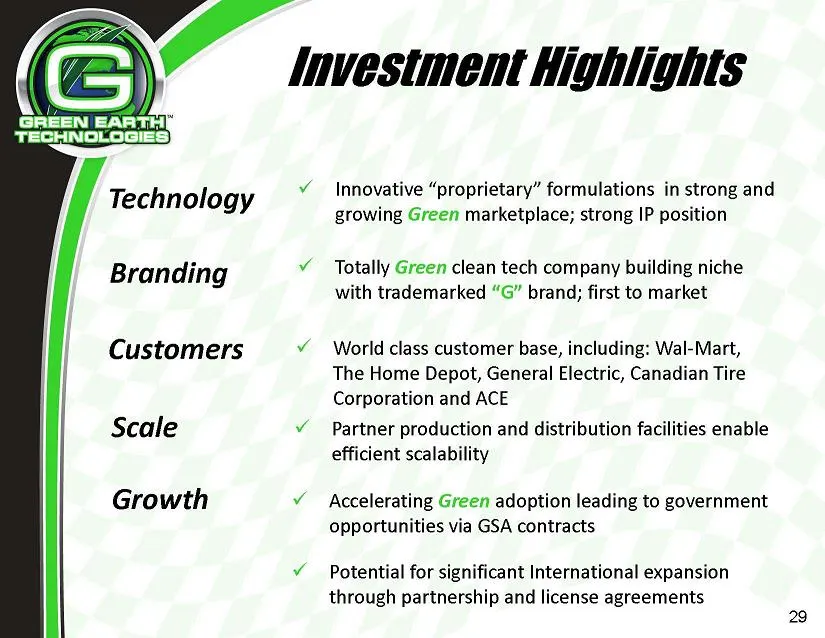
Slide 29: Investment Highlights
Technology Branding Customers a Scale v Growth 4 Highlights VES Innovative “proprietary” formulations in strong and growing Green marketplace; strong IP position Totally Green clean tech company building niche with trademarked “G” brand; first to market World class customer base, including: Wal-Mart

Slide 30: Corporate Headquarters and Sales & Marketing Group
Corporate Headquarters Sales & Marketing Group: 10 Bank Street Suite 680 1136 Celebration Blvd. White Plains, NY 10606 Celebration, FL 34747
Source: SEC EDGAR · 8-K/A filed Oct 5, 2011