Middlefield Banc — Investor Presentation (August 2014)
18 slides from Middlefield Banc's investor presentation, Aug 26, 2014
Slide 1: Middlefield Banc Corp. Investor Presentation August 2014
Exhibit 99.1 Middlefield Thomas August 27, G. 2014 Caldwell Banc Corp. Donald Investor L. Stacy Presentation President August and CEO 2014Treasurer and CFO
Slide 2: Forward-Looking Statements
Forward This Banc and significant Securities Middlefield the Corp. 2 “Investor are presentation Corp.’s assumes subject Looking and risks Banc Relations” plans, Exchange no toand contains known Corp.’s Statements obligation strategies, uncertainties page. Commission and periodic forward-looking toun
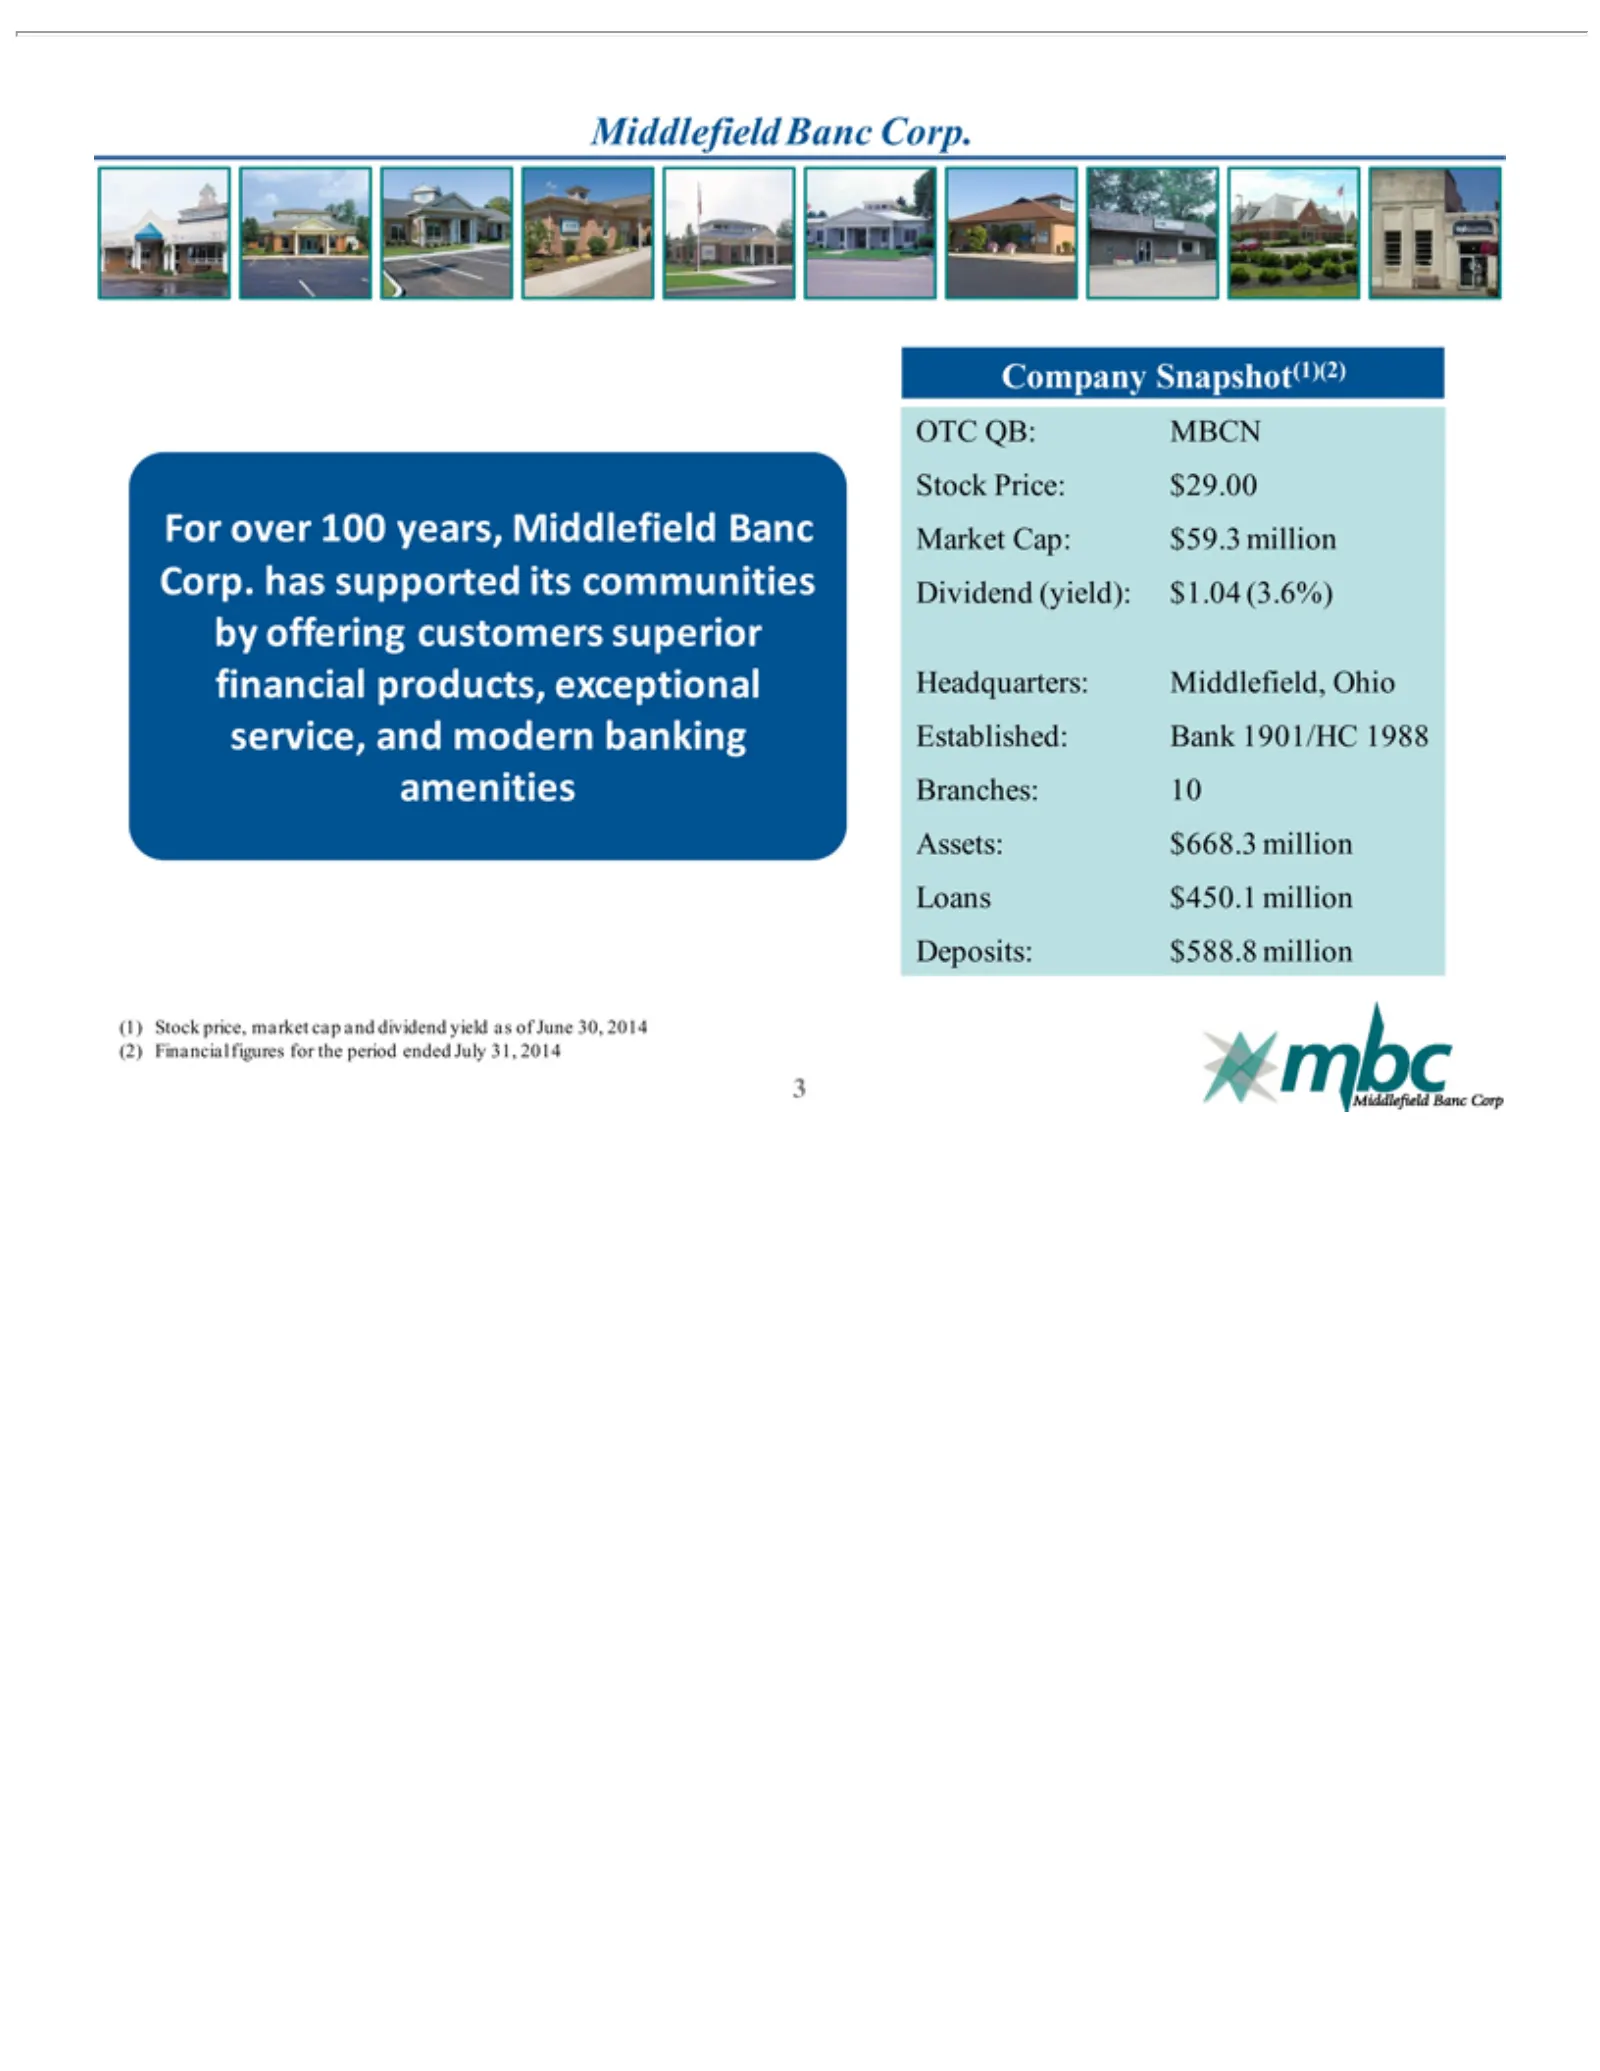
Slide 3: Middlefield Banc Corp. Company Snapshot
Middlefield For (1) (2) OTC Stock Market Dividend Headquarters: Established: Branches: Assets: Loans Deposits: Company 3 Stock Financial over QB: Price: $450.1 Cap: $668.3 100 price, (yield): $588.8 Snapshot(1)(2) MBCN 10Banc $29.00 Bank $59.3 figures years, million Middlefield, million market milli
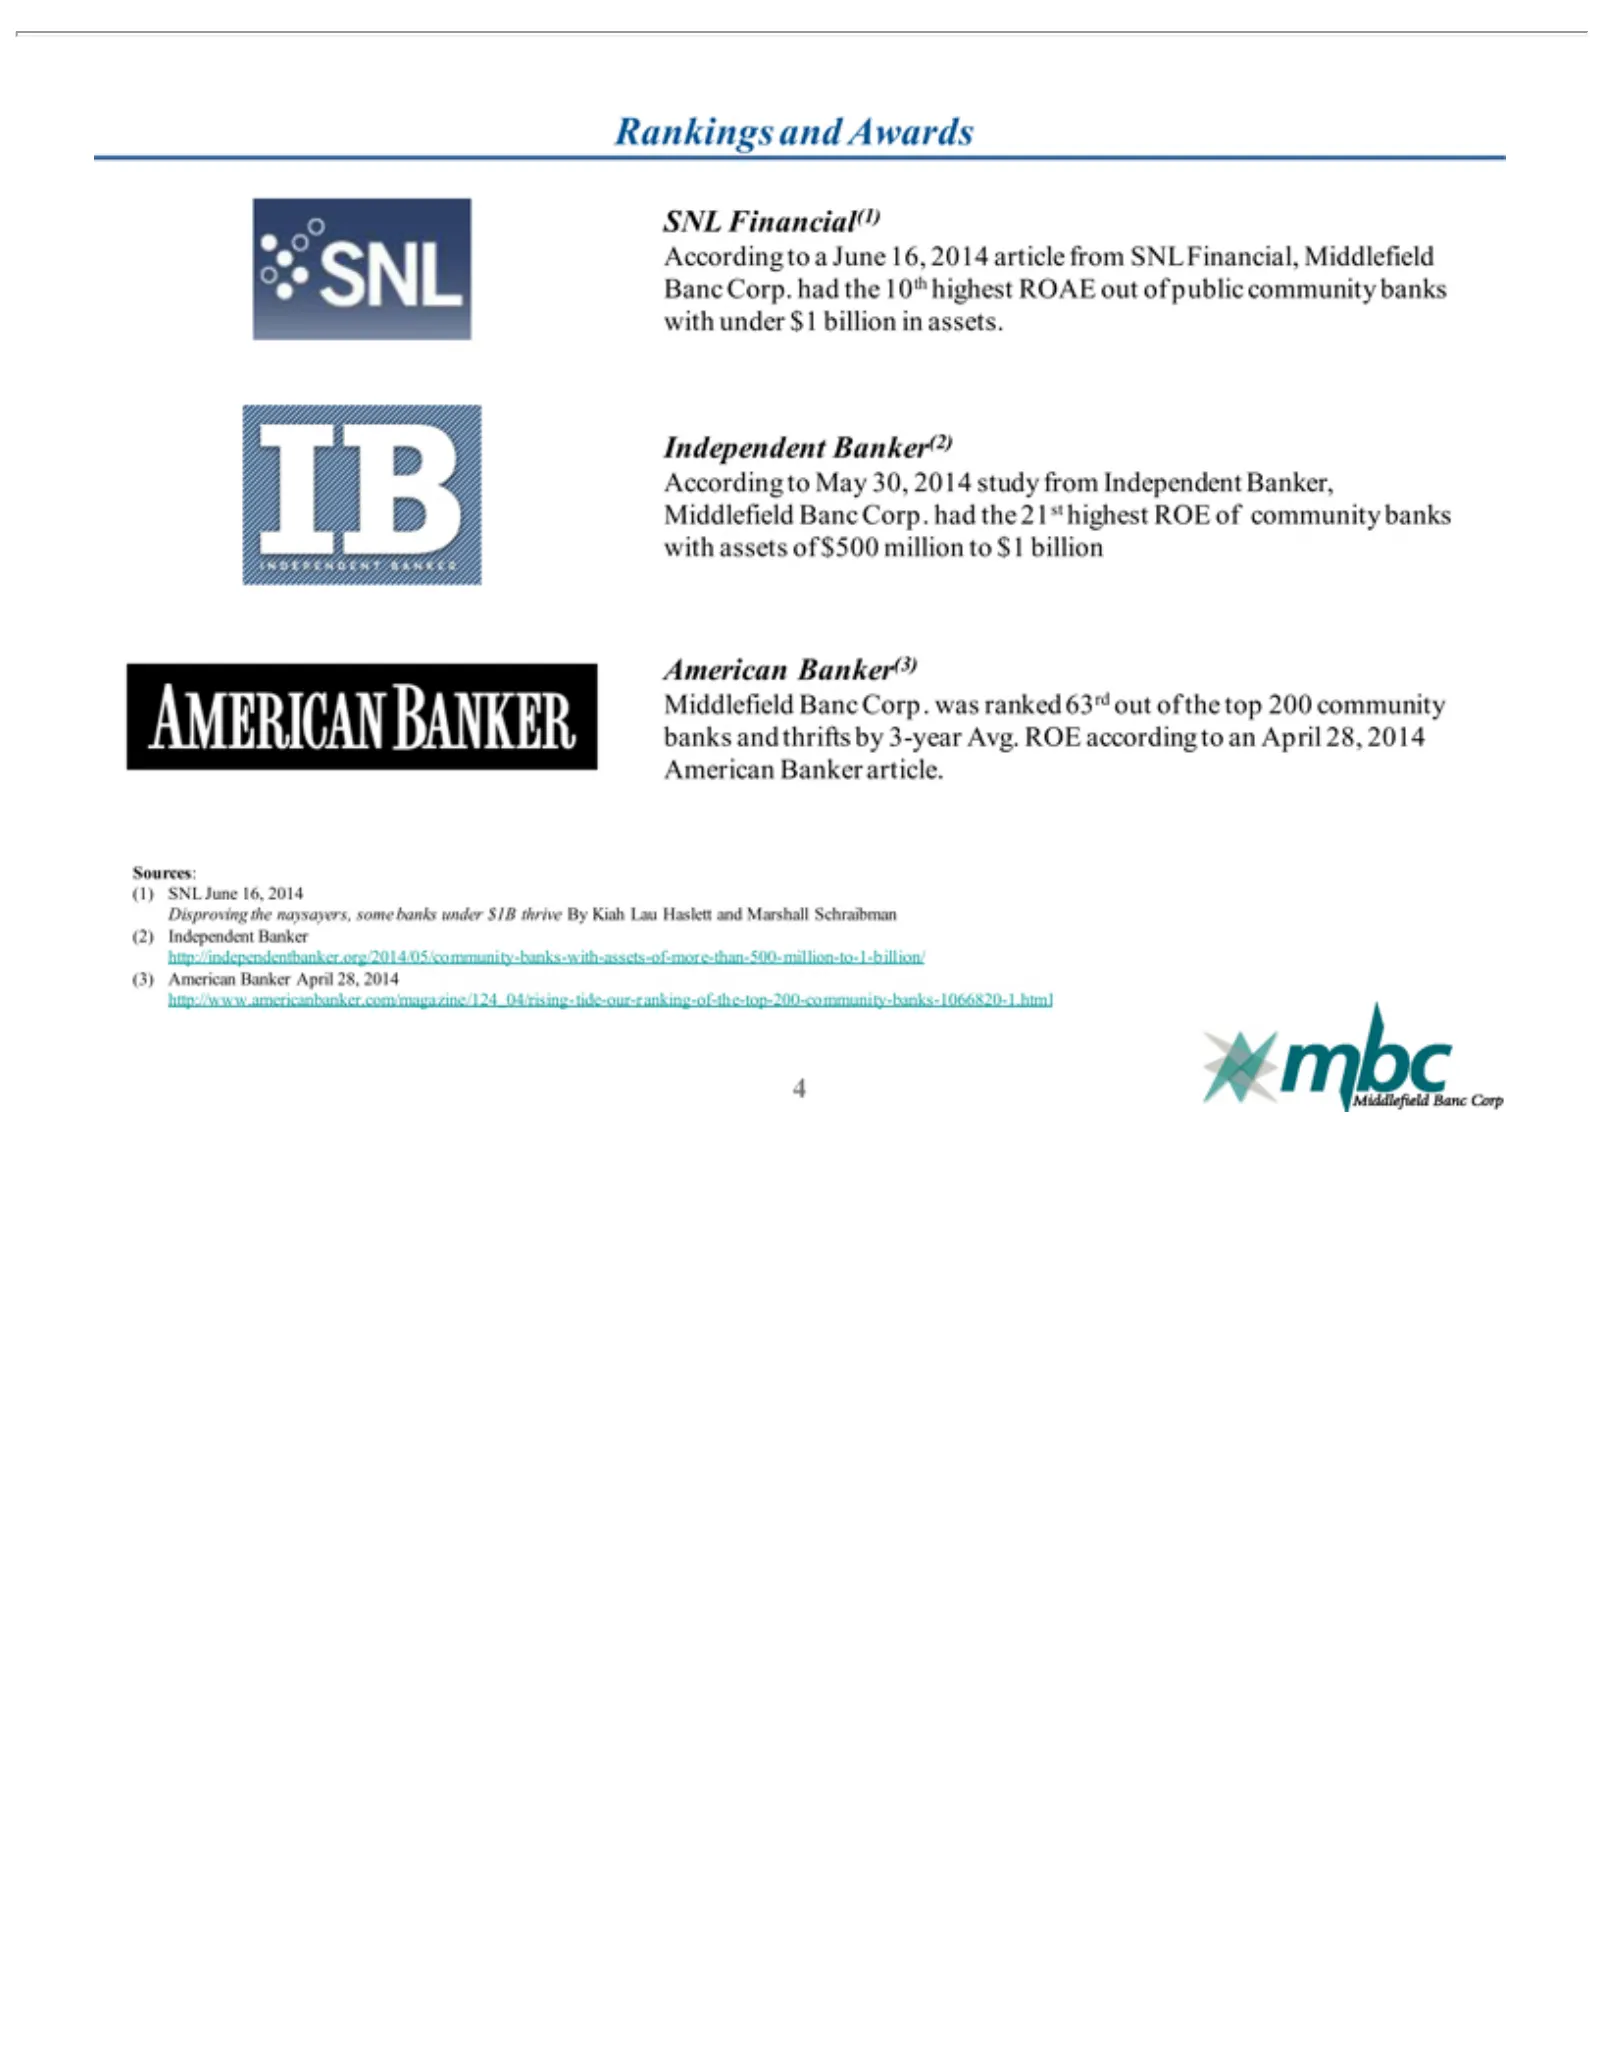
Slide 4: Rankings
Rankings SNL Independent According American Middlefield (1) Sources: Disproving (2) 4 http://www.americanbanker.com/magazine/124_04/rising-tide-our-ranking-of-the-top-200-community-banks-1066820-1.html SNL Independent Financial(1) June and Banker(3) tothe Banc Banker(2) a16, May Awards June naysayer
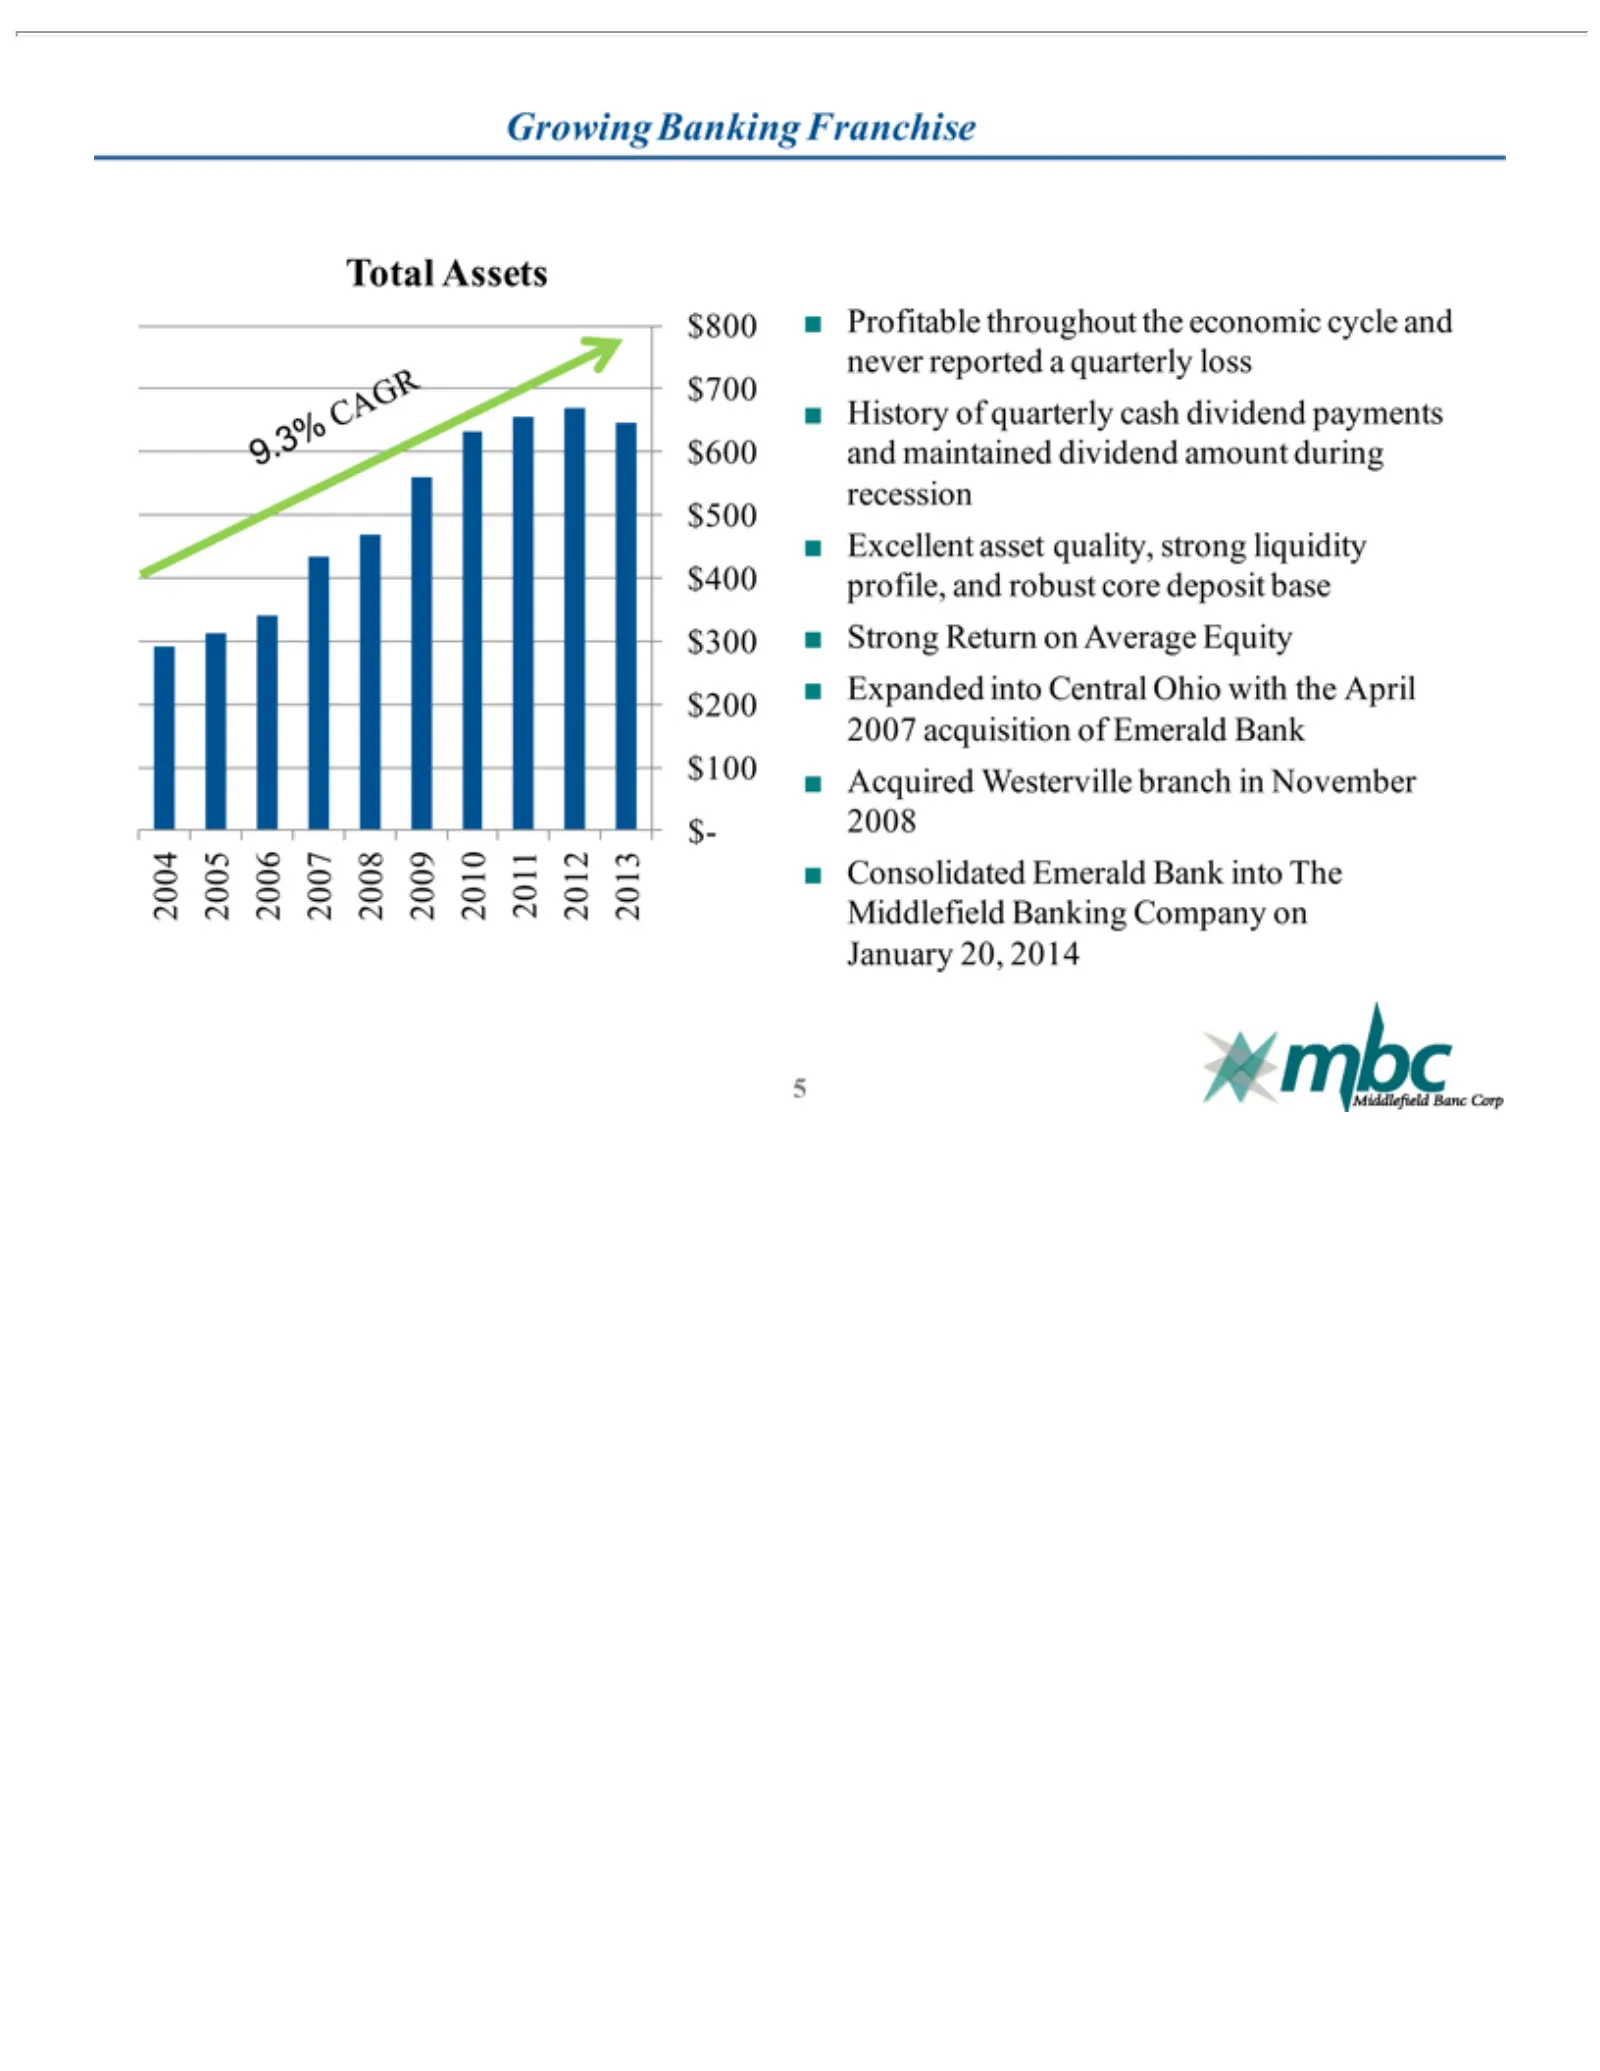
Slide 5: Growing and Profitable Banking Franchise
Growing Total $800 2004 Profitable strong November 9.3% 5 Assets $700 2005 CAGR liquidity Banking throughout 2008 $600profile, 2006 Consolidated $500 2007 Franchise the $400 2008 and economic robust $300 2009 Emerald $200 2010 core cycle $100 2011 Bank deposit and2012 $- into never base The 2013 rep
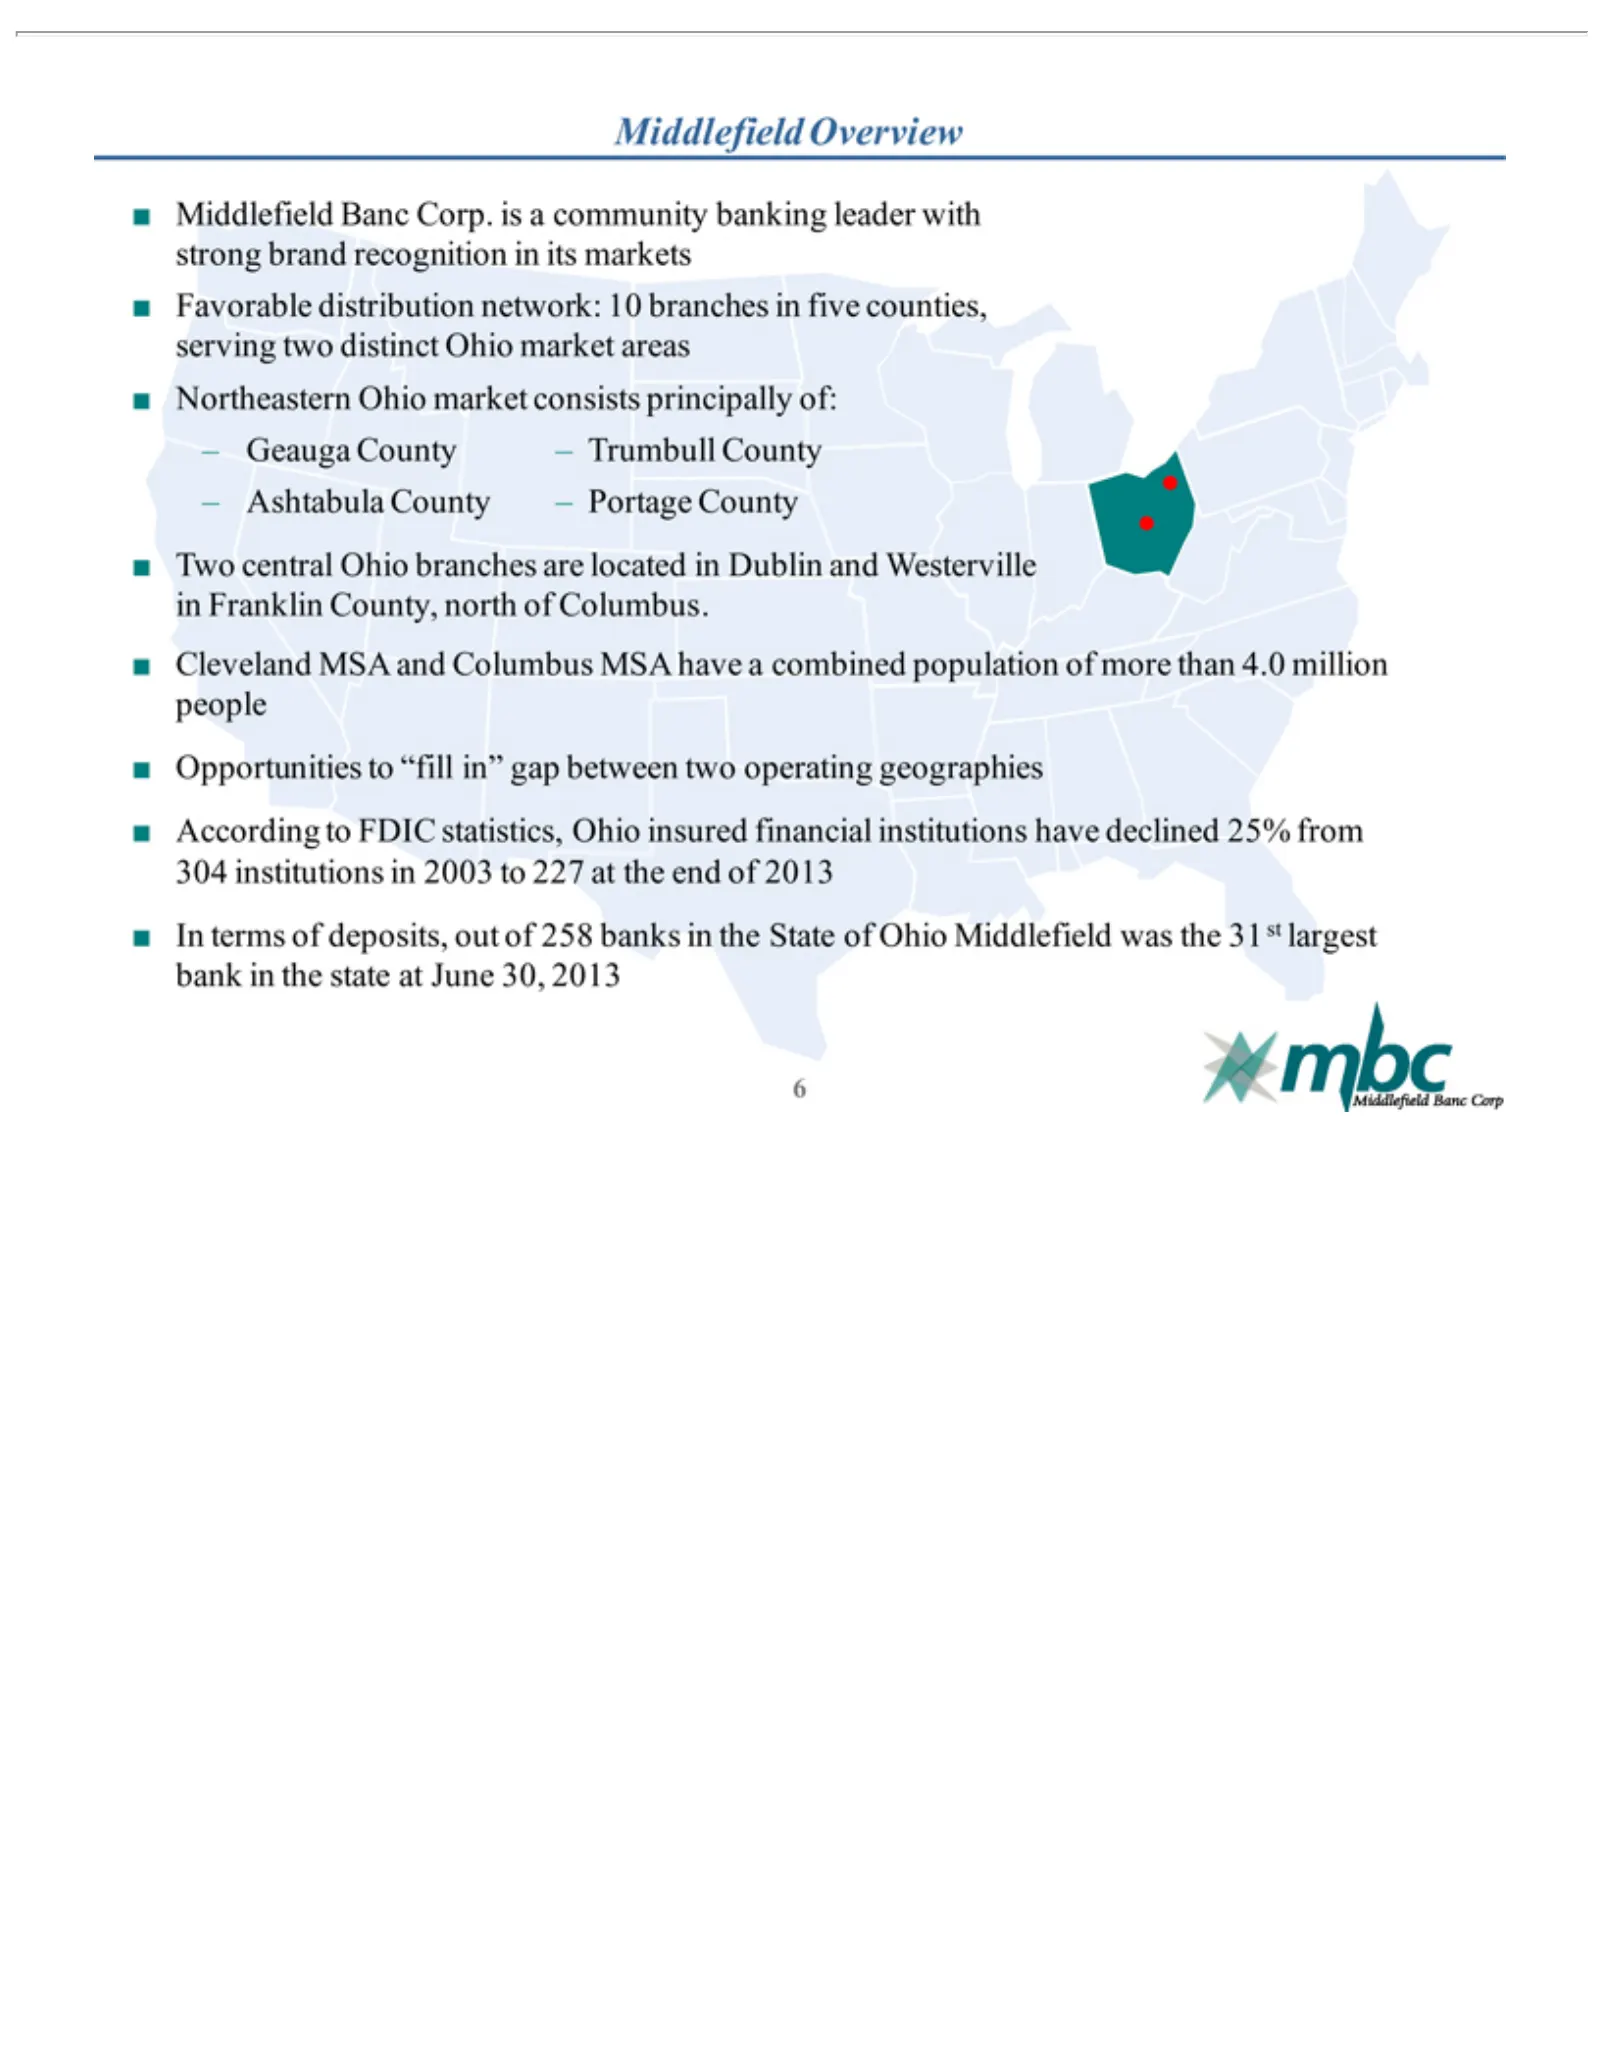
Slide 6: Middlefield Banc Corp. Overview and Favorable Markets
Middlefield Favorable Northeastern Geauga Ashtabula Two Cleveland Opportunities According In 6 terms central County ofdistribution MSA County to deposits, Overview Banc Ohio Ohio FDIC to–and “fill Trumbull branches Corp. –market statistics, Portage Columbus out in” network: isof gap consists a258 ar
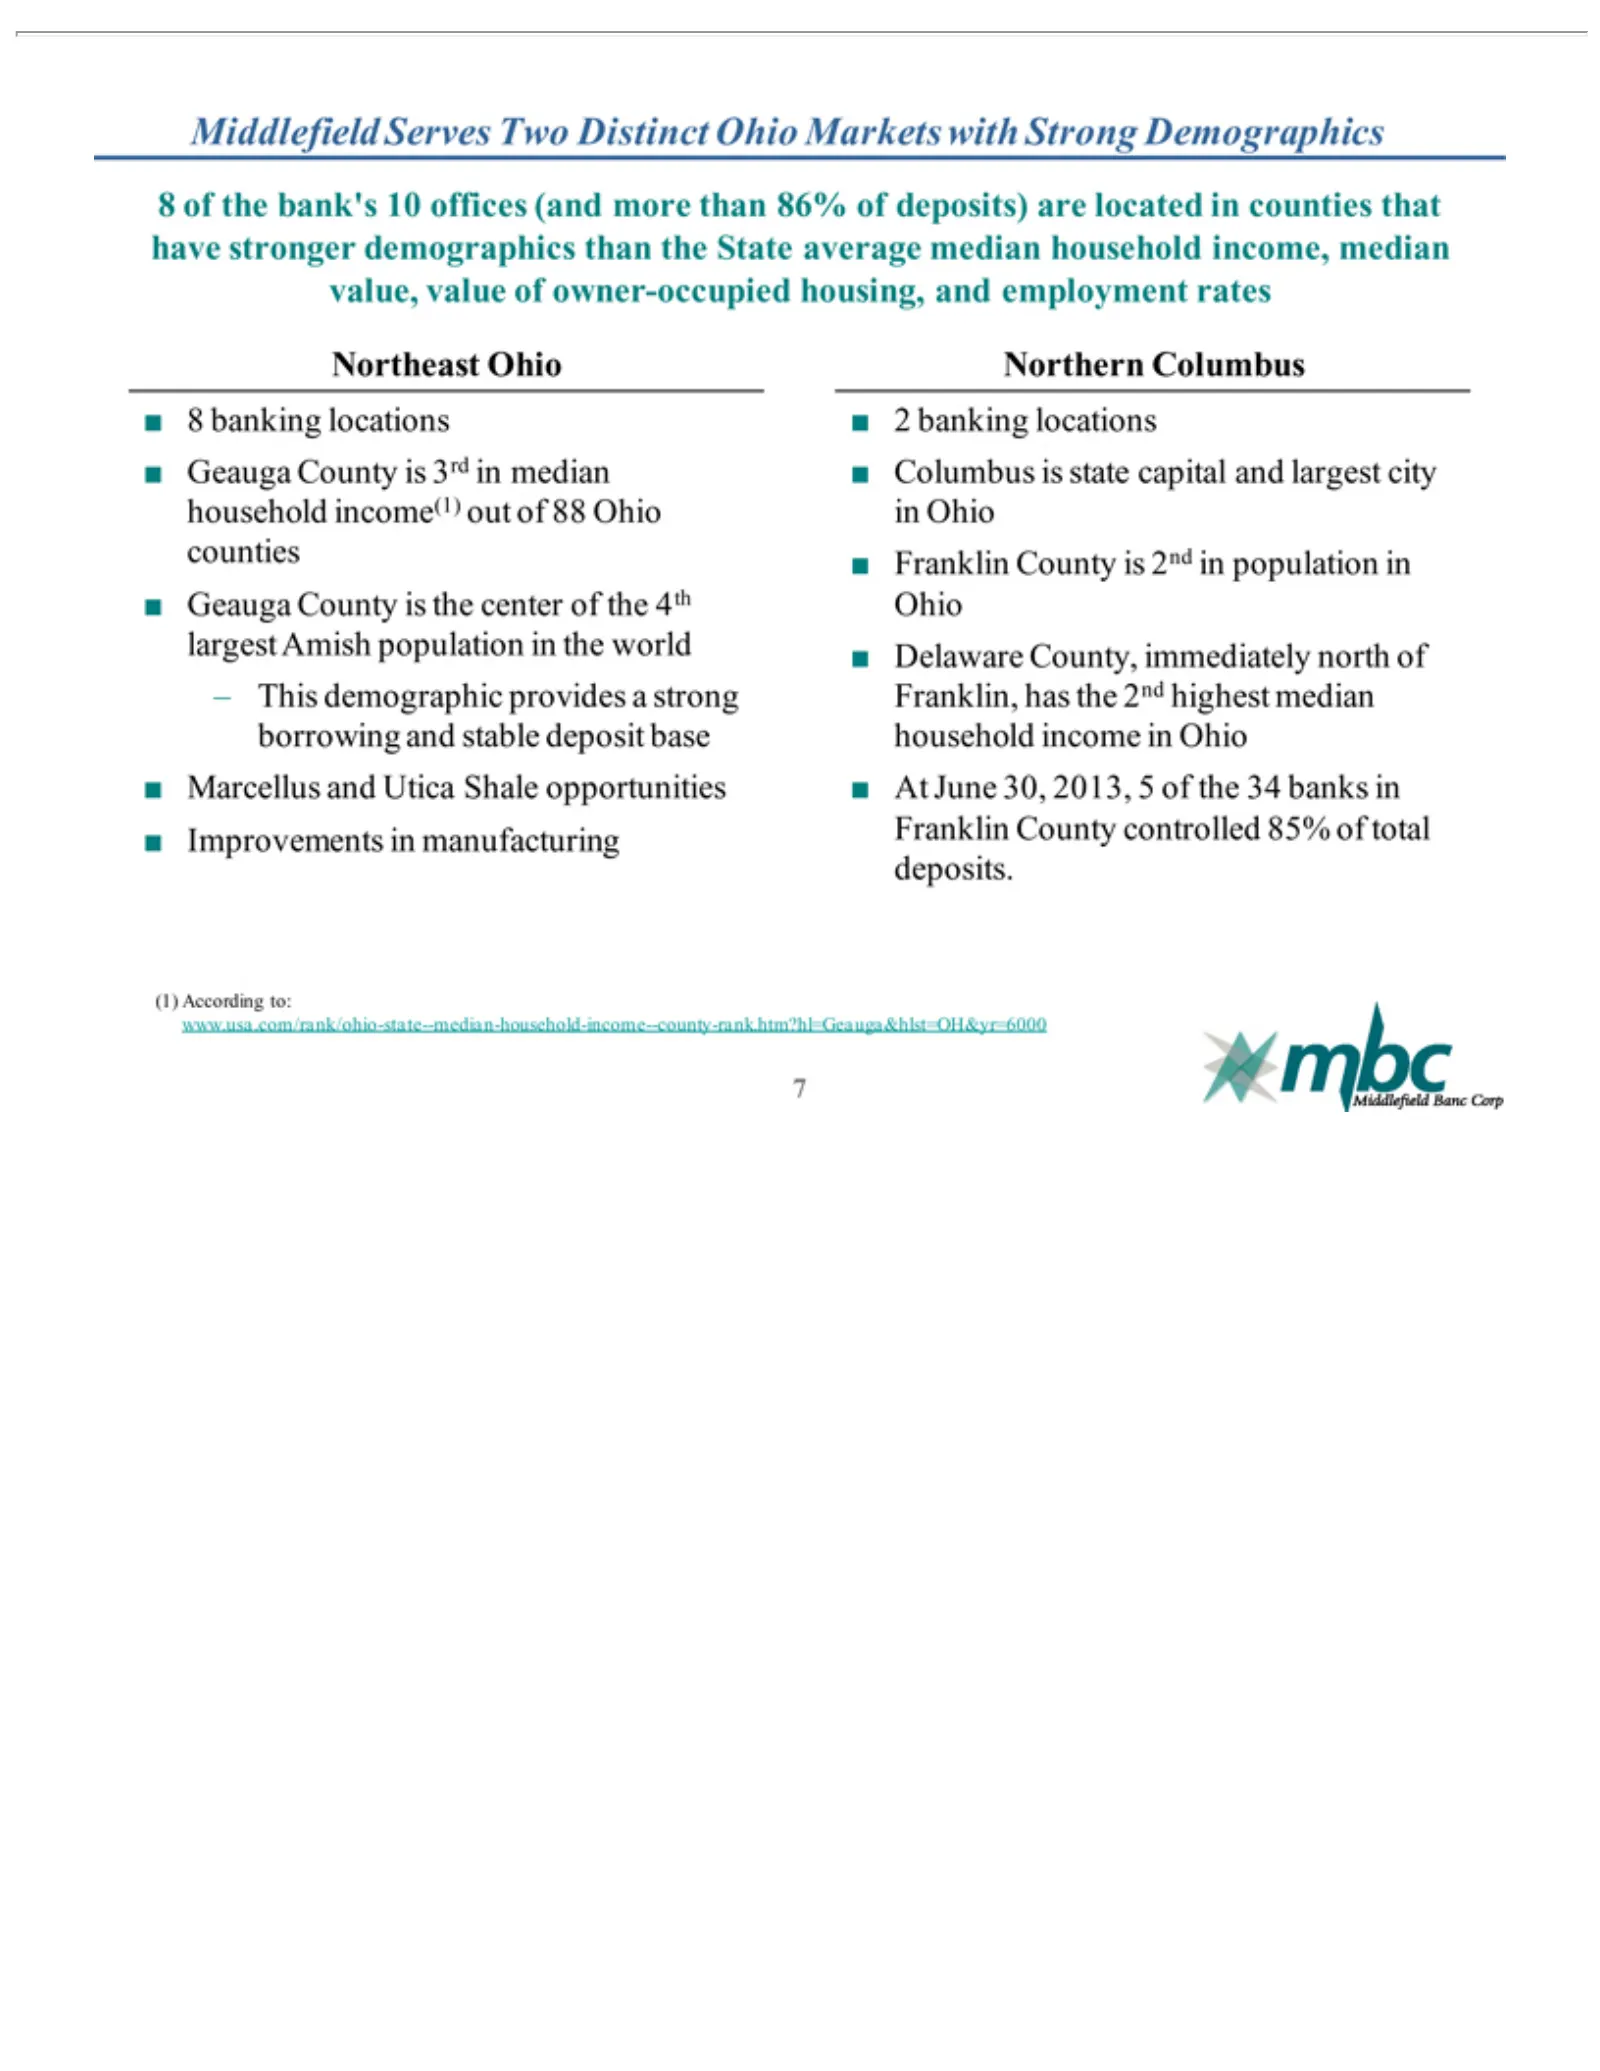
Slide 7: Northeastern and Central Ohio Distinct Markets
Middlefield occupied Northeast 8 Geauga – Marcellus Improvements Northern 2 Columbus Franklin Delaware At (1) 7 lp6 This ofJune banking According thedemographic County bank’s 30, County housing, Columbus County, Ohio locations and is2013, Serves state to: Utica in 10 isismanufacturing www.usa 5capit
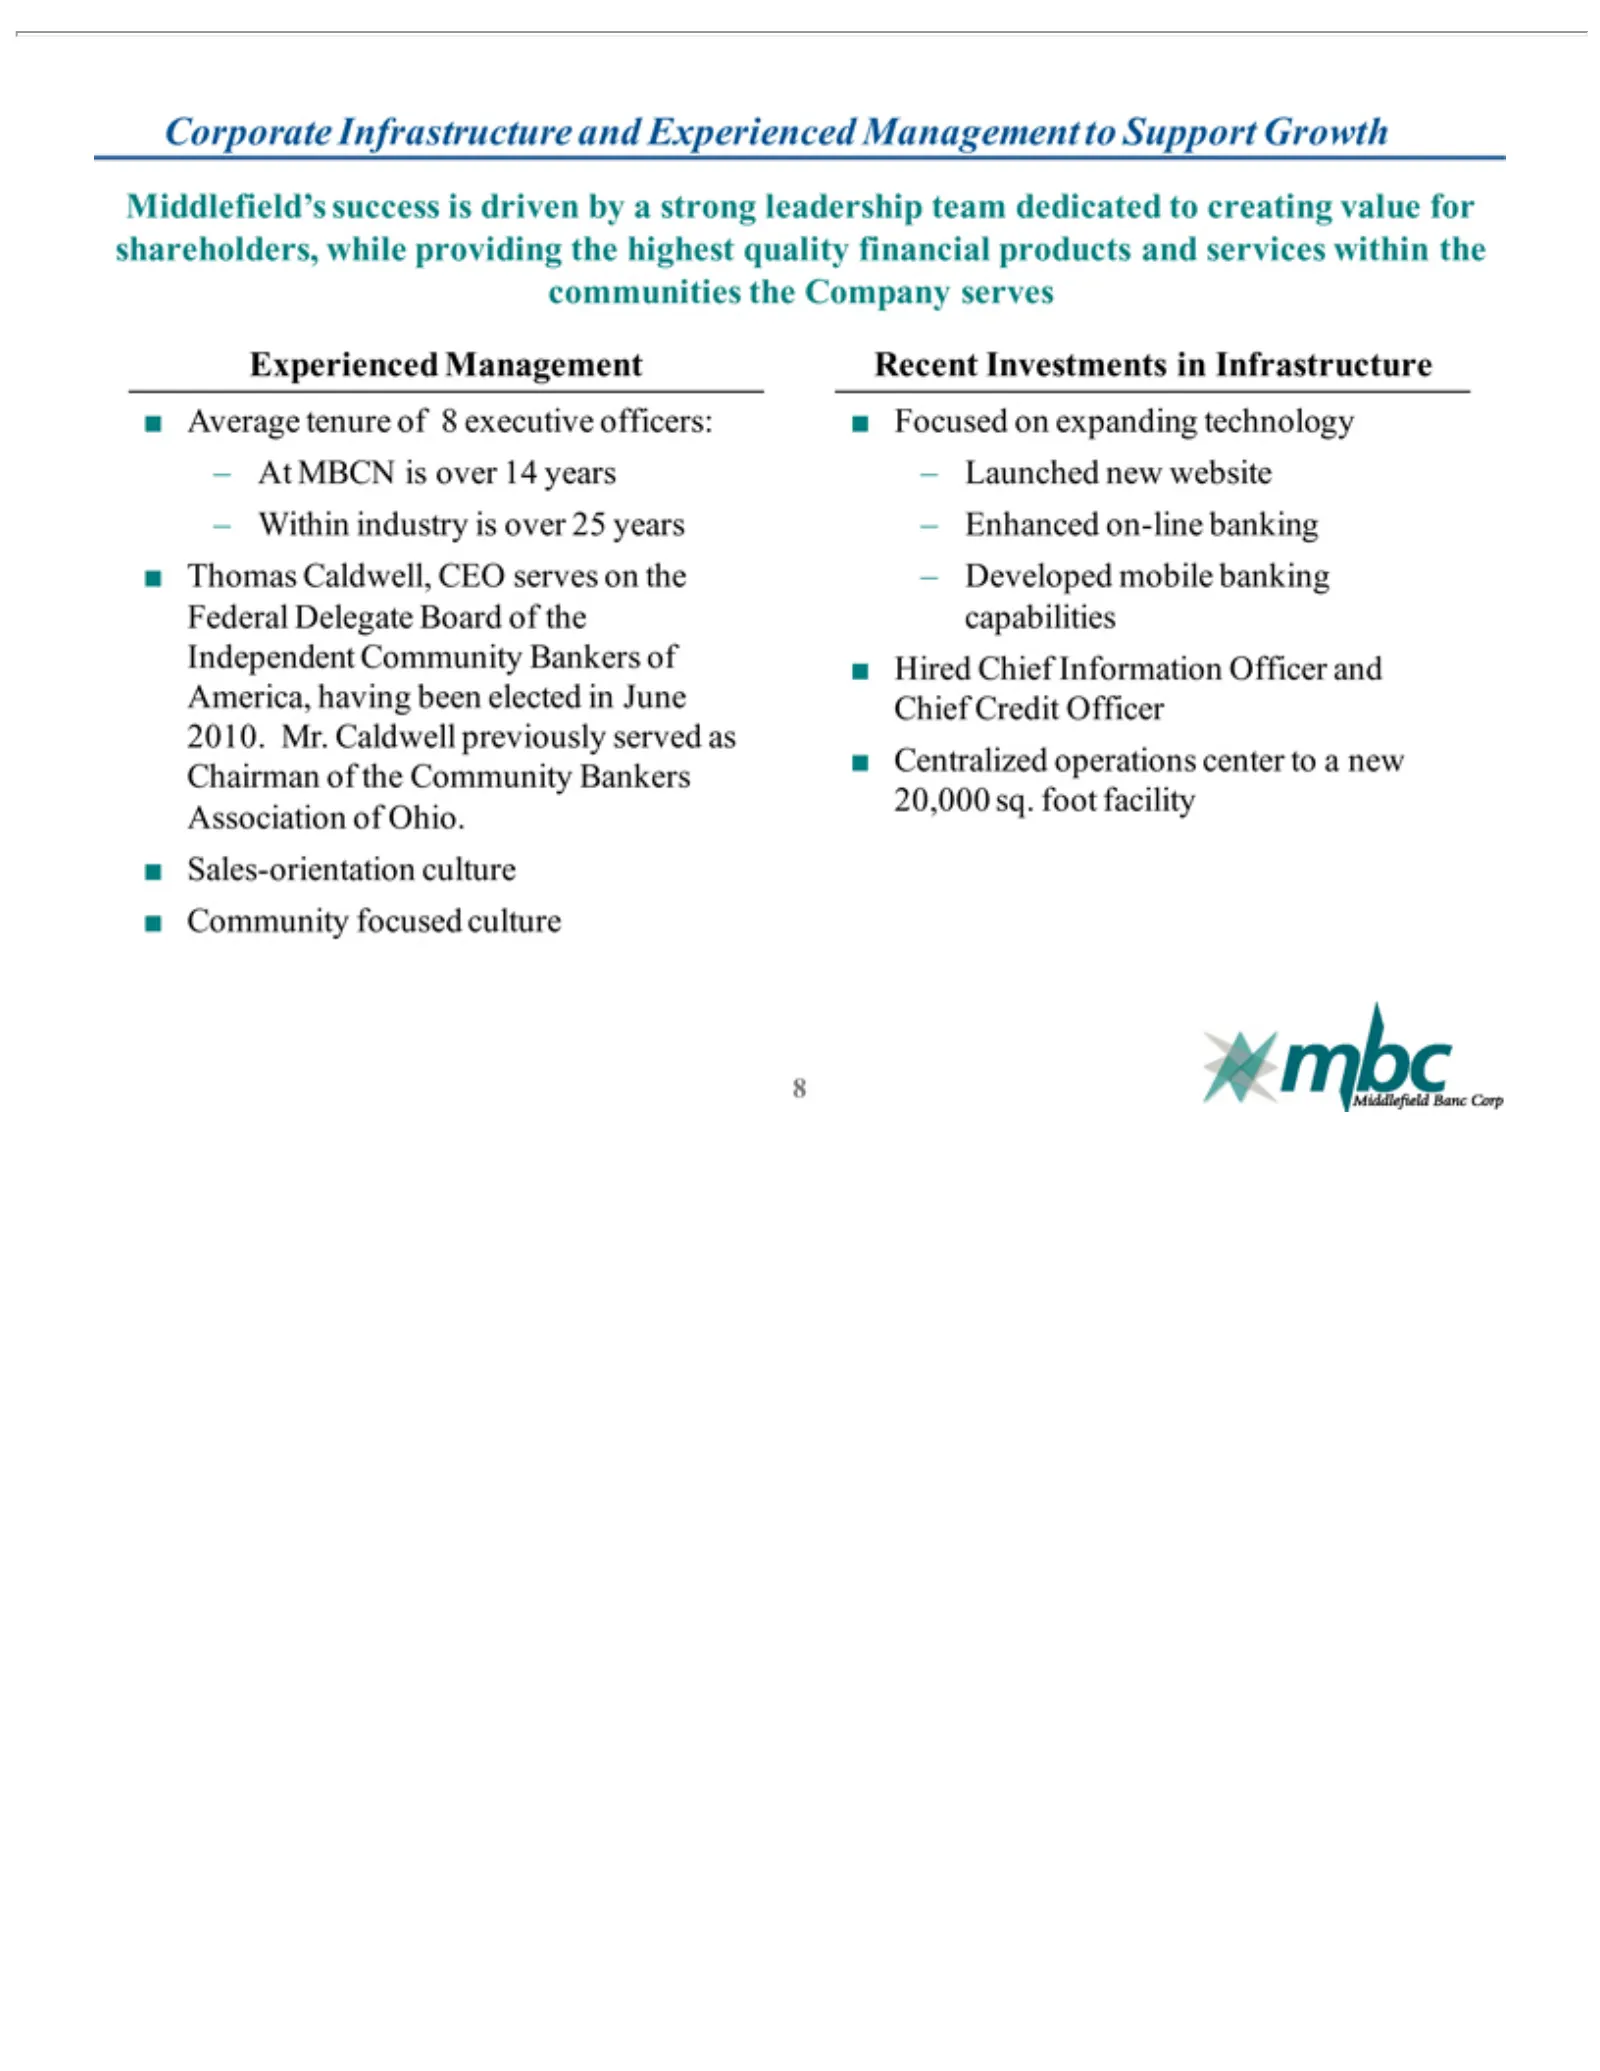
Slide 8: Middlefield's Corporate Culture and Experienced Management
Corporate Middlefield’s Company Experienced Average – Thomas the Sales-orientation Community Recent Focused Launched Enhanced Developed Hired Centralized 8 At Within Community MBCN Chief Investments Caldwell, tenure on industry serves new on-line Infrastructure mobile expanding operations Informatio
Slide 9: Customers: Personal and Focused
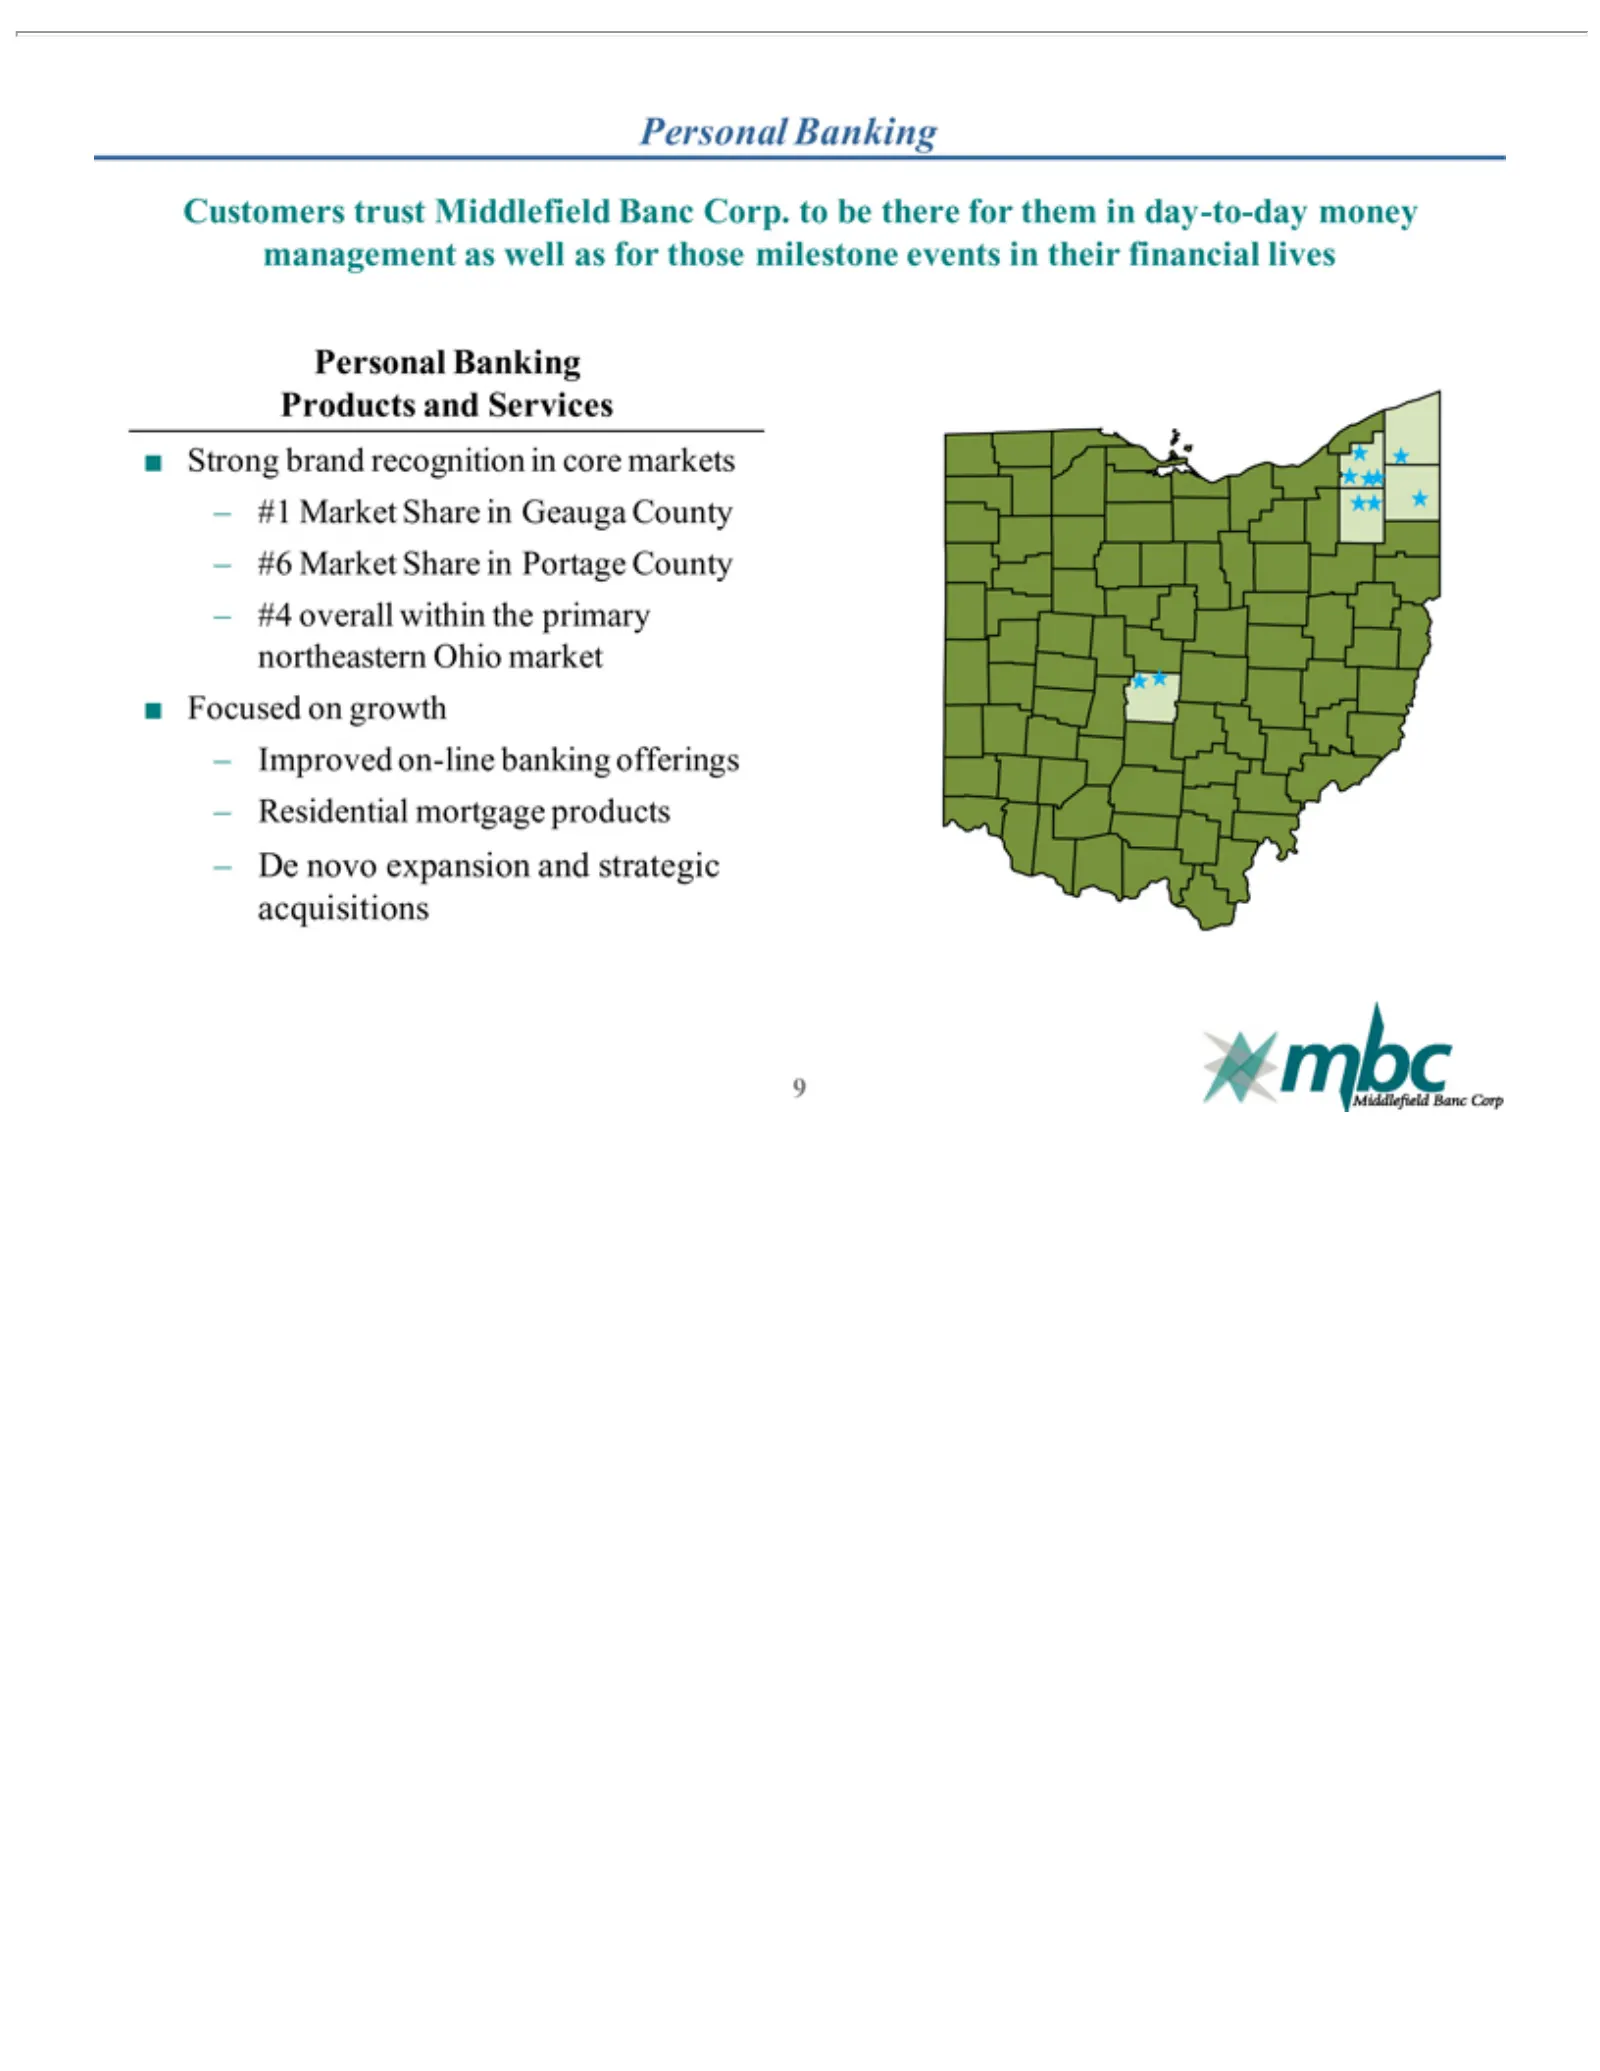
Customers ?Personal Focused – 9 Strong #1 overall #6 #4 Improved Residential De Market novo on brand Banking expansion trust growth on-line within Share mortgage recognition Middlefield Products in the banking Geauga Portage and primary products strategic in and offerings Banc core County northeaste
Slide 10: Strong Northeastern Ohio Market Share Opportunities
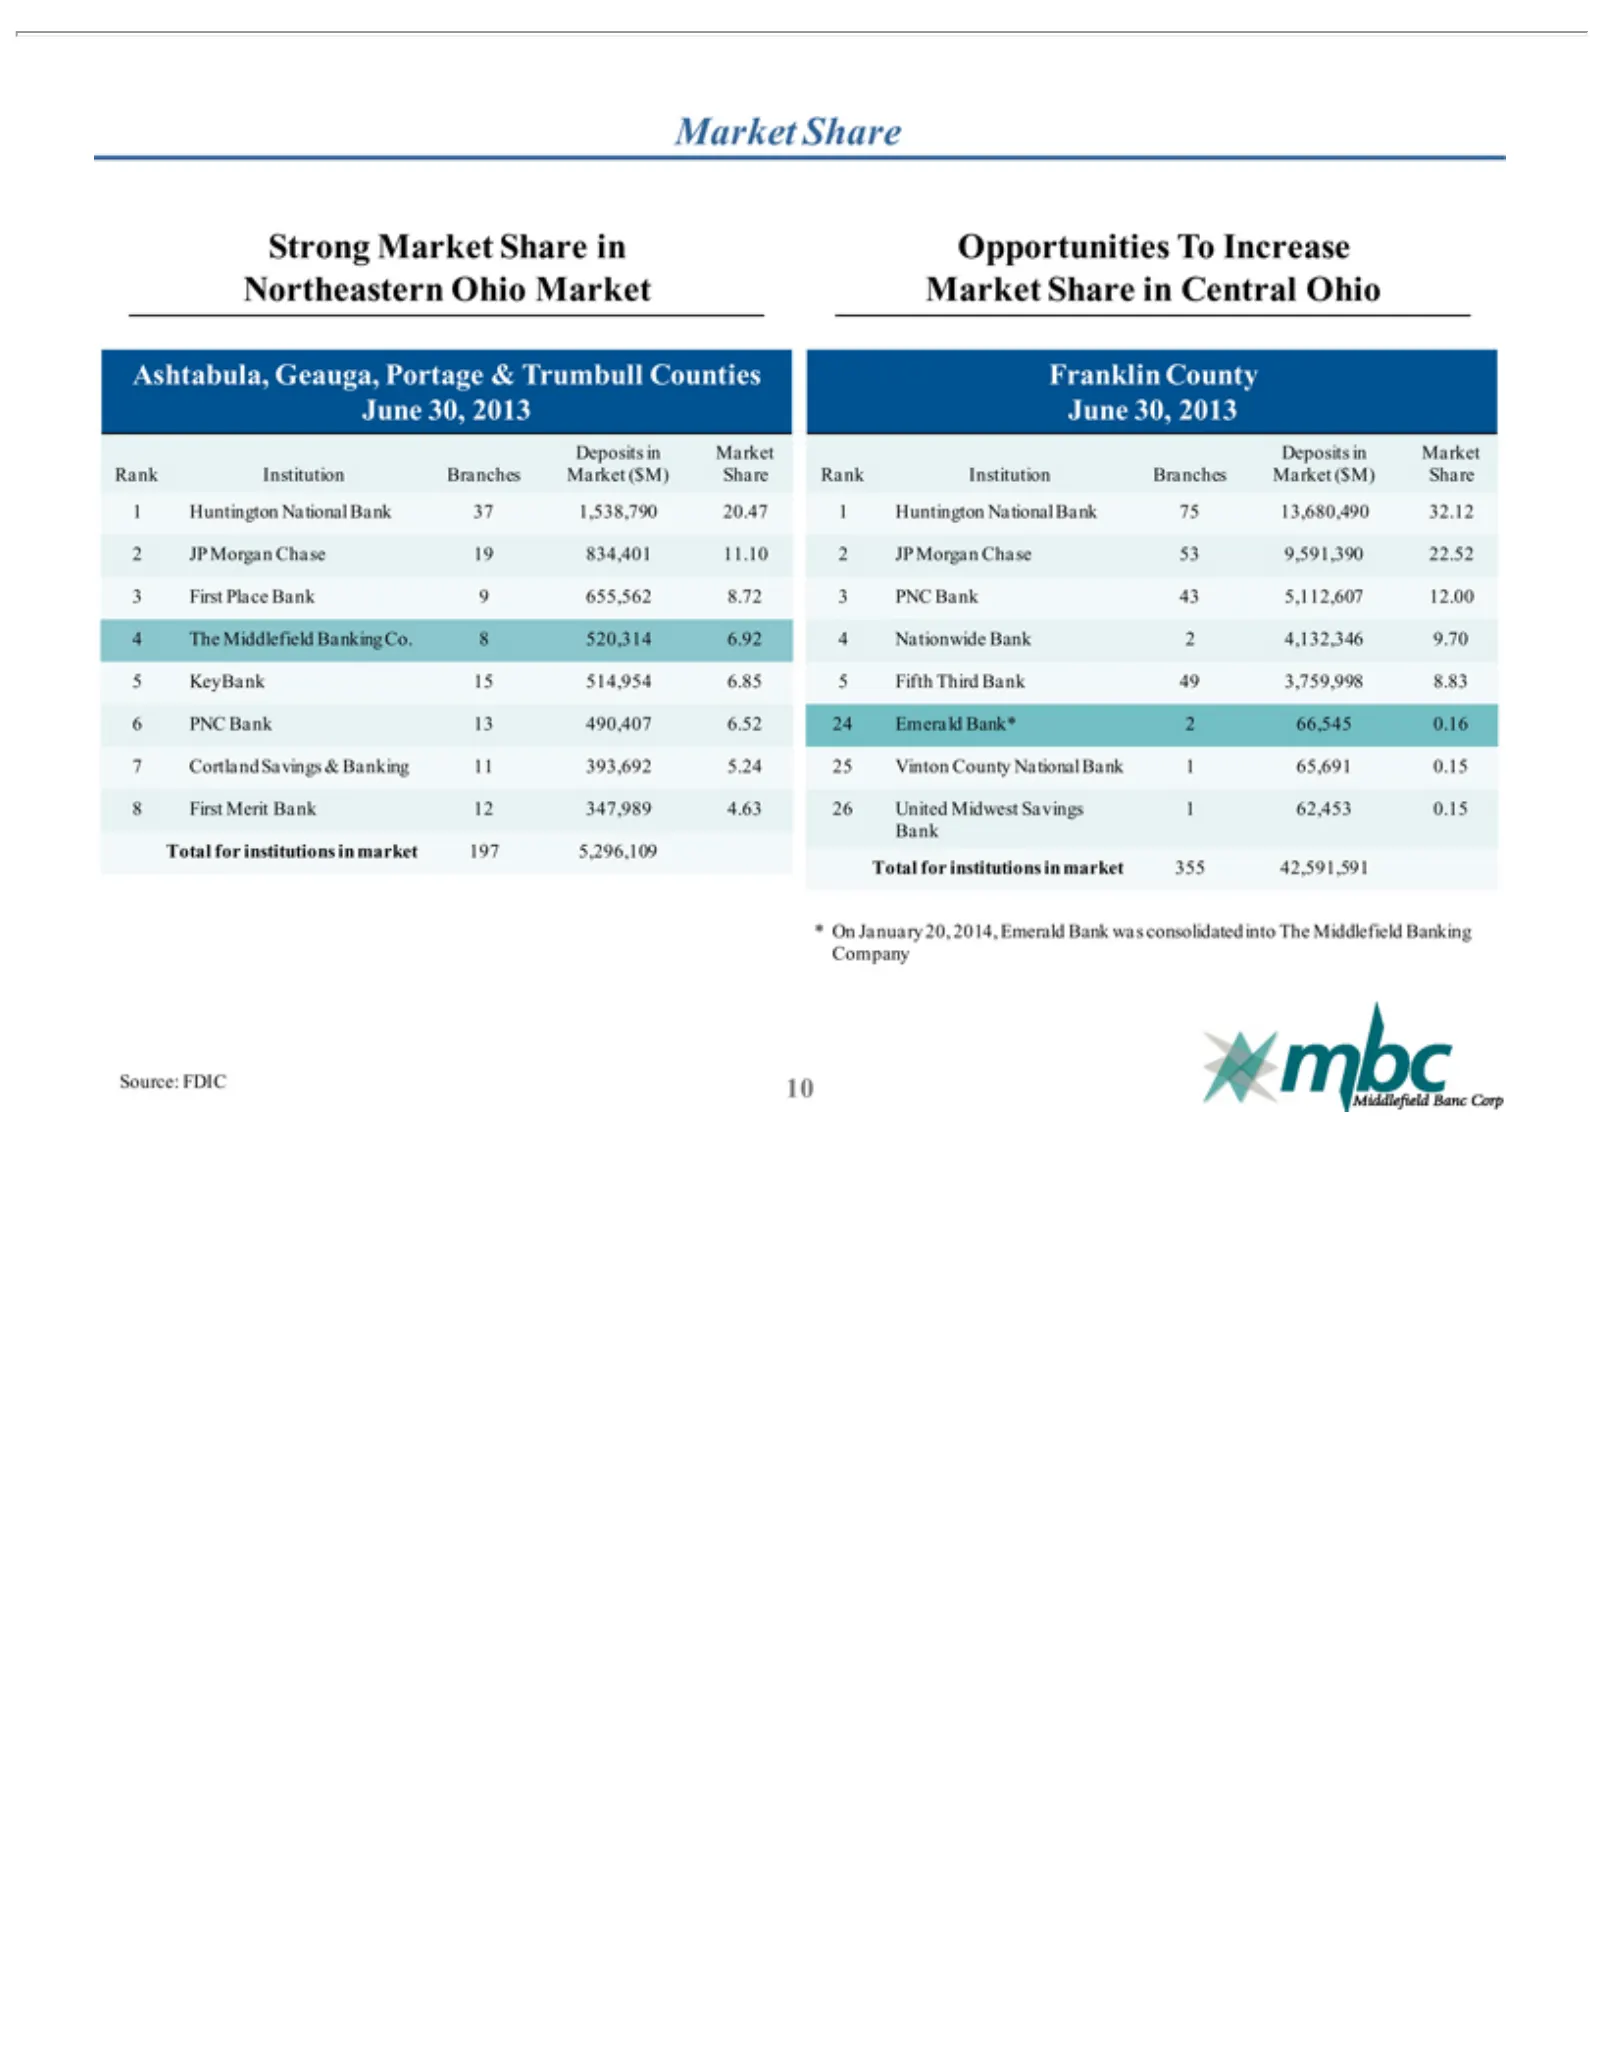
Strong Northeastern Ashtabula, 4 5 6 7 8 Total Opportunities Market Franklin June Deposits Rank 1 2 3 24The 25 26KeyBank Cortland First Huntington JP PNC OnMorgan Total Bank * 30, for Source: 10 Institution Middlefield Place Merit Market Bank Share Nationwide 2013 County institutions inSavings Geaug
Slide 11: Enhanced Commercial Banking Expertise
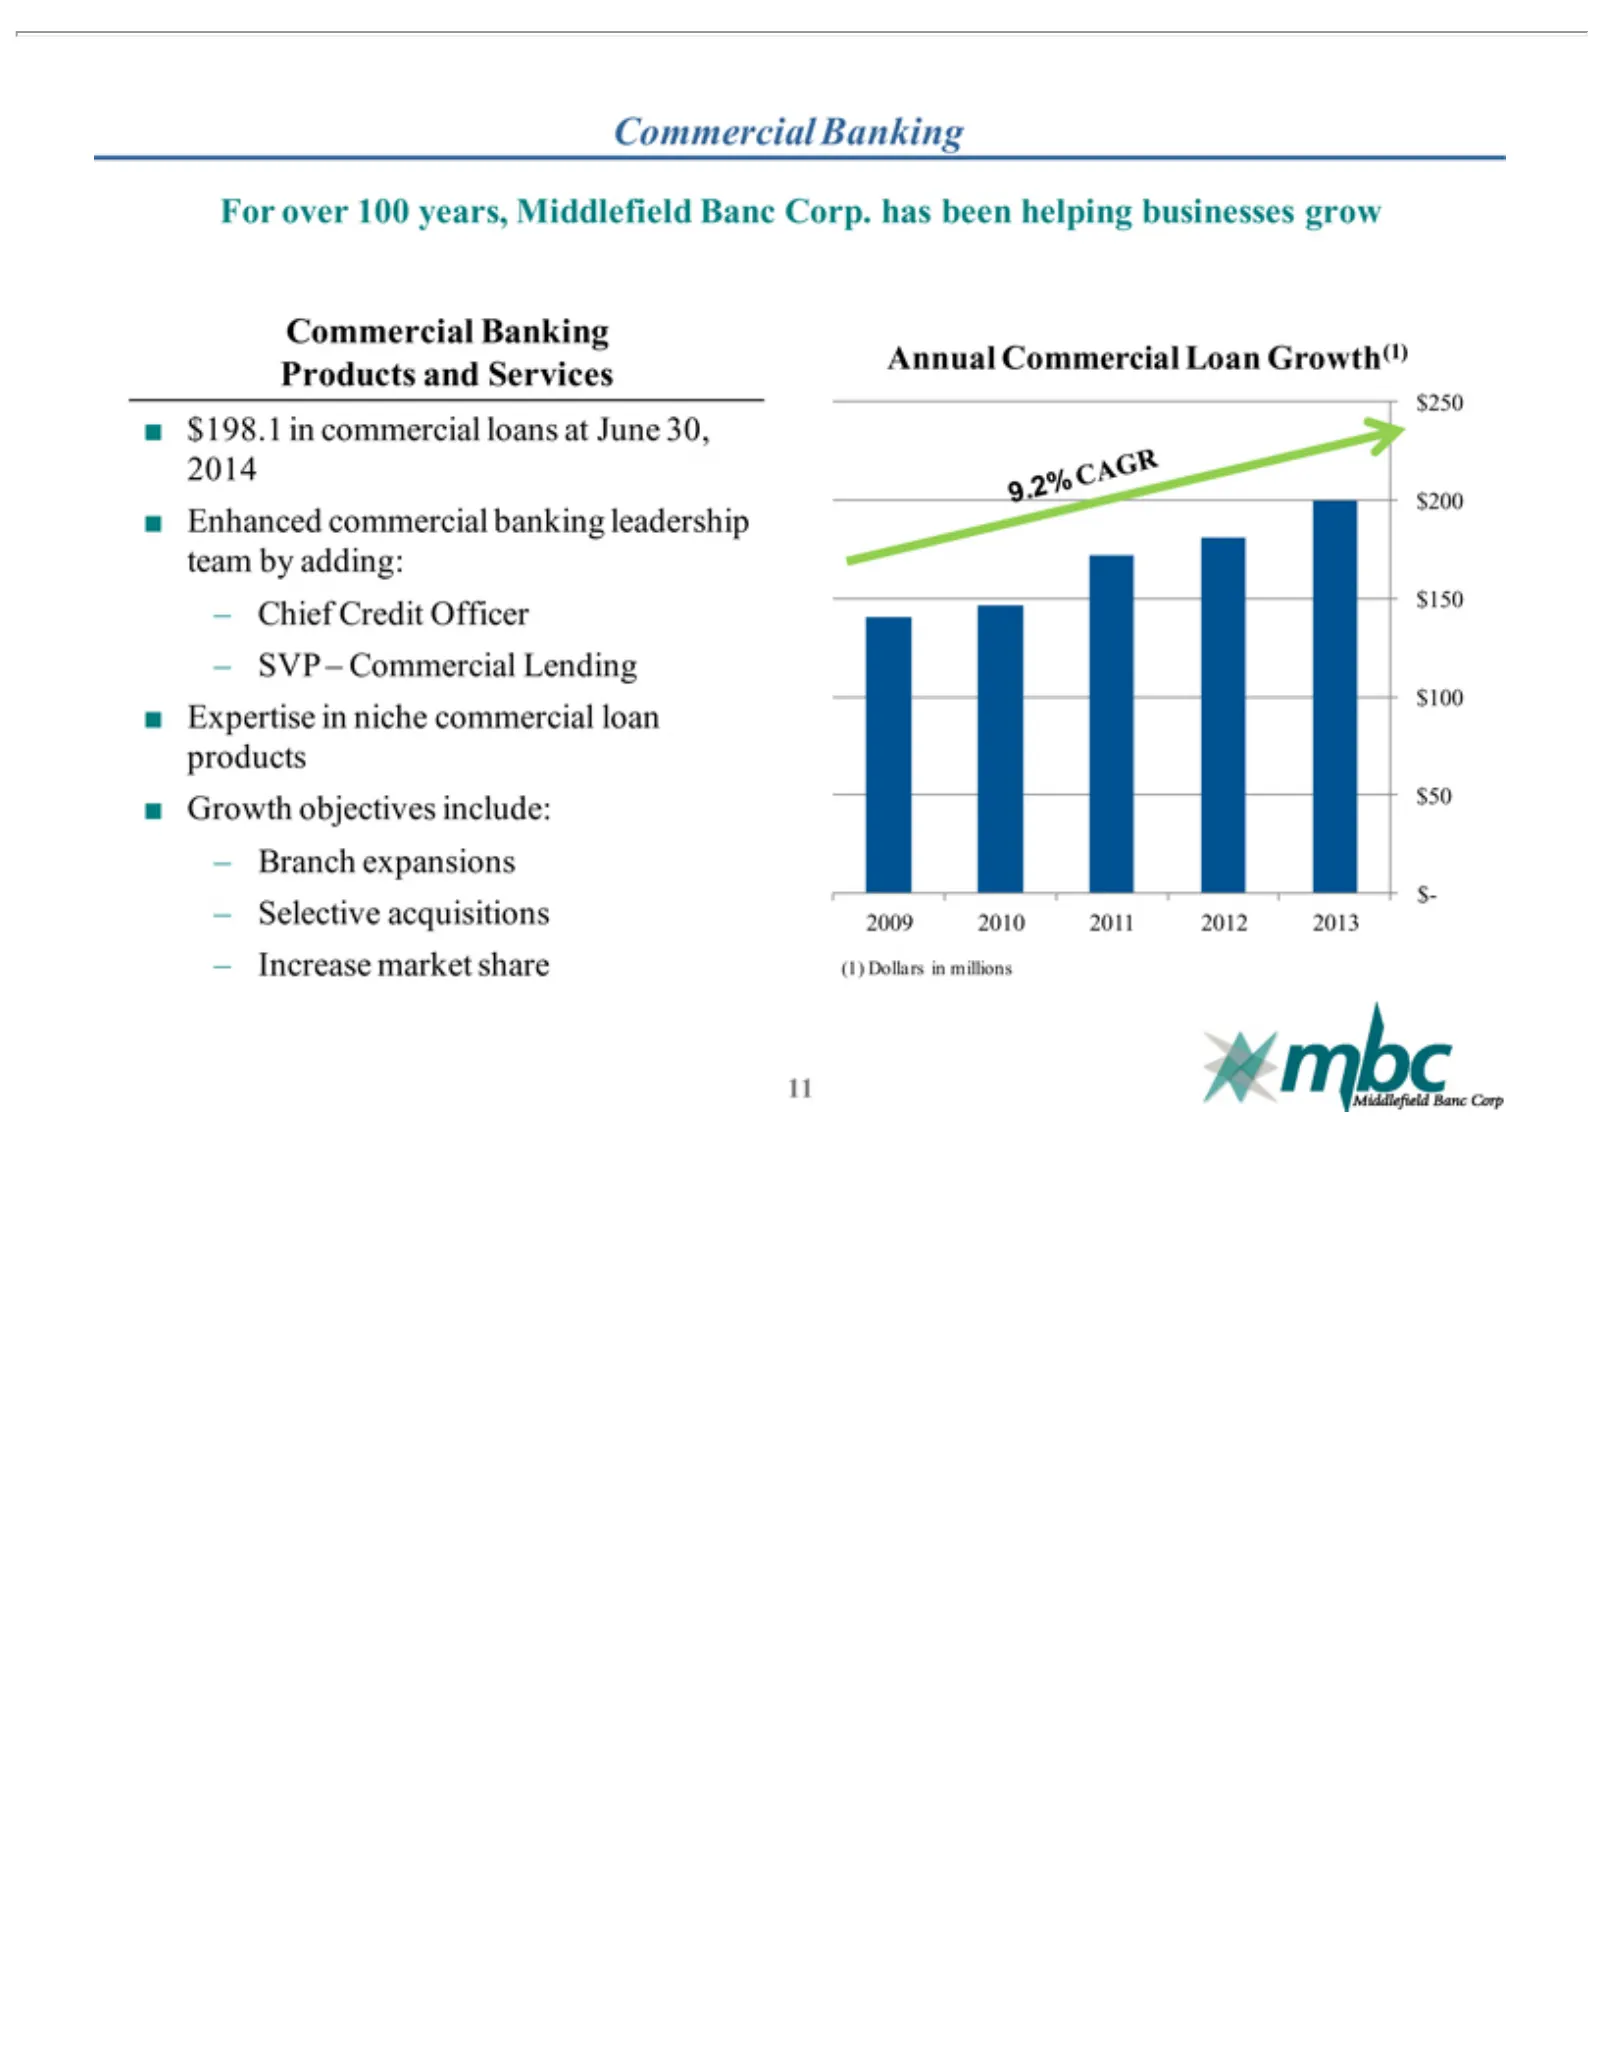
For Commercial $198.1 Enhanced Chief SVP Expertise Growth – Annual $250 2009 (1) 11 9.2%cagr Branch Selective Increase Dollars over –2010 $200 Credit Commercial in Commercial objectives 100 expansions in commercial commercial market $150 2011 in acquisitions niche Banking Officer years, millions 201
Slide 12: Annual ROAA and ROAE History
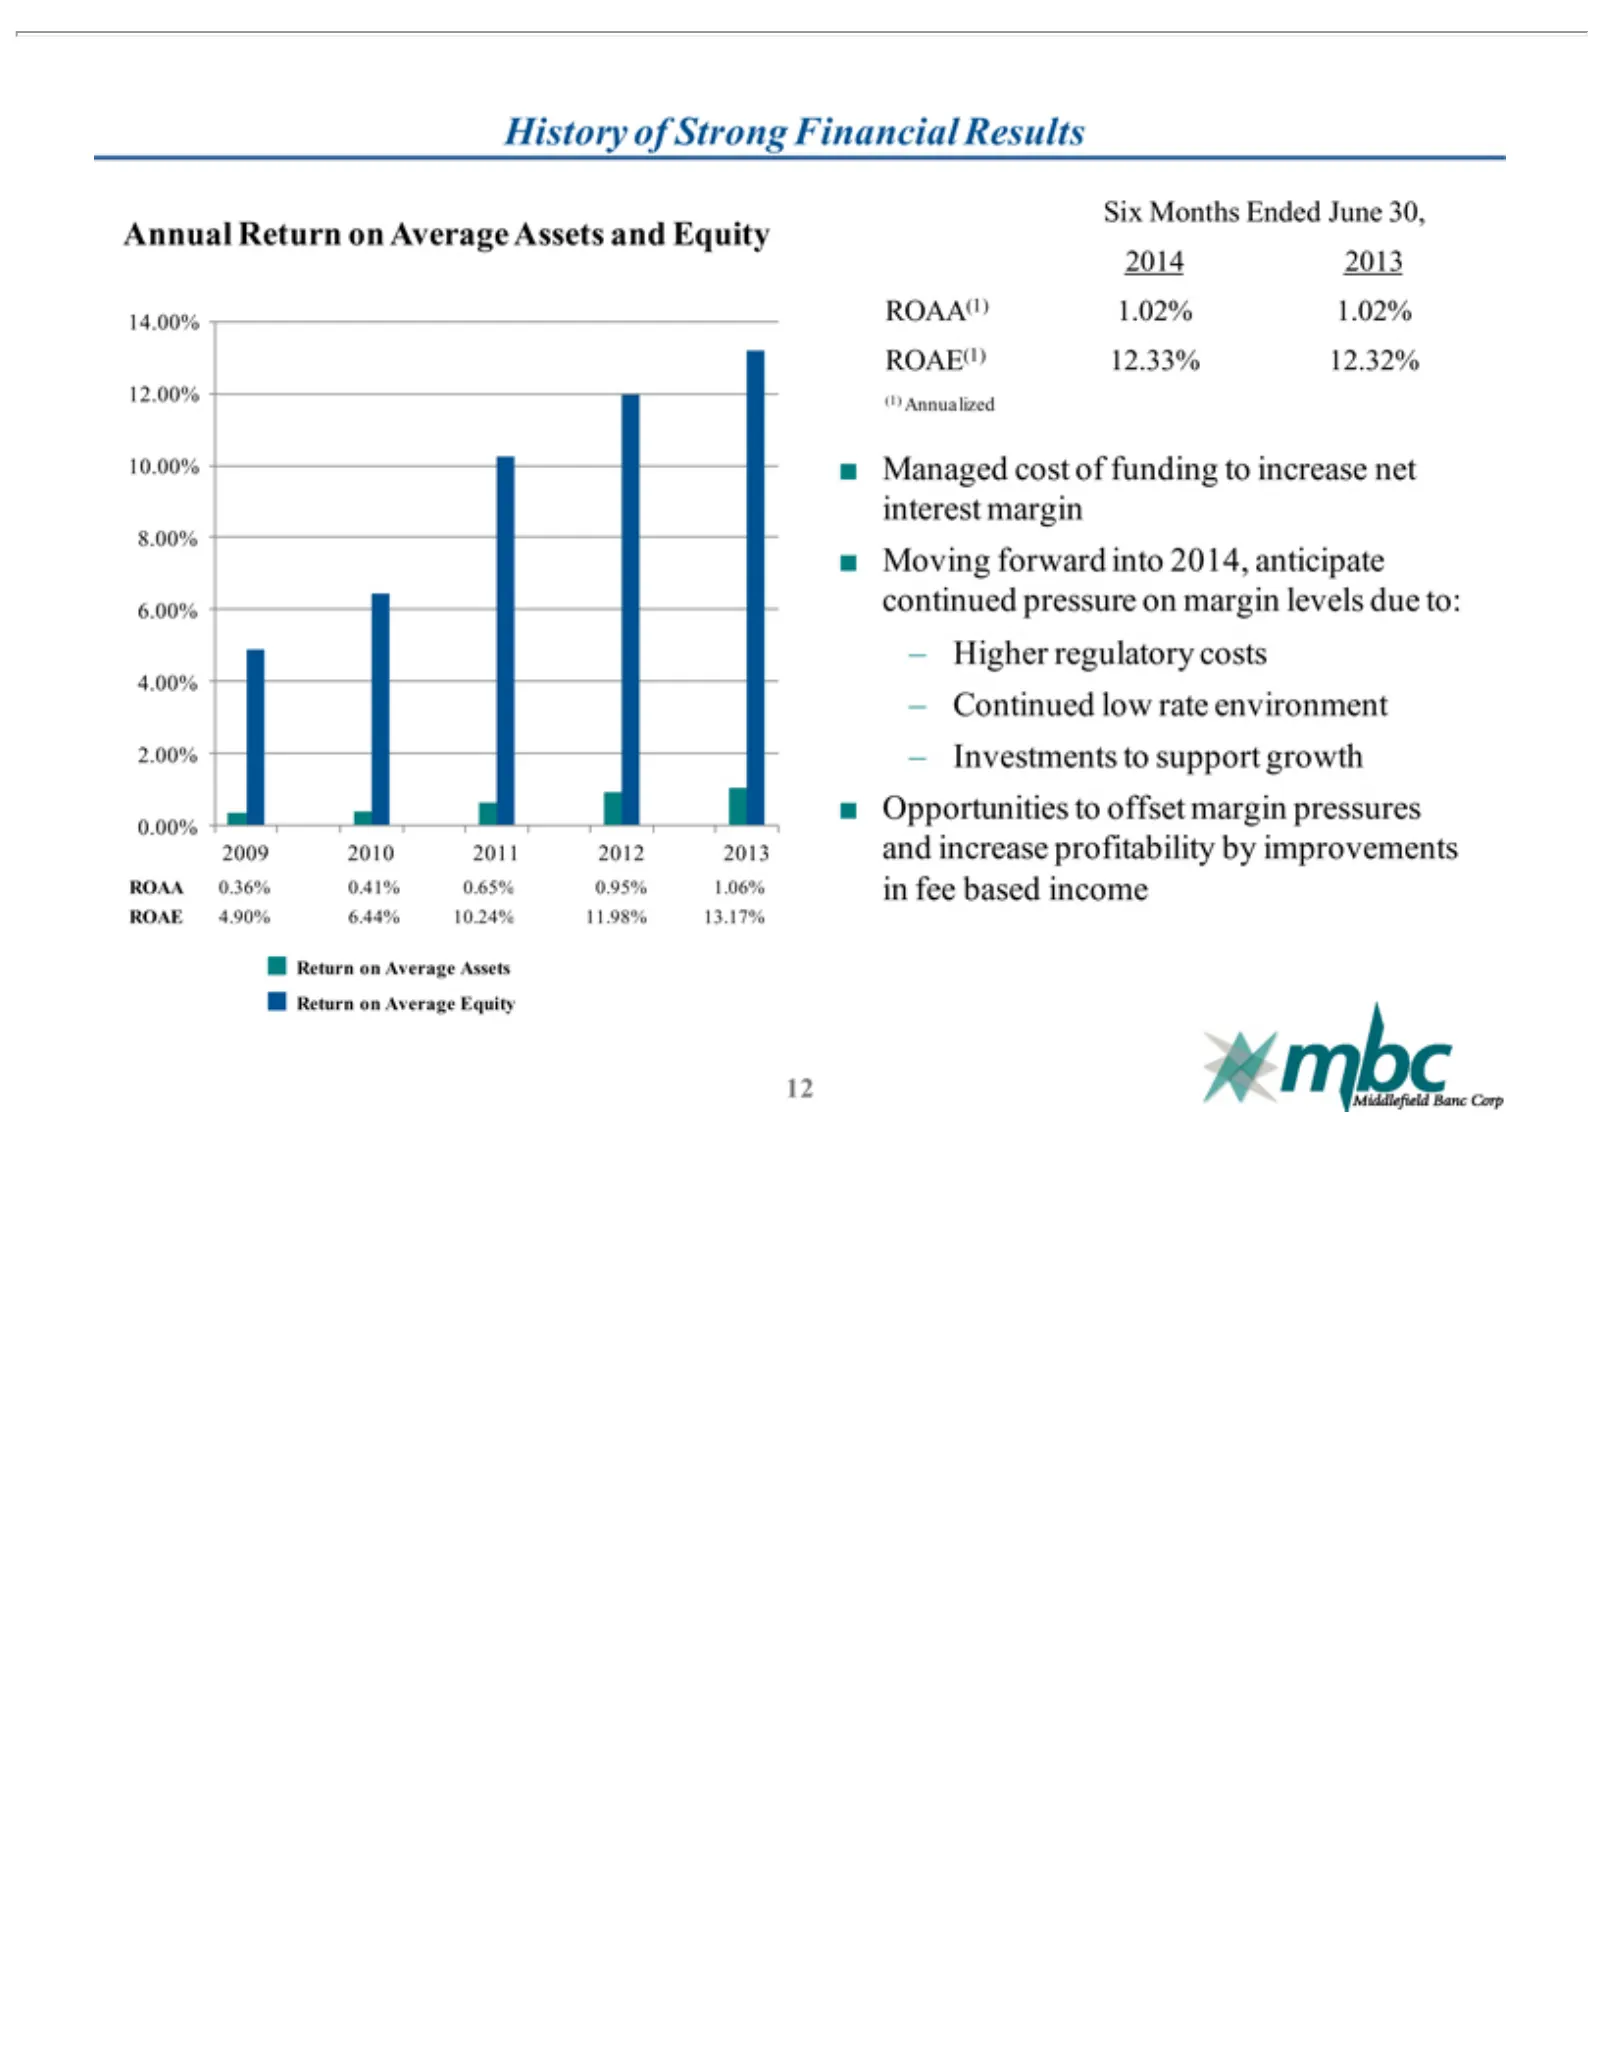
History Annual 14.00% ROAA 2009 0.36% Return Six (1) Managed Moving Higher Continued Investments Opportunities 12 Annualized Months 2010 0.41% on regulatory ROAE Return of 12.00% forward cost Average Strong low 2011 Ended to0.65% to of support on rate 10.00% 2012 offset into funding Financial Averag
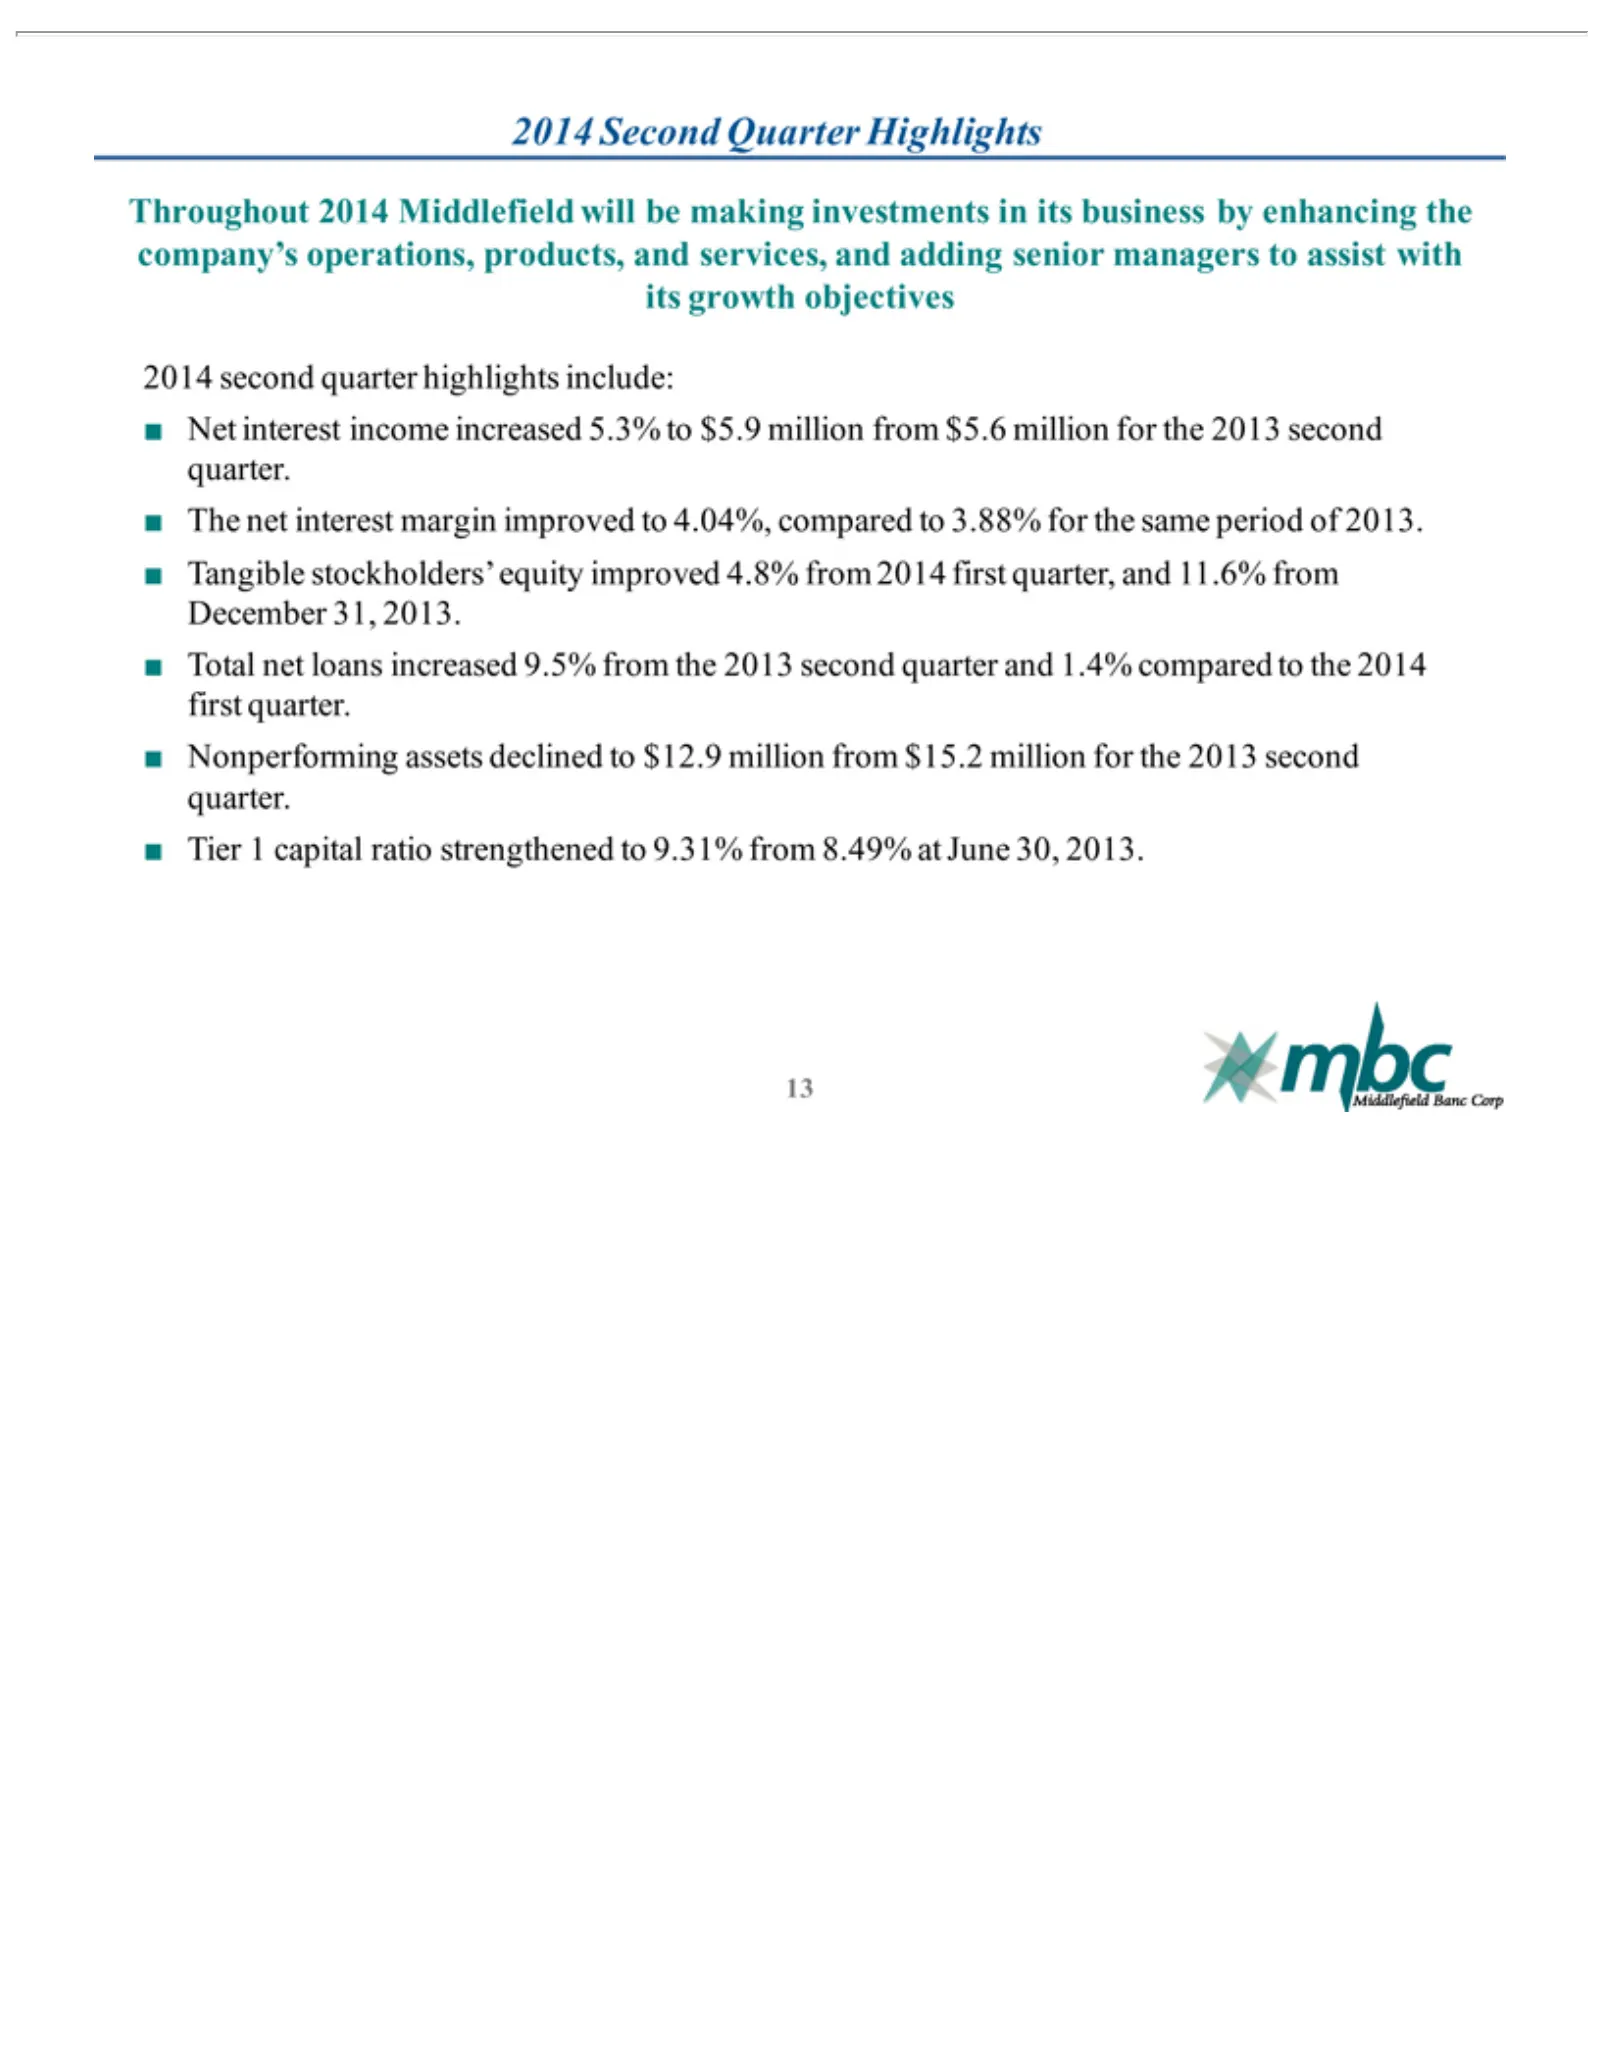
Slide 13: Second Quarter 2014 Highlights
Throughout 2014 objectives Net The Tangible December Total Nonperforming Tier 13 interest net 1second Second net capital interest stockholders’ loans 31, income 2014 quarter Quarter ratio 2013. increased margin assets Middlefield strengthened increased highlights Highlights declined equity improved
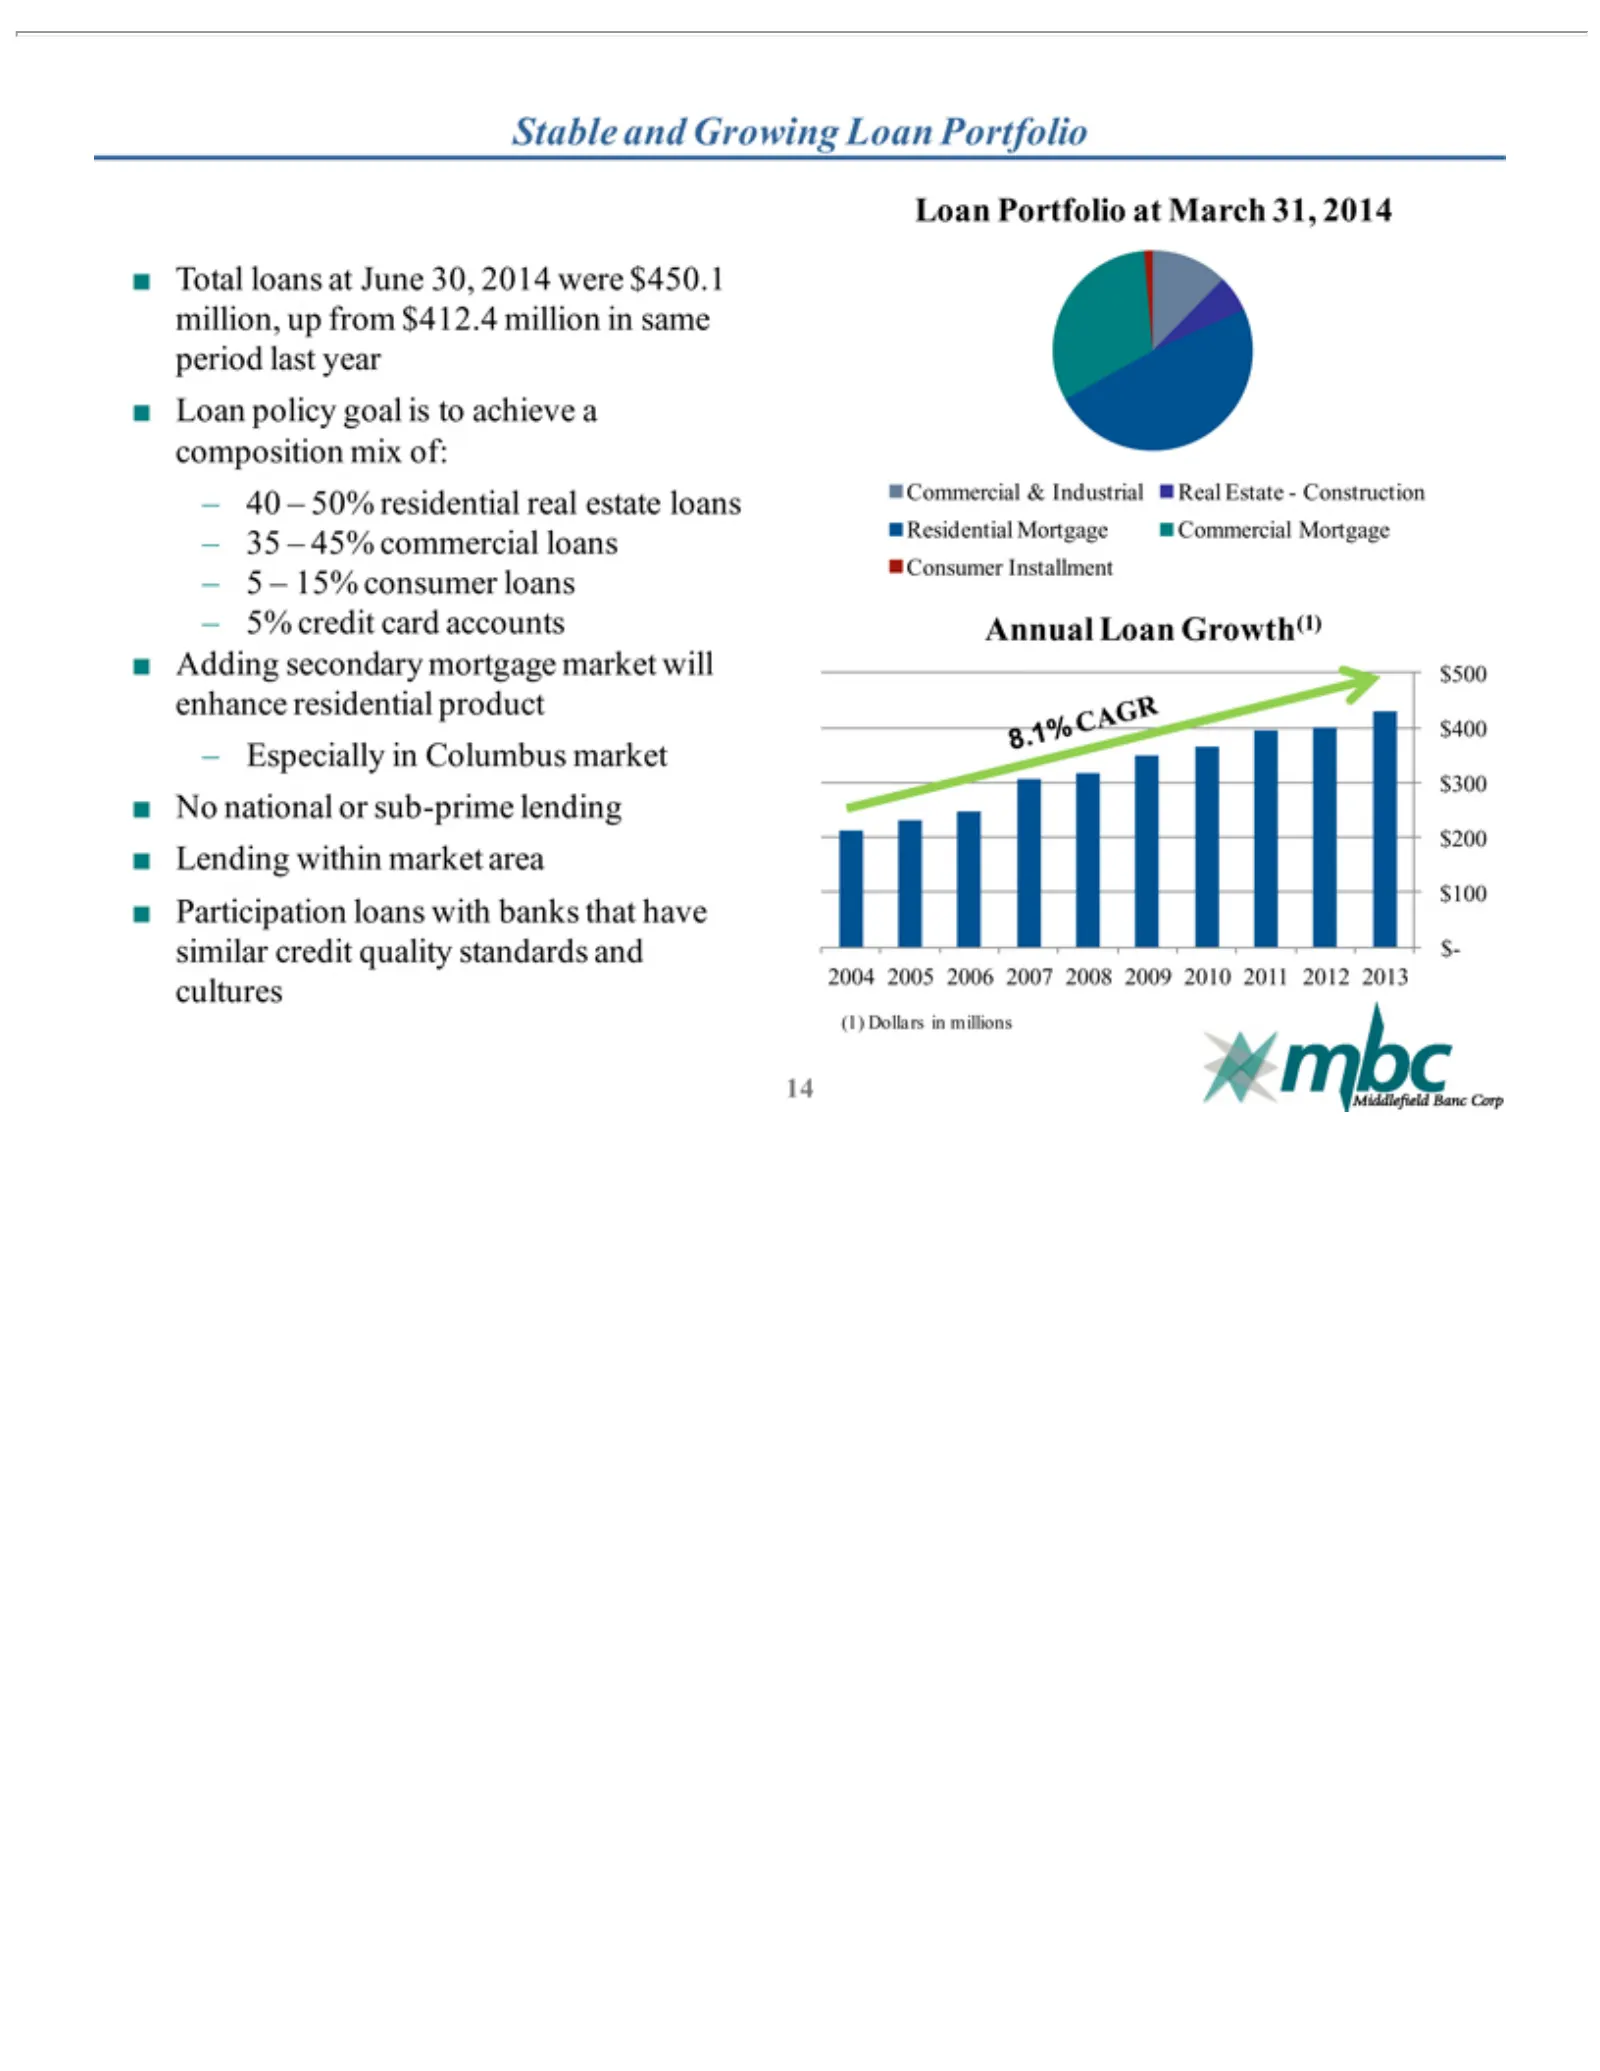
Slide 14: Stable Total Loan Portfolio
Stable Total – Adding Especially No Lending Participation Loan Commercial Residential Consumer Annual $500 2004 $- (1) 1440Dollars 535 5% national ––2005 15% $400 loans policy Portfolio credit and 50% 45% Loan secondary within consumer Installment in Growing $300 2006 in at Mortgage residential comm
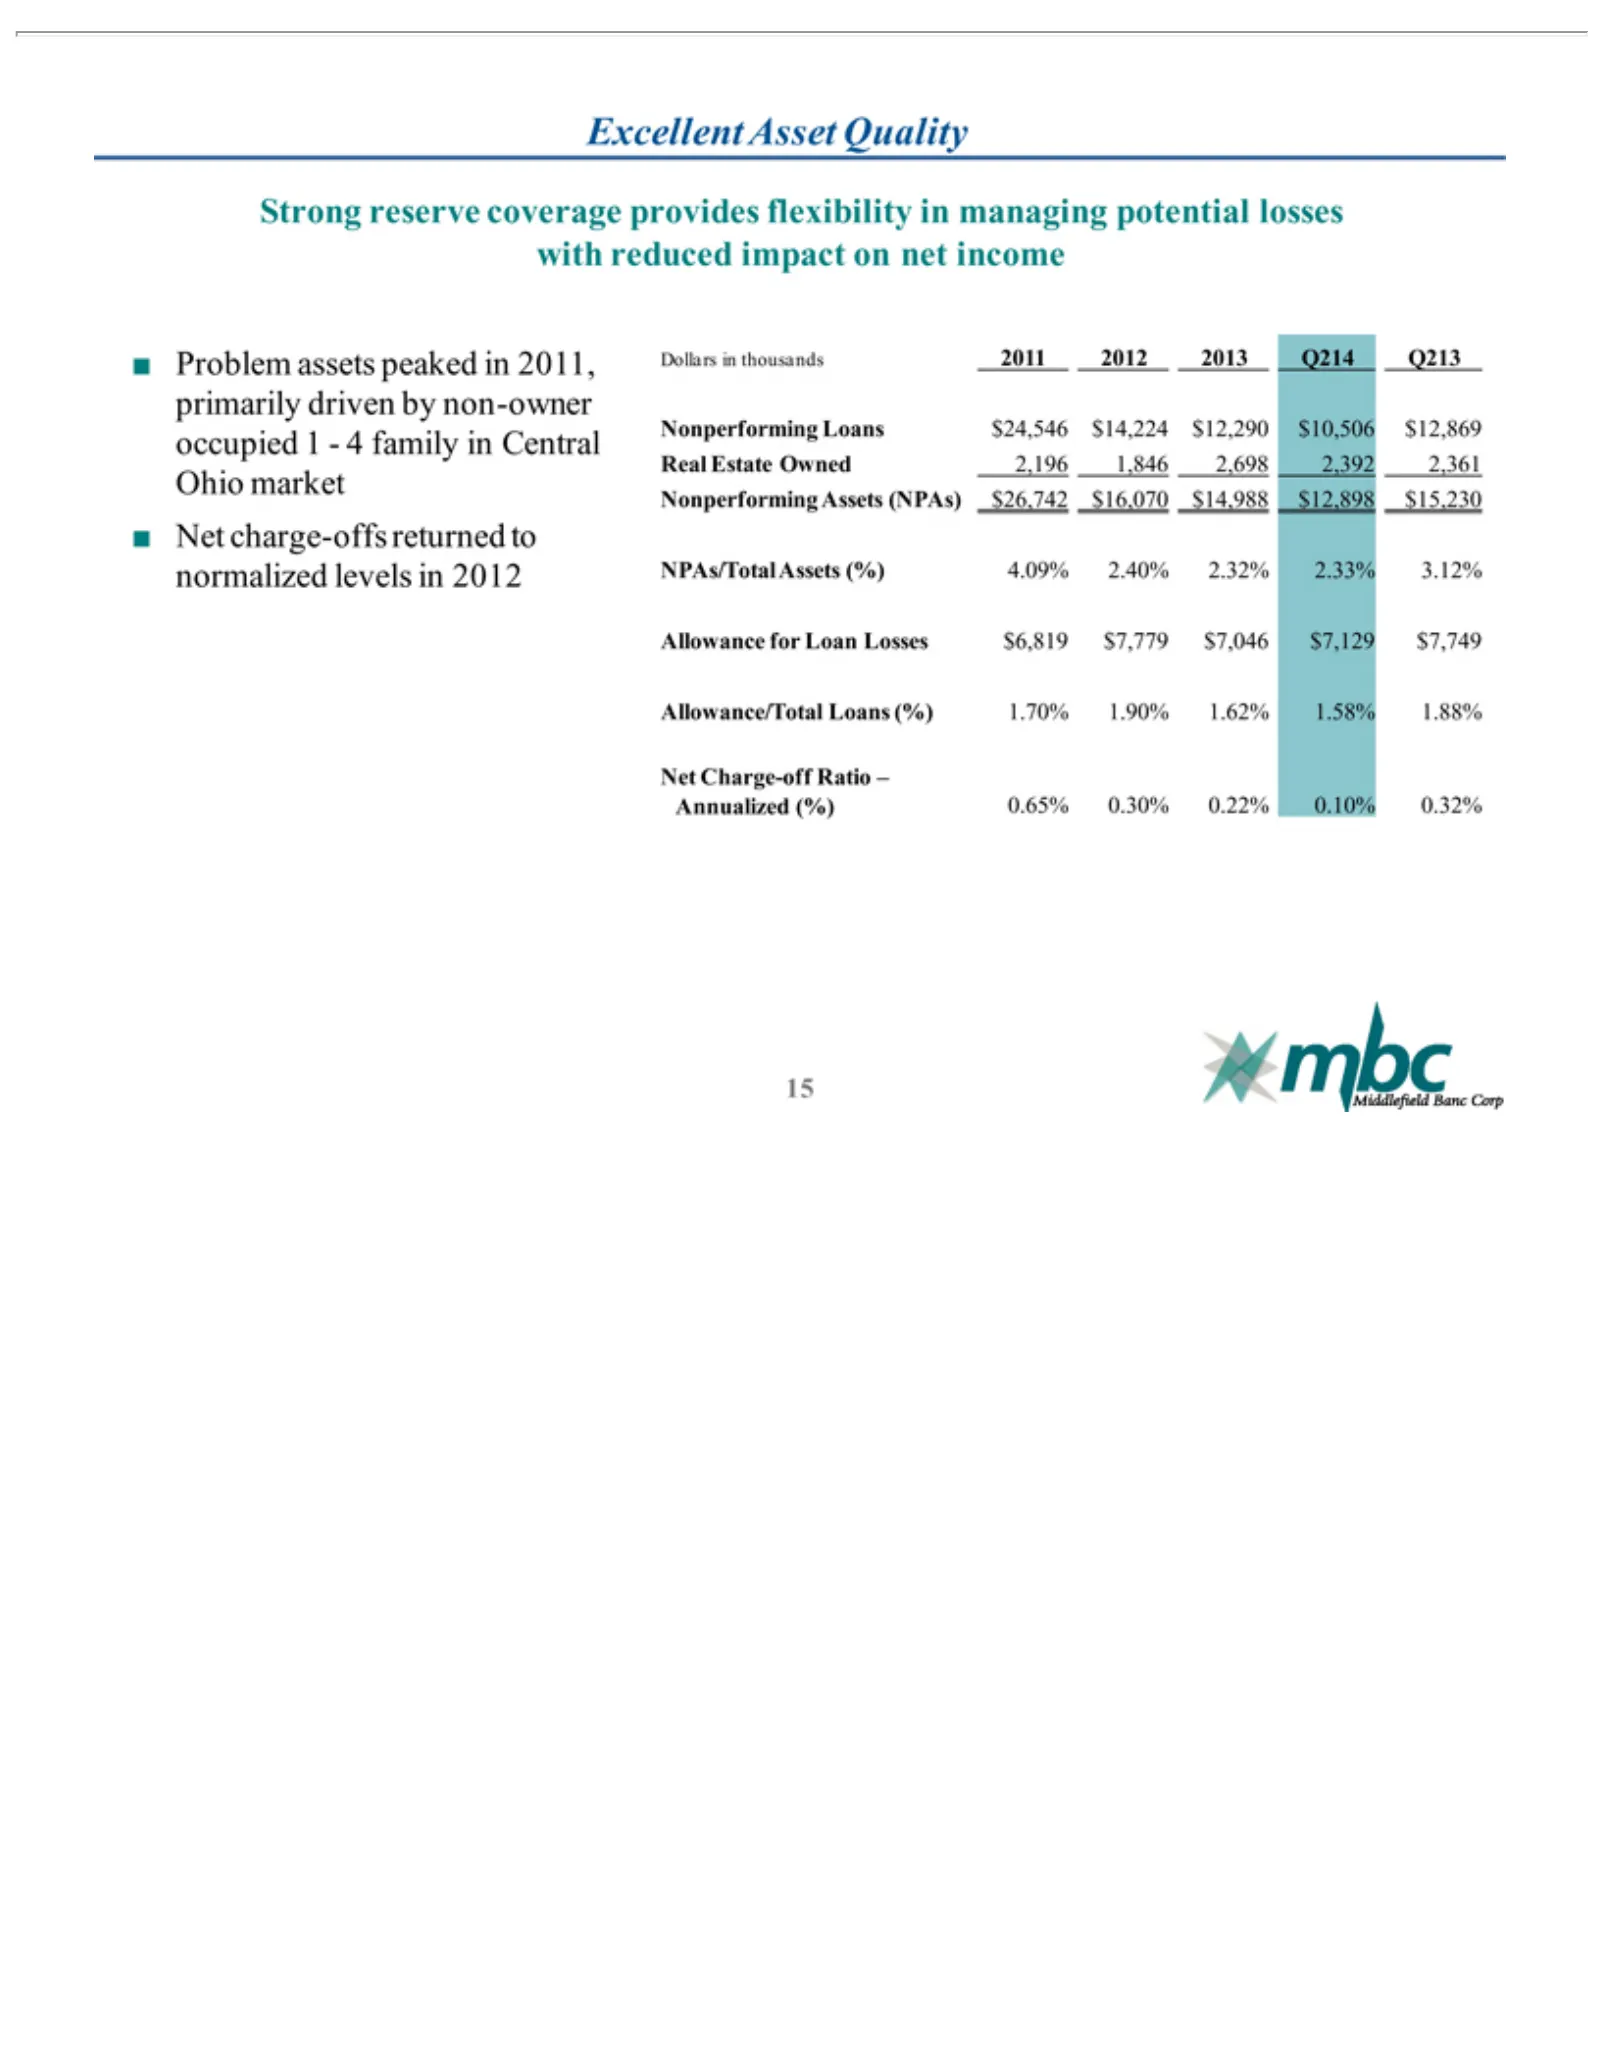
Slide 15: Excellent Asset Quality
Excellent Strong (1) (2) Dollars Real Nonperforming NPAs/Total Allowance Allowance/Total Net Annualized 15 Problem Net Charge-off Estate reserve charge-offs inAsset thousands for Owned Assets (%) assets Loan coverage Ratio Assets Quality Loans 0.65% Loans peaked (%) returned 2,196 Losses 2011 –$24,5
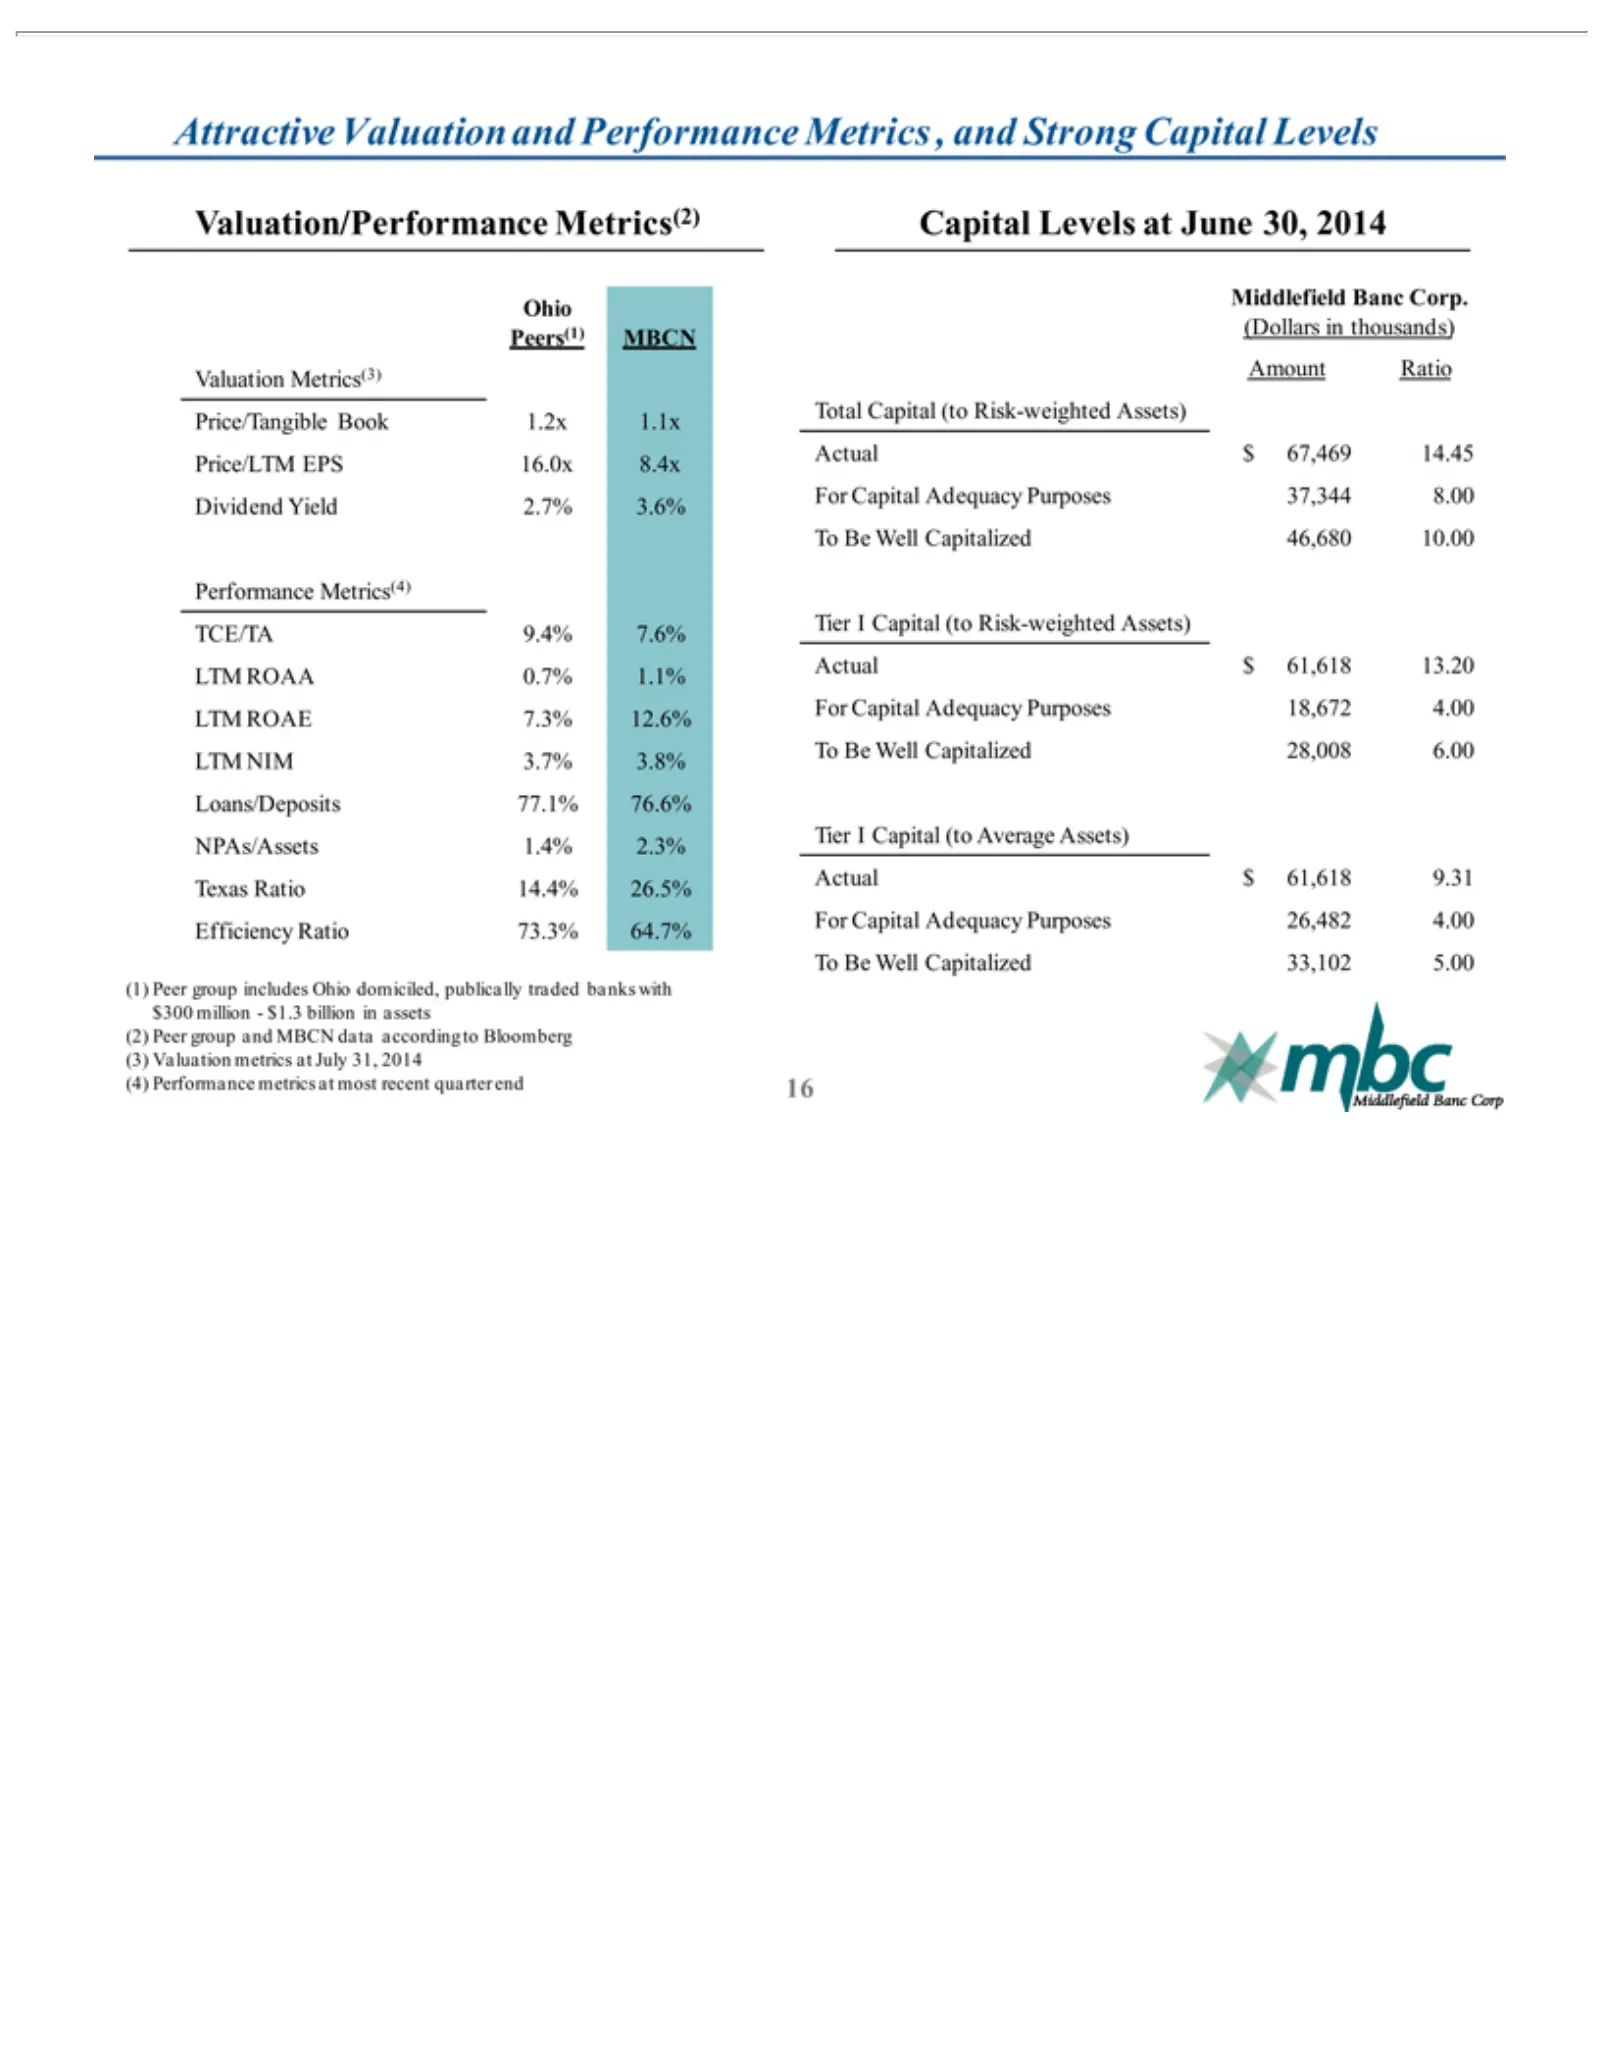
Slide 16: Attractive Valuation/Performance Metrics
Attractive Valuation/Performance MBCN Peers(1) Ohio Price/Tangible Price/LTM 1.1x 1.2x Dividend 8.4x 16.0x 3.6% 2.7% 7.6% 9.4% TCE/TA 1.1% 0.7% LTM 12.6% 7.3% Texas 2.3% 1.4% NPAs/Assets 76.6% 77.1% Loans/Deposits 3.8% 3.7% Efficiency 26.5% 14.4% Capital 64.7% 73.3% Middlefield (Dollars Amount Total
Slide 17: Supplemental Information
Supplemental Information 17
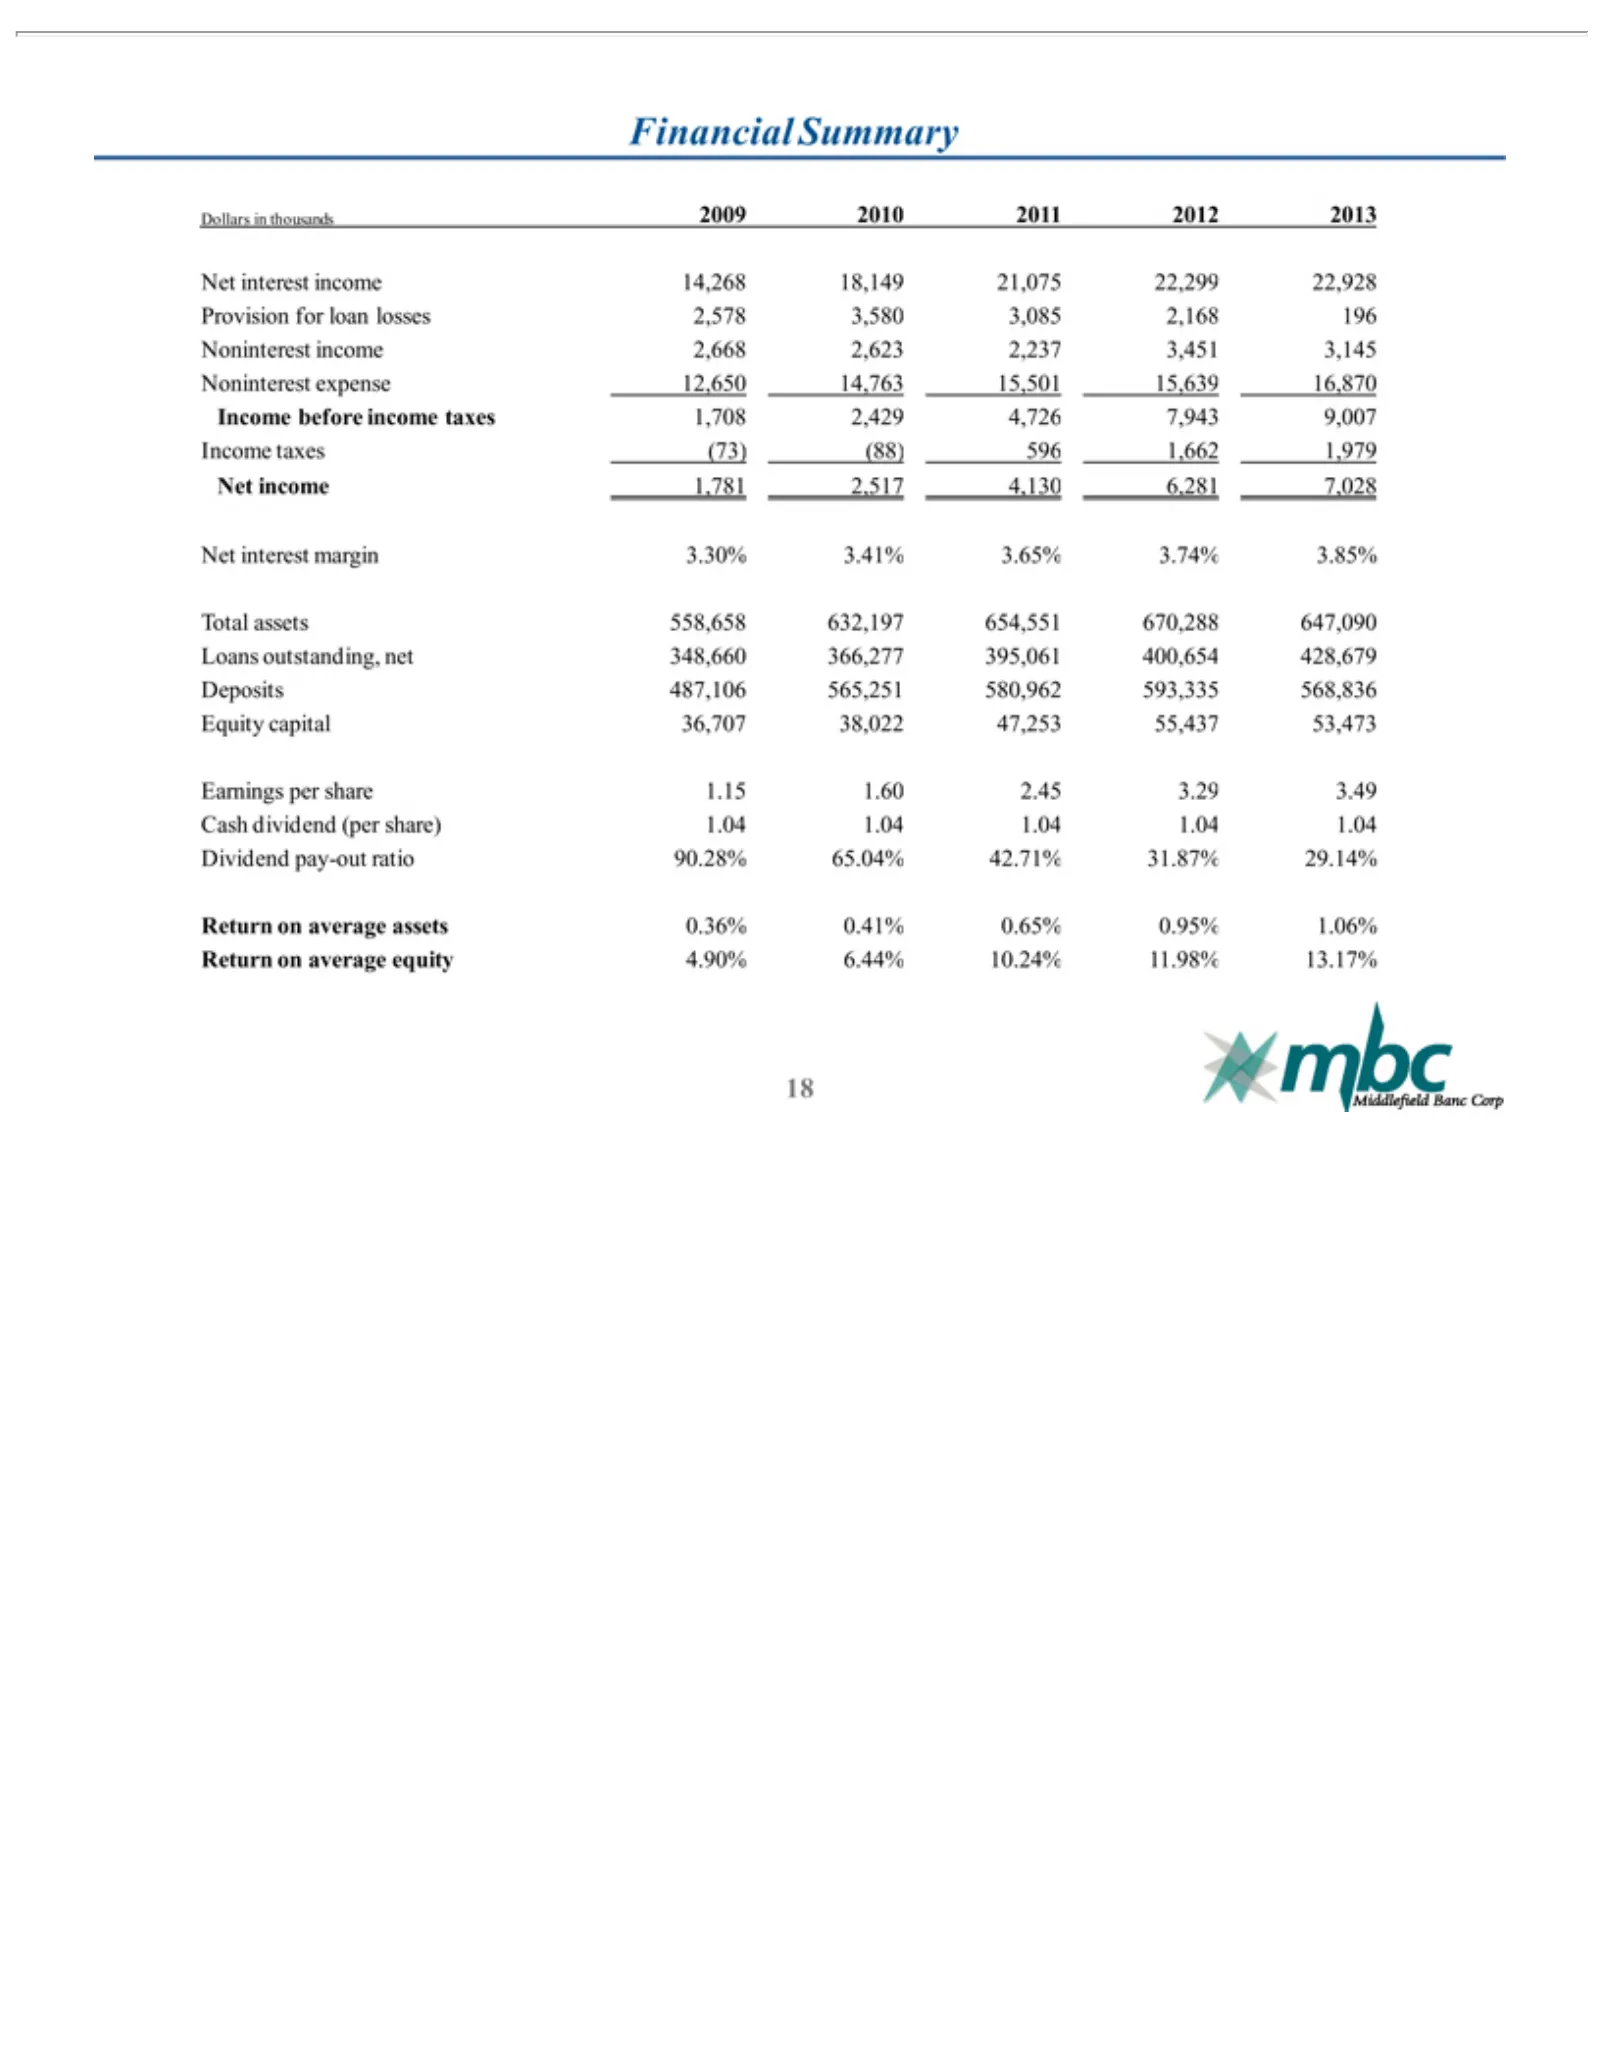
Slide 18: Financial Summary
Financial Dollars Provision Noninterest Income Net Total Loans Deposits Equity Earnings Cash Dividend Return 18 income interest dividend assets outstanding, capital on in before taxes(73)(88) 487,106 per Summary pay-out for thousands average 558,658 income 1,781 margin expense share loan 36,707 (per
Source: SEC EDGAR · 8-K filed Aug 26, 2014
More decks from Middlefield Banc
 Merger or Acquisition (October 2025)27 slides · Oct 22, 2025
 Q2 2025 Earnings Presentation24 slides · Jul 28, 2025
 Investor Presentation (June 2025)23 slides · Jun 2, 2025
 Q4 2024 Earnings Presentation24 slides · Jan 27, 2025
 Investor Presentation (November 2024)25 slides · Nov 22, 2024
 Investor Presentation (July 2024)25 slides · Jul 29, 2024