Fauquier Bankshares — Shareholder Meeting (May 2017)
34 slides from Fauquier Bankshares's shareholder meeting presentation, May 16, 2017
Slide 1: Annual Shareholders' Meeting May 16, 2017
_____________________FAUQUIER BANKSHARES, INC.ANNUAL SHAREHOLDERS’ MEETING May 16, 2017
Slide 2: Safe Harbor Statement
Safe Harbor Statement Today’s presentations may include forward-looking statements. These statements represent the company's beliefs regarding future events that, by their nature, are uncertain and outside of the company’s control. The company’s actual results and financial condition may differ, pos
Slide 3: Vision Statement and Values
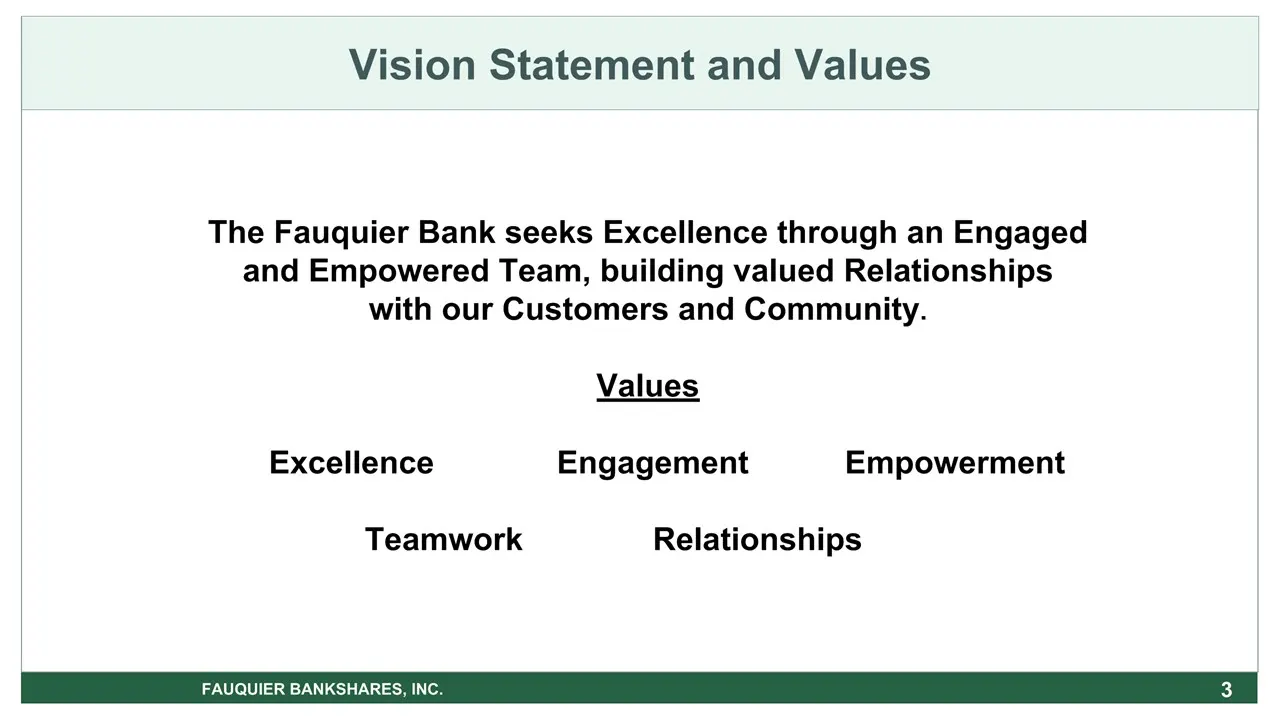
* Vision Statement and Values FAUQUIER BANKSHARES, INC. The Fauquier Bank seeks Excellence through an Engagedand Empowered Team, building valued Relationshipswith our Customers and Community.Values Excellence Engagement Empowerment Teamwork Relationships
Slide 4: Board of Directors
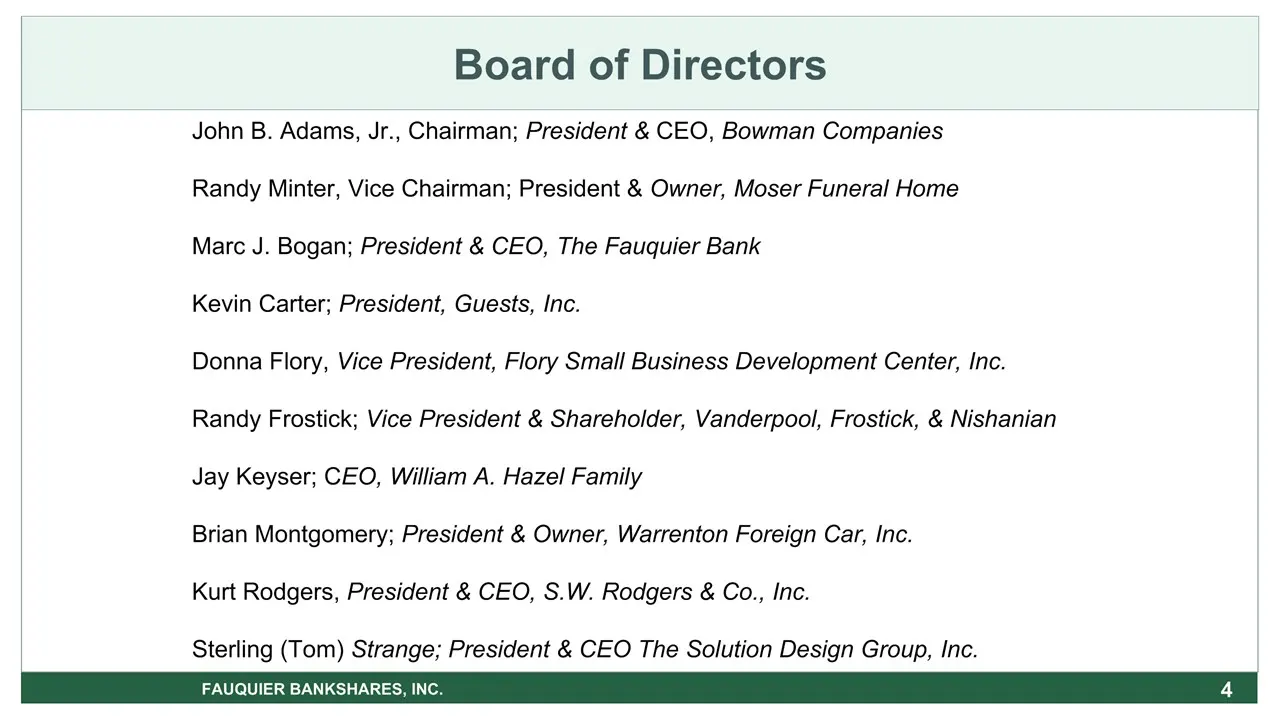
* Board of Directors FAUQUIER BANKSHARES, INC. John B. Adams, Jr., Chairman; President & CEO, Bowman CompaniesRandy Minter, Vice Chairman; President & Owner, Moser Funeral HomeMarc J. Bogan; President & CEO, The Fauquier BankKevin Carter; President, Guests, Inc.Donna Flory, Vice President, Flory Sma
Slide 5: Management
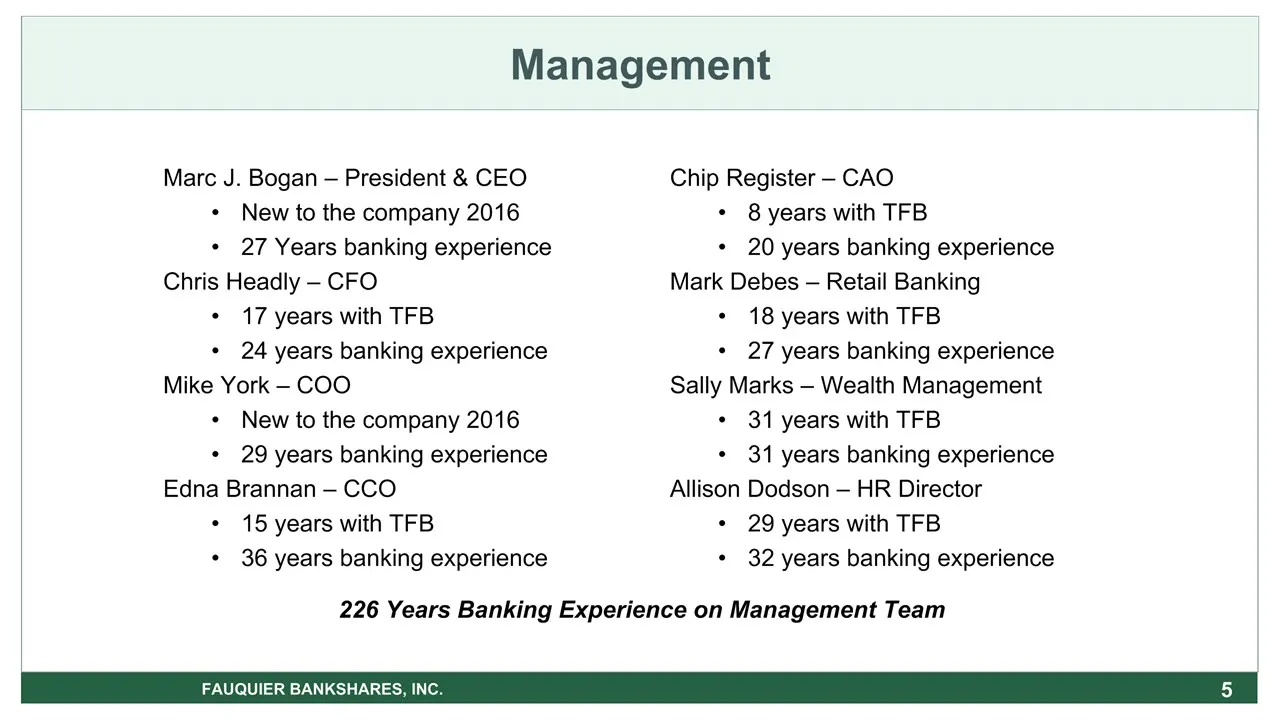
* Management FAUQUIER BANKSHARES, INC. Marc J. Bogan – President & CEONew to the company 201627 Years banking experienceChris Headly – CFO17 years with TFB24 years banking experienceMike York – COONew to the company 201629 years banking experienceEdna Brannan – CCO15 years with TFB36 years banking e
Slide 6: FAUQUIER BANKSHARES, INC. 6
FAUQUIER BANKSHARES, INC. 6
Slide 7: Net Income
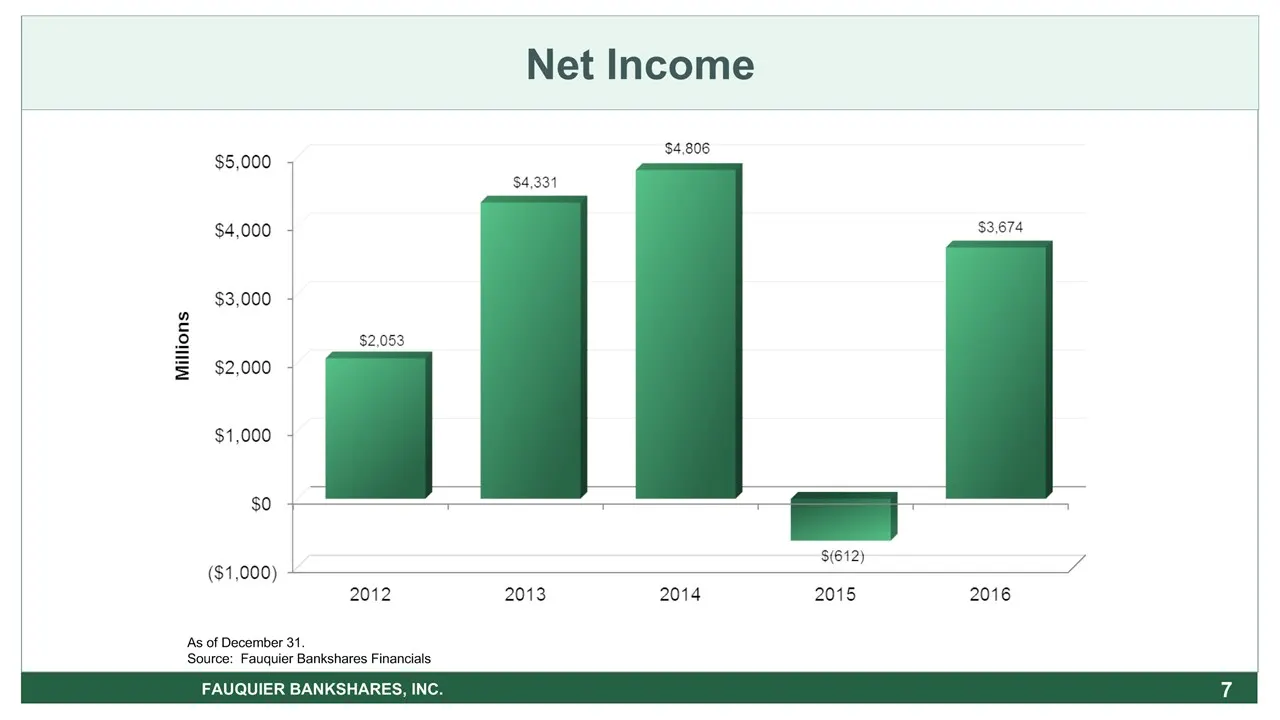
7 As of December 31. Source: Fauquier Bankshares Financials Net Income FAUQUIER BANKSHARES, INC.
Slide 8: Total Assets
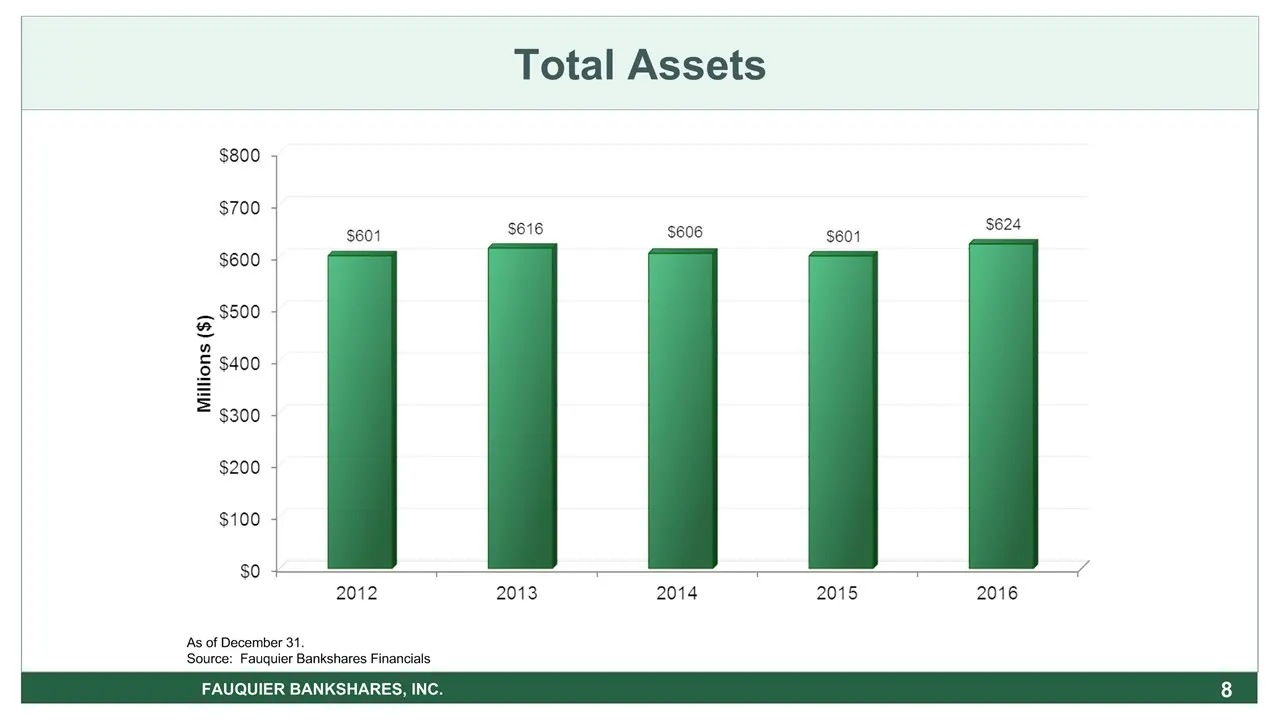
* As of December 31.Source: Fauquier Bankshares Financials Total Assets FAUQUIER BANKSHARES, INC.
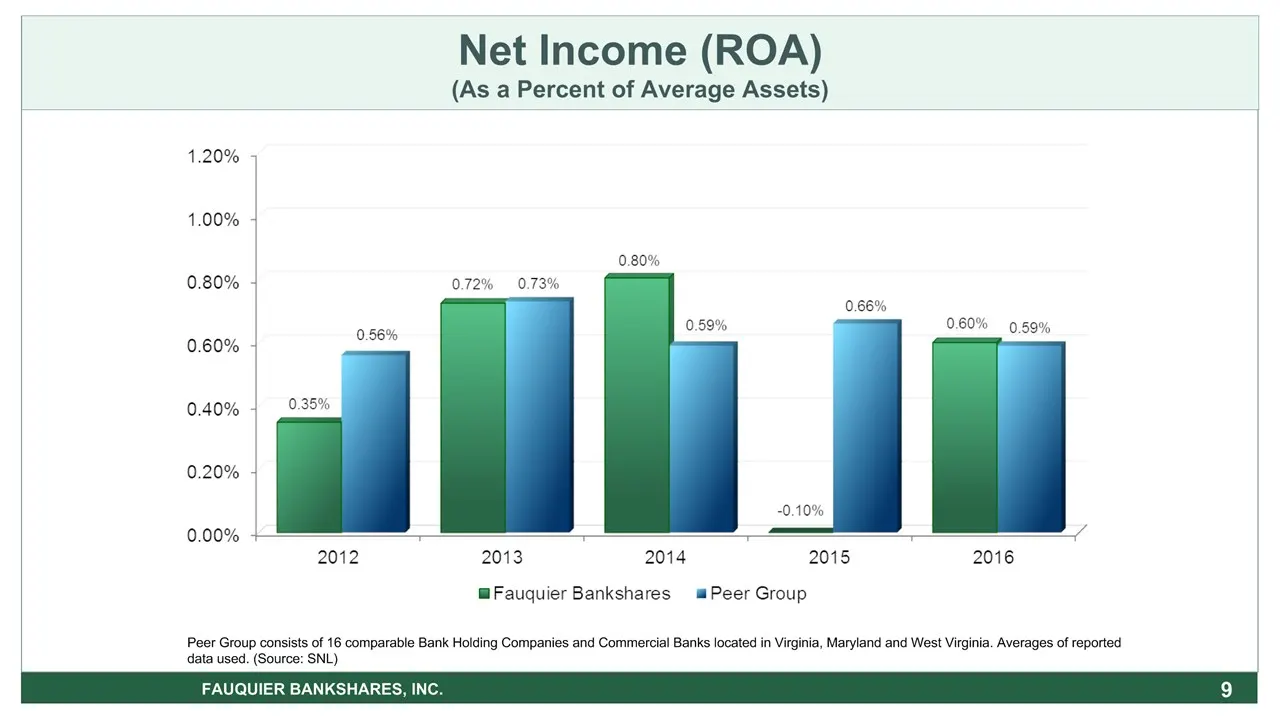
Slide 9: Net Income (ROA)
Net Income (ROA)(As a Percent of Average Assets) * FAUQUIER BANKSHARES, INC. Peer Group consists of 16 comparable Bank Holding Companies and Commercial Banks located in Virginia, Maryland and West Virginia. Averages of reported data used. (Source: SNL)
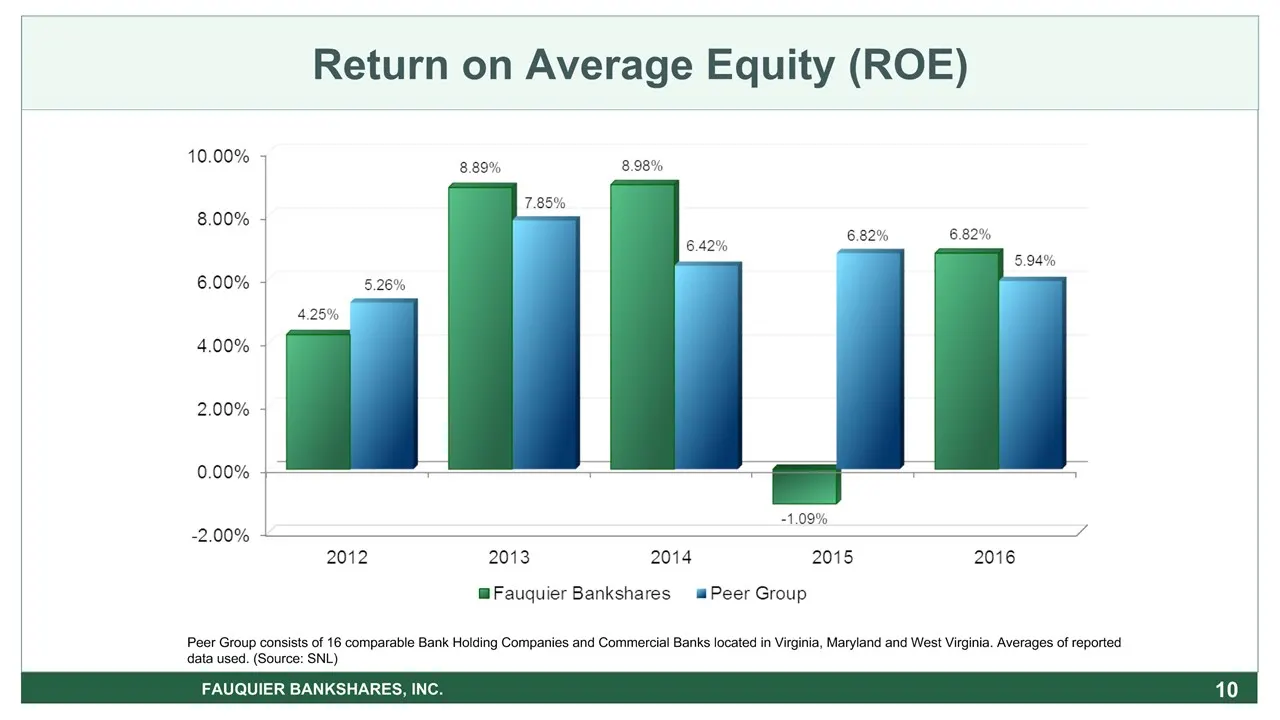
Slide 10: Return on Average Equity (ROE)
Peer Group consists of 16 comparable Bank Holding Companies and Commercial Banks located in Virginia, Maryland and West Virginia. Averages of reported data used. (Source: SNL) Return on Average Equity (ROE) 10 FAUQUIER BANKSHARES, INC. FAUQUIER BANKSHARES, INC.
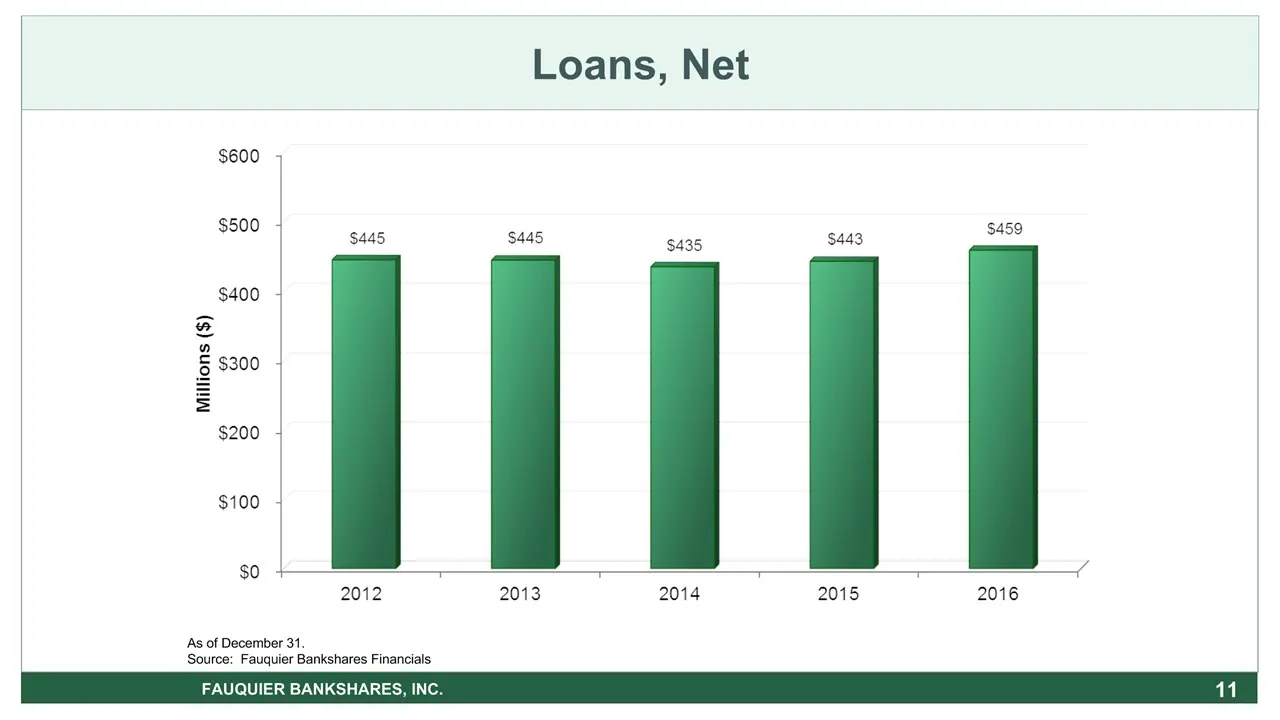
Slide 11: Loans, Net
* As of December 31.Source: Fauquier Bankshares Financials Loans, Net FAUQUIER BANKSHARES, INC.
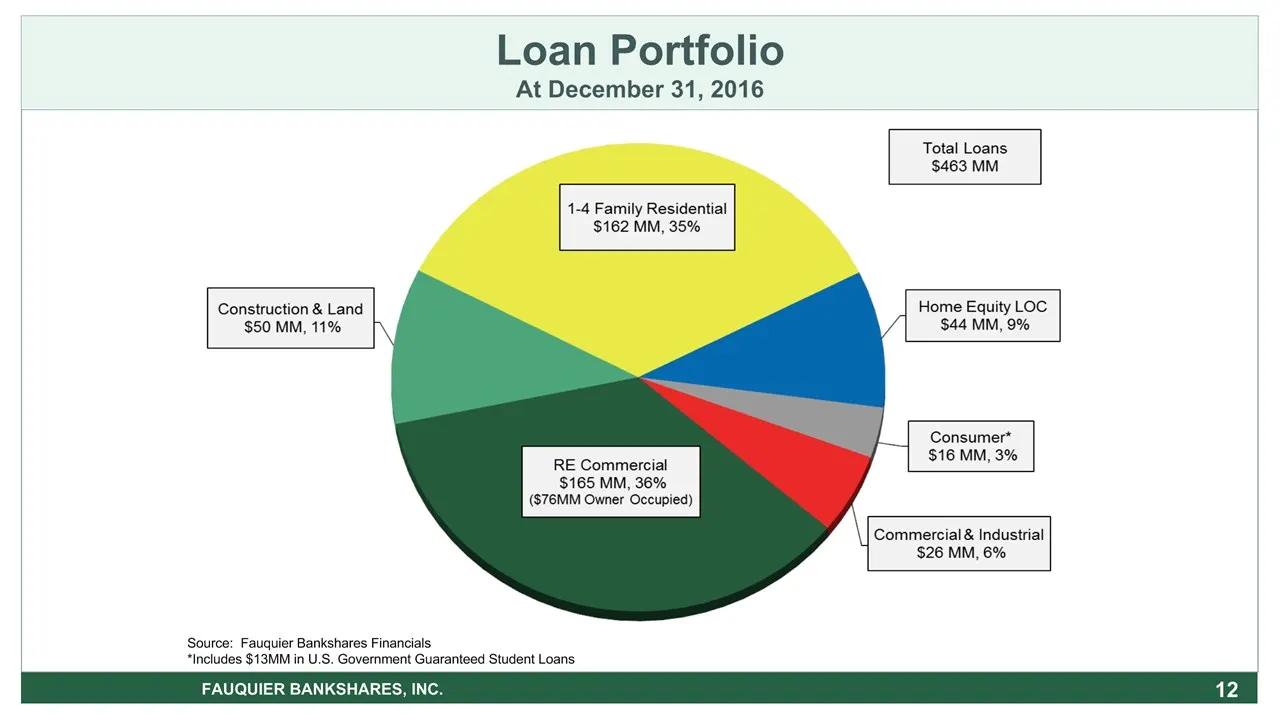
Slide 12: Loan Portfolio at December 31, 2016
* Source: Fauquier Bankshares Financials *Includes $13MM in U.S. Government Guaranteed Student Loans Loan PortfolioAt December 31, 2016 FAUQUIER BANKSHARES, INC.
Slide 13: Total Deposits
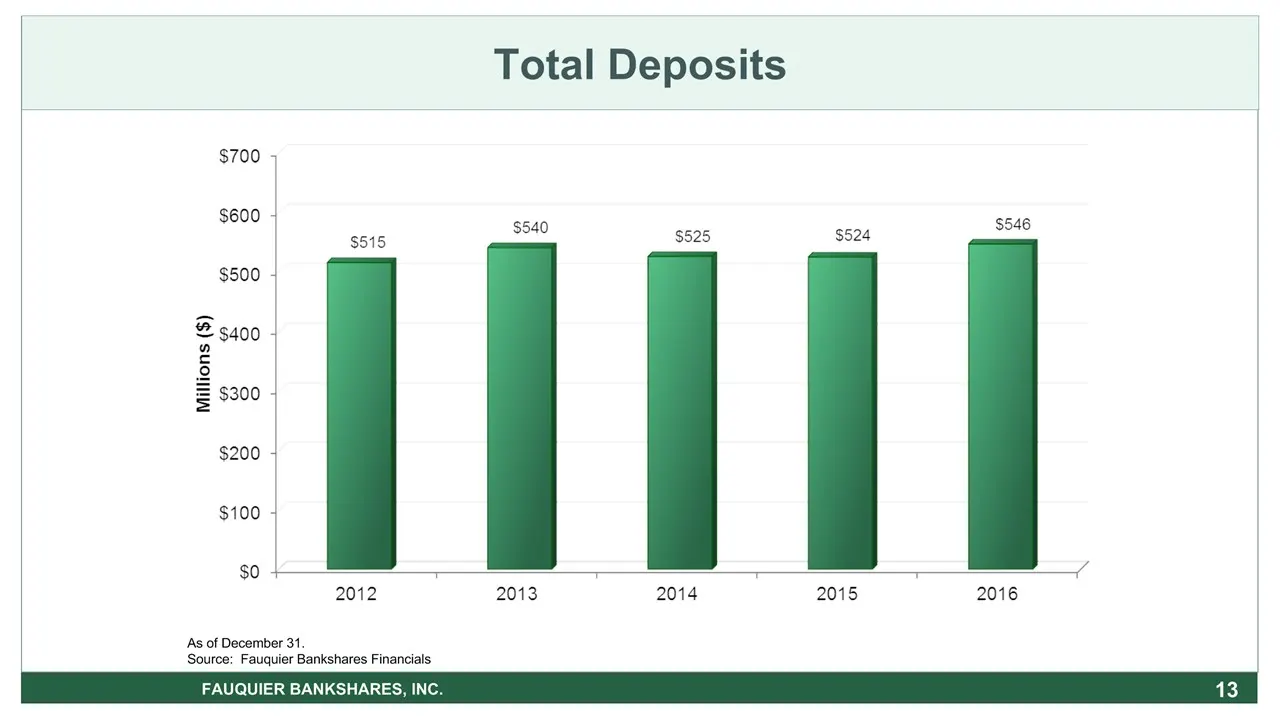
* As of December 31. Source: Fauquier Bankshares Financials Total Deposits FAUQUIER BANKSHARES, INC.
Slide 14: Deposit Market Share
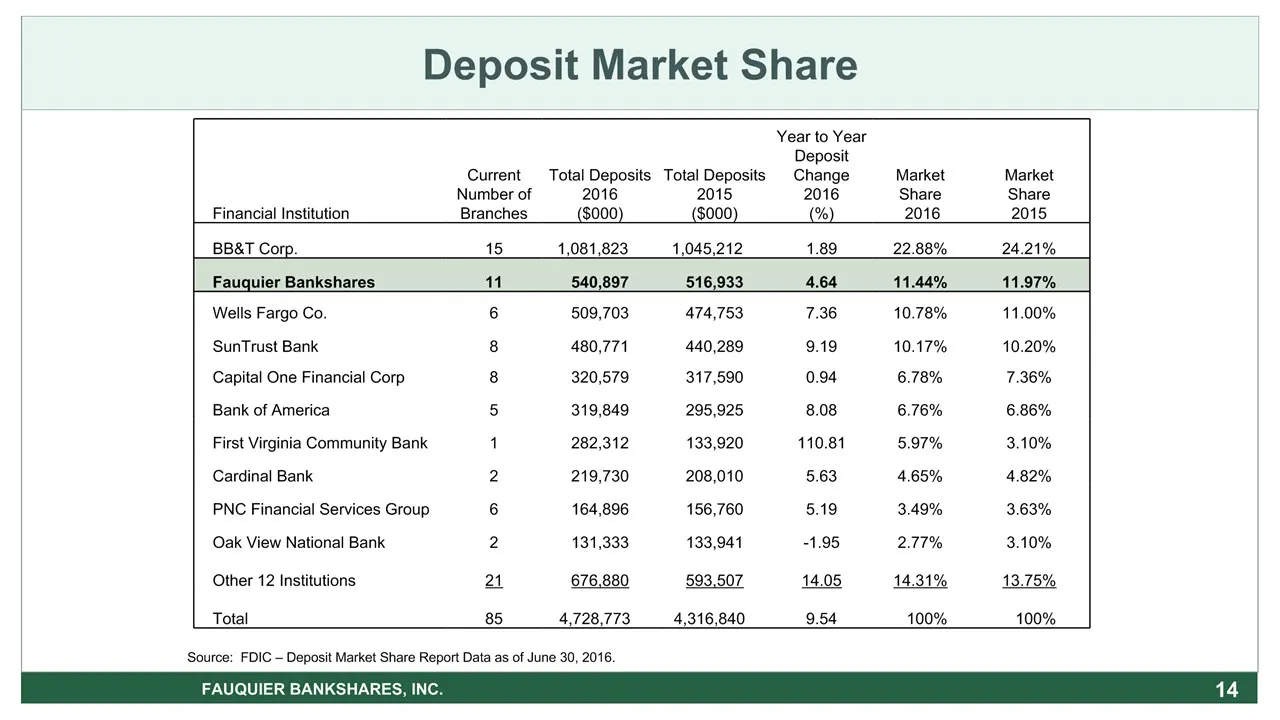
* Deposit Market Share FAUQUIER BANKSHARES, INC. Financial Institution Current Number ofBranches Total Deposits 2016($000) Total Deposits 2015($000) Year to Year Deposit Change 2016(%) MarketShare 2016 MarketShare2015 BB&T Corp. 15 1,081,823 1,045,212 1.89 22.88% 24.21% Fauquier Bankshares 11 540,89
Slide 15: Deposit Portfolio at December 31, 2016
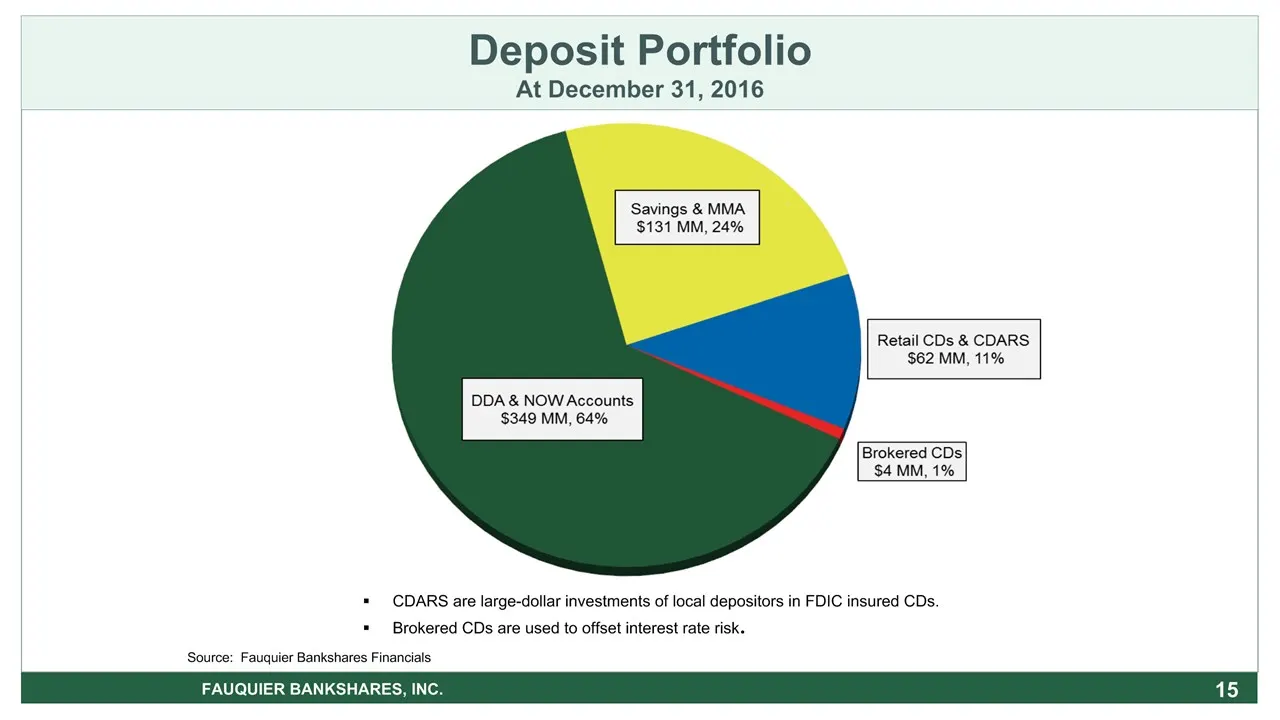
* Source: Fauquier Bankshares Financials Deposit PortfolioAt December 31, 2016 FAUQUIER BANKSHARES, INC. CDARS are large-dollar investments of local depositors in FDIC insured CDs.Brokered CDs are used to offset interest rate risk.
Slide 16: Core Deposit Portfolio
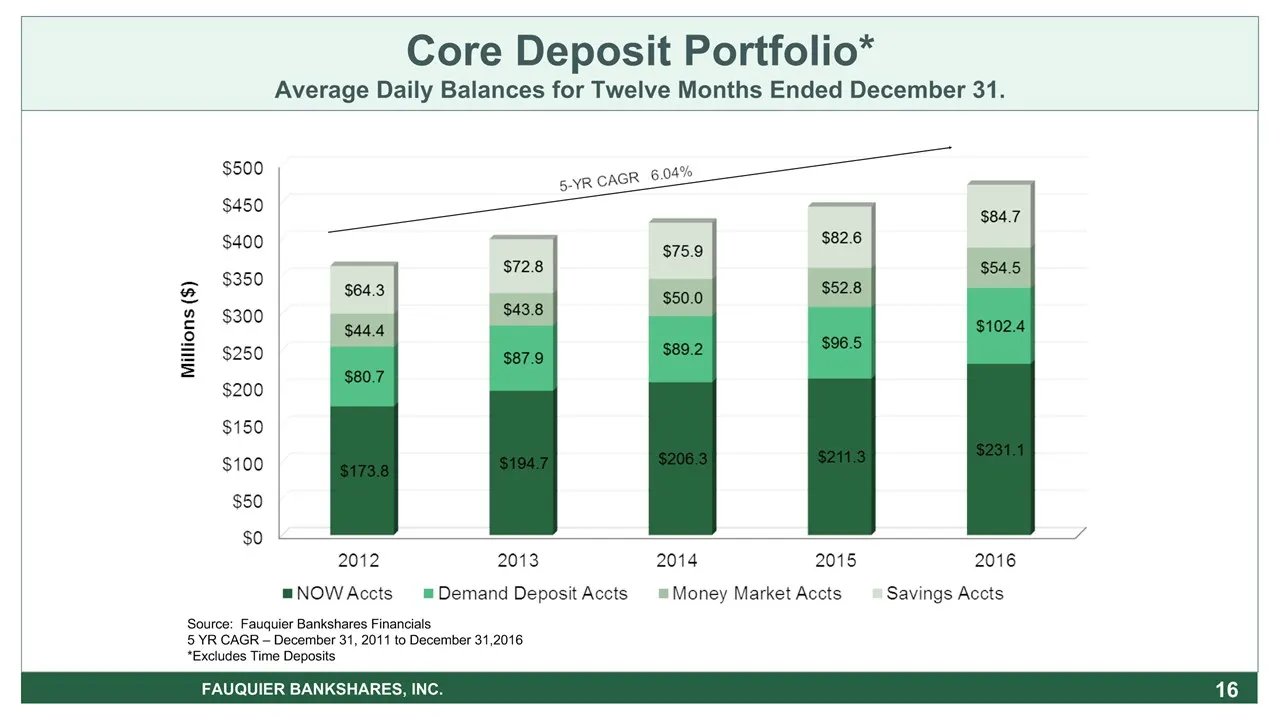
Source: Fauquier Bankshares Financials5 YR CAGR – December 31, 2011 to December 31,2016*Excludes Time Deposits * Core Deposit Portfolio*Average Daily Balances for Twelve Months Ended December 31. FAUQUIER BANKSHARES, INC.
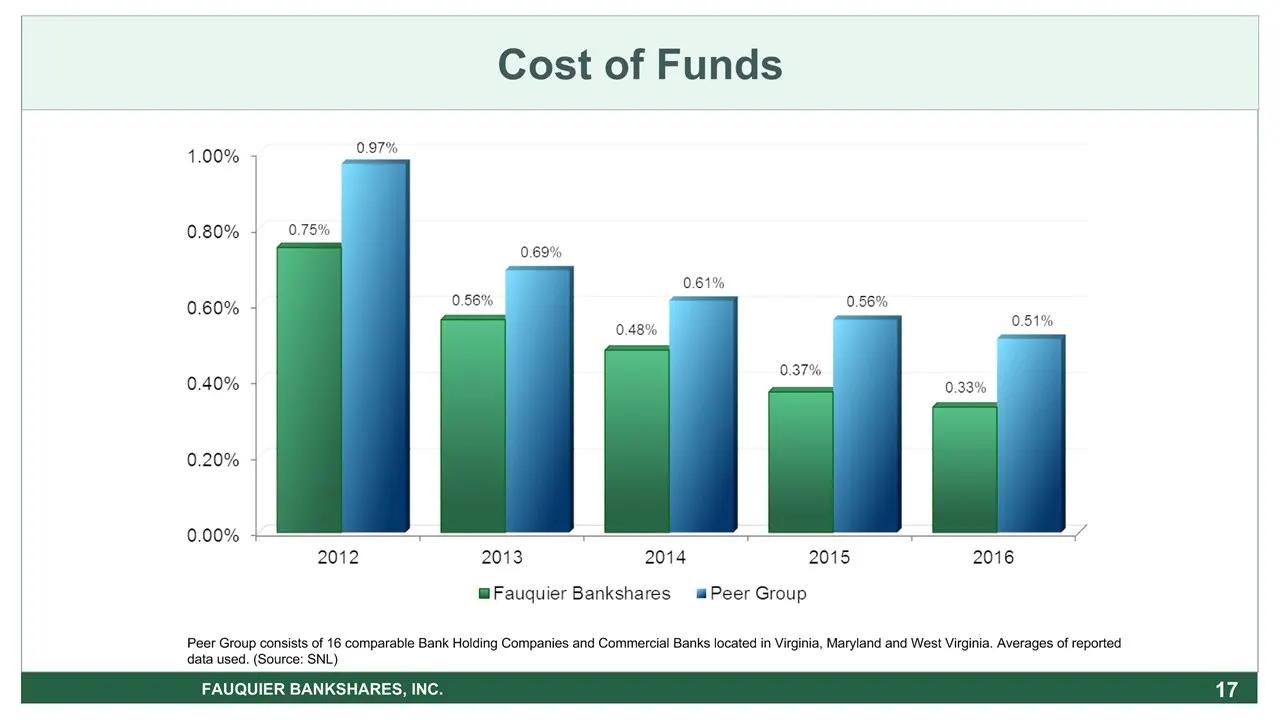
Slide 17: Cost of Funds
Cost of Funds 17 Peer Group consists of 16 comparable Bank Holding Companies and Commercial Banks located in Virginia, Maryland and West Virginia. Averages of reported data used. (Source: SNL) FAUQUIER BANKSHARES, INC.
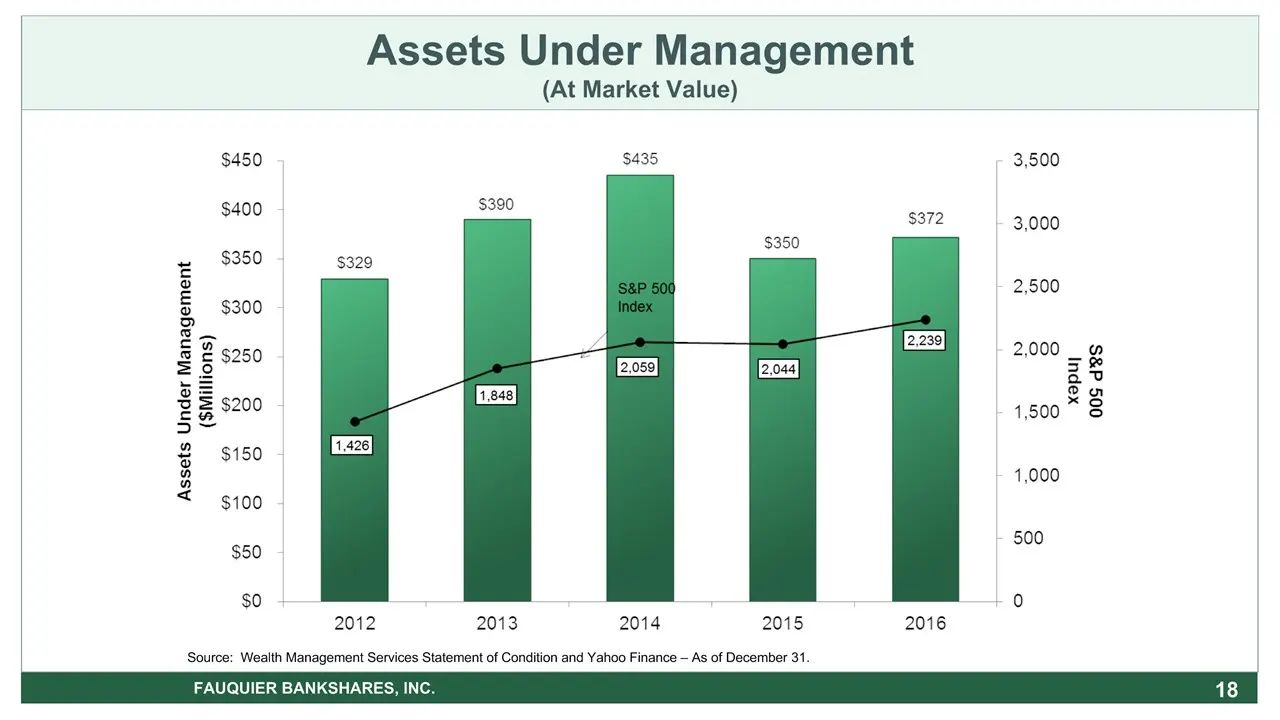
Slide 18: Assets Under Management
Assets Under Management(At Market Value) 18 FAUQUIER BANKSHARES, INC. Source: Wealth Management Services Statement of Condition and Yahoo Finance – As of December 31.
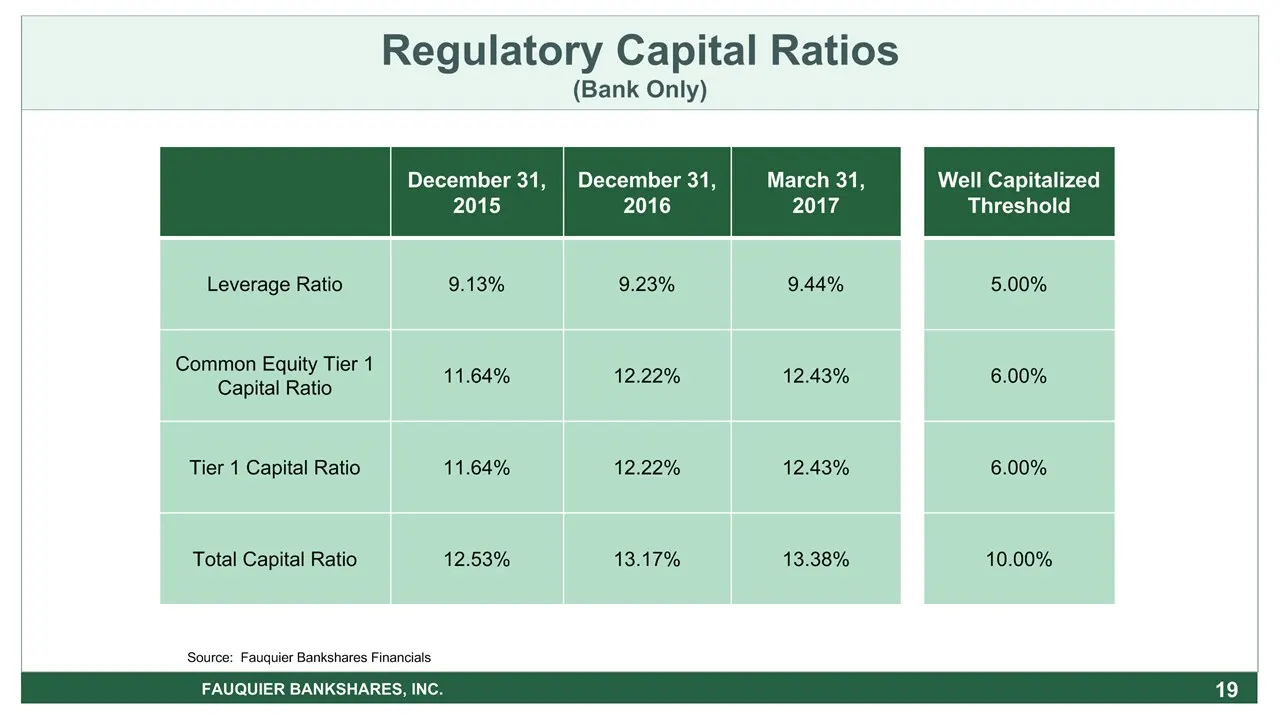
Slide 19: Regulatory Capital Ratios (Bank Only)
* Regulatory Capital Ratios(Bank Only) FAUQUIER BANKSHARES, INC. December 31, 2015 December 31, 2016 March 31, 2017 Leverage Ratio 9.13% 9.23% 9.44% Common Equity Tier 1 Capital Ratio 11.64% 12.22% 12.43% Tier 1 Capital Ratio 11.64% 12.22% 12.43% Total Capital Ratio 12.53% 13.17% 13.38% Well Capital
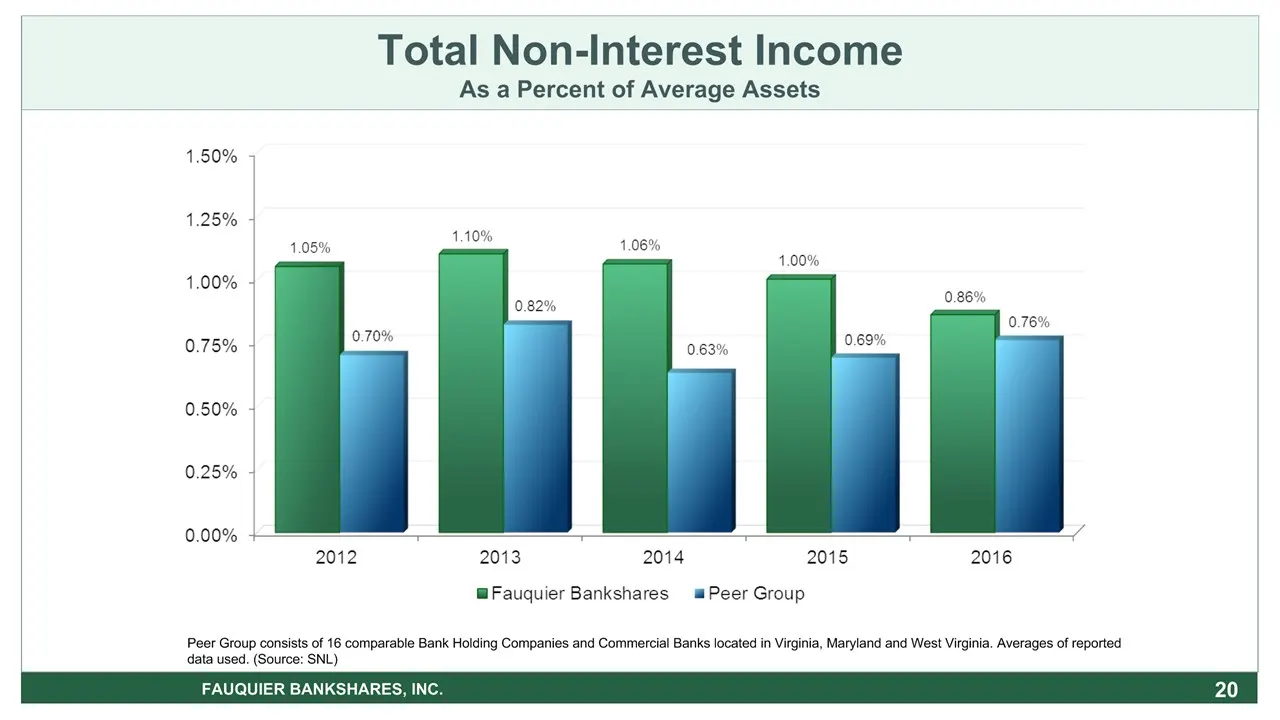
Slide 20: Total Non-Interest Income
Total Non-Interest IncomeAs a Percent of Average Assets 20 FAUQUIER BANKSHARES, INC. Peer Group consists of 16 comparable Bank Holding Companies and Commercial Banks located in Virginia, Maryland and West Virginia. Averages of reported data used. (Source: SNL)
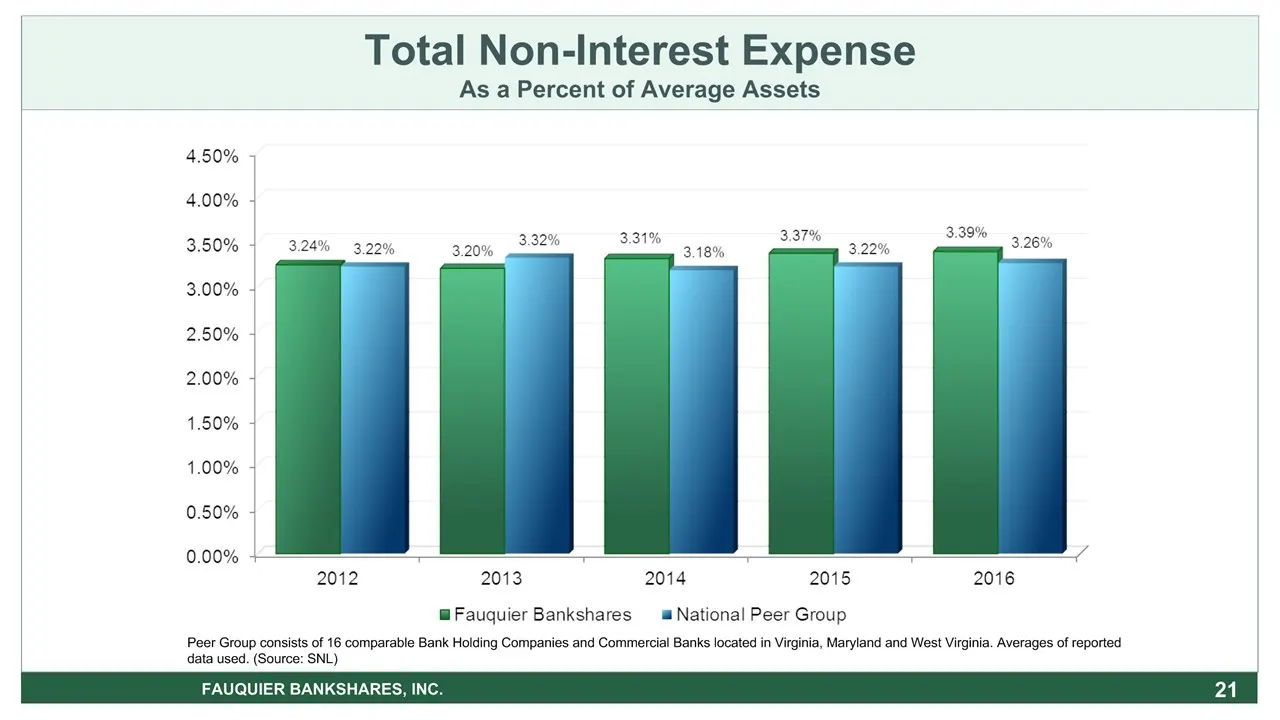
Slide 21: Total Non-Interest Expense
Total Non-Interest ExpenseAs a Percent of Average Assets 21 FAUQUIER BANKSHARES, INC. Peer Group consists of 16 comparable Bank Holding Companies and Commercial Banks located in Virginia, Maryland and West Virginia. Averages of reported data used. (Source: SNL)
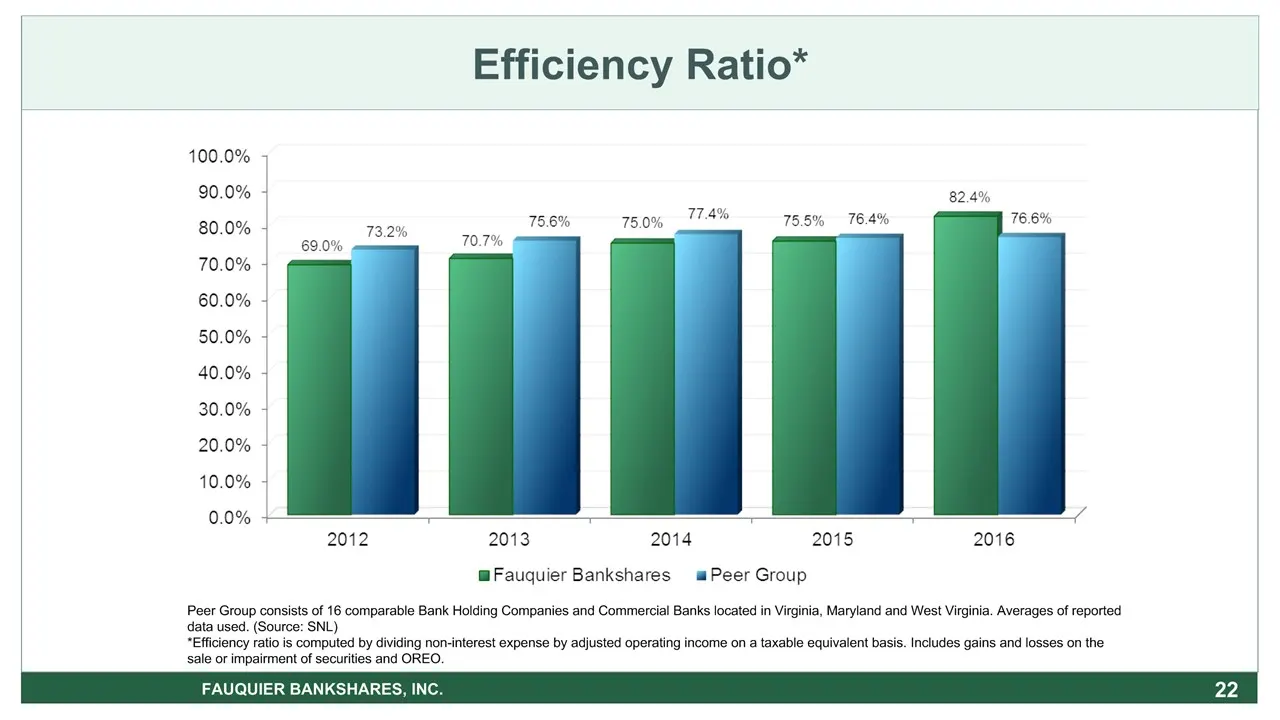
Slide 22: Efficiency Ratio
Efficiency Ratio* * Peer Group consists of 16 comparable Bank Holding Companies and Commercial Banks located in Virginia, Maryland and West Virginia. Averages of reported data used. (Source: SNL) *Efficiency ratio is computed by dividing non-interest expense by adjusted operating income on a taxable
Slide 23: FAUQUIER BANKSHARES, INC. 23
FAUQUIER BANKSHARES, INC. 23
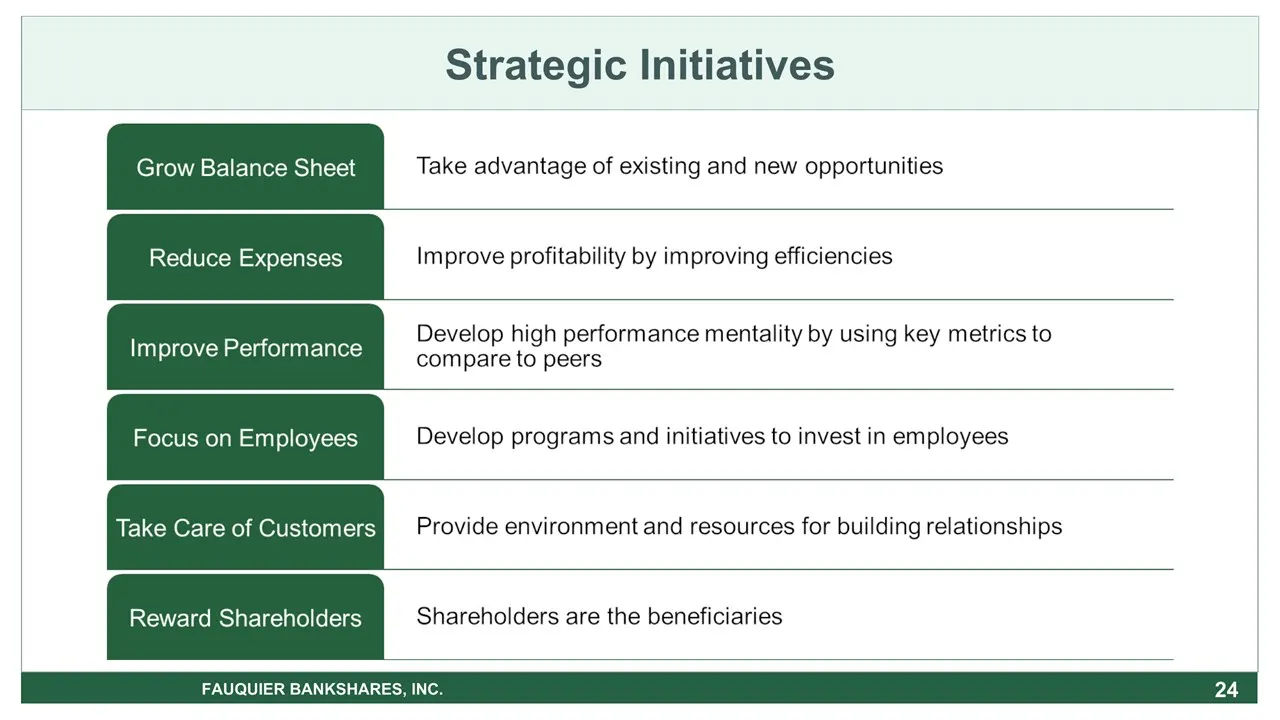
Slide 24: Strategic Initiatives
* Strategic Initiatives FAUQUIER BANKSHARES, INC.
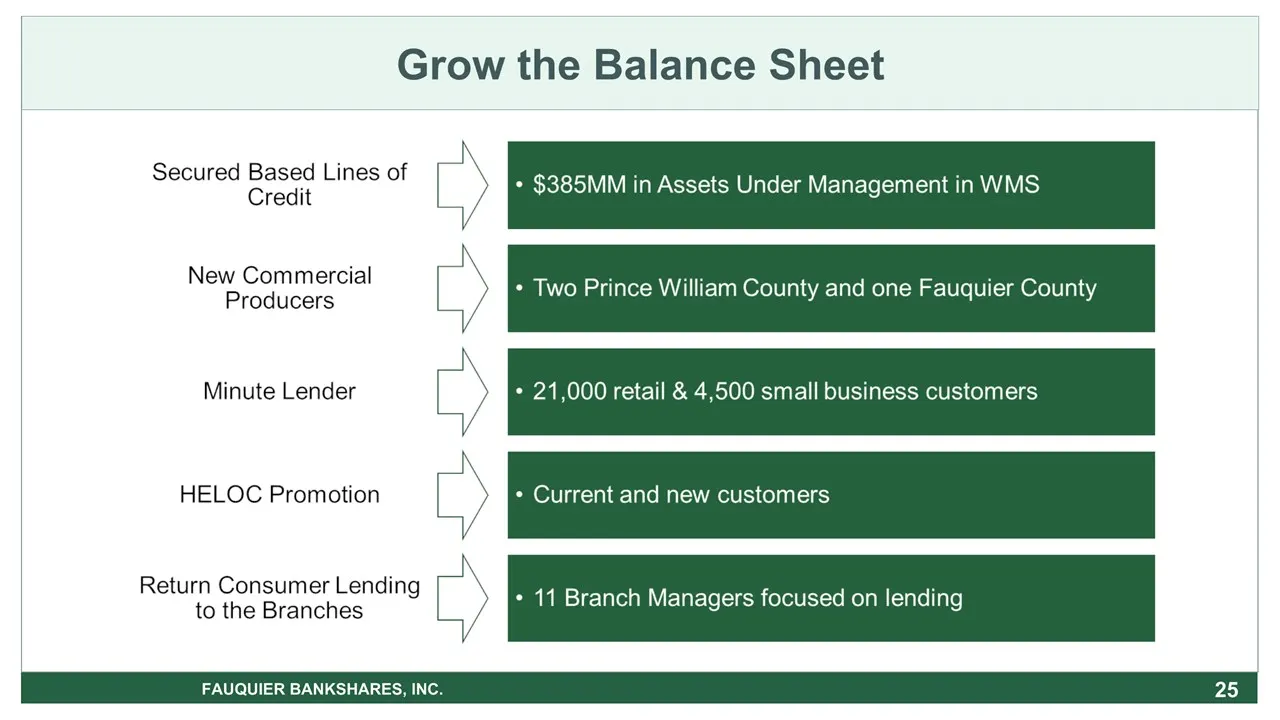
Slide 25: Grow the Balance Sheet
* Grow the Balance Sheet FAUQUIER BANKSHARES, INC.
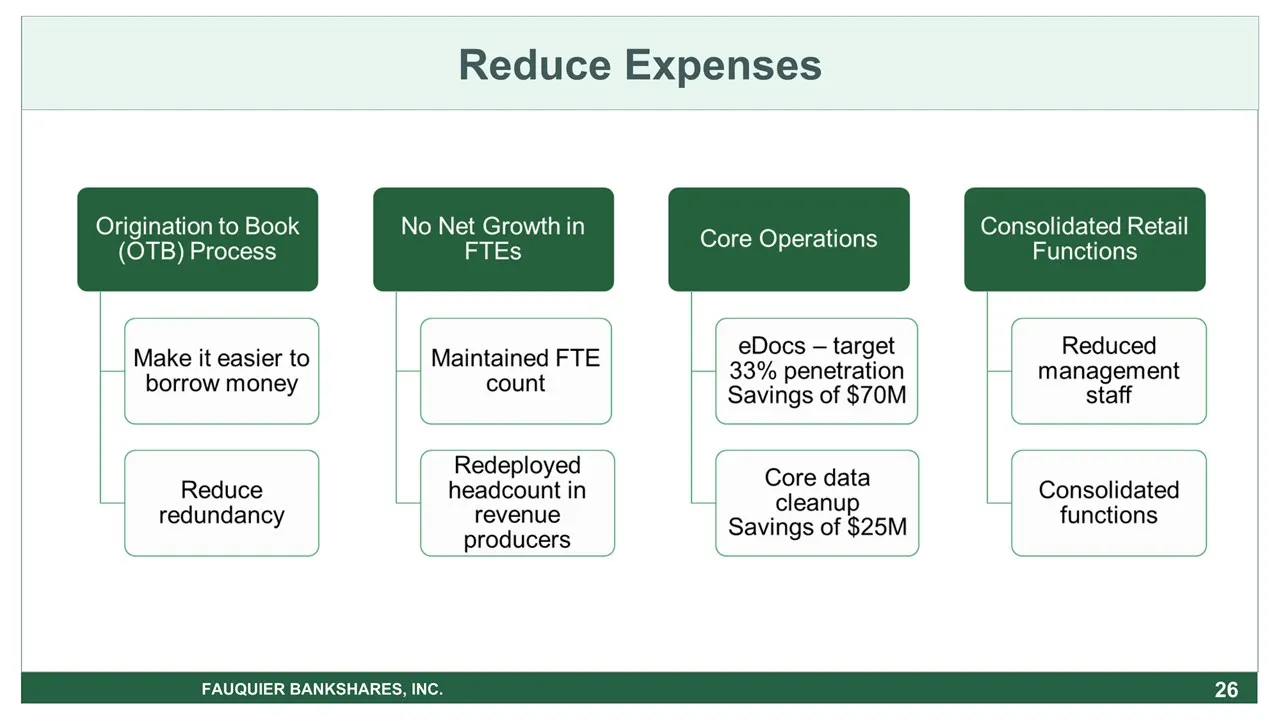
Slide 26: Reduce Expenses
* Reduce Expenses FAUQUIER BANKSHARES, INC.
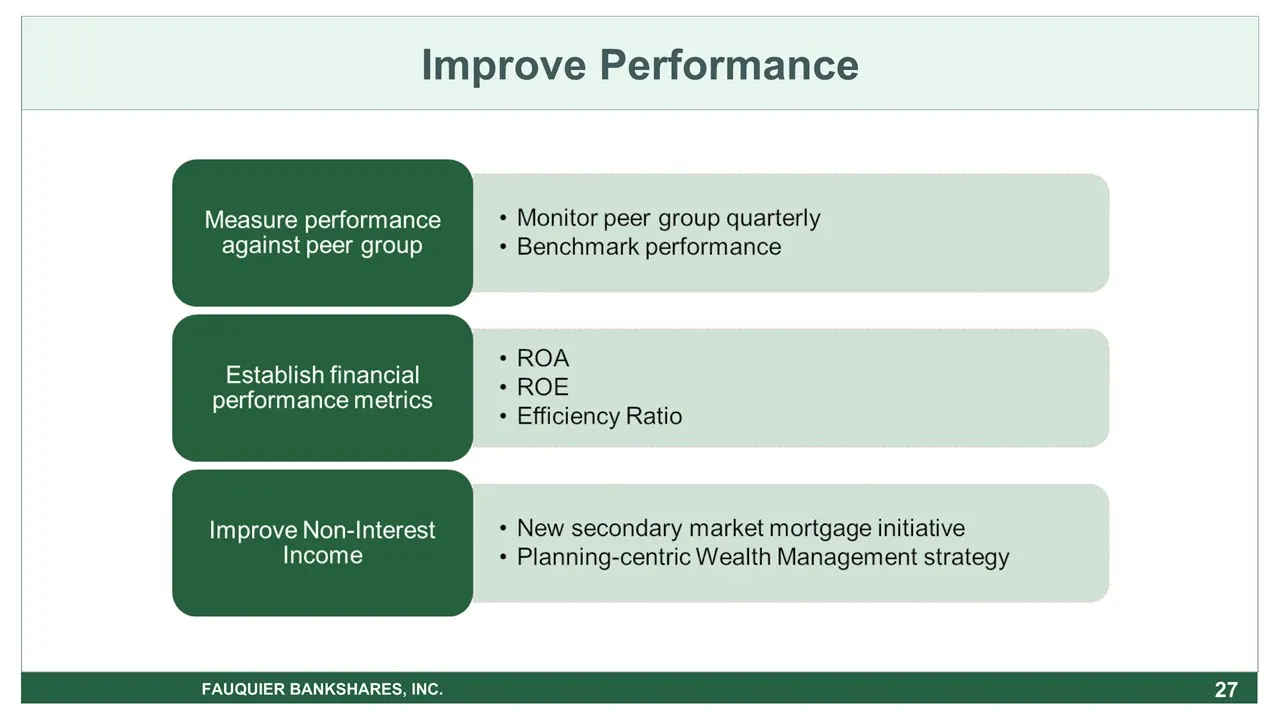
Slide 27: Improve Performance
* Improve Performance FAUQUIER BANKSHARES, INC.
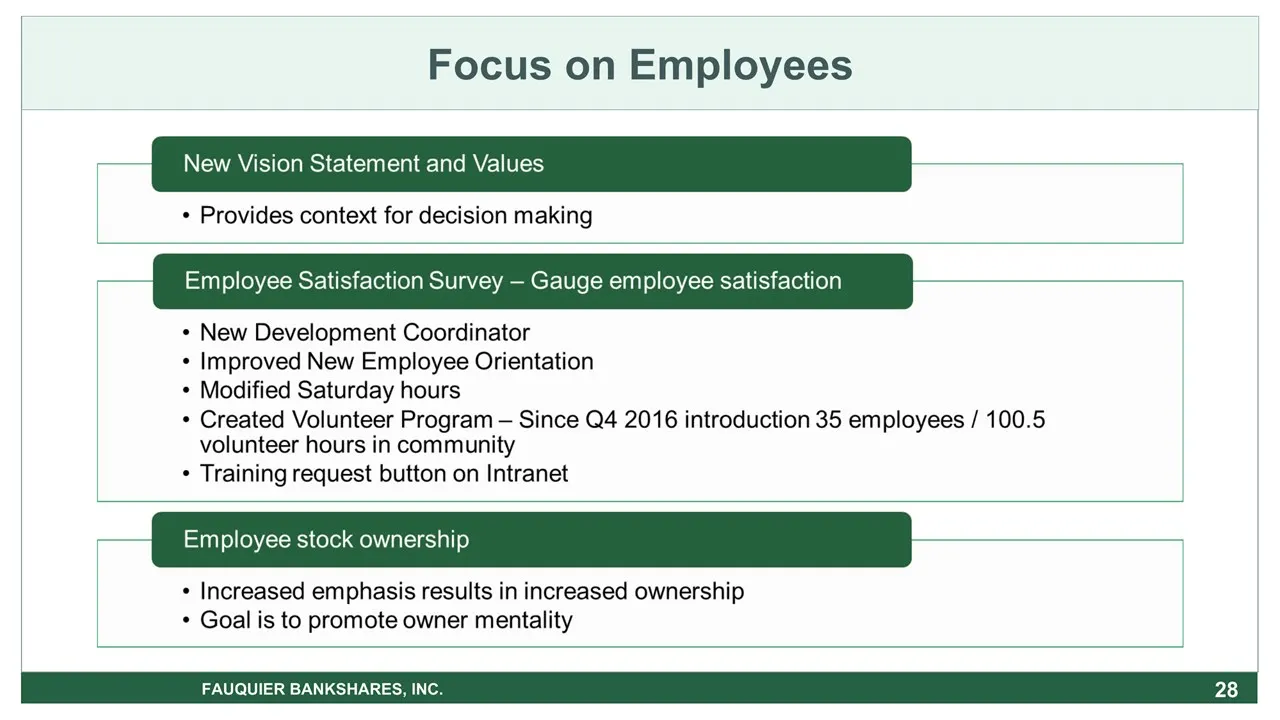
Slide 28: Focus on Employees
* Focus on Employees FAUQUIER BANKSHARES, INC.
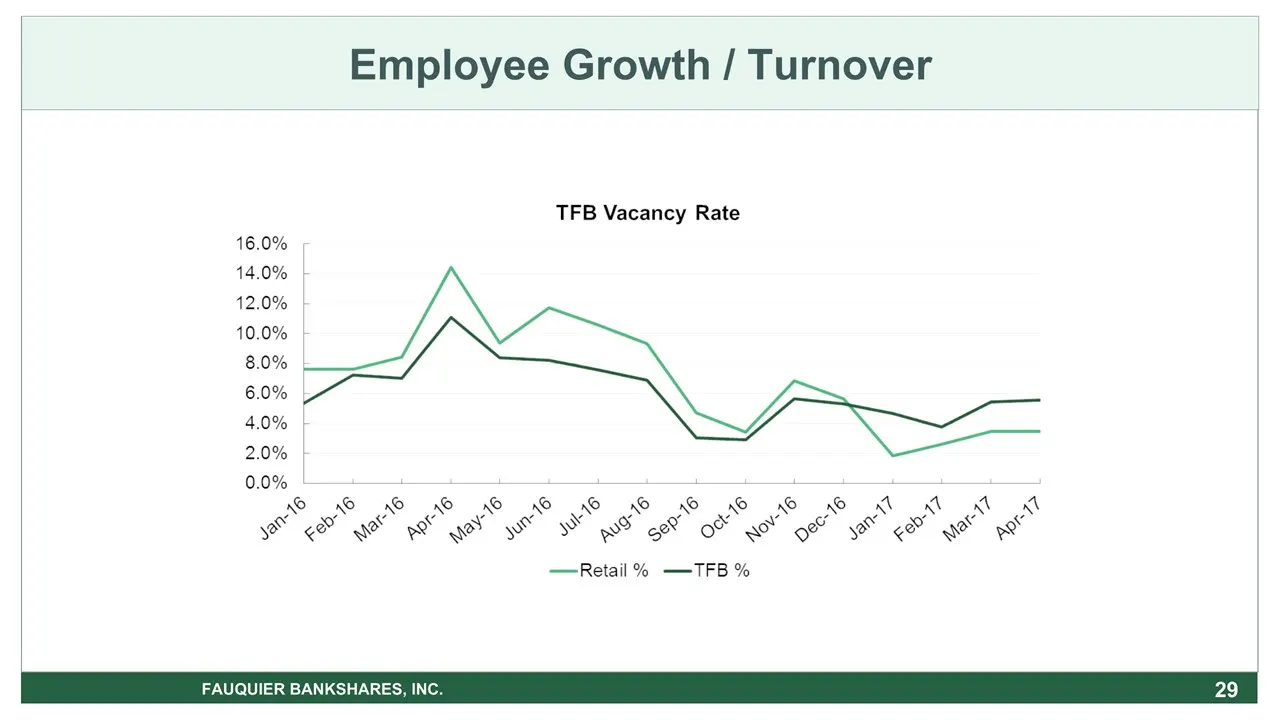
Slide 29: Employee Growth / Turnover
* Employee Growth / Turnover FAUQUIER BANKSHARES, INC.
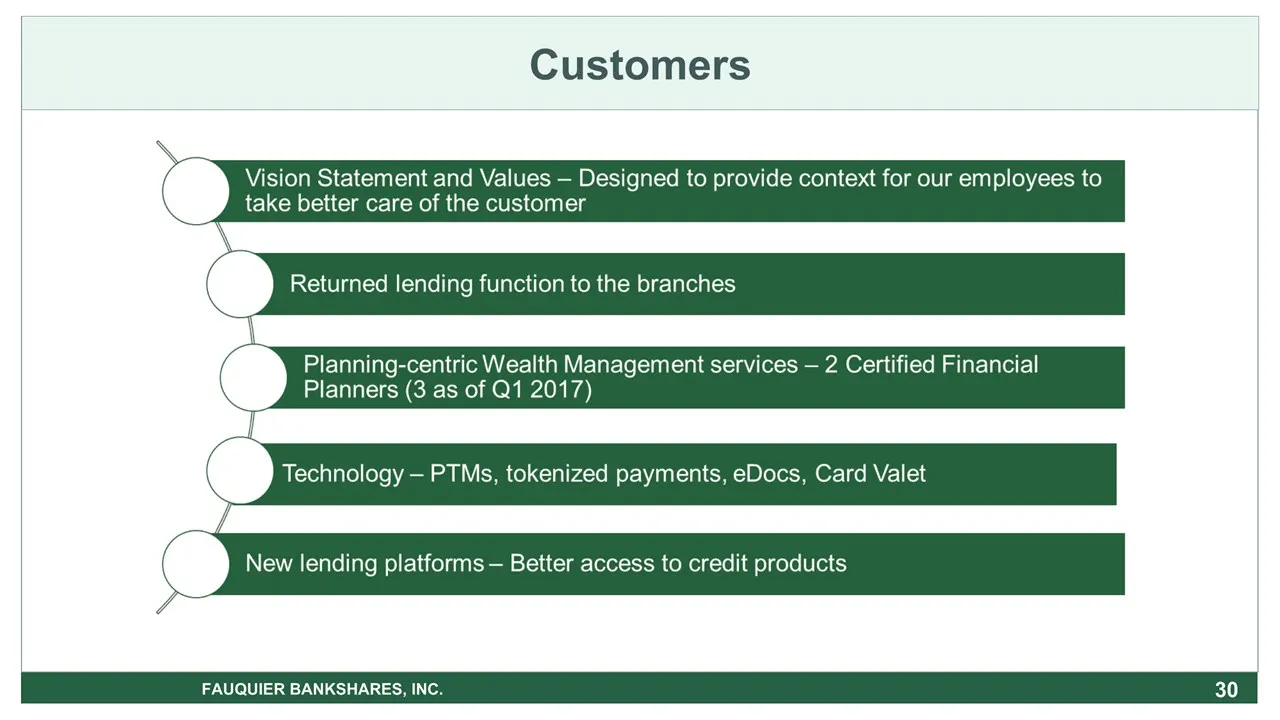
Slide 30: Customers
* Customers FAUQUIER BANKSHARES, INC.
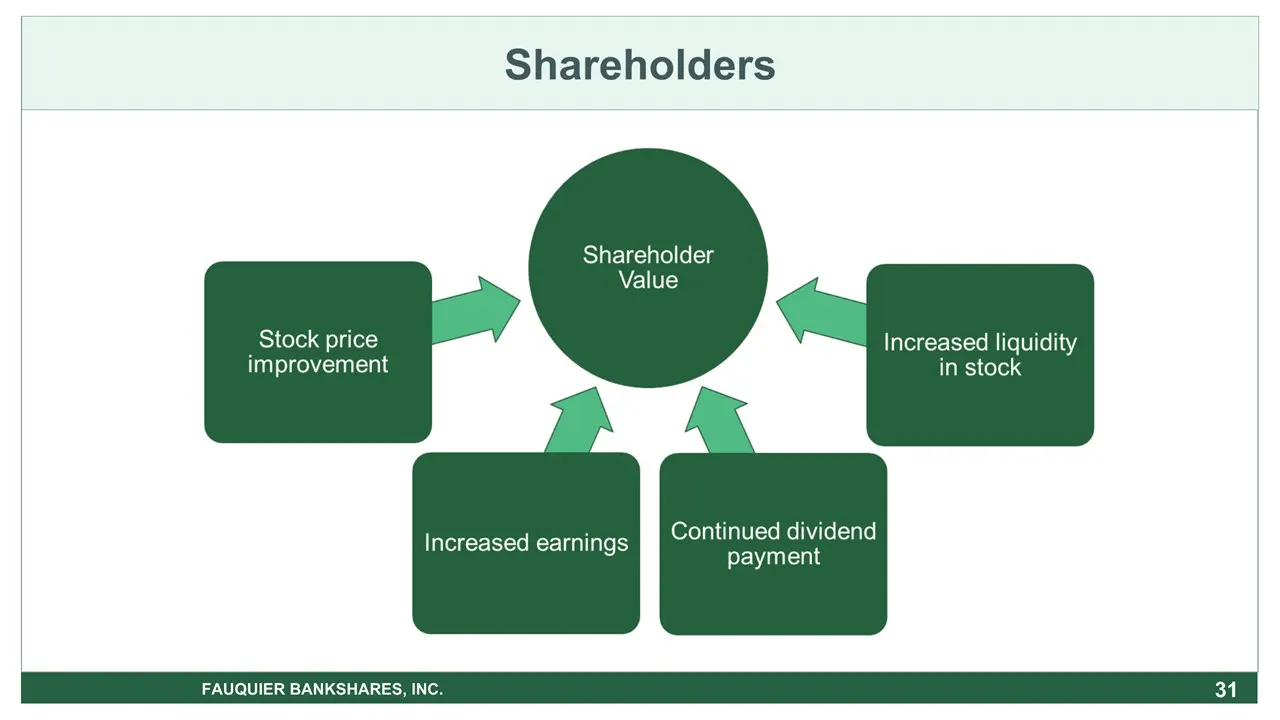
Slide 31: Shareholders
* Shareholders FAUQUIER BANKSHARES, INC.
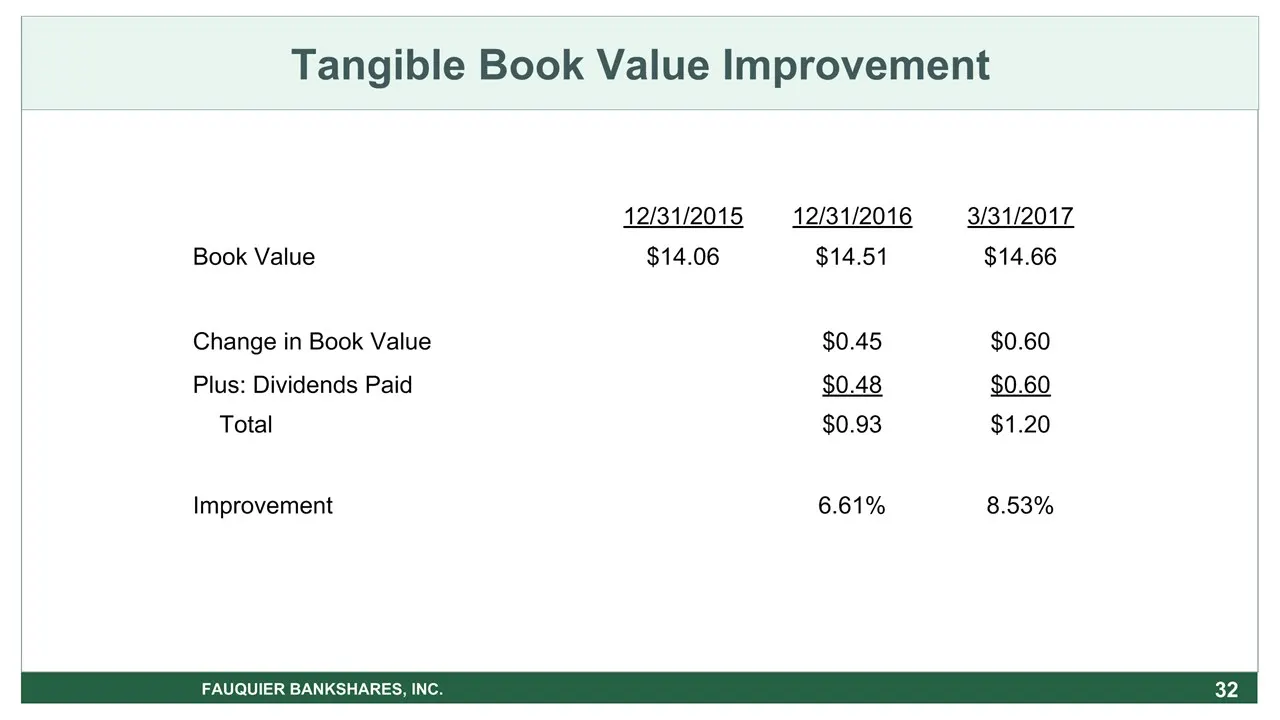
Slide 32: Tangible Book Value Improvement
* Tangible Book Value Improvement FAUQUIER BANKSHARES, INC. 12/31/2015 12/31/2016 3/31/2017 Book Value $14.06 $14.51 $14.66 Change in Book Value $0.45 $0.60 Plus: Dividends Paid $0.48 $0.60 Total $0.93 $1.20 Improvement 6.61% 8.53%
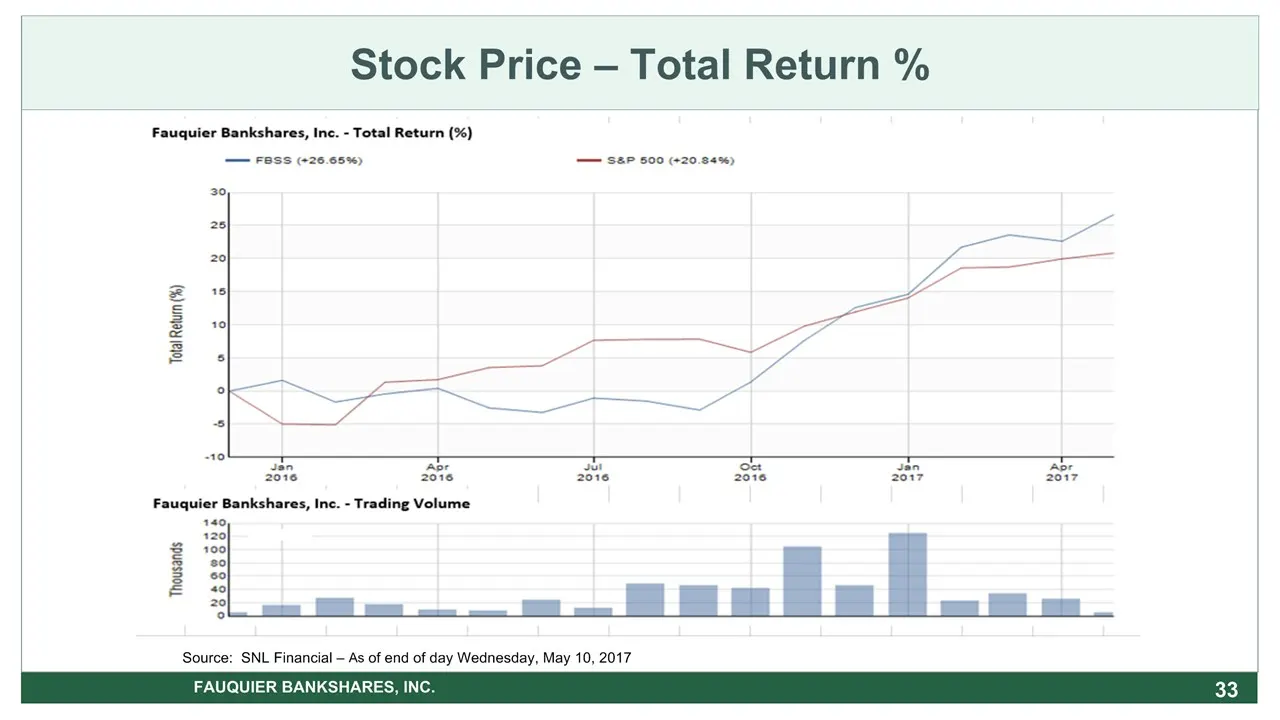
Slide 33: Stock Price – Total Return %
Stock Price – Total Return % 33 FAUQUIER BANKSHARES, INC. Source: SNL Financial – As of end of day Wednesday, May 10, 2017
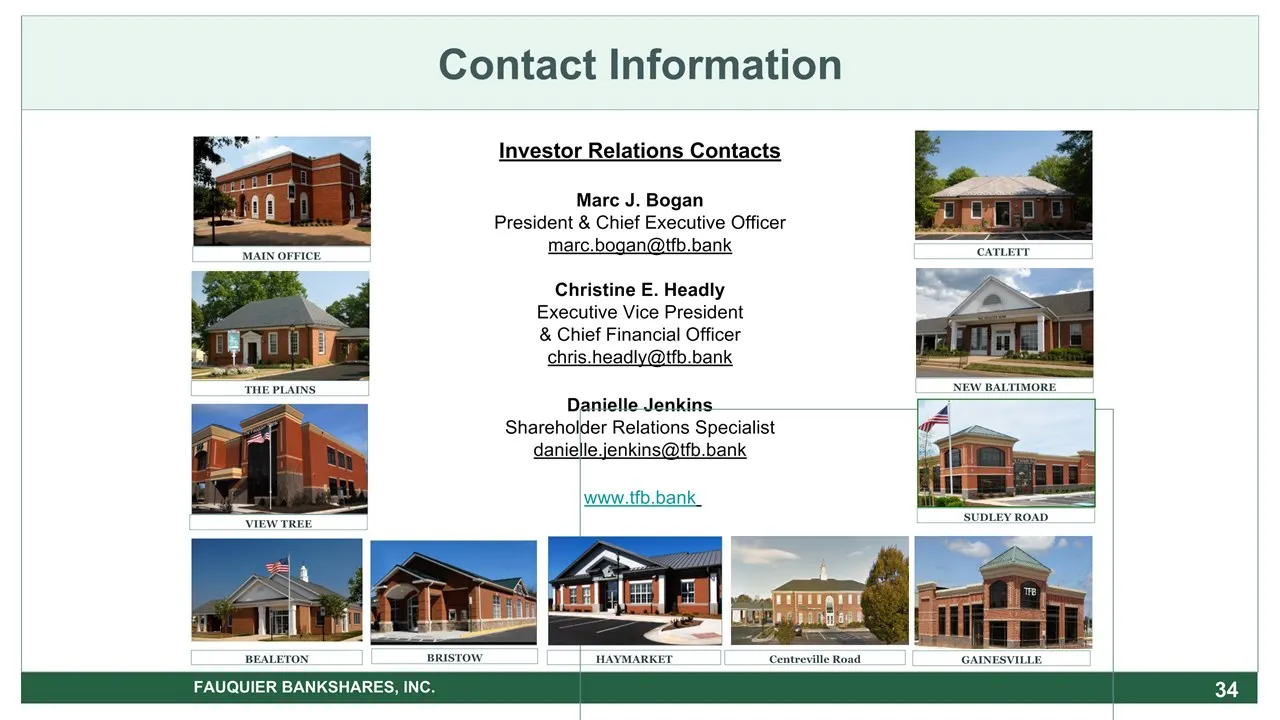
Slide 34: Investor Relations Contacts
Investor Relations ContactsMarc J. BoganPresident & Chief Executive Officer marc.bogan@tfb.bankChristine E. HeadlyExecutive Vice President& Chief Financial Officerchris.headly@tfb.bankDanielle JenkinsShareholder Relations Specialistdanielle.jenkins@tfb.bankwww.tfb.bank MAIN OFFICE THE PLAINS VIEW TR
Source: SEC EDGAR · 8-K filed May 16, 2017
More decks from Fauquier Bankshares Inc
 Merger or Acquisition (October 2020)20 slides · Oct 1, 2020
 Shareholder Meeting (May 2020)30 slides · May 19, 2020
 Investor Presentation (August 2019)20 slides · Aug 7, 2019
 Shareholder Meeting (May 2019)31 slides · May 21, 2019
 Investor Presentation (October 2018)18 slides · Oct 22, 2018
 Shareholder Meeting (May 2018)33 slides · May 15, 2018