WellCare Health Plans — Investor Presentation (March 2014)
16 slides from WellCare Health Plans's investor presentation, Mar 3, 2014

Slide 1: WellCare Health Plans Management Presentation
Exhibit 99.4 NWAwellCare WellCare Health Plans Management Presentation March 2014
Slide 2: Cautionary Statement
Cautionary Statement This presentation contains “forward-looking” statements that are made pursuant to the Safe Harbor provisions of the Private Securities Litigation Reform Act of 1995. Statements that are predictive in nature, that depend upon or refer to future events or conditions, or that inclu
Slide 3: What We Do
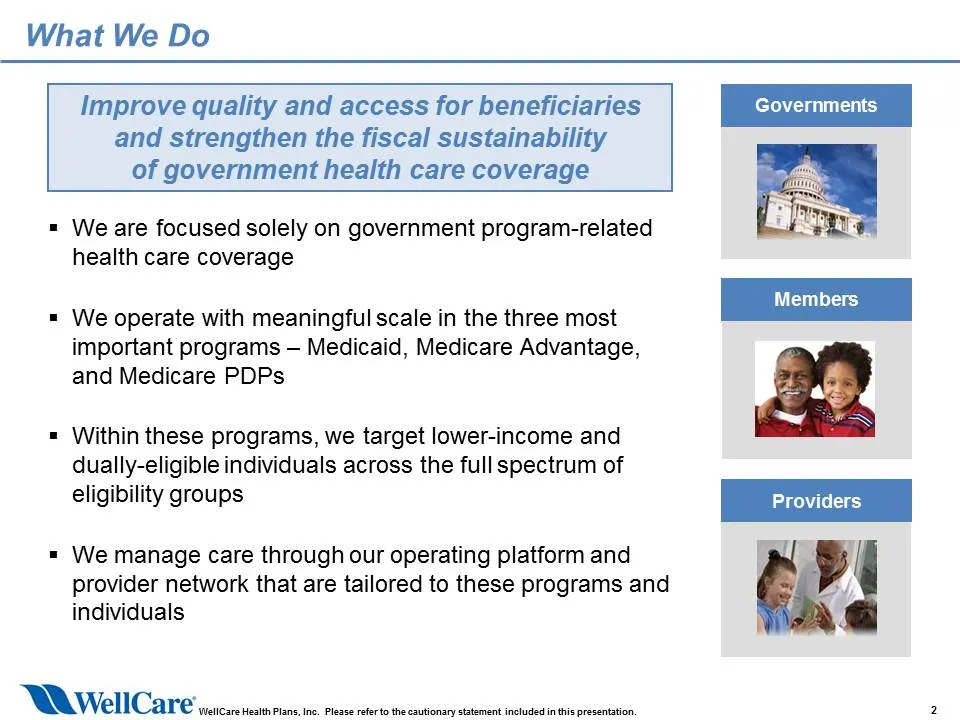
What We Do Improve quality and access for beneficiaries and strengthen the fiscal sustainability of government health care coverage = We are focused solely on government program-related health care coverage = We operate with meaningful scale in the three most | members| important programs — Medicaid
Slide 4: Industry Growth Profile
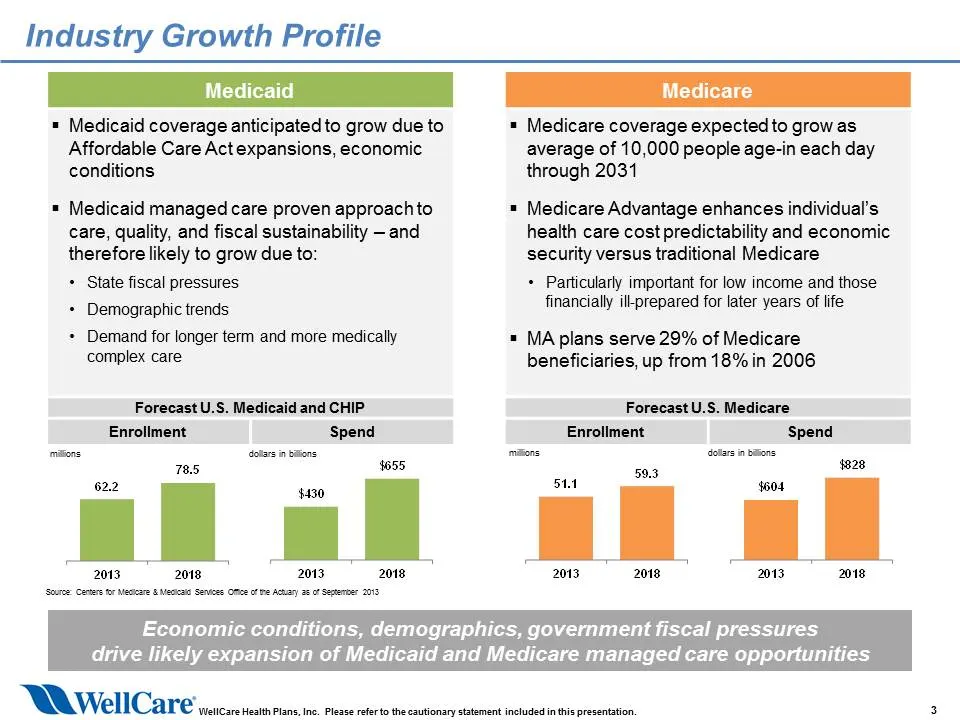
Industry Growth Profile « Medicaid coverage anticipated to grow due to Affordable Care Act expansions, economic conditions = Medicaid managed care proven approachto care, quality, and fiscal sustainability — and therefore likely to grow due to: + State fiscal pressures + Demographic trends + Demand
Slide 5: Three Product Strategy
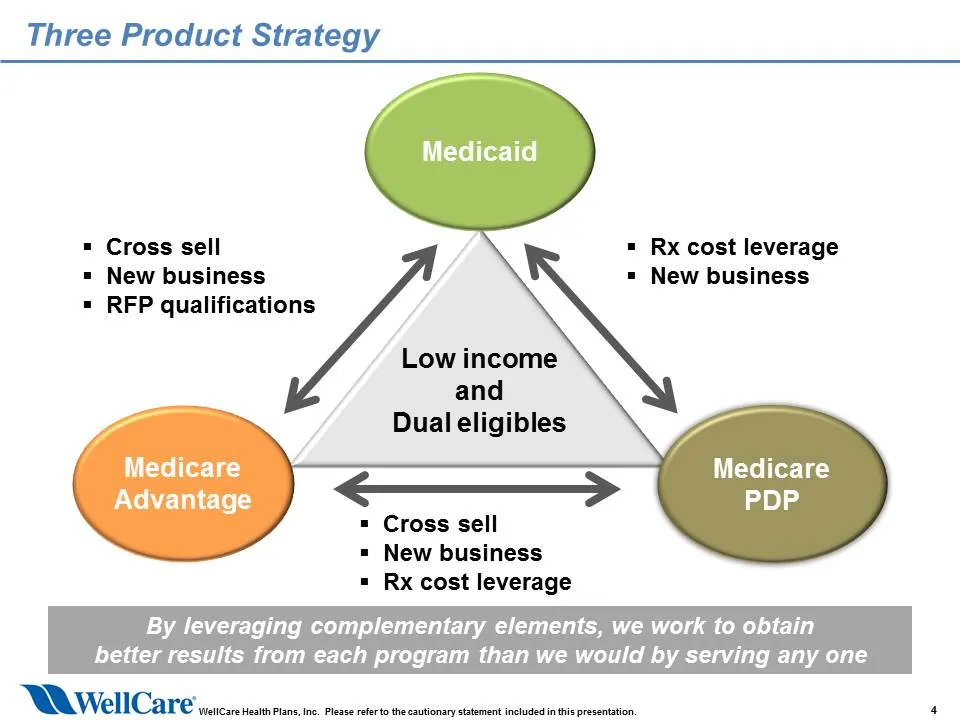
Three Product Strategy Medicaid = Cross sell = New business = RFP qualifications = Rx cost leverage = New business Low income and Dual eligibles Medicare Medicare Advantage < > PDP = Cross sell = New business = Rx cost leverage By leveraging complementary elements, we work to obtain better results f
Slide 6: Approach to Growth
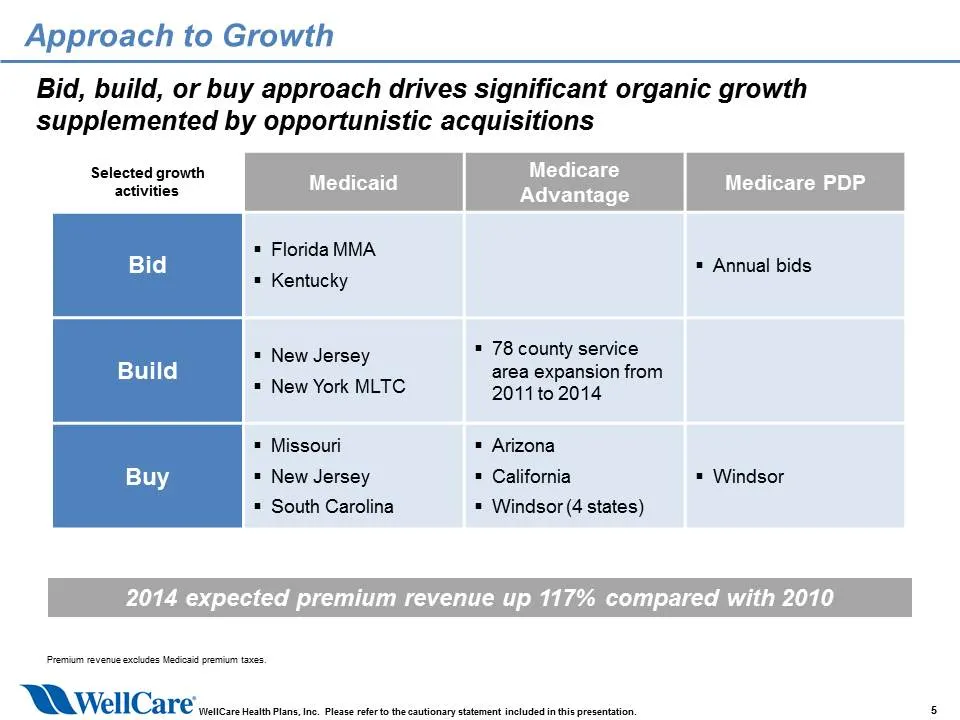
Approach to Growth Bid, build, or buy approach drives significant organic growth supplemented by opportunistic acquisitions Selected growth Medicare a Medicai activities Advantage = Florida MMA = Annual bids = Kentucky = New Jersey = 78 county service area expansion from = New York MLTC 2011 to 2014
Slide 7: Operating Model
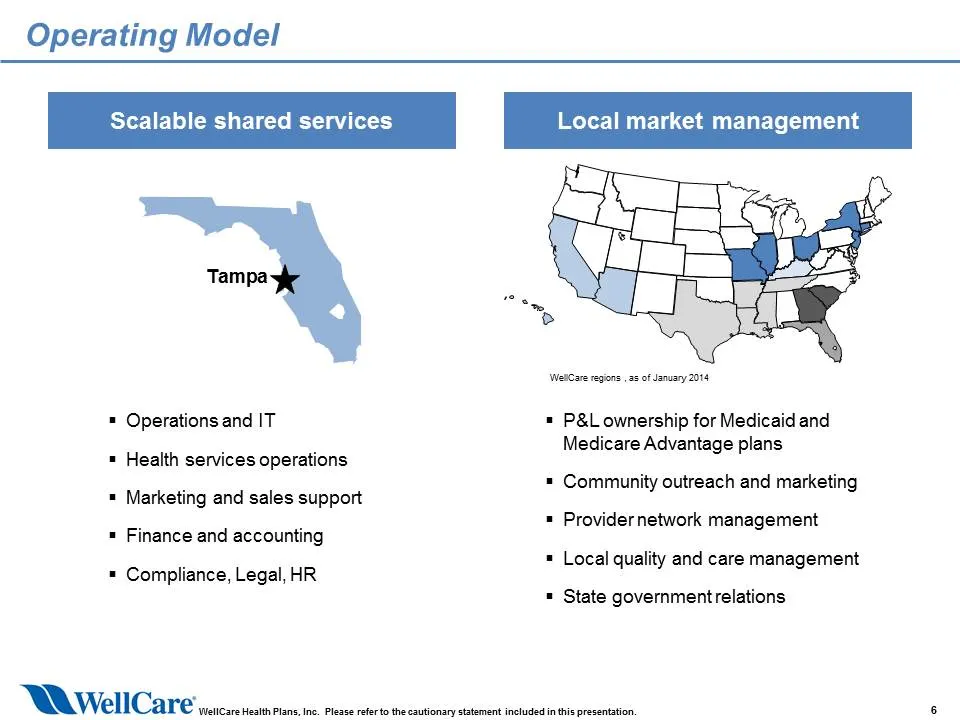
Operating Model Scalable shared services Local market management Tampa WeaCare regions , 2s of January 2014 Operations and IT = P&L ownership for Medicaid and Medicare Advantage plans Health services operations Community outreach and marketing Marketing and sales support Provider network management
Slide 8: Company Profile
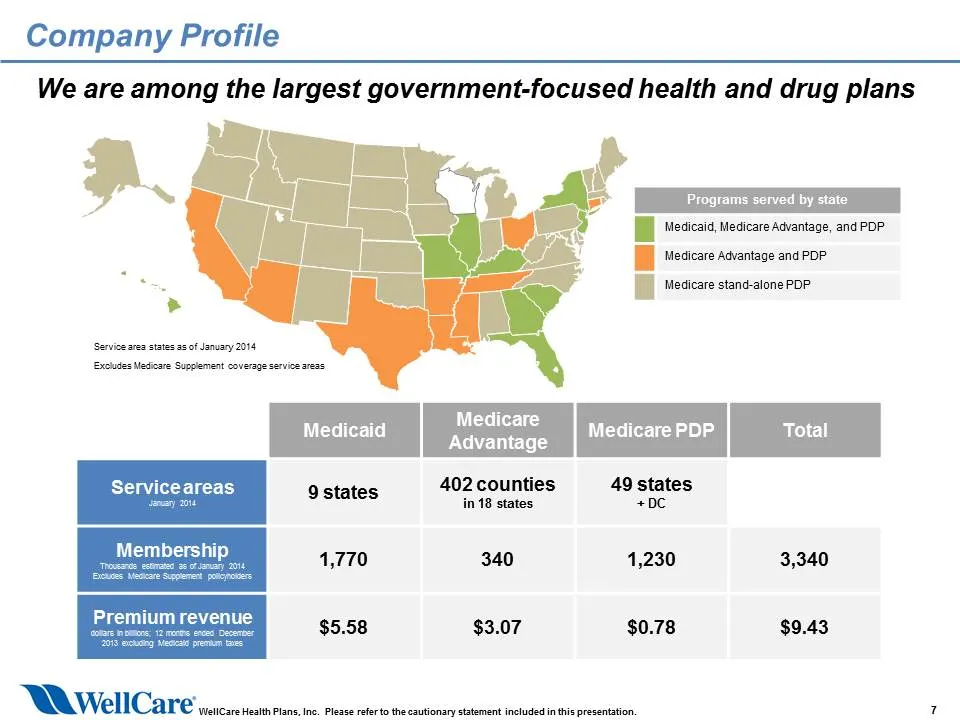
Company Profile We are among the largest government-focused health and drug plans Programs served by state fl Medicaid, Medicare Advantage, and PDP | | Medicare Advantage and PDP [7 Wesicare stand-alone POP: Excdes Medicare Suplement coverage servan areas y Medicaid Medicare | medicare PDP Total Adv
Slide 9: Medicaid Profile
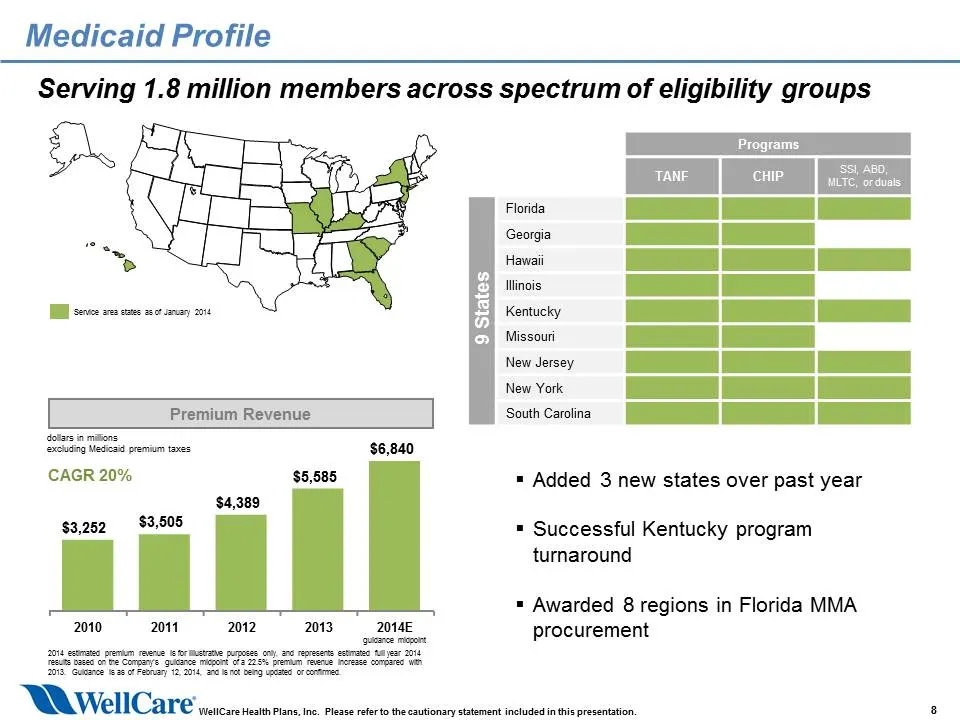
Medicaid Profile Serving 1.8 million members across spectrum of eligibility groups Sk Ti secs we tes cain 2 Premium Revenue colar in mons ‘eccuing Medioaid premium taxes $6,840 CAGR 20% $4,389 $3,252 $3,505 ‘gumree bis Guanes is of Peonar) 12 20 we et beng peas eer We Care wescoctssmouns ne peters n
Slide 10: Medicare Advantage Profile
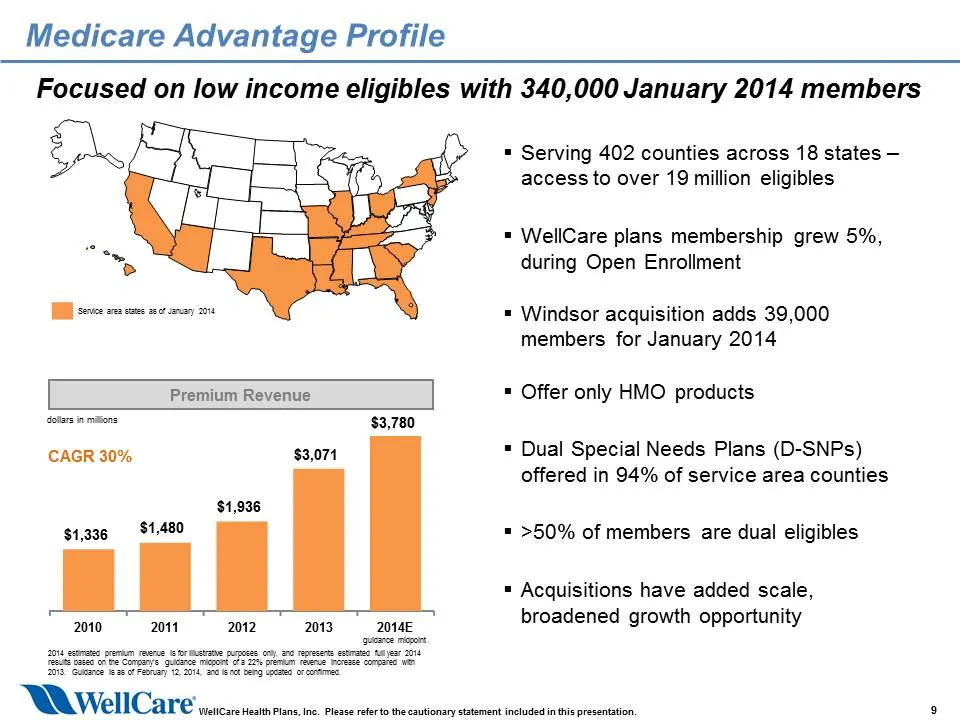
Medicare Advantage Profile Focused on low income eligibles with 340,000 January 2014 members = Serving 402 counties across 18 states — access to over 19 million eligibles = WellCare plans membership grew 5%, during Open Enrollment (0 eee cerca ony mt = Windsor acquisition adds 39,000 members for Jan
Slide 11: Prescription Drug Plans Profile
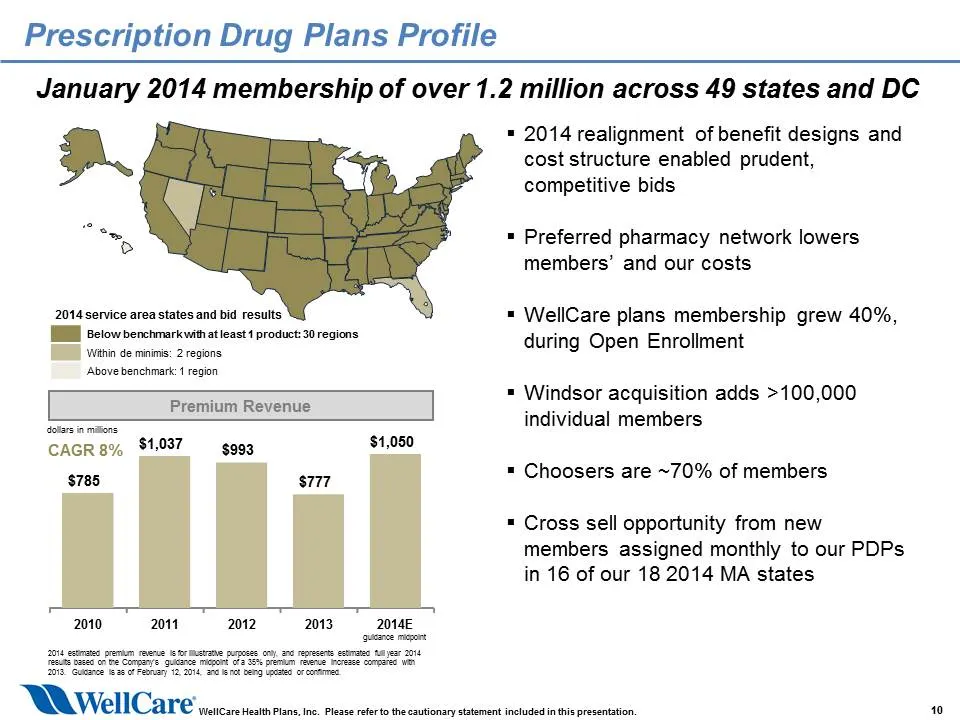
Prescription Drug Plans Profile January 2014 membership of over 1.2 million across 49 states and DC = 2014 realignment of benefit designs and cost structure enabled prudent, competitive bids = Preferred pharmacy network lowers members’ and our costs 2014 service area states and bid results = WellCar
Slide 12: Growth and Diversification
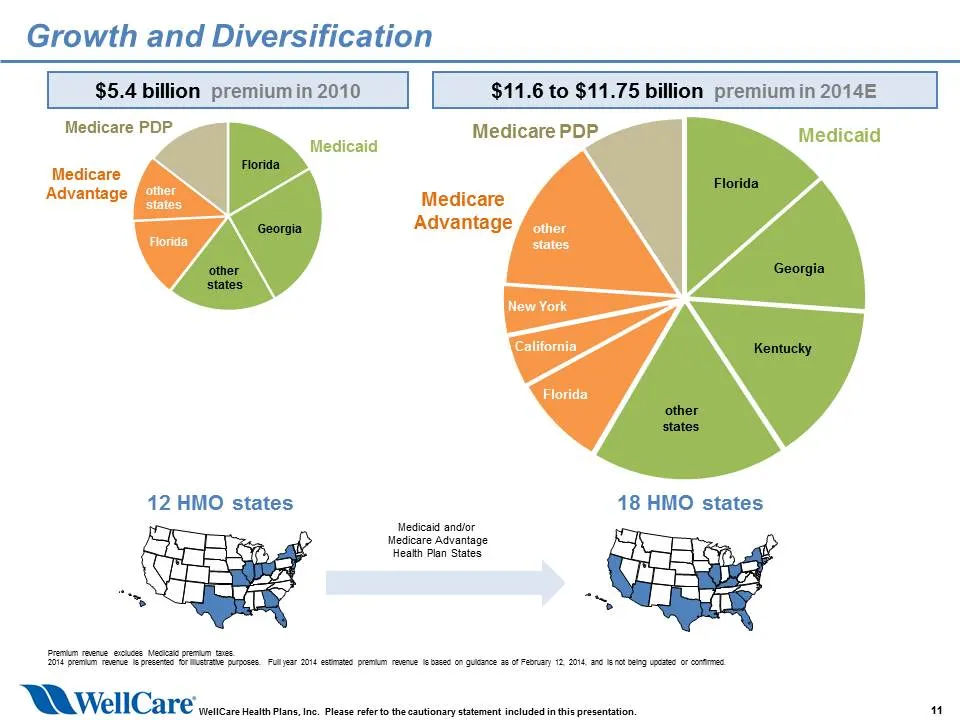
Growth and Diversification $5.4 billion premiumin 2010 $11.6 to $11.75 billion premiumin 2014E Medicare PDP Medicare PDP. —_ Medicaid Medicaid Medicare ee AS Medicare WZ Advantage A 12 HMO states 18 HMO states Medicaid andior Medicare Advantage Heath Plan States ~~ “~y Prank mane siouce Mesias erin
Slide 13: Operating Performance and Outlook
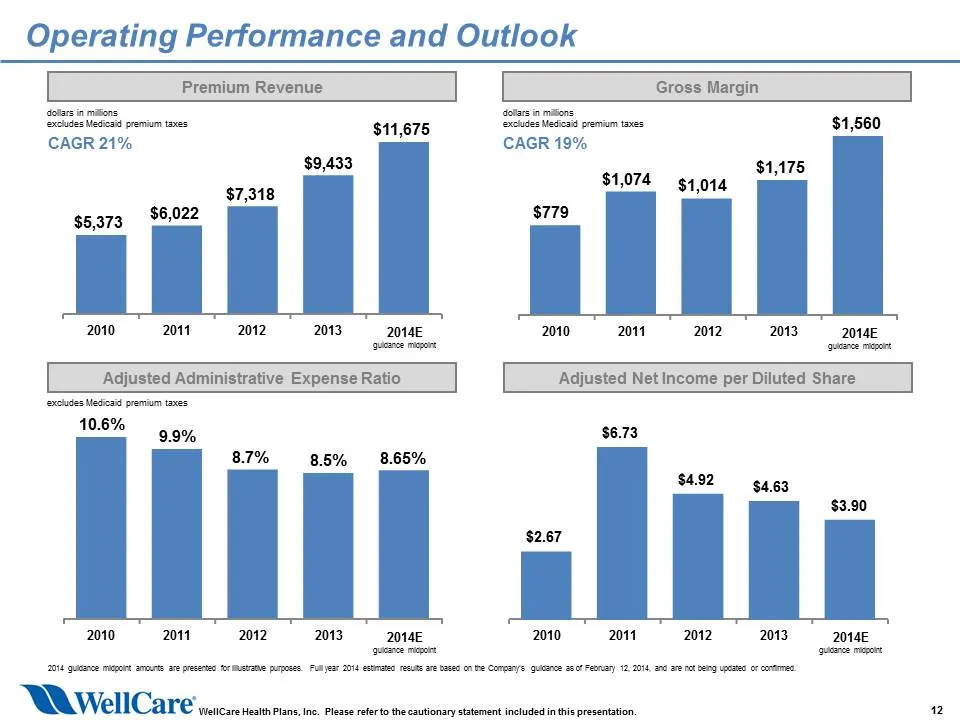
Operating Performance and Outlook Premium Revenue Gross Margin dolars in masons (Sccudes Medicaid premium tes CAGR 21% $11,675 $9,433 2010 2011 2012 2013 2014E detain mons de a premio teas $1,560 CAGR 19% $4,175 $1,074 g4 014 $779 2010 2011 2012 2013 2014E Adjusted Administrative Expense Ratio Adjus
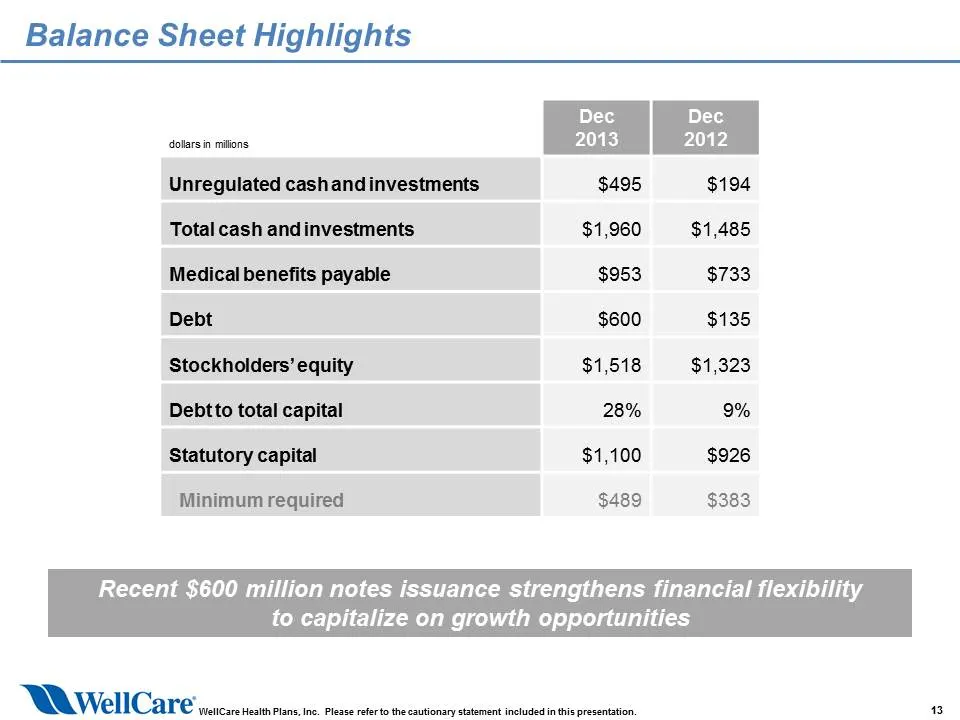
Slide 14: Balance Sheet Highlights
Balance Sheet Highlights Somers a mans (ea) Unregulated cash and investments $495 $194 Total cash andinvestments $1,960 $1,485 Medical benefits payable $953 $733 Debt $600 $135 Stockholders’ equity $1,518 $1,323 Debtto total capital 28% 9% Statutory capital $1,100 $926 Minimum required $489 $383 Rec
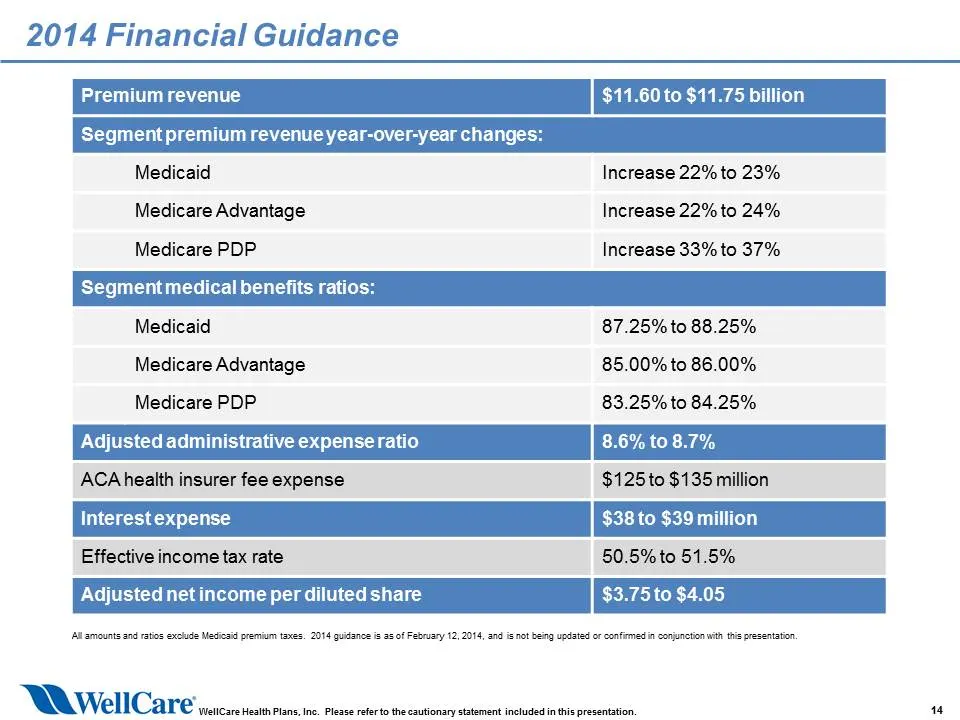
Slide 15: 2014 Financial Guidance
2014 Financial Guidance Segment premium revenue year-ove Medicaid Increase 22% to 23% Medicare Advantage Increase 22% to 24% Medicare PDP Increase 33% to 37% Medicaid 87.25% to 88.25% Medicare Advantage 85.00% to 86.00% Medicare PDP. 83.25% to 84.25% sted administrative expensera' ACA health insurer
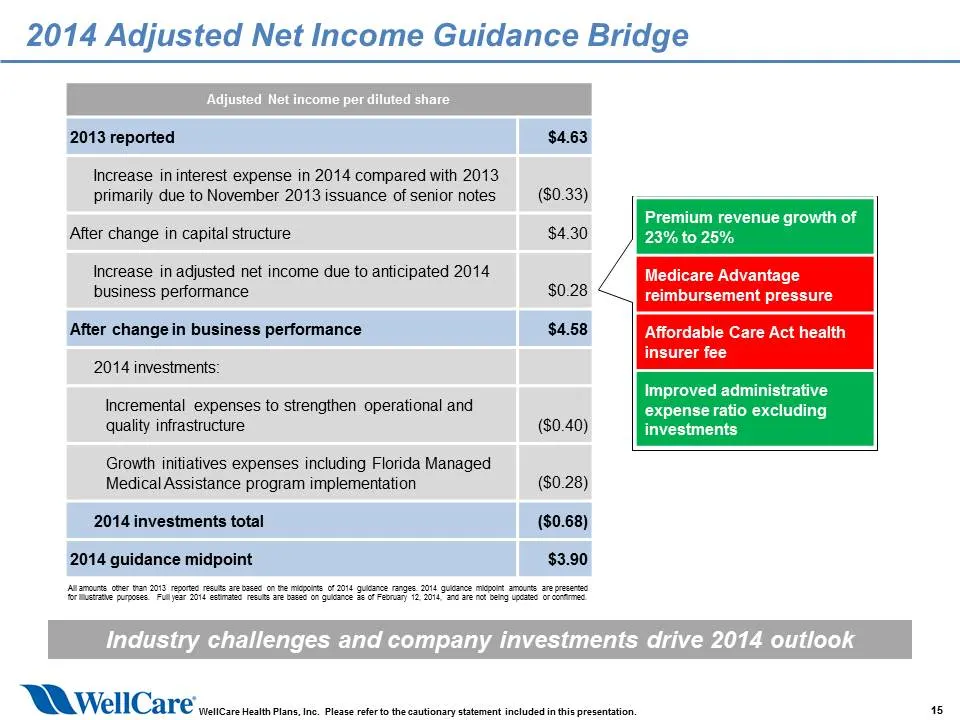
Slide 16: 2014 Adjusted Net Income Guidance Bridge
2014 Adjusted Net Income Guidance Bridge 2013 reported $4.63 Increase ininterest expense in 2014 compared with 2013 primarily due to November 2013 issuance of senior notes ($0.33) Premium revenue growth of After change in capital structure $4.30 23% to 25% Increase in adjusted net income due to anti
Source: SEC EDGAR · 8-K filed Mar 3, 2014
More decks from WellCare Health Plans Inc
 Wellcare — Investor Presentation (2026)13 slides · Oct 29, 2026
 WellCare of Kentucky — Provider Summit 202618 slides · Apr 3, 2026
 Wellcare — Investor Presentation (September 2025)13 slides · September 2025
 Wellcare — Investor Presentation (2025)78 slides · Jun 12, 2025
 Wellcare — Investor Presentation (2025)13 slides · Feb 8, 2025
 Wellcare — Investor Presentation (2025)13 slides · 2025