Timken Company (the) · NYSE:TKR
Timken Company (the) — The Timken Company — Investor Presentation (December 2013)
53 slides from Timken Company (the)'s investor presentation, December 2013
Slide 1: The Timken Company Investor Presentation December 2013
THE TIMKEN COMPANY Investor Presentation DECEMBER 2013
Slide 2: Forward-Looking Statements Safe Harbor and Non-GAAP Financial Information
FORWARD-LOOKING STATEMENTS SAFE HARBOR AND NON-GAAP FINANCIAL INFORMATION Certain statements in this presentation (including statements regarding the company's forecasts, estimates and expectations) that are not historical in nature are "forward-looking" statements within the meaning of the Private
Slide 3: Strategic Update & Review
TIMKEN Strategic Update & Review Stronger. Commitment. Stronger. Value. Stronger. Worldwide. Stronger. Together. | Stronger. By Design
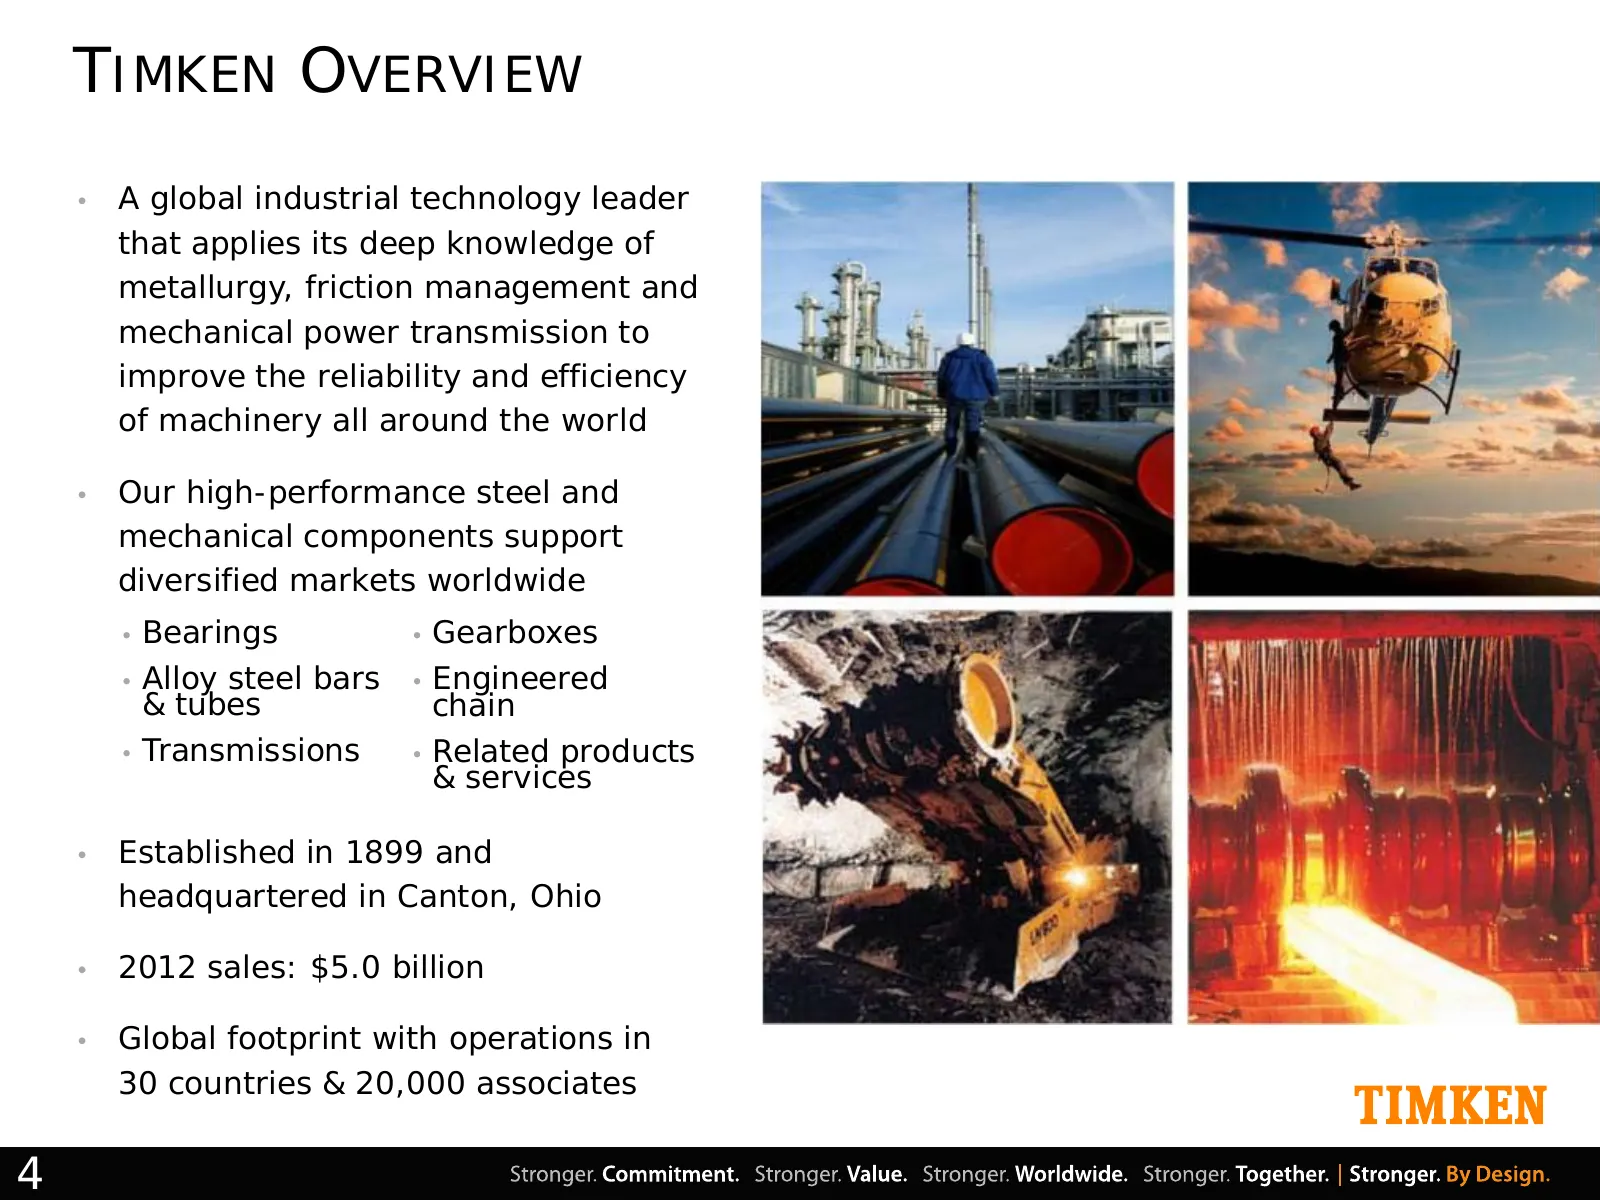
Slide 4: Timken Overview
TIMKEN OVERVIEW • A global industrial technology leader that applies its deep knowledge of metallurgy, friction management and mechanical power transmission to improve the reliability and efficiency of machinery all around the world • Our high-performance steel and mechanical components support dive
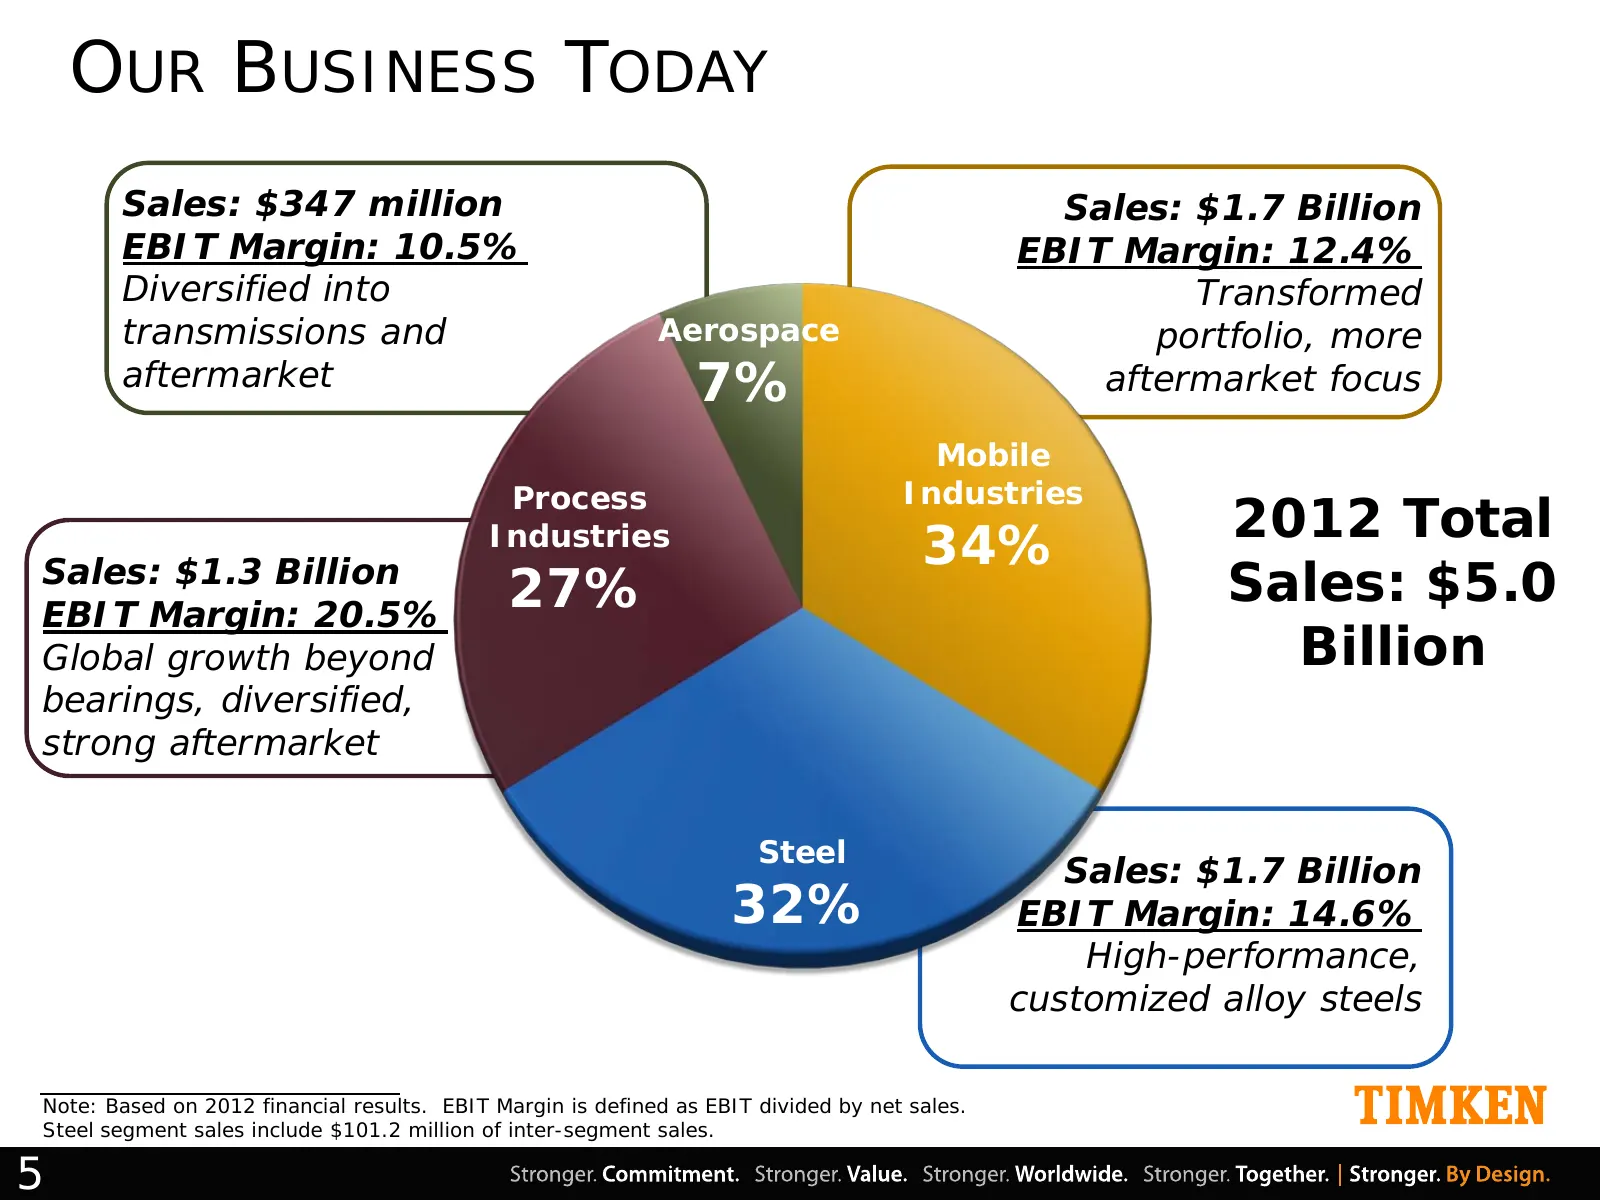
Slide 5: Our Business Today
OUR BUSINESS TODAY Sales: $347 million Sales: $1.7 Billion EBIT Margin: 10.5% EBIT Margin: 12.4% Diversified into Transformed transmissions and Aerospace portfolio, more aftermarket 7% aftermarket focus Mobile Process Industries 2012 Total Industries 34% Sales: $1.3 Billion EBIT Margin: 20.5% 27% Sa
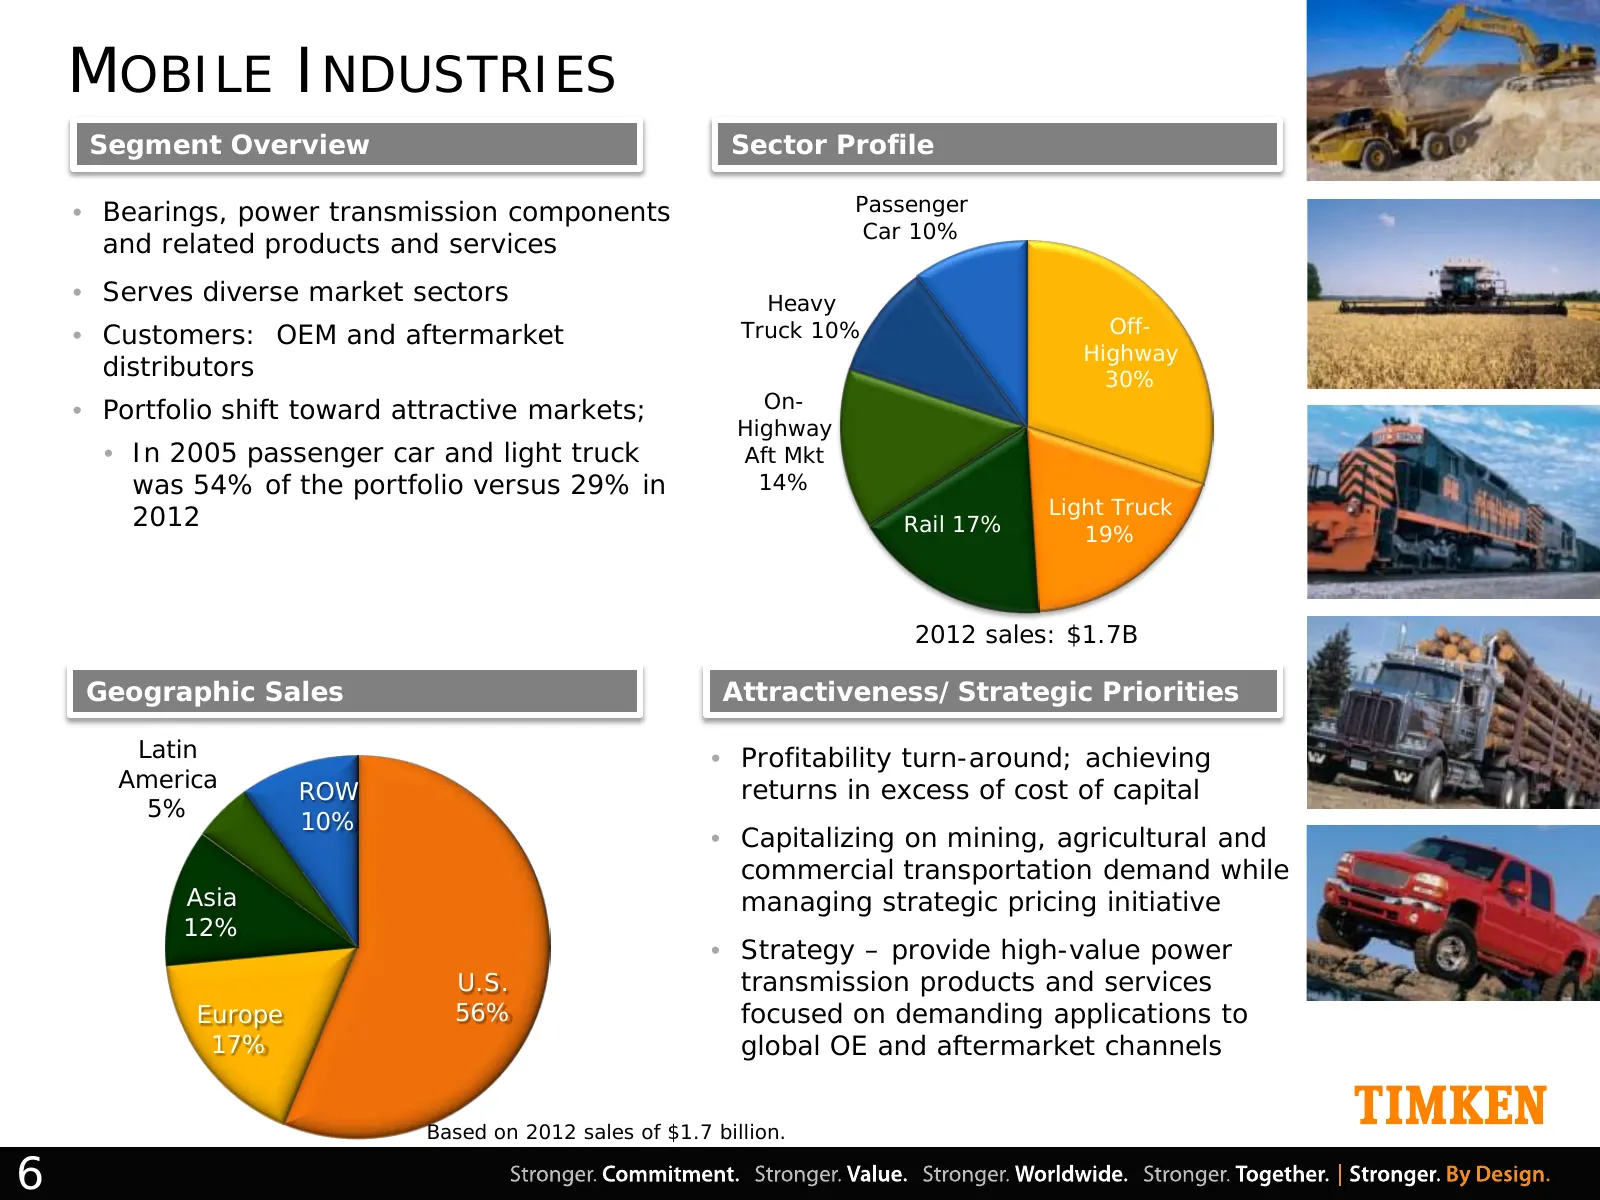
Slide 6: Mobile Industries
MOBILE INDUSTRIES Segment Overview Sector Profile • Bearings, power transmission components Passenger Car 10% and related products and services • Serves diverse market sectors Heavy • Customers: OEM and aftermarket Truck 10% Off- Highway distributors 30% • Portfolio shift toward attractive markets;
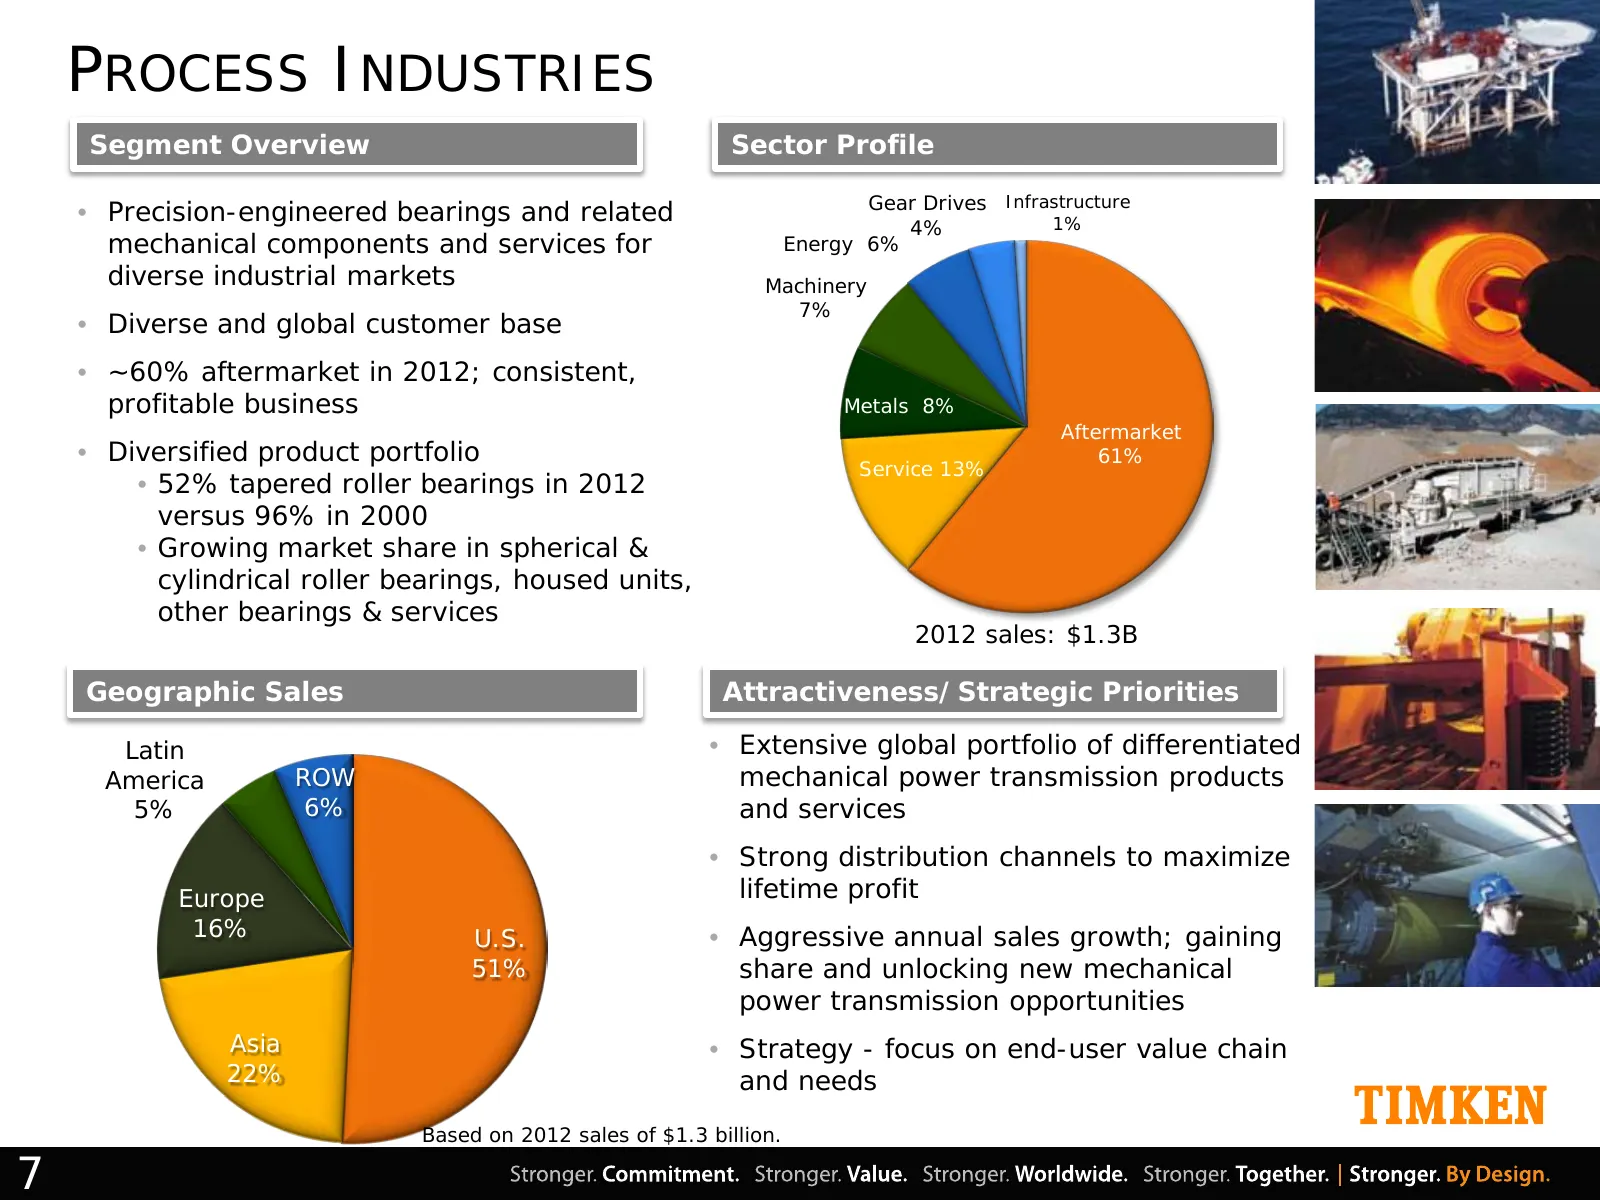
Slide 7: Process Industries
PROCESS INDUSTRIES Segment Overview Sector Profile Gear Drives Infrastructure • Precision-engineered bearings and related 1% 4% mechanical components and services for Energy 6% diverse industrial markets Machinery 7% • Diverse and global customer base • ~60% aftermarket in 2012; consistent, profitab
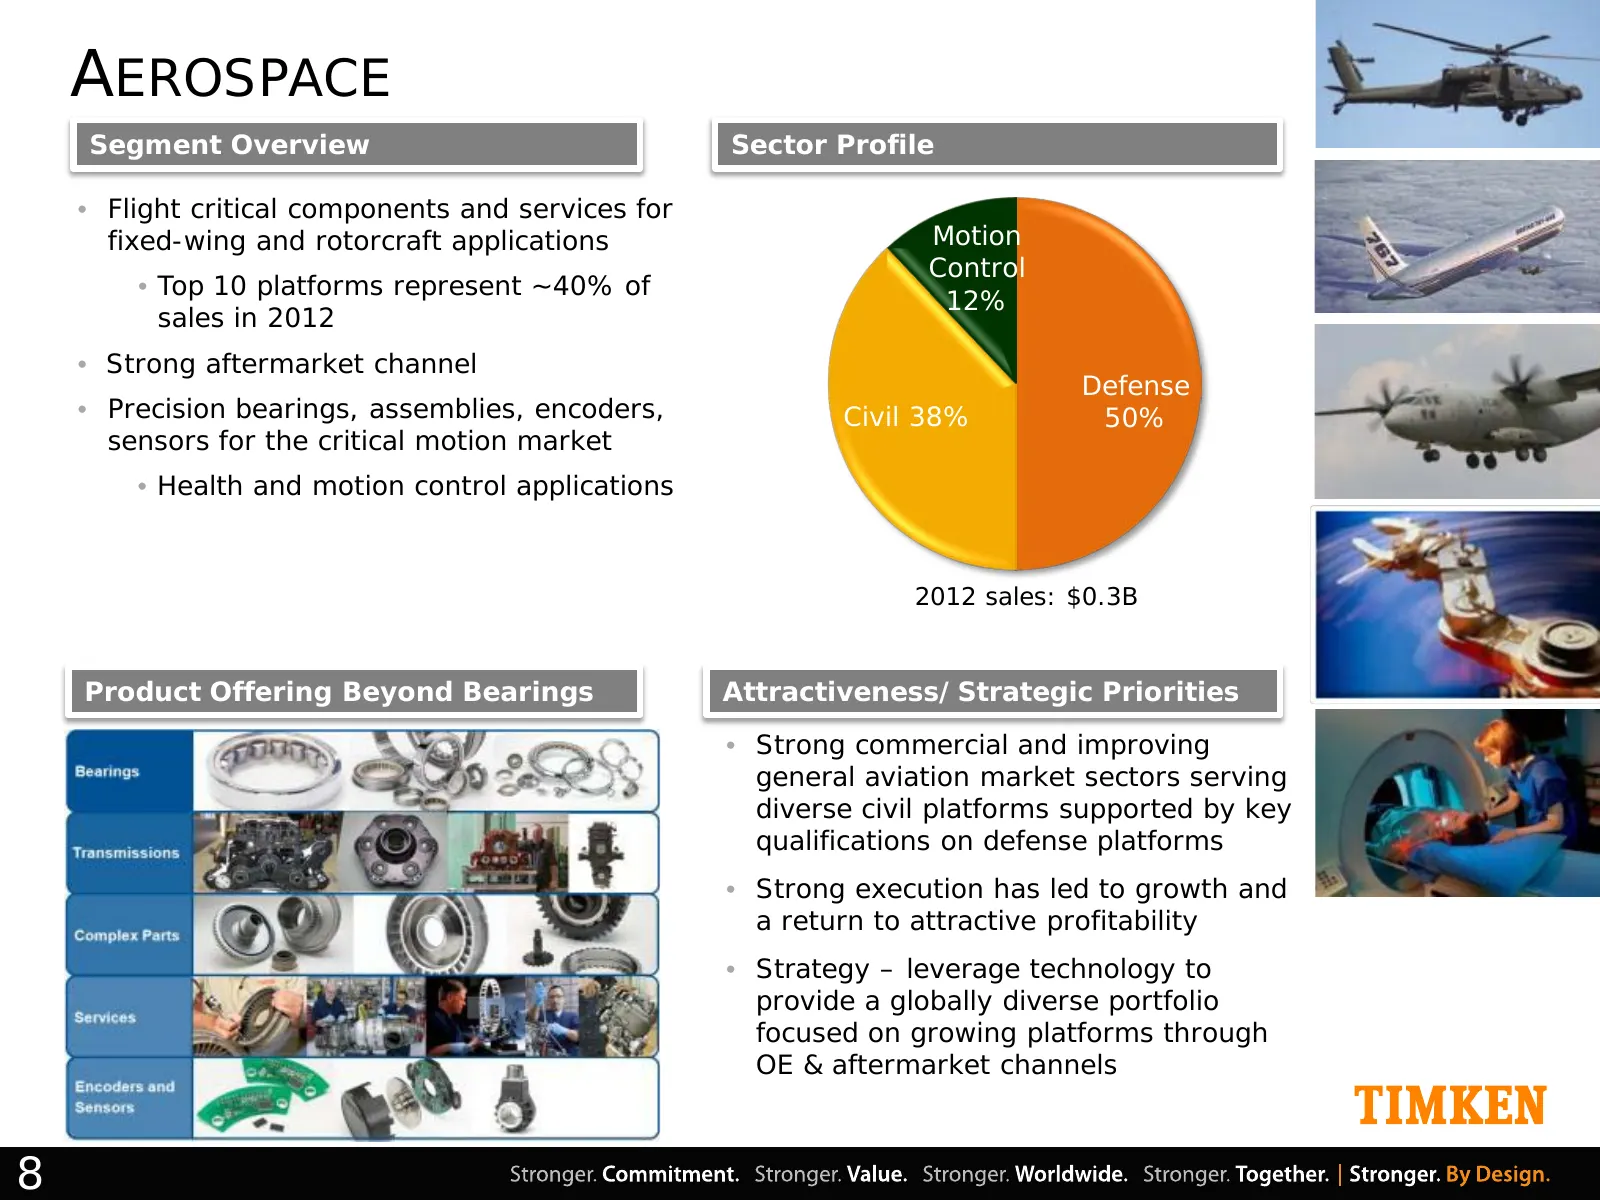
Slide 8: Aerospace
AEROSPACE Segment Overview Sector Profile • Flight critical components and services for fixed-wing and rotorcraft applications Motion Control • Top 10 platforms represent ~40% of 12% sales in 2012 • Strong aftermarket channel Defense • Precision bearings, assemblies, encoders, Civil 38% 50% sensors
Slide 9: Steel
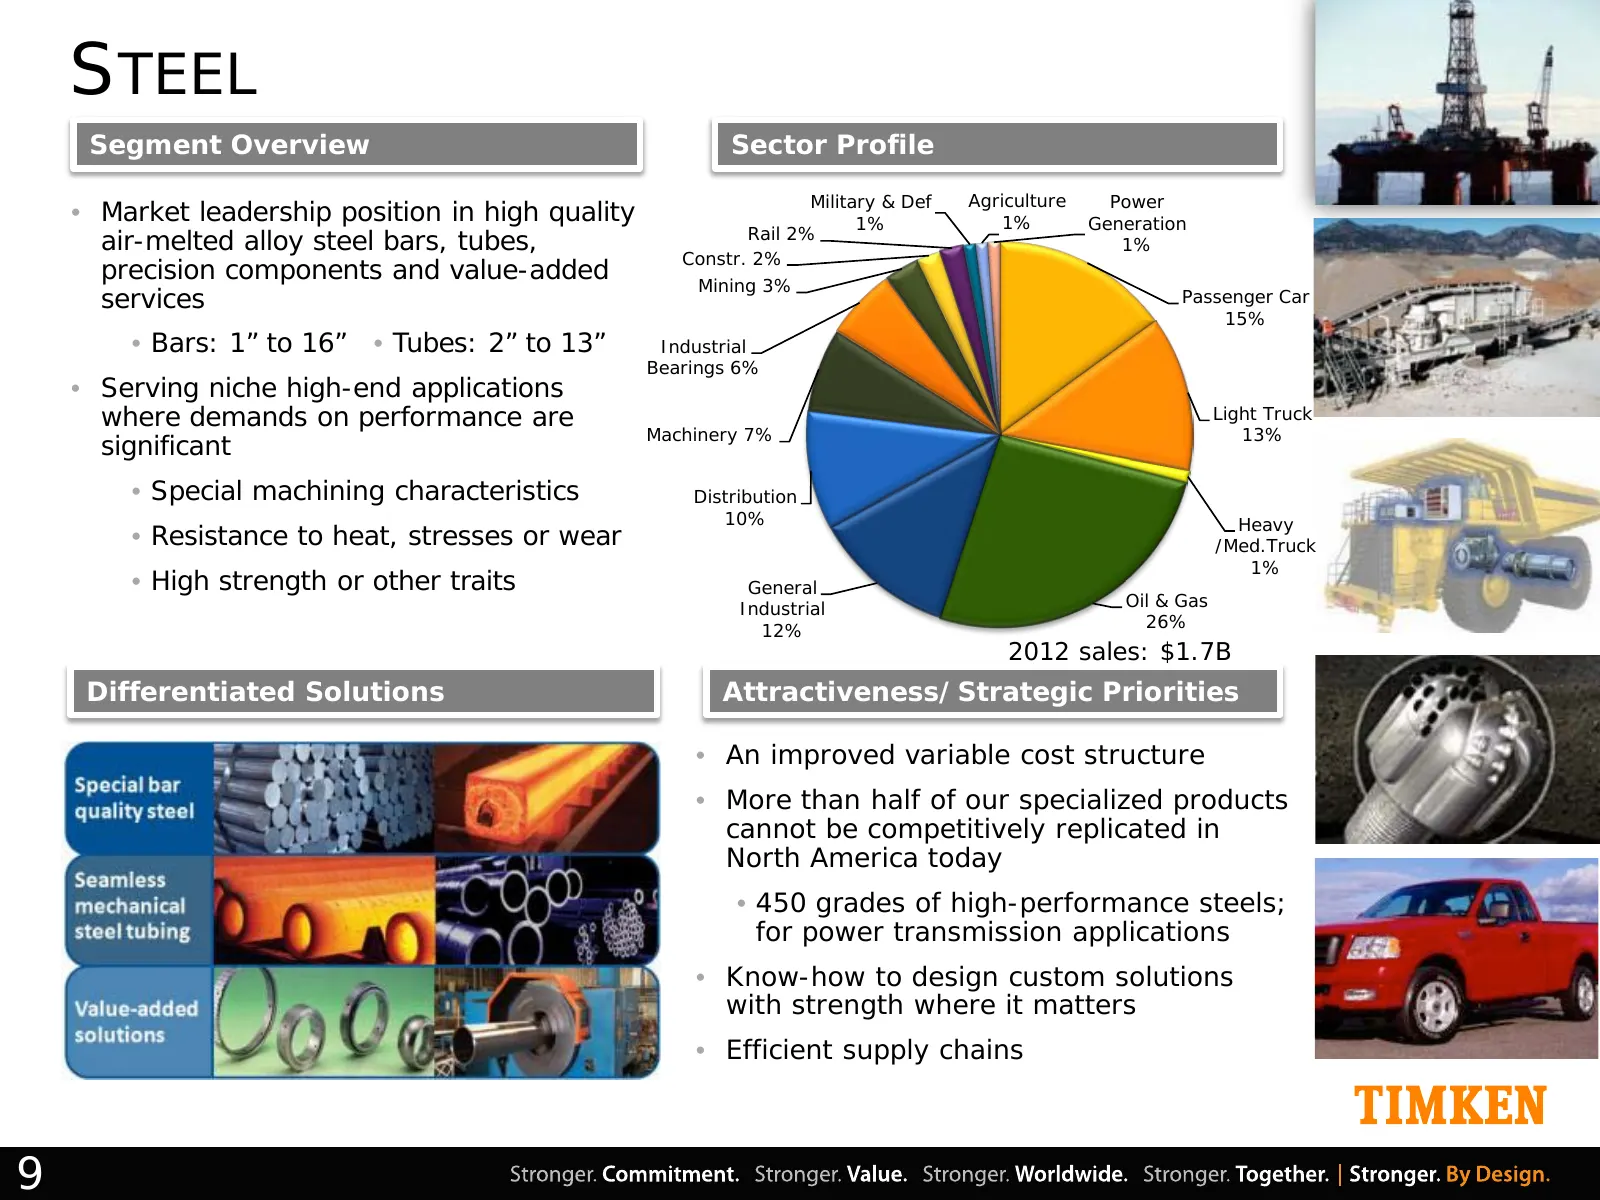
STEEL Segment Overview Sector Profile Military & Def Agriculture Power • Market leadership position in high quality 1% 1% Generation Rail 2% air-melted alloy steel bars, tubes, 1% Constr. 2% precision components and value-added Mining 3% services Passenger Car 15% • Bars: 1” to 16” • Tubes: 2” to 13
Slide 10: Timken Strategy to Deliver Shareholder Value
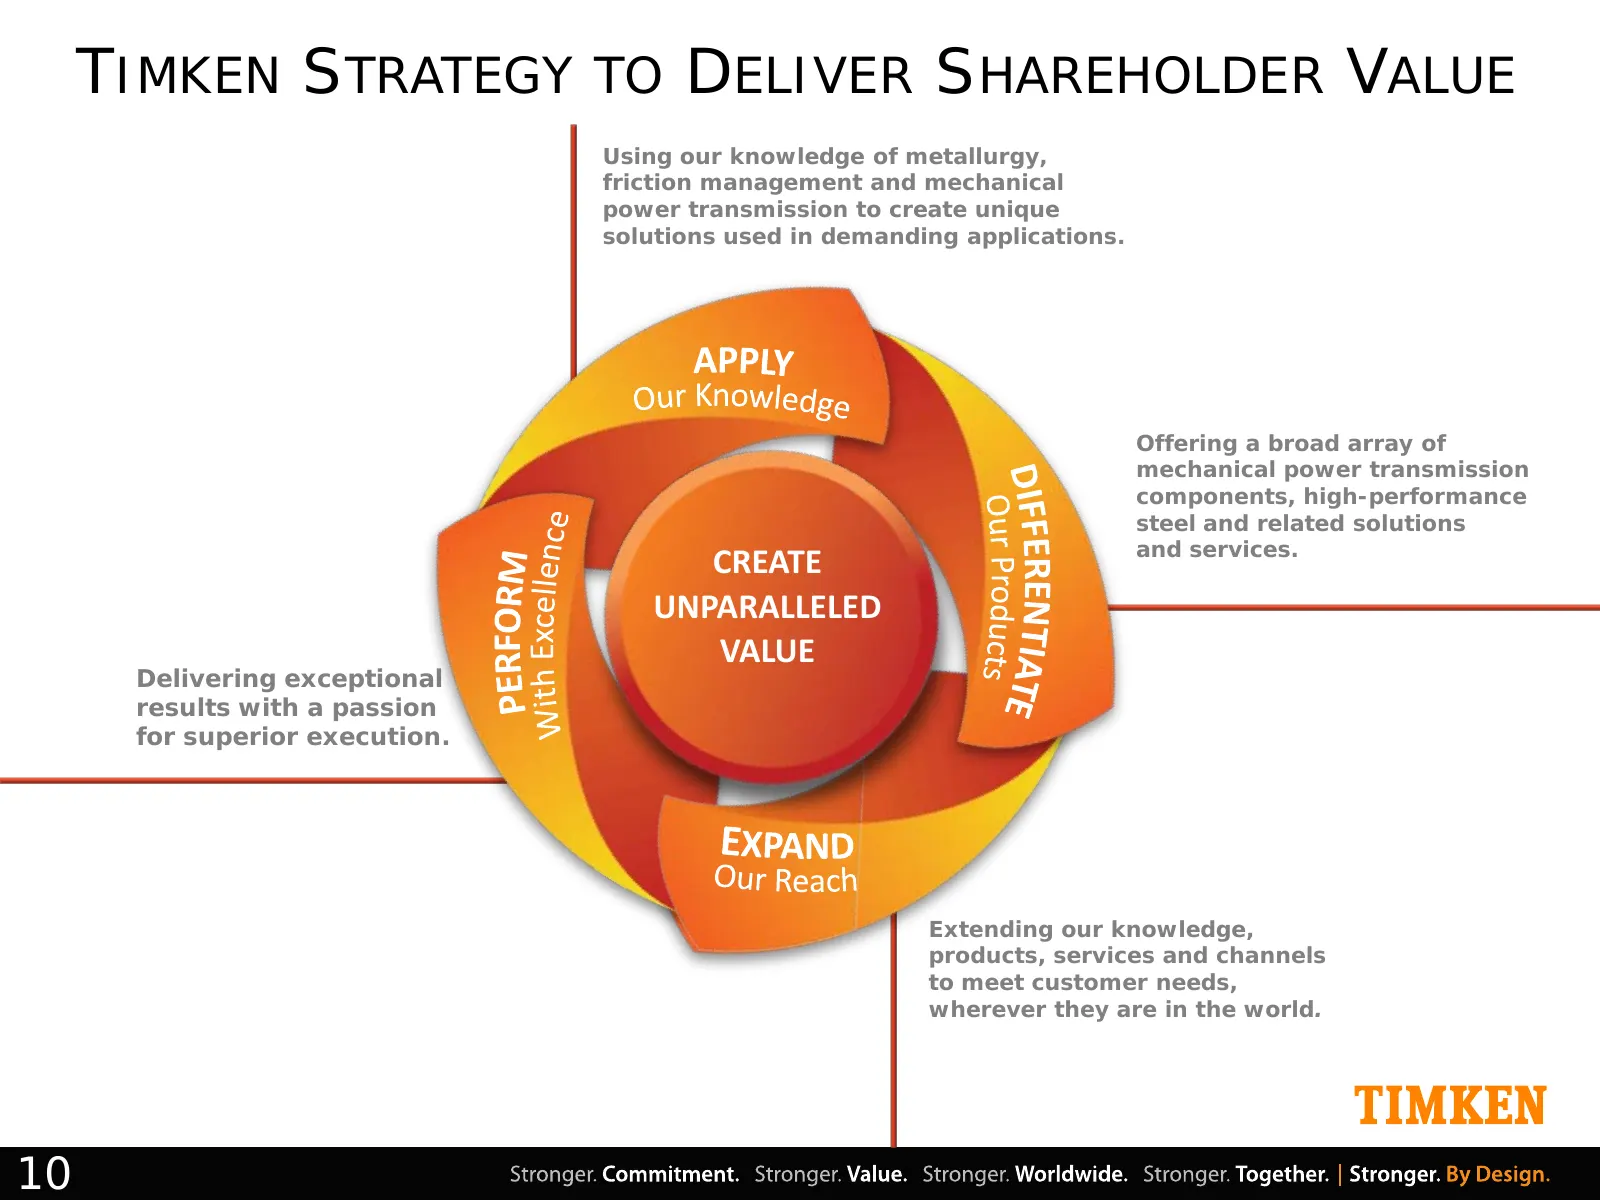
TIMKEN STRATEGY TO DELIVER SHAREHOLDER VALUE Using our knowledge of metallurgy, friction management and mechanical power transmission to create unique solutions used in demanding applications. Offering a broad array of mechanical power transmission components, high-performance steel and related solu
Slide 11: A Multi-Faceted Transformation
A MULTI-FACETED TRANSFORMATION • Markets • Geographies • Products • Performance 11
Slide 12: Global End-Market Sector Diversification
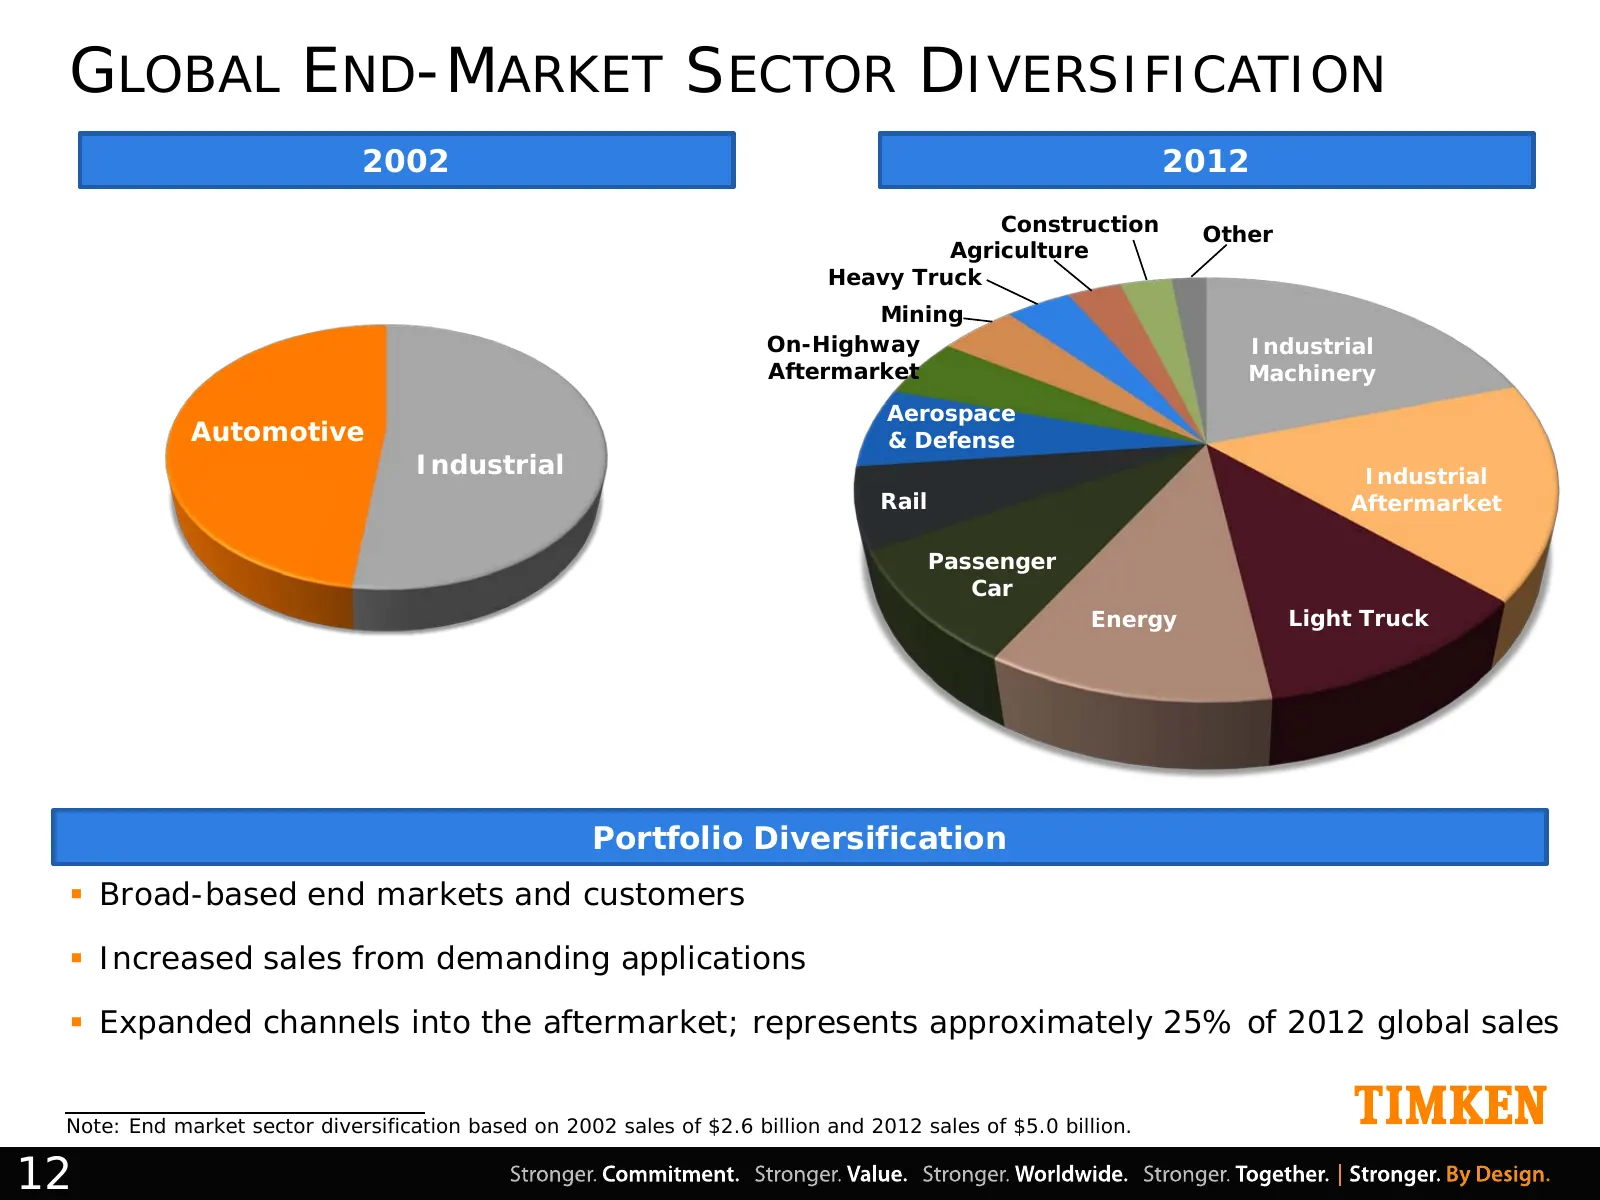
GLOBAL END-MARKET SECTOR DIVERSIFICATION 2002 2012 Construction Other Agriculture Heavy Truck Mining On-Highway Industrial Aftermarket Machinery Aerospace Automotive & Defense Industrial Industrial Rail Aftermarket Passenger Car Energy Light Truck Portfolio Diversification Broad-based end markets
Slide 13: Emerging Markets: A Source of Growth
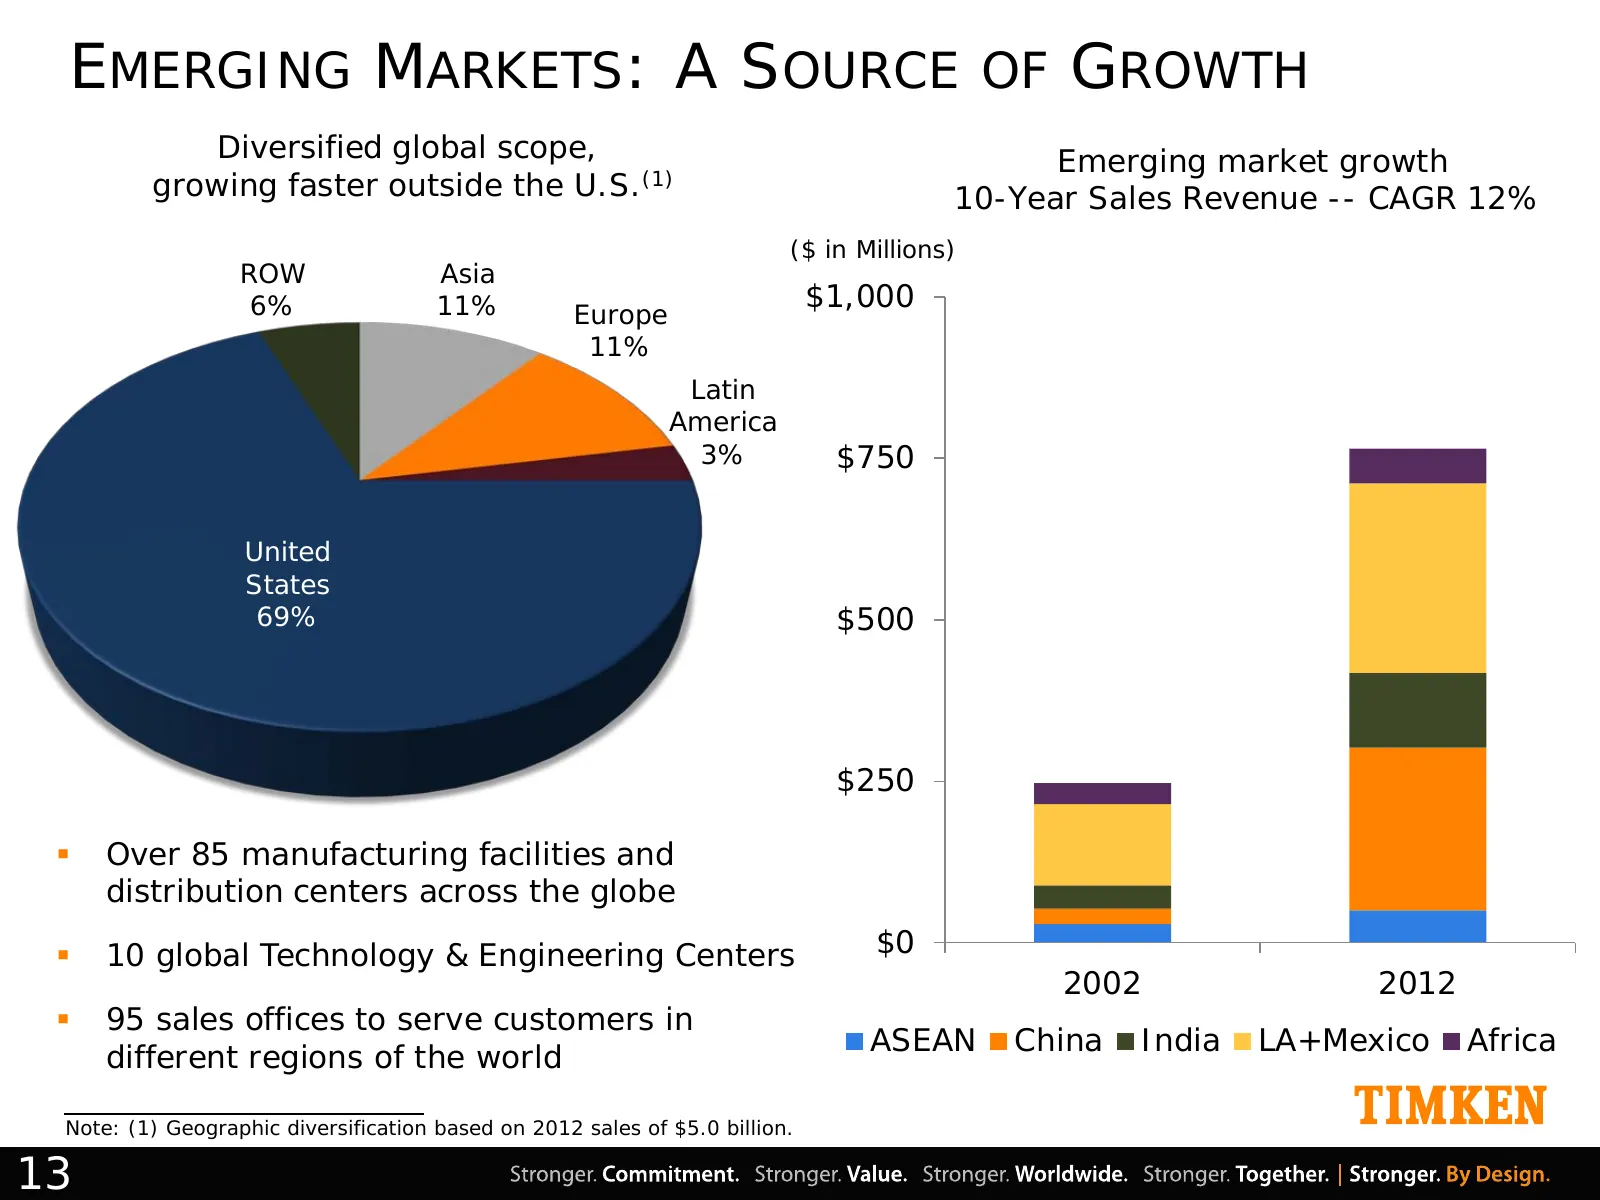
EMERGING MARKETS: A SOURCE OF GROWTH Diversified global scope, Emerging market growth growing faster outside the U.S.(1) 10-Year Sales Revenue -- CAGR 12% ($ in Millions) ROW Asia 6% 11% $1,000 Europe 11% Latin America 3% $750 United States 69% $500 $250 Over 85 manufacturing facilities and distri
Slide 14: Product Line Expansion & Diversification
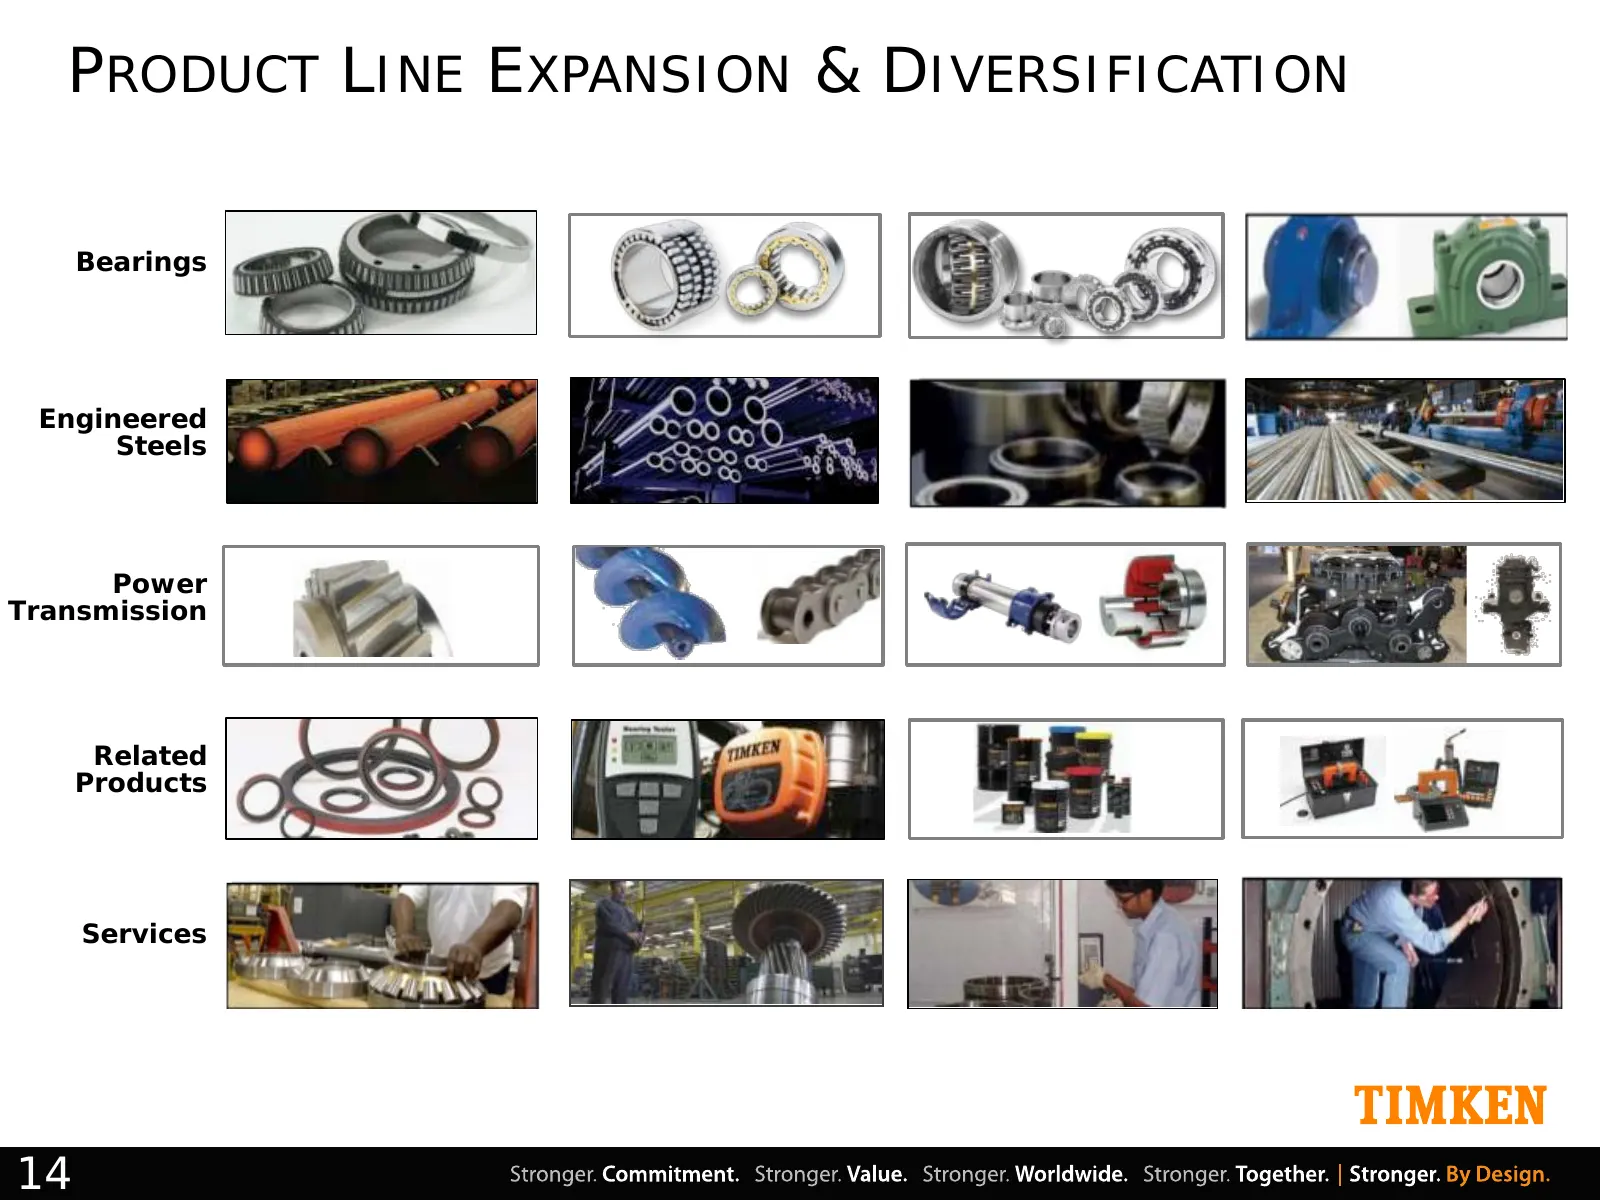
PRODUCT LINE EXPANSION & DIVERSIFICATION Bearings Engineered Steels Power Transmission Related Products Services 14
Slide 15: New Acquisitions, New Capabilities
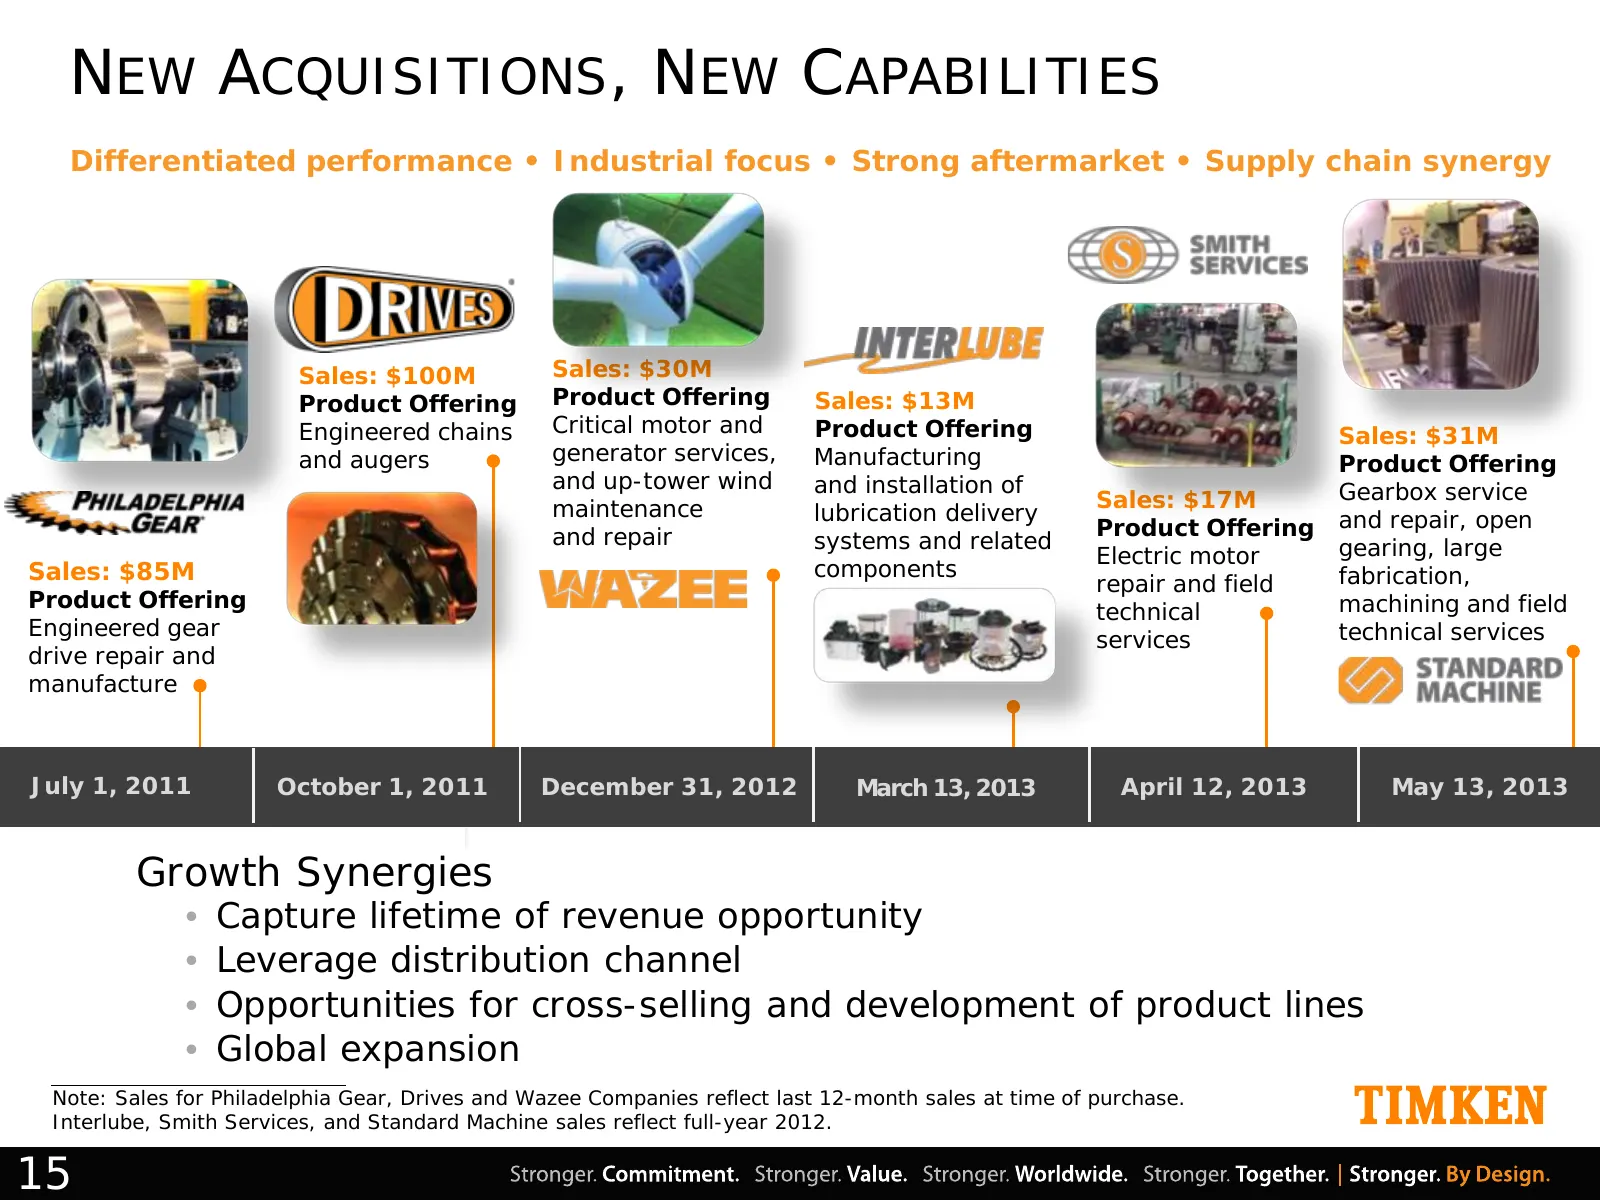
NEW ACQUISITIONS, NEW CAPABILITIES Differentiated performance • Industrial focus • Strong aftermarket • Supply chain synergy Sales: $100M Sales: $30M Product Offering Product Offering Sales: $13M Engineered chains Critical motor and Product Offering Sales: $31M and augers generator services, Manufac
Slide 16: Our Future: Two Strong Companies
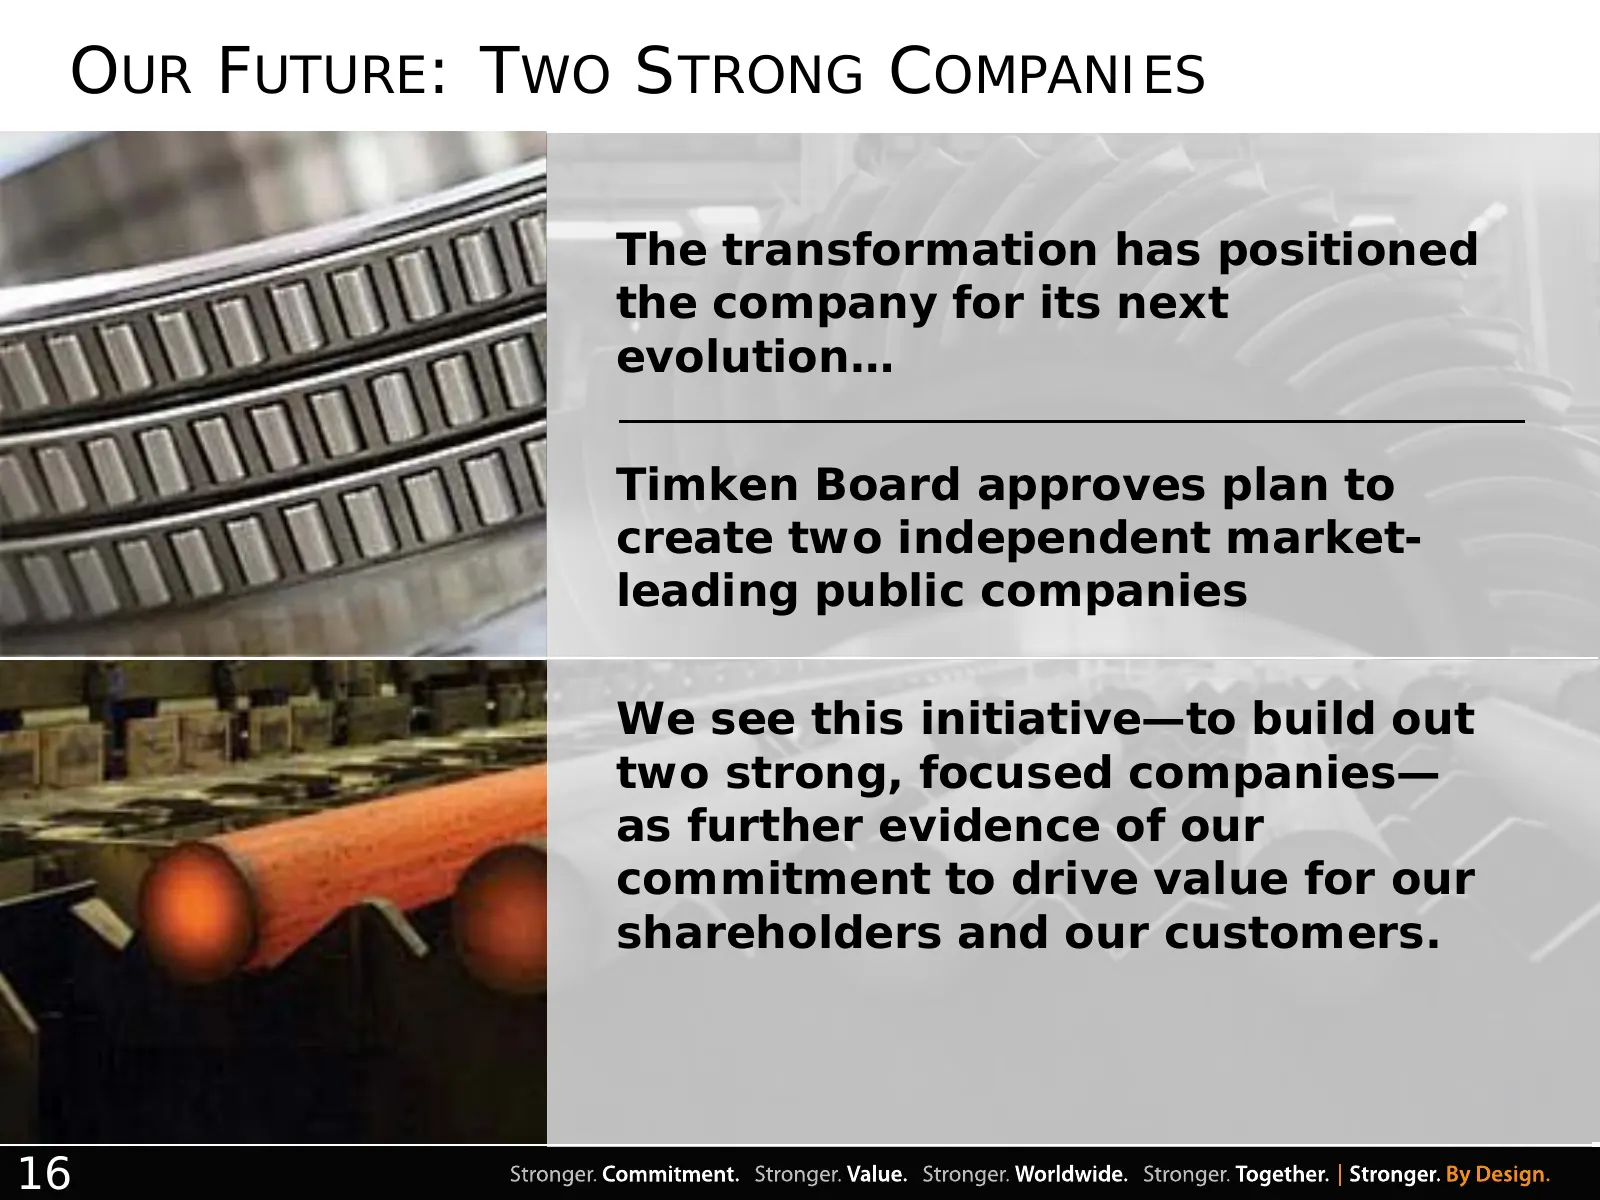
OUR FUTURE: TWO STRONG COMPANIES The transformation has positioned the company for its next evolution… Timken Board approves plan to create two independent market- leading public companies We see this initiative—to build out two strong, focused companies— as further evidence of our commitment to dri
Slide 17: Board Approves Plan to Spin-off Steel Business
Board Approves Plan to Spin-off Steel Business
Slide 18: Timken Transformation Continues
TIMKEN TRANSFORMATION CONTINUES • Timken to create two independent public companies • Board conducted thorough review process with advisors, including discussions with shareholders and customers • Management and the Board believe that the separation will create additional shareholder value • Organiz
Slide 19: Results from Strategic Review
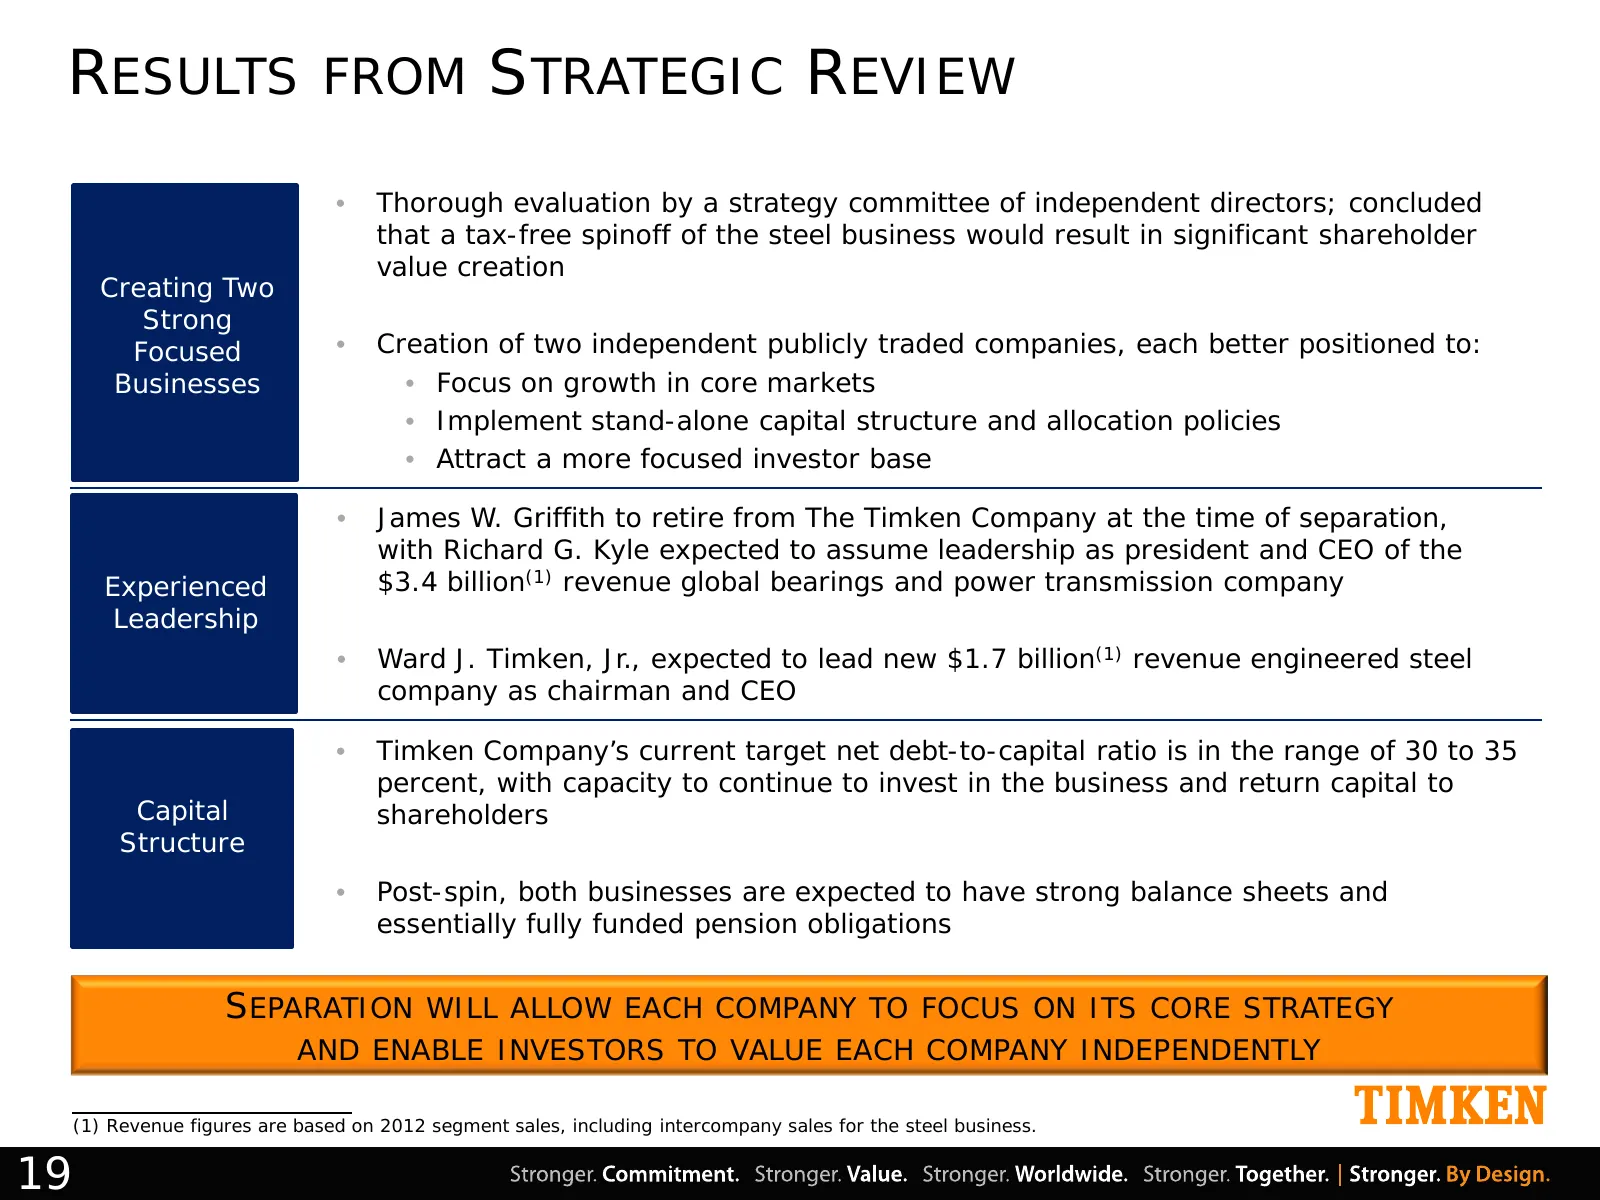
RESULTS FROM STRATEGIC REVIEW • Thorough evaluation by a strategy committee of independent directors; concluded that a tax-free spinoff of the steel business would result in significant shareholder value creation Creating Two Strong Focused • Creation of two independent publicly traded companies, ea
Slide 20: Business Profiles
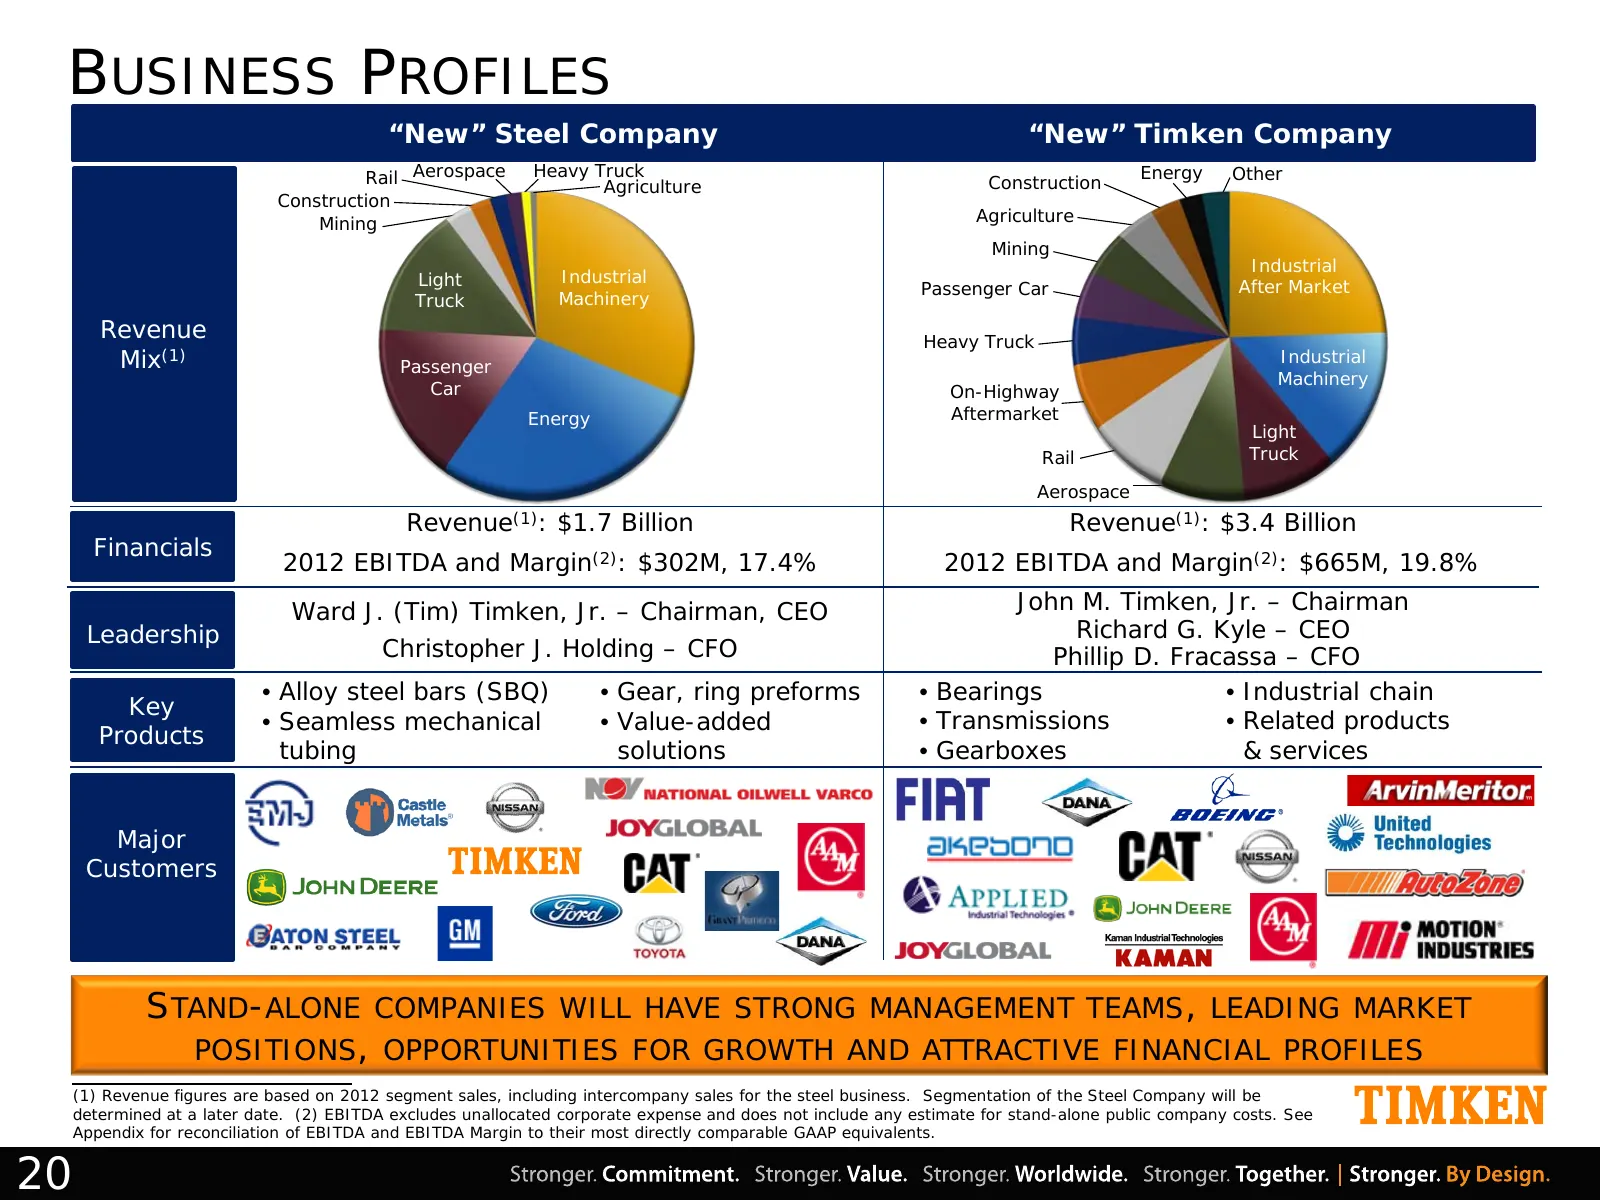
BUSINESS PROFILES “New” Steel Company “New” Timken Company Rail Aerospace Heavy Truck Construction Energy Other Agriculture Construction Mining Agriculture Mining Industrial Light Industrial Passenger Car After Market Truck Machinery Revenue Heavy Truck Mix(1) Passenger Industrial Machinery Car On-H
Slide 21: "New" Steel Business Profile
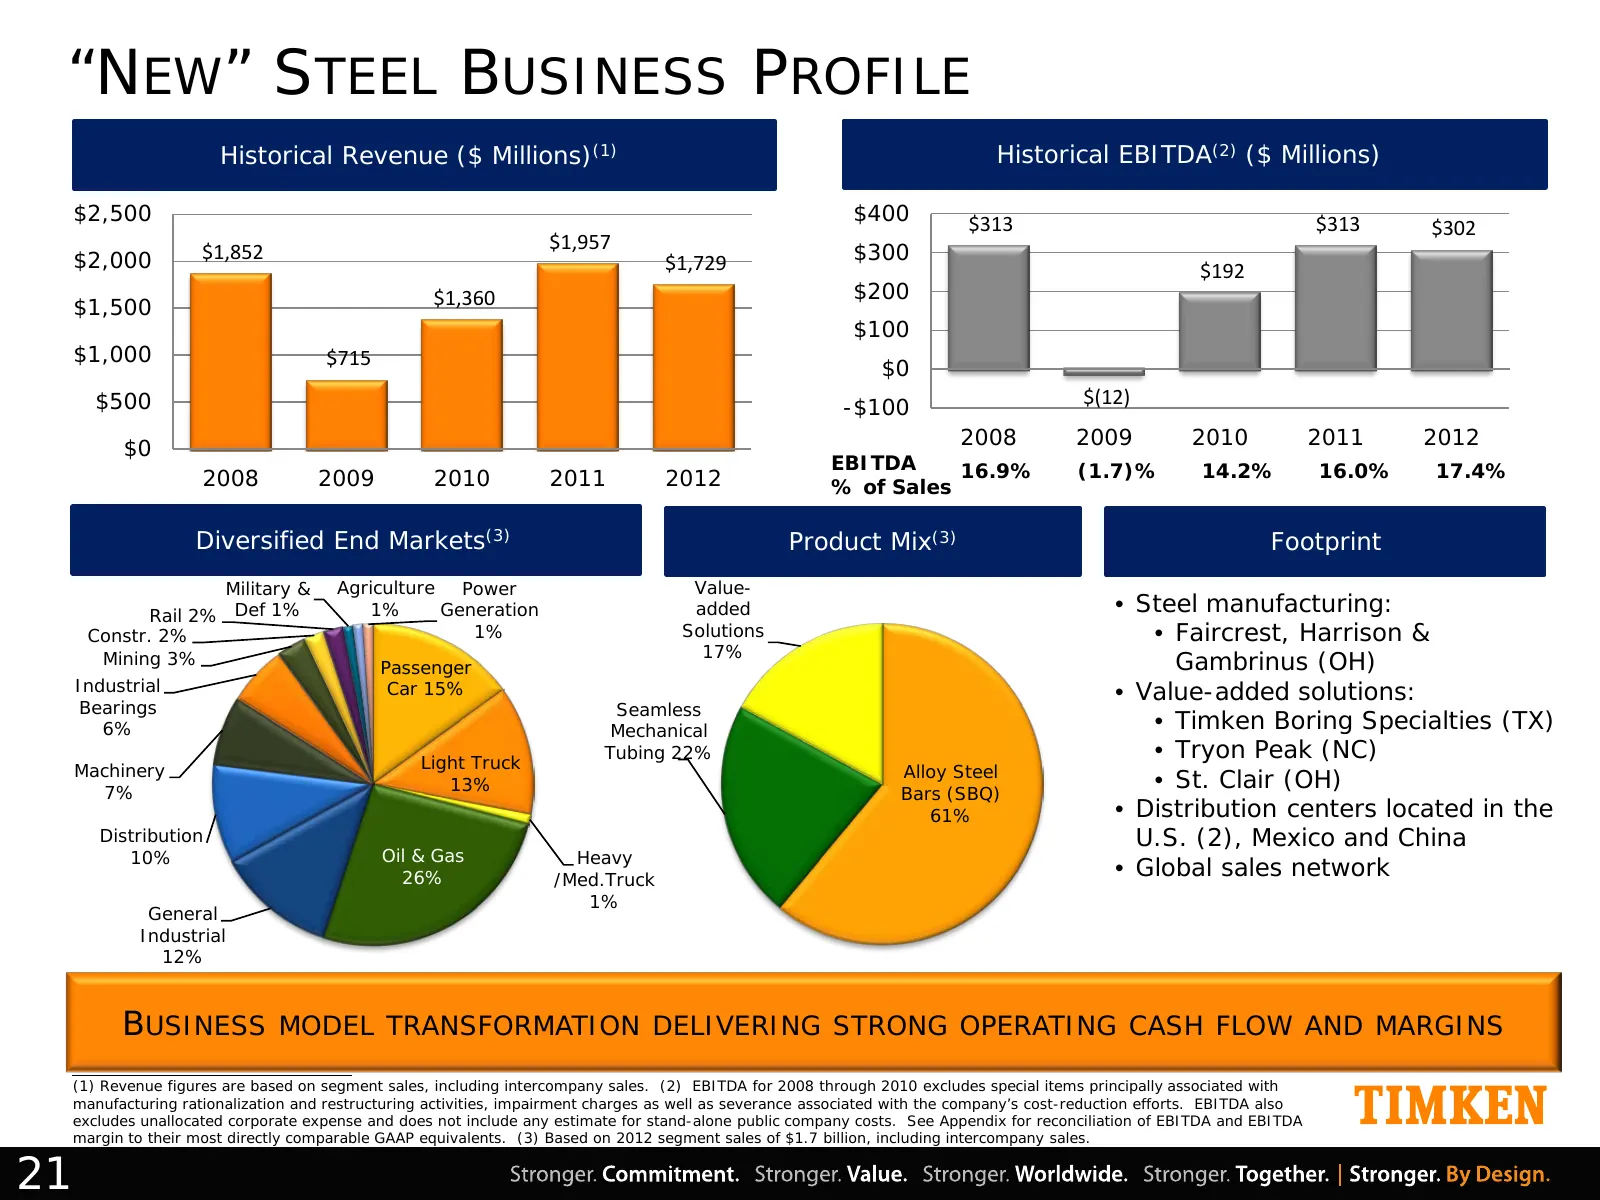
“NEW” STEEL BUSINESS PROFILE Historical Revenue ($ Millions)(1) Historical EBITDA(2) ($ Millions) $2,500 $400 $313 $313 $302 $1,852 $1,957 $300 $2,000 $1,729 $192 $1,360 $200 $1,500 $100 $1,000 $715 $0 $500 -$100 $(12) 2008 2009 2010 2011 2012 $0 EBITDA 16.9% (1.7)% 14.2% 16.0% 17.4% 2008 2009 2010
Slide 22: "New" Steel Business Profile
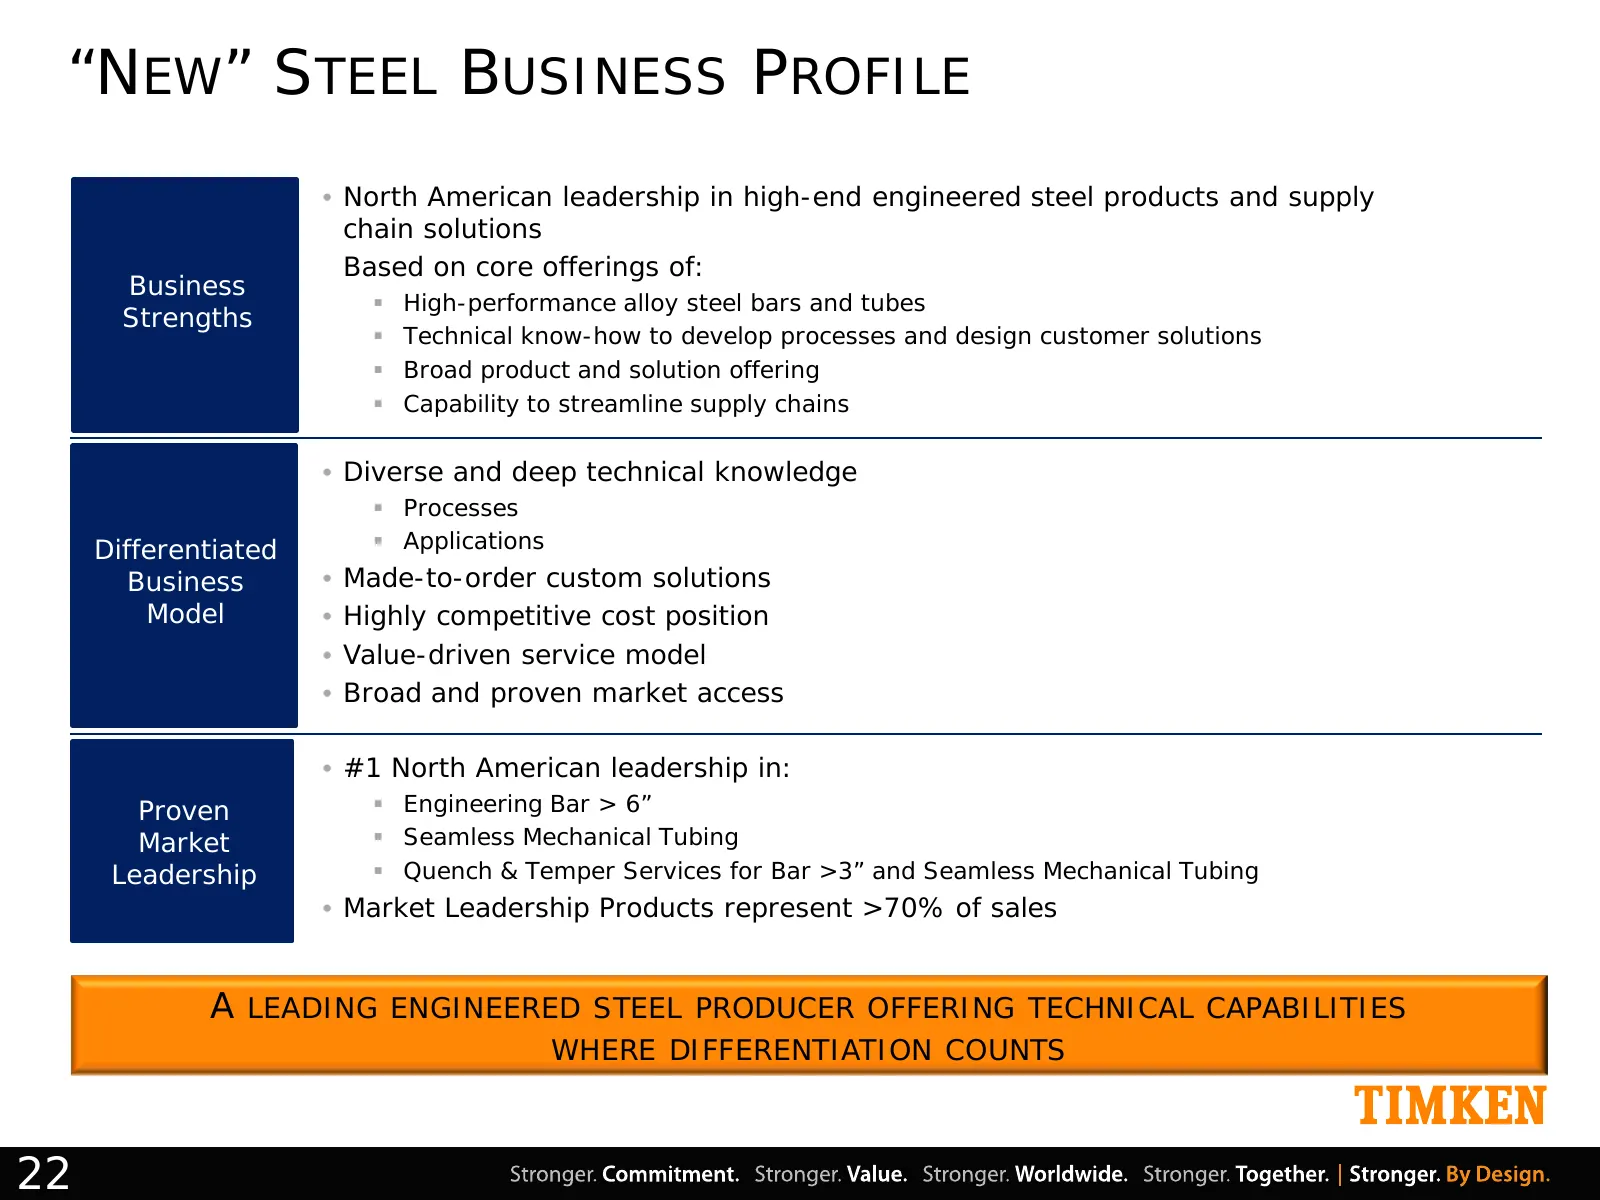
“NEW” STEEL BUSINESS PROFILE • North American leadership in high-end engineered steel products and supply chain solutions Based on core offerings of: Business High-performance alloy steel bars and tubes Strengths Technical know-how to develop processes and design customer solutions Broad produ
Slide 23: "New" Steel Strategy: Expand Value-Add & Service Offering
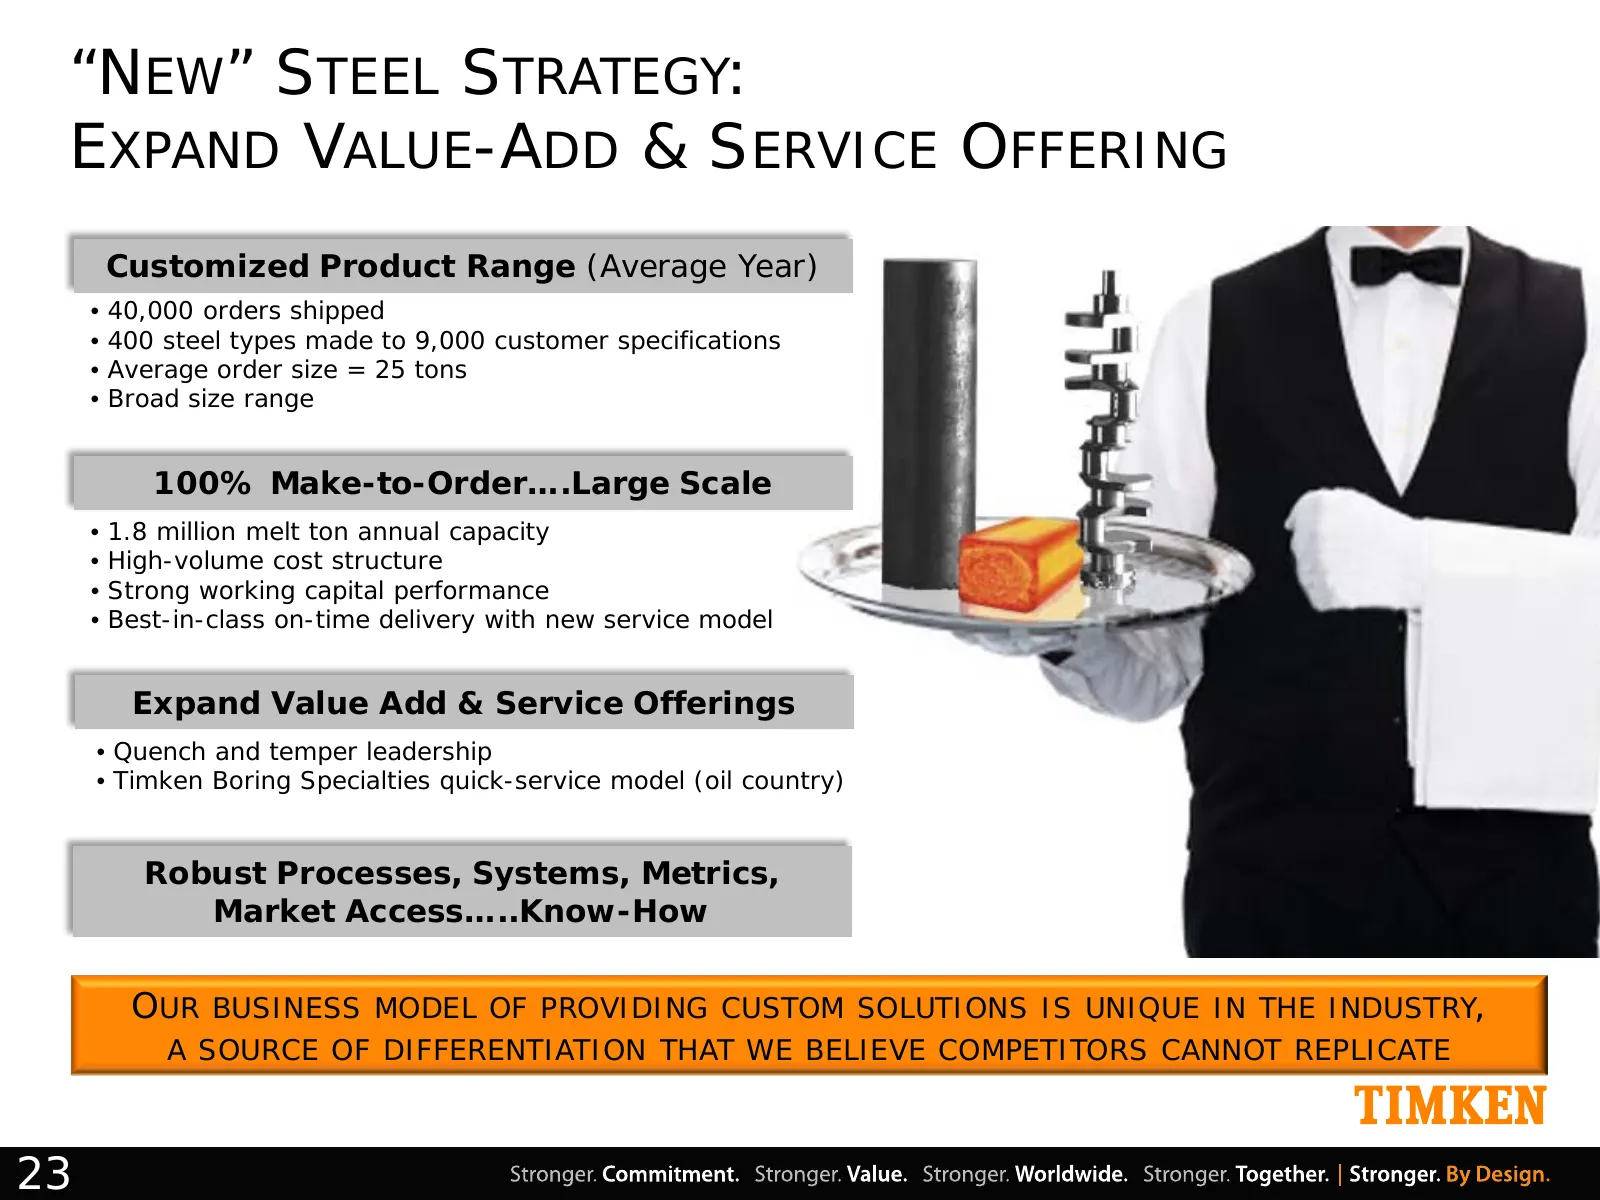
“NEW” STEEL STRATEGY: EXPAND VALUE-ADD & SERVICE OFFERING Customized Product Range (Average Year) • 40,000 orders shipped • 400 steel types made to 9,000 customer specifications • Average order size = 25 tons • Broad size range 100% Make-to-Order….Large Scale • 1.8 million melt ton annual capacity •
Slide 24: "New" Steel Key Near-Term Priorities
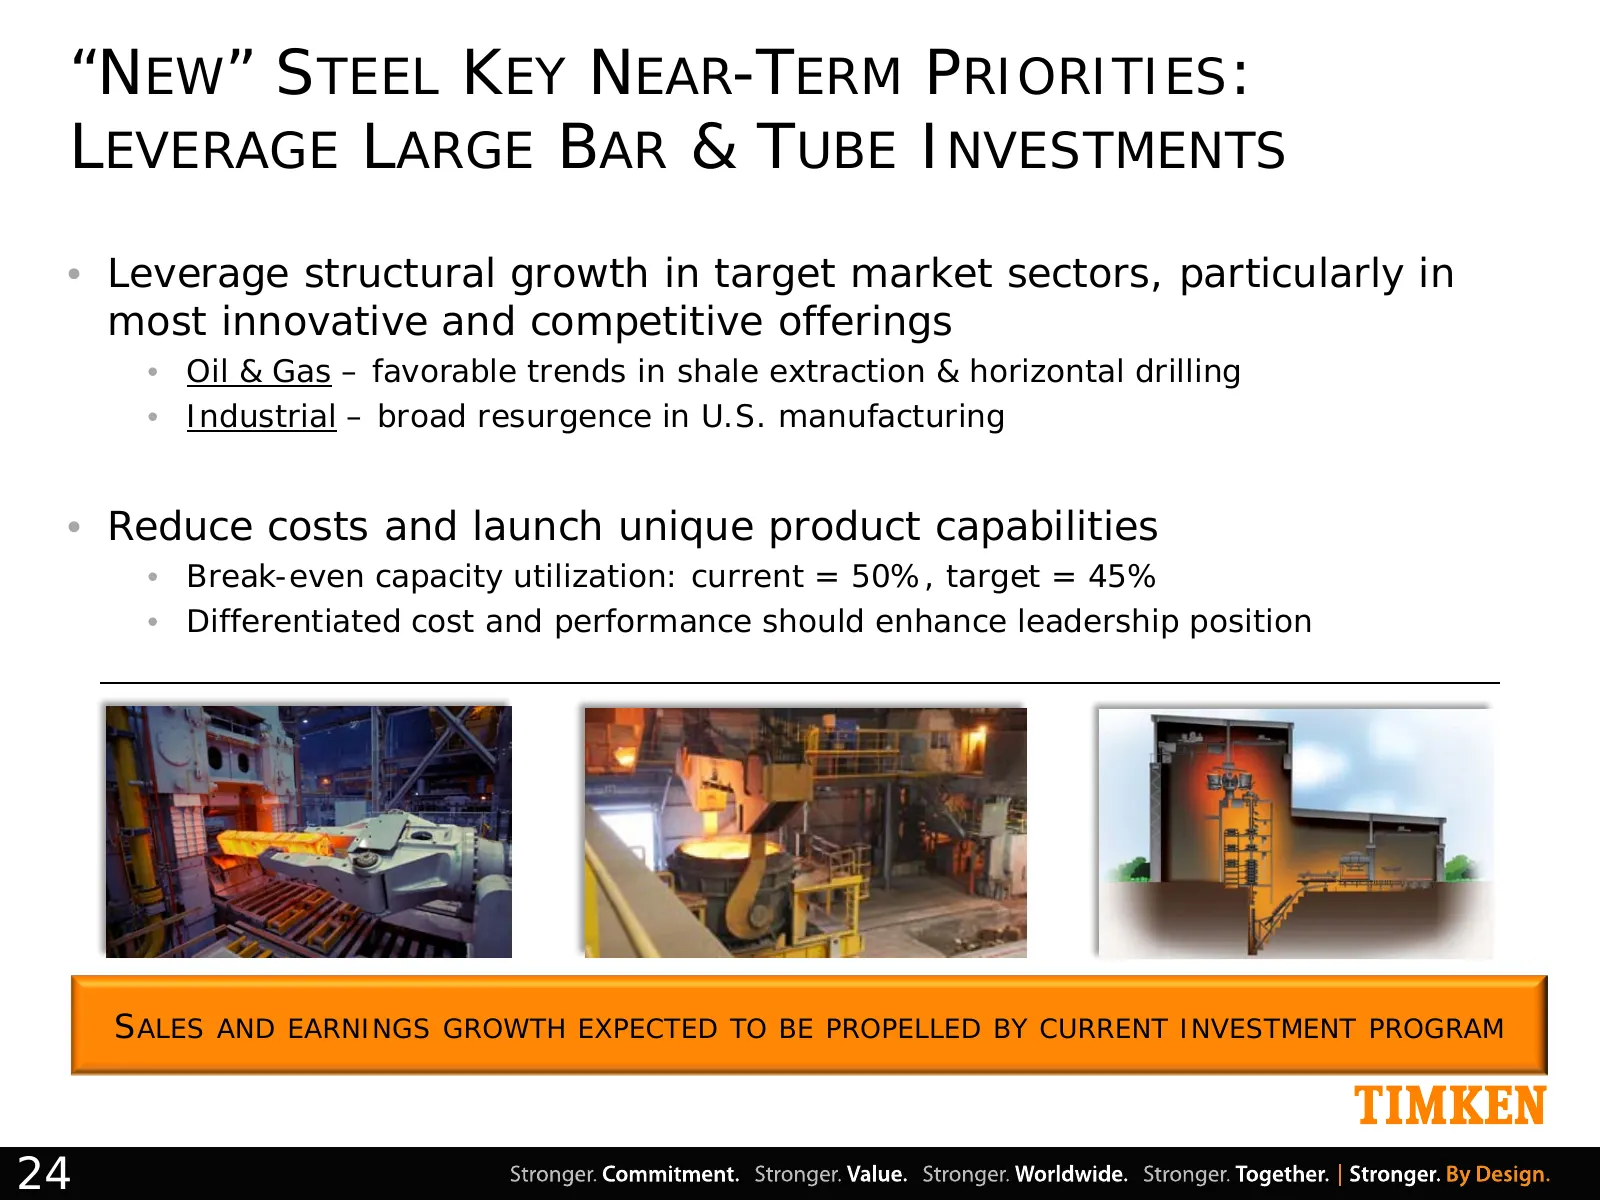
“NEW” STEEL KEY NEAR-TERM PRIORITIES: LEVERAGE LARGE BAR & TUBE INVESTMENTS • Leverage structural growth in target market sectors, particularly in most innovative and competitive offerings • Oil & Gas – favorable trends in shale extraction & horizontal drilling • Industrial – broad resurgence in U.S
Slide 25: "New" Timken Company Business Profile
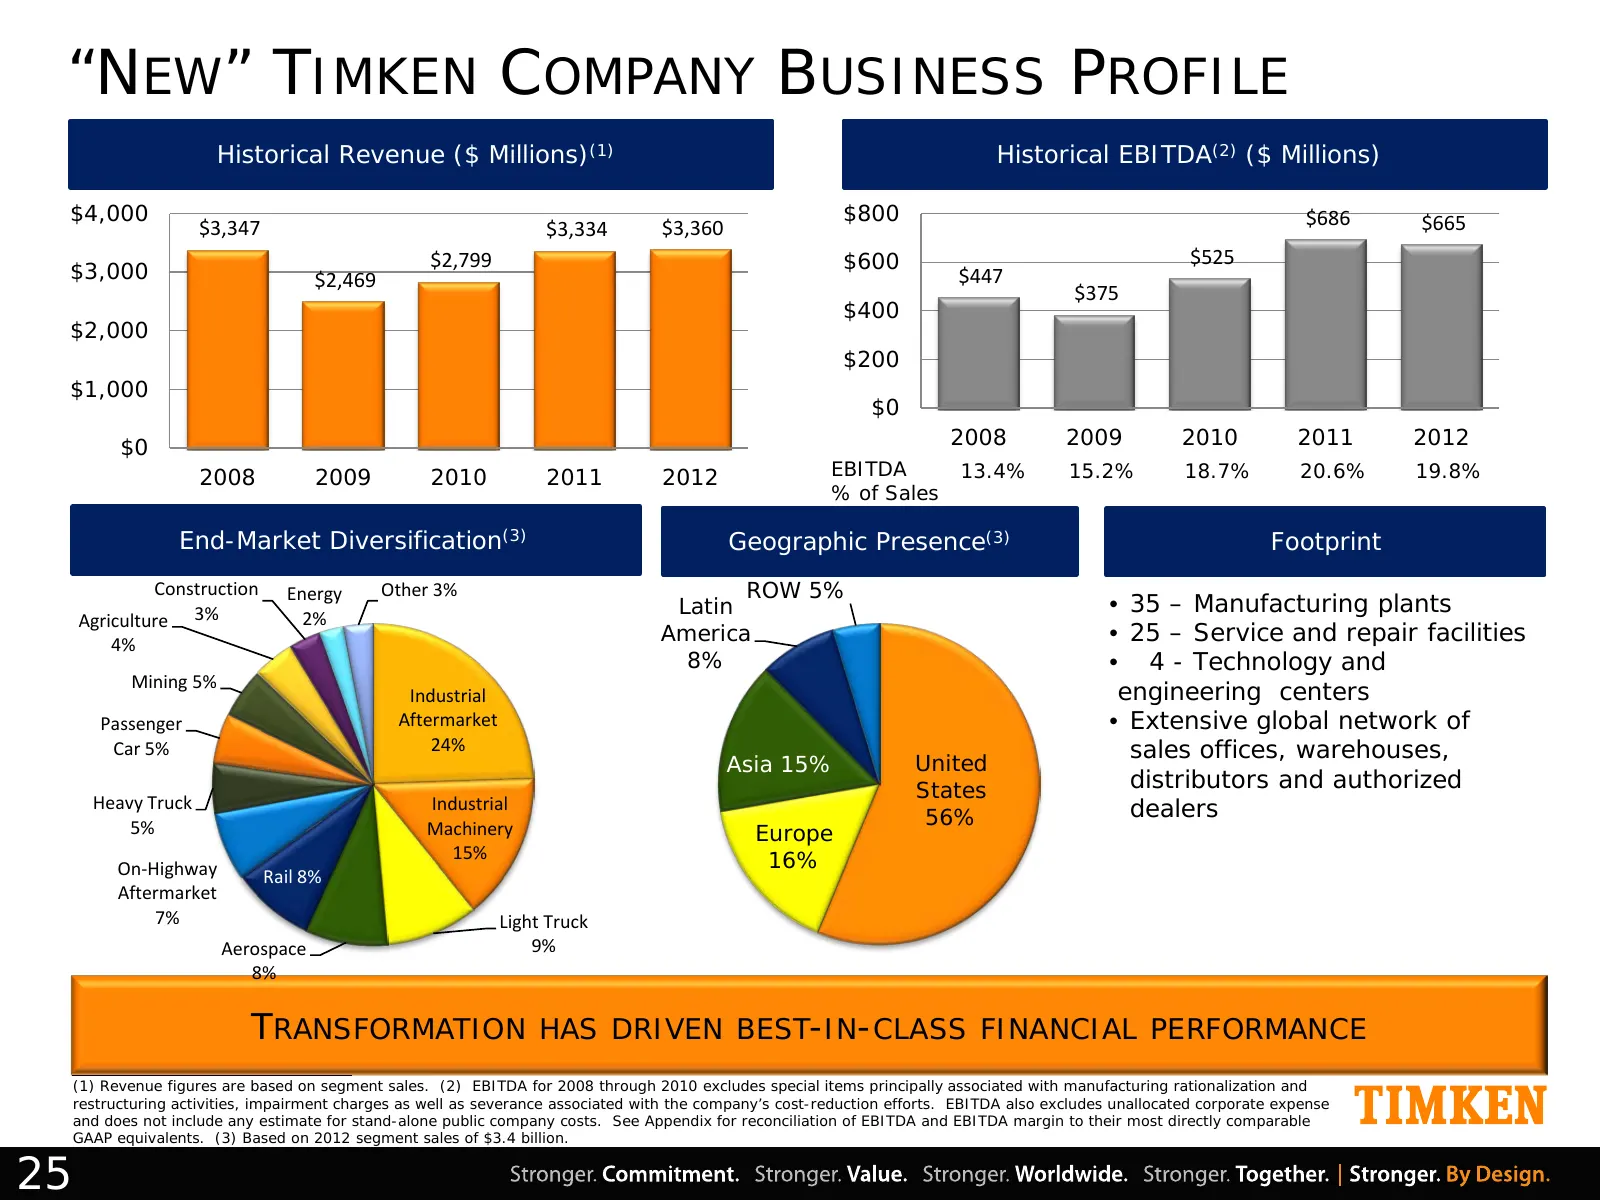
“NEW” TIMKEN COMPANY BUSINESS PROFILE Historical Revenue ($ Millions)(1) Historical EBITDA(2) ($ Millions) $4,000 $800 $686 $665 $3,347 $3,334 $3,360 $2,799 $600 $525 $3,000 $2,469 $447 $375 $400 $2,000 $200 $1,000 $0 $0 2008 2009 2010 2011 2012 2008 2009 2010 2011 2012 EBITDA 13.4% 15.2% 18.7% 20.6
Slide 26: "New" Timken Company Business Profile
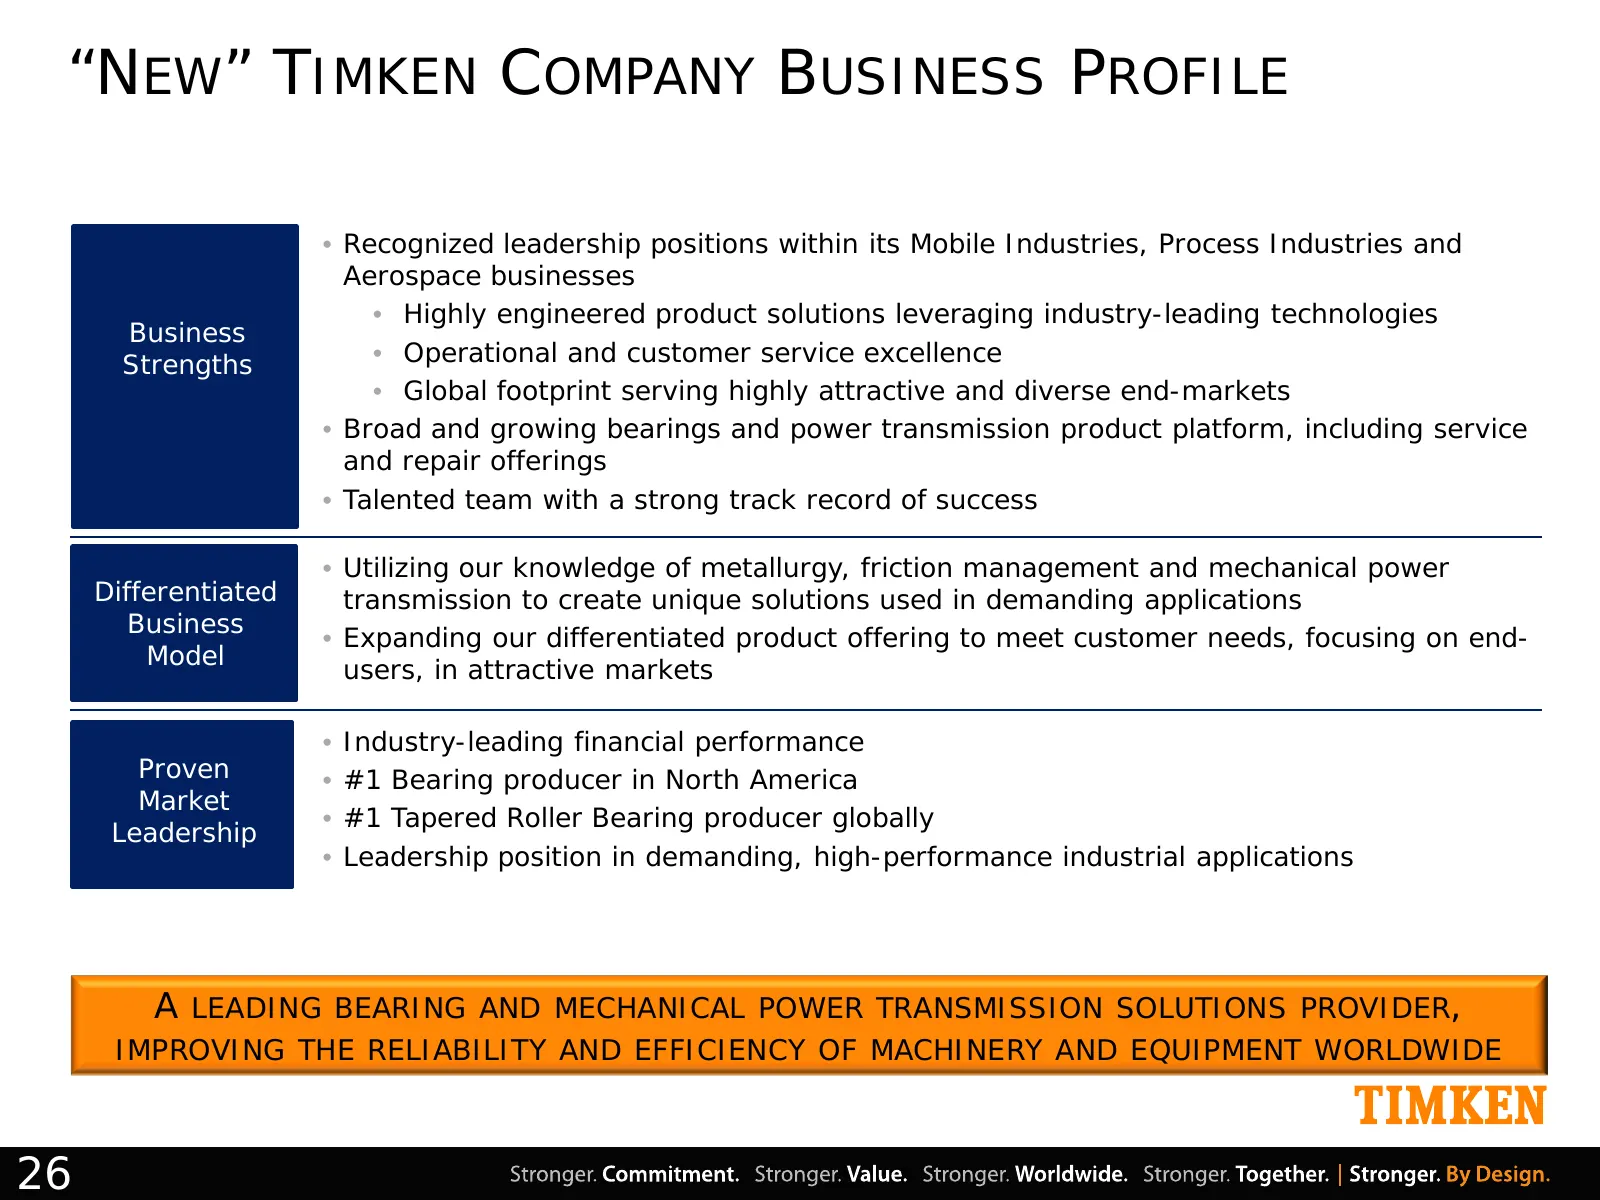
“NEW” TIMKEN COMPANY BUSINESS PROFILE • Recognized leadership positions within its Mobile Industries, Process Industries and Aerospace businesses • Highly engineered product solutions leveraging industry-leading technologies Business Strengths • Operational and customer service excellence • Global f
Slide 27: "New" Timken Company Business Profile
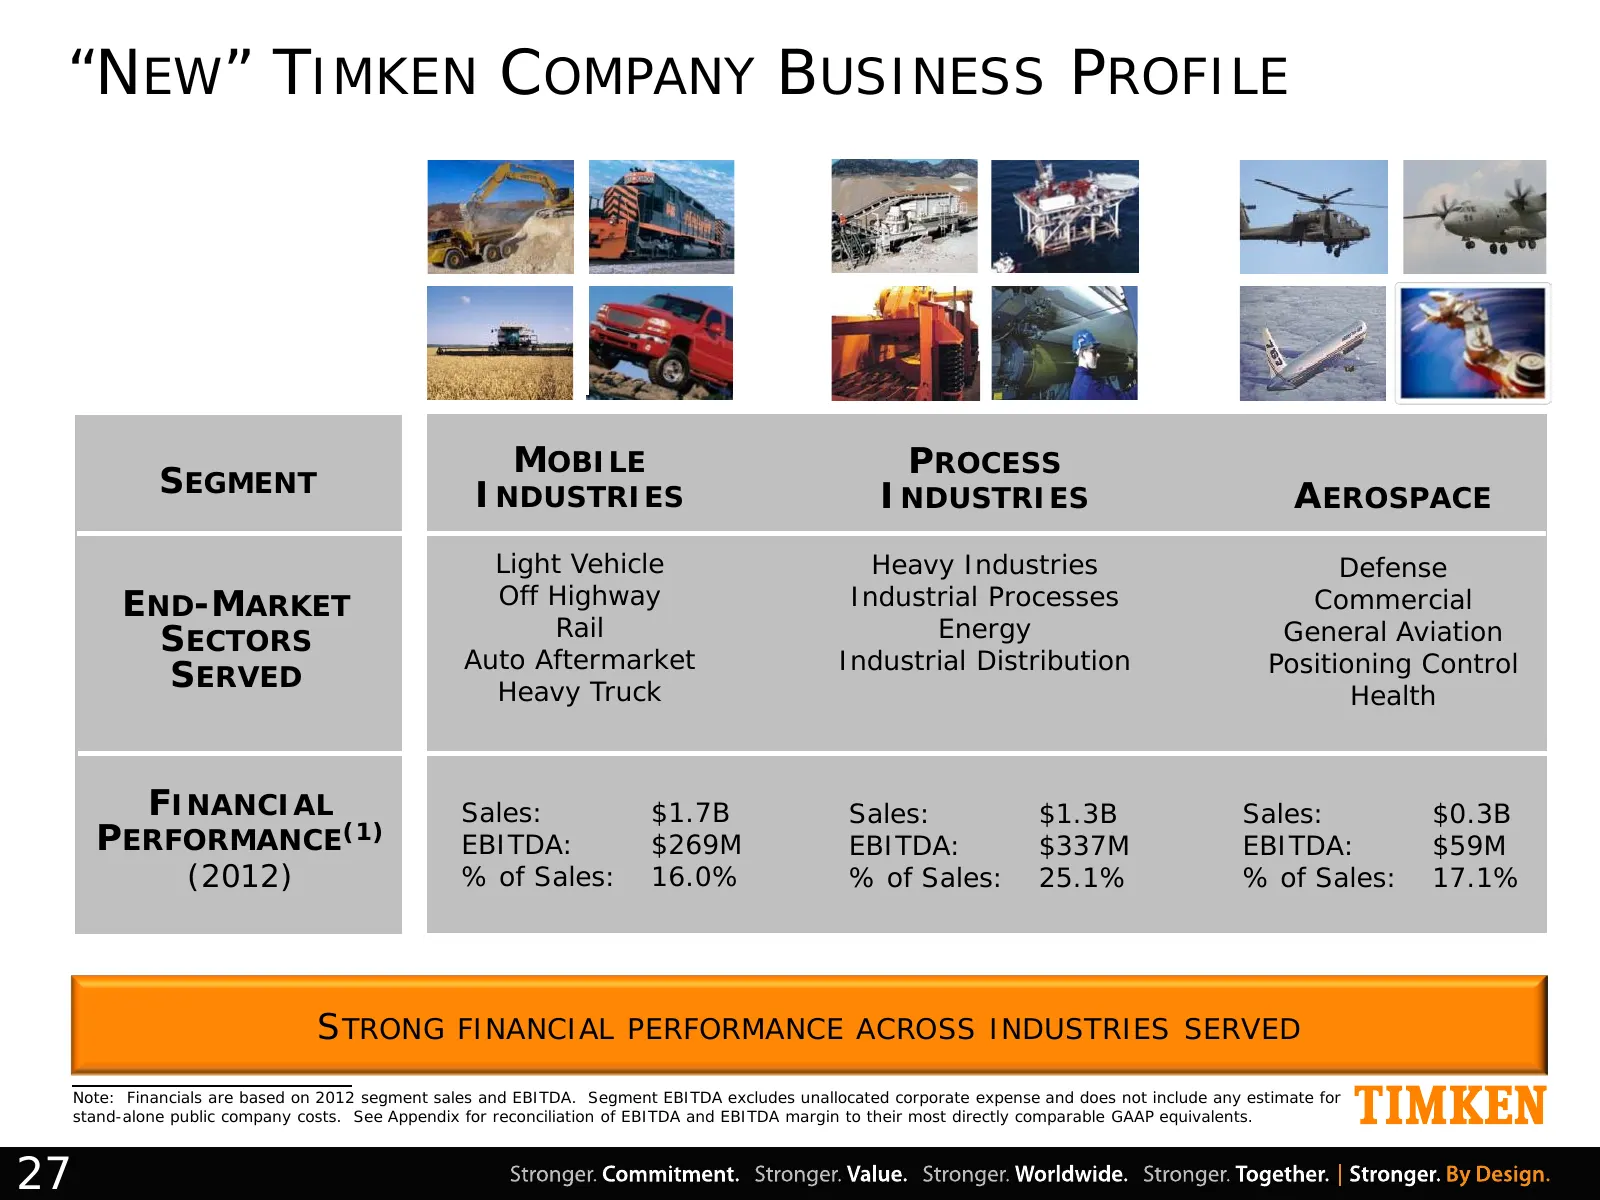
“NEW” TIMKEN COMPANY BUSINESS PROFILE MOBILE PROCESS SEGMENT INDUSTRIES INDUSTRIES AEROSPACE Light Vehicle Heavy Industries Defense END-MARKET Off Highway Industrial Processes Commercial Rail Energy General Aviation SECTORS Auto Aftermarket Industrial Distribution Positioning Control SERVED Heavy Tr
Slide 28: "New" Timken Company Strategy
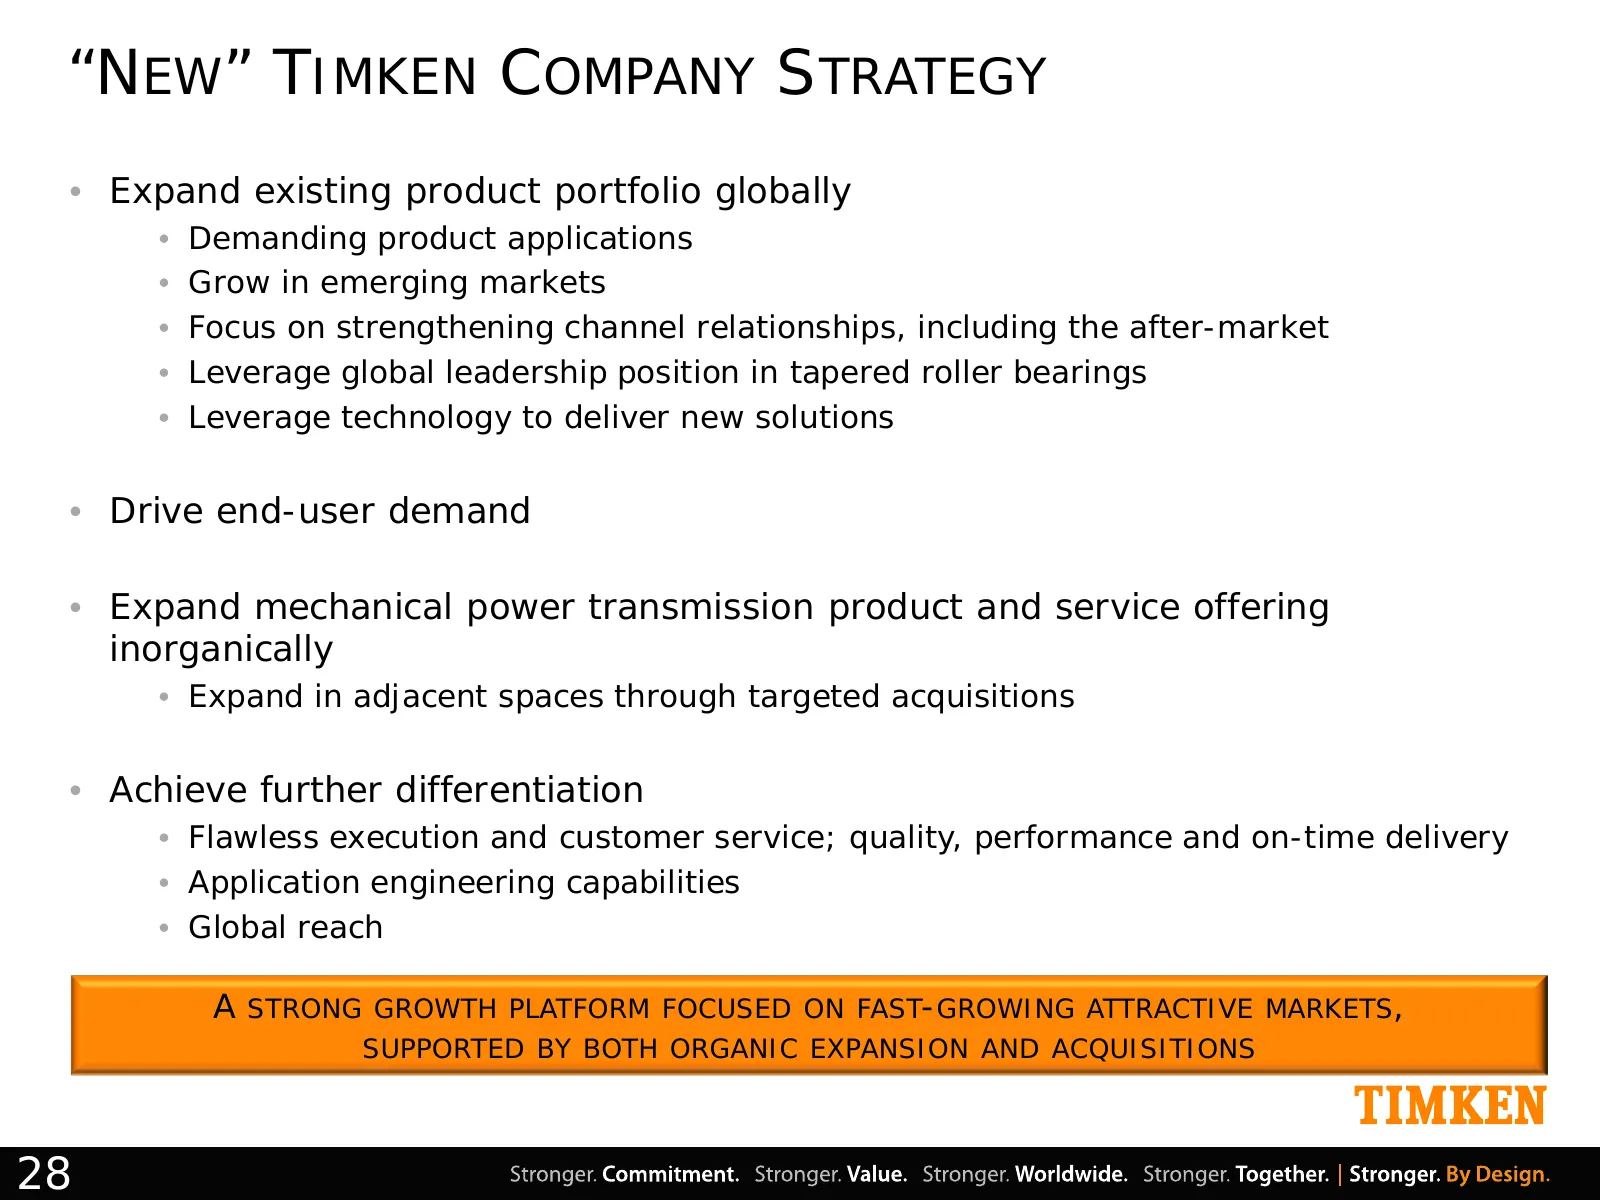
“NEW” TIMKEN COMPANY STRATEGY • Expand existing product portfolio globally • Demanding product applications • Grow in emerging markets • Focus on strengthening channel relationships, including the after-market • Leverage global leadership position in tapered roller bearings • Leverage technology to
Slide 29: Overview of Planned Separation
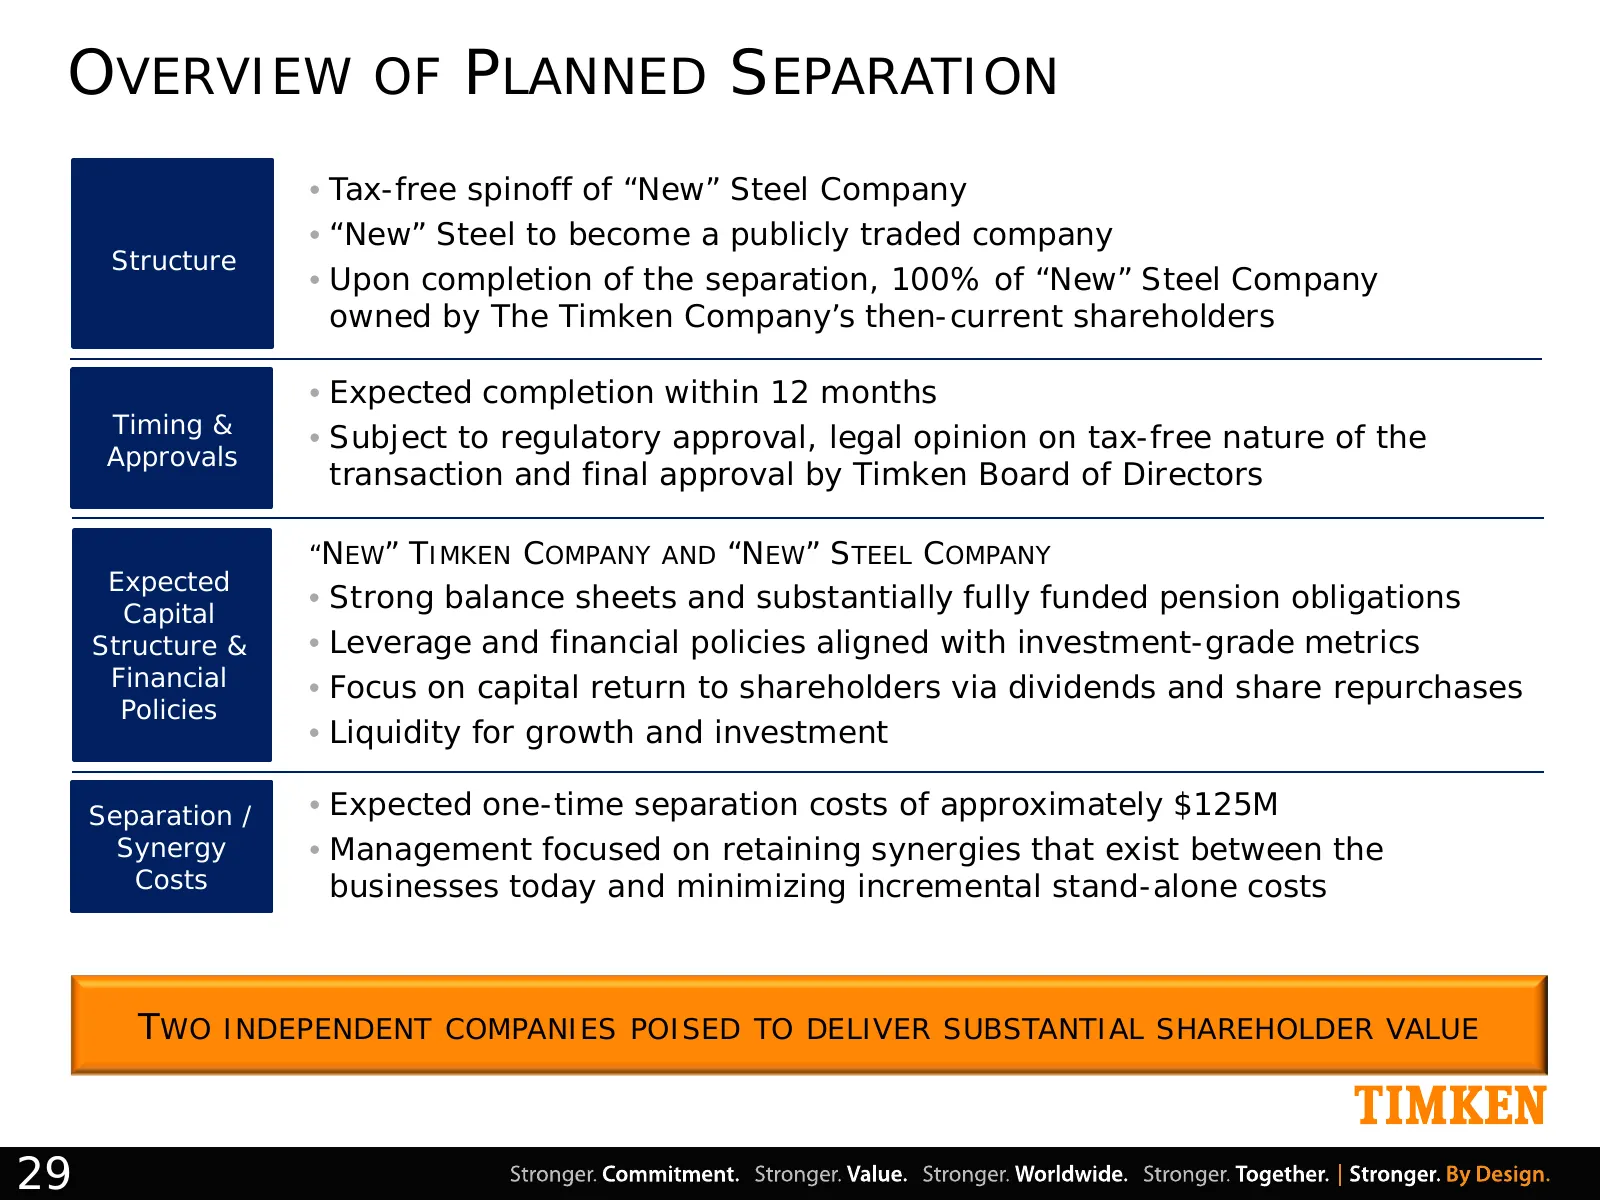
OVERVIEW OF PLANNED SEPARATION • Tax-free spinoff of “New” Steel Company • “New” Steel to become a publicly traded company Structure • Upon completion of the separation, 100% of “New” Steel Company owned by The Timken Company’s then-current shareholders • Expected completion within 12 months Timing
Slide 30: Financial Review
TIMKEN Financial Review Stronger. Commitment. Stronger. Value. Stronger. Worldwide. Stronger. Together. | Stronger. By Design.
Slide 31: 2012 Results
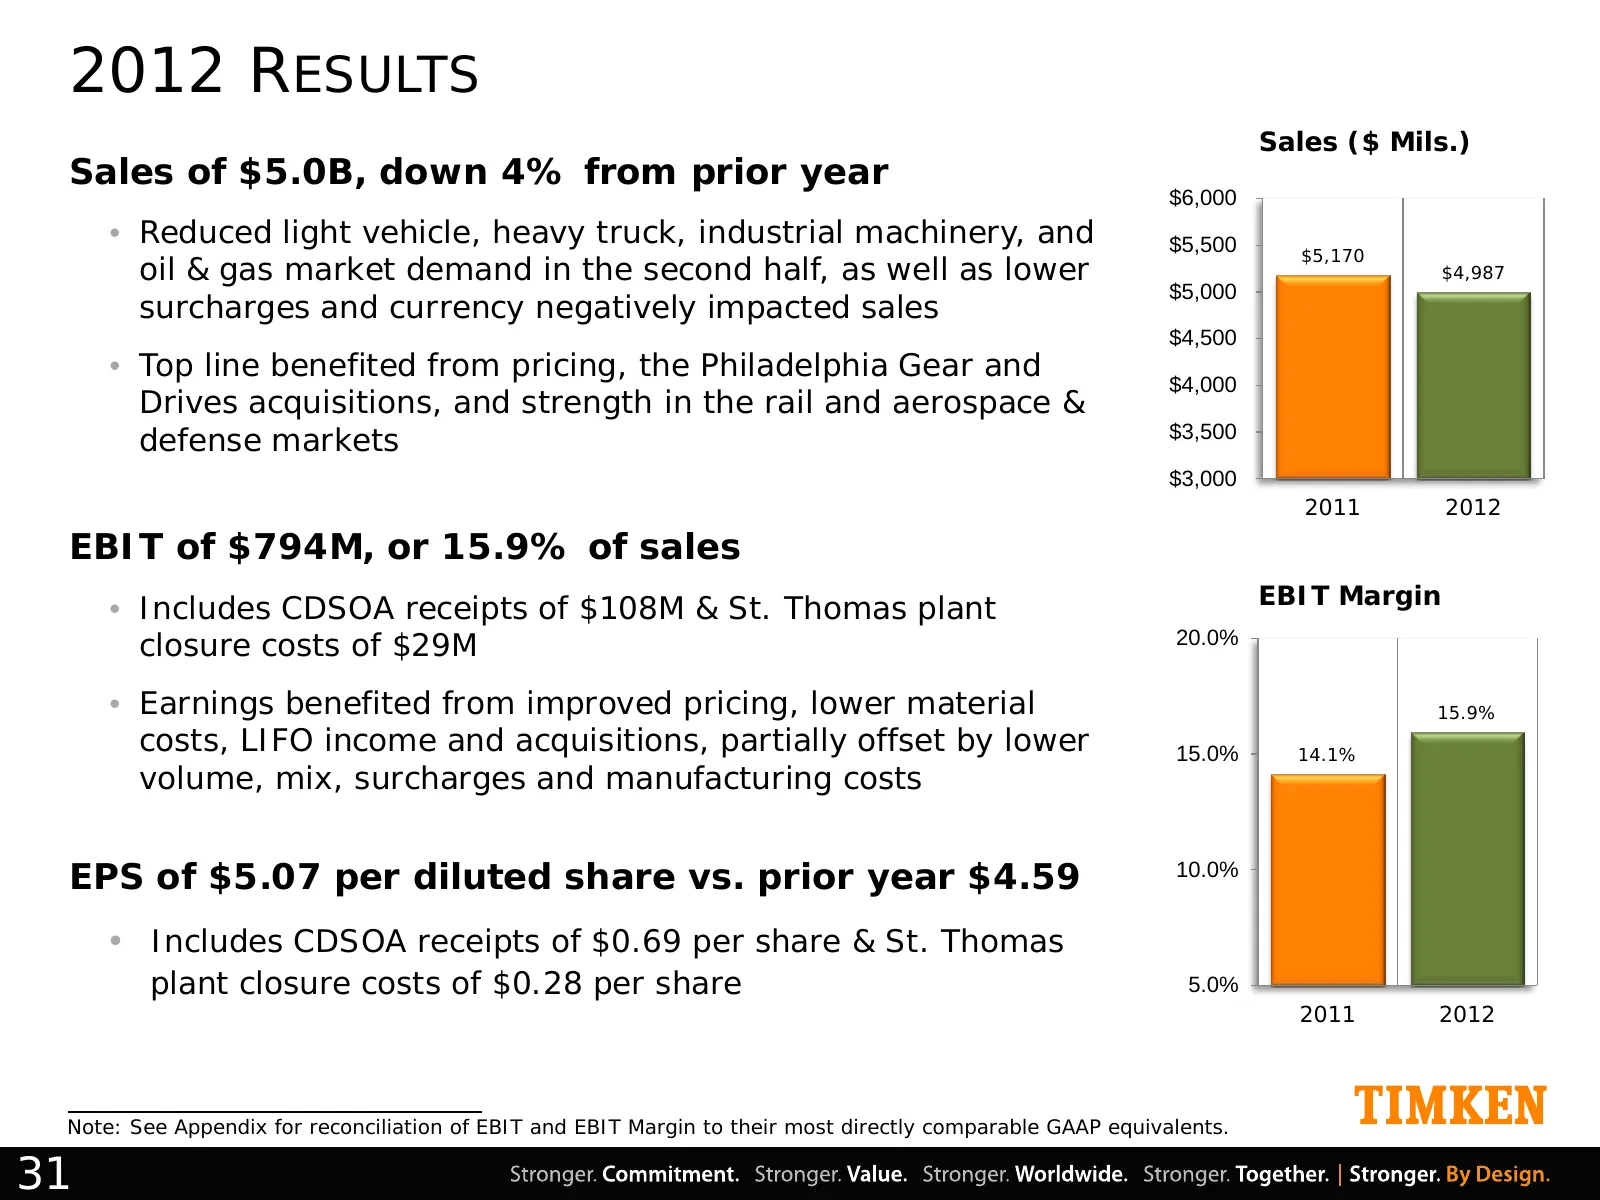
2012 RESULTS Sales ($ Mils.) Sales of $5.0B, down 4% from prior year $6,000 • Reduced light vehicle, heavy truck, industrial machinery, and $5,500 $5,170 oil & gas market demand in the second half, as well as lower $4,987 $5,000 surcharges and currency negatively impacted sales $4,500 • Top line ben
Slide 32: 2012 Results
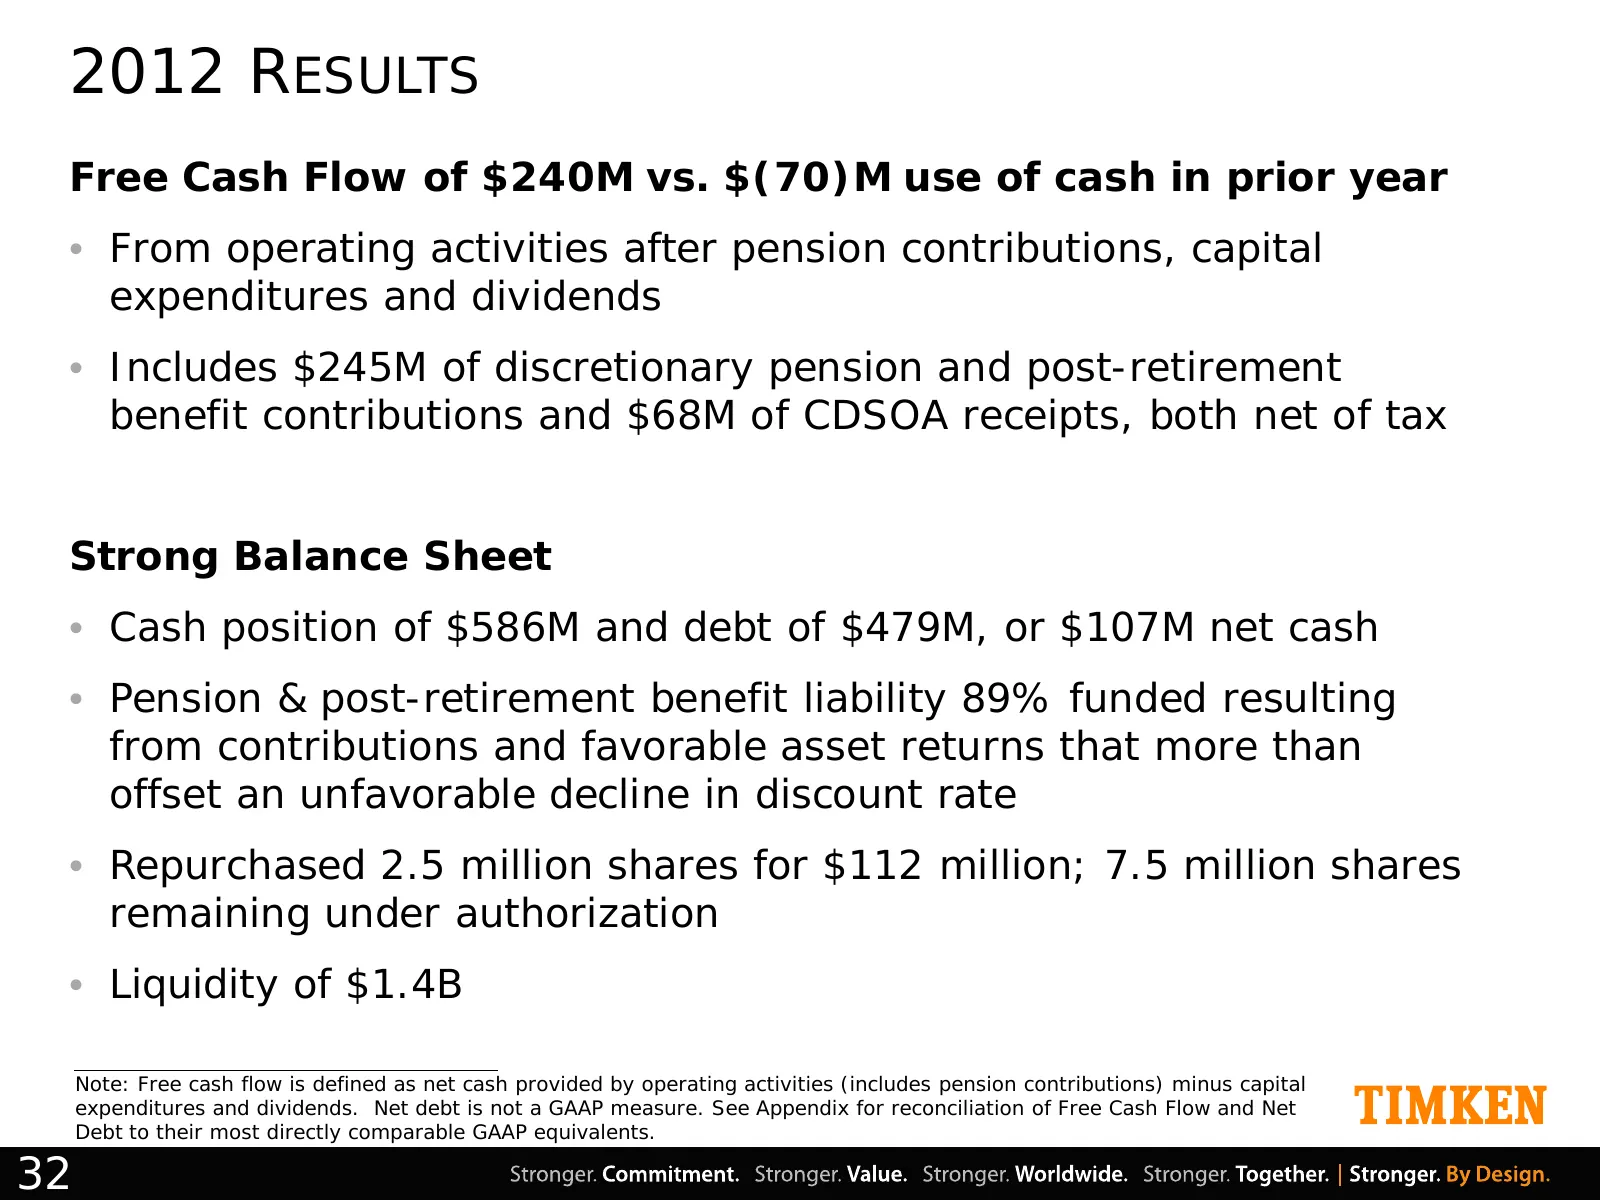
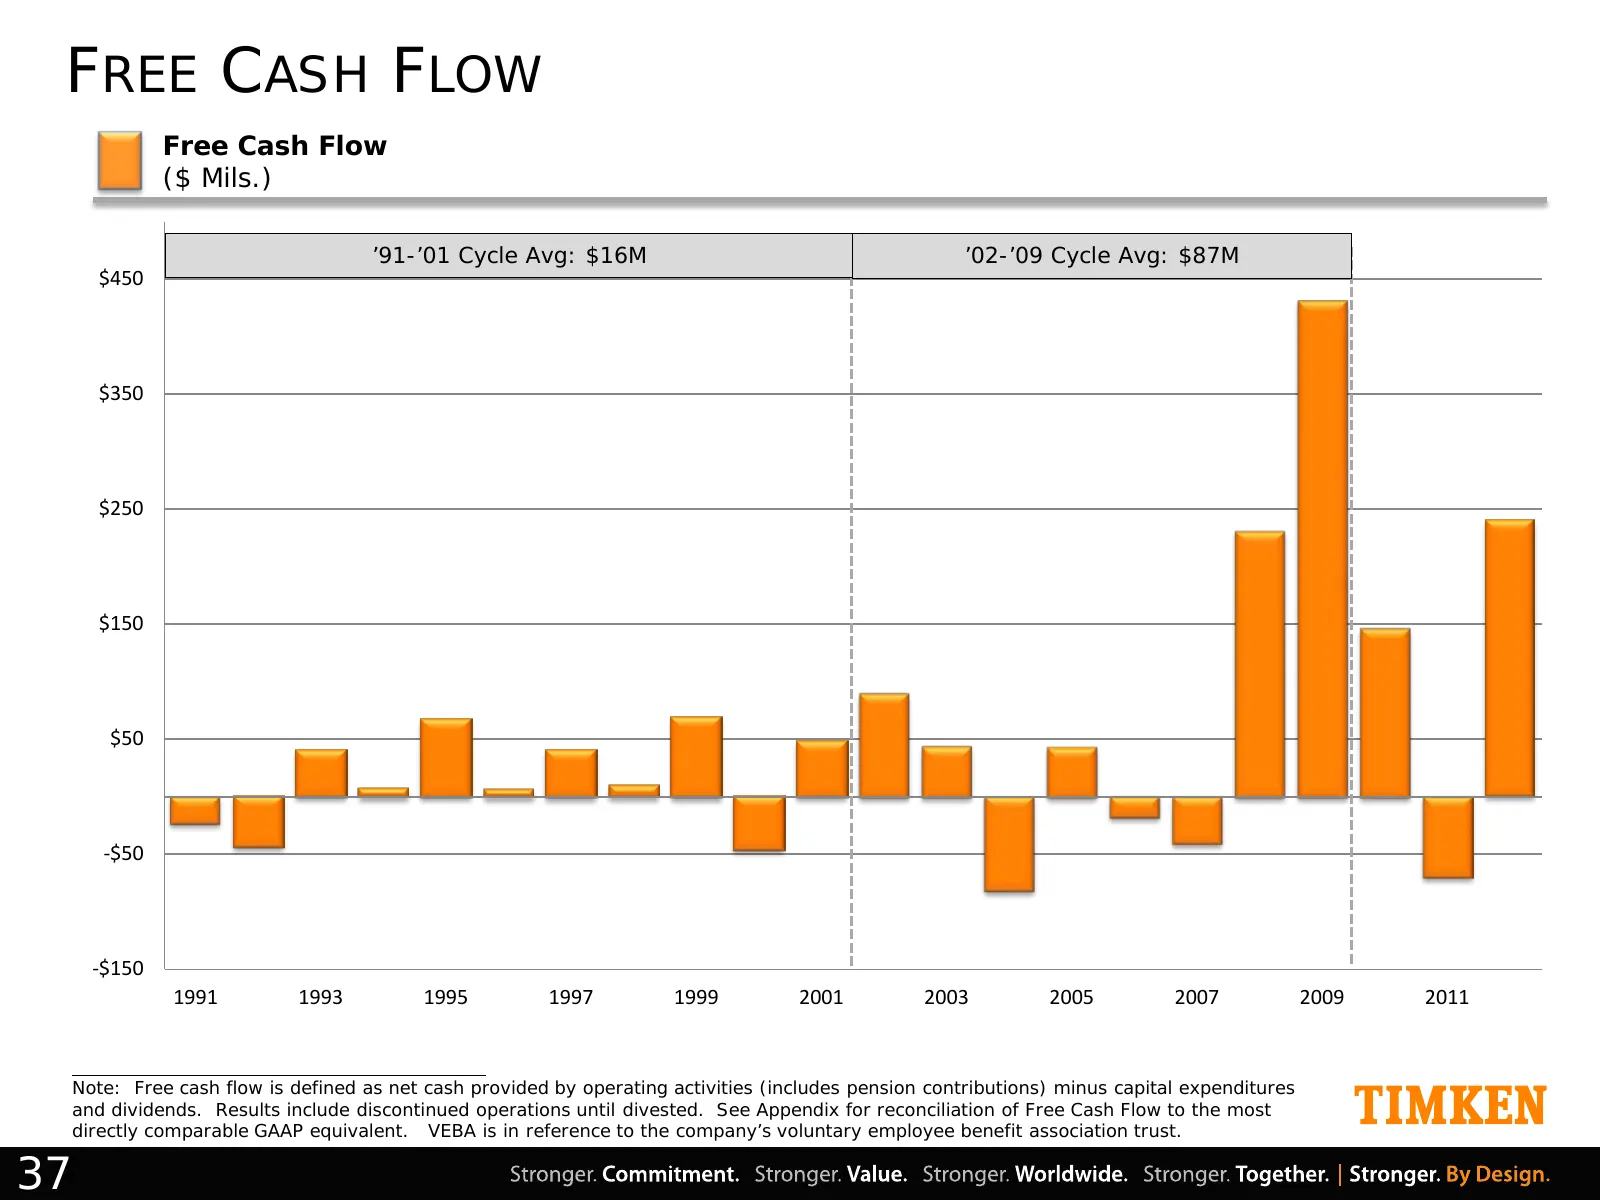
2012 RESULTS Free Cash Flow of $240M vs. $(70)M use of cash in prior year • From operating activities after pension contributions, capital expenditures and dividends • Includes $245M of discretionary pension and post-retirement benefit contributions and $68M of CDSOA receipts, both net of tax Strong
Slide 33: 2013 Results – First Nine Months
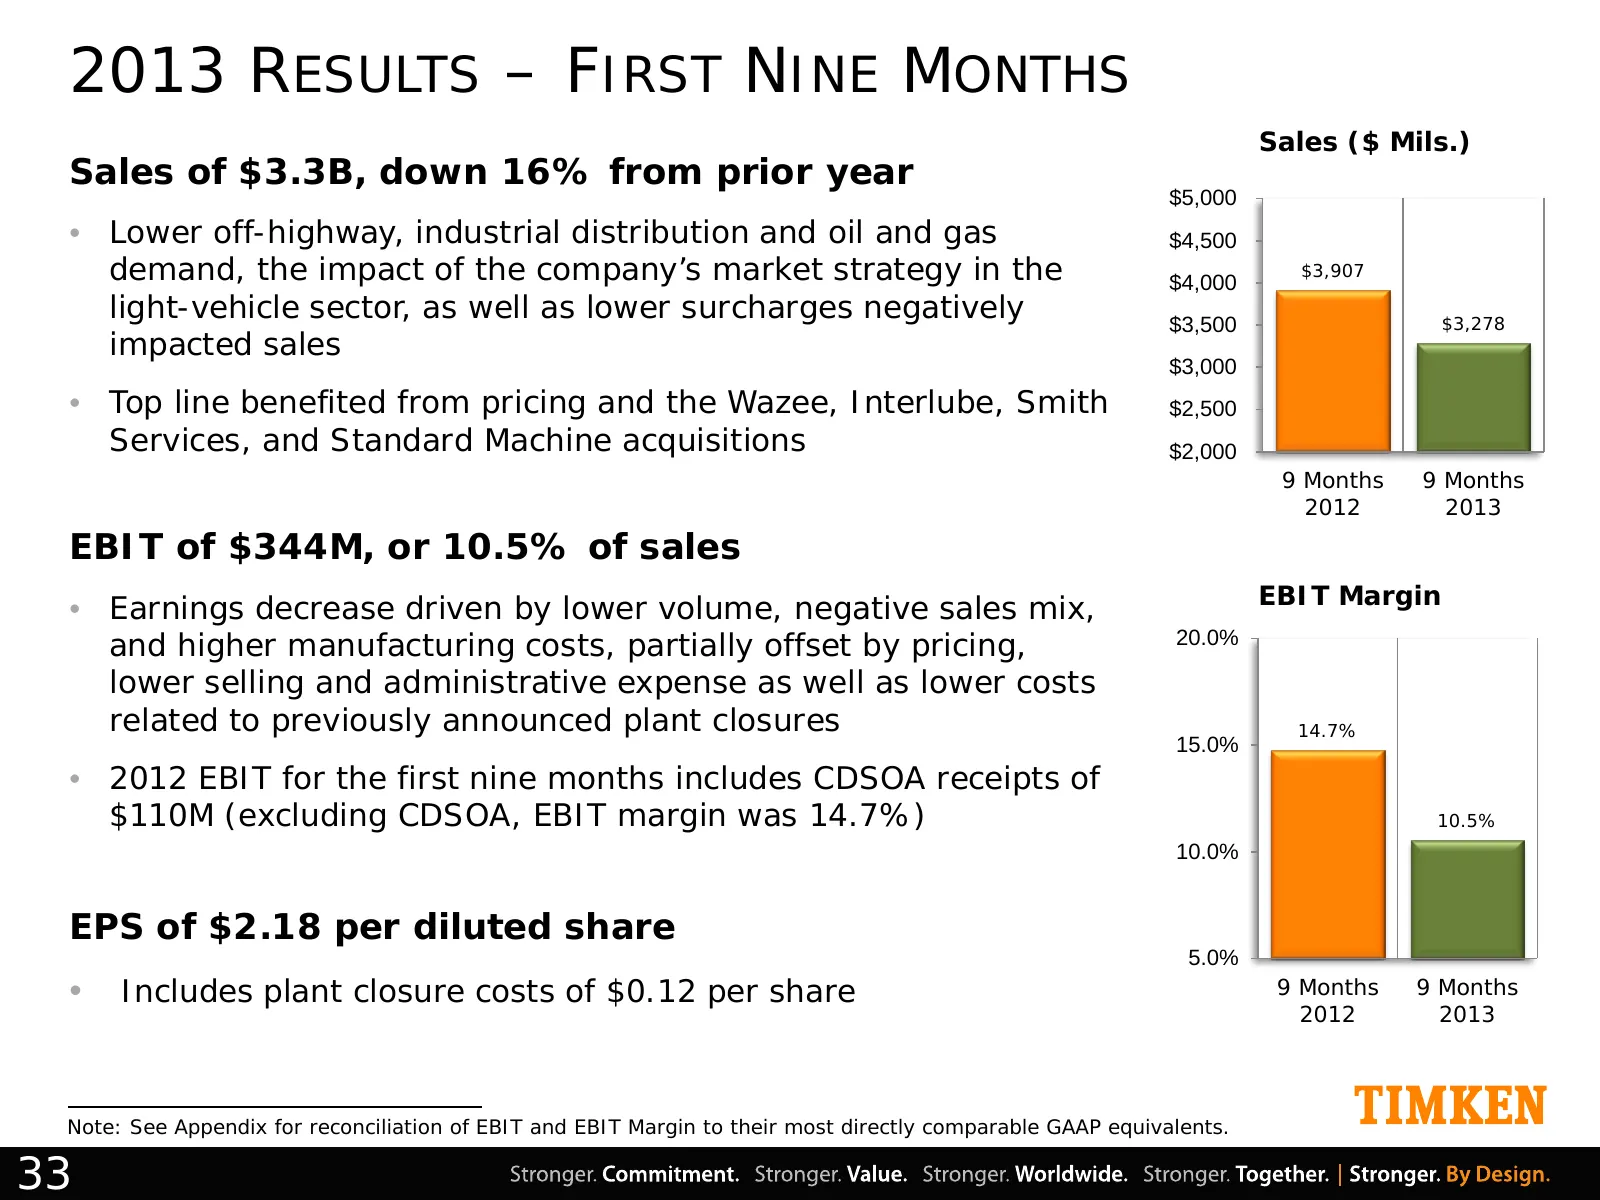
2013 RESULTS – FIRST NINE MONTHS Sales ($ Mils.) Sales of $3.3B, down 16% from prior year $5,000 • Lower off-highway, industrial distribution and oil and gas $4,500 demand, the impact of the company’s market strategy in the $4,000 $3,907 light-vehicle sector, as well as lower surcharges negatively $
Slide 34: 2013 Results – First Nine Months
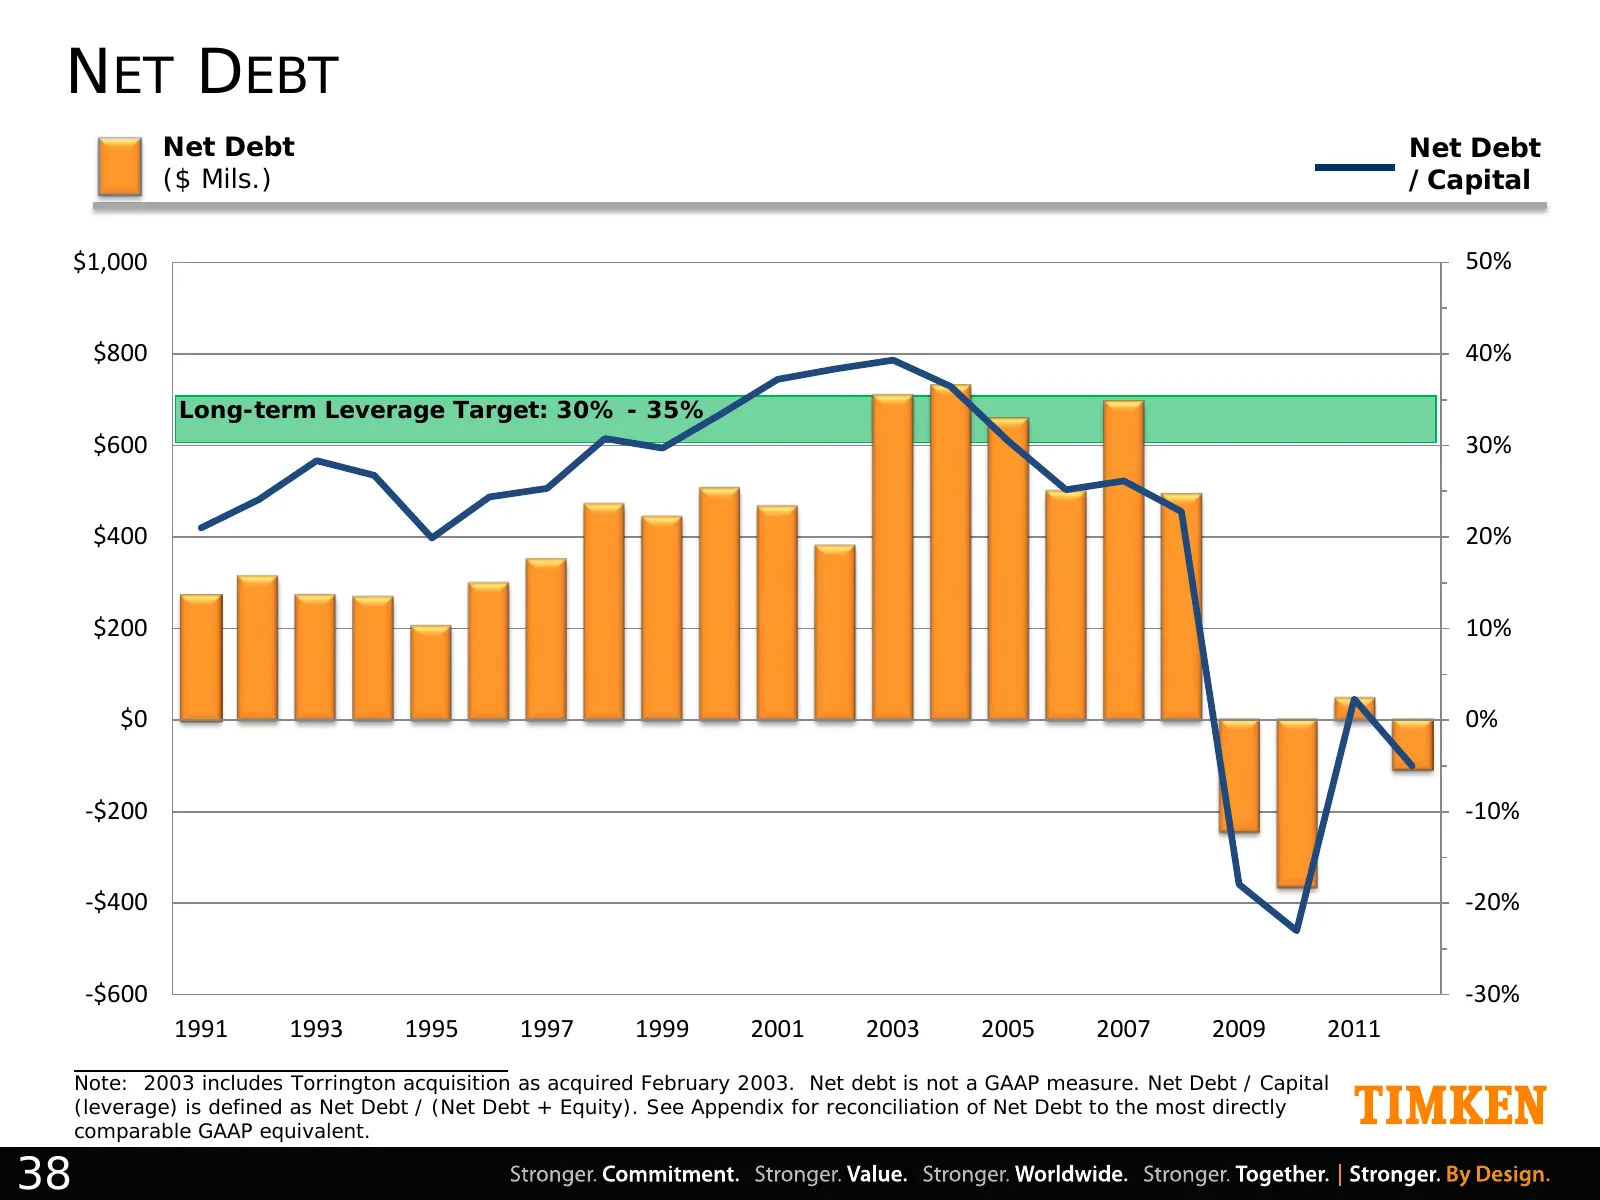
2013 RESULTS – FIRST NINE MONTHS Free Cash Flow, a use of $25M • From operating activities after pension contributions, capital expenditures of $210M and dividends of $66M • Includes $66M of discretionary pension contributions, net of tax Strong Balance Sheet • Cash position of $418M, or $59M net de
Slide 35: Sales
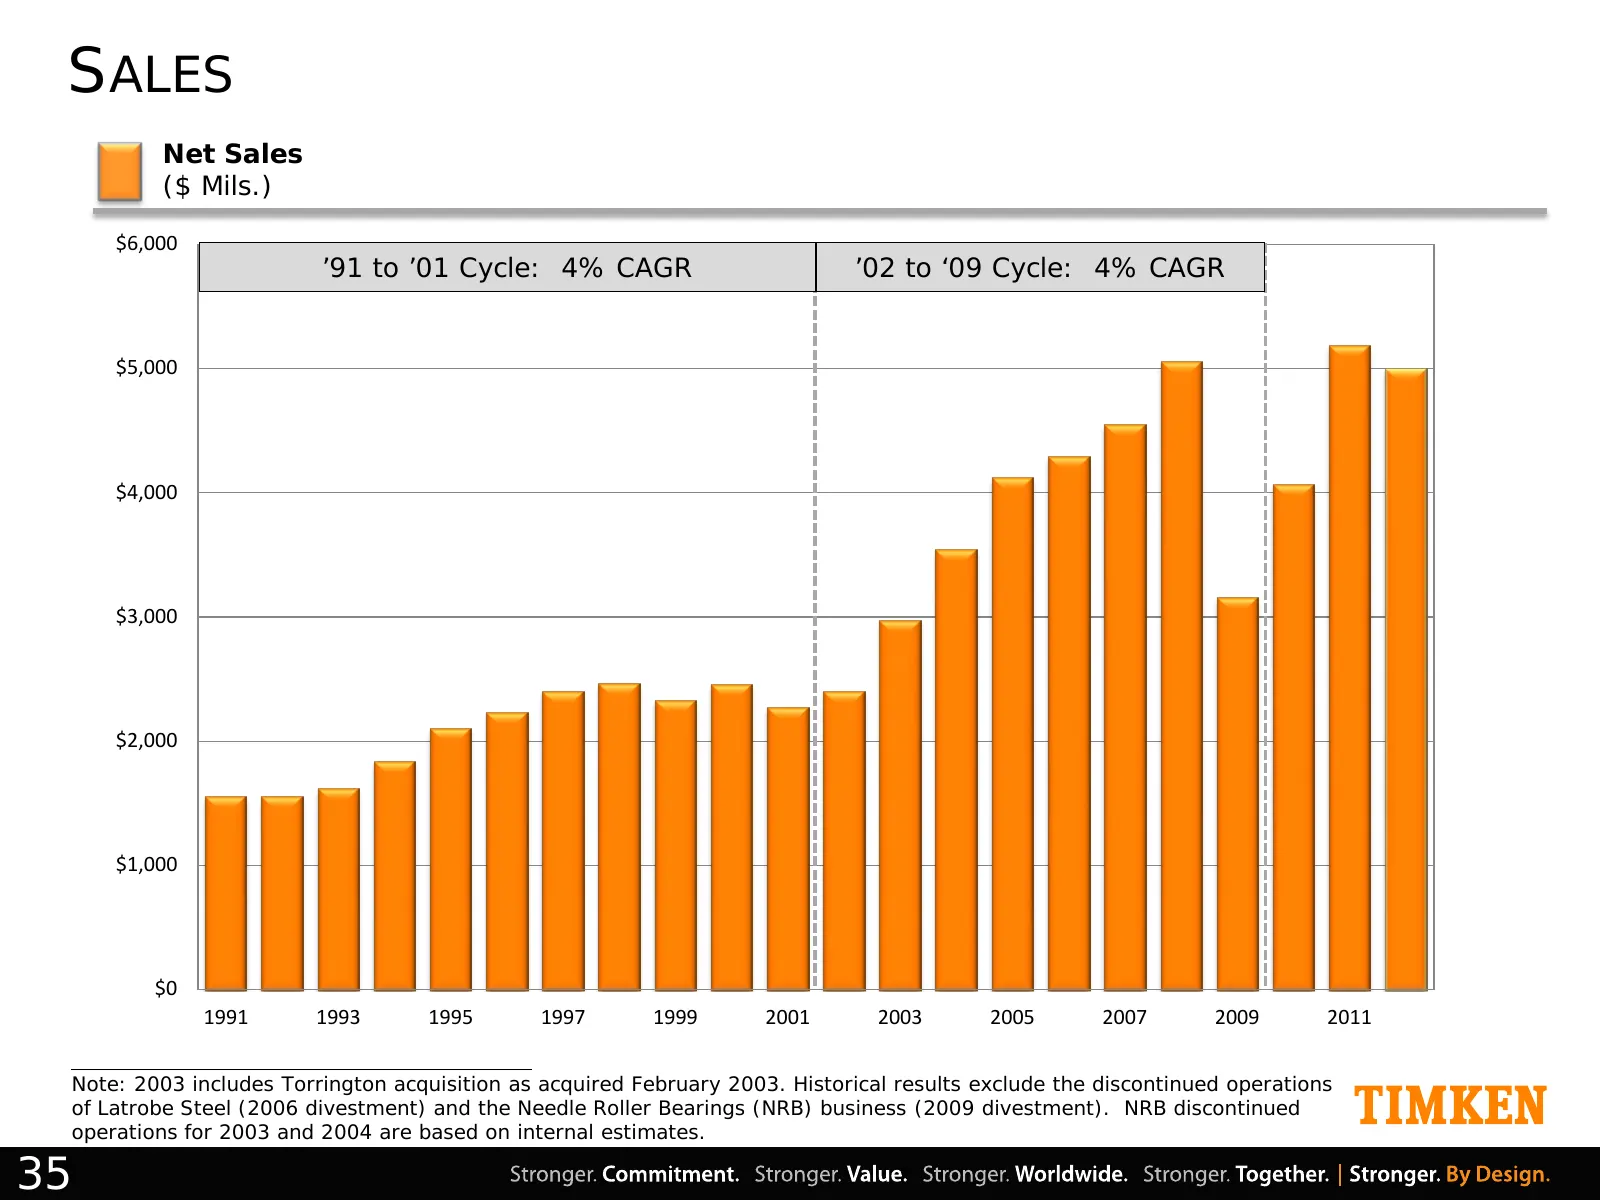
SALES Net Sales ($ Mils.) $6,000 ’91 to ’01 Cycle: 4% CAGR ’02 to ‘09 Cycle: 4% CAGR $5,000 $4,000 $3,000 $2,000 $1,000 $0 1991 1993 1995 1997 1999 2001 2003 2005 2007 2009 2011 Note: 2003 includes Torrington acquisition as acquired February 2003. Historical results exclude the discontinued operatio
Slide 36: Earnings Per Share
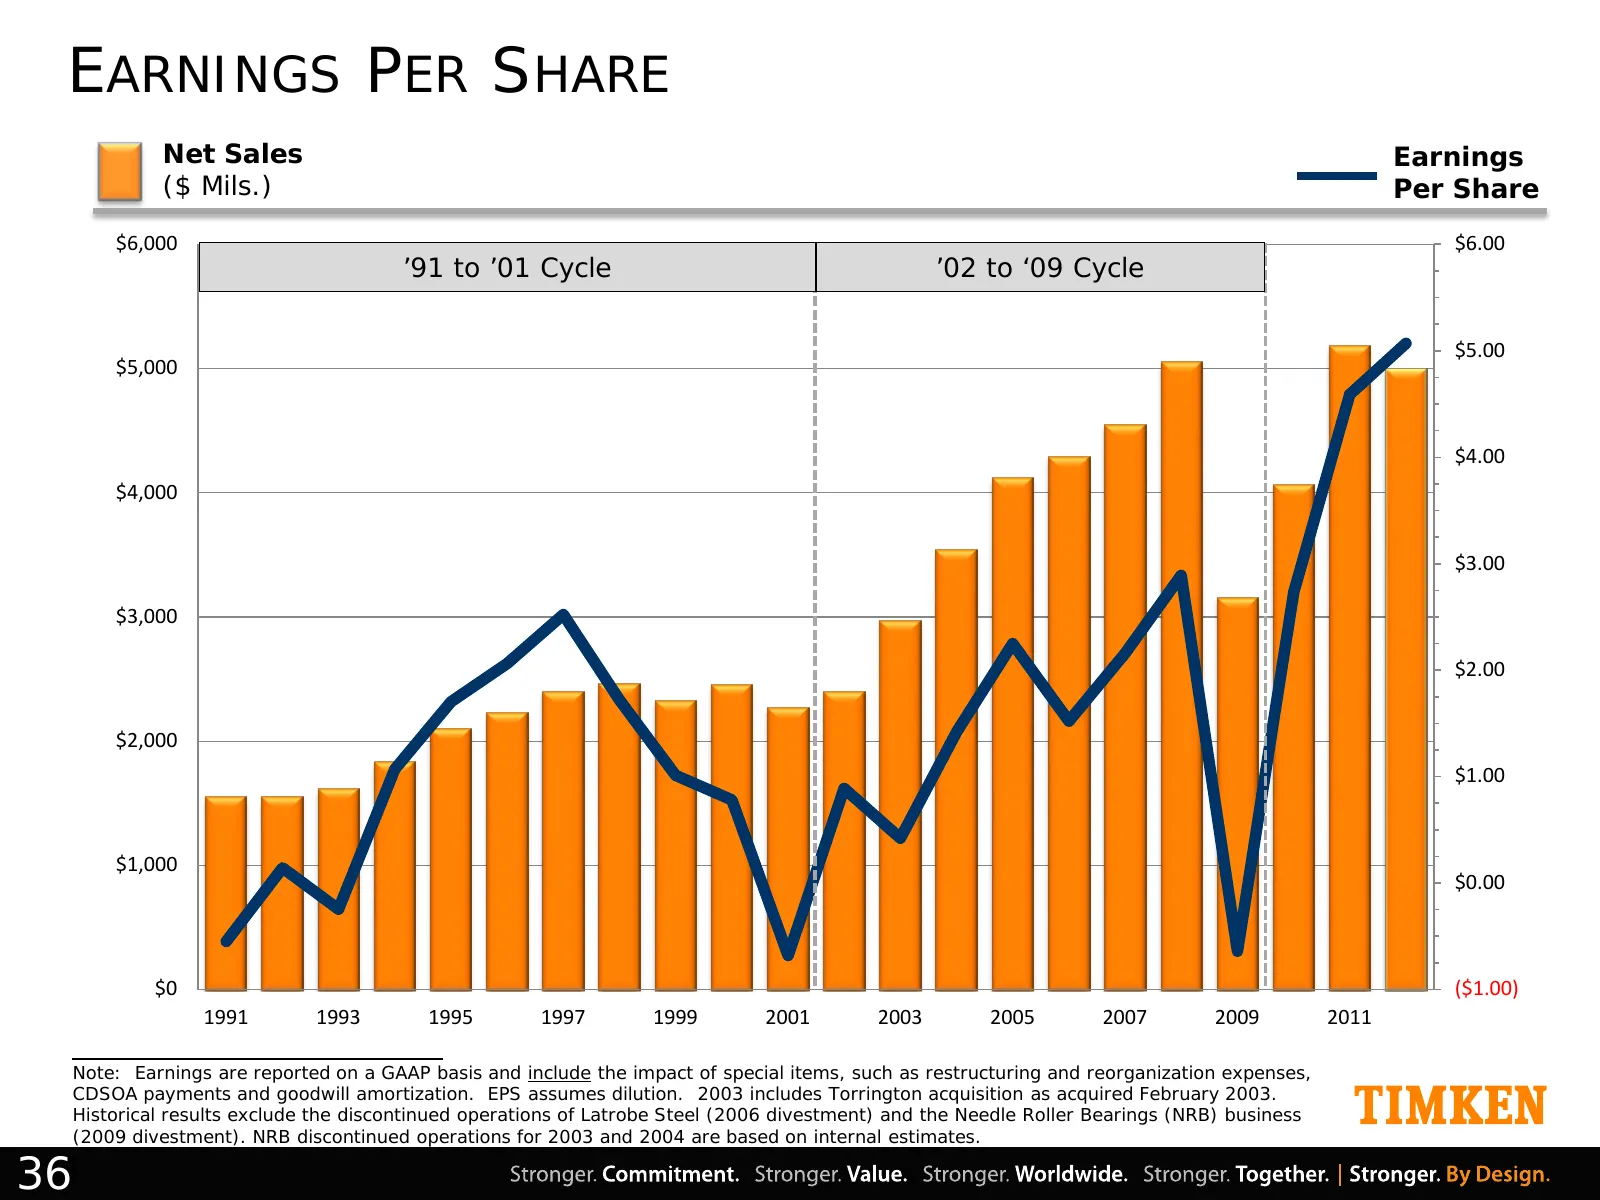
EARNINGS PER SHARE Net Sales Earnings ($ Mils.) Per Share $6,000 $6.00 ’91 to ’01 Cycle ’02 to ‘09 Cycle $5.00 $5,000 $4.00 $4,000 $3.00 $3,000 $2.00 $2,000 $1.00 $1,000 $0.00 $0 ($1.00) 1991 1993 1995 1997 1999 2001 2003 2005 2007 2009 2011 Note: Earnings are reported on a GAAP basis and include th
Slide 37: Free Cash Flow
FREE CASH FLOW Free Cash Flow ($ Mils.) ’91-’01 Cycle Avg: $16M ’02-’09 Cycle Avg: $87M $450 $350 $250 $150 $50 -$50 -$150 1991 1993 1995 1997 1999 2001 2003 2005 2007 2009 2011 Note: Free cash flow is defined as net cash provided by operating activities (includes pension contributions) minus capita
Slide 38: Net Debt
NET DEBT Net Debt Net Debt ($ Mils.) /Capital $1,000 50% $800 40% Long-term Leverage Target: 30% - 35% $600 30% $400 20% $200 10% $0 0% -$200 -10% -$400 -20% -$600 -30% 1991 1993 1995 1997 1999 2001 2003 2005 2007 2009 2011 Note: 2003 includes Torrington acquisition as acquired February 2003. Net de
Slide 39: 2012 Capital Allocation Highlights
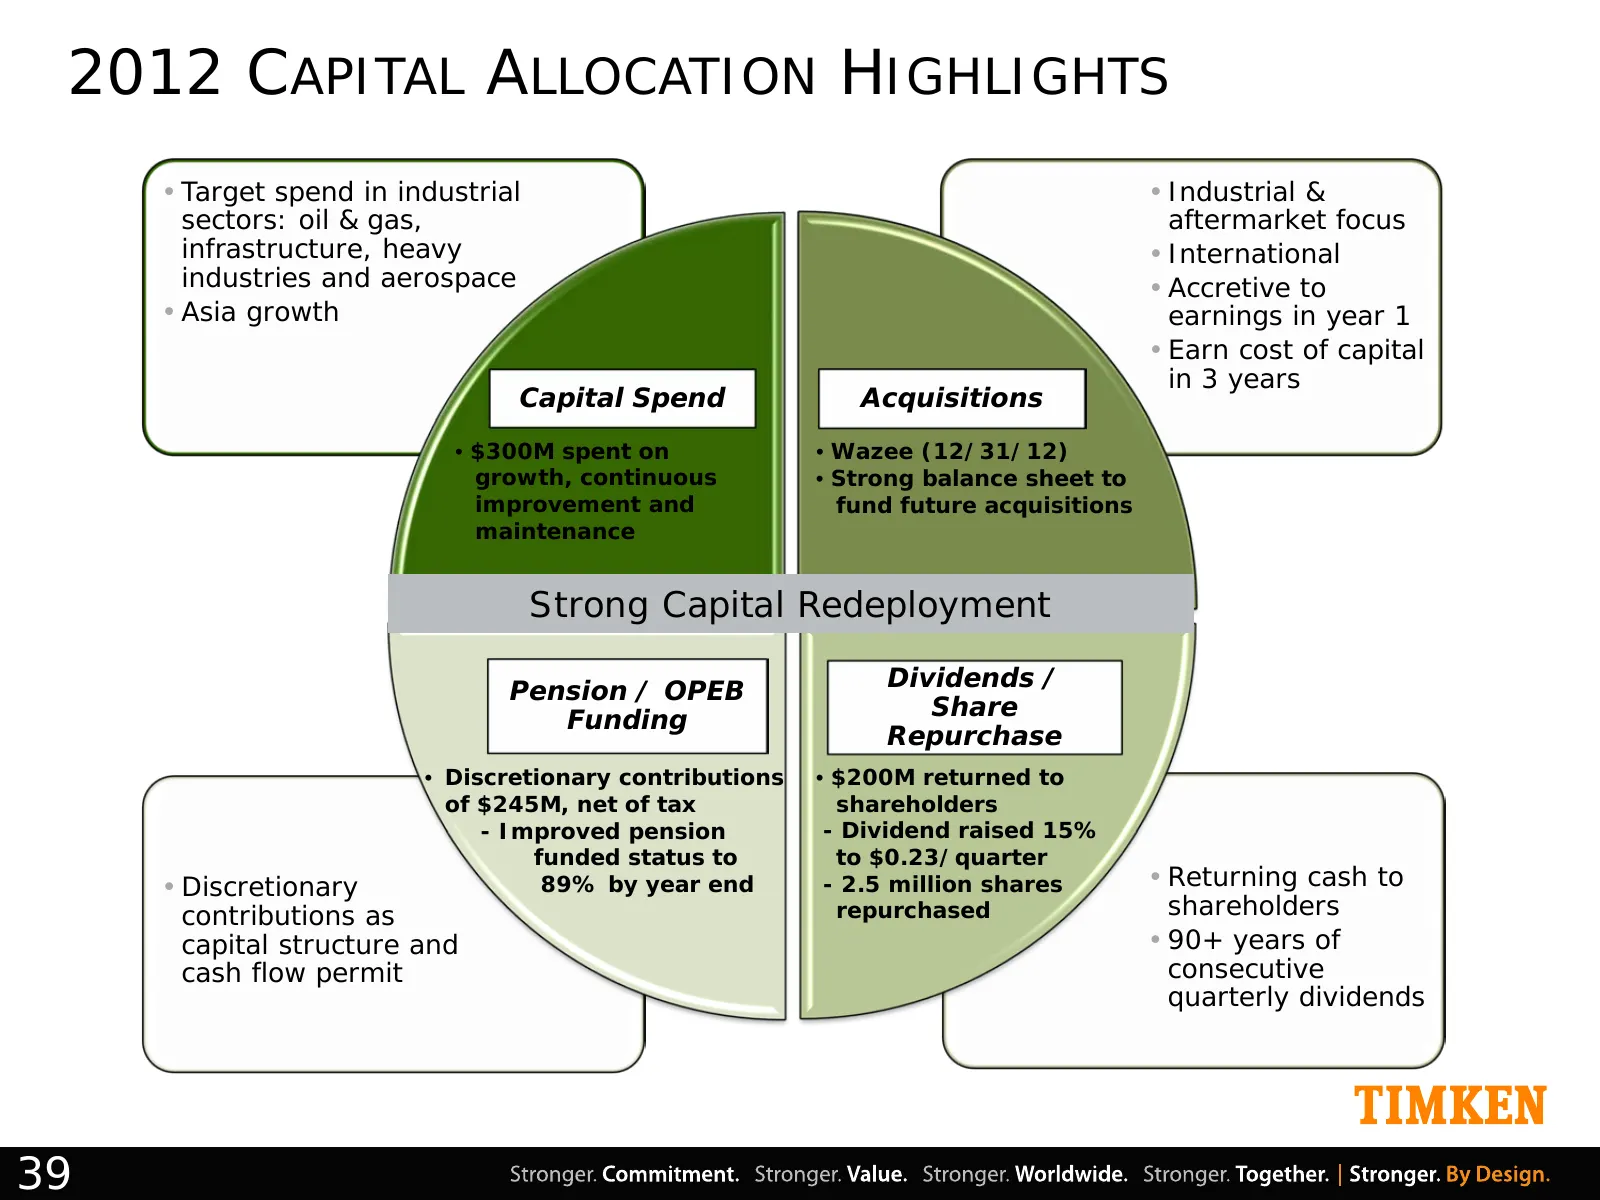
2012 CAPITAL ALLOCATION HIGHLIGHTS • Target spend in industrial • Industrial & sectors: oil & gas, aftermarket focus infrastructure, heavy • International industries and aerospace • Accretive to • Asia growth earnings in year 1 • Earn cost of capital in 3 years Capital Spend Acquisitions • $300M spe
Slide 40: 2013 Capital Allocation Highlights – First Nine Months
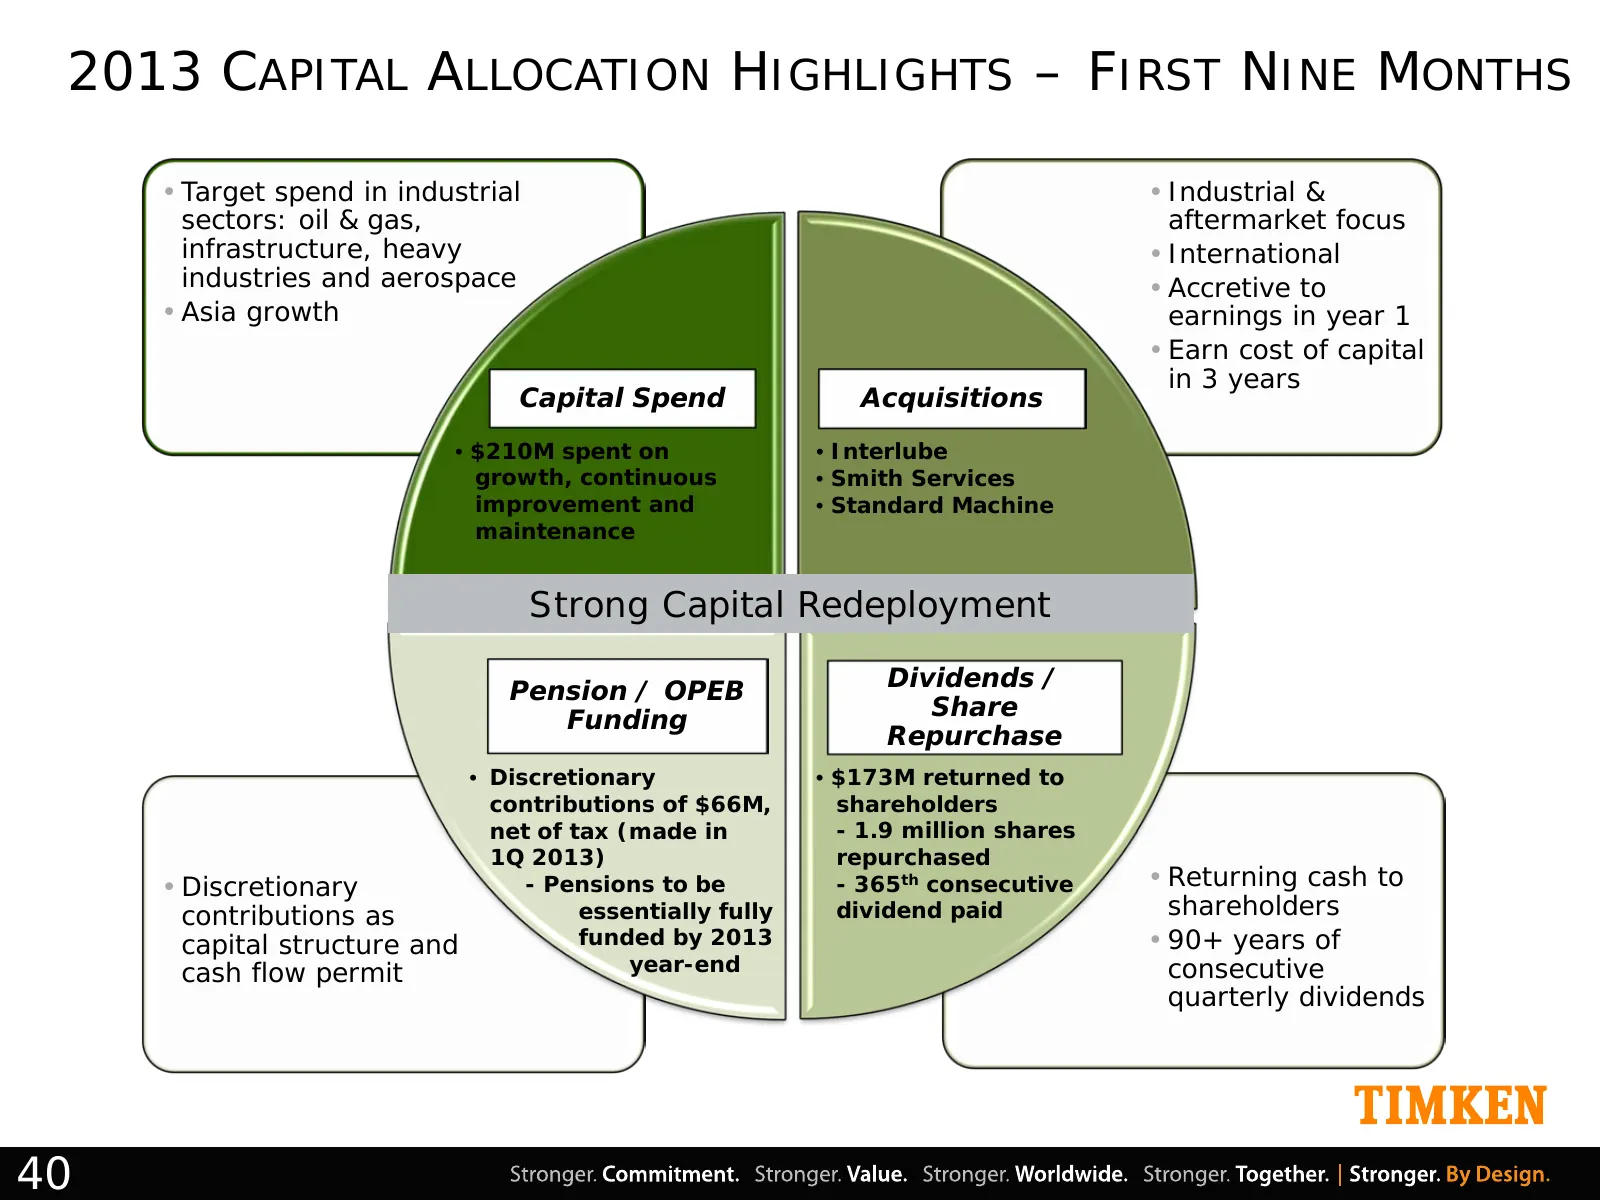
2013 CAPITAL ALLOCATION HIGHLIGHTS – FIRST NINE MONTHS • Target spend in industrial • Industrial & sectors: oil & gas, aftermarket focus infrastructure, heavy • International industries and aerospace • Accretive to • Asia growth earnings in year 1 • Earn cost of capital in 3 years Capital Spend Acqu
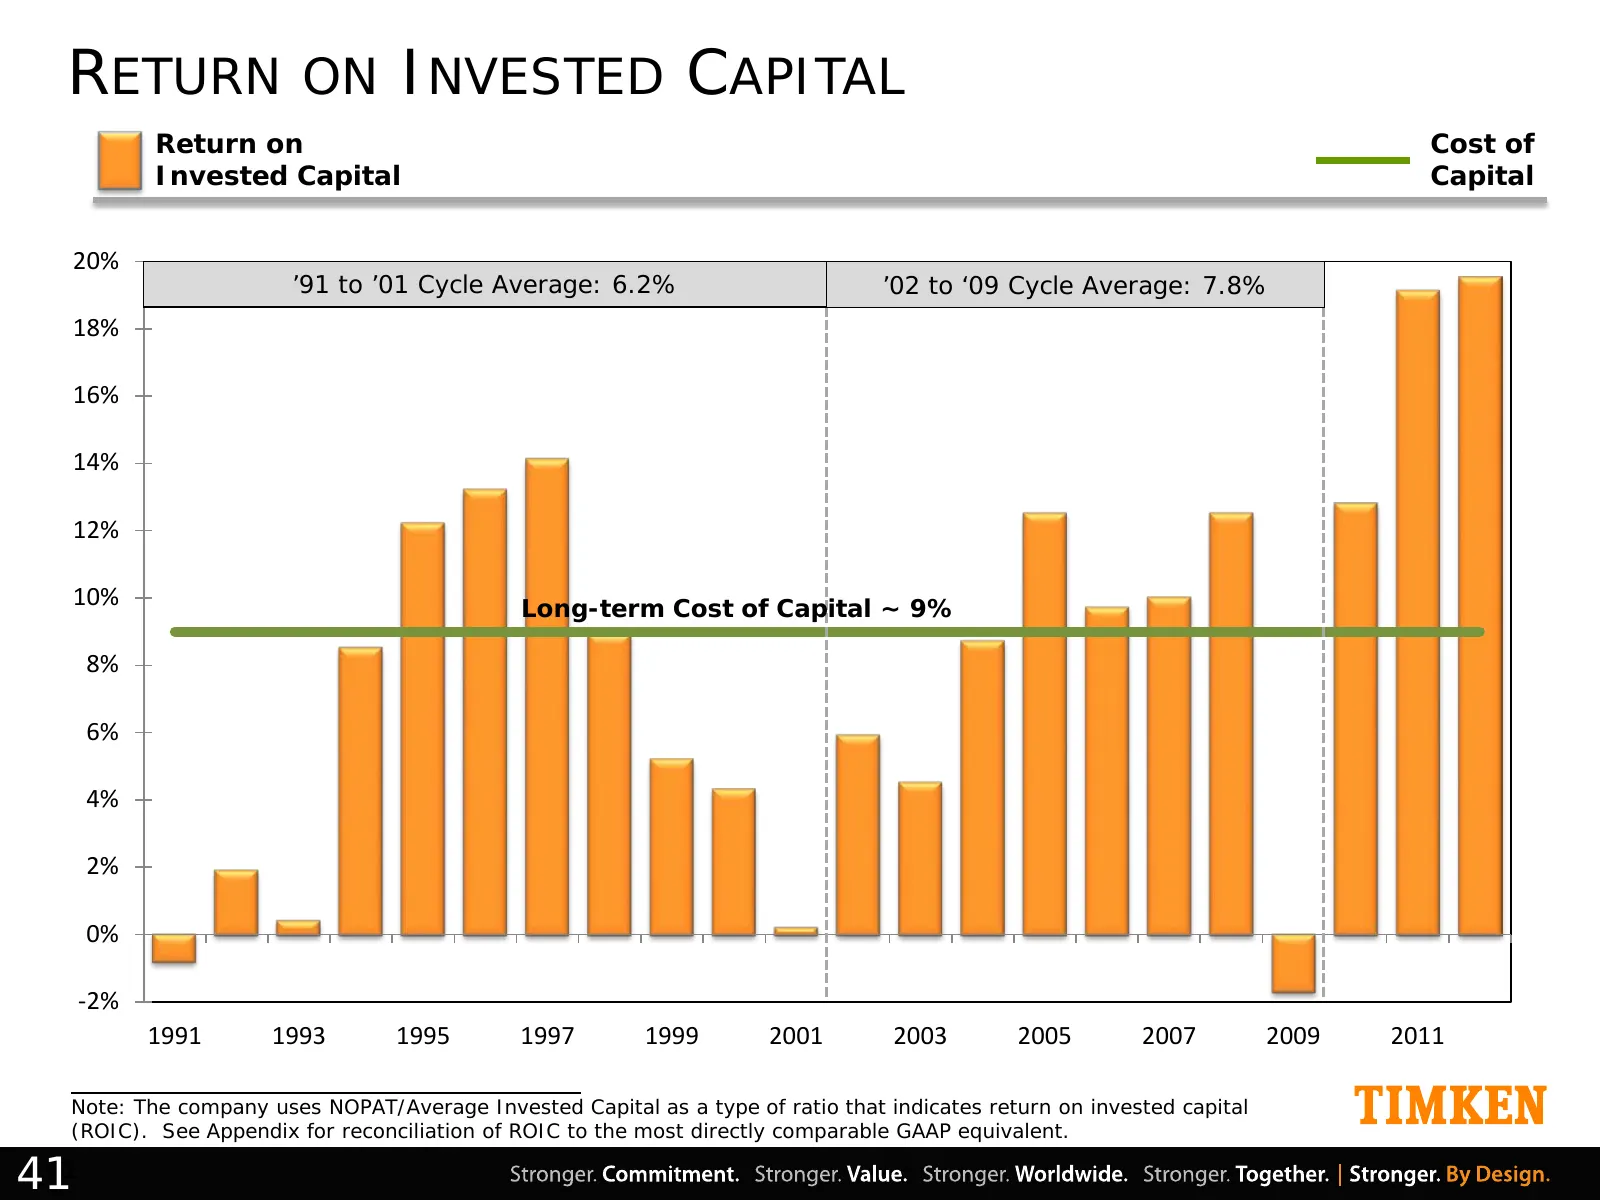
Slide 41: Return on Invested Capital
RETURN ON INVESTED CAPITAL Return on Cost of Invested Capital Capital 20% ’91 to ’01 Cycle Average: 6.2% ’02 to ‘09 Cycle Average: 7.8% 18% 16% 14% 12% 10% Long-term Cost of Capital ~ 9% 8% 6% 4% 2% 0% -2% 1991 1993 1995 1997 1999 2001 2003 2005 2007 2009 2011 Note: The company uses NOPAT/Average In
Slide 42: Timken
TIMKEN
Slide 43: Appendix
TIMKEN Appendix Stronger. Commitment. Stronger. Value. Stronger. Worldwide. Stronger. Together. | Stronger. By Design.
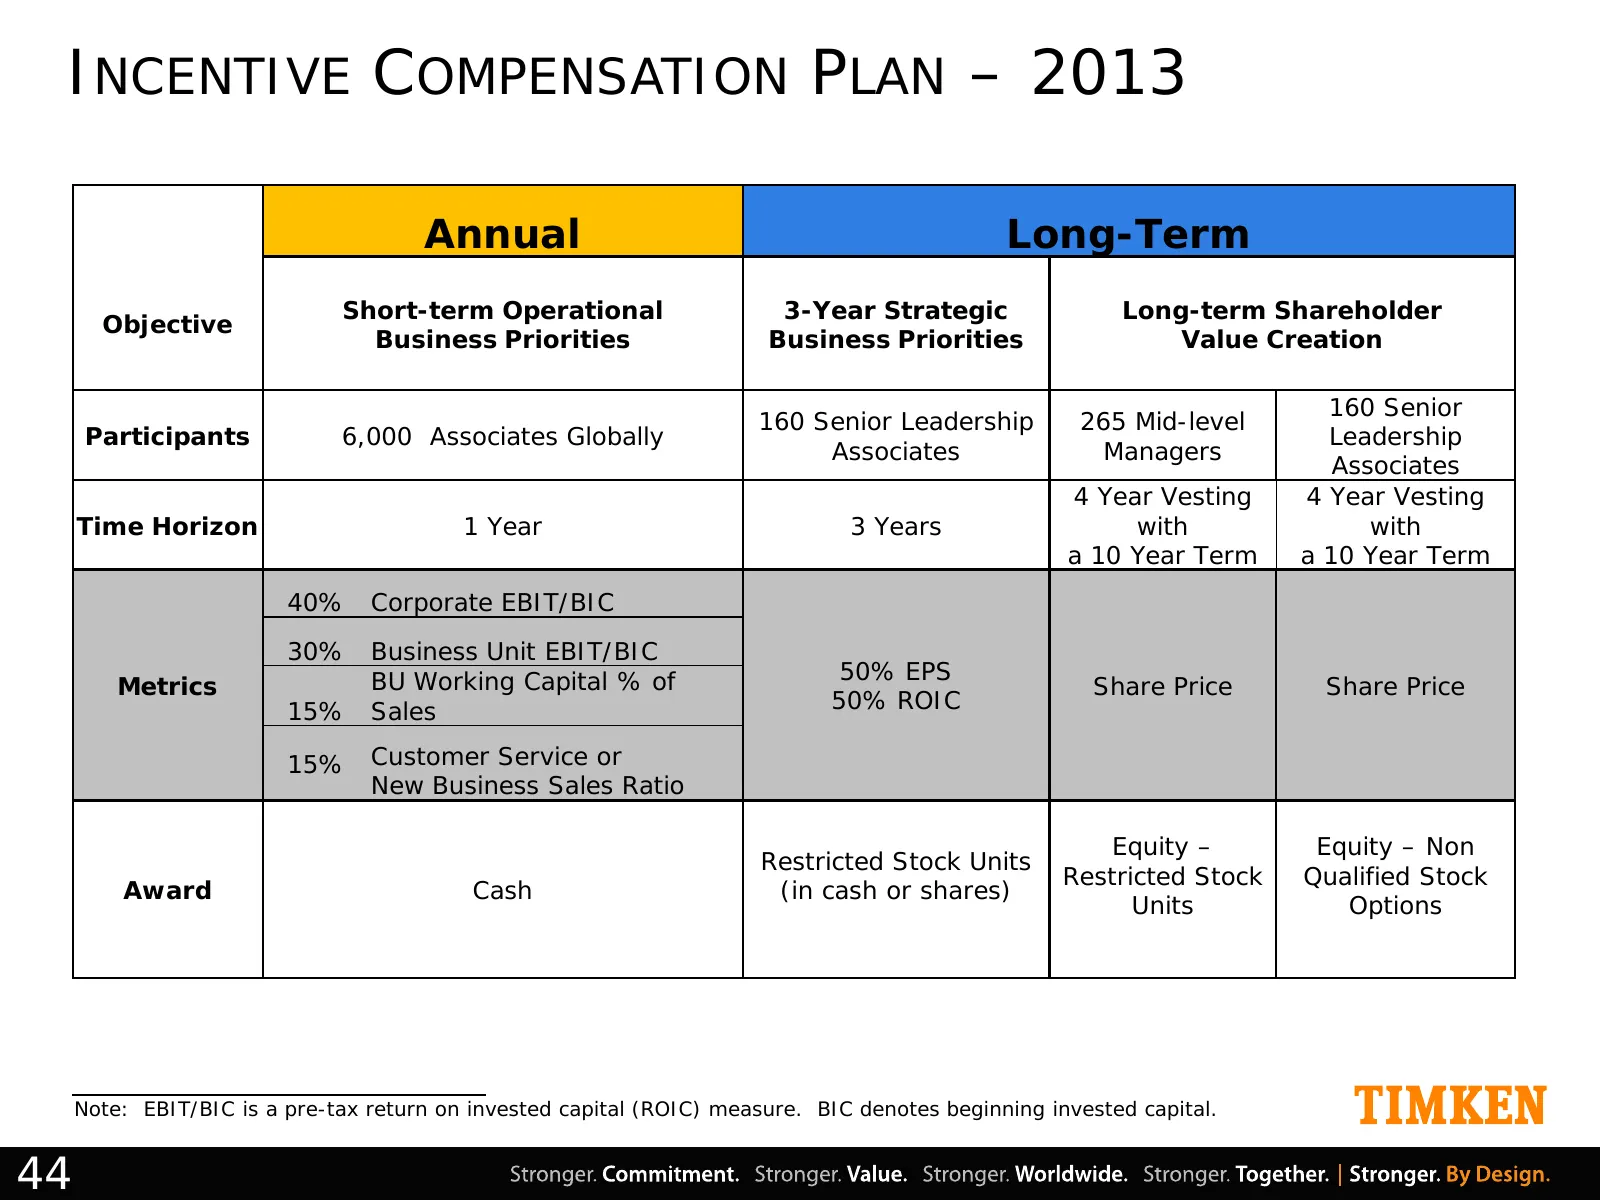
Slide 44: Incentive Compensation Plan – 2013
INCENTIVE COMPENSATION PLAN – 2013 Annual Long-Term Short-term Operational 3-Year Strategic Long-term Shareholder Objective Business Priorities Business Priorities Value Creation 160 Senior 160 Senior Leadership 265 Mid-level Participants 6,000 Associates Globally Leadership Associates Managers Asso
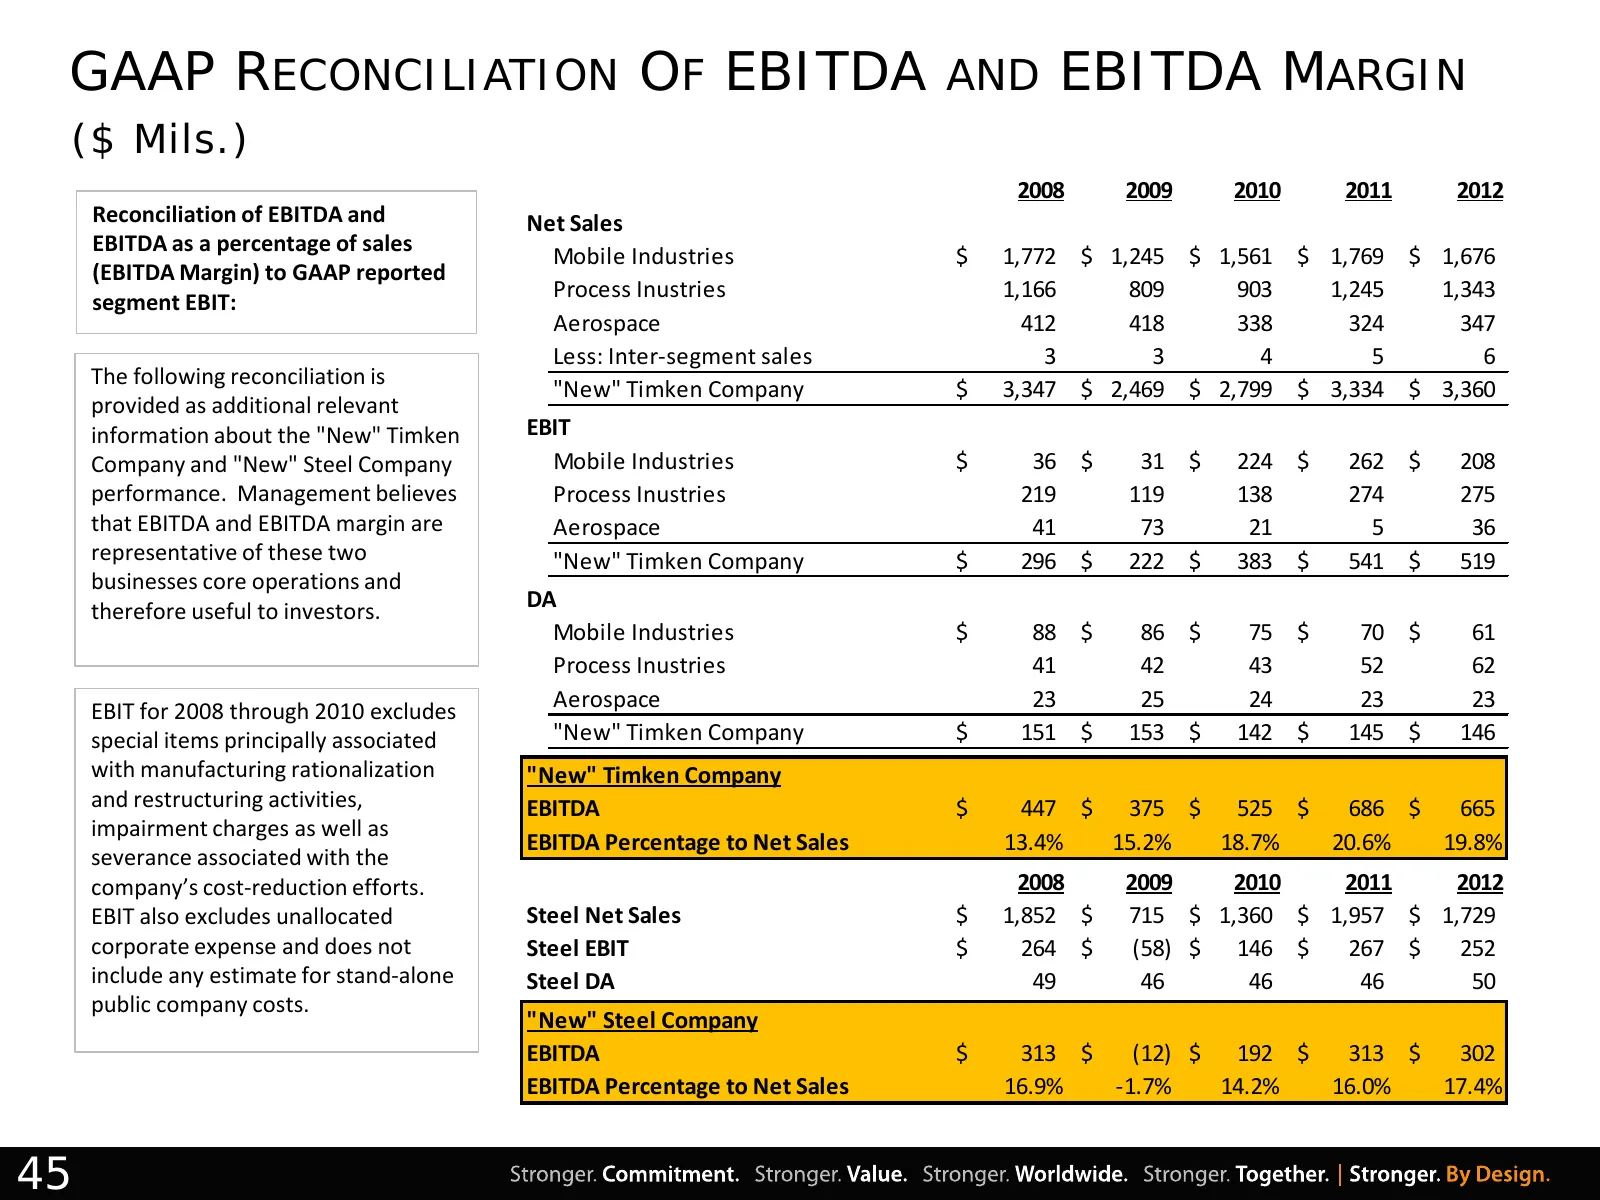
Slide 45: GAAP Reconciliation of EBITDA and EBITDA Margin
GAAP RECONCILIATION OF EBITDA AND EBITDA MARGIN ($ Mils.) 2008 2009 2010 2011 2012 Reconciliation of EBITDA and Net Sales EBITDA as a percentage of sales Mobile Industries $ 1,772 $ 1,245 $ 1,561 $ 1,769 $ 1,676 (EBITDA Margin) to GAAP reported segment EBIT: Process Inustries 1,166 809 903 1,245 1,3
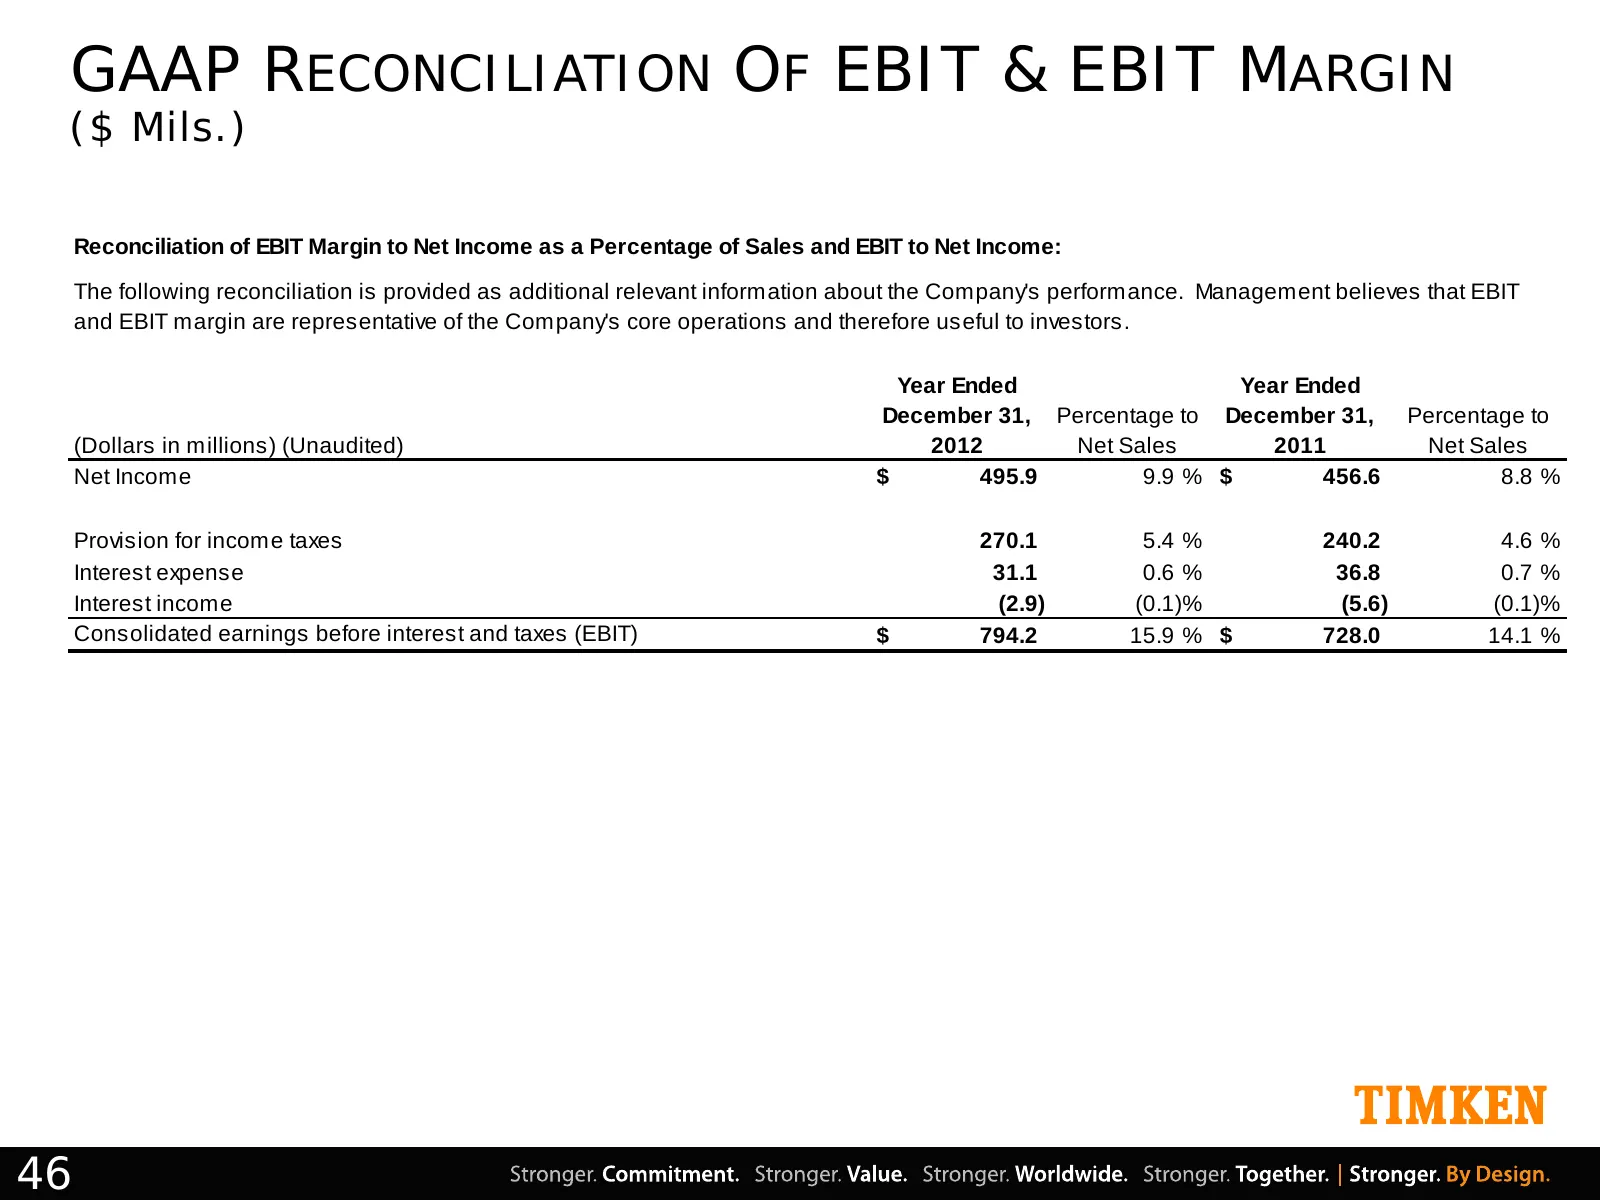
Slide 46: GAAP Reconciliation of EBIT & EBIT Margin
GAAP RECONCILIATION OF EBIT & EBIT MARGIN ($ Mils.) Reconciliation of EBIT Margin to Net Income as a Percentage of Sales and EBIT to Net Income: The following reconciliation is provided as additional relevant information about the Company's performance. Management believes that EBIT and EBIT margin
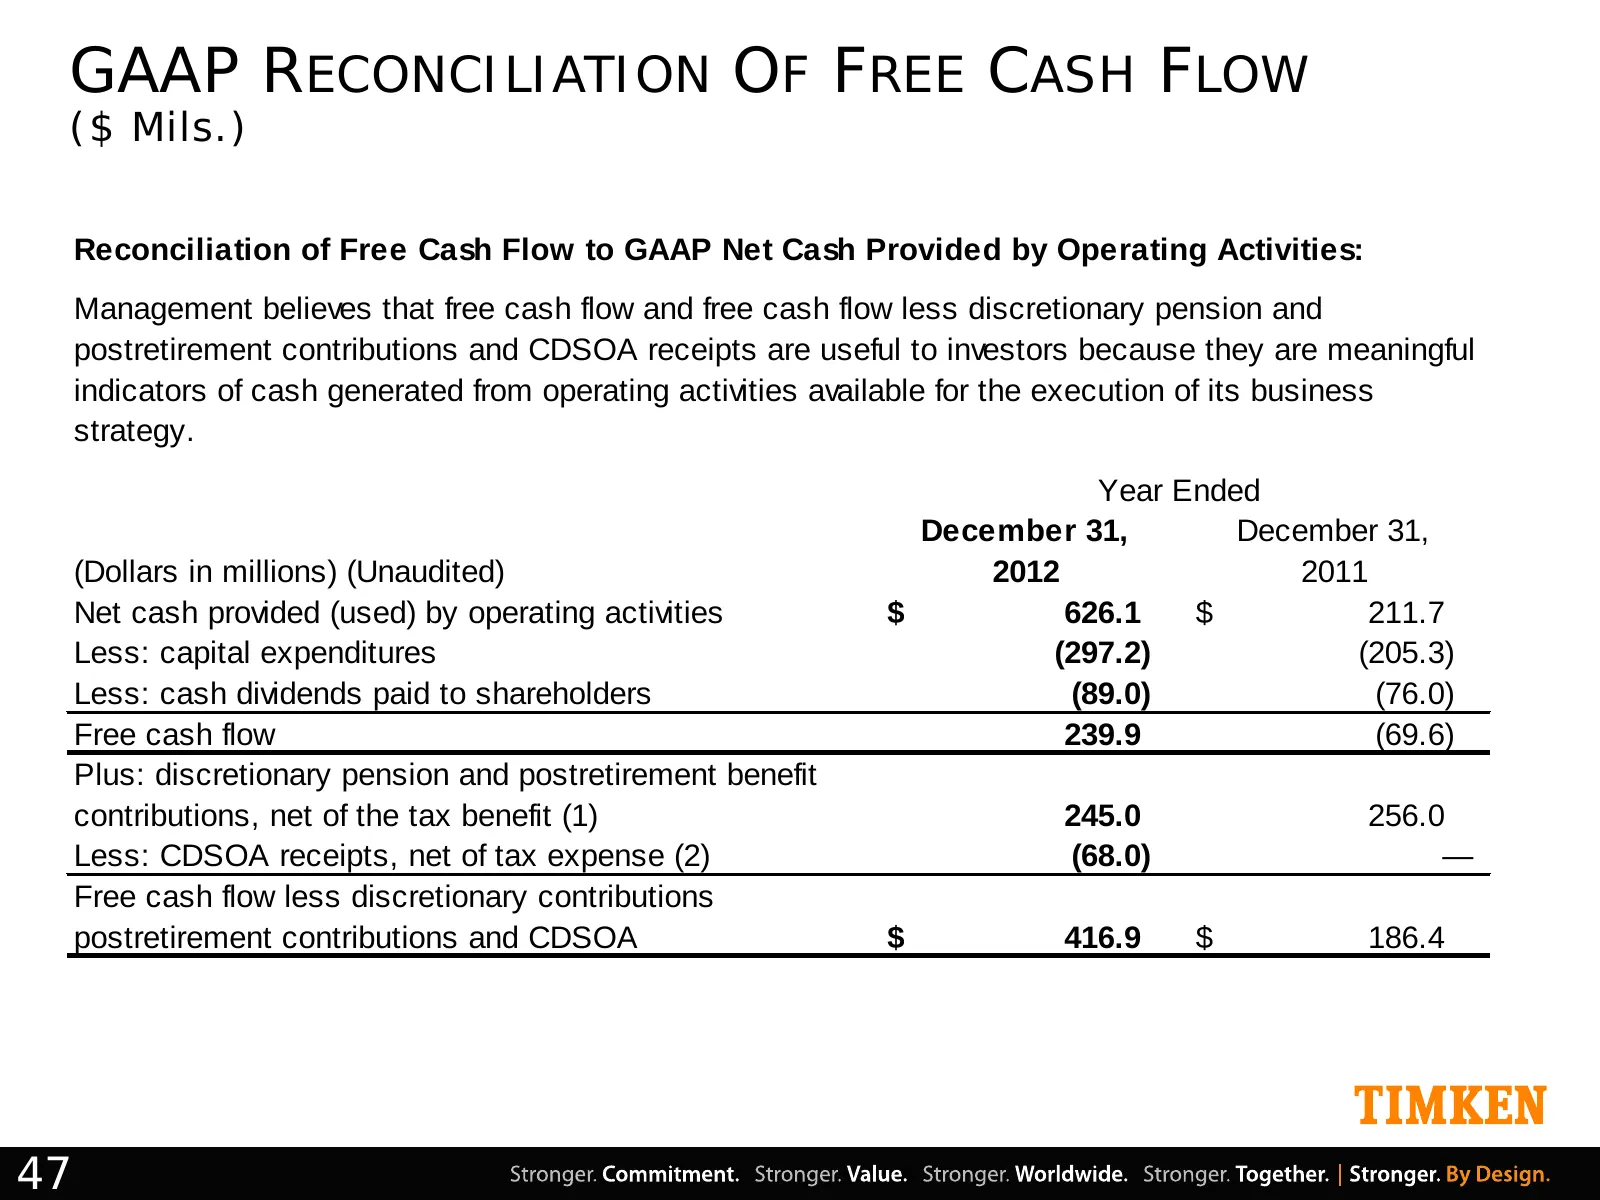
Slide 47: GAAP Reconciliation of Free Cash Flow
GAAP RECONCILIATION OF FREE CASH FLOW ($ Mils.) Reconciliation of Free Cash Flow to GAAP Net Cash Provided by Operating Activities: Management believes that free cash flow and free cash flow less discretionary pension and postretirement contributions and CDSOA receipts are useful to investors becaus
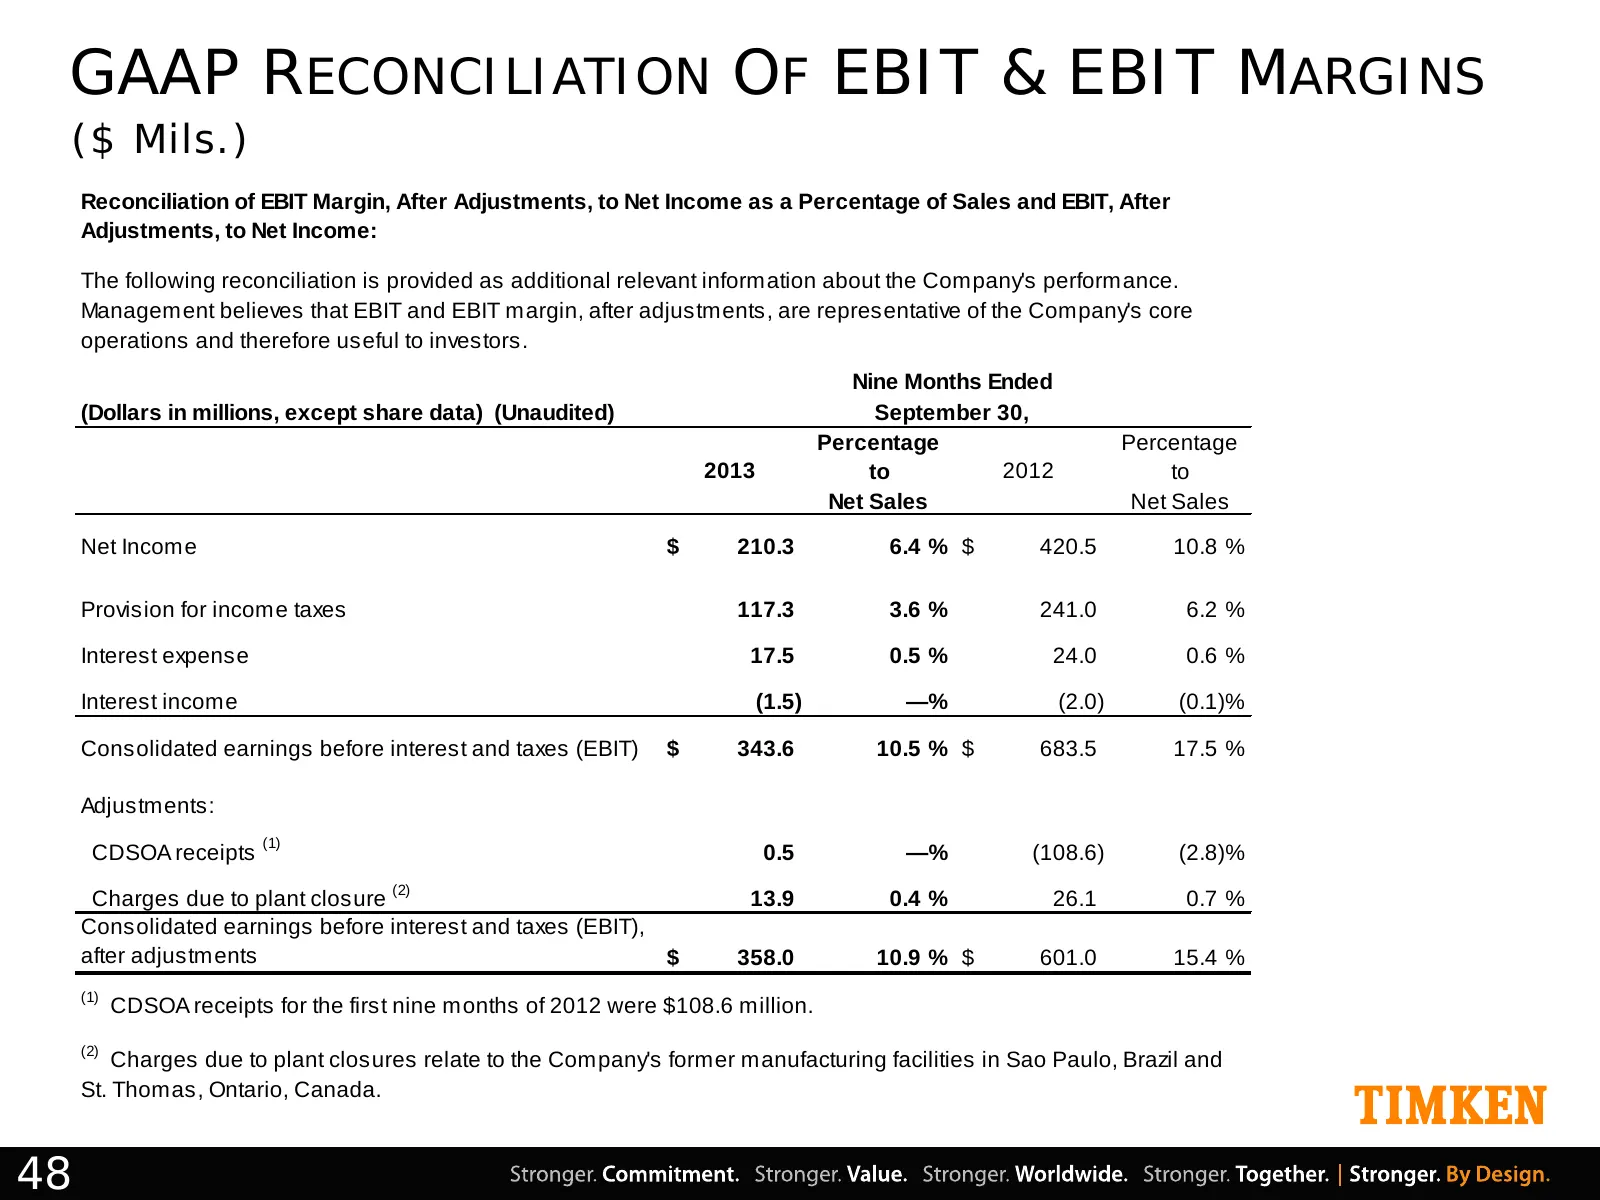
Slide 48: GAAP Reconciliation of EBIT & EBIT Margins
GAAP RECONCILIATION OF EBIT & EBIT MARGINS ($ Mils.) Reconciliation of EBIT Margin, After Adjustments, to Net Income as a Percentage of Sales and EBIT, After Adjustments, to Net Income: The following reconciliation is provided as additional relevant information about the Company's performance. Manag
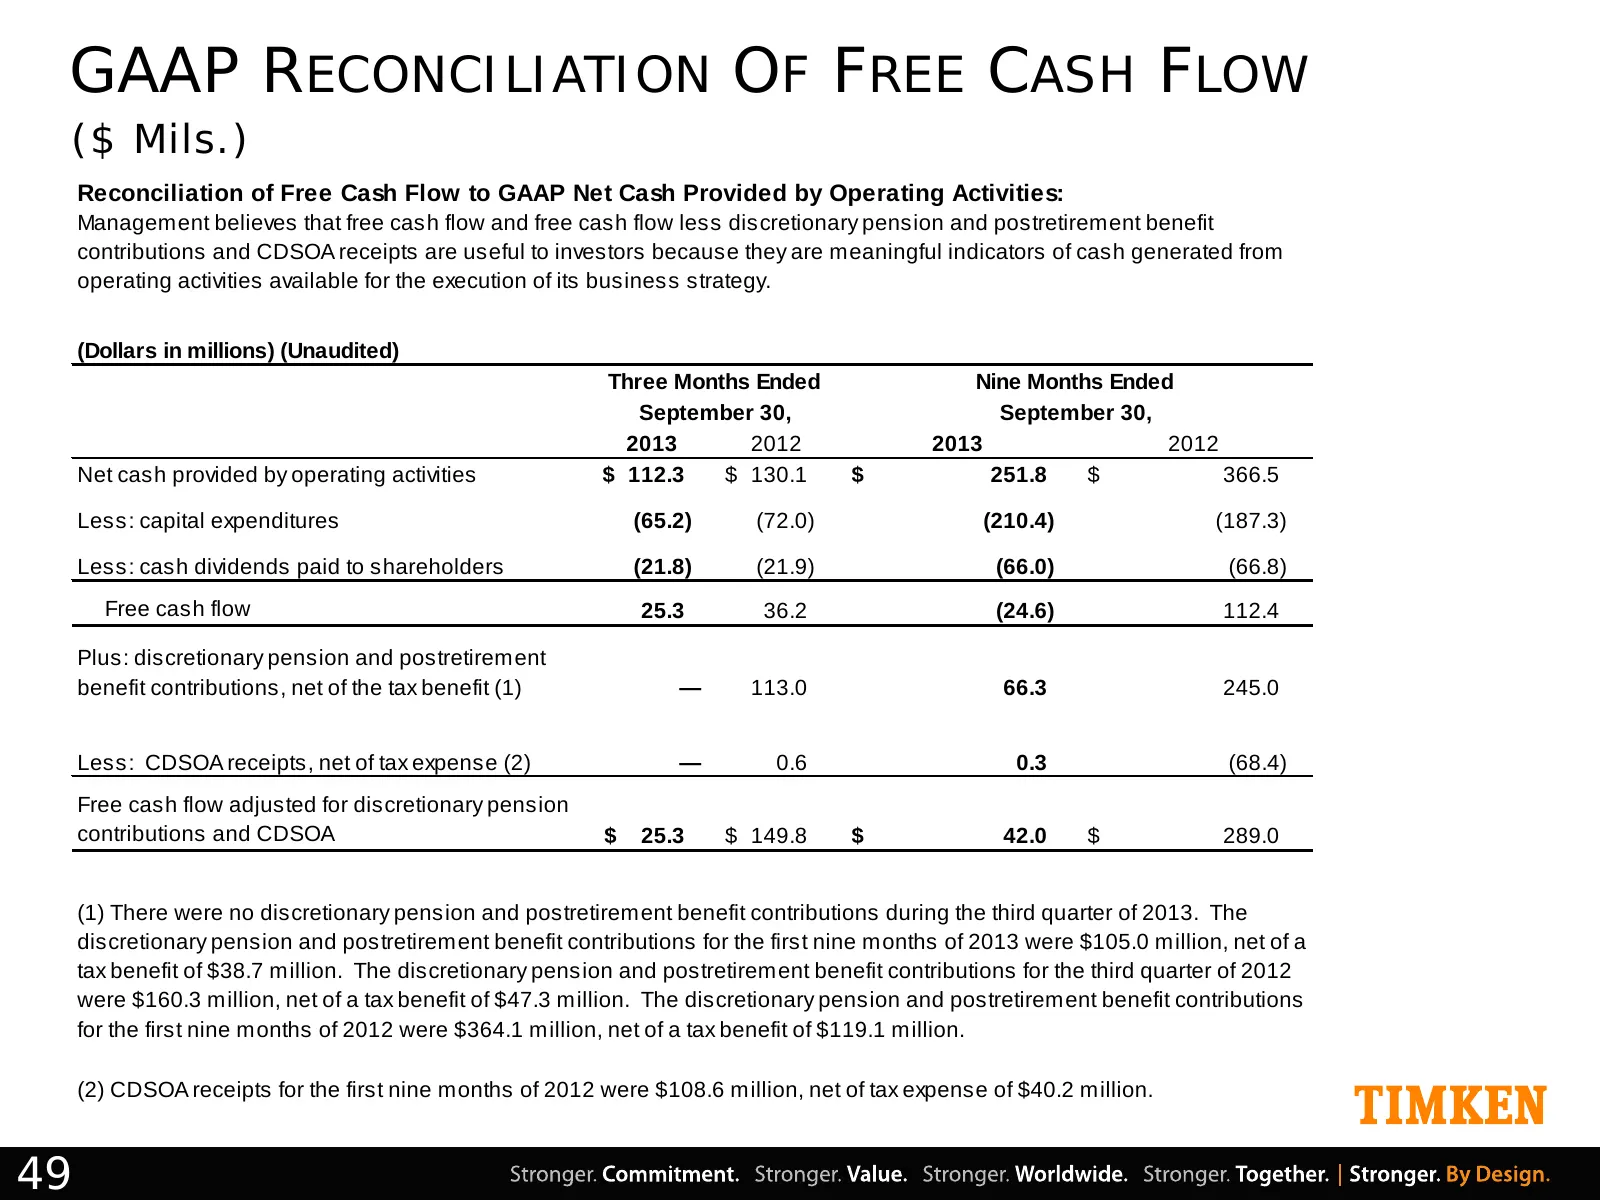
Slide 49: GAAP Reconciliation of Free Cash Flow
GAAP RECONCILIATION OF FREE CASH FLOW ($ Mils.) Reconciliation of Free Cash Flow to GAAP Net Cash Provided by Operating Activities: Management believes that free cash flow and free cash flow less discretionary pension and postretirement benefit contributions and CDSOA receipts are useful to investor
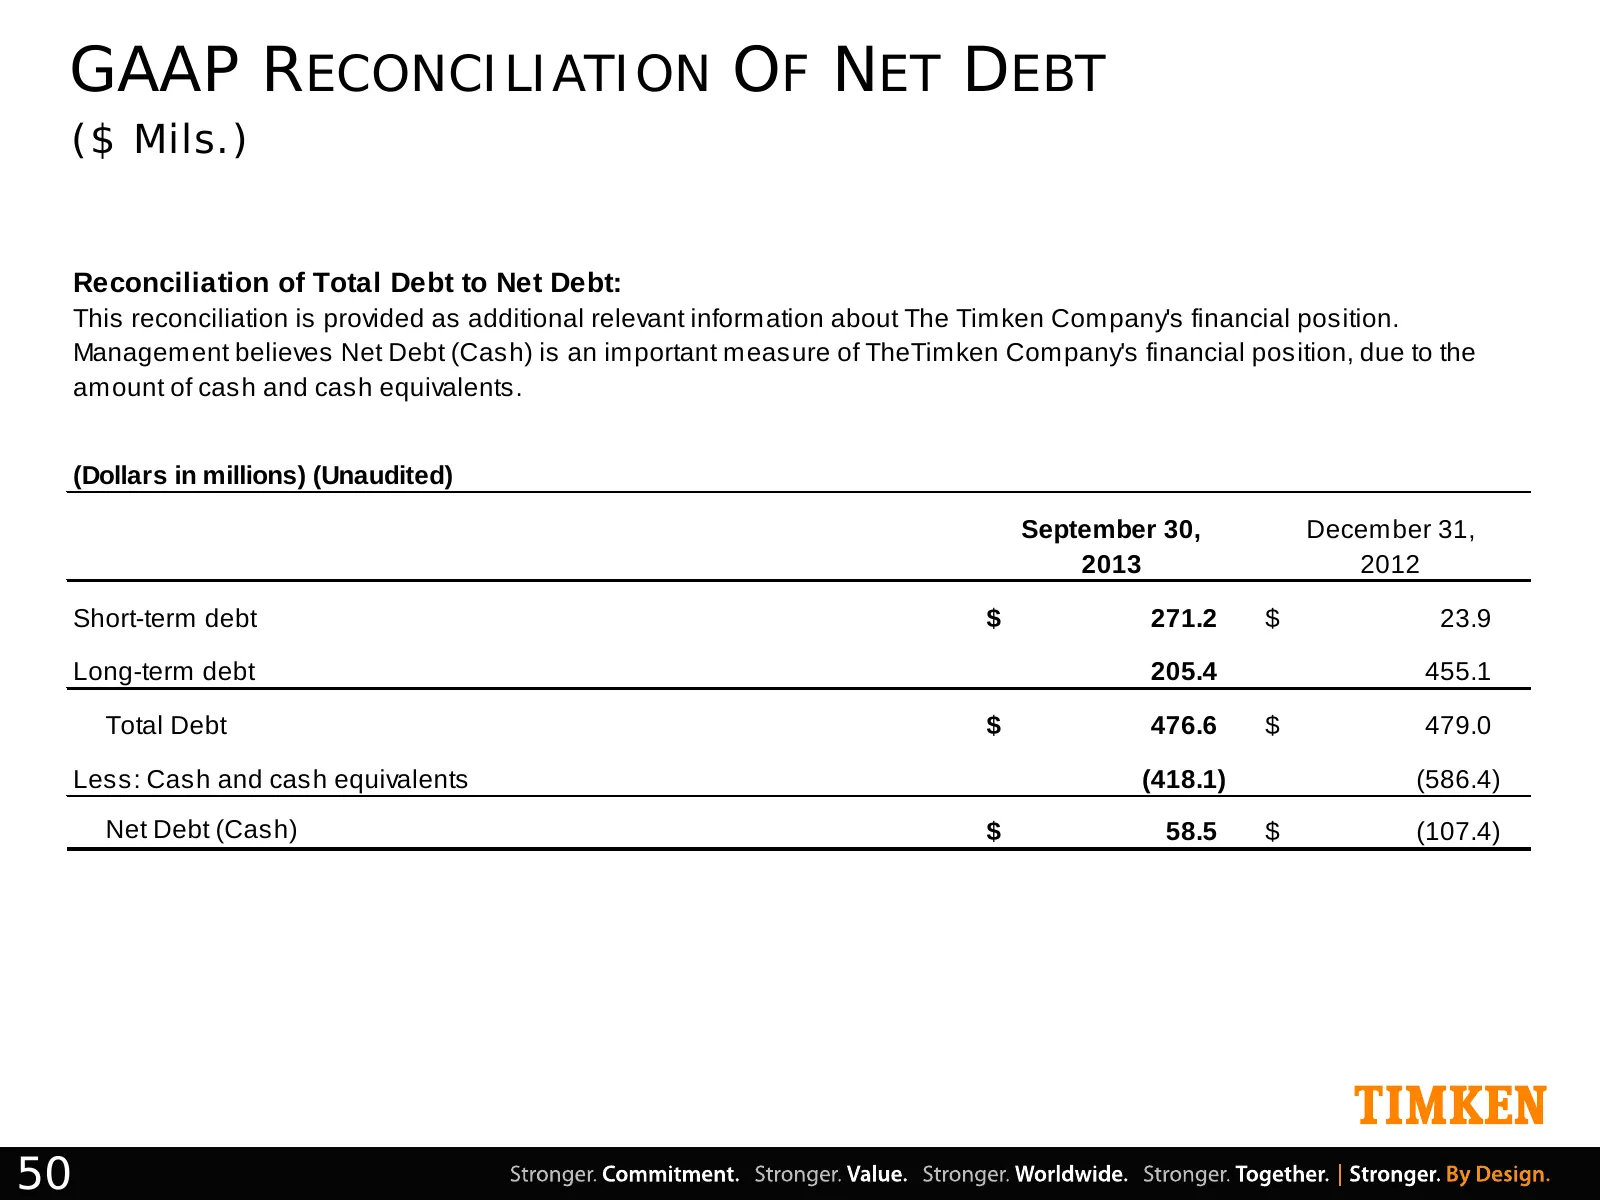
Slide 50: GAAP Reconciliation of Net Debt
GAAP RECONCILIATION OF NET DEBT ($ Mils.) Reconciliation of Total Debt to Net Debt: This reconciliation is provided as additional relevant information about The Timken Company's financial position. Management believes Net Debt (Cash) is an important measure of TheTimken Company's financial position,
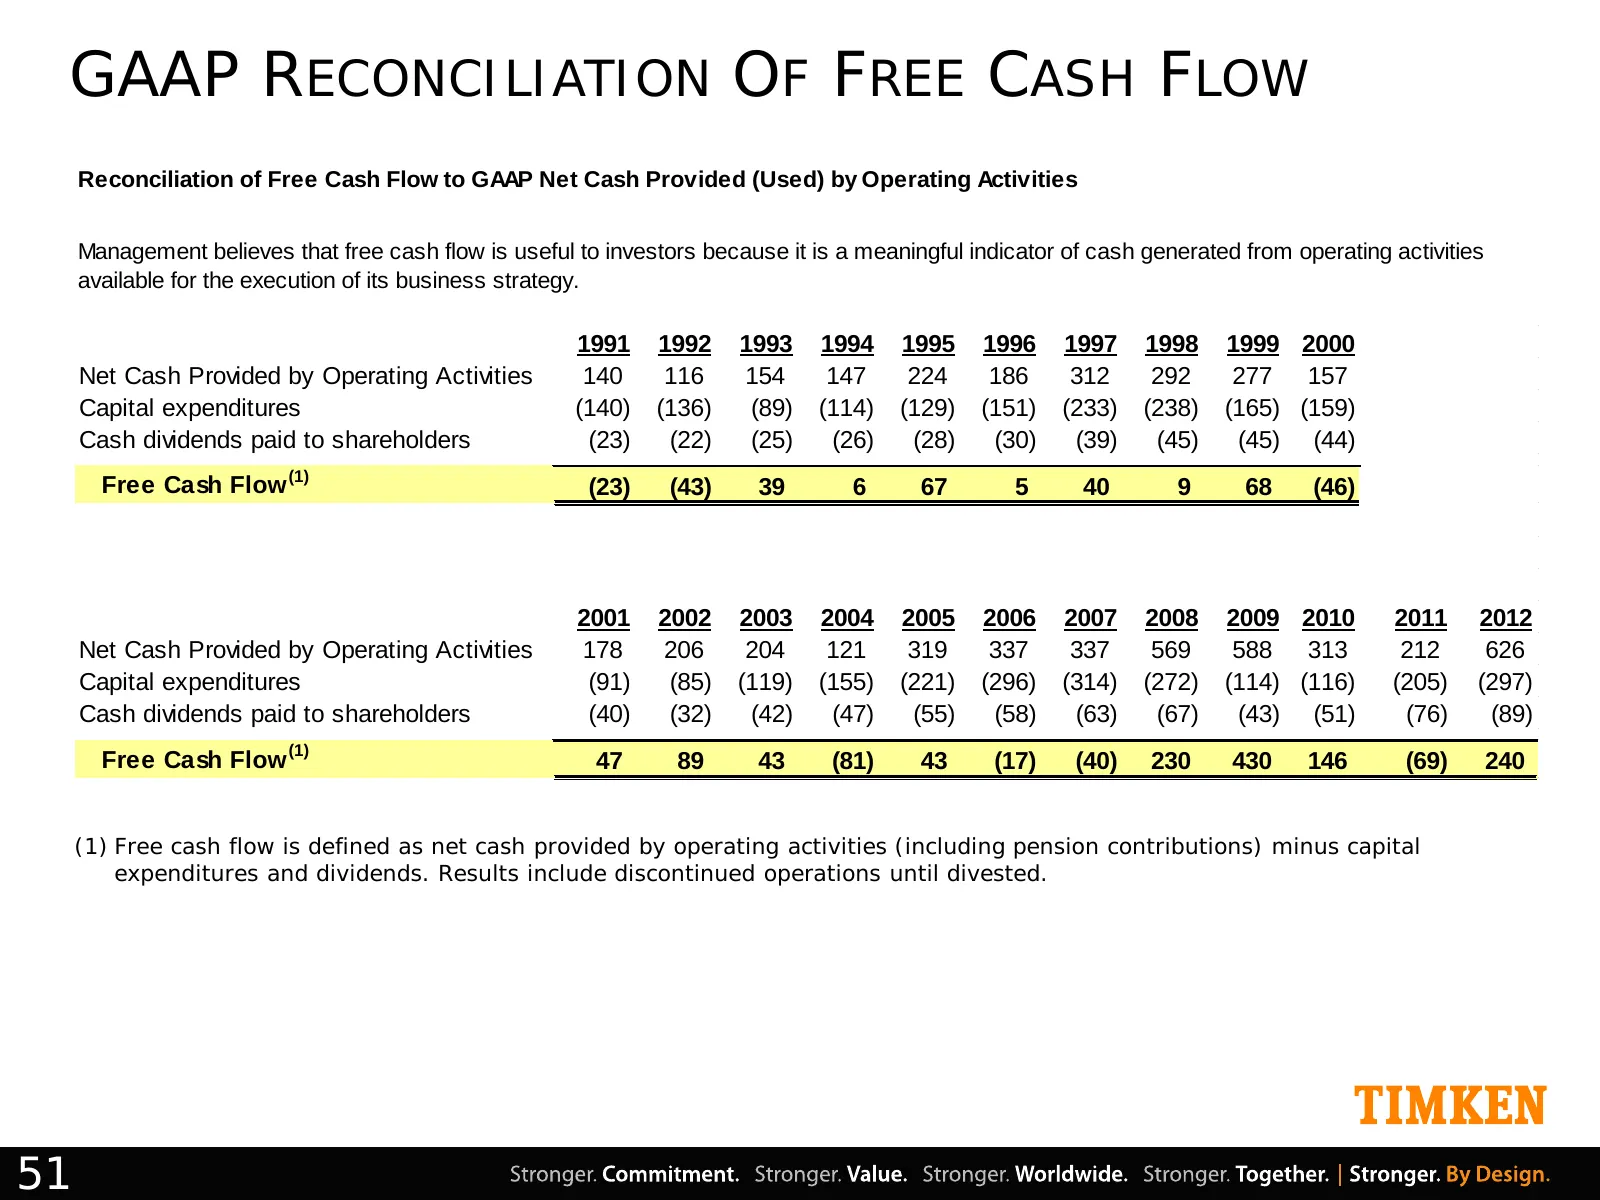
Slide 51: GAAP Reconciliation of Free Cash Flow
GAAP RECONCILIATION OF FREE CASH FLOW Reconciliation of Free Cash Flow to GAAP Net Cash Provided (Used) by Operating Activities Management believes that free cash flow is useful to investors because it is a meaningful indicator of cash generated from operating activities available for the execution
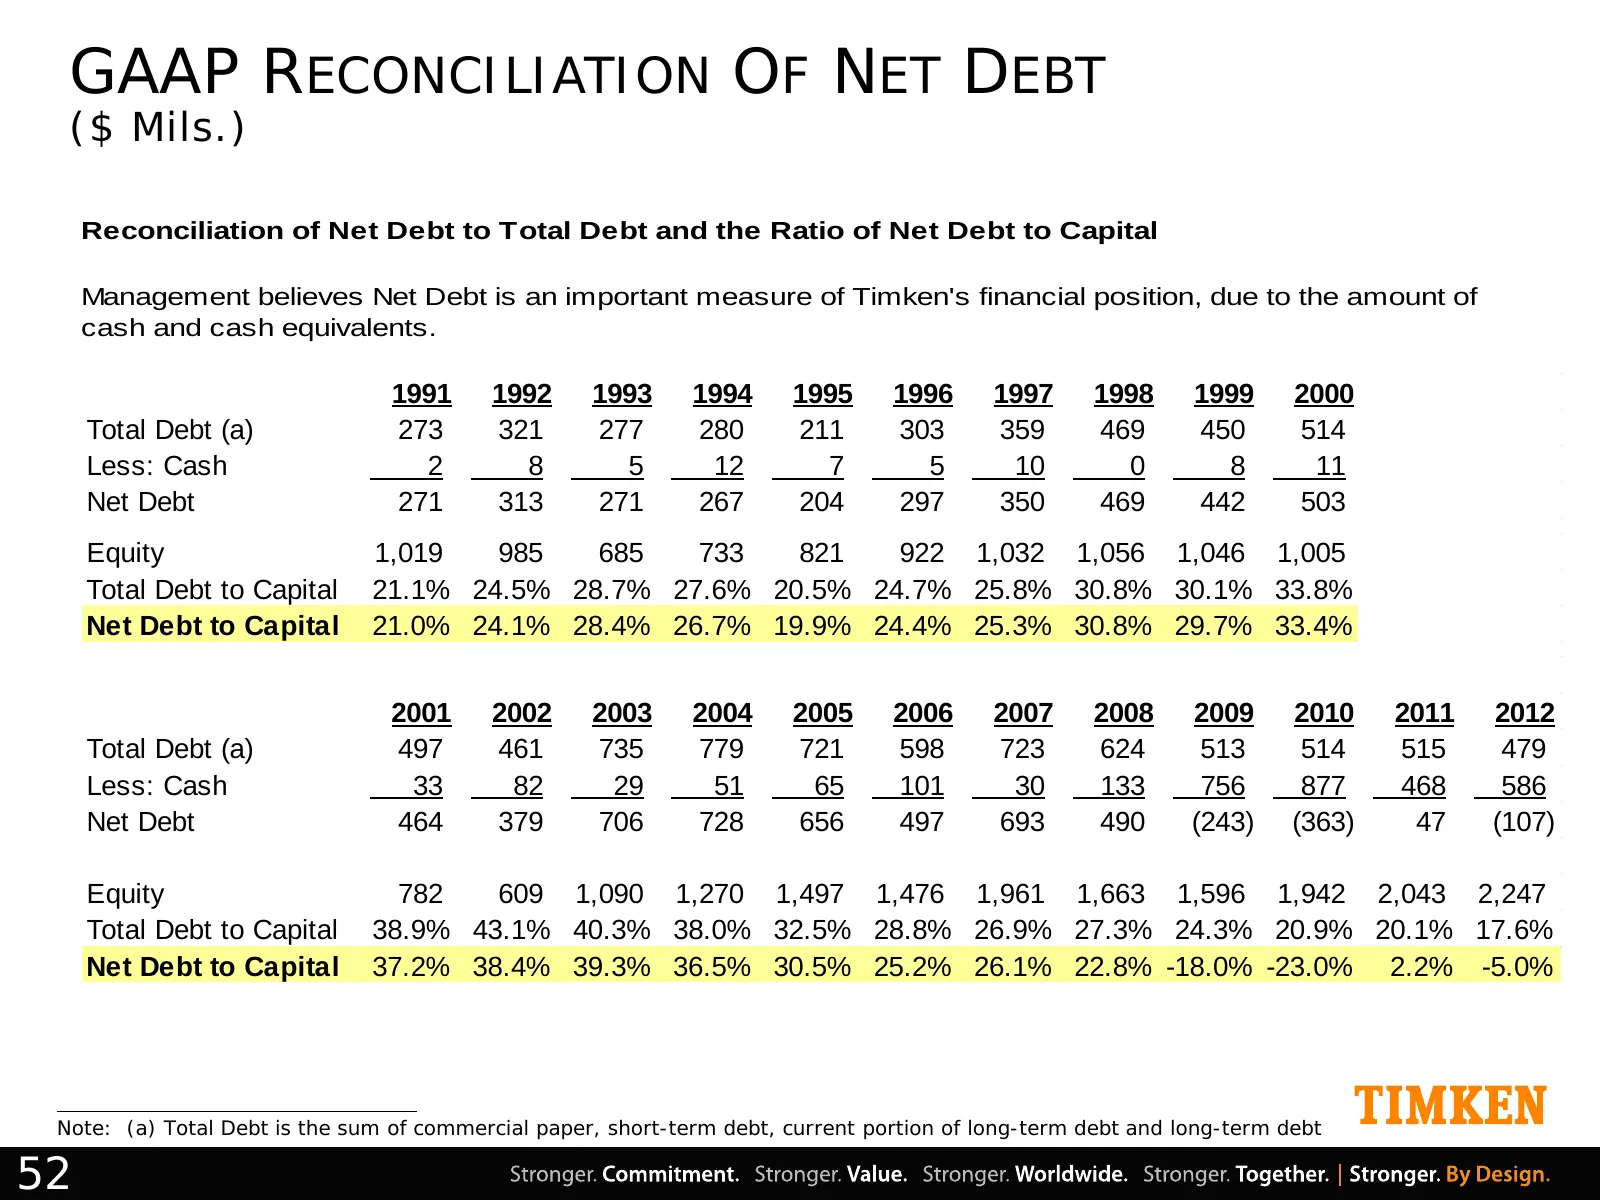
Slide 52: GAAP Reconciliation of Net Debt
GAAP RECONCILIATION OF NET DEBT ($ Mils.) Reconciliation of Net Debt to Total Debt and the Ratio of Net Debt to Capital Management believes Net Debt is an important measure of Timken's financial position, due to the amount of cash and cash equivalents. 1991 1992 1993 1994 1995 1996 1997 1998 1999 20
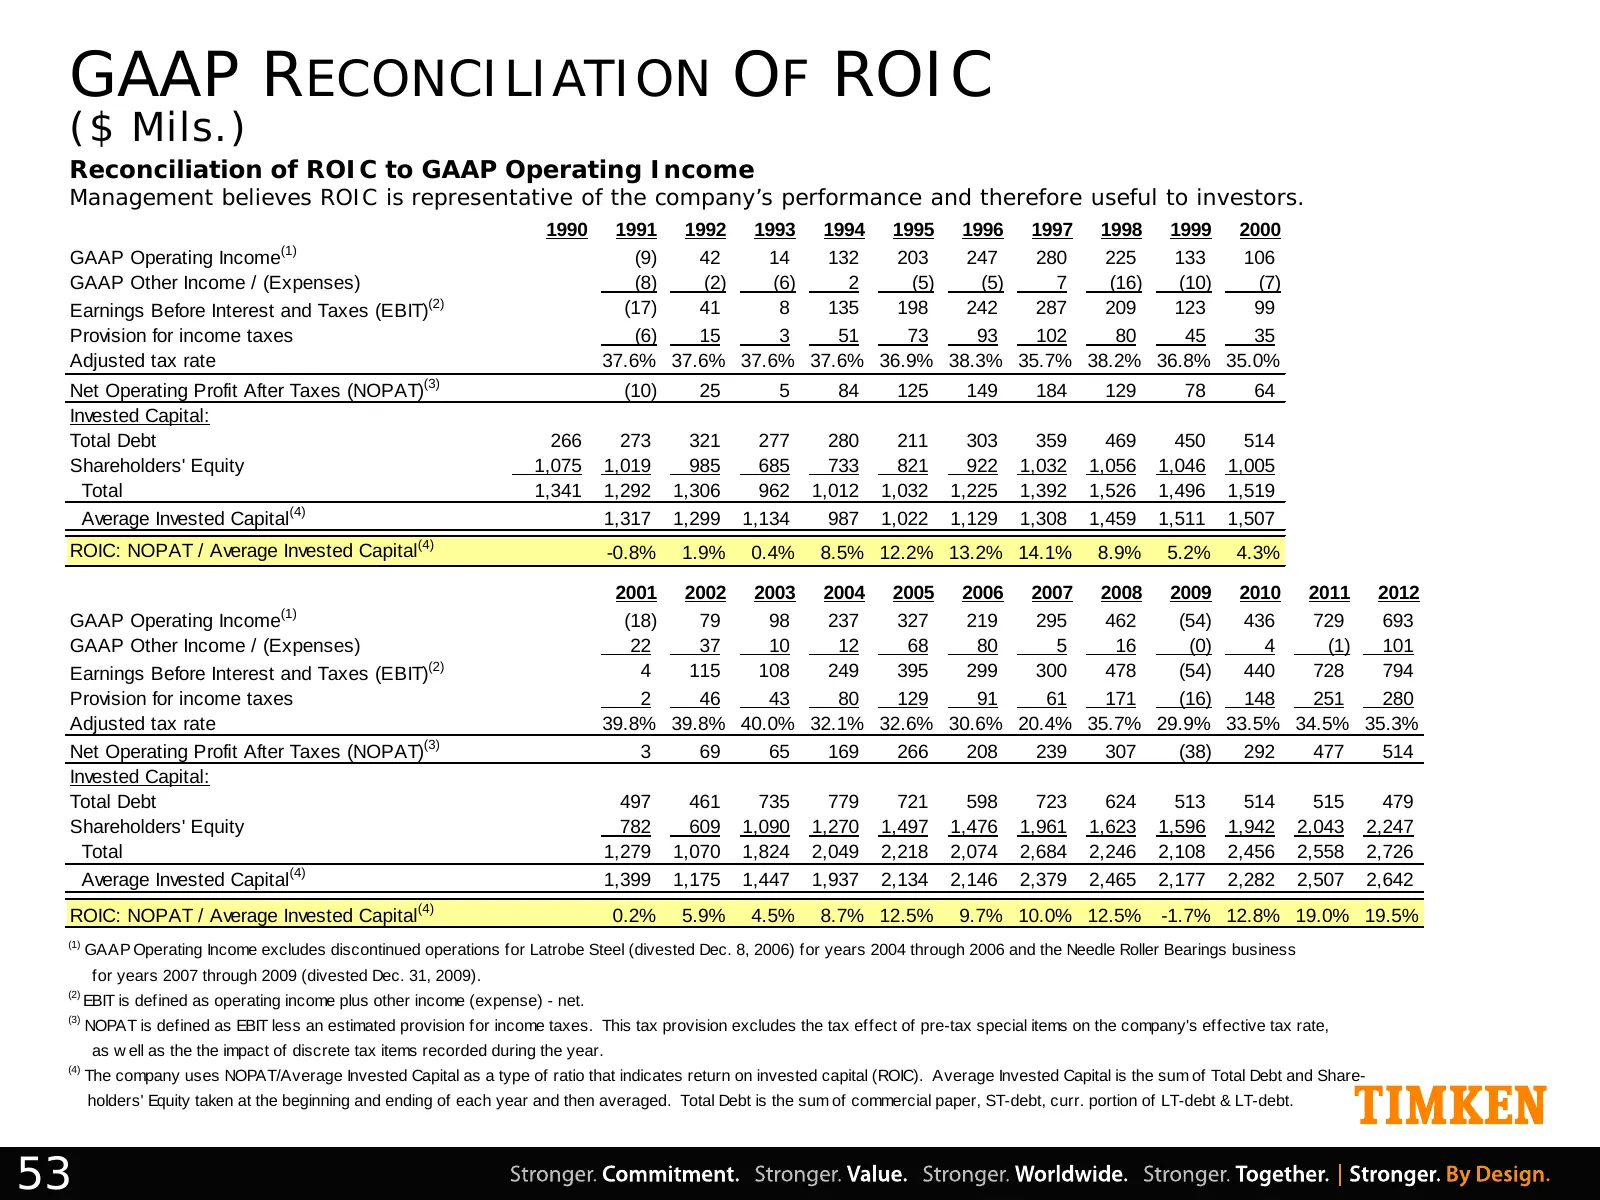
Slide 53: GAAP Reconciliation of ROIC
GAAP RECONCILIATION OF ROIC ($ Mils.) Reconciliation of ROIC to GAAP Operating Income Management believes ROIC is representative of the company’s performance and therefore useful to investors. 1990 1991 1992 1993 1994 1995 1996 1997 1998 1999 2000 GAAP Operating Income(1) (9) 42 14 132 203 247 280 2
Source: Internet Archive copy of timken.com
More decks from Timken Company (the)
 The Timken Company — Baird Global Industrial Conference 202641 slides · Nov 10, 2026
 The Timken Company — Q3 2026 Earnings Presentation28 slides · Nov 4, 2026
 The Timken Company — Morgan Stanley Laguna Conference 202639 slides · Sep 16, 2026
 The Timken Company — Q2 2026 Earnings Presentation27 slides · Aug 4, 2026
 The Timken Company — Investor Presentation (August 2026)39 slides · August 2026
 The Timken Company — Investor Presentation (June 2026)38 slides · June 2026