William Lyon Homes — Q3 2013 Earnings Presentation
16 slides from William Lyon Homes's earnings presentation, Nov 13, 2013

Slide 1: 2013 Q3 Earnings Call
2013 Q3 Earnings Call November 11, 2013, 9:00 am PST
Slide 2: Disclosure Statement
Disclosure Statement 1 Certain statements contained in this presentation that are not historical information contain forward-looking statements. The forward-looking statements involve risks and uncertainties and actual results may differ materially from those projected or implied. Further, certain f
Slide 3: Management Presenters
Management Presenters William H. Lyon − Chief Executive Officer Matthew Zaist − President and Chief Operating Officer Colin Severn − Vice President and Chief Financial Officer 2
Slide 4: William Lyon Homes At-a-Glance
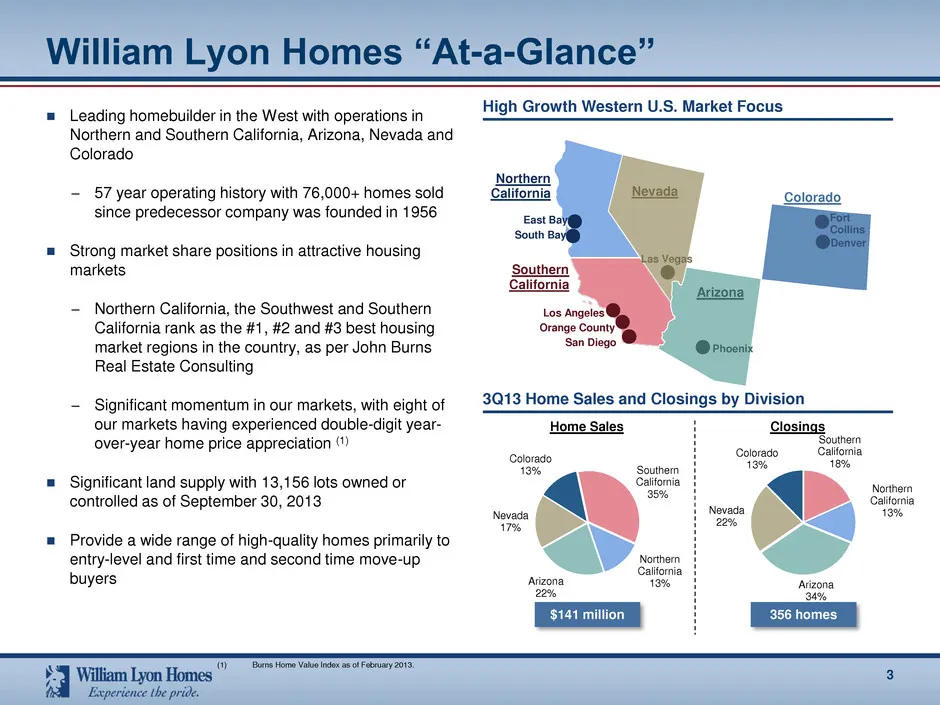
Southern California 35% Northern California 13% Arizona 22% Nevada 17% Colorado 13% William Lyon Homes “At-a-Glance” Leading homebuilder in the West with operations in Northern and Southern California, Arizona, Nevada and Colorado − 57 year operating history with 76,000+ homes sold since predecess
Slide 5: Key Investment Highlights
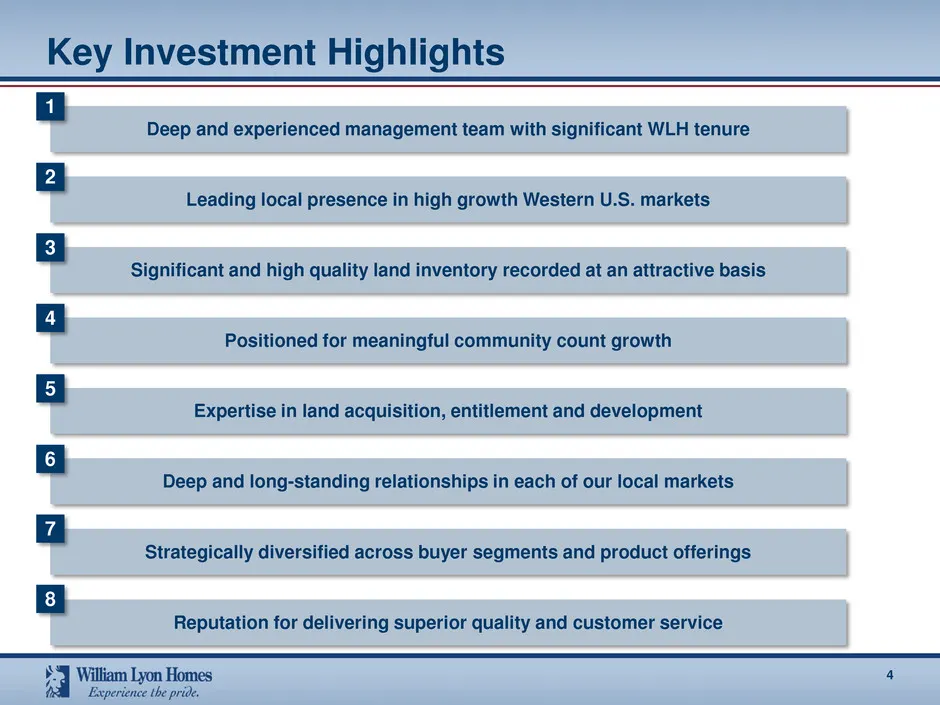
Key Investment Highlights Leading local presence in high growth Western U.S. markets 2 Positioned for meaningful community count growth 4 Expertise in land acquisition, entitlement and development 5 Deep and long-standing relationships in each of our local markets 6 Strategically diversified across
Slide 6: Third Quarter Results
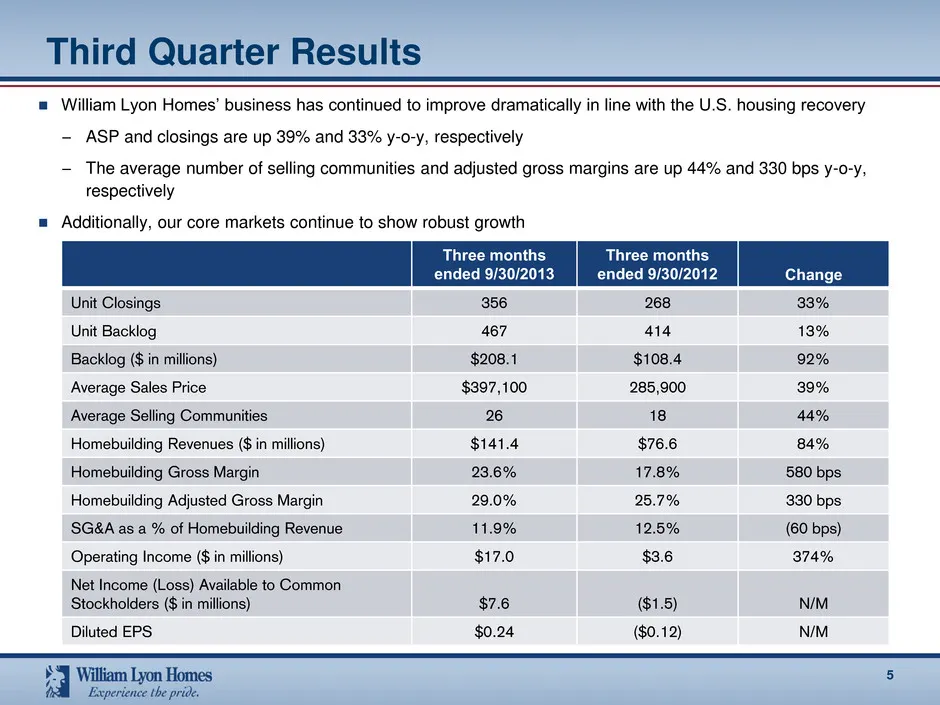
Third Quarter Results 5 Three months ended 9/30/2013 Three months ended 9/30/2012 Change Unit Closings 356 268 33% Unit Backlog 467 414 13% Backlog ($ in millions) $208.1 $108.4 92% Average Sales Price $397,100 285,900 39% Average Selling Communities 26 18 44% Homebuilding Revenues ($ in millions) $
Slide 7: Q3 2013 Operational Results
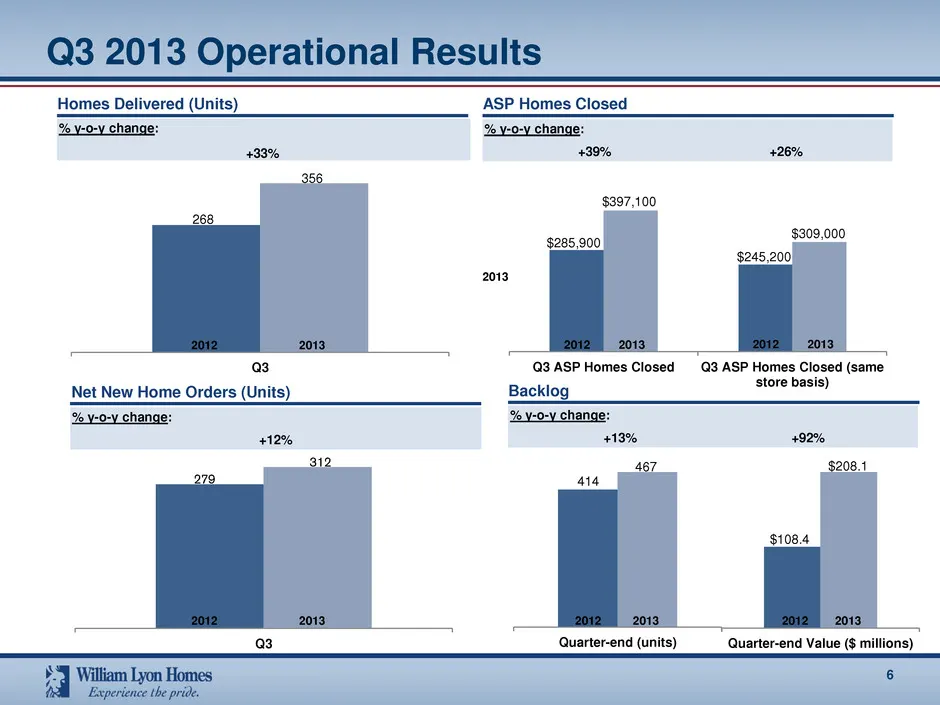
Q3 2013 Operational Results 6 ASP Homes Closed % y-o-y change: Homes Delivered (Units) % y-o-y change: +39% +26% % y-o-y change: +12% Net New Home Orders (Units) % y-o-y change: +13% +92% Backlog Q3 356 268 2012 2013 +33% Q3 312 279 Q3 ASP Homes Closed Q3 ASP Homes Closed (same store basis) $309,000
Slide 8: 2013 Q1, Q2, & Q3 Year over Year
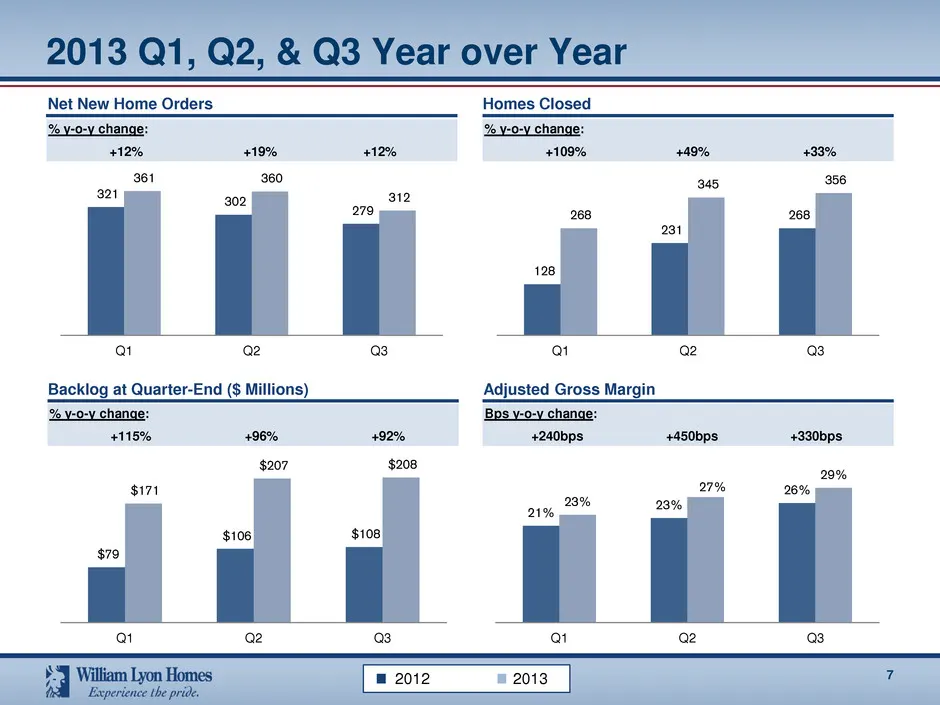
2013 Q1, Q2, & Q3 Year over Year 7 % y-o-y change: +12% +19% +12% % y-o-y change: +115% +96% +92% Bps y-o-y change: +240bps +450bps +330bps Net New Home Orders Homes Closed Backlog at Quarter-End ($ Millions) Adjusted Gross Margin % y-o-y change: +109% +49% +33% 2012 2013 321 302 279 361 360 312 Q1
Slide 9: ASP Homes Closed – Q3 Year over Year
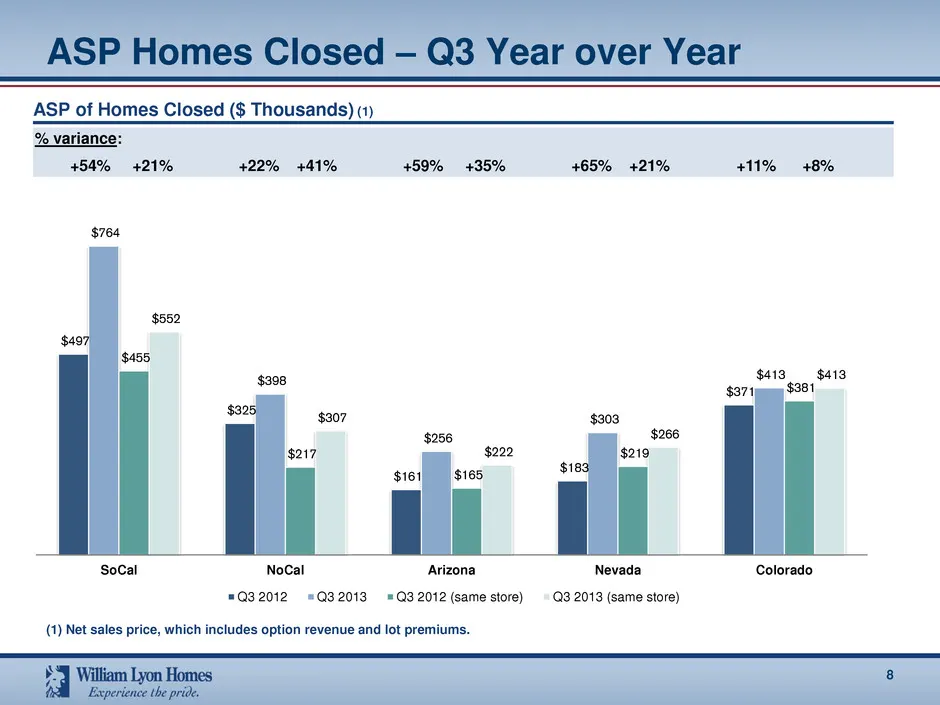
ASP Homes Closed – Q3 Year over Year 8 ASP of Homes Closed ($ Thousands) (1) % variance: +54% +21% +22% +41% +59% +35% +65% +21% +11% +8% $497 $325 $161 $183 $371 $764 $398 $256 $303 $413 $455 $217 $165 $219 $381 $552 $307 $222 $266 $413 SoCal NoCal Arizona Nevada Colorado Q3 2012 Q3 2013 Q3 2012 (s
Slide 10: Significant and High Quality Land
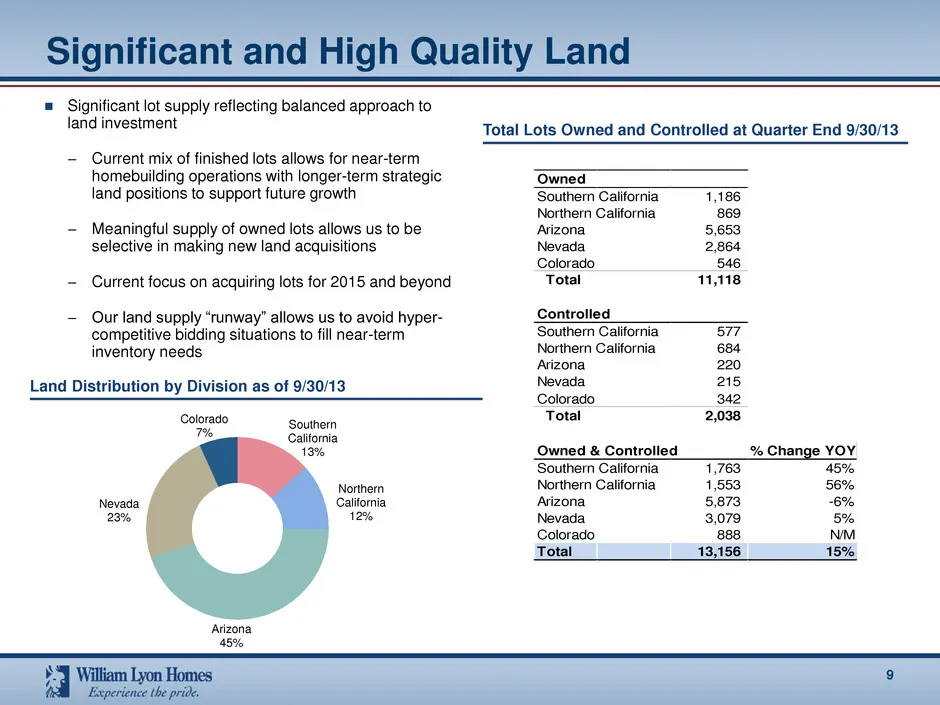
Significant and High Quality Land 9 Significant lot supply reflecting balanced approach to land investment − Current mix of finished lots allows for near-term homebuilding operations with longer-term strategic land positions to support future growth − Meaningful supply of owned lots allows us to b
Slide 11: Selected Financial Data (Three Months)
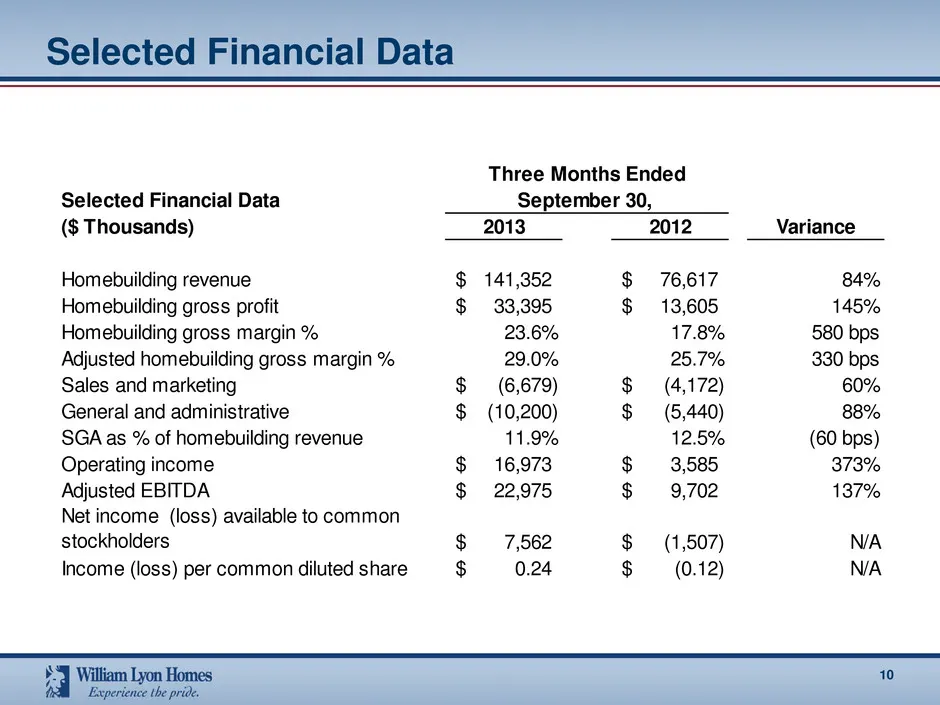
Selected Financial Data 10 Selected Financial Data ($ Thousands) 2013 2012 Variance Homebuilding revenue 141,352$ 76,617$ 84% Homebuilding gross profit 33,395$ 13,605$ 145% Homebuilding gross margin % 23.6% 17.8% 580 bps Adjusted homebuilding gross margin % 29.0% 25.7% 330 bps Sales and marketing (6
Slide 12: Selected Financial Data (Nine Months)
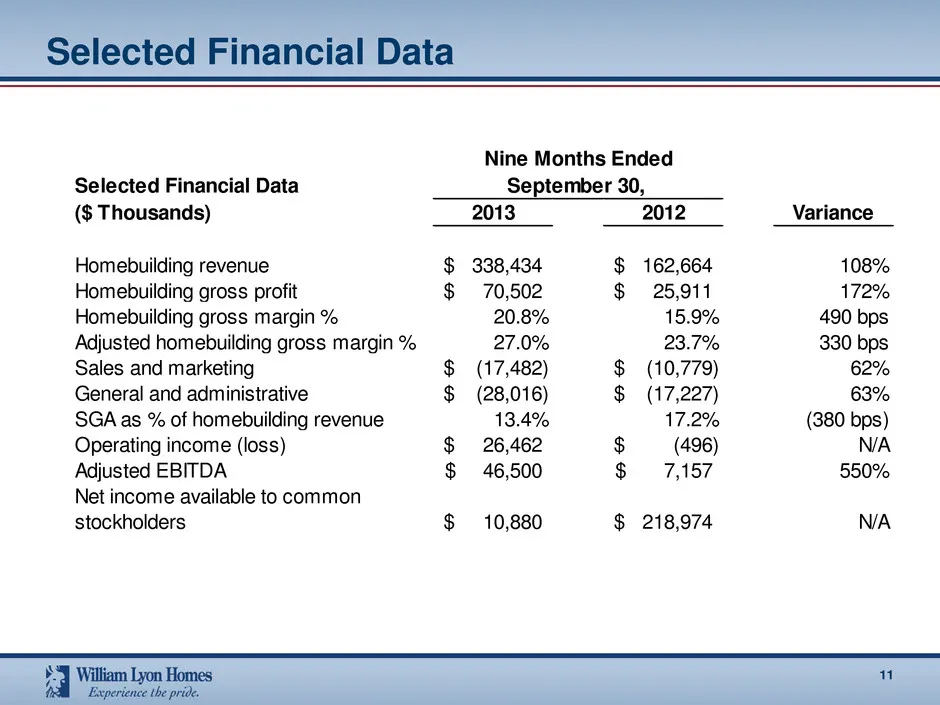
Selected Financial Data 11 Selected Financial Data ($ Thousands) 2013 2012 Variance Homebuilding revenue 338,434$ 162,664$ 108% Homebuilding gross profit 70,502$ 25,911$ 172% Homebuilding gross margin % 20.8% 15.9% 490 bps Adjusted homebuilding gross margin % 27.0% 23.7% 330 bps Sales and marketing
Slide 13: Adjusted EBITDA
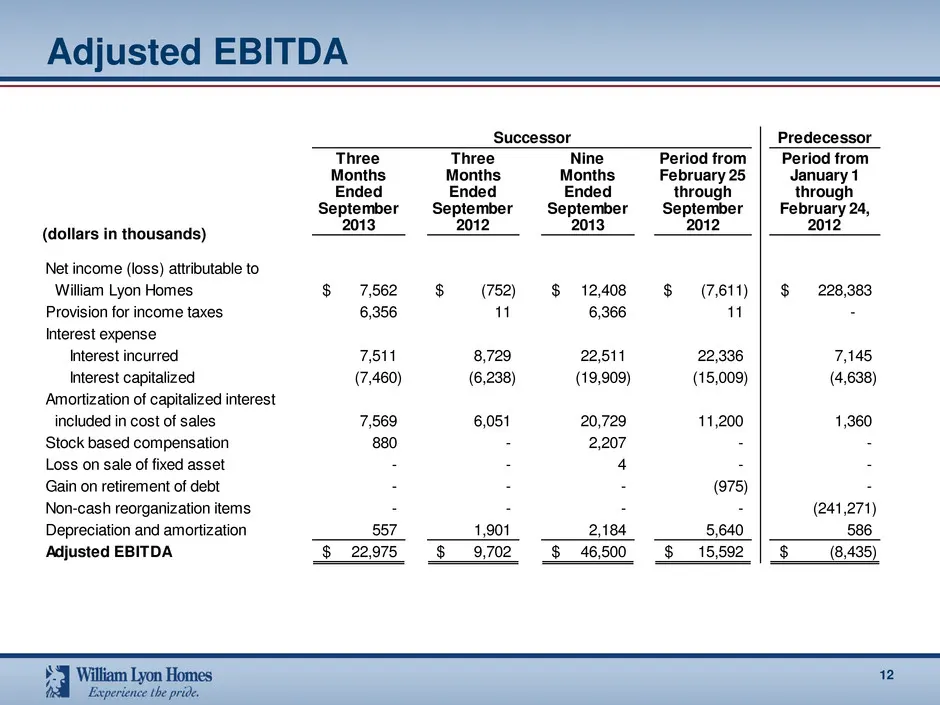
Adjusted EBITDA 12 Predecessor Three Three Nine Period from Period from Months Months Months February 25 January 1 Ended Ended Ended through through September September September September February 24, 2013 2012 2013 2012 2012 Net income (loss) attributable to 7,562$ (752)$ 12,408$ (7,611)$ 228,383$
Slide 14: Adjusted Homebuilding Gross Margin
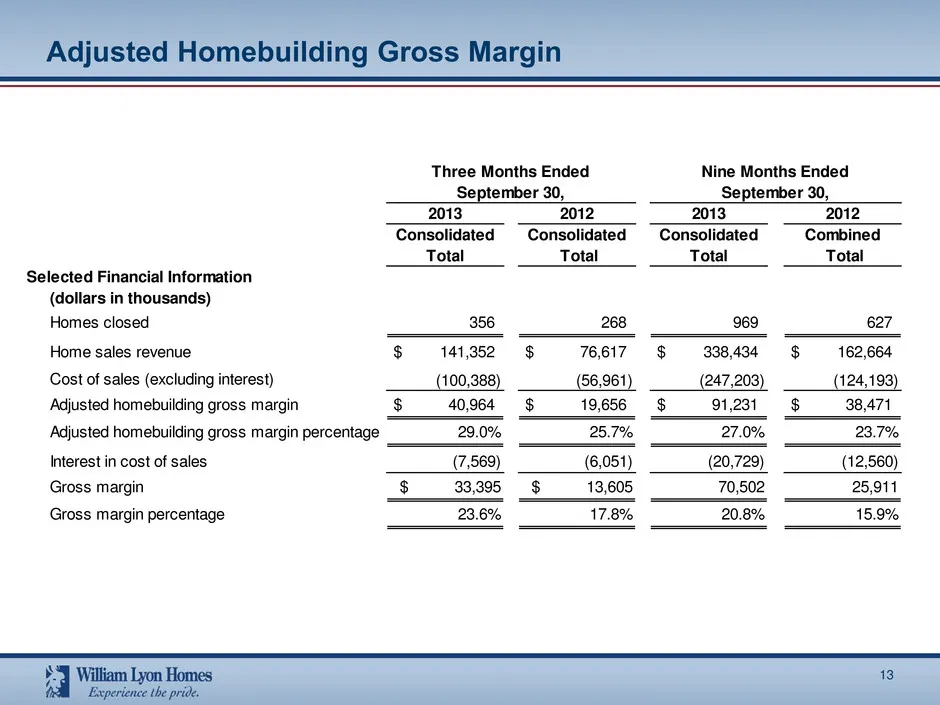
Adjusted Homebuilding Gross Margin 13 2013 2012 2013 2012 Consolidated Consolidated Consolidated Combined Total Total Total Total (dollars in thousands) Homes closed 356 268 969 627 Home sales revenue $ 141,352 $ 76,617 $ 338,434 $ 162,664 Cost of sales (excluding interest) (100,388) (56,961) (247,2
Slide 15: Pre-tax Income Excluding Noncontrolling Interest
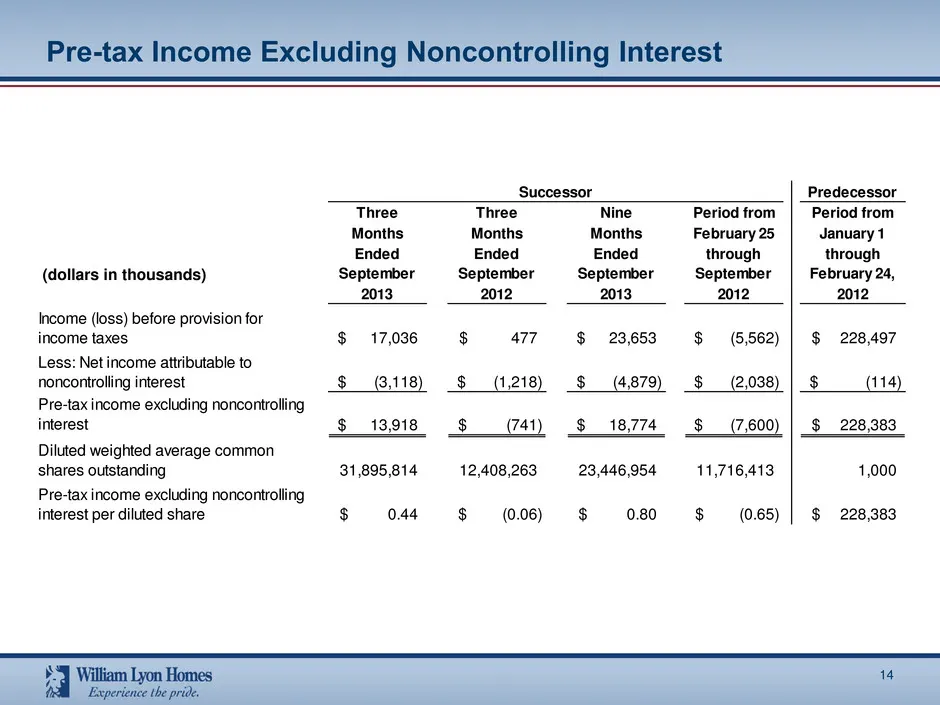
Predecessor Three Three Nine Period from Period from Months Months Months February 25 January 1 Ended Ended Ended through through September September September September February 24, 2013 2012 2013 2012 2012 17,036$ 477$ 23,653$ (5,562)$ 228,497$ (3,118)$ (1,218)$ (4,879)$ (2,038)$ (114)$ 13,918$ (7
Slide 16: Executing Our Strategy
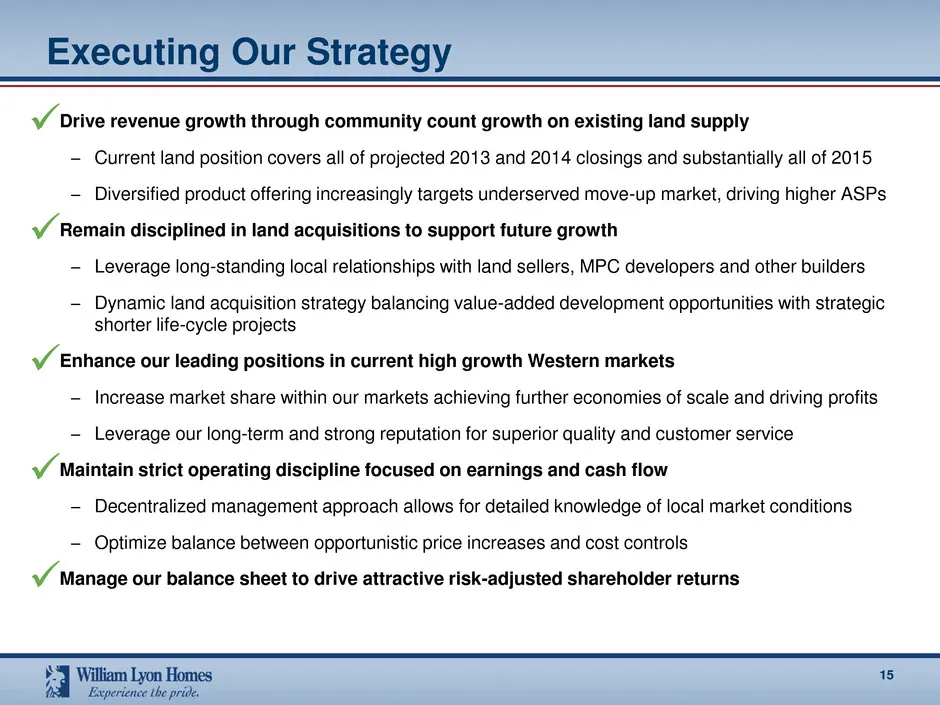
Executing Our Strategy 15 Drive revenue growth through community count growth on existing land supply − Current land position covers all of projected 2013 and 2014 closings and substantially all of 2015 − Diversified product offering increasingly targets underserved move-up market, driving
Source: SEC EDGAR · 8-K filed Nov 13, 2013
More decks from William Lyon Homes
 Merger or Acquisition (November 2019)18 slides · Nov 6, 2019
 Q2 2019 Earnings Presentation15 slides · Aug 1, 2019
 Q1 2019 Earnings Presentation14 slides · May 2, 2019
 Q4 2018 Earnings Presentation18 slides · Feb 14, 2019
 Q3 2018 Earnings Presentation17 slides · Oct 30, 2018
 2018 Zelman Housing Summit31 slides · Sep 27, 2018