Dermapharm Holding SE · XETR:DMP
Dermapharm — Dermapharm Hldg — Q3 2026 Earnings Presentation
24 slides from Dermapharm's earnings presentation, Nov 12, 2026
Slide 1: Investors' and Analysts' Conference Call Q3 2026
INVESTORS’ AND ANALYSTS’ CONFERENCE CALL Q3 2026 Grünwald, 12 November 2026 Image: Günther Fotodesign 1
Slide 2: Agenda
AGENDA 1 Financial figures 2 Outlook 2026 3 Q&A Image: Günther Fotodesign Dermapharm Q3 2026 2
Slide 3: Financial figures
1 Financial figures Dermapharm Q3 2026 3
Slide 4: Highlights
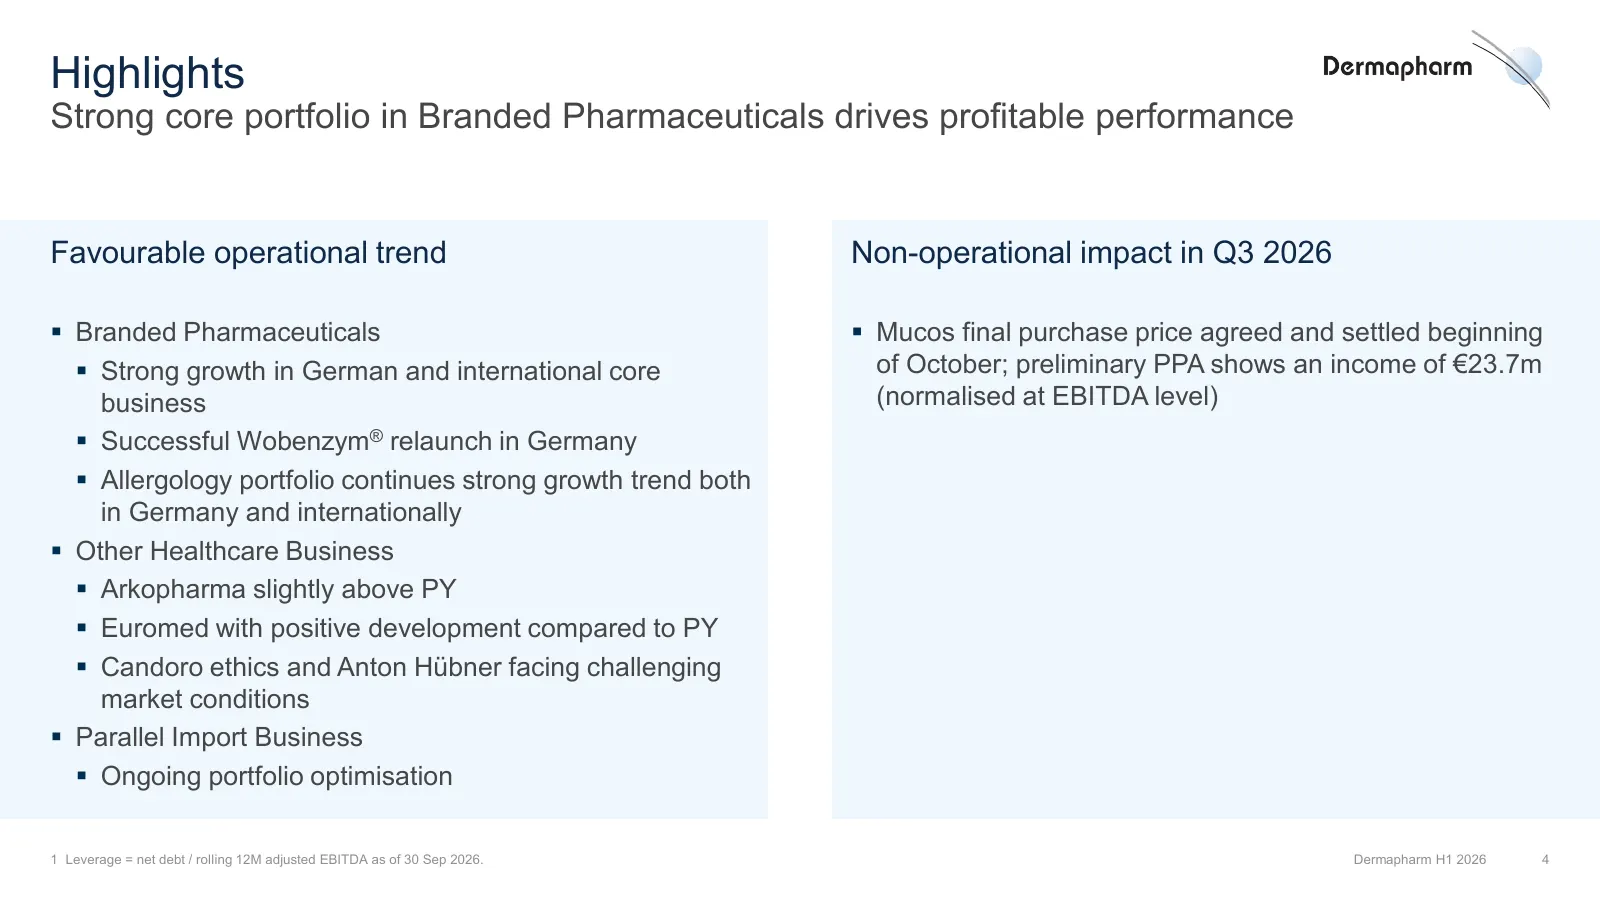
Highlights Strong core portfolio in Branded Pharmaceuticals drives profitable performance Favourable operational trend Non-operational impact in Q3 2026 Branded Pharmaceuticals Mucos final purchase price agreed and settled beginning Strong growth in German and international core of October; pr
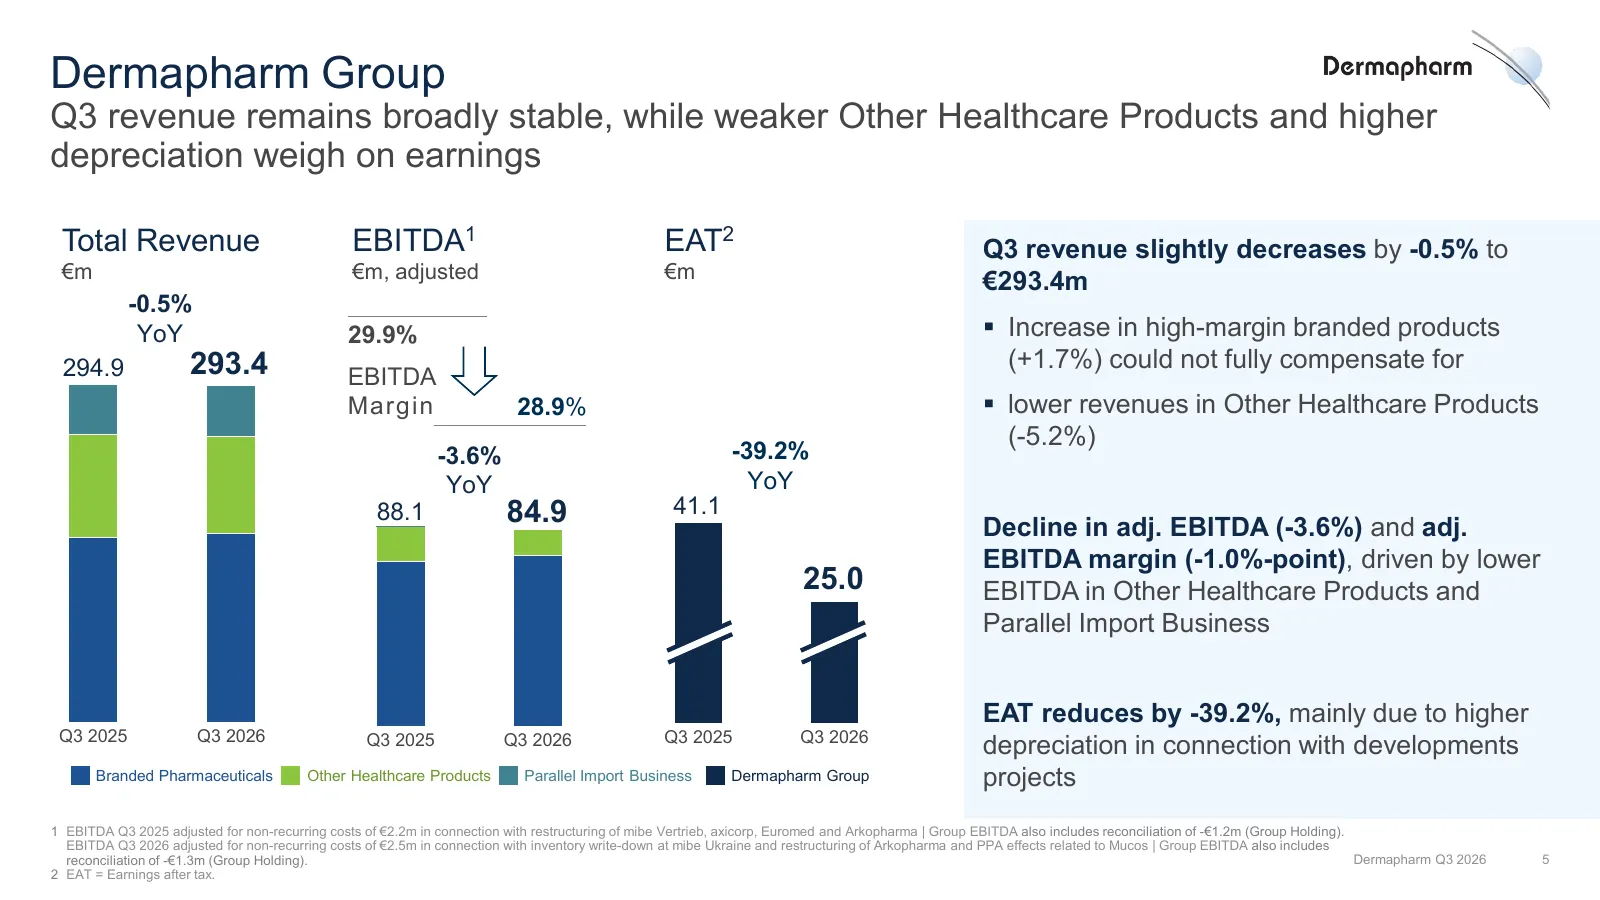
Slide 5: Dermapharm Group Q3
Dermapharm Group Q3 revenue remains broadly stable, while weaker Other Healthcare Products and higher depreciation weigh on earnings Total Revenue EBITDA1 EAT2 Q3 revenue slightly decreases by -0.5% to €m €m, adjusted €m €293.4m -0.5% YoY 29.9% Increase in high-margin branded products 294.9 293.4
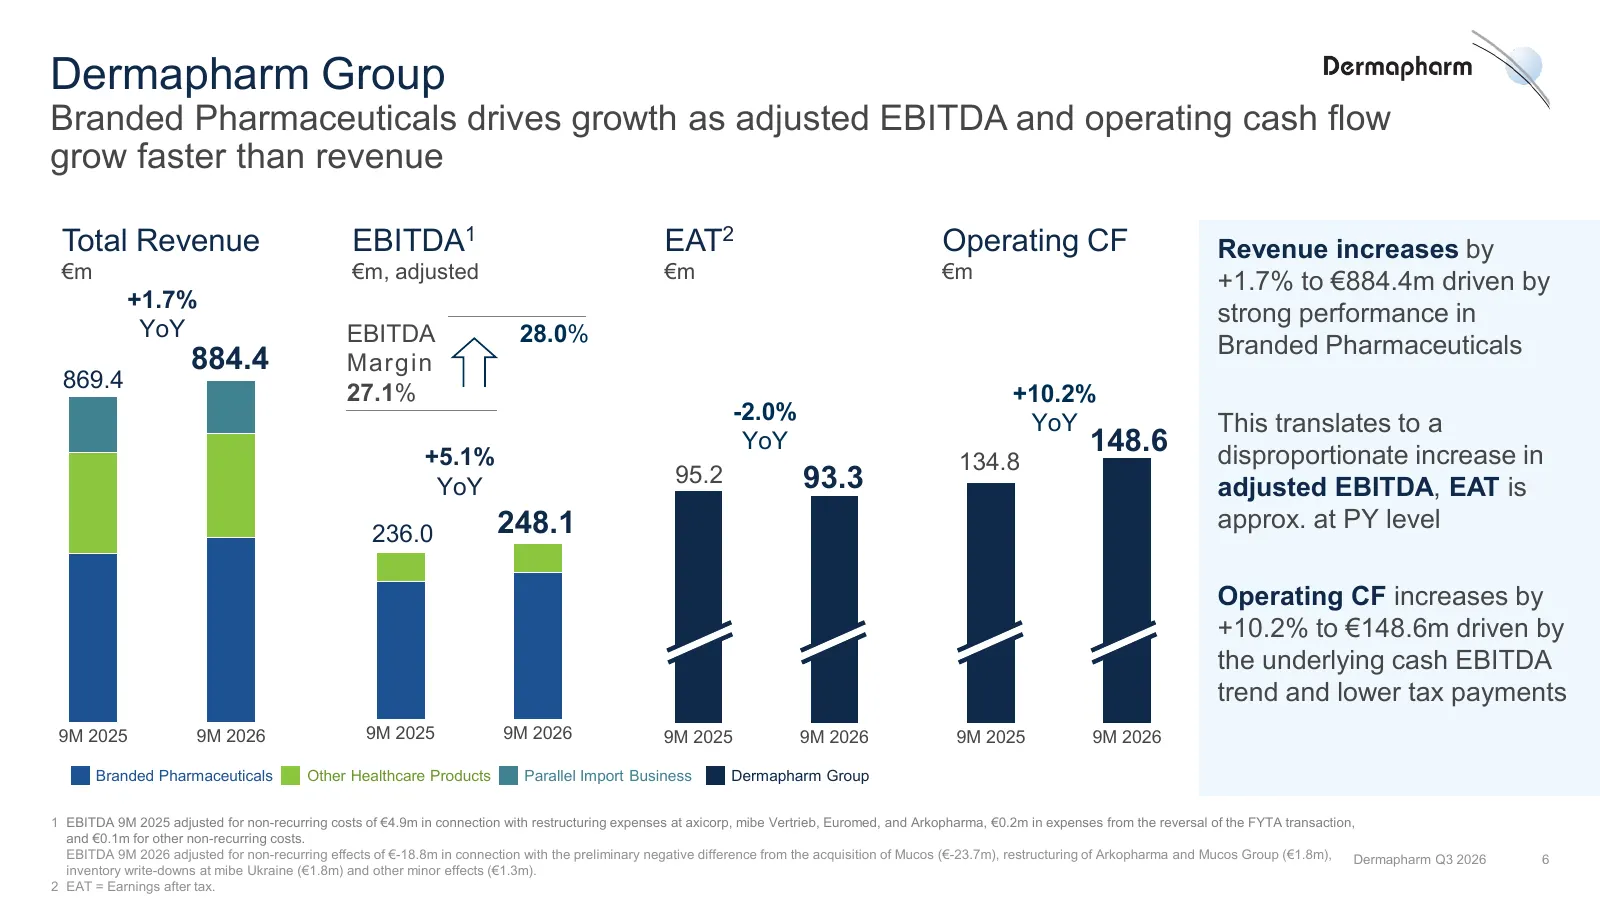
Slide 6: Dermapharm Group 9M
Dermapharm Group Branded Pharmaceuticals drives growth as adjusted EBITDA and operating cash flow grow faster than revenue Total Revenue EBITDA1 EAT2 Operating CF Revenue increases by €m €m, adjusted €m €m +1.7% to €884.4m driven by +1.7% strong performance in YoY EBITDA 28.0% Branded Pharmaceutical
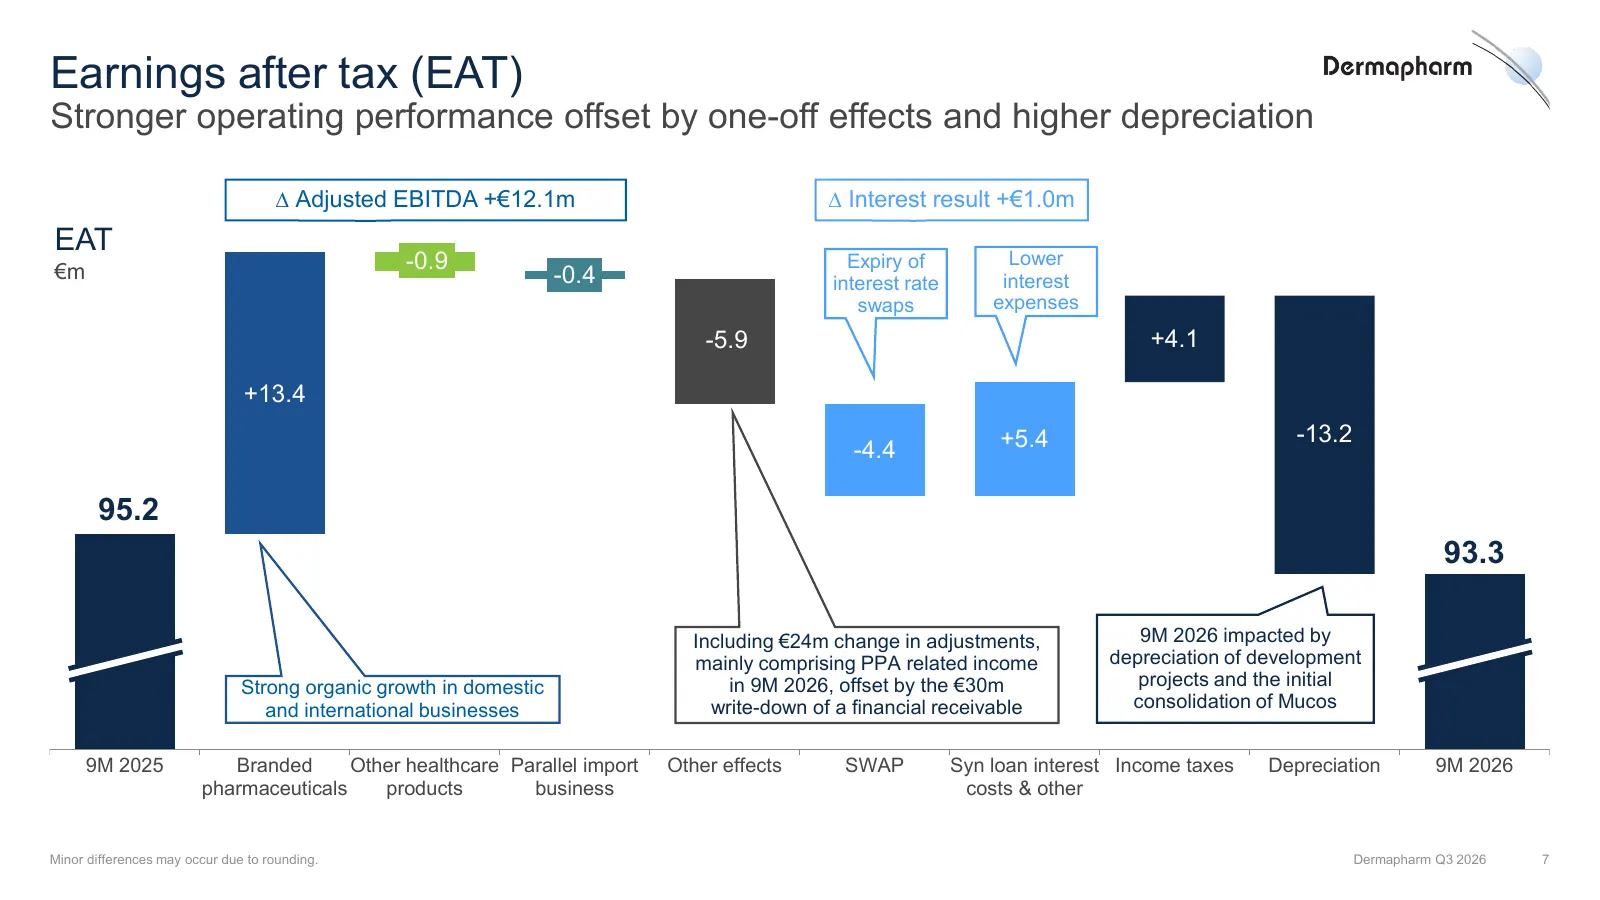
Slide 7: Earnings after tax (EAT)
Earnings after tax (EAT) Stronger operating performance offset by one-off effects and higher depreciation ∆ Adjusted EBITDA +€12.1m ∆ Interest result +€1.0m EAT €m -0.9 Expiry of Lower -0.4 interest rate interest swaps expenses -5.9 +4.1 +13.4 +5.4 -13.2 -4.4 95.2 93.3 Including €24m change in adjus
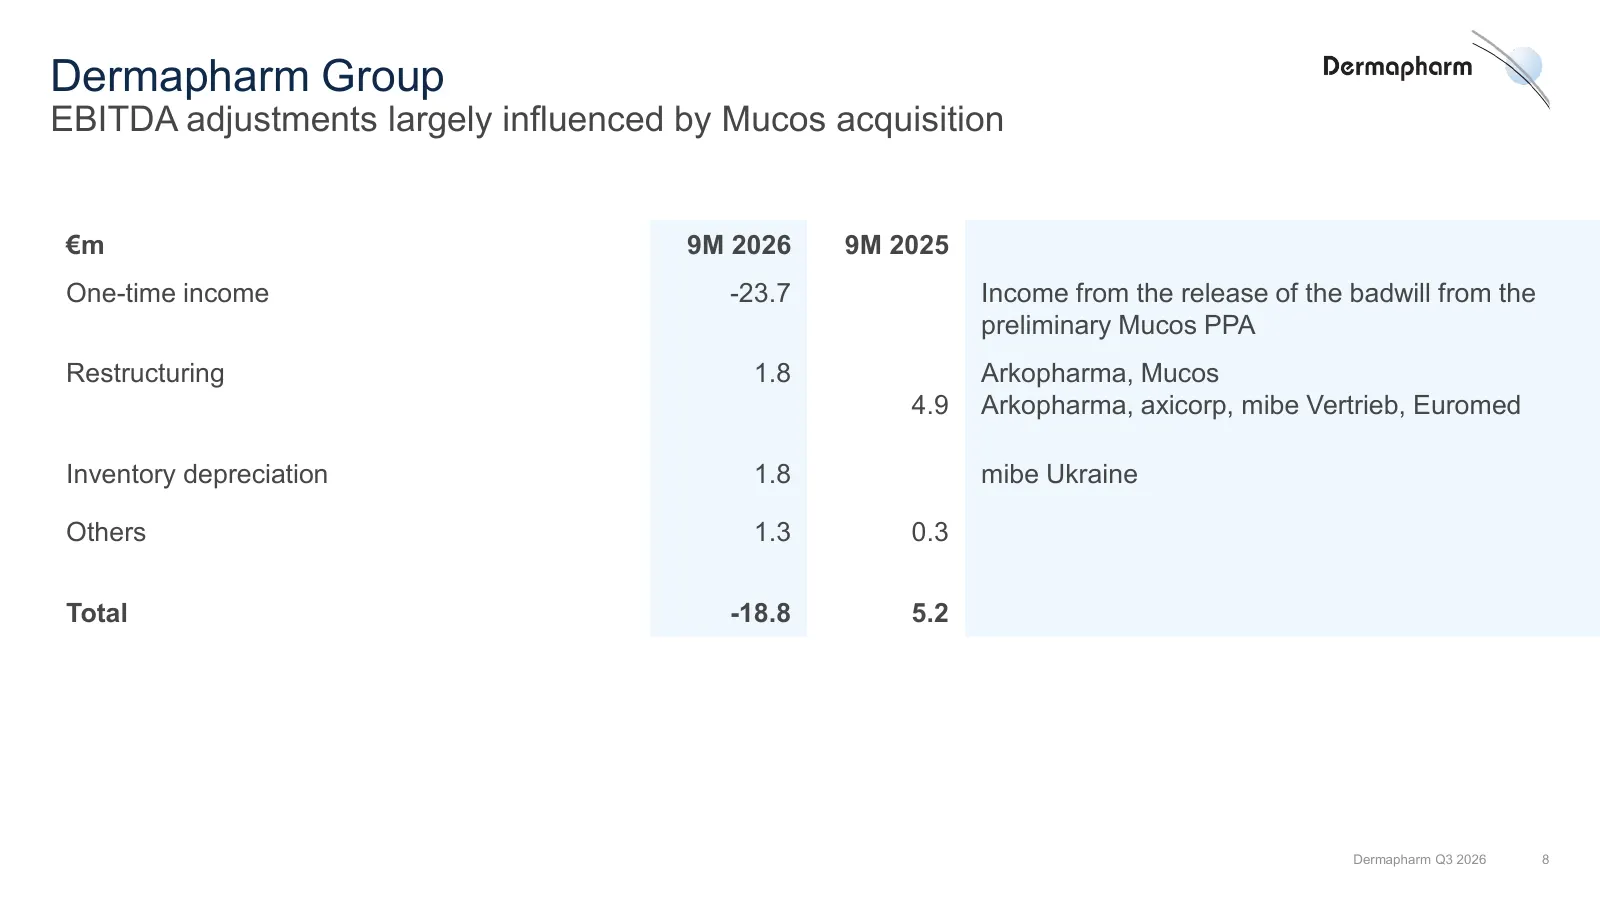
Slide 8: EBITDA adjustments largely influenced by Mucos acquisition
Dermapharm Group EBITDA adjustments largely influenced by Mucos acquisition €m 9M 2026 9M 2025 One-time income -23.7 Income from the release of the badwill from the preliminary Mucos PPA Restructuring 1.8 Arkopharma, Mucos 4.9 Arkopharma, axicorp, mibe Vertrieb, Euromed Inventory depreciation 1.8 mi
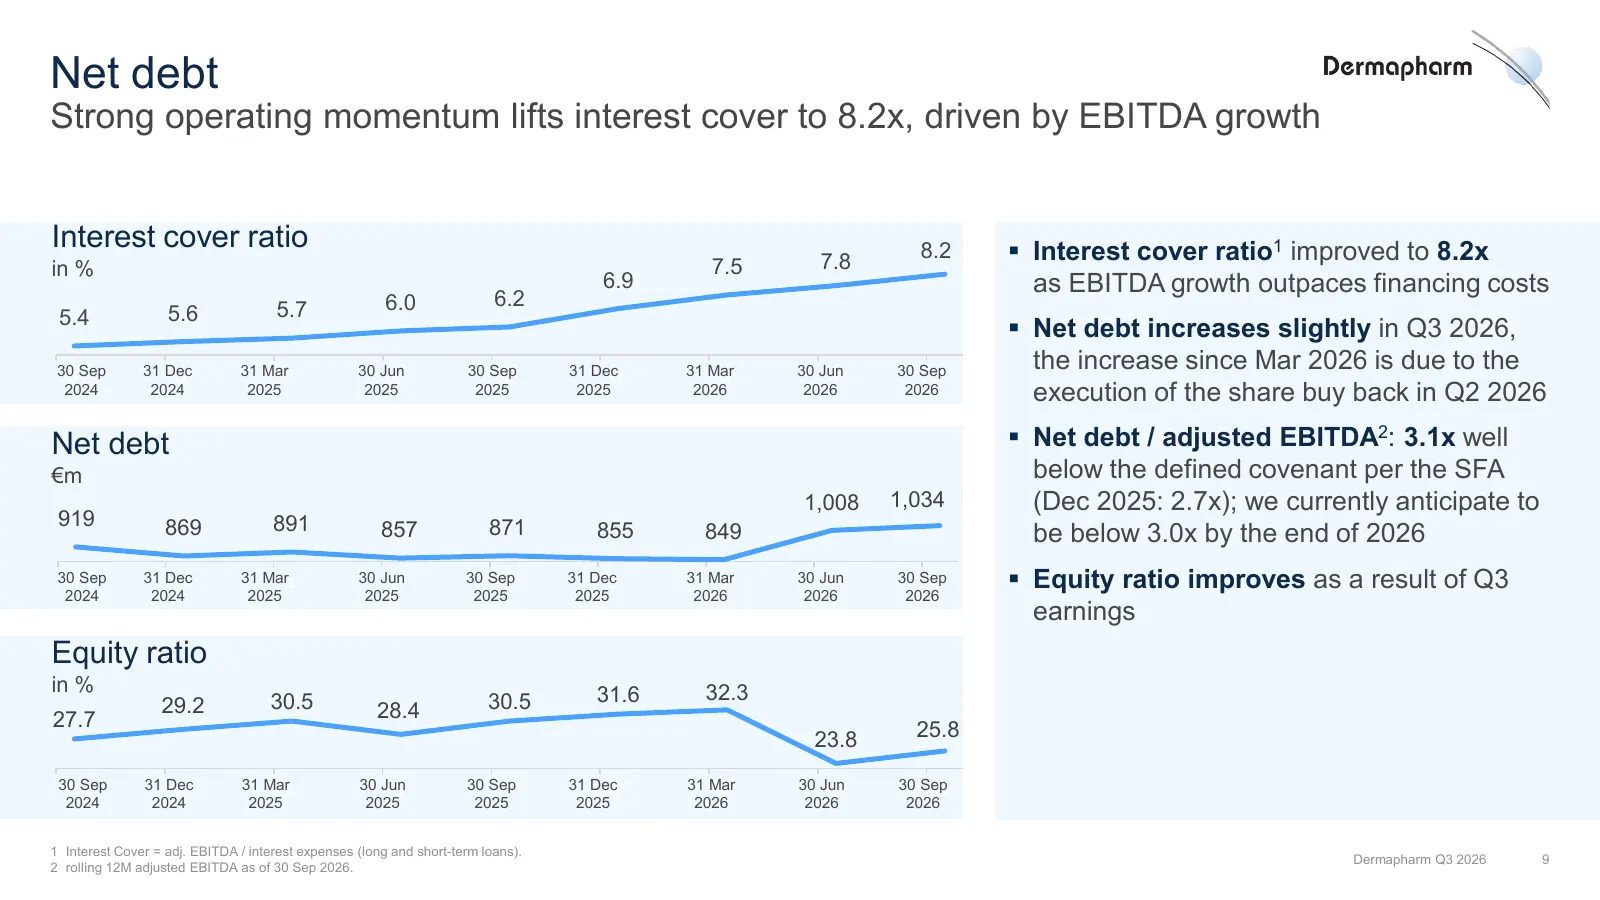
Slide 9: Net debt
Net debt Strong operating momentum lifts interest cover to 8.2x, driven by EBITDA growth Interest cover ratio 8.2 Interest cover ratio1 improved to 8.2x in % 7.5 7.8 6.9 as EBITDA growth outpaces financing costs 6.0 6.2 5.4 5.6 5.7 Net debt increases slightly in Q3 2026, 30 Sep 31 Dec 31 Mar 30
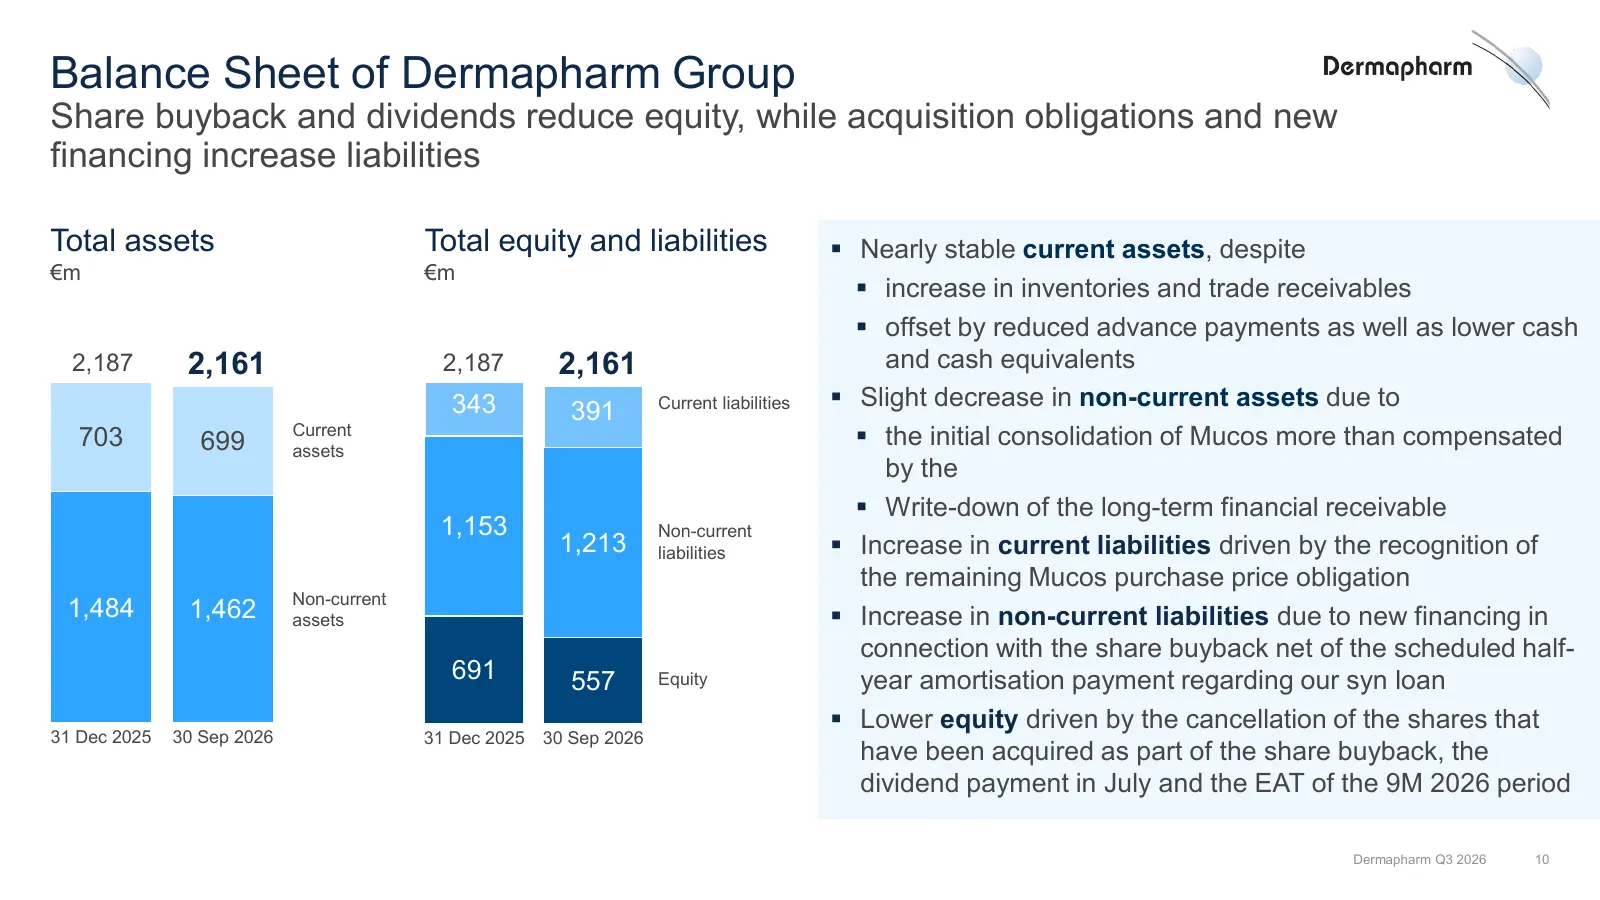
Slide 10: Balance Sheet of Dermapharm Group
Balance Sheet of Dermapharm Group Share buyback and dividends reduce equity, while acquisition obligations and new financing increase liabilities Total assets Total equity and liabilities Nearly stable current assets, despite €m €m increase in inventories and trade receivables offset by reduce
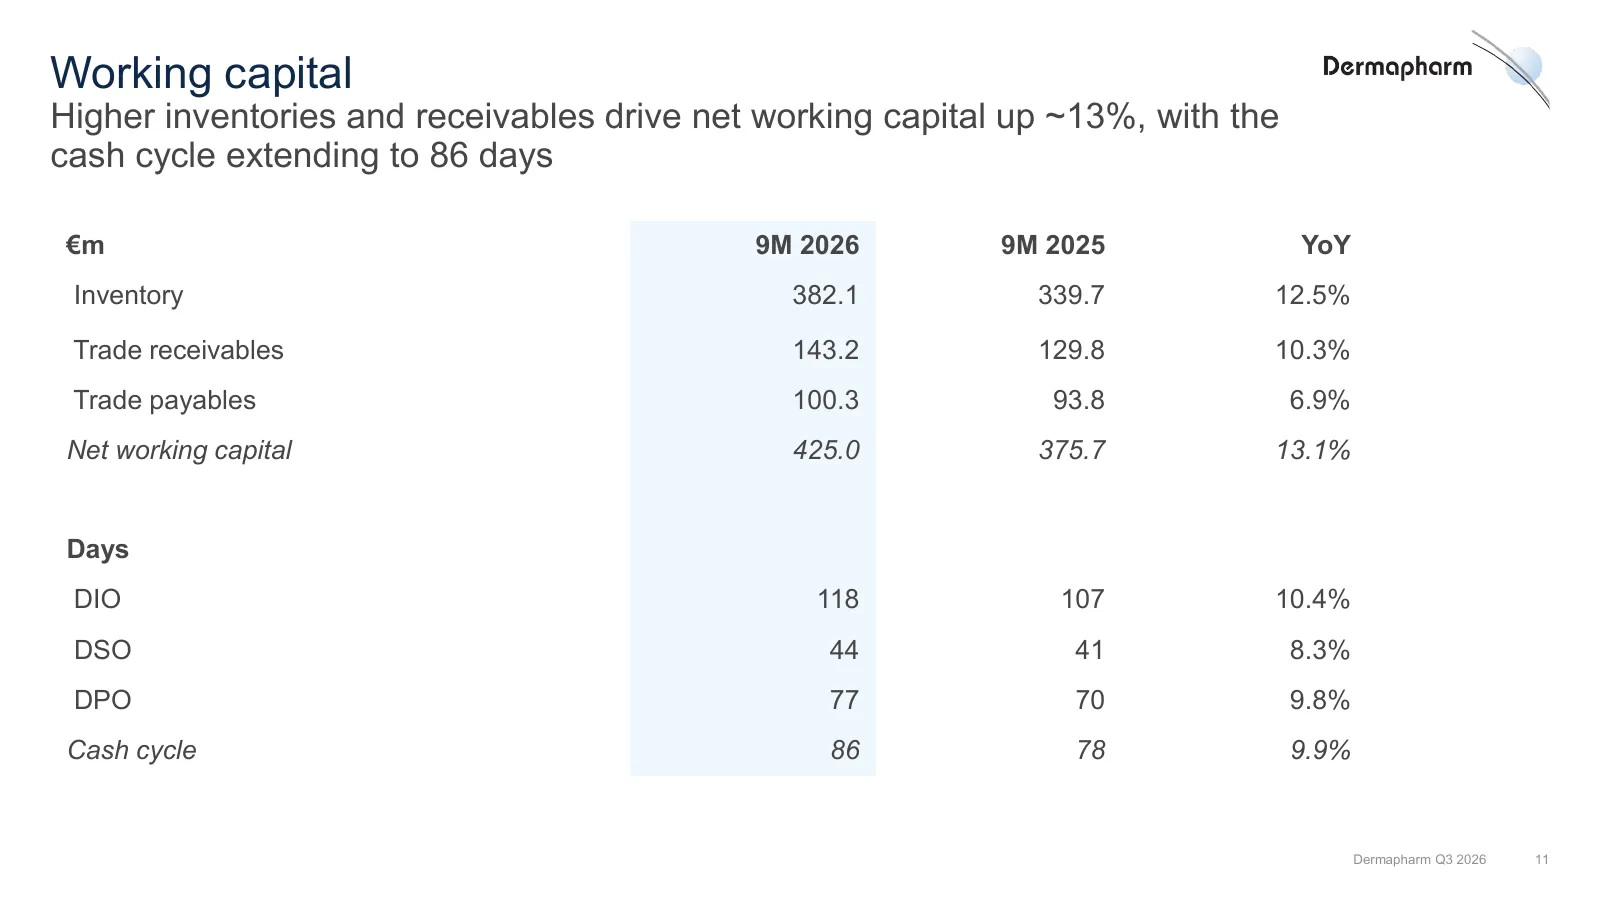
Slide 11: Working capital
Working capital Higher inventories and receivables drive net working capital up ~13%, with the cash cycle extending to 86 days €m 9M 2026 9M 2025 YoY Inventory 382.1 339.7 12.5% Trade receivables 143.2 129.8 10.3% Trade payables 100.3 93.8 6.9% Net working capital 425.0 375.7 13.1% Days DIO 118 107
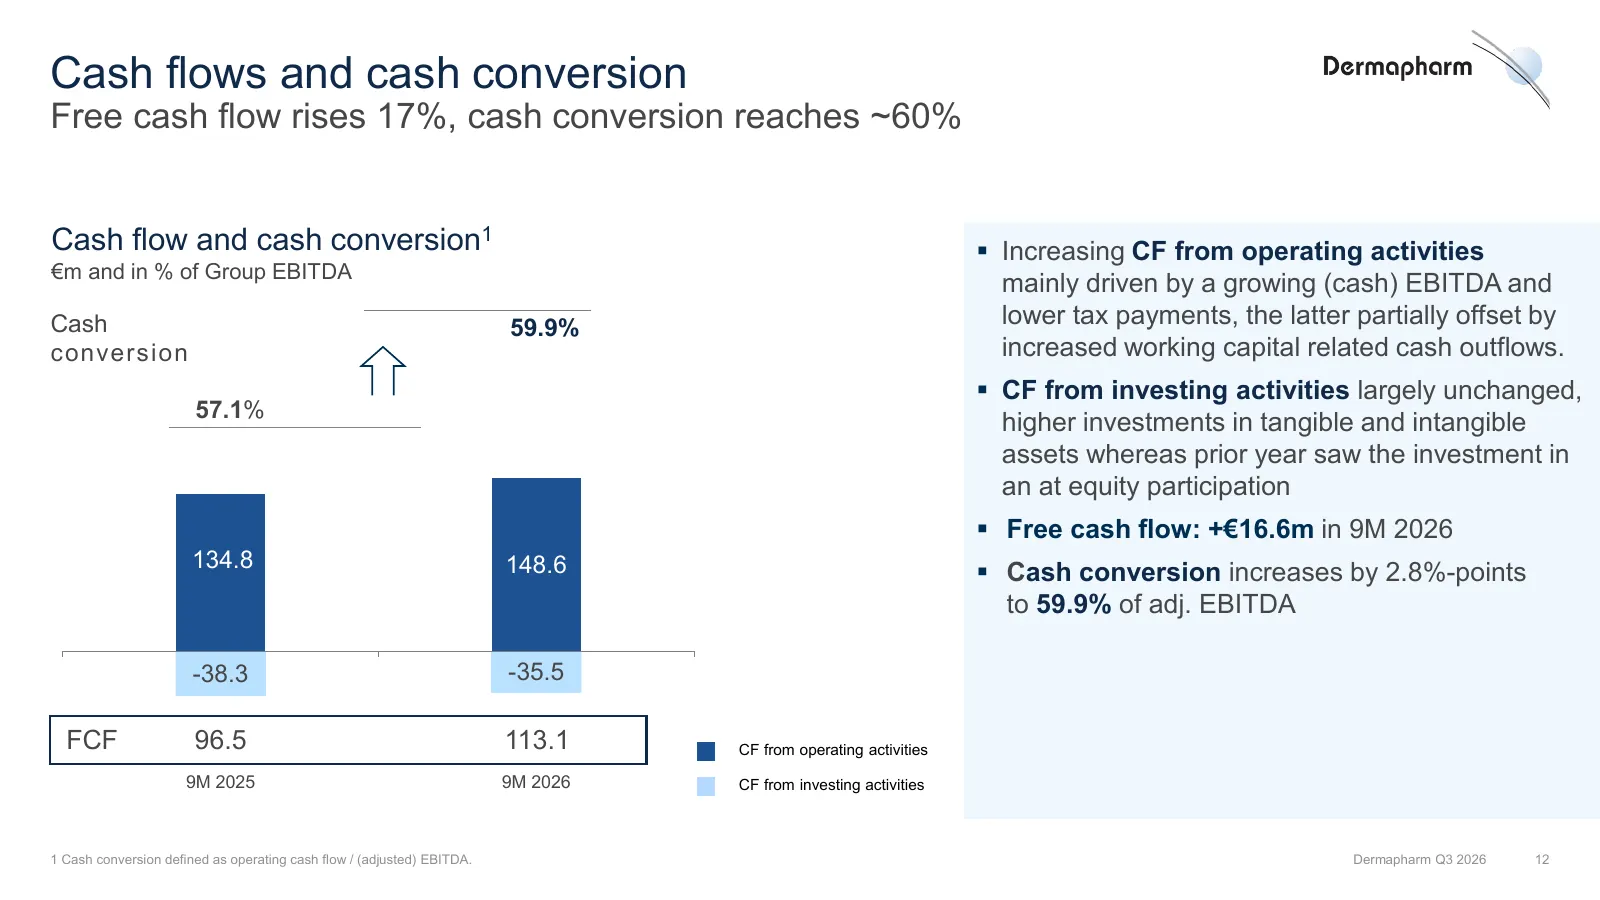
Slide 12: Cash flows and cash conversion
Cash flows and cash conversion Free cash flow rises 17%, cash conversion reaches ~60% Cash flow and cash conversion1 Increasing CF from operating activities €m and in % of Group EBITDA mainly driven by a growing (cash) EBITDA and Cash 59.9% lower tax payments, the latter partially offset by conver
Slide 13: Cash flow from operating activities
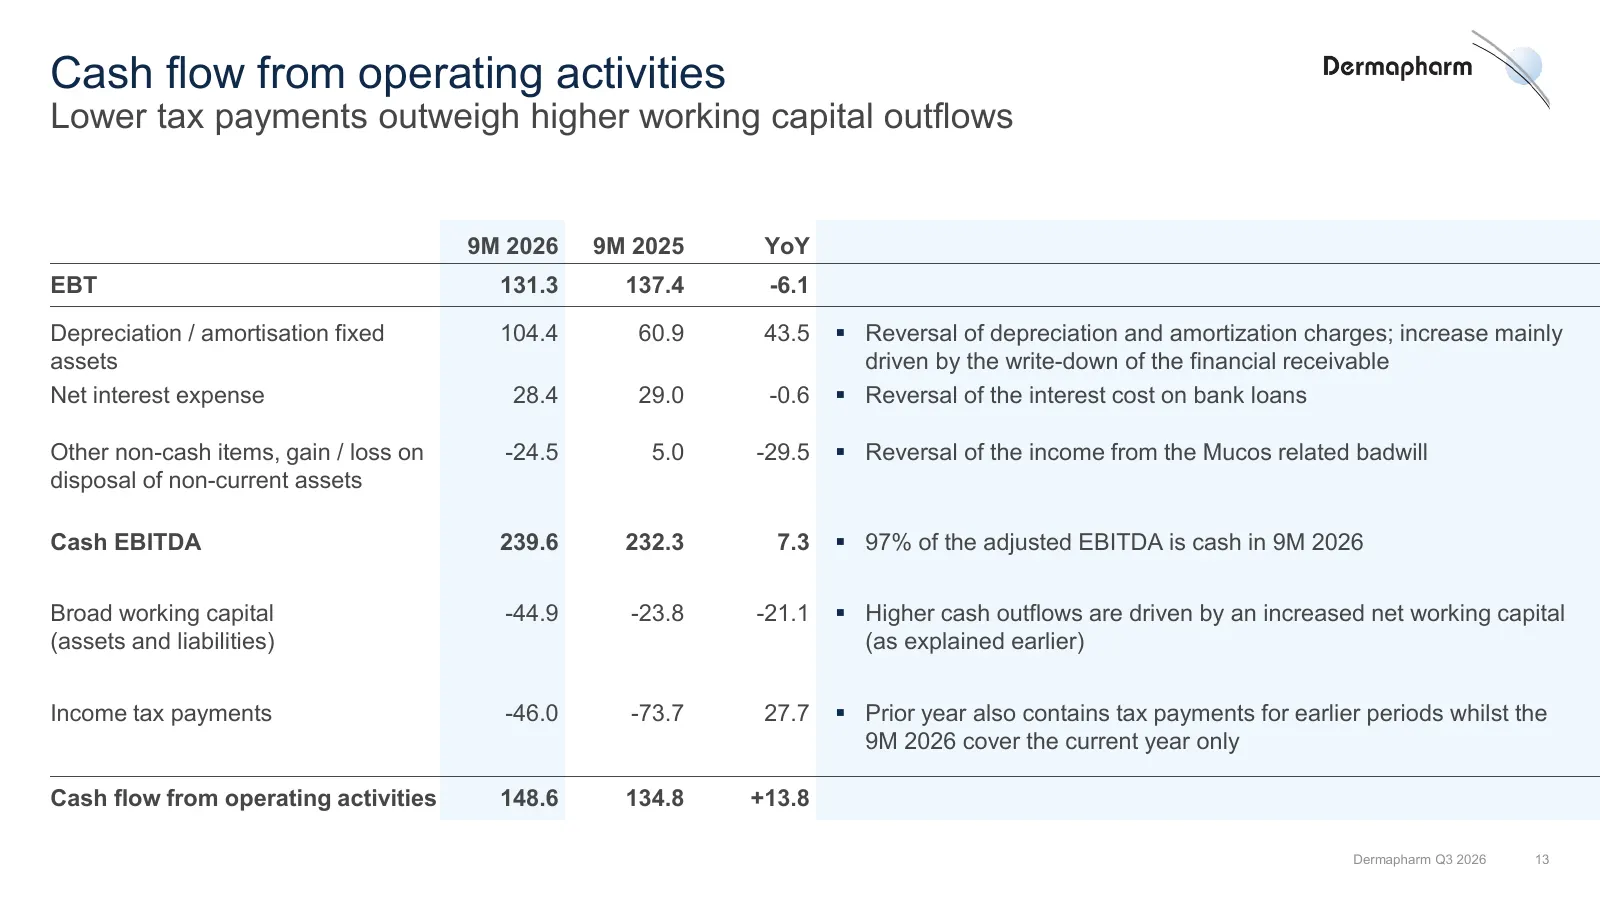
Cash flow from operating activities Lower tax payments outweigh higher working capital outflows 9M 2026 9M 2025 YoY EBT 131.3 137.4 -6.1 Depreciation / amortisation fixed 104.4 60.9 43.5 Reversal of depreciation and amortization charges; increase mainly assets driven by the write-down of the finan
Slide 14: Outlook 2026
2 Outlook 2026 Dermapharm Q3 2026
Slide 15: Outlook 2026
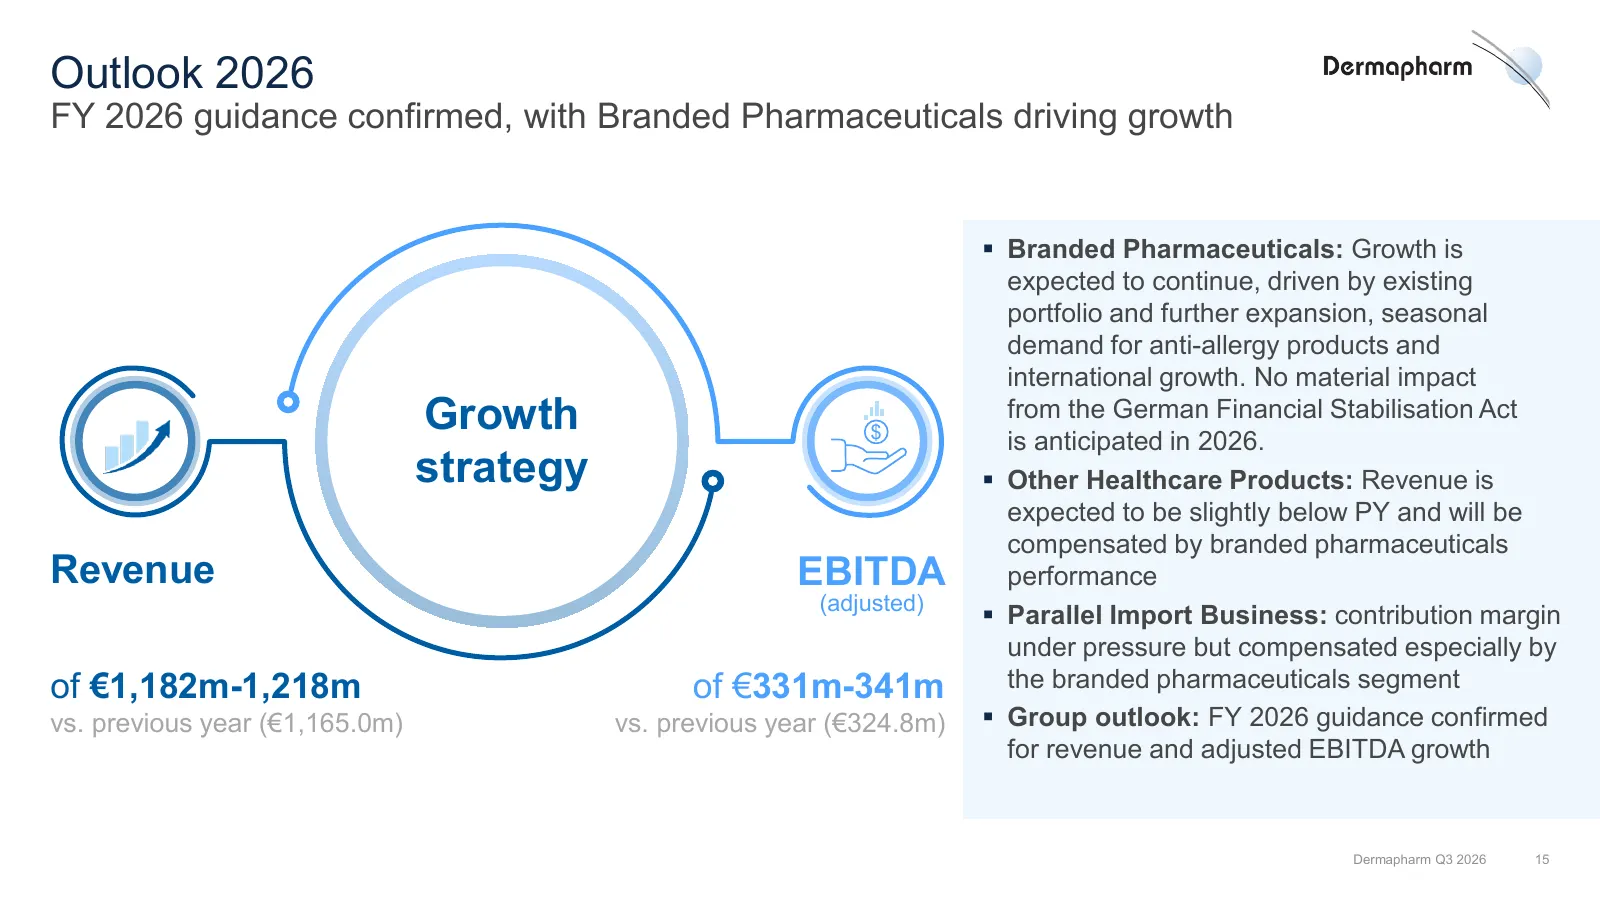
Outlook 2026 FY 2026 guidance confirmed, with Branded Pharmaceuticals driving growth Branded Pharmaceuticals: Growth is expected to continue, driven by existing portfolio and further expansion, seasonal demand for anti-allergy products and international growth. No material impact Growth $ from the

Slide 16: Q&A
3 Q&A Dermapharm Dermapharm PPT Master Q3 2026 16
Slide 17: Backup
Backup Dermapharm Q3 2026
Slide 18: Branded Pharmaceuticals
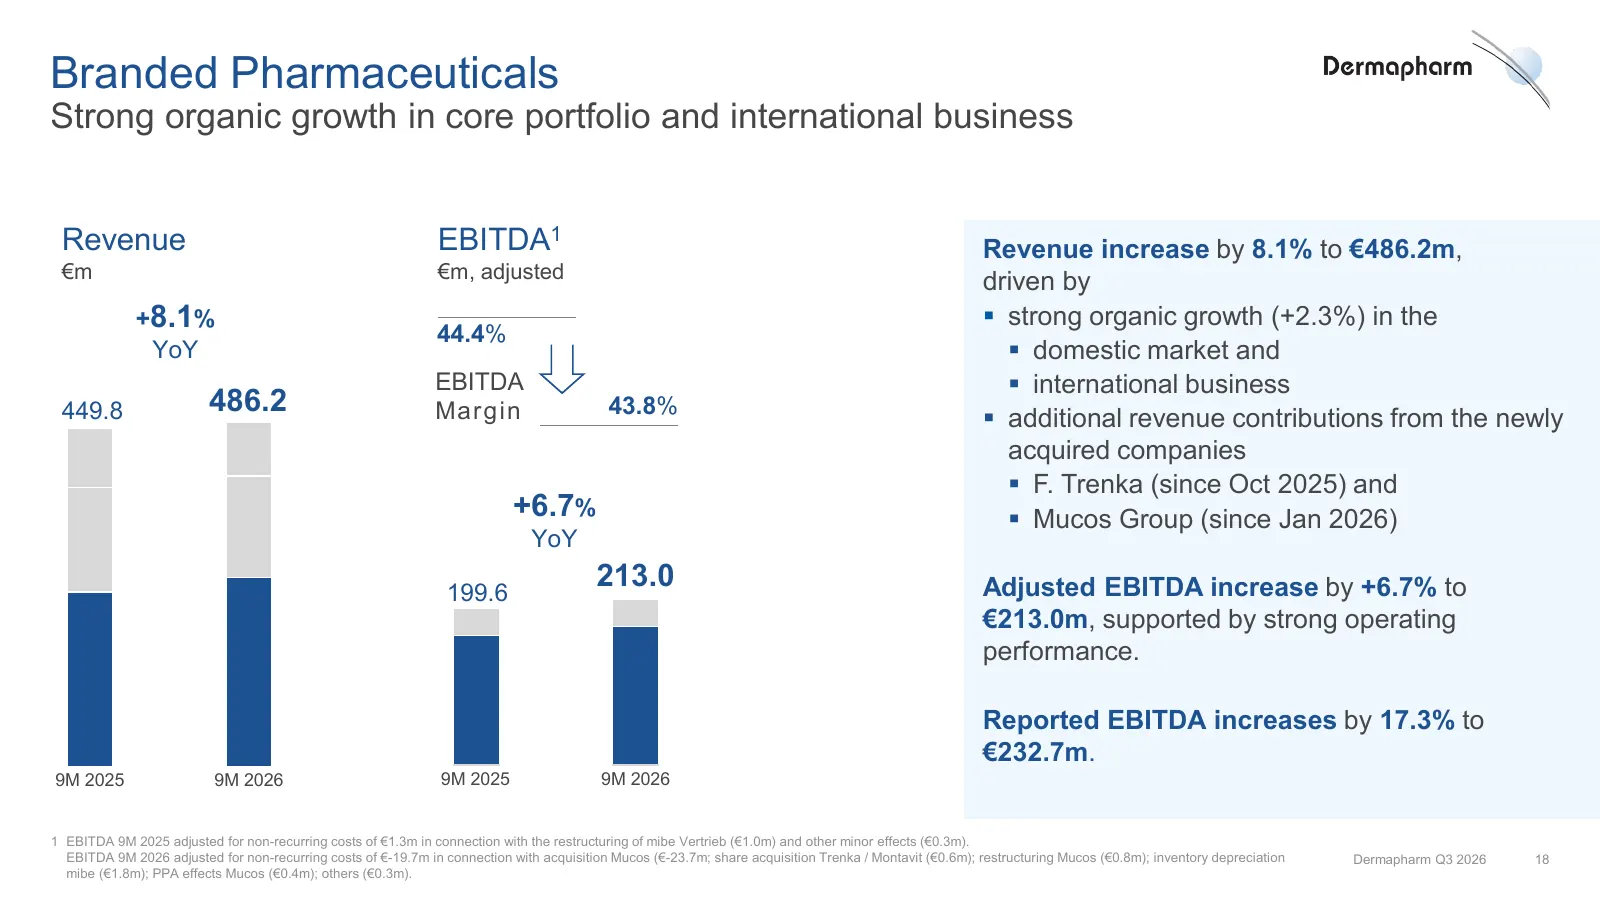
Branded Pharmaceuticals Strong organic growth in core portfolio and international business Revenue EBITDA1 Revenue increase by 8.1% to €486.2m, €m €m, adjusted driven by +8.1% strong organic growth (+2.3%) in the 44.4% YoY domestic market and EBITDA international business 449.8 486.2 Margin 43
Slide 19: Other Healthcare Products
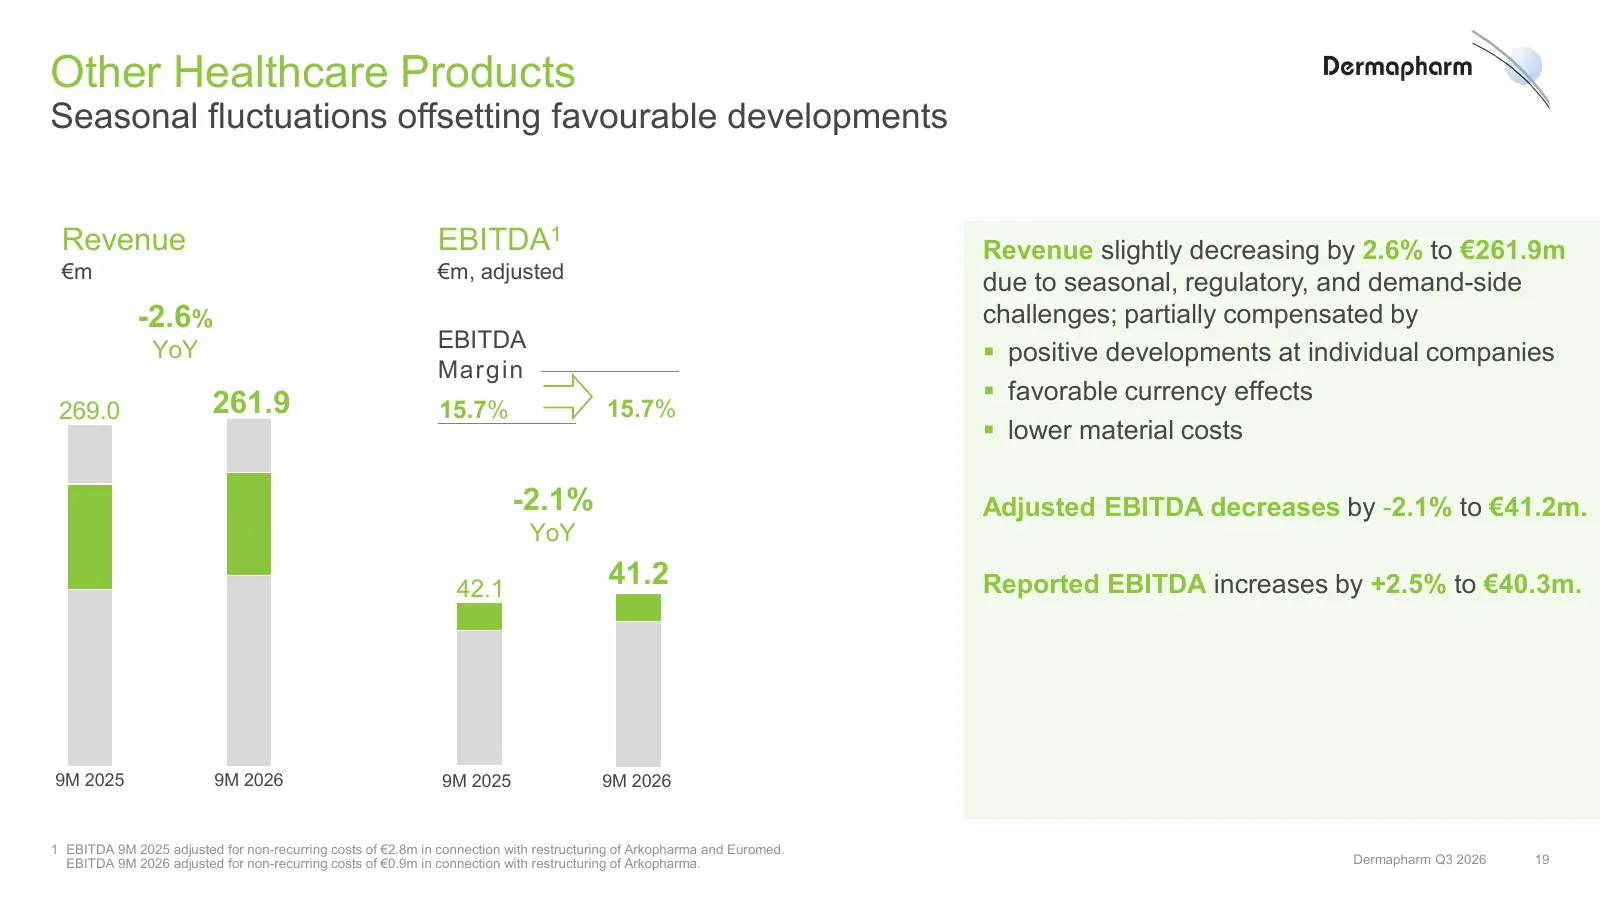
Other Healthcare Products Seasonal fluctuations offsetting favourable developments Revenue EBITDA1 Revenue slightly decreasing by 2.6% to €261.9m €m €m, adjusted due to seasonal, regulatory, and demand-side -2.6% challenges; partially compensated by YoY EBITDA positive developments at individual c
Slide 20: Parallel Import Business
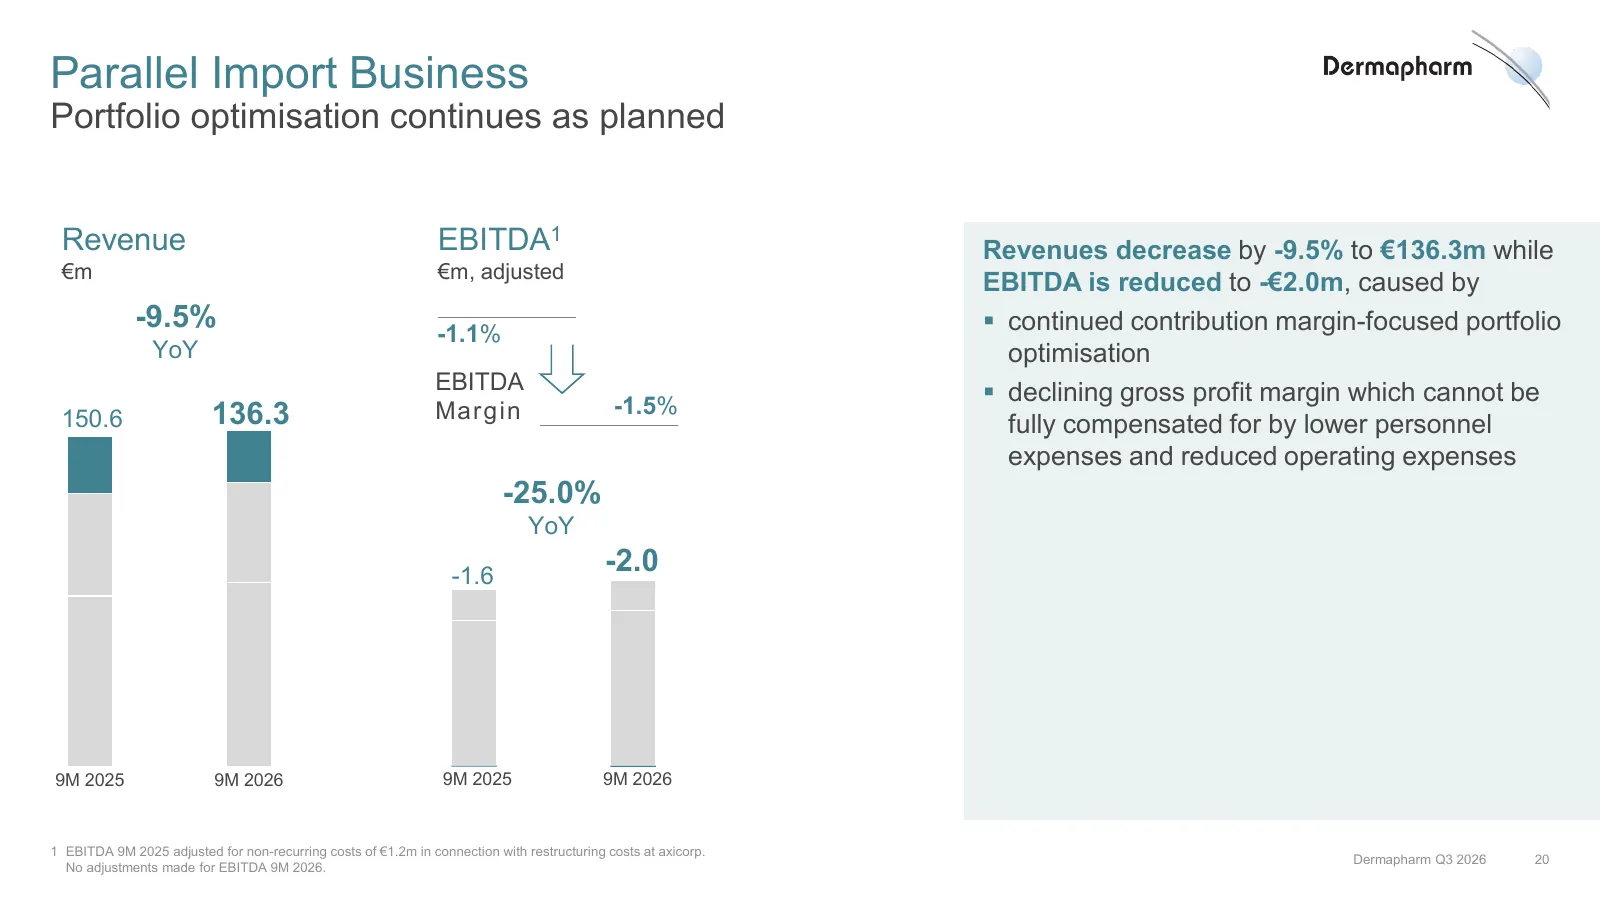
Parallel Import Business Portfolio optimisation continues as planned Revenue EBITDA1 Revenues decrease by -9.5% to €136.3m while €m €m, adjusted EBITDA is reduced to -€2.0m, caused by -9.5% -1.1% continued contribution margin-focused portfolio YoY optimisation EBITDA declining gross profit margi
Slide 21: Earnings before tax (Group EBT)
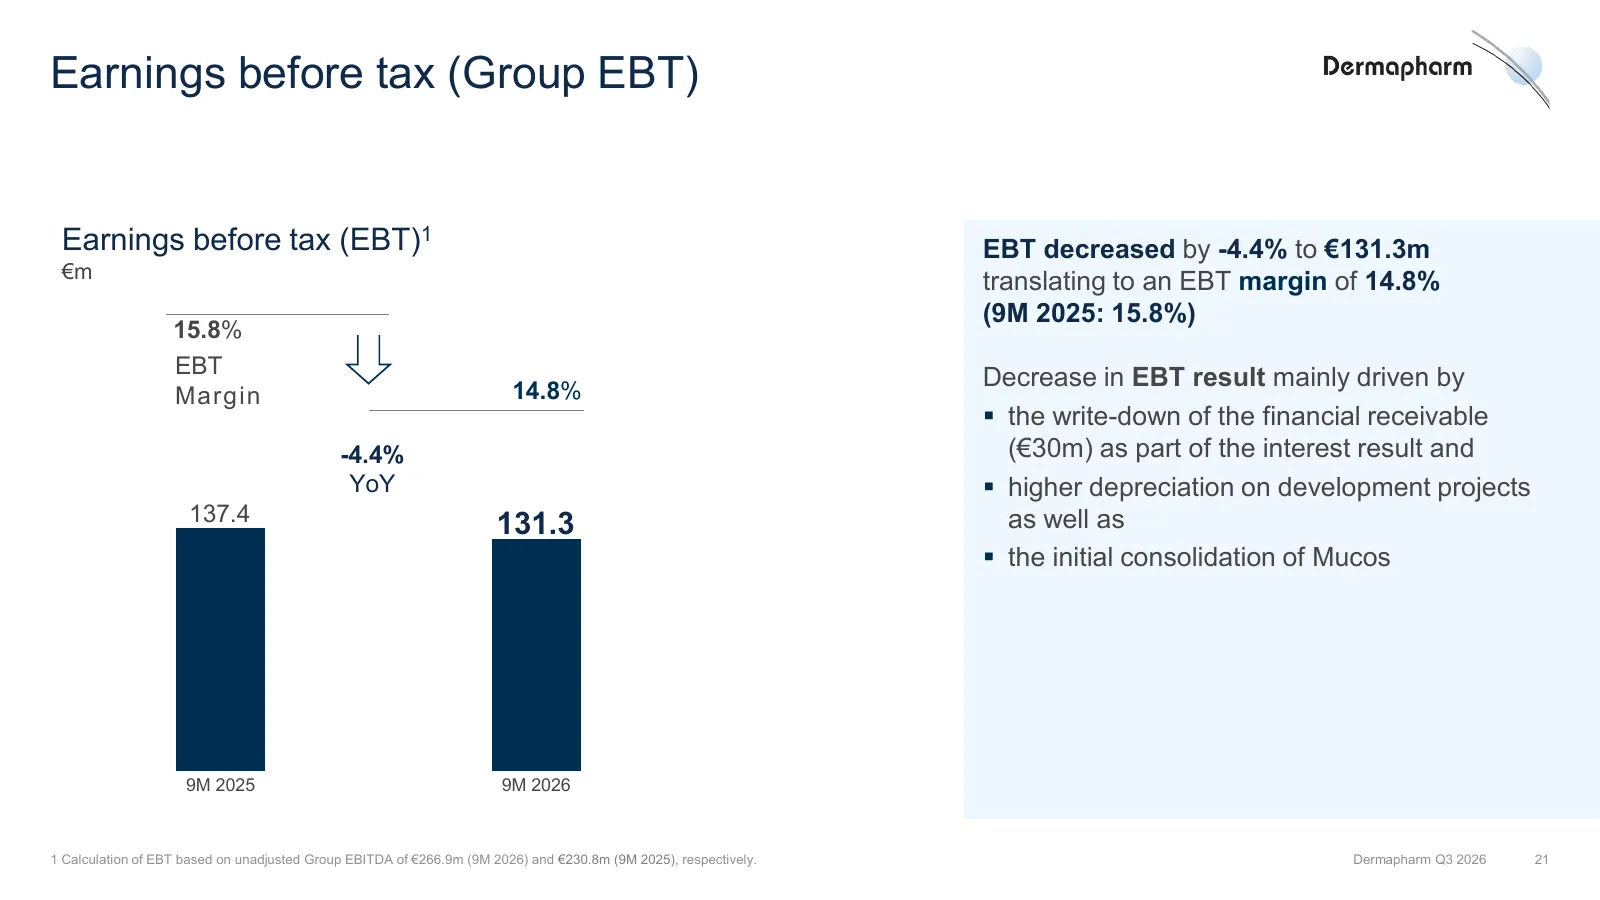
Earnings before tax (Group EBT) Earnings before tax (EBT)1 EBT decreased by -4.4% to €131.3m €m translating to an EBT margin of 14.8% (9M 2025: 15.8%) 15.8% EBT Decrease in EBT result mainly driven by Margin 14.8% the write-down of the financial receivable -4.4% (€30m) as part of the interest resu
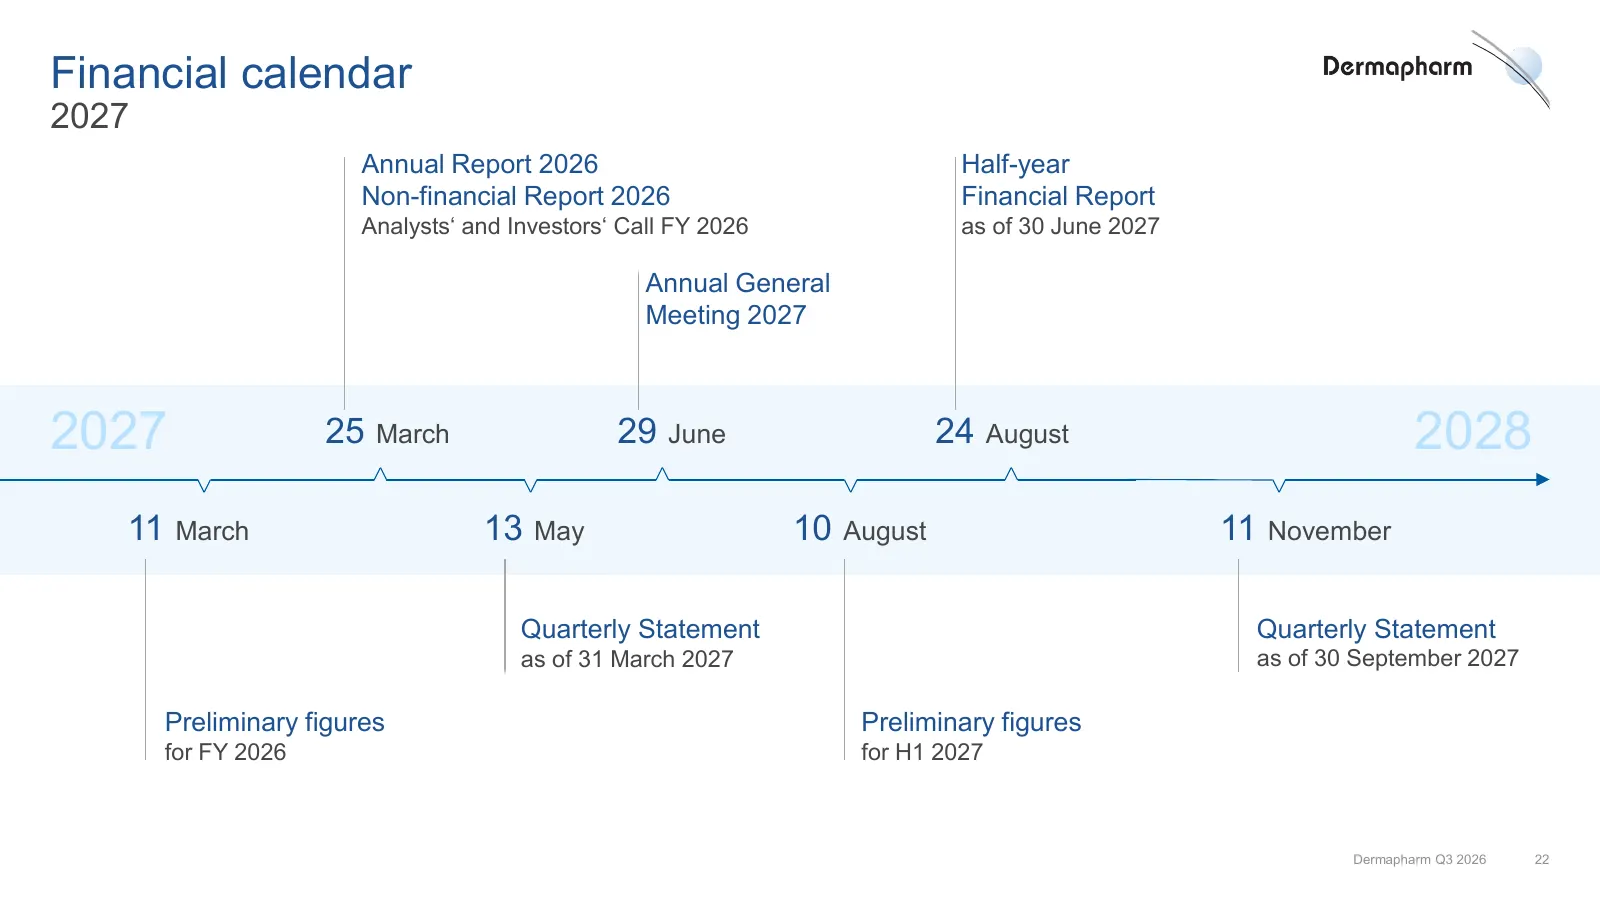
Slide 22: Financial calendar
Financial calendar 2027 Annual Report 2026 Half-year Non-financial Report 2026 Financial Report Analysts‘ and Investors‘ Call FY 2026 as of 30 June 2027 Annual General Meeting 2027 2027 25 March 29 June 24 August 2028 11 March 13 May 10 August 11 November Quarterly Statement Quarterly Statement as o
Slide 23: Disclaimer
Disclaimer This publication includes statements, estimates, opinions and projections with respect to the anticipated future performance of Dermapharm Holding SE (together with its consolidated subsidiaries, “Dermapharm”) and such statements, estimates, opinions and projections (“Forward-Looking Stat
Slide 24: For information, please contact
For information, please contact Britta Hamberger Investor Relations & Corporate Communications Dermapharm Holding SE E-Mail: ir@dermapharm.com Phone: +49 (0) 89 64186-233
Source: 6ix earnings call
More decks from Dermapharm Holding SE
 Q1 2026 Earnings Presentation21 slides · May 13, 2026
 FY2025 Earnings Presentation24 slides · Mar 31, 2026
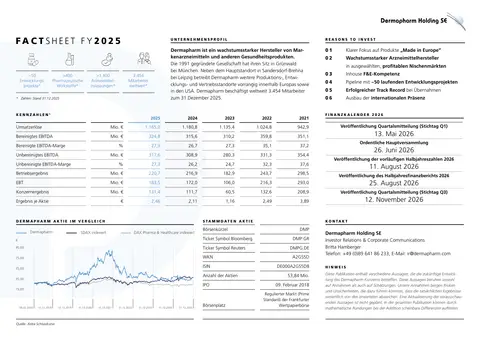 Fact Sheet (2026)2 slides · Mar 30, 2026
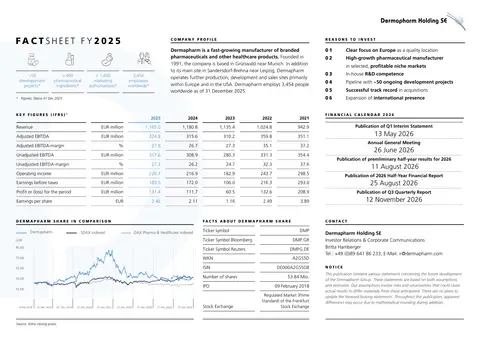 Fact Sheet (December 2025)2 slides · Dec 31, 2025
 Q3 2025 Earnings Presentation23 slides · Nov 13, 2025
 H1 2025 Earnings Presentation23 slides · Aug 26, 2025