Spire Global, Inc. · NYSE:SPIR
Spire Global — Q3 2026 Earnings Presentation
10 slides from Spire Global's earnings presentation, November 2026

Slide 1: Spire Global Q3 2026 Investor Update
Spire Global Q3 2026 Investor Update Turning Space Data into Actionable Intelligence November 2026 | NYSE: SPIR Satellite Data · Analytics · Intelligence
Slide 2: Cautionary Note Regarding Forward-Looking Statements
Cautionary Note Regarding Forward-Looking Statements This presentation contains forward-looking statements within the safe harbor provisions under the Private Securities Litigation Reform Act of 1995. All statements, other than statements of historical fact, are forward-looking statements, including
Slide 3: Business Update
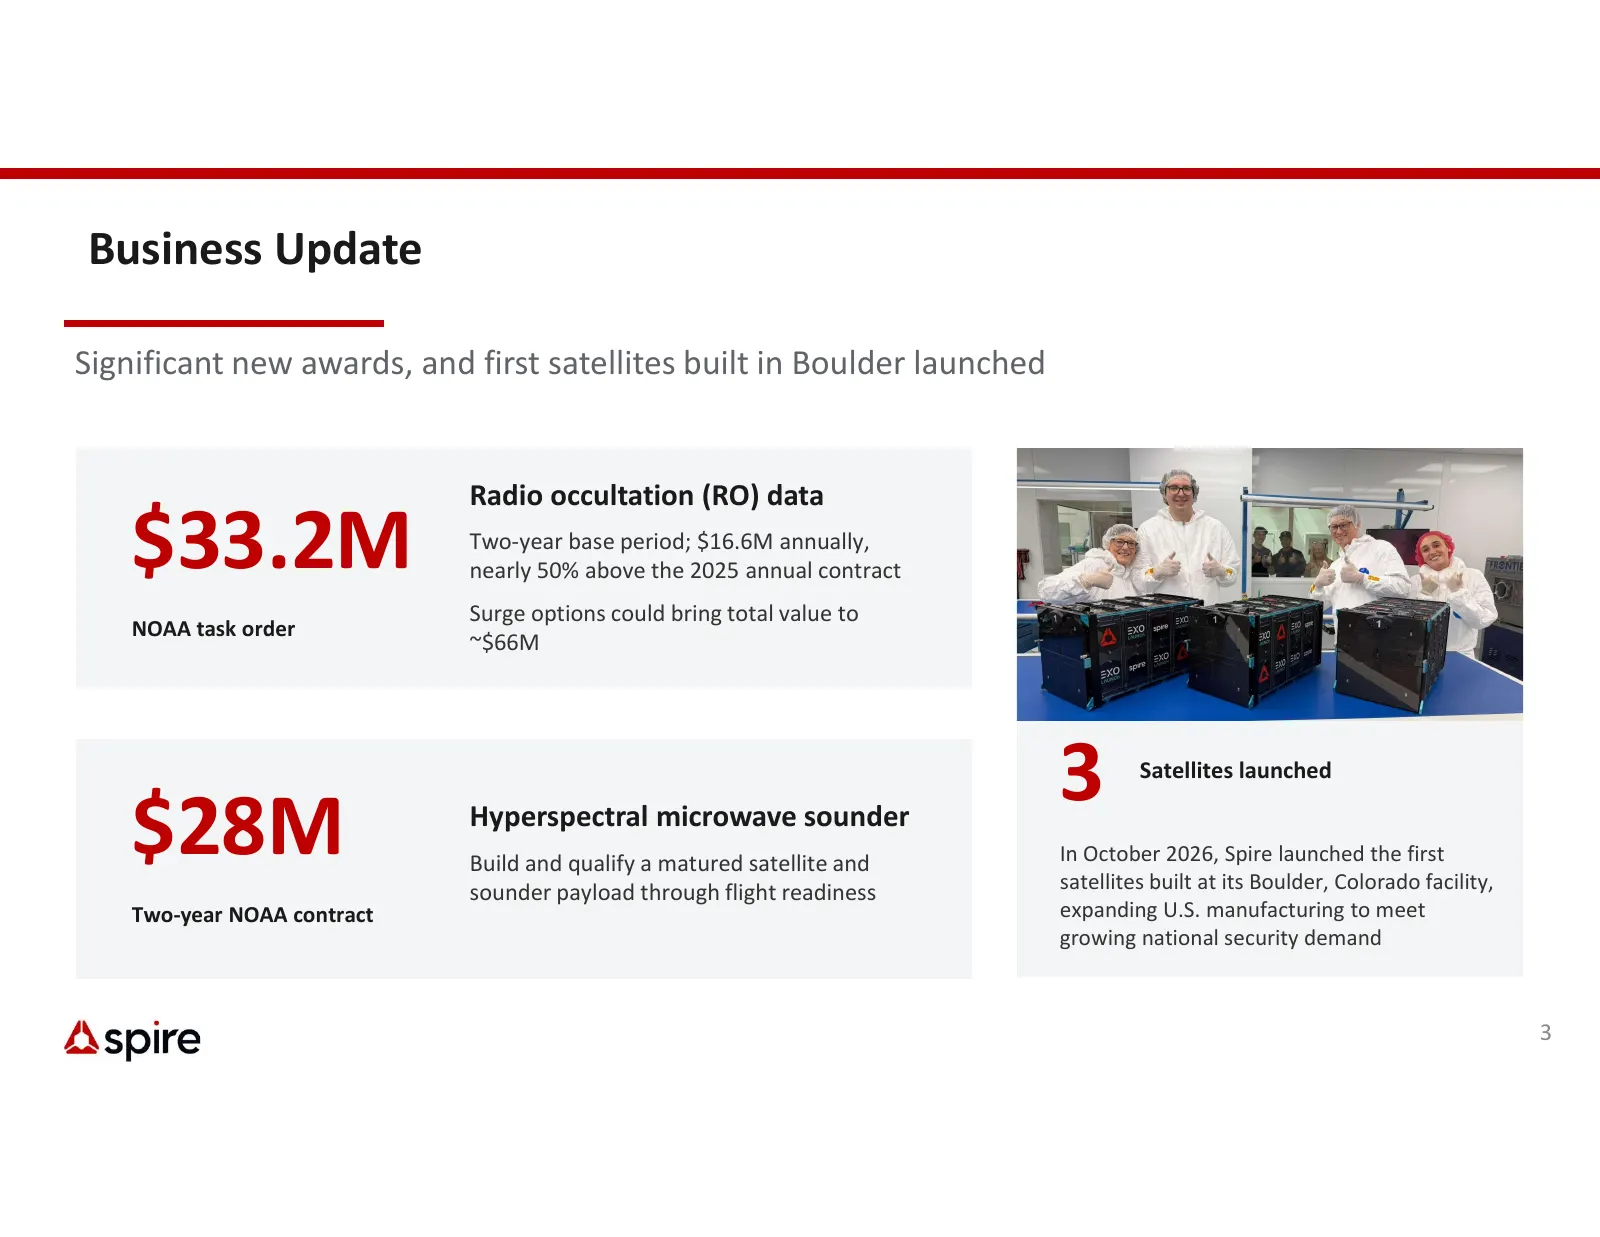
Business Update Significant new awards, and first satellites built in Boulder launched Radio occultation (RO) data $33.2M Two-year base period; $16.6M annually, nearly 50% above the 2025 annual contract Surge options could bring total value to NOAA task order ~$66M 3 Satellites launched $28M Hypersp
Slide 4: Third Quarter 2026 Non-GAAP Results
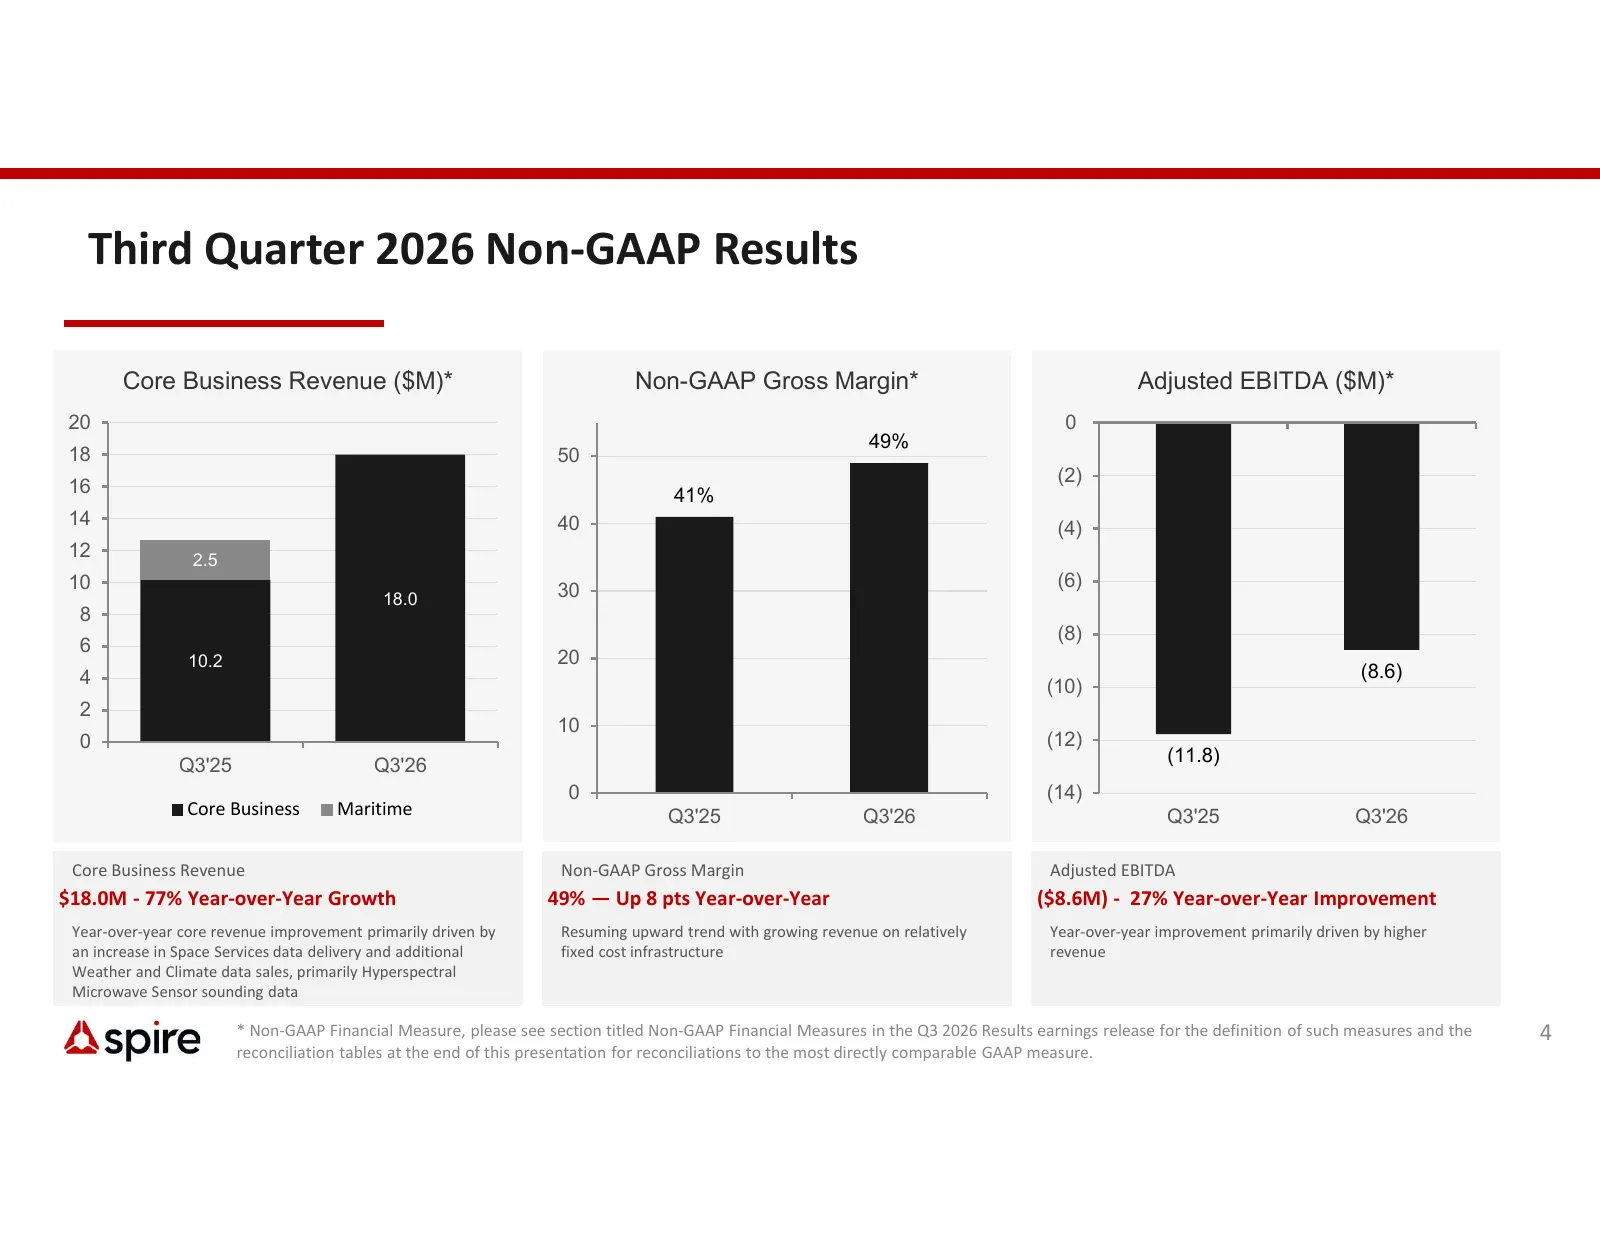
Third Quarter 2026 Non-GAAP Results Core Business Revenue ($M)* Non-GAAP Gross Margin* Adjusted EBITDA ($M)* 20 0 49% 18 50 (2) 16 41% 14 40 (4) 12 2.5 10 30 (6) 18.0 8 (8) 6 10.2 20 4 (8.6) (10) 2 10 0 (12) Q3'25 Q3'26 (11.8) 0 (14) Core Business Maritime Q3'25 Q3'26 Q3'25 Q3'26 Core Business Reven
Slide 5: 2026 Quarterly Non-GAAP Progression
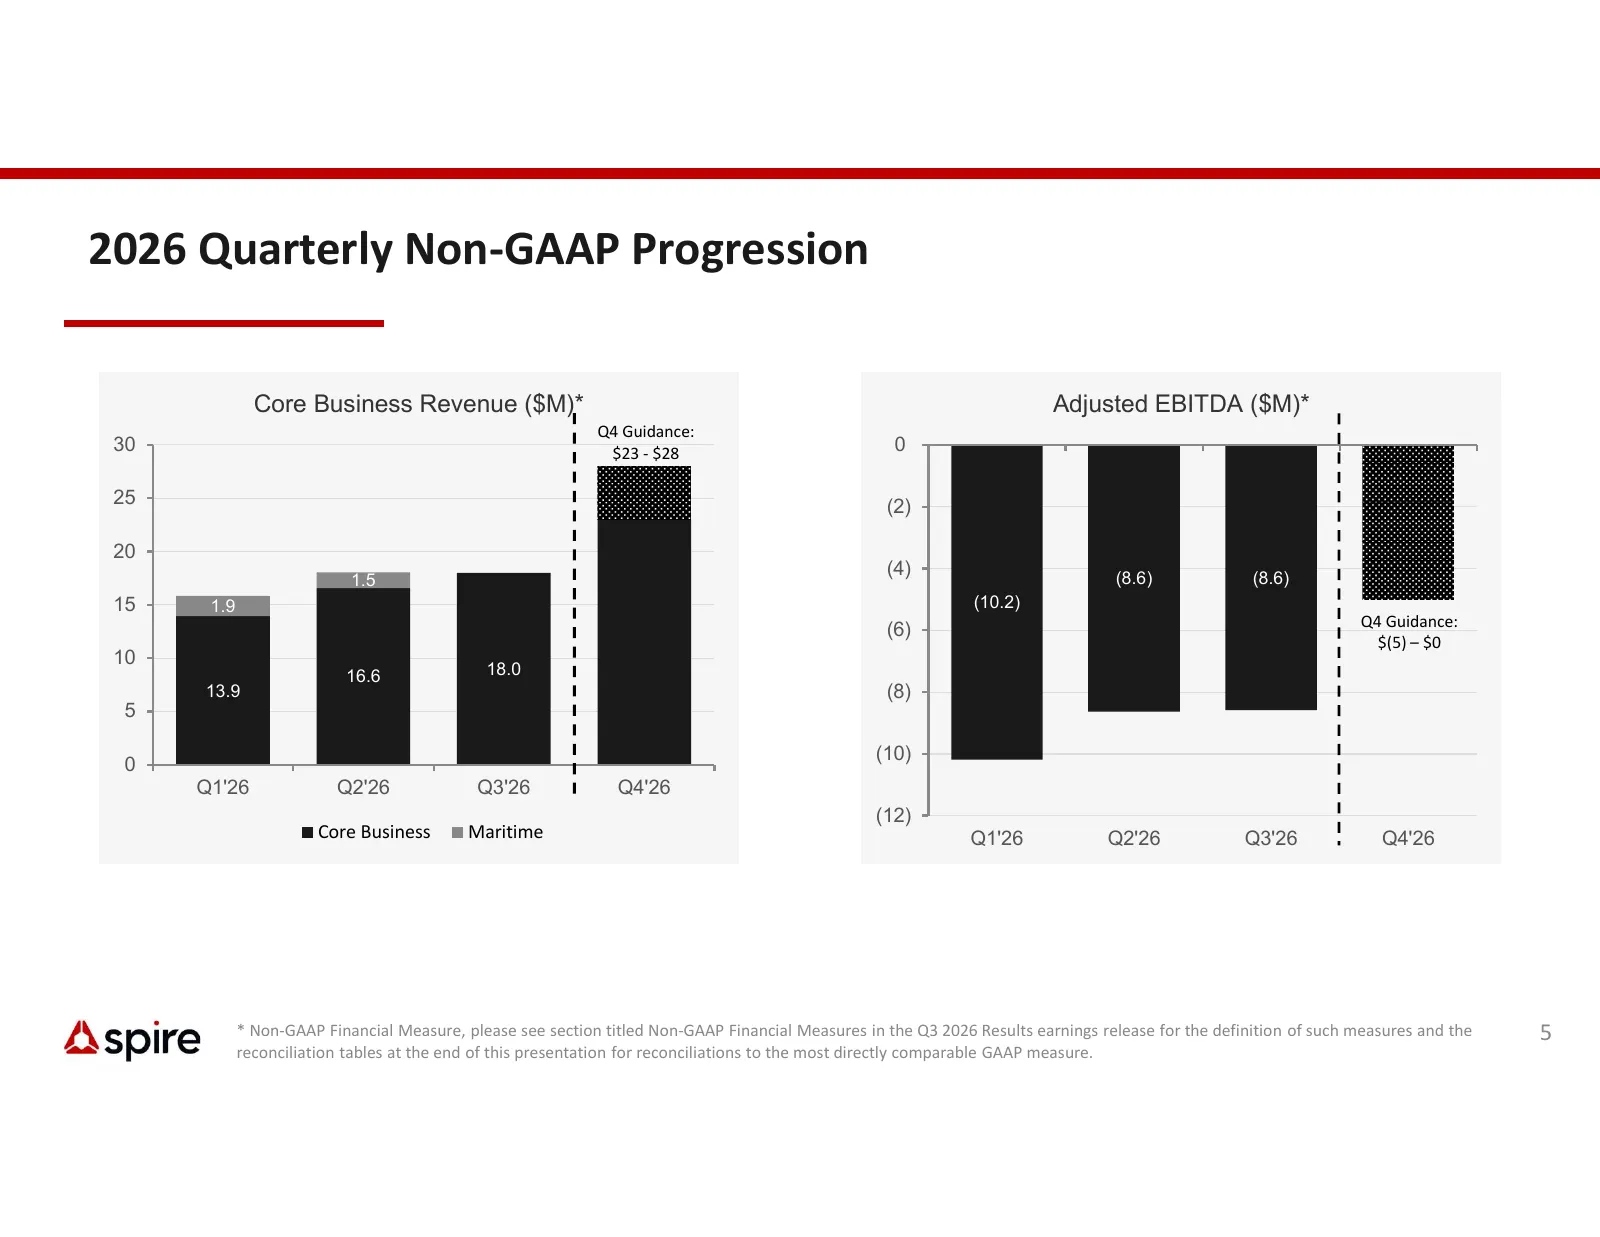
2026 Quarterly Non-GAAP Progression Core Business Revenue ($M)* Adjusted EBITDA ($M)* Q4 Guidance: 30 $23 - $28 0 25 (2) 20 (4) (8.6) (8.6) 1.5 15 1.9 (10.2) Q4 Guidance: (6) $(5) – $0 10 16.6 18.0 13.9 (8) 5 (10) 0 Q1'26 Q2'26 Q3'26 Q4'26 (12) Core Business Maritime Q1'26 Q2'26 Q3'26 Q4'26 * Non-GA
Slide 6: 2026 Outlook
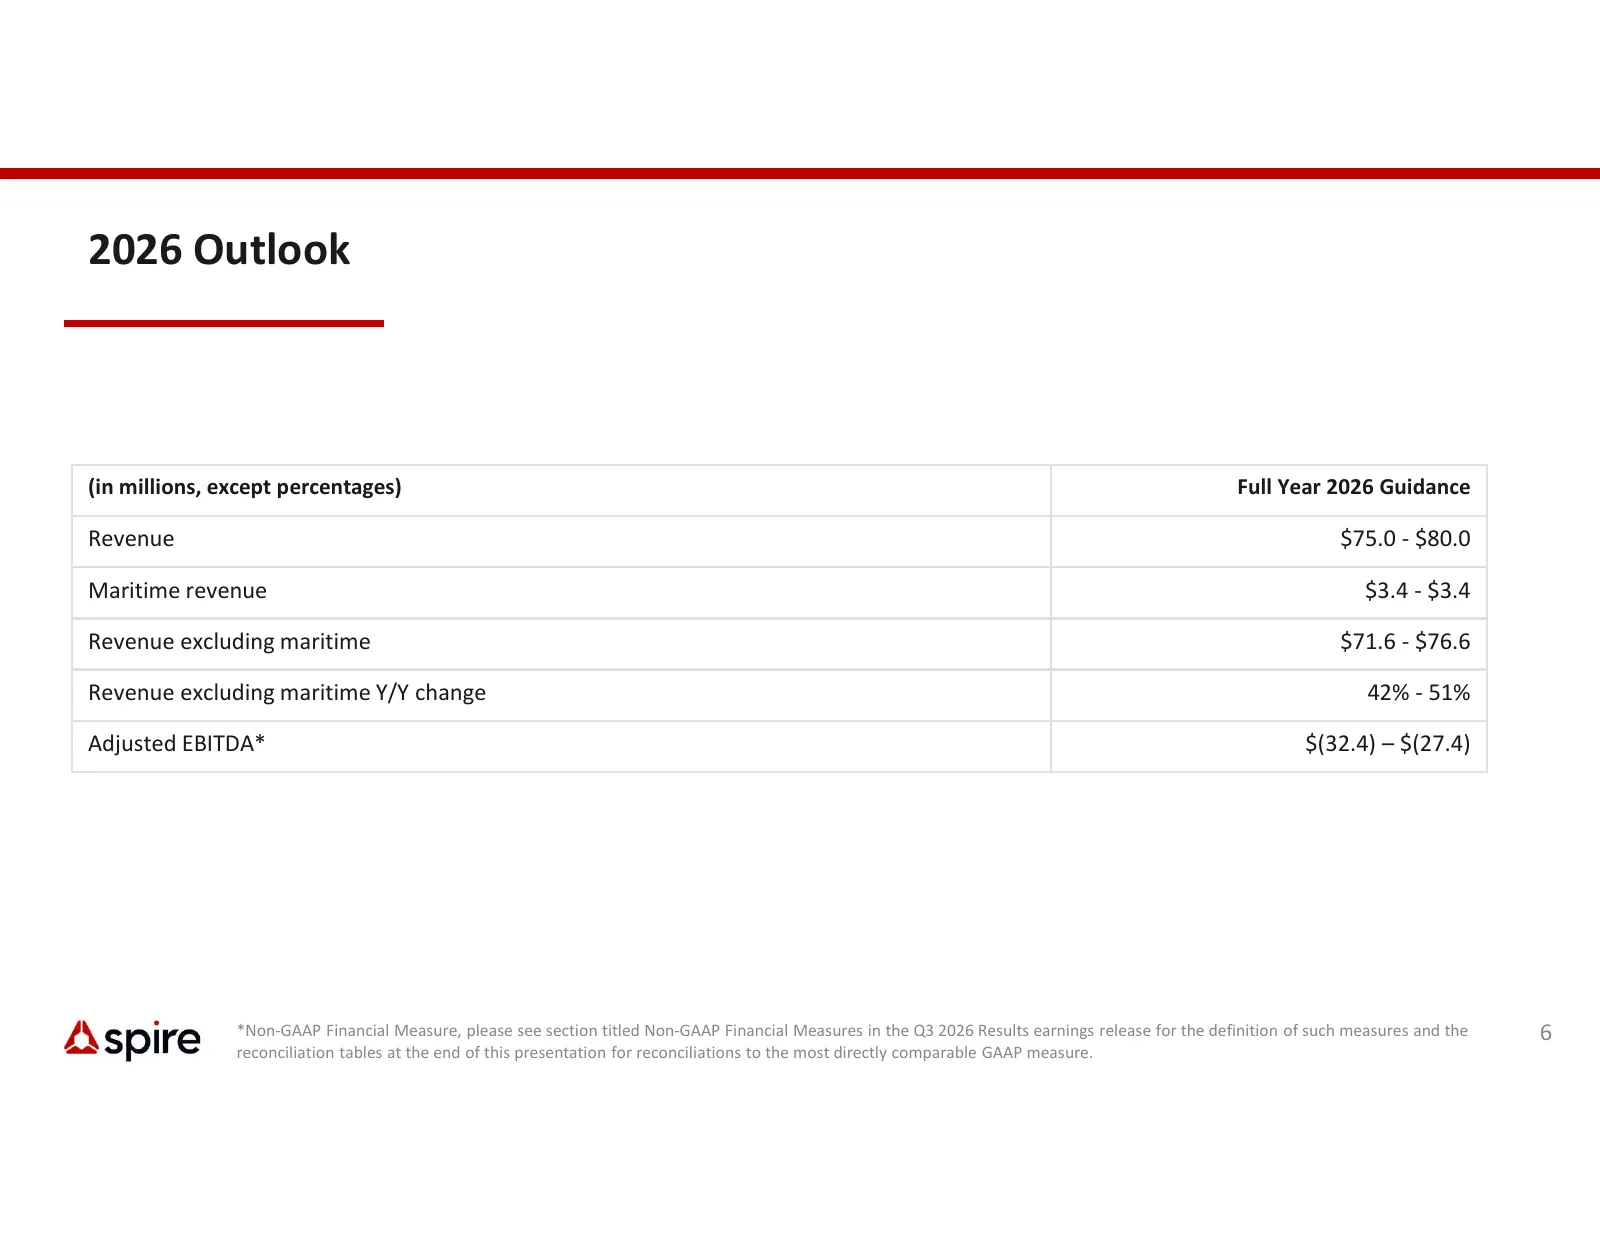
2026 Outlook (in millions, except percentages) Full Year 2026 Guidance Revenue $75.0 - $80.0 Maritime revenue $3.4 - $3.4 Revenue excluding maritime $71.6 - $76.6 Revenue excluding maritime Y/Y change 42% - 51% Adjusted EBITDA* $(32.4) – $(27.4) *Non-GAAP Financial Measure, please see section titled
Slide 7: Strategic Path to Profitability
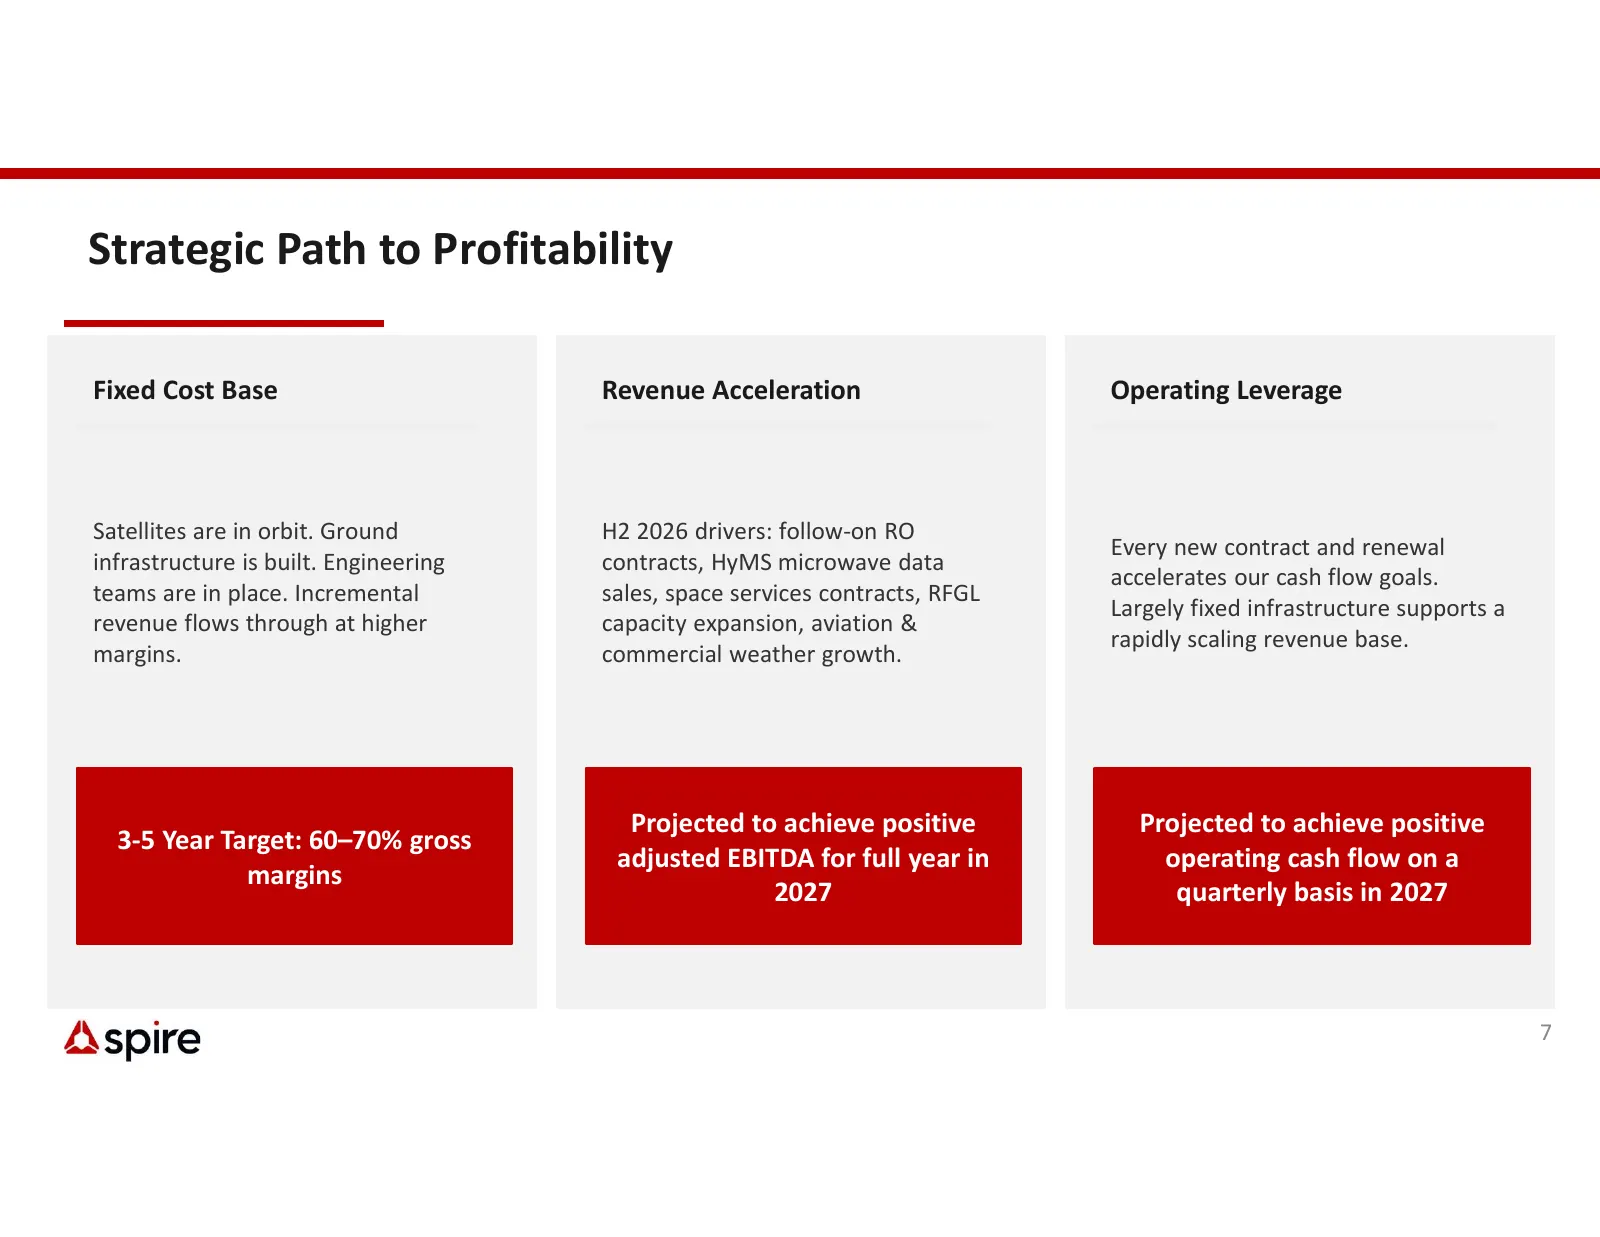
Strategic Path to Profitability Fixed Cost Base Revenue Acceleration Operating Leverage Satellites are in orbit. Ground H2 2026 drivers: follow-on RO Every new contract and renewal infrastructure is built. Engineering contracts, HyMS microwave data accelerates our cash flow goals. teams are in place
Slide 8: Thank You
Thank You Trusted space-based intelligence for a safer, optimized, resilient world NYSE: SPIR Satellite Data · Analytics · Intelligence
Slide 9: Non-GAAP Reconciliation
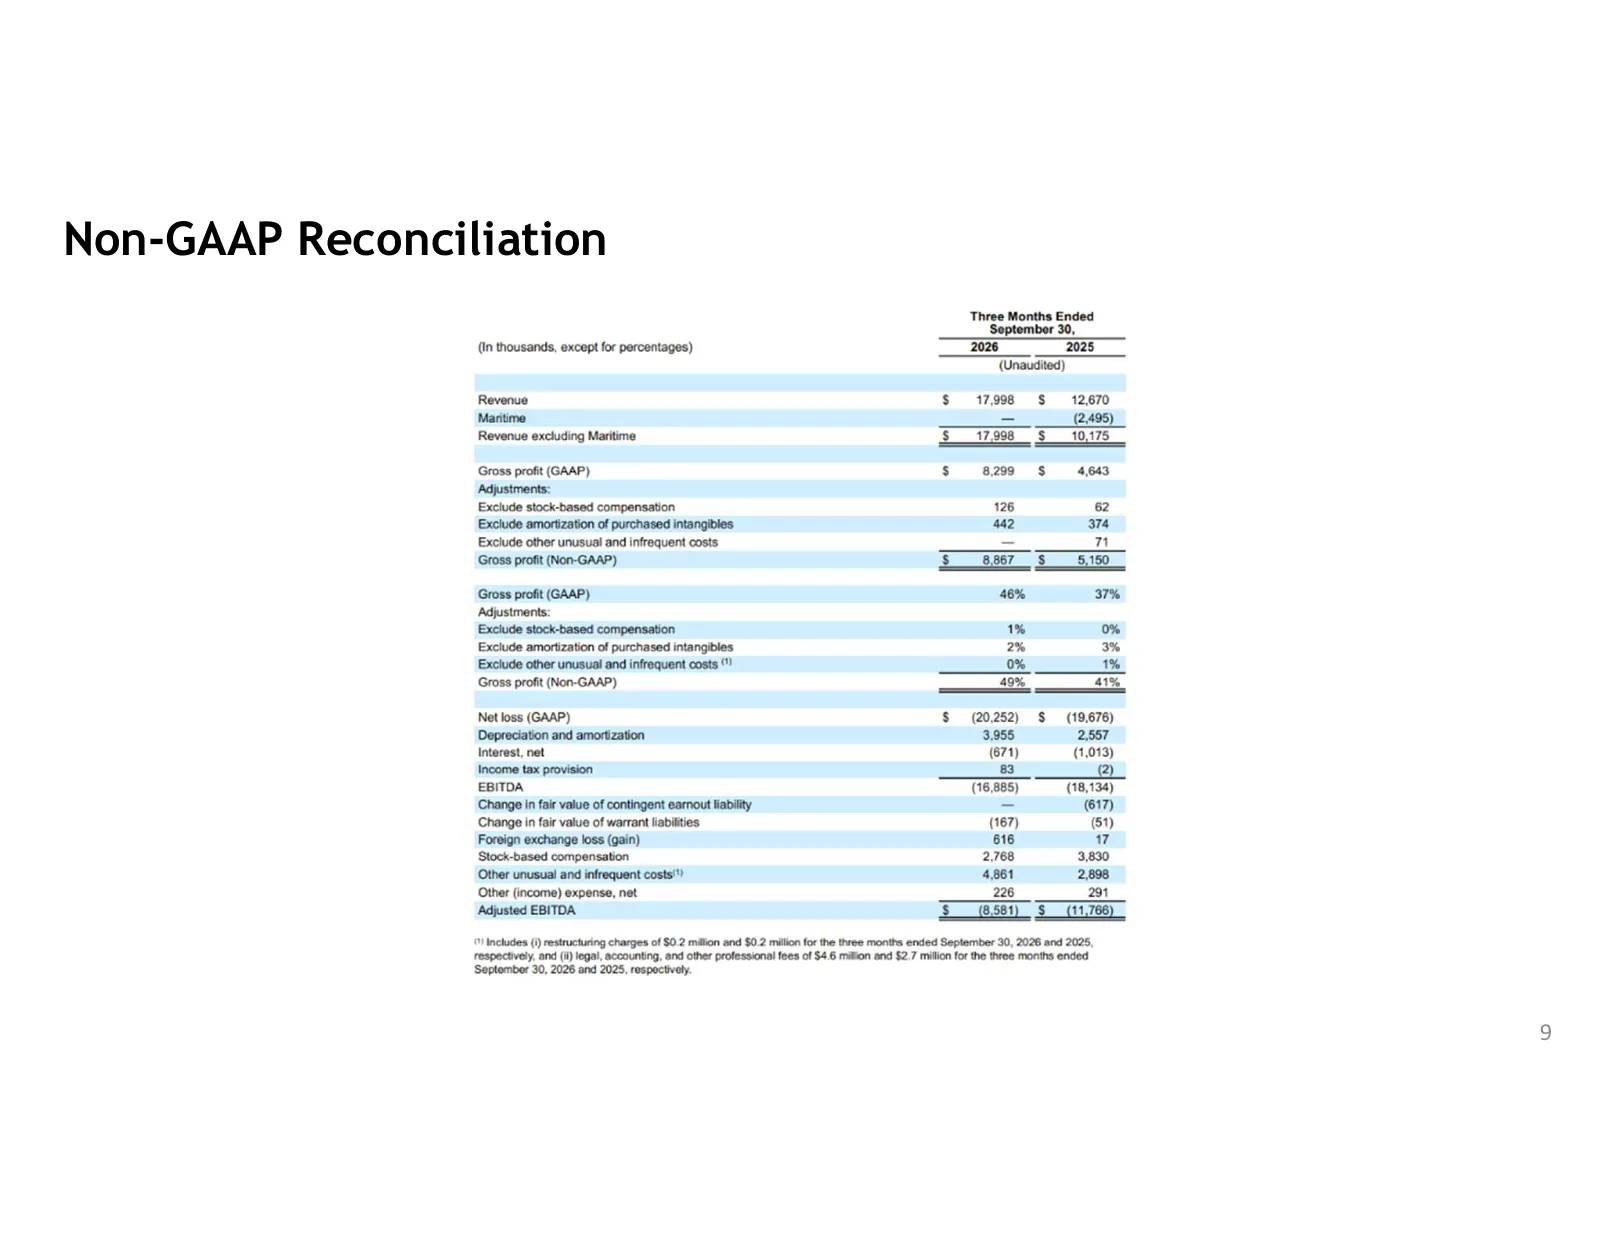
Non-GAAP Reconciliation (in thousands, except for percentages) Revenue Maritime Revenue excluding Maritime Gross profit (GAAP) Adjustments: Exclude stock-based compensation ‘Exclude amortization of purchased intangibles Exclude other unusual and infrequent costs ‘Gross profit (Non-GAAP) Gross profit
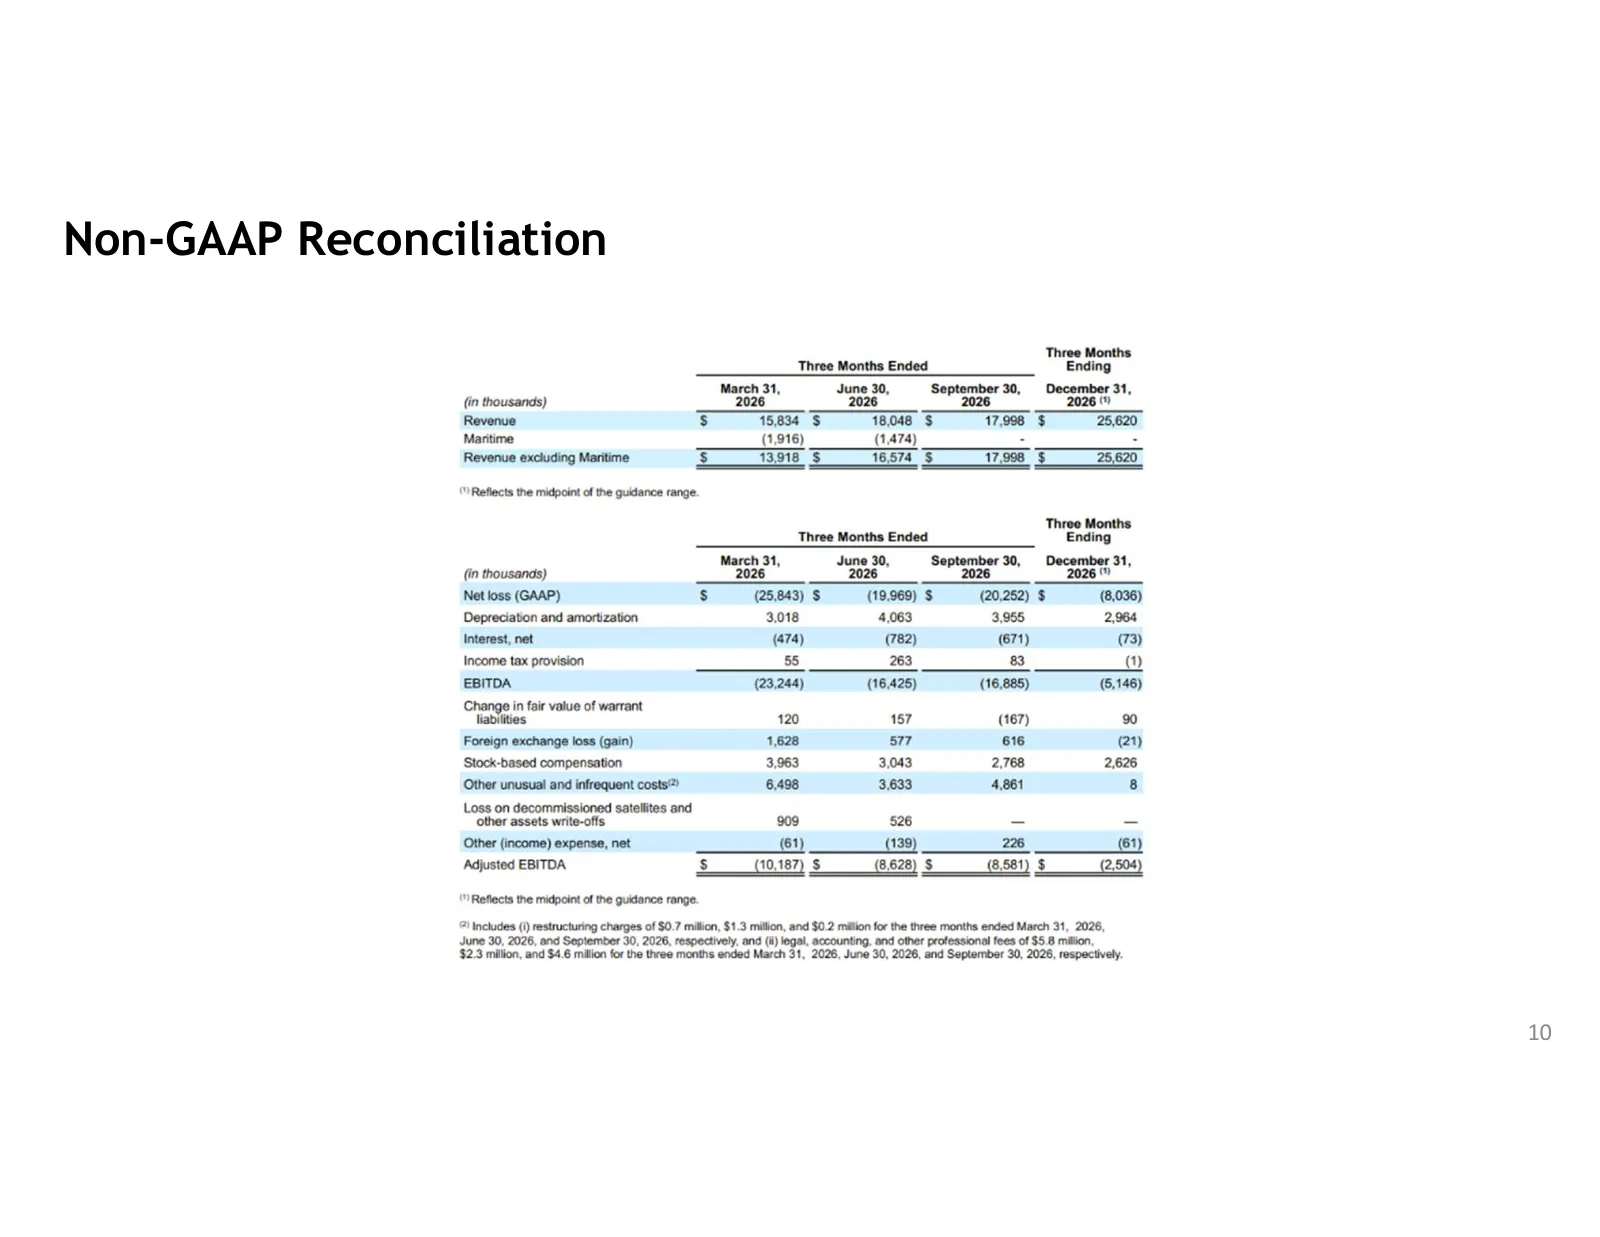
Slide 10: Non-GAAP Reconciliation
Non-GAAP Reconciliation Three Months Three Months Ended Ending March 31, June 30, September 30, December 31, (in thousands) 2026 2026 2026 2026") Revenue C 15634 S 18048 S 17,998 $ 25,620 Mantime (1,916) (1,474) - - Revenue excluding Maritime = 1398 S 16,574 S$ 17588 § 25,620 \" Retlects the midpoin
Source: company website
More decks from Spire Global, Inc.
 Q2 2026 Earnings Presentation15 slides · Aug 12, 2026
 Q1 2026 Earnings Presentation13 slides · May 13, 2026
 Q4 2025 Earnings Presentation15 slides · Mar 18, 2026
 Q3 2025 Earnings Presentation10 slides · Dec 17, 2025
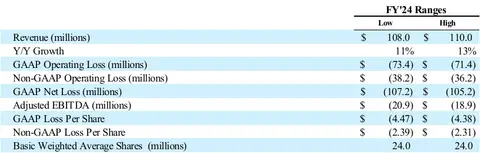 FY2024 Earnings Presentation9 slides · Mar 3, 2025
 Q1 2024 Earnings Presentation14 slides · May 15, 2024