Ucb S.A. · EURONEXT:UCB
Ucb — Investor Presentation (April 2011)
63 slides from Ucb's investor presentation, April 2011

Slide 1: Progressing to become the patient-centric global biopharma leader
Progressing to become the patient-centric global biopharma leader April 2011 Alison, living with rheumatoid arthritis
Slide 2: Disclaimer and safe harbour
Disclaimer and safe harbour Forward-looking statements: This presentation includes “forward-looking statements” relating to UCB group of companies (“UCB”) that are subject to known and unknown risks and uncertainties, many of which are outside of UCB’s control and are difficult to predict, that may
Slide 3: UCB: to be patient-centric global biopharma leader
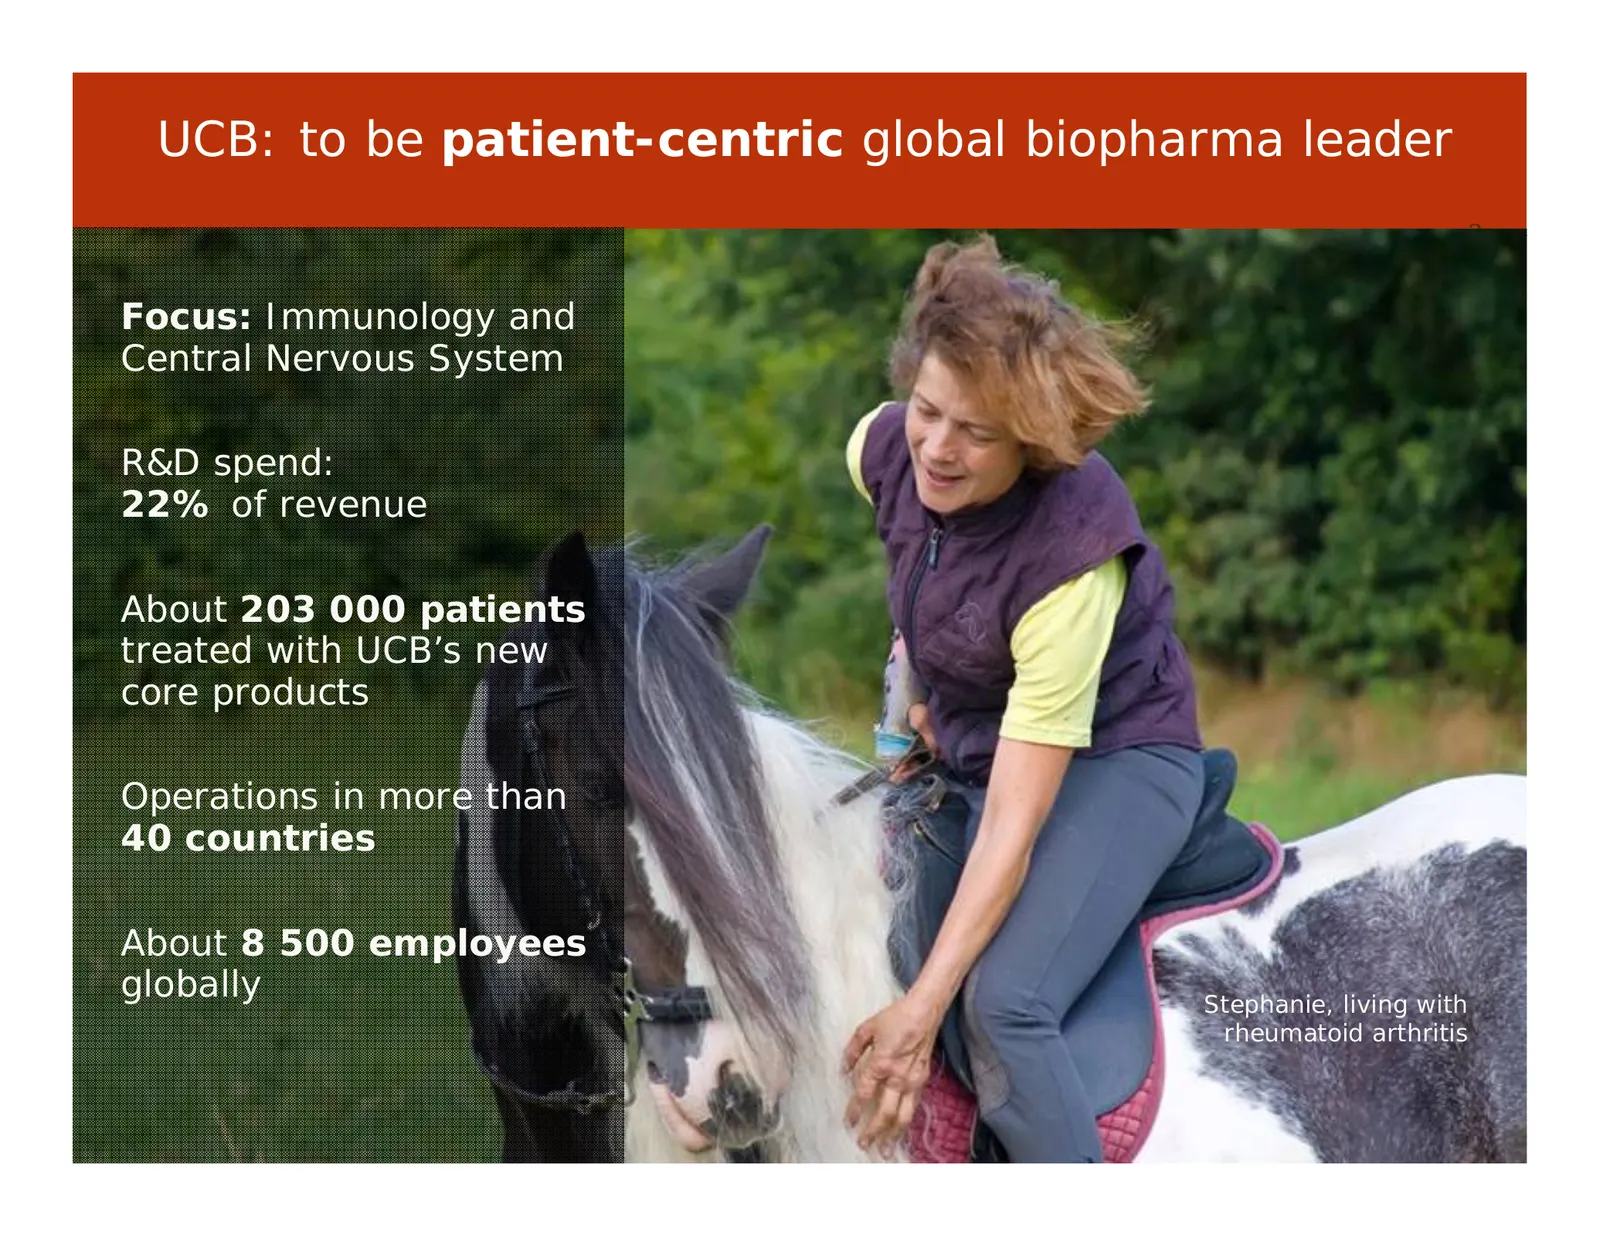
UCB: to be patient-centric global biopharma leader 3 Focus: Immunology and Central Nervous System R&D spend: 22% of revenue About 203 000 patients treated with UCB’s new core products Operations in more than 40 countries About 8 500 employees globally Stephanie, living with rheumatoid arthritis 3
Slide 4: 2010 financial highlights
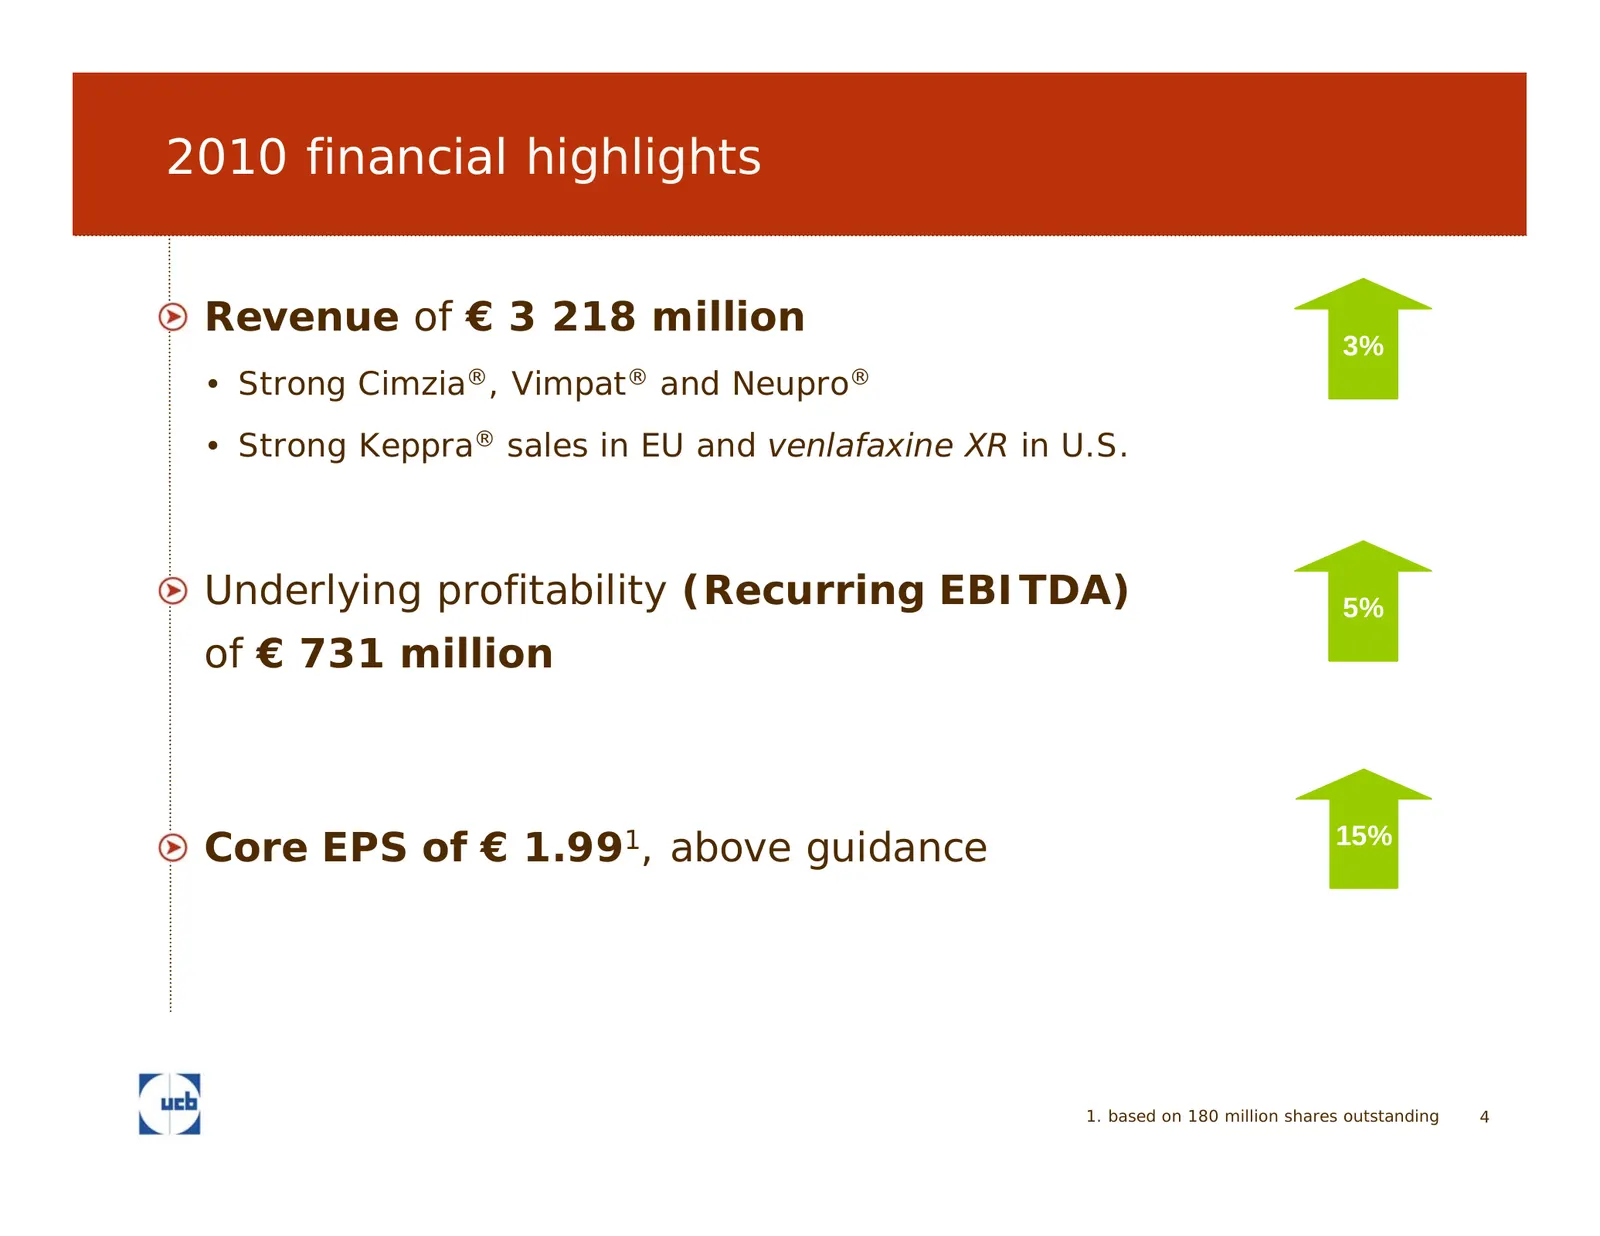
2010 financial highlights Revenue of € 3 218 million 3% • Strong Cimzia®, Vimpat® and Neupro® • Strong Keppra® sales in EU and venlafaxine XR in U.S. Underlying profitability (Recurring EBITDA) 5% of € 731 million Core EPS of € 1.991, above guidance 15% 1. based on 180 million shares outstanding 4
Slide 5: 203 000 patients have now been treated
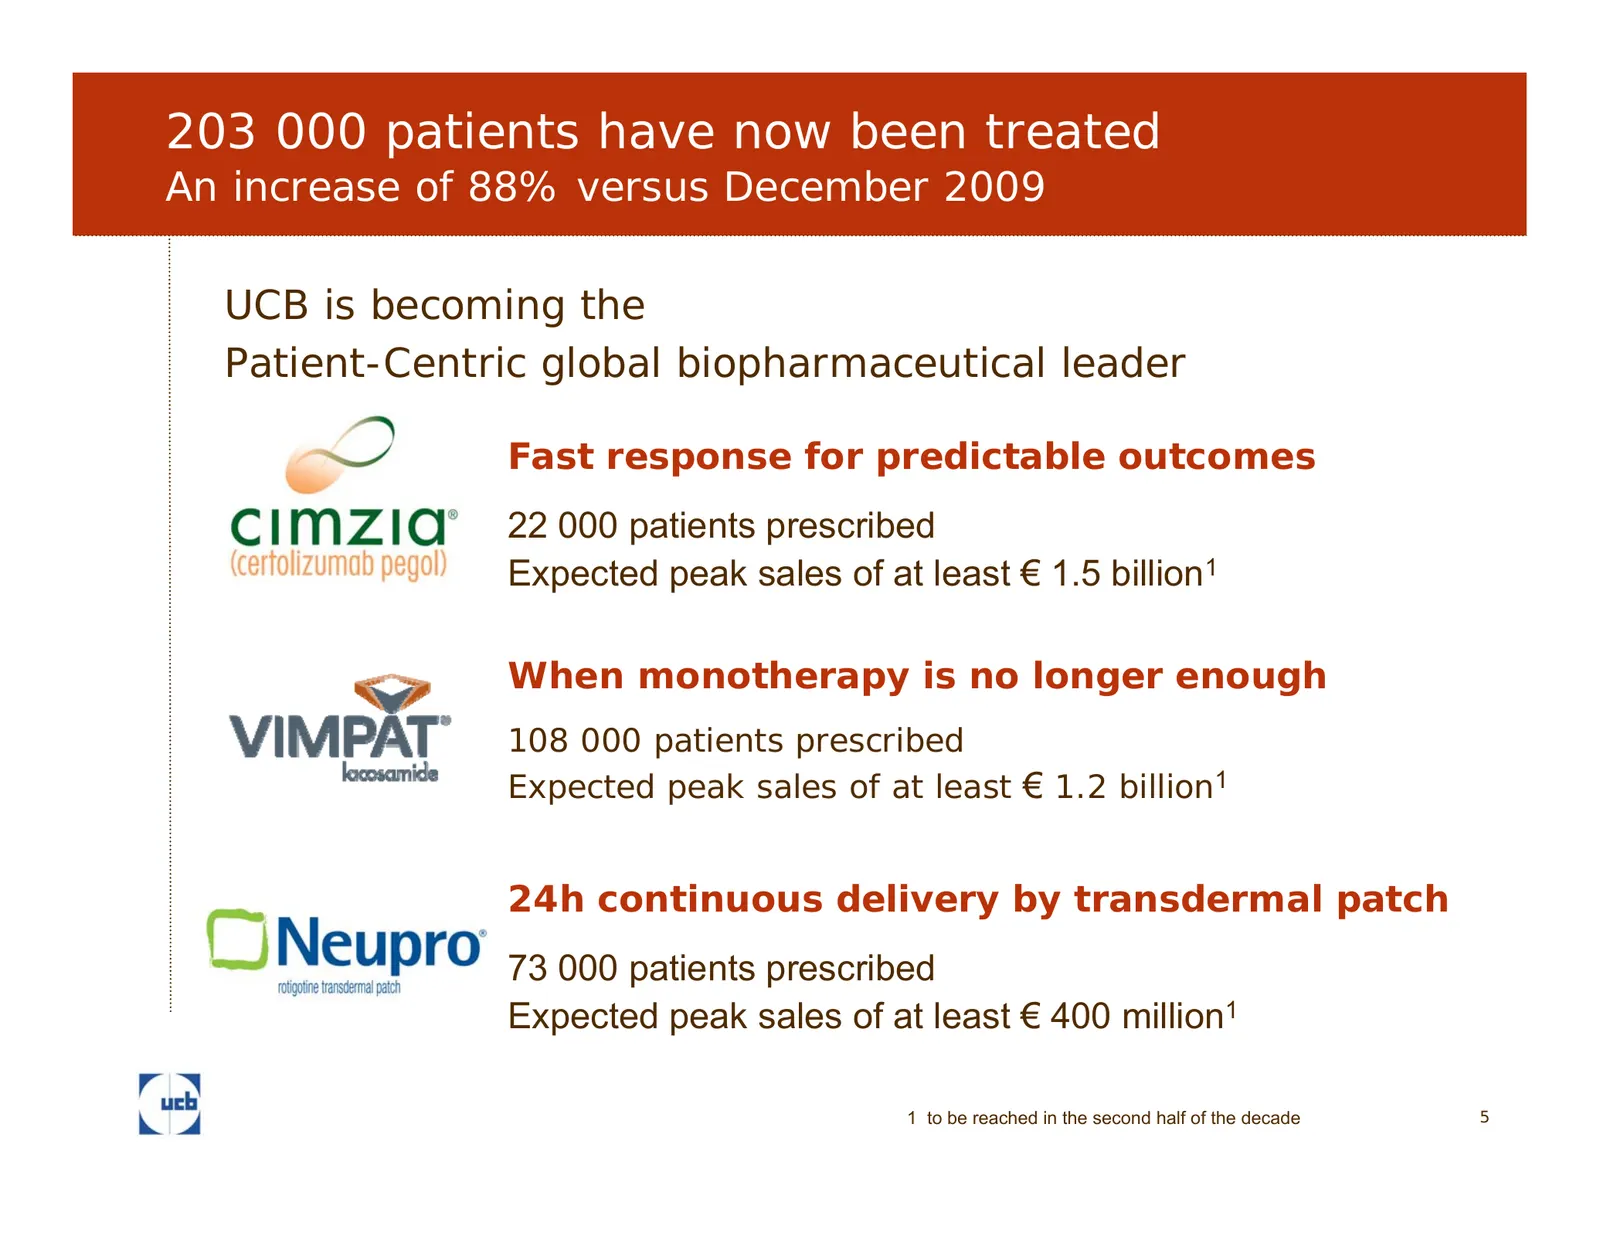
203 000 patients have now been treated An increase of 88% versus December 2009 UCB is becoming the Patient-Centric global biopharmaceutical leader Fast response for predictable outcomes 22 000 patients prescribed Expected peak sales of at least € 1.5 billion1 When monotherapy is no longer enough 108

Slide 6: Core Medicines
Core Medicines Brett, living with crohn’s disease
Slide 7: Cimzia
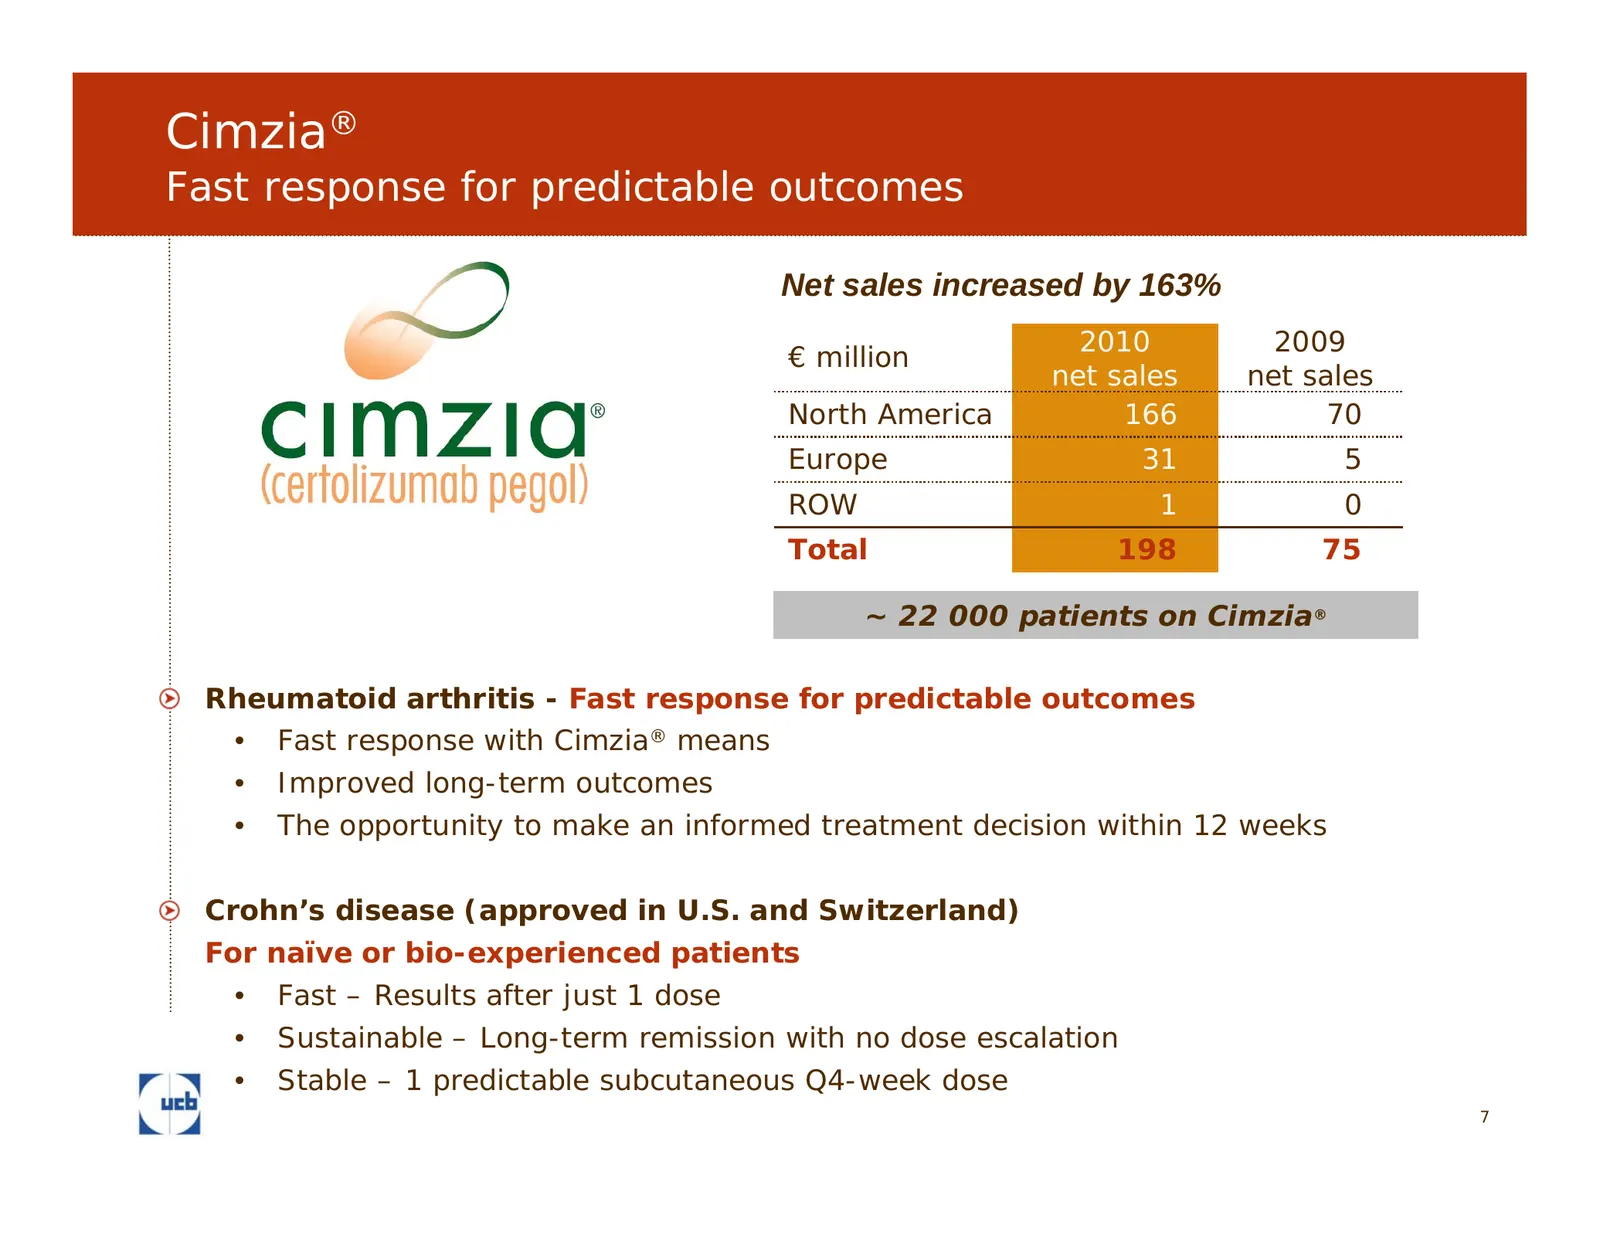
Cimzia® Fast response for predictable outcomes Net sales increased by 163% 2010 2009 € million net sales net sales North America 166 70 Europe 31 5 ROW 1 0 Total 198 75 ~ 22 000 patients on Cimzia® Rheumatoid arthritis - Fast response for predictable outcomes • Fast response with Cimzia® means • Imp
Slide 8: Cimzia provides a fast response for results that last
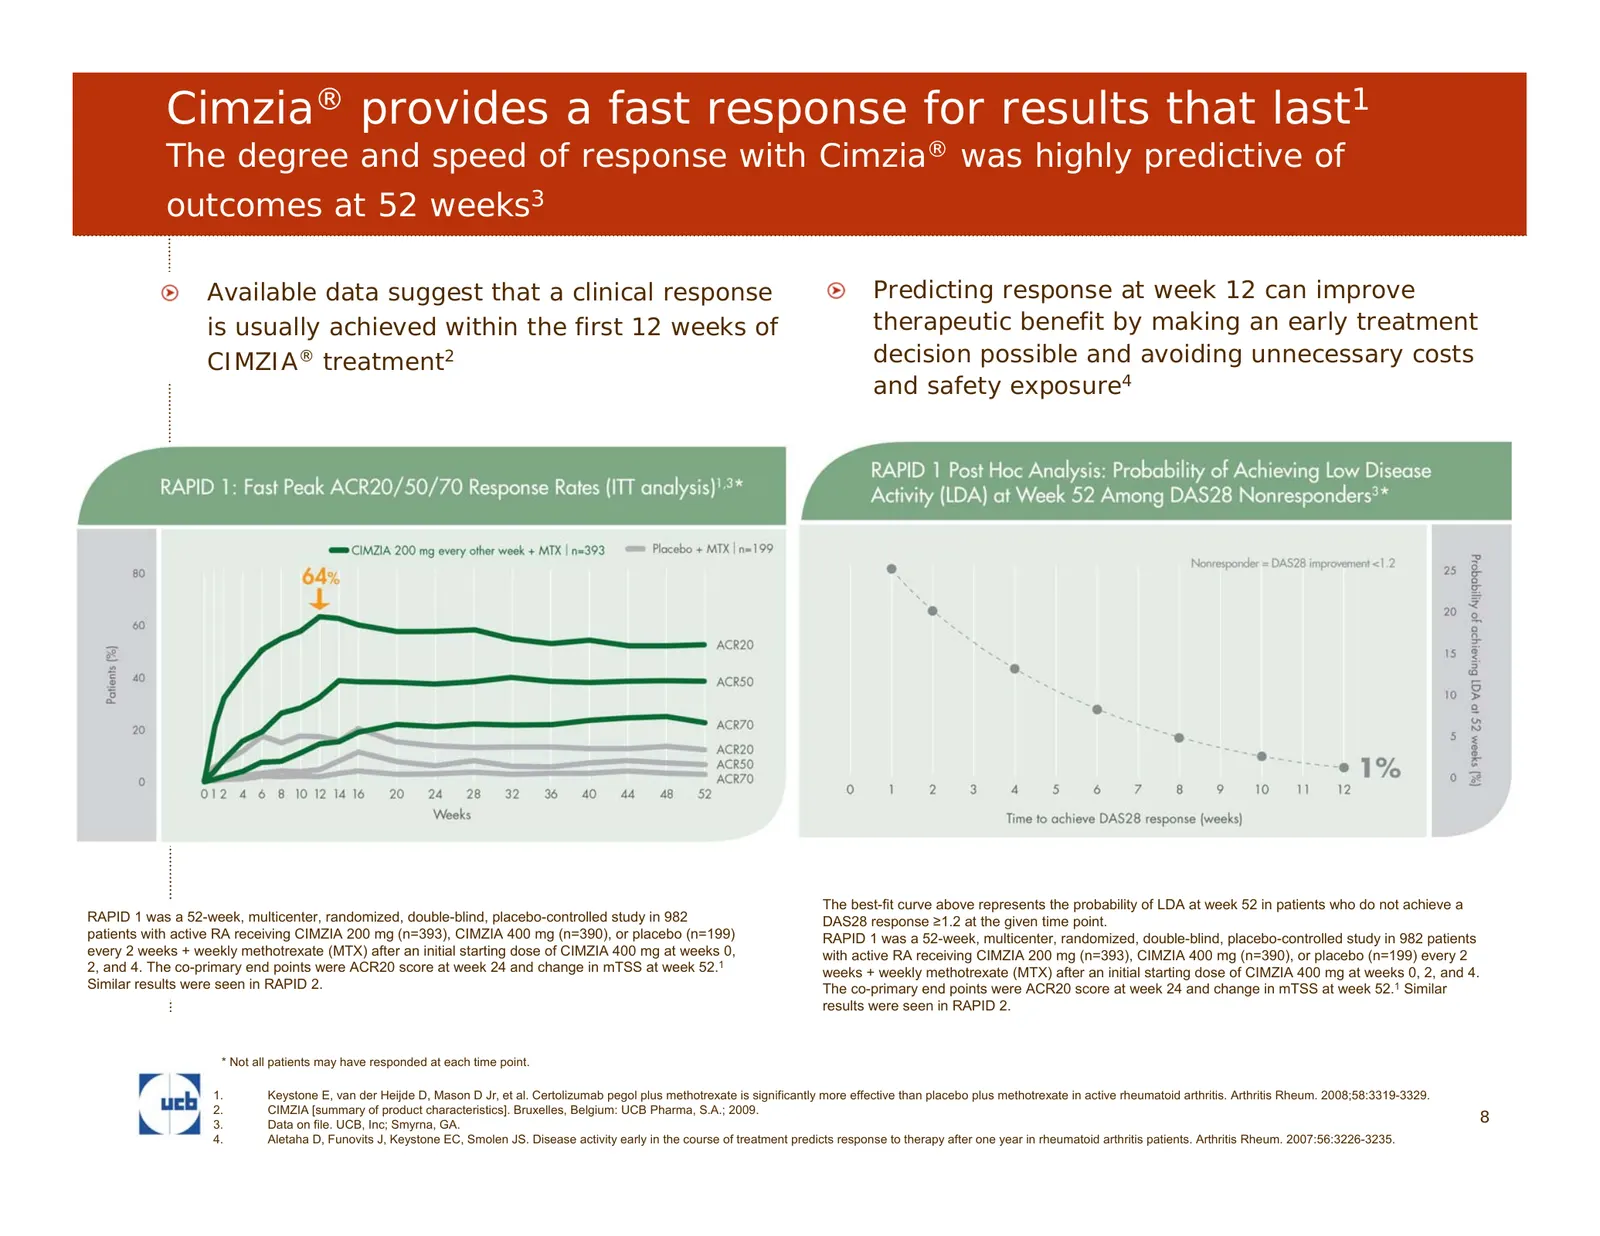
Cimzia® provides a fast response for results that last1 The degree and speed of response with Cimzia® was highly predictive of outcomes at 52 weeks3 Available data suggest that a clinical response Predicting response at week 12 can improve is usually achieved within the first 12 weeks of therapeutic
Slide 9: Cimzia in rheumatoid arthritis – U.S.
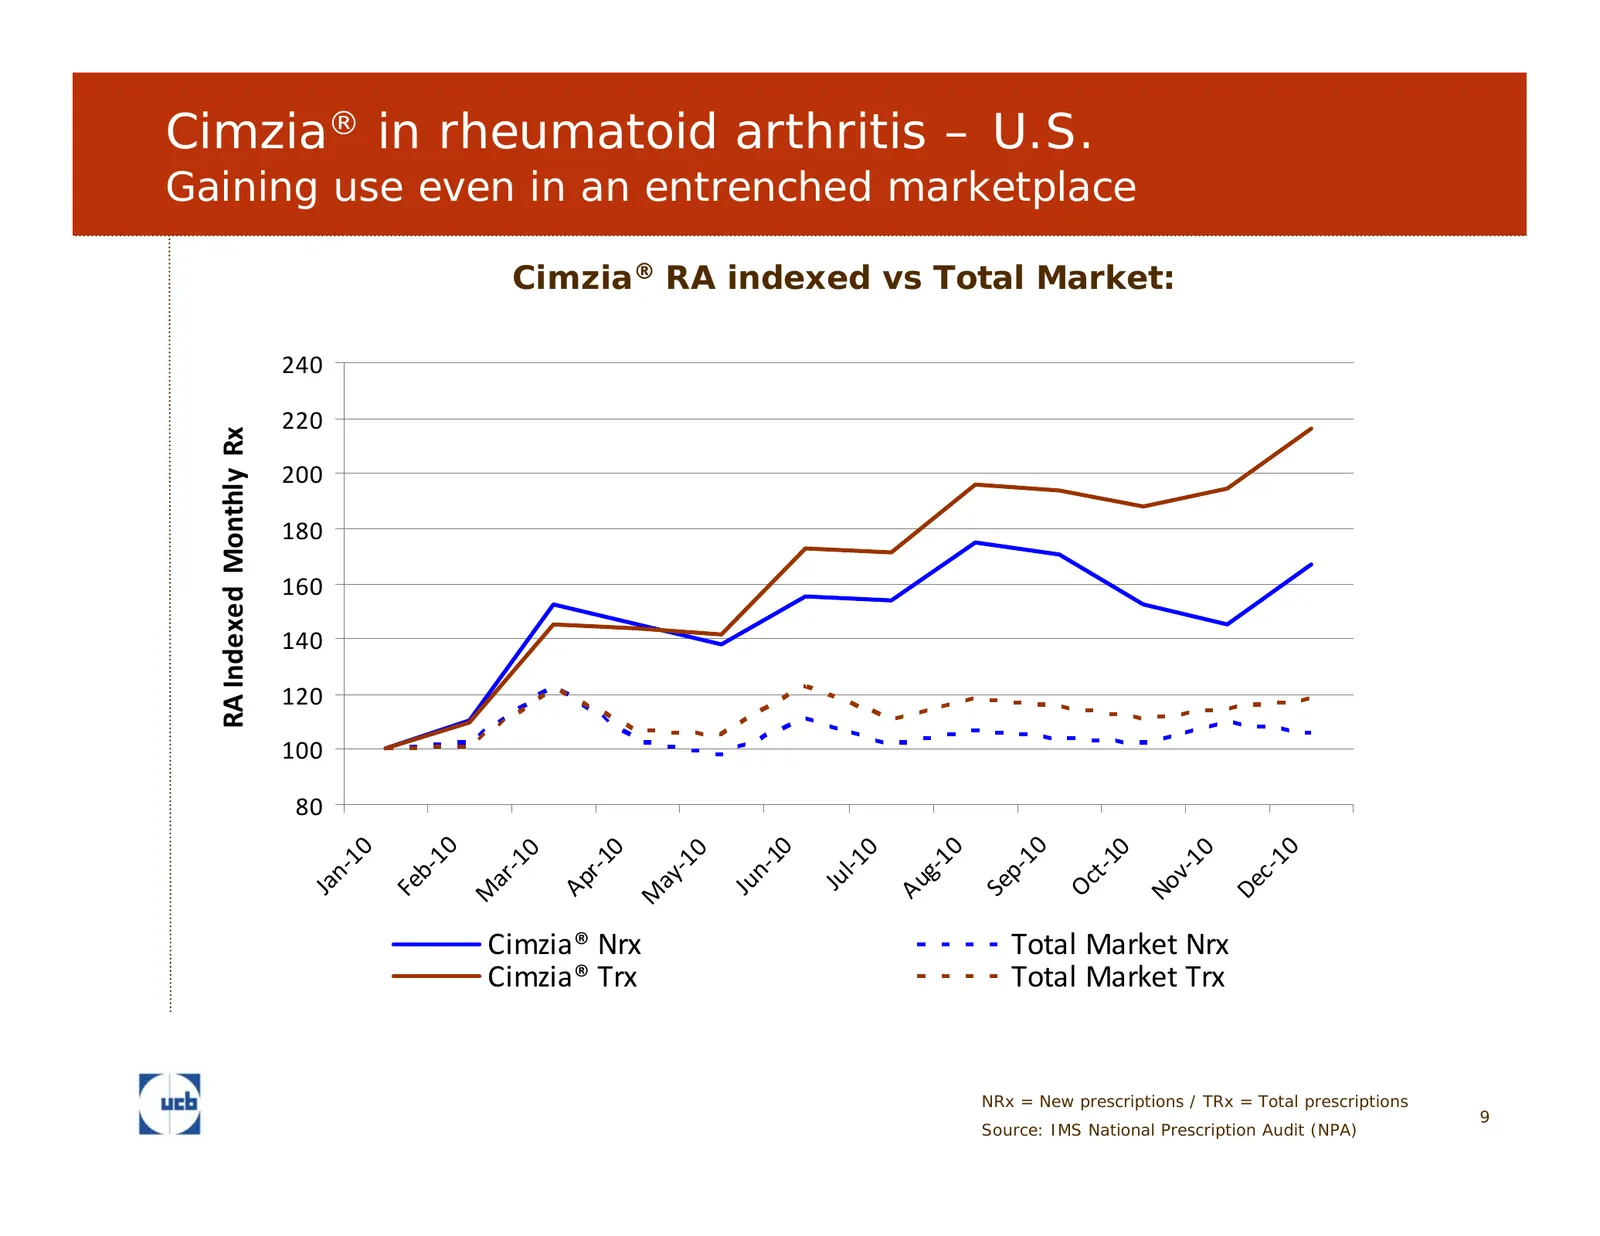
Cimzia® in rheumatoid arthritis – U.S. Gaining use even in an entrenched marketplace Cimzia® RA indexed vs Total Market: 240 220 RA Indexed Monthly Rx 200 180 160 140 120 100 80 10 10 10 10 10 0 0 0 0 0 0 0 ‐1 r ‐1 t ‐1 ‐1 ‐1 ‐1 ‐1 b‐ p‐ g‐ c‐ n‐ n l v ar ay Ju Ap Oc Au De Fe Se Ju No Ja M M Cimzia®
Slide 10: Cimzia for Crohn's disease - U.S.
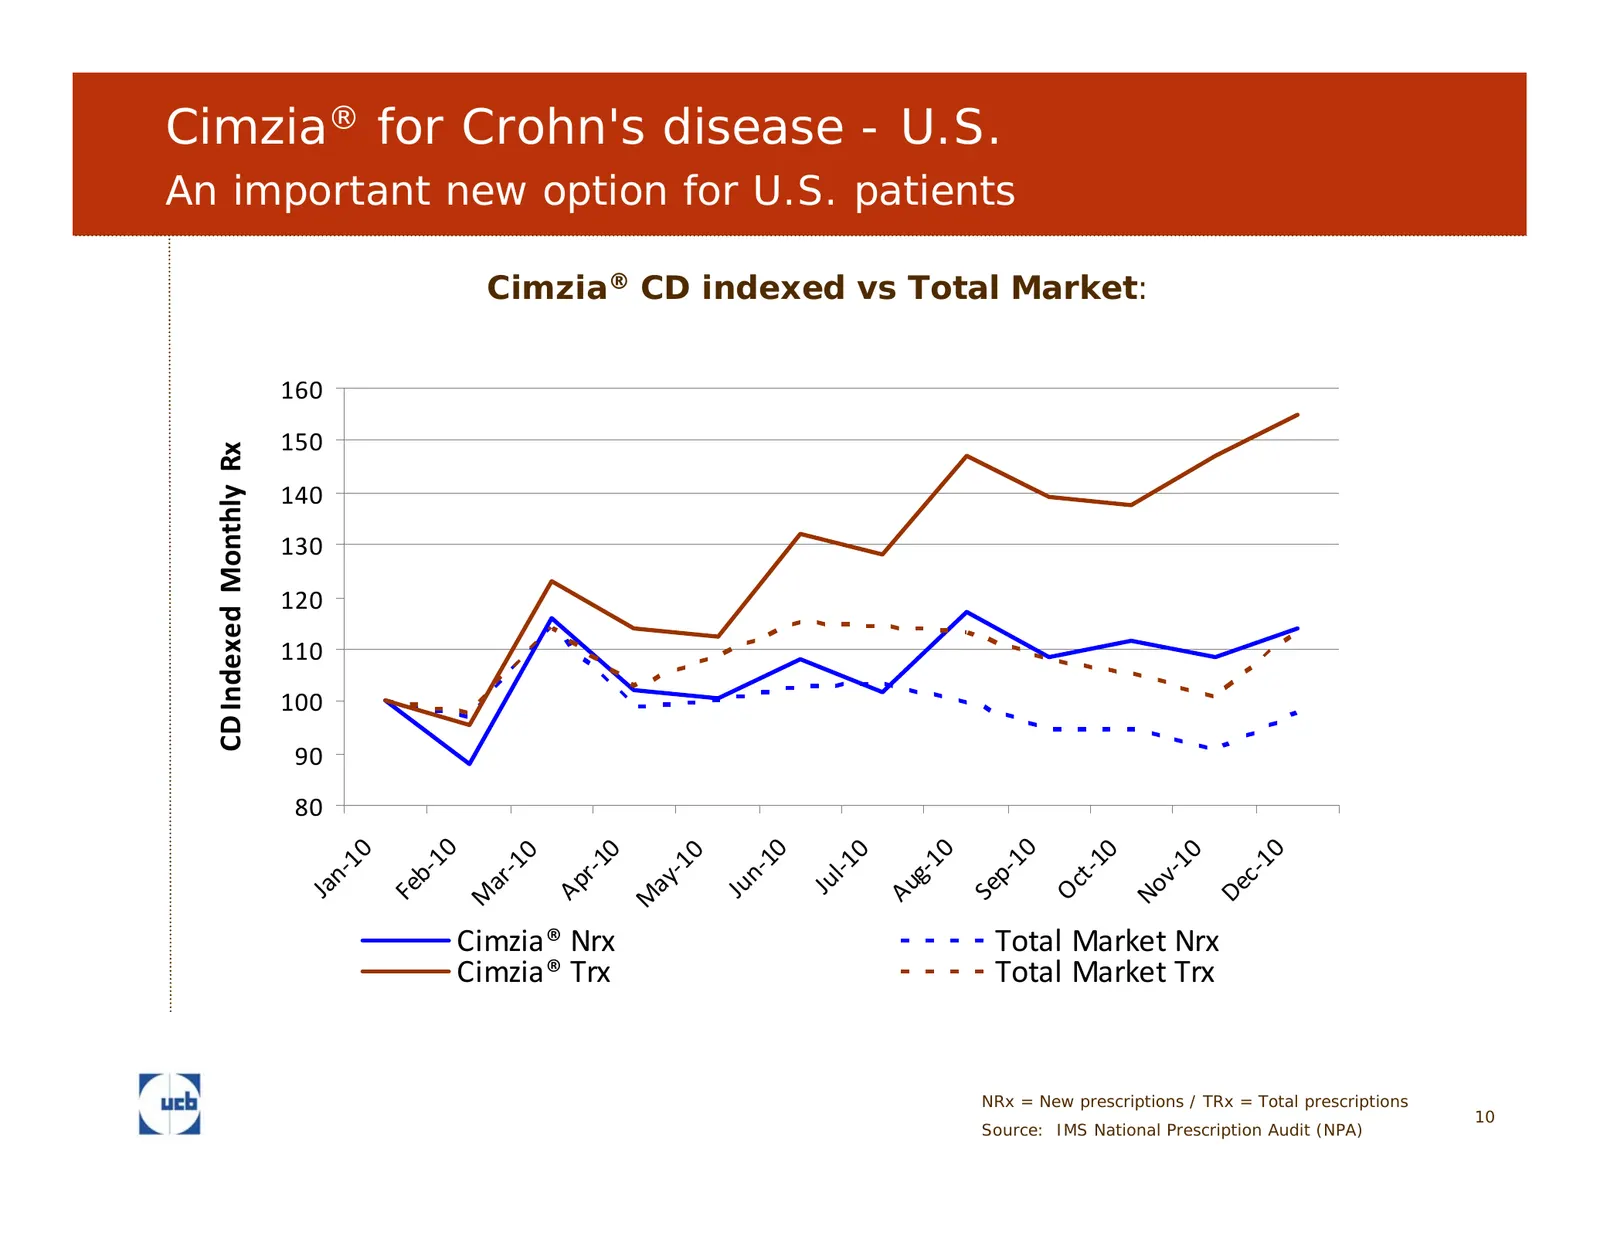
Cimzia® for Crohn's disease - U.S. An important new option for U.S. patients Cimzia® CD indexed vs Total Market: 160 150 CD Indexed Monthly Rx 140 130 120 110 100 90 80 10 10 0 10 10 0 0 10 0 0 0 0 ‐1 r ‐1 t ‐1 1 ‐1 ‐1 ‐1 b‐ p‐ g‐ c‐ n‐ v‐ n l ar ay Ju Ap Oc Au De Fe Se Ju No Ja M M Cimzia® Nrx Tota
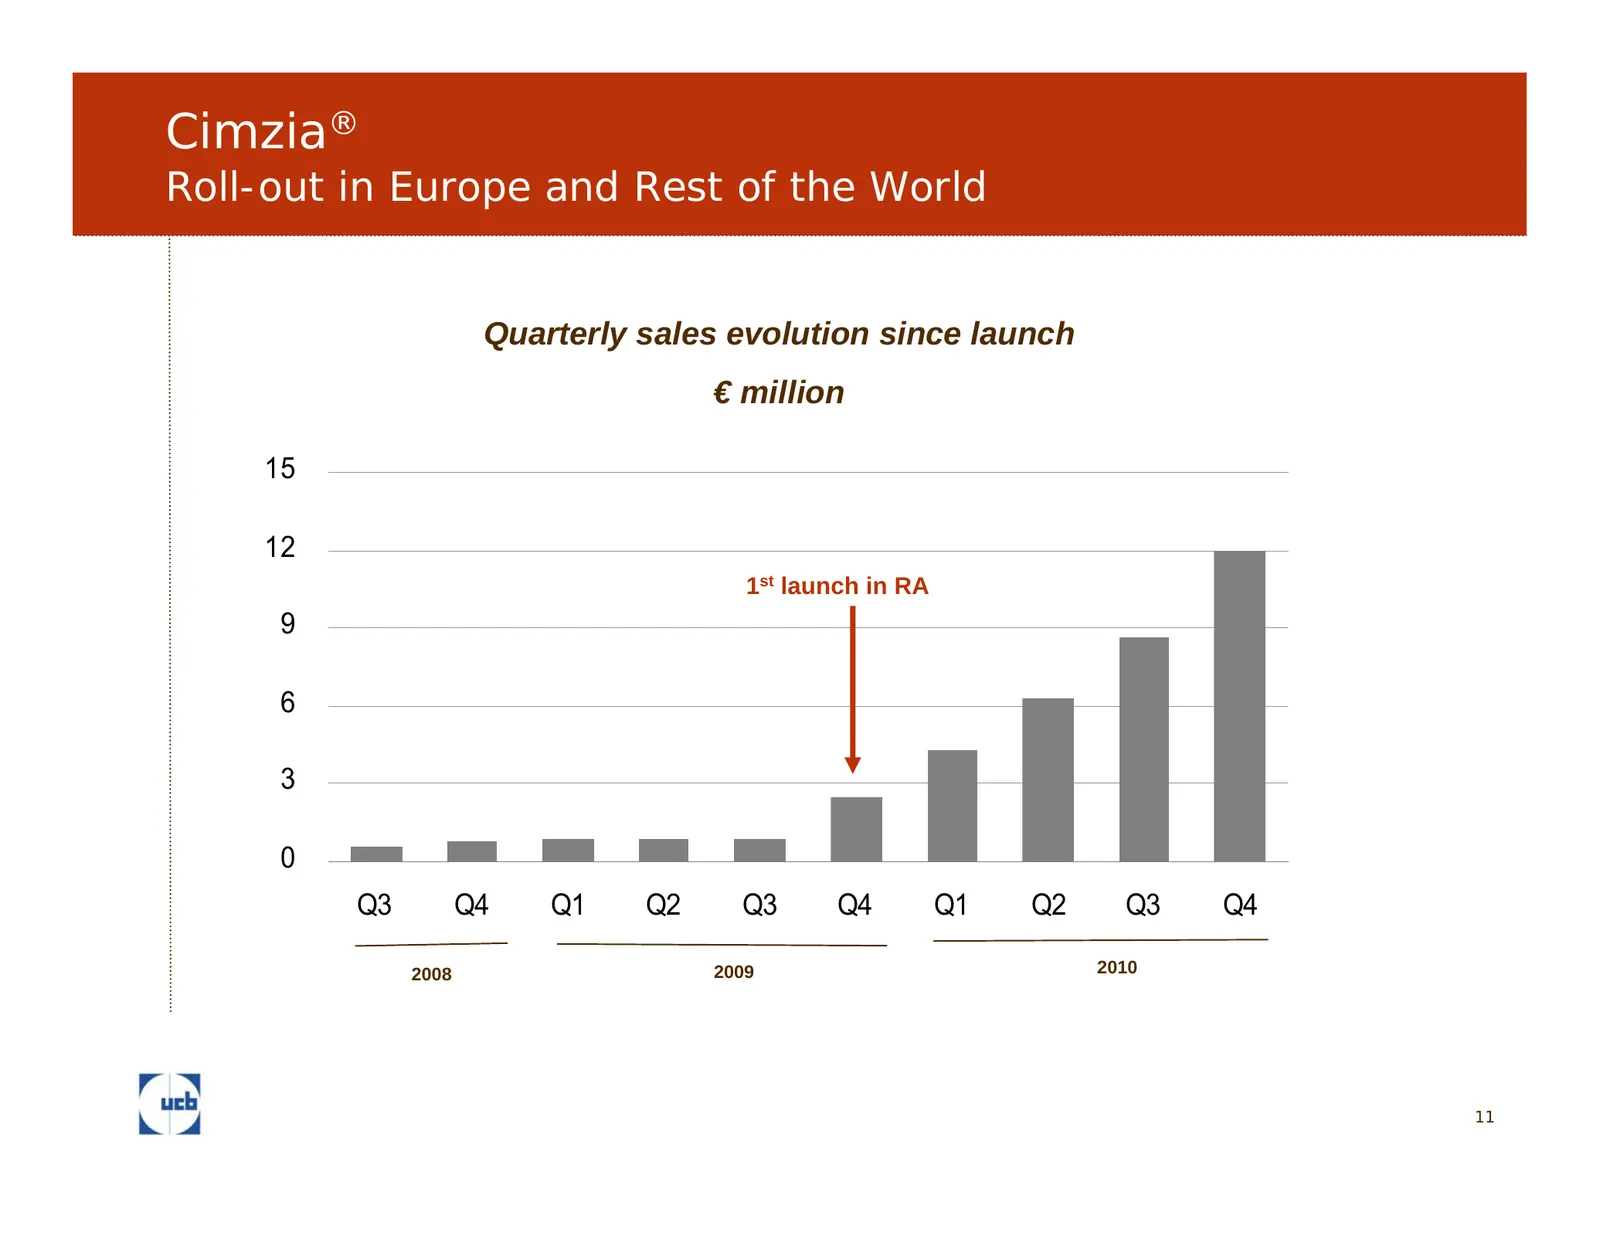
Slide 11: Cimzia: Roll-out in Europe and Rest of the World
Cimzia® Roll-out in Europe and Rest of the World Quarterly sales evolution since launch € million 15 12 1st launch in RA 9 6 3 0 Q3 Q4 Q1 Q2 Q3 Q4 Q1 Q2 Q3 Q4 2008 2009 2010 11
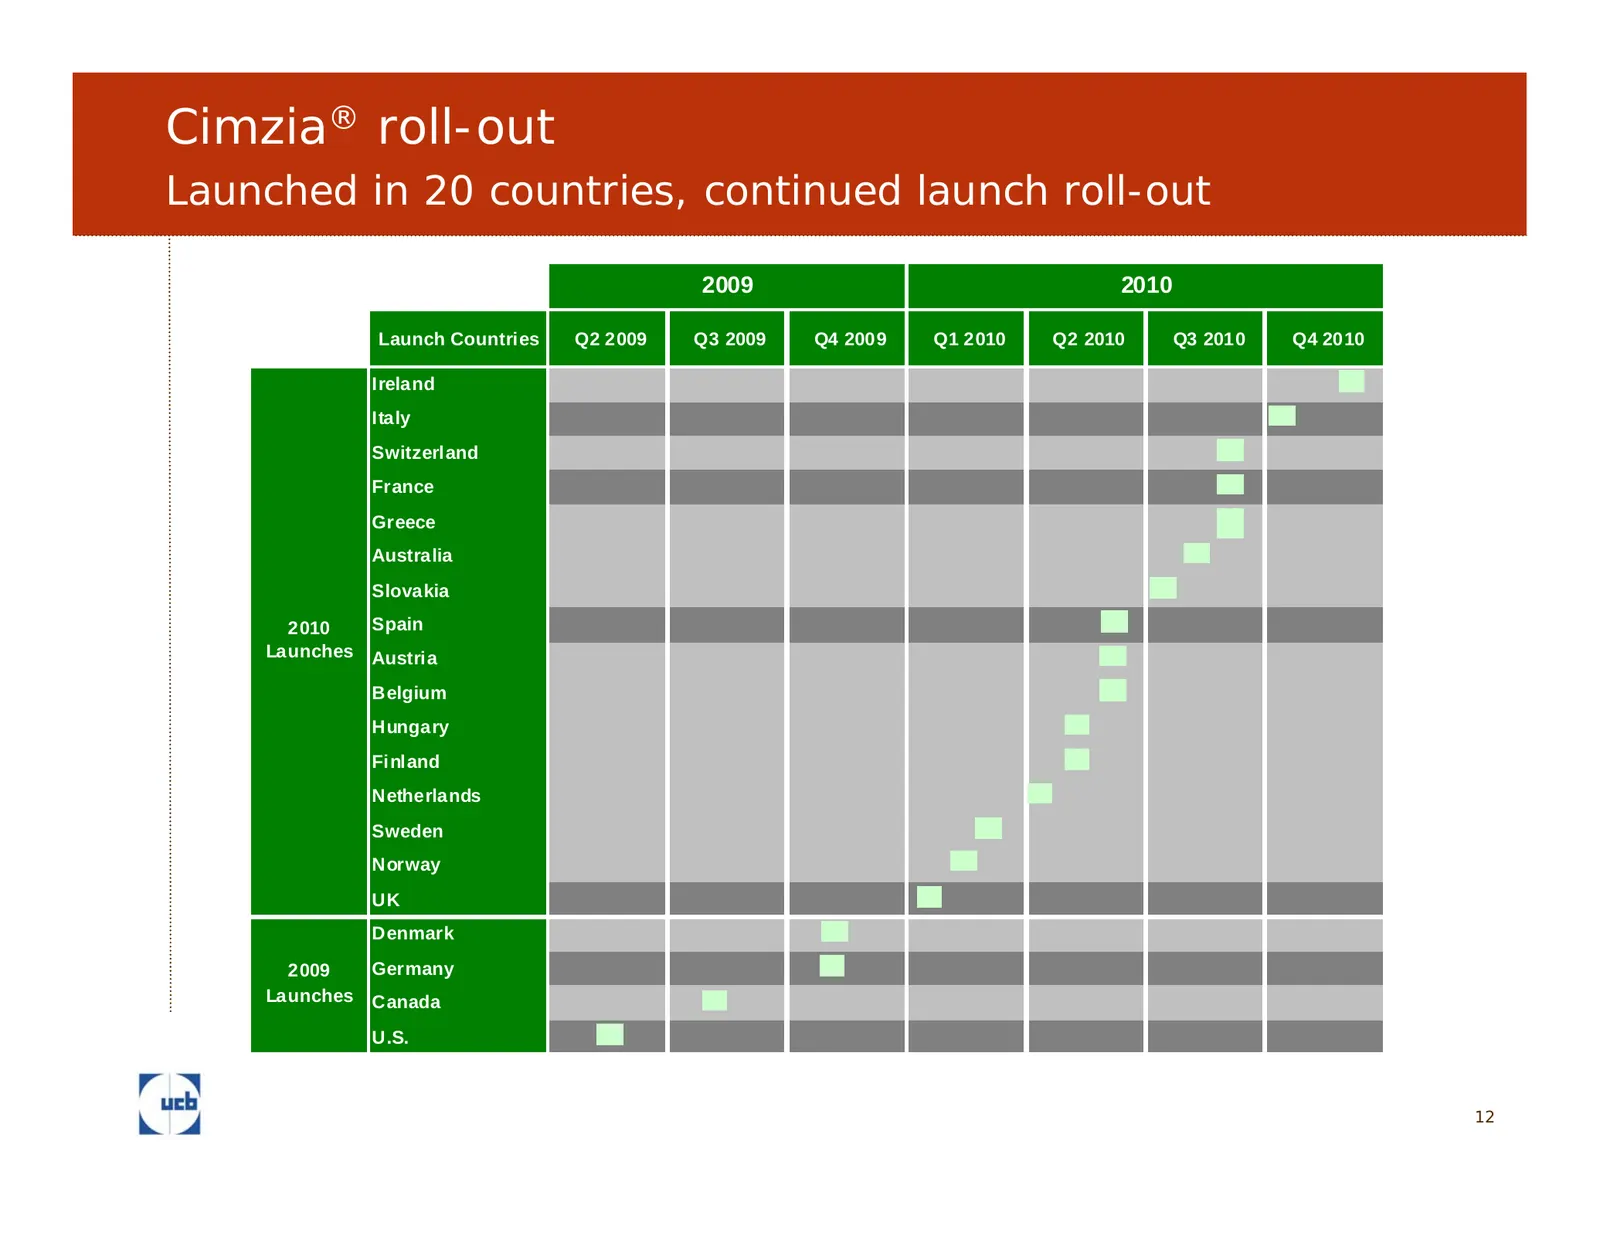
Slide 12: Cimzia roll-out
Cimzia® roll-out Launched in 20 countries, continued launch roll-out 2009 2010 Launch Countries Q2 2009 Q3 2009 Q4 2009 Q1 2010 Q2 2010 Q3 2010 Q4 2010 Ireland Italy Switzerland France Greece Australia Slovakia 2010 Spain Launches Austria Belgium Hungary Finland Netherlands Sweden Norway UK Denmark
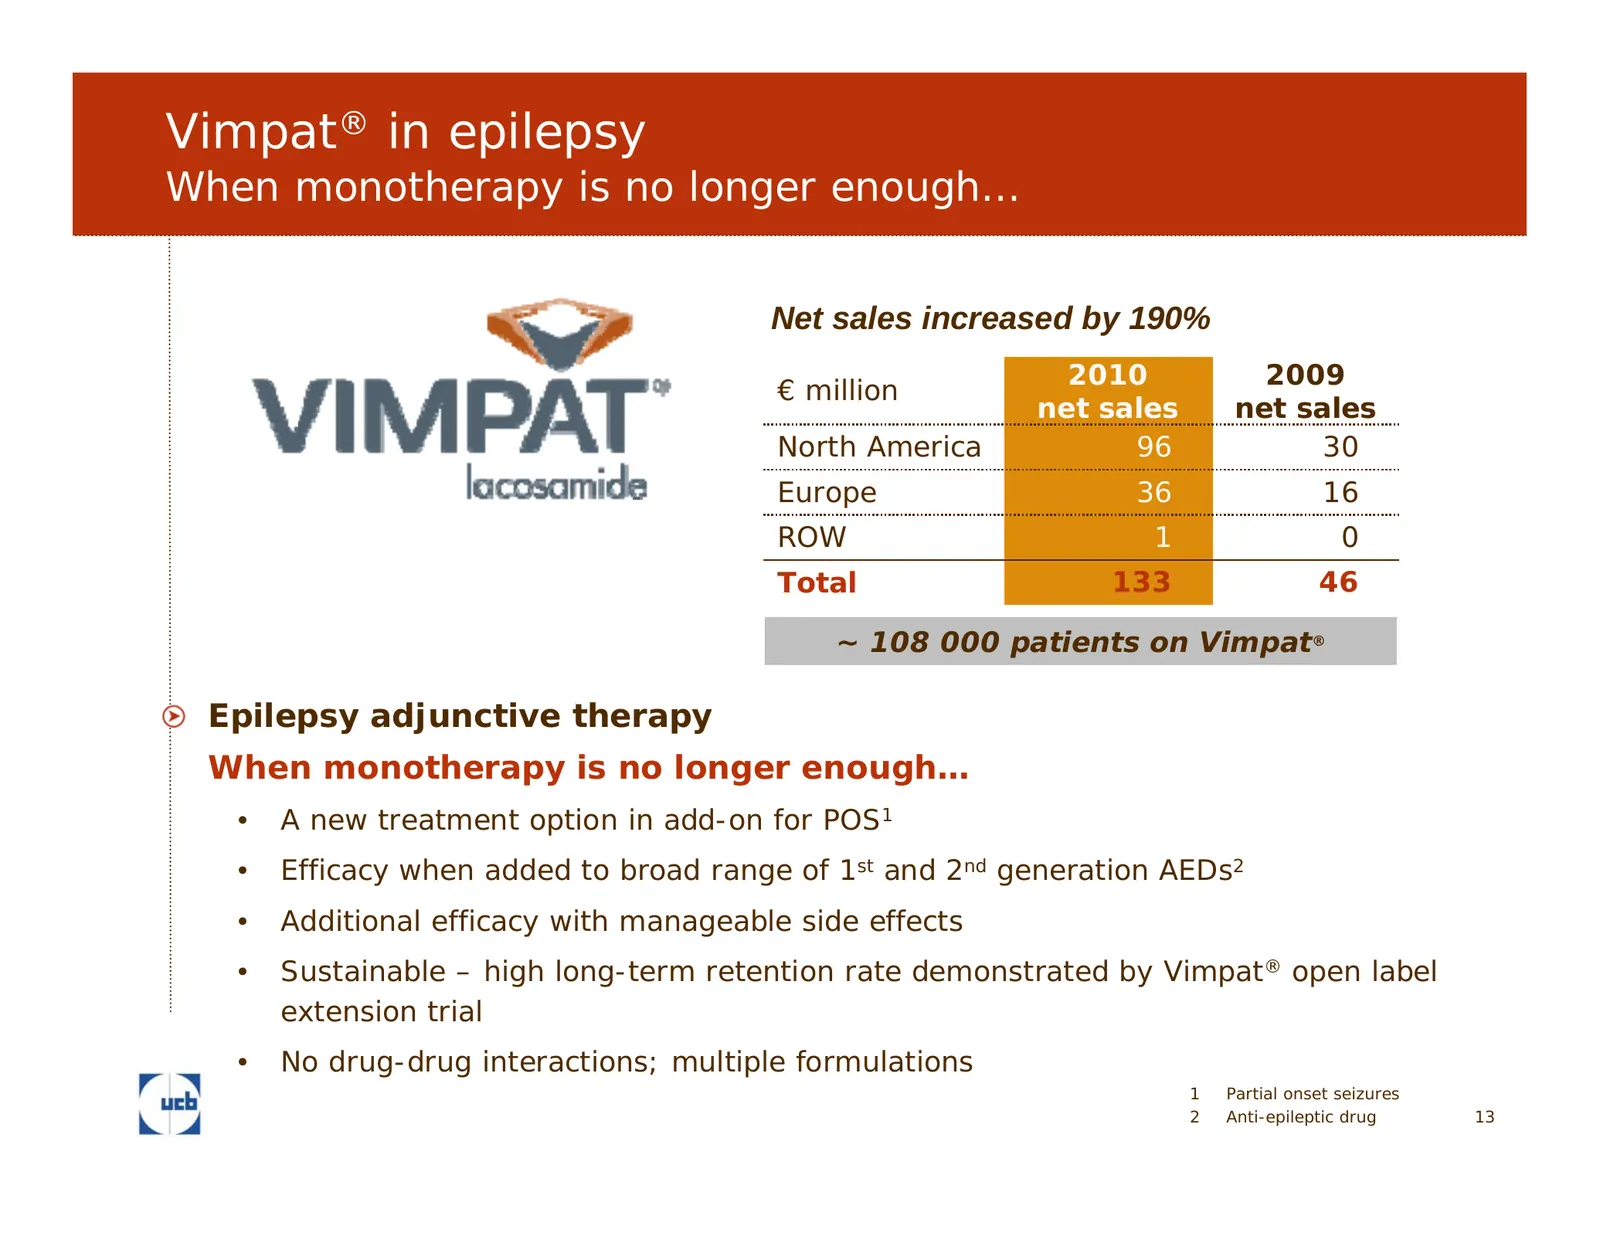
Slide 13: Vimpat in epilepsy
Vimpat® in epilepsy When monotherapy is no longer enough… Net sales increased by 190% 2010 2009 € million net sales net sales North America 96 30 Europe 36 16 ROW 1 0 Total 133 46 ~ 108 000 patients on Vimpat® Epilepsy adjunctive therapy When monotherapy is no longer enough… • A new treatment option
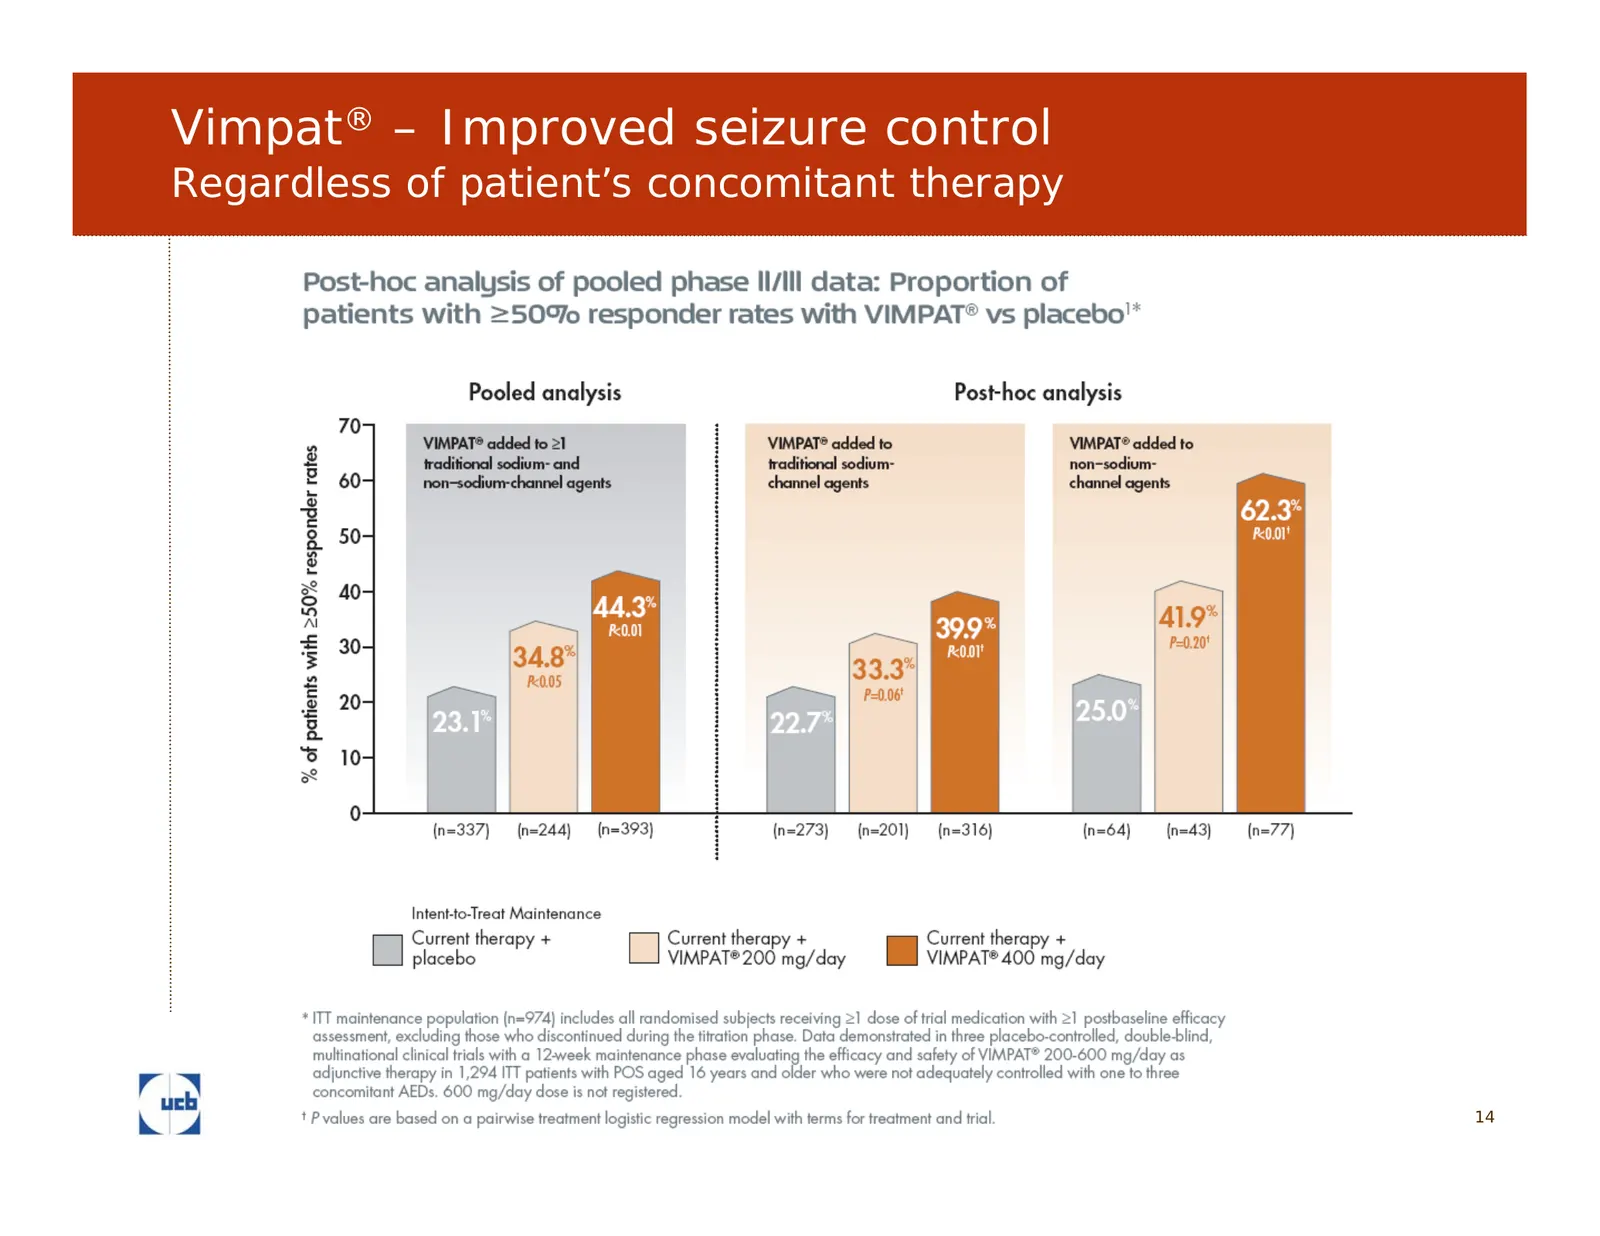
Slide 14: Vimpat – Improved seizure control
Vimpat® – Improved seizure control Regardless of patient’s concomitant therapy 14
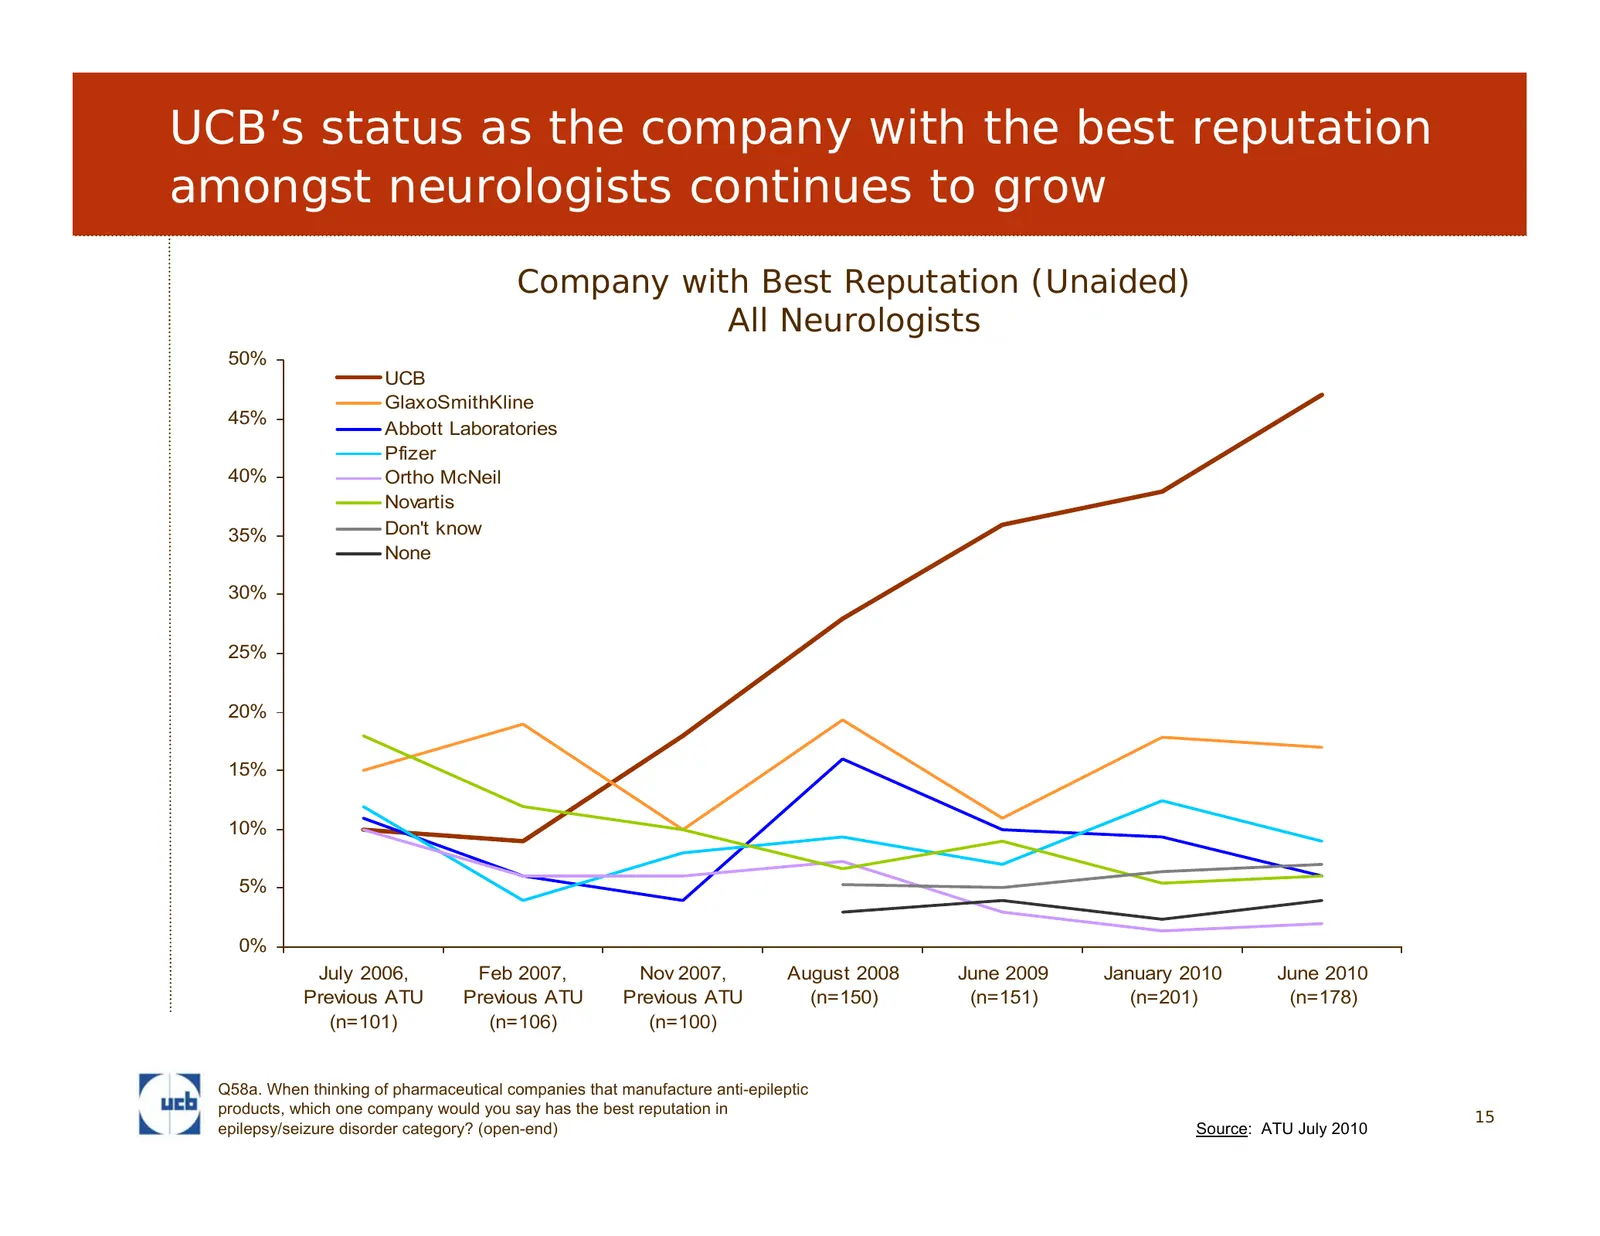
Slide 15: UCB's reputation amongst neurologists continues to grow
UCB’s status as the company with the best reputation amongst neurologists continues to grow Company with Best Reputation (Unaided) All Neurologists 50% UCB GlaxoSmithKline 45% Abbott Laboratories Pfizer 40% Ortho McNeil Novartis 35% Don't know None 30% 25% 20% 15% 10% 5% 0% July 2006, Feb 2007, Nov
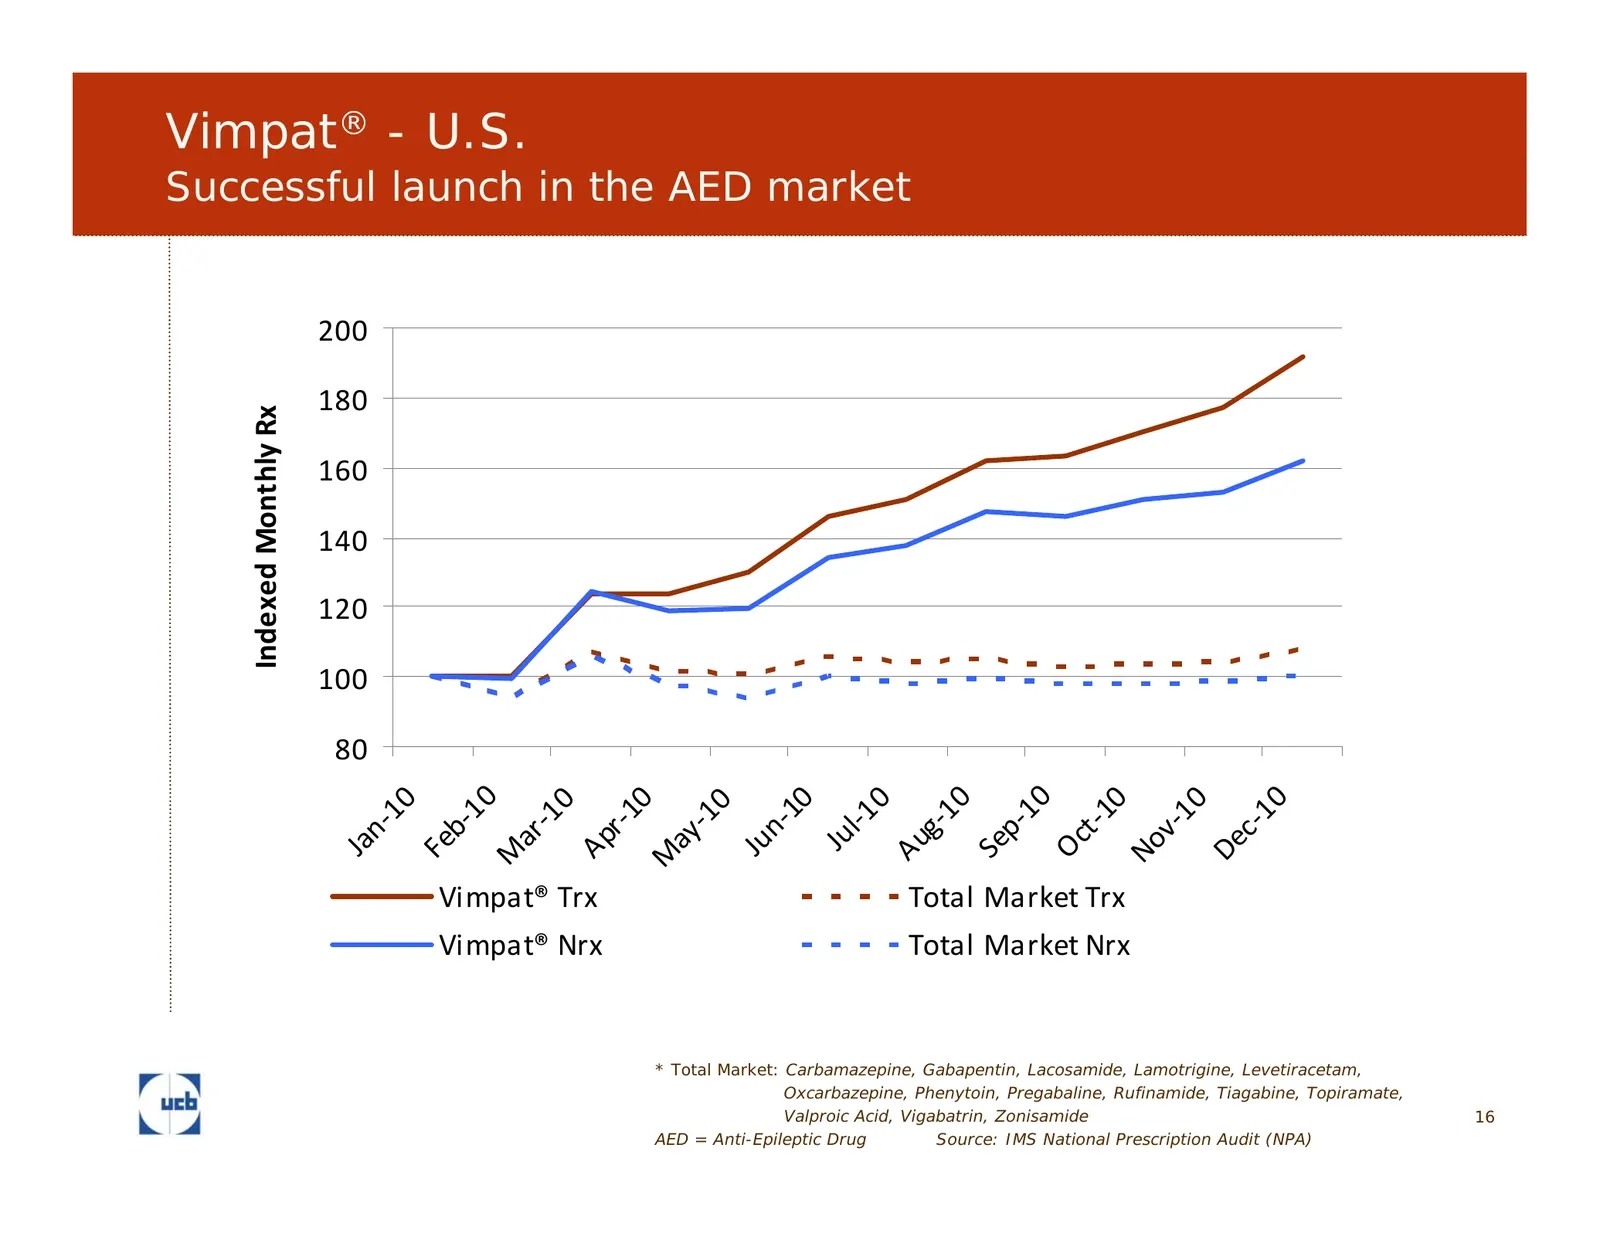
Slide 16: Vimpat - U.S.
Vimpat® - U.S. Successful launch in the AED market 200 180 Indexed Monthly Rx 160 140 120 100 80 10 10 10 10 10 10 0 10 0 0 0 0 r ‐1 t ‐1 l‐1 ‐1 ‐1 n‐ b‐ p‐ g‐ c‐ n‐ v‐ ar ay Ju Ap Oc Au De Fe Se Ju No Ja M M Vimpat® Trx Total Market Trx Vimpat® Nrx Total Market Nrx * Total Market: Carbamazepine, Ga
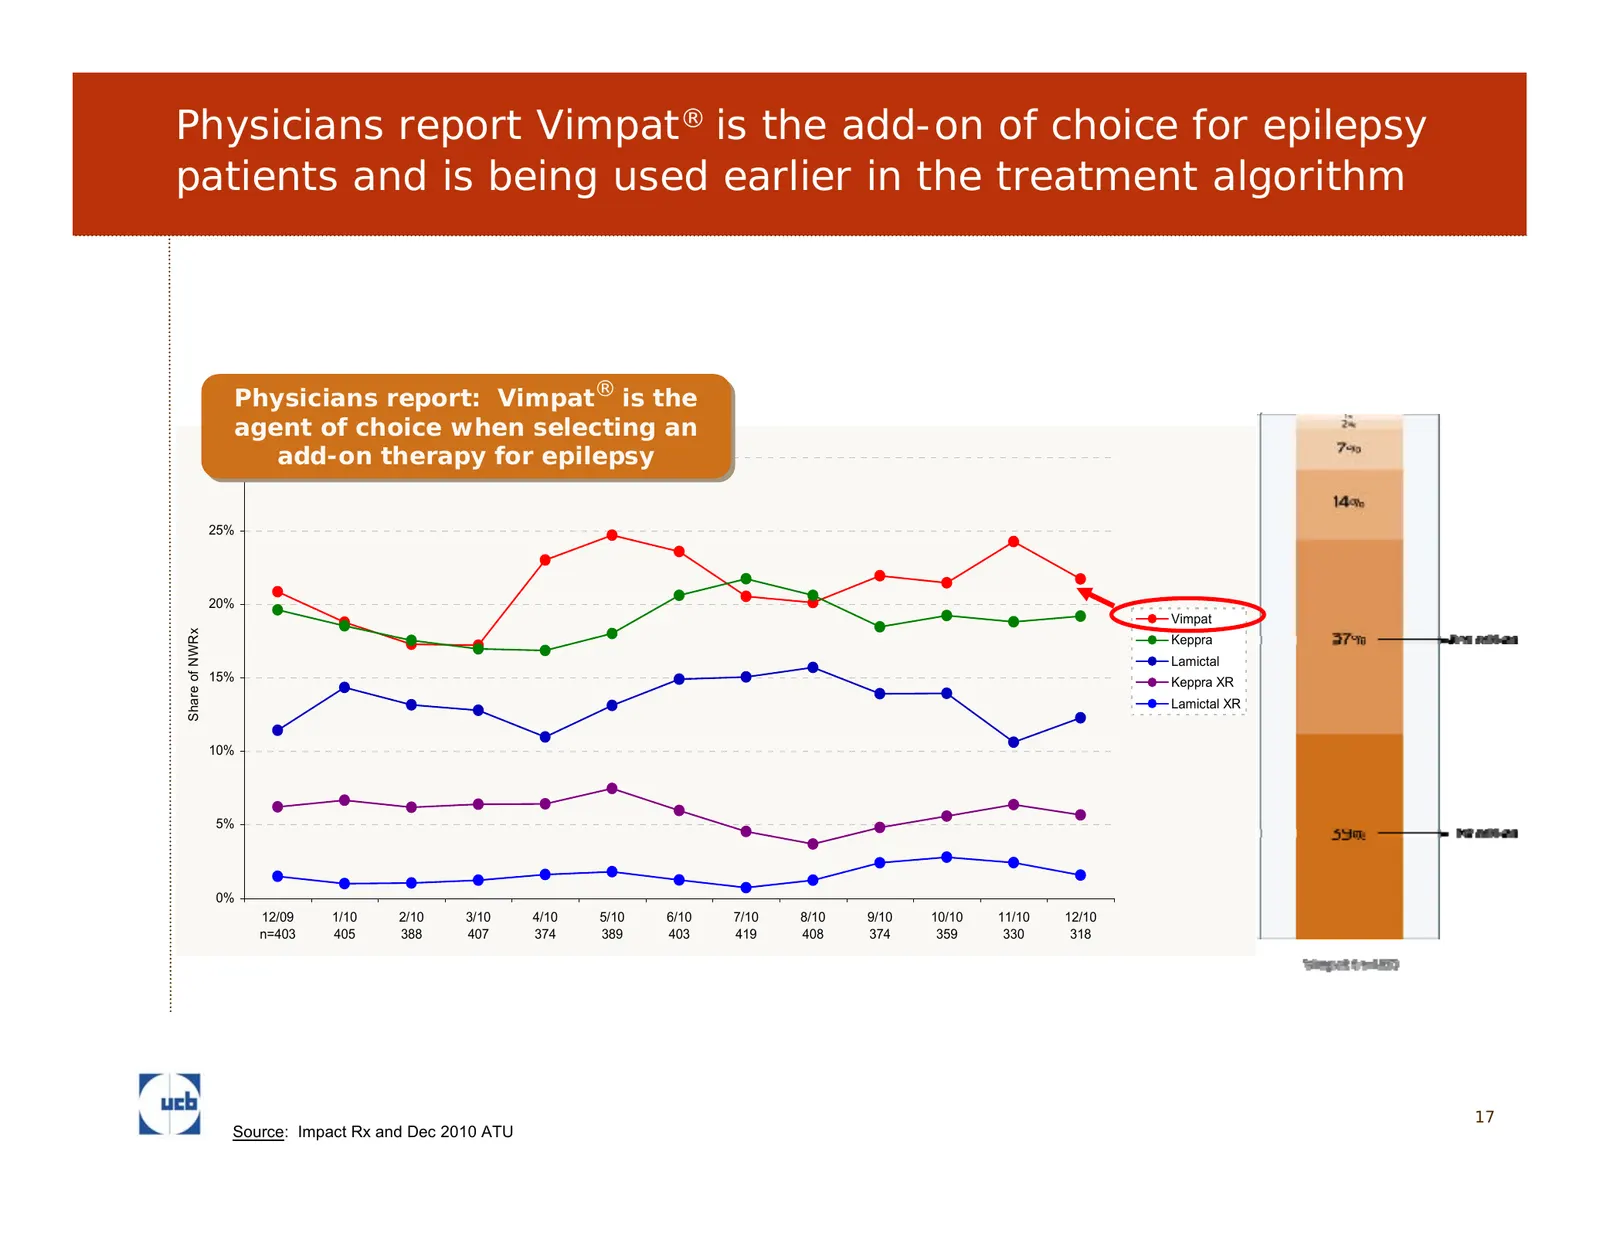
Slide 17: Vimpat is the add-on of choice for epilepsy patients
Physicians report Vimpat® is the add-on of choice for epilepsy patients and is being used earlier in the treatment algorithm ® Physicians Physicians report: Vimpat® is report: Vimpat is the the agent agent of choice when selecting an of choice when selecting an 30% add-on therapy for epilepsy add-on
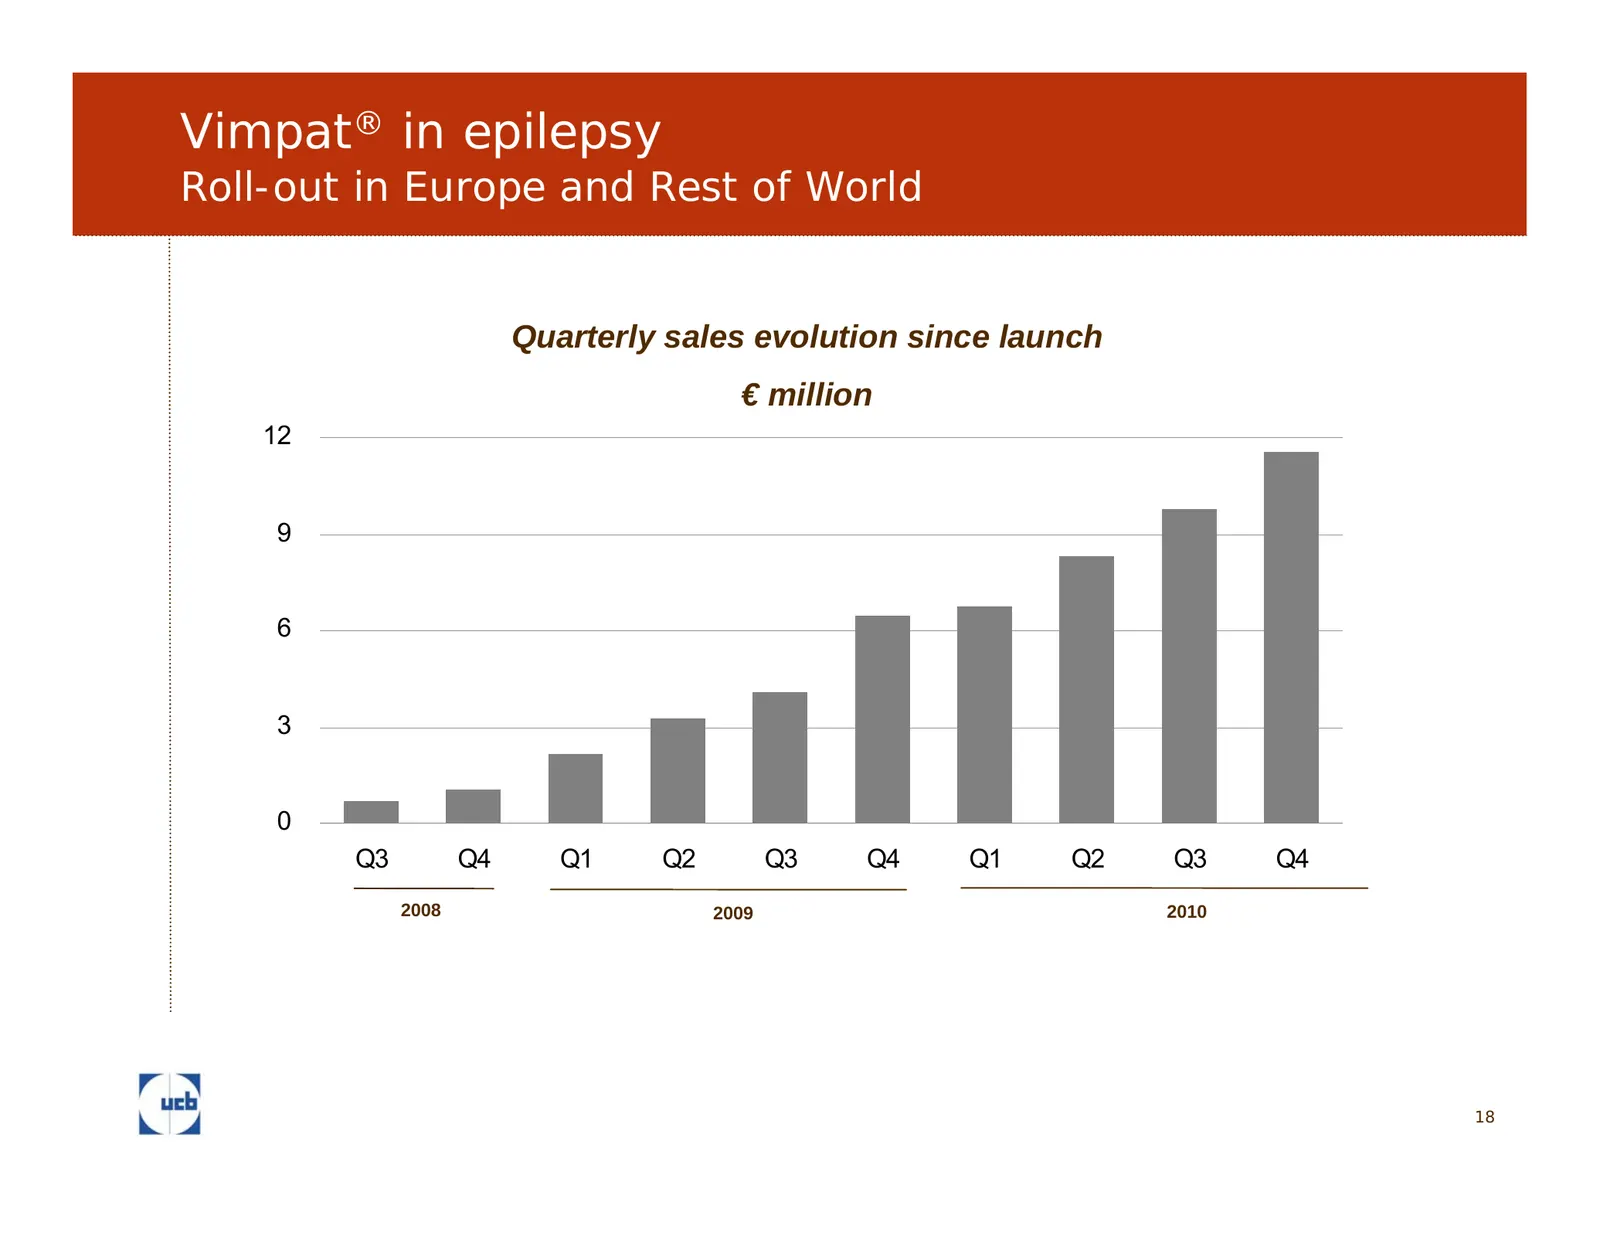
Slide 18: Vimpat in epilepsy: roll-out in Europe and Rest of World
Vimpat® in epilepsy Roll-out in Europe and Rest of World Quarterly sales evolution since launch € million 12 9 6 3 0 Q3 Q4 Q1 Q2 Q3 Q4 Q1 Q2 Q3 Q4 2008 2009 2010 18
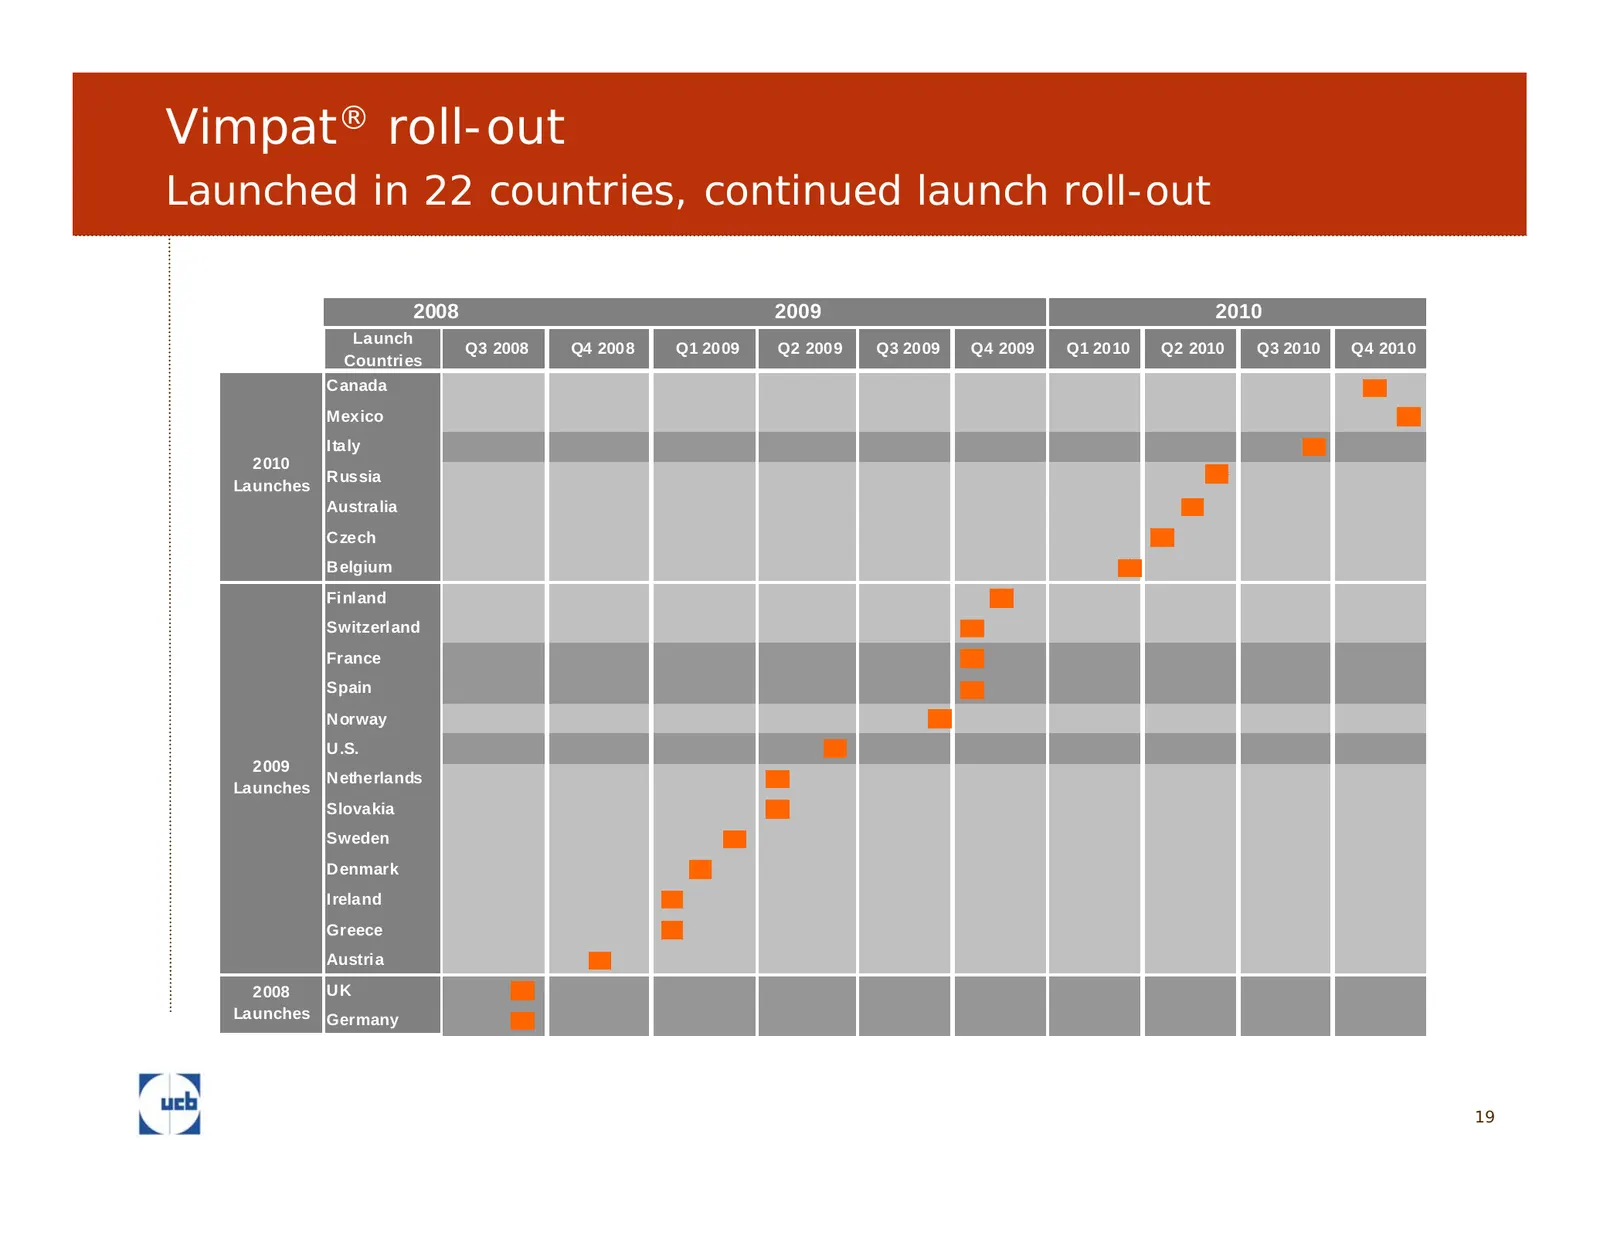
Slide 19: Vimpat roll-out
Vimpat® roll-out Launched in 22 countries, continued launch roll-out 2008 2009 2010 Launch Q3 2008 Q4 2008 Q1 2009 Q2 2009 Q3 2009 Q4 2009 Q1 2010 Q2 2010 Q3 2010 Q4 2010 Countries Canada Mexico Italy 2010 Russia Launches Australia Czech Belgium Finland Switzerland France Spain Norway U.S. 2009 Neth
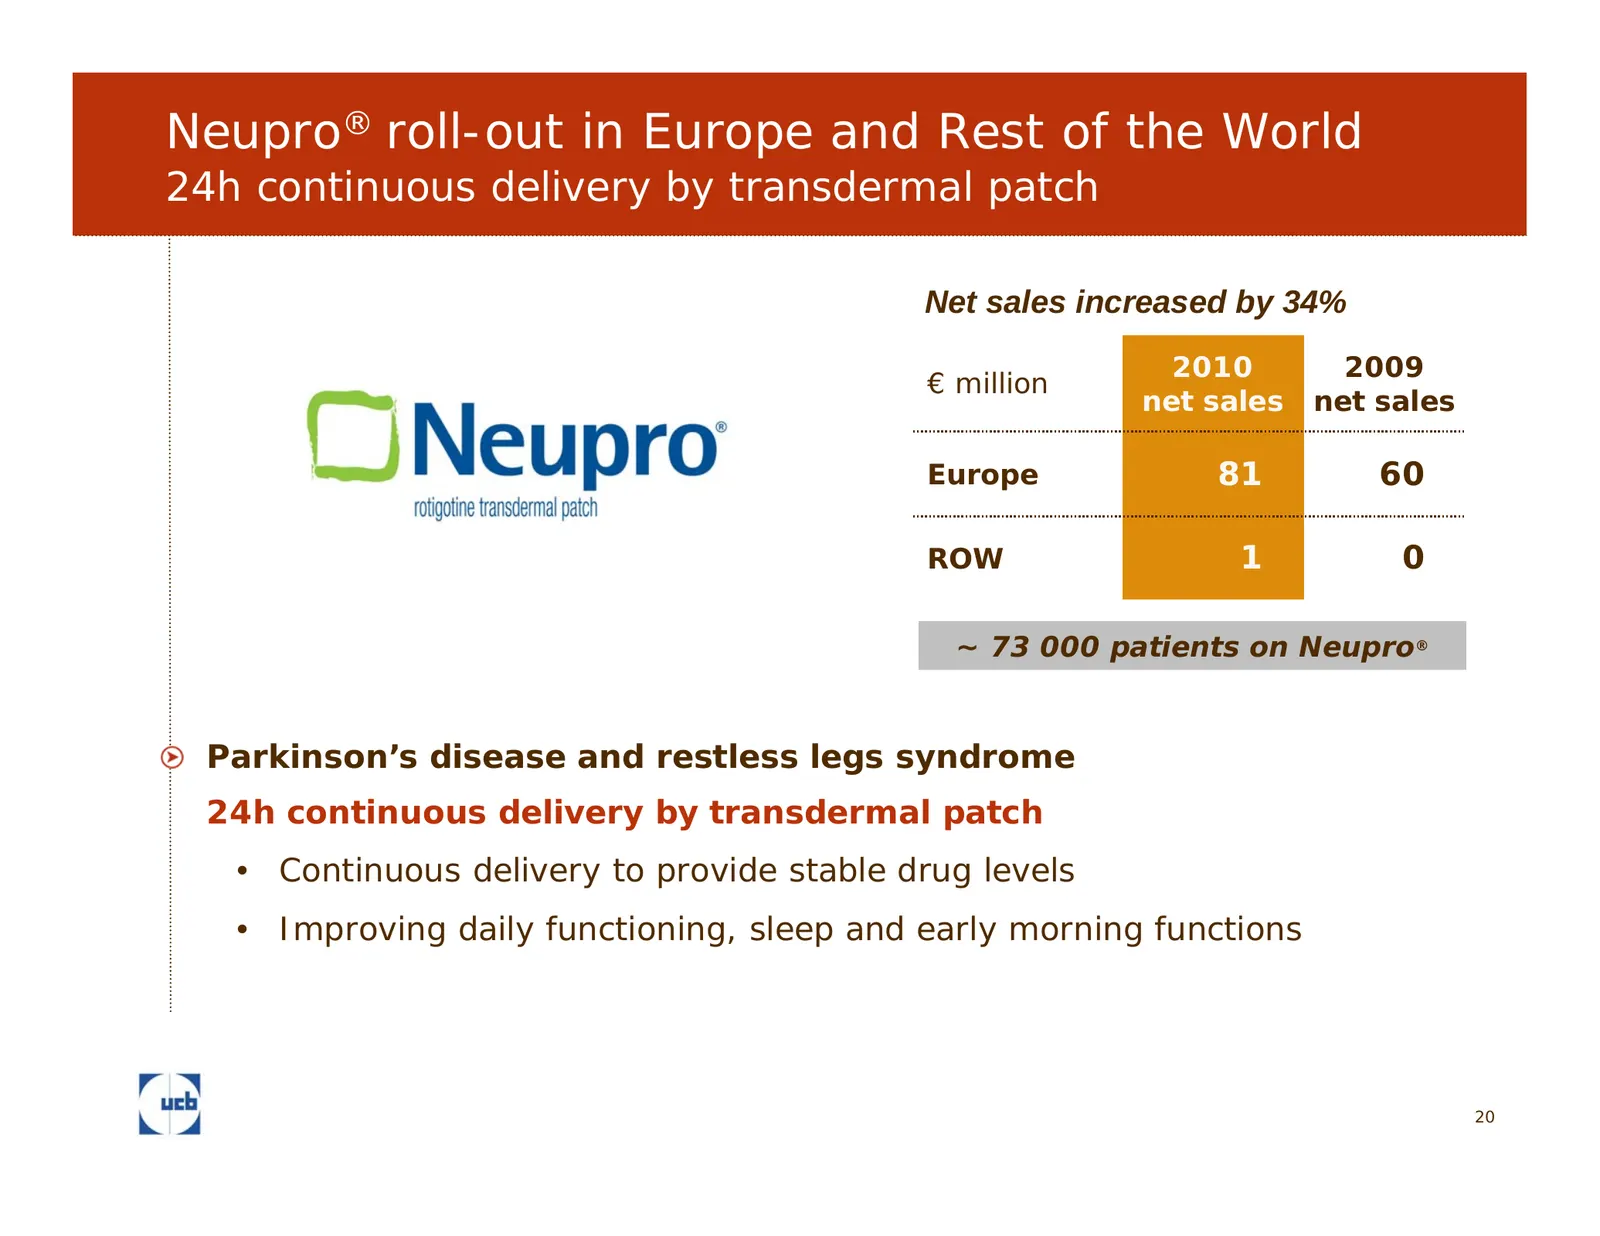
Slide 20: Neupro roll-out in Europe and Rest of the World
Neupro® roll-out in Europe and Rest of the World 24h continuous delivery by transdermal patch Net sales increased by 34% 2010 2009 € million net sales net sales Europe 81 60 ROW 1 0 ~ 73 000 patients on Neupro® Parkinson’s disease and restless legs syndrome 24h continuous delivery by transdermal pat
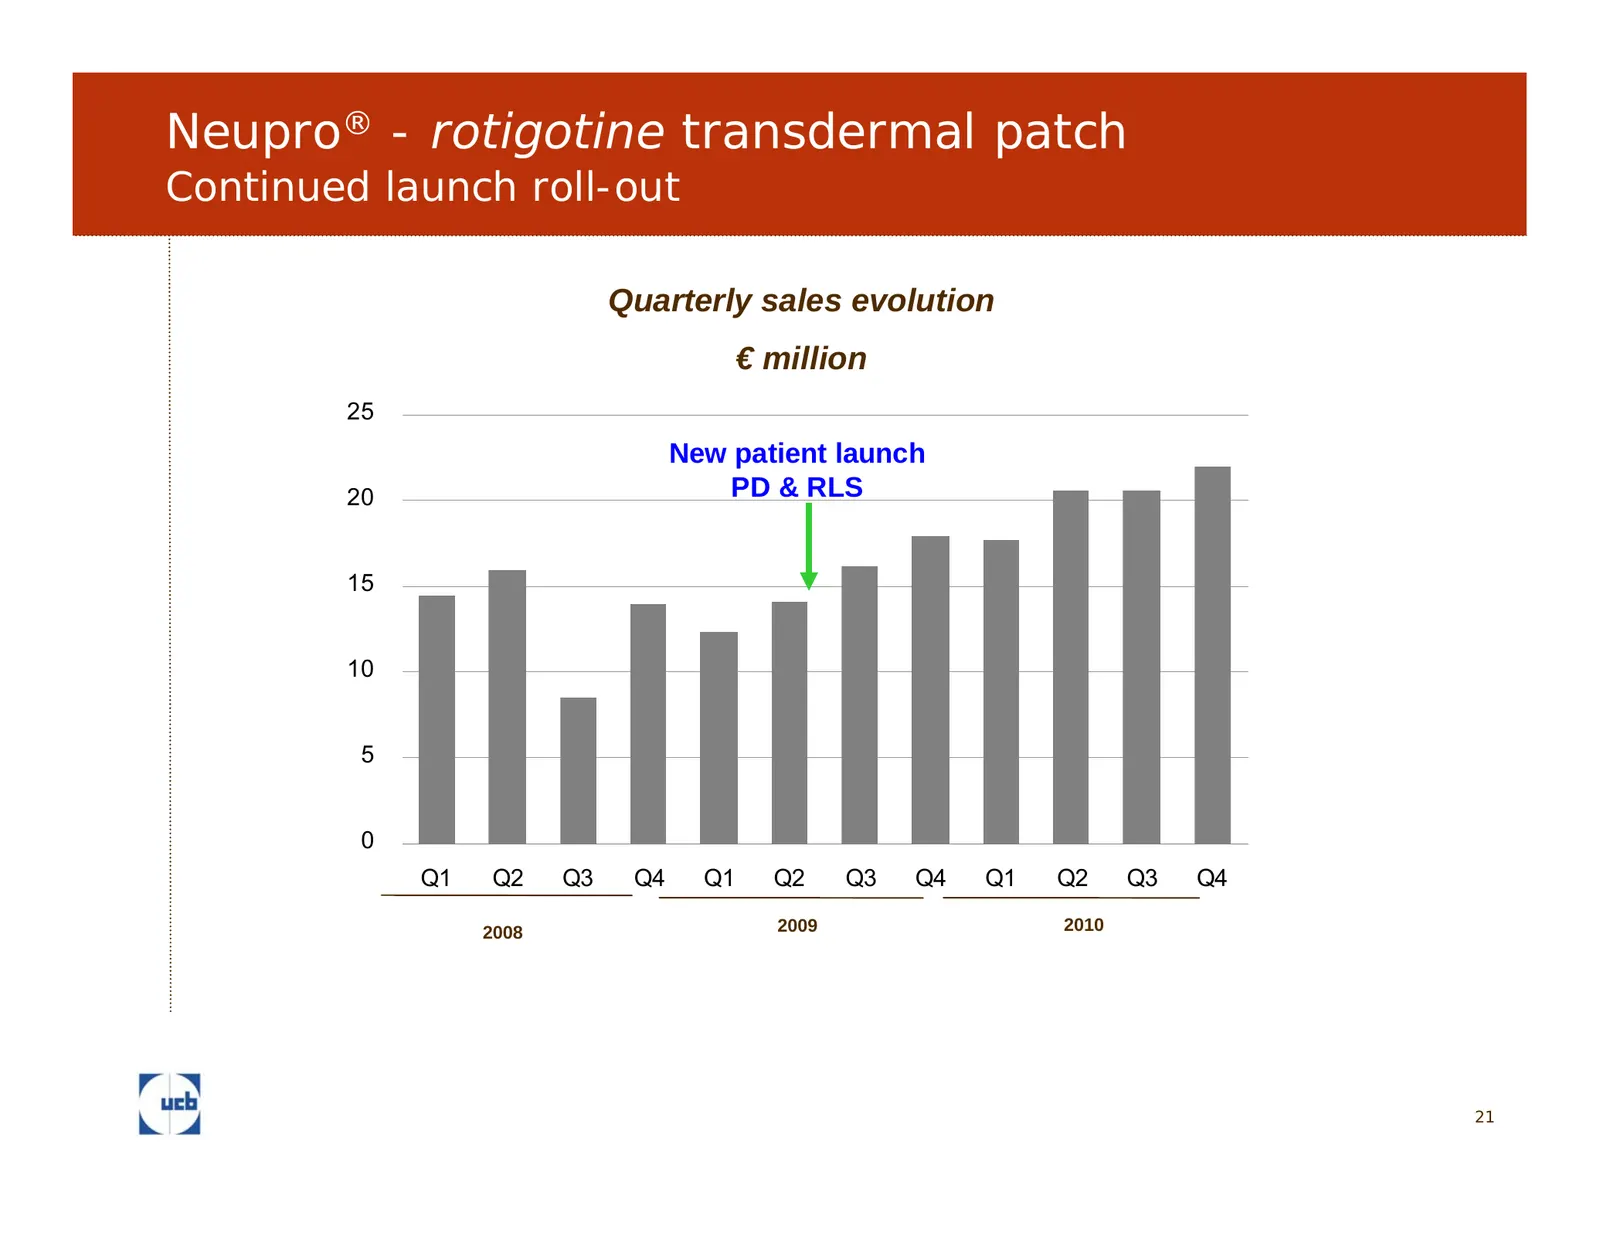
Slide 21: Neupro - rotigotine transdermal patch
Neupro® - rotigotine transdermal patch Continued launch roll-out Quarterly sales evolution € million 25 New patient launch 20 PD & RLS 15 10 5 0 Q1 Q2 Q3 Q4 Q1 Q2 Q3 Q4 Q1 Q2 Q3 Q4 2008 2009 2010 21
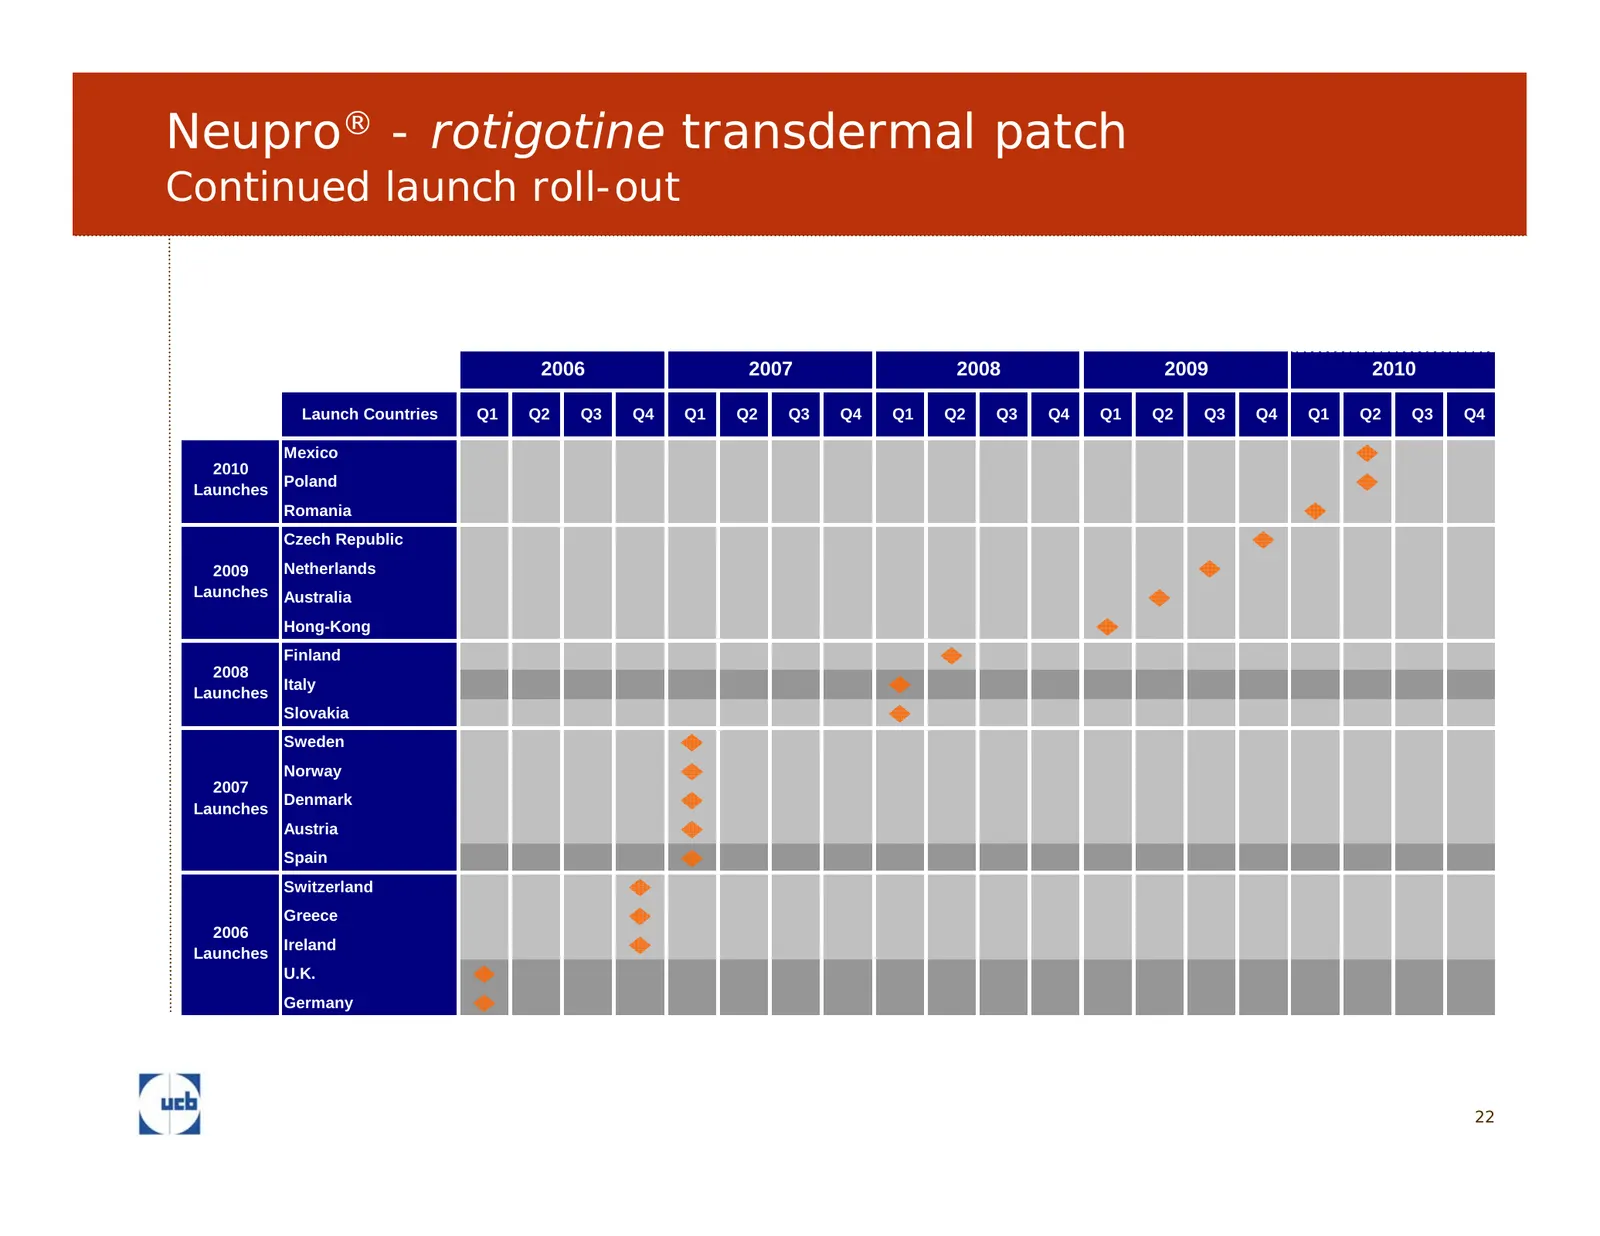
Slide 22: Neupro - rotigotine transdermal patch
Neupro® - rotigotine transdermal patch Continued launch roll-out 2006 2007 2008 2009 2010 Launch Countries Q1 Q2 Q3 Q4 Q1 Q2 Q3 Q4 Q1 Q2 Q3 Q4 Q1 Q2 Q3 Q4 Q1 Q2 Q3 Q4 Mexico 2010 Poland Launches Romania Czech Republic 2009 Netherlands Launches Australia Hong-Kong Finland 2008 Italy Launches Slovakia
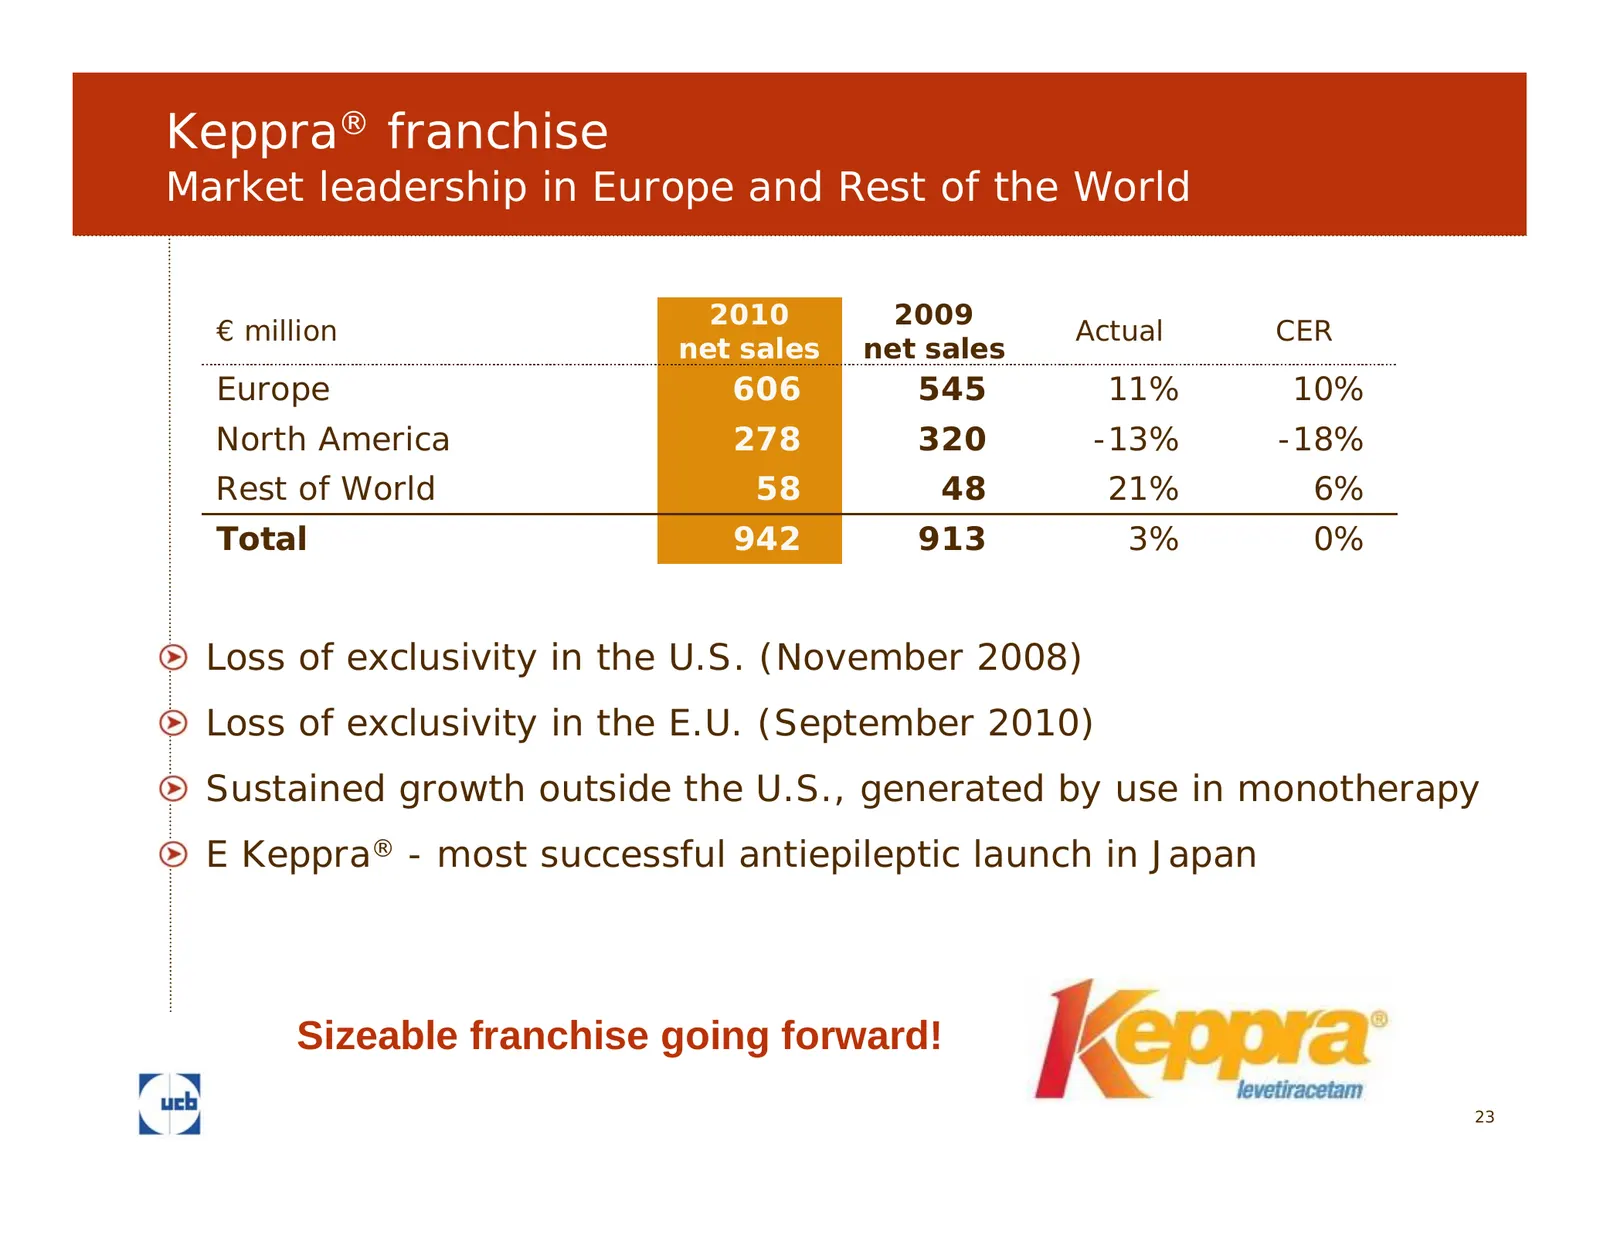
Slide 23: Keppra franchise
Keppra® franchise Market leadership in Europe and Rest of the World 2010 2009 € million Actual CER net sales net sales Europe 606 545 11% 10% North America 278 320 -13% -18% Rest of World 58 48 21% 6% Total 942 913 3% 0% Loss of exclusivity in the U.S. (November 2008) Loss of exclusivity in the E.U.
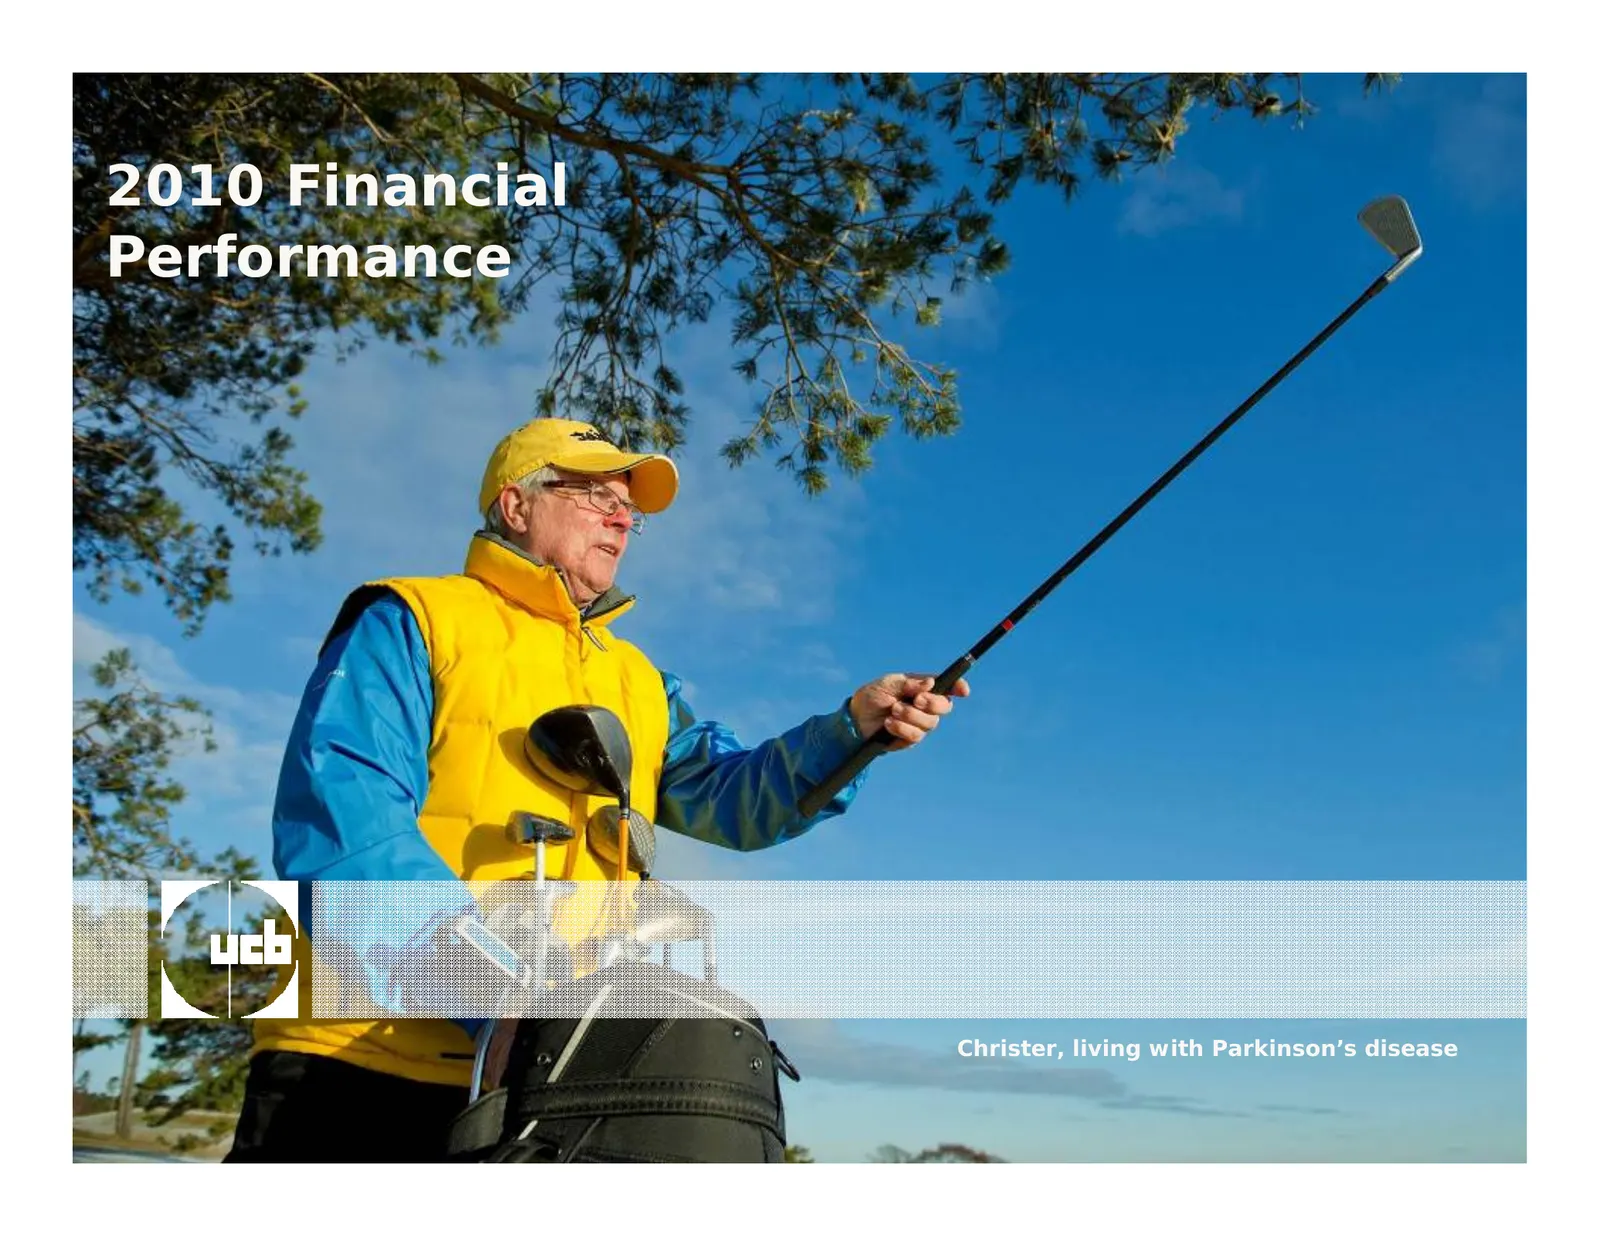
Slide 24: 2010 Financial Performance
2010 Financial Performance Christer, living with Parkinson’s disease
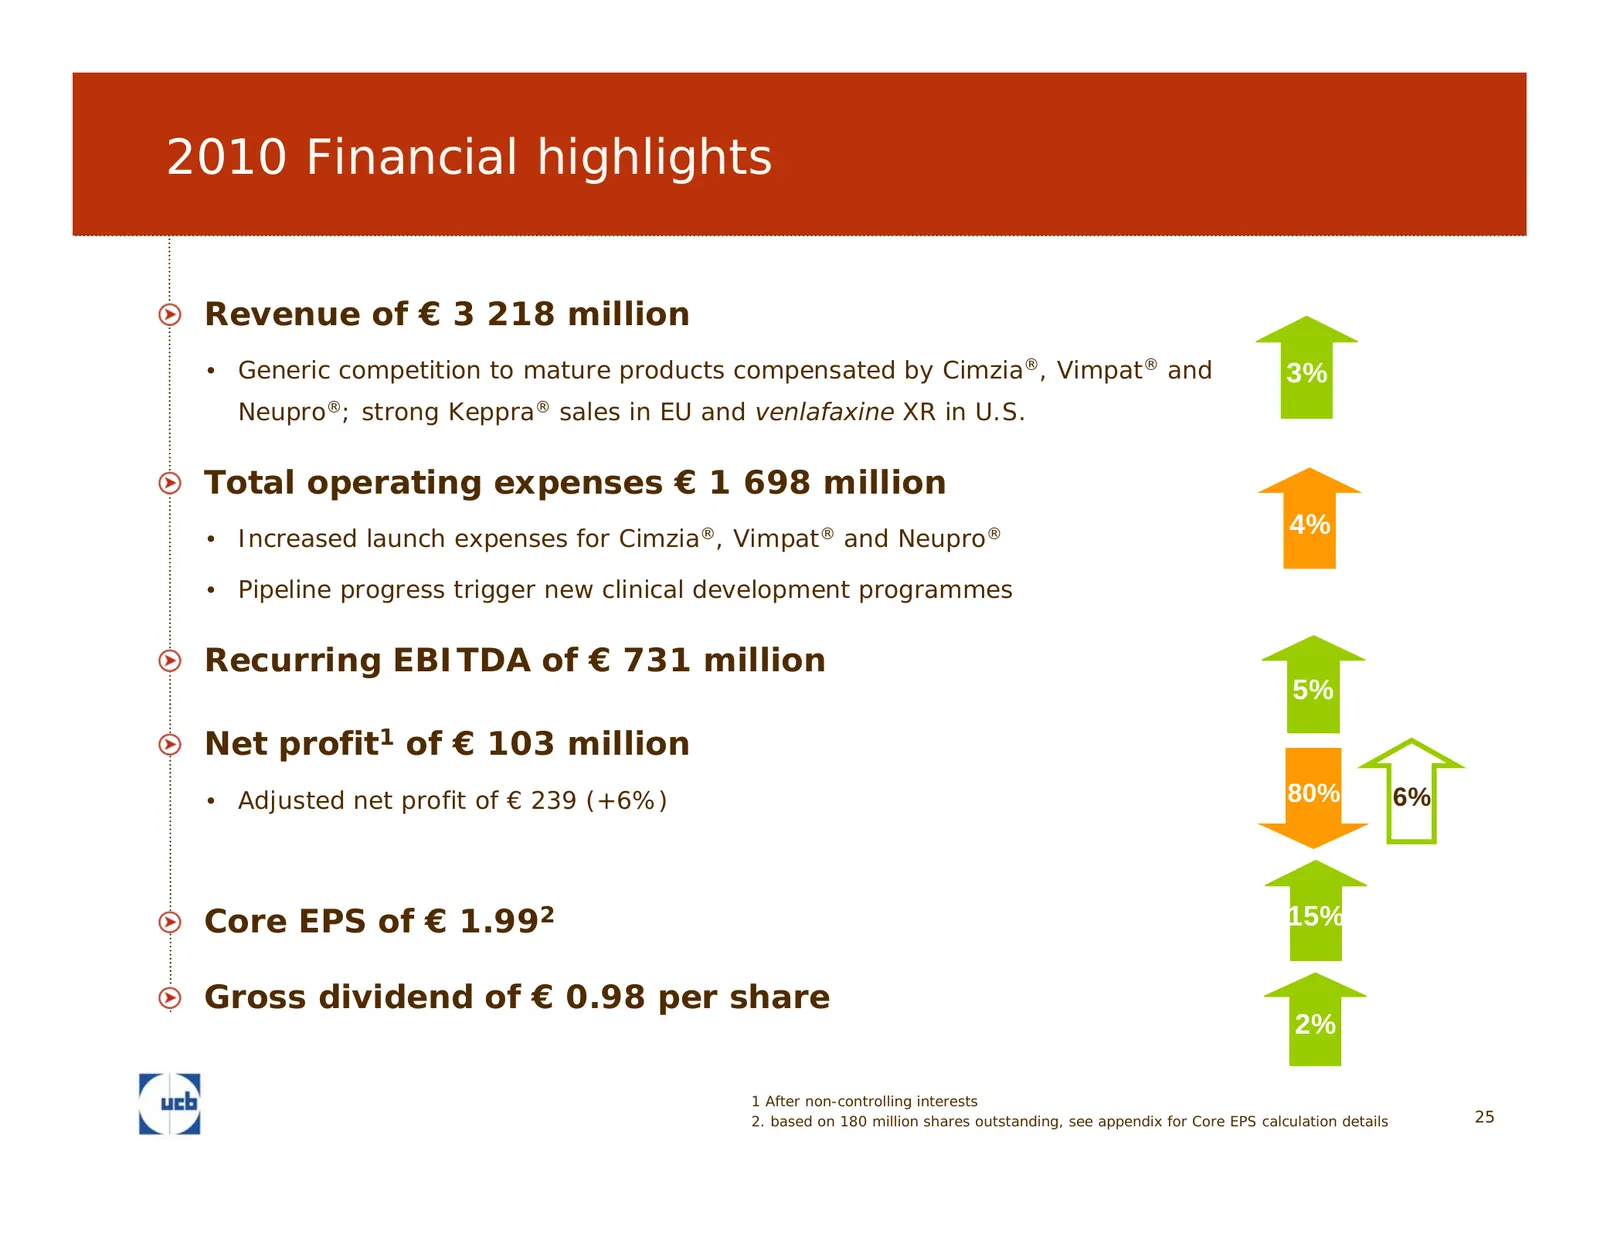
Slide 25: 2010 Financial highlights
2010 Financial highlights Revenue of € 3 218 million • Generic competition to mature products compensated by Cimzia®, Vimpat® and 3% Neupro®; strong Keppra® sales in EU and venlafaxine XR in U.S. Total operating expenses € 1 698 million • Increased launch expenses for Cimzia®, Vimpat® and Neupro® 4%
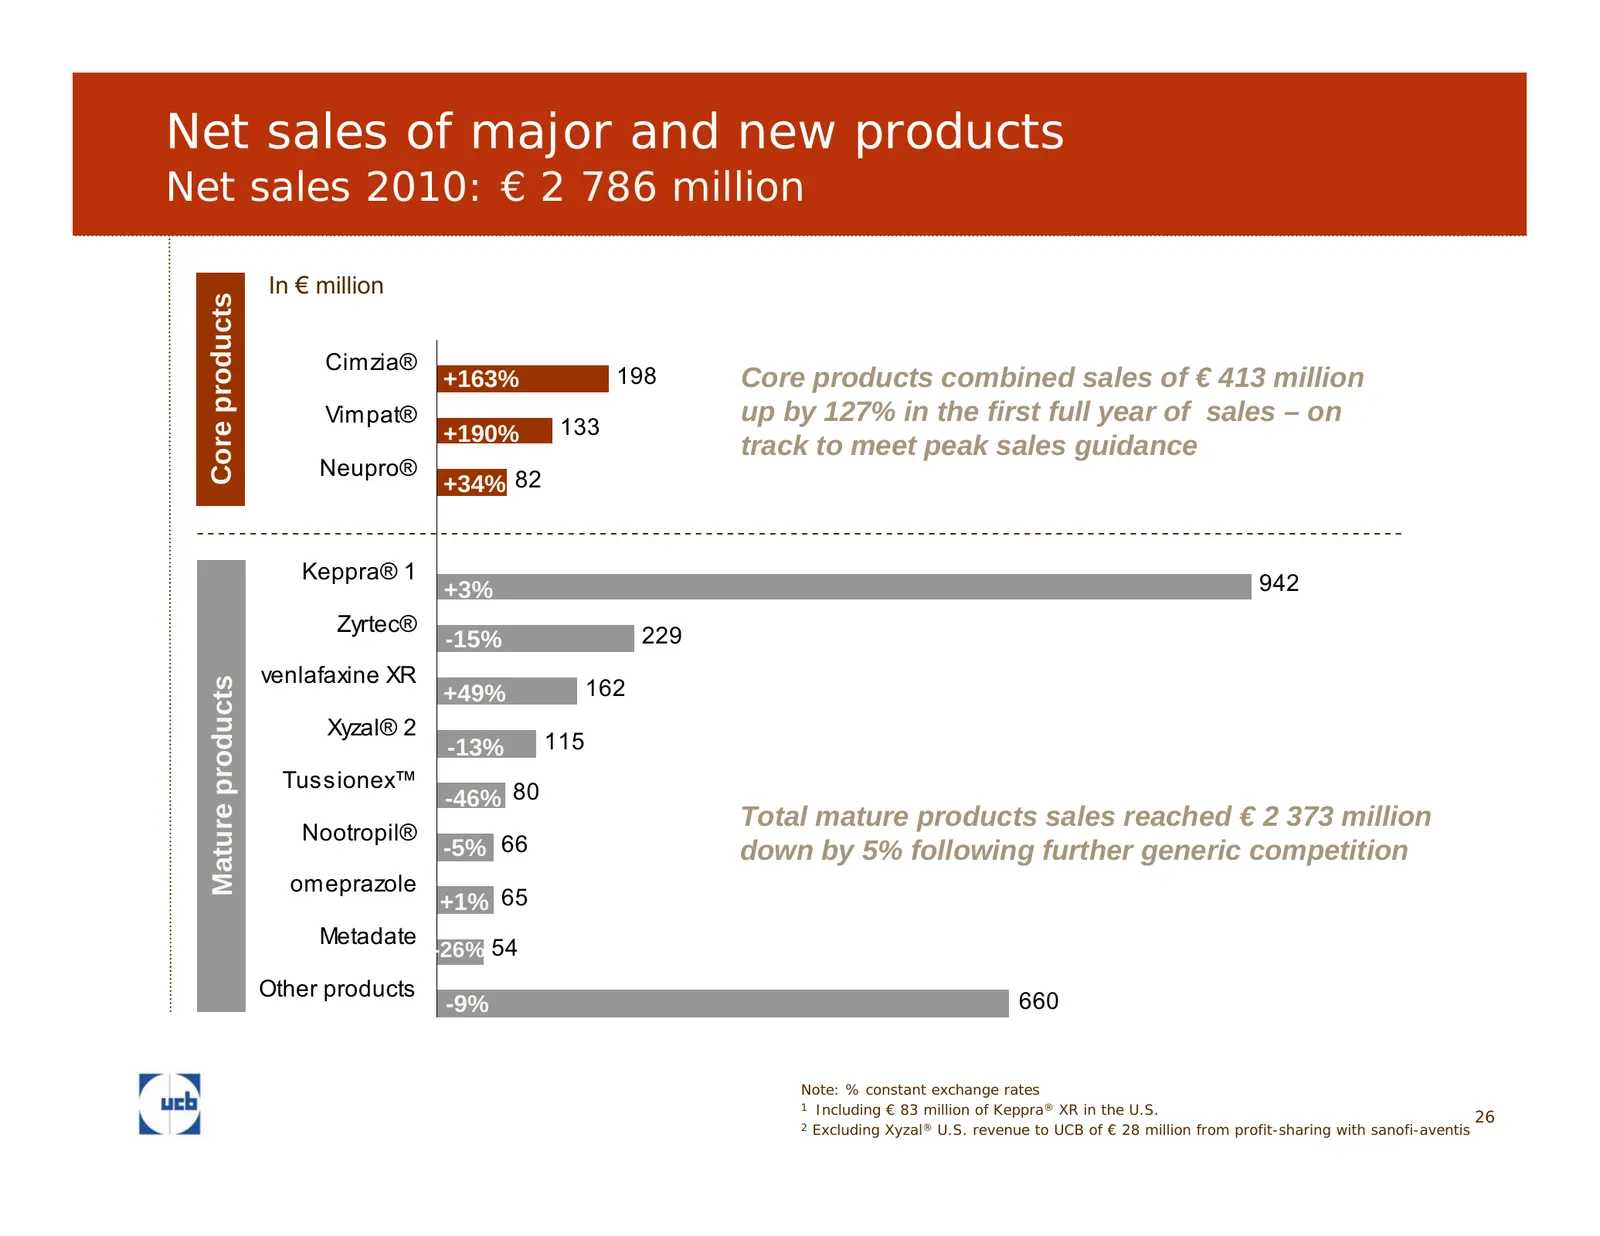
Slide 26: Net sales of major and new products
Net sales of major and new products Net sales 2010: € 2 786 million In € million Core products Cimzia® +163% 198 Core products combined sales of € 413 million Vimpat® 133 up by 127% in the first full year of sales – on +190% track to meet peak sales guidance Neupro® +34% 82 Keppra® 1 +3% 942 Zyrtec®
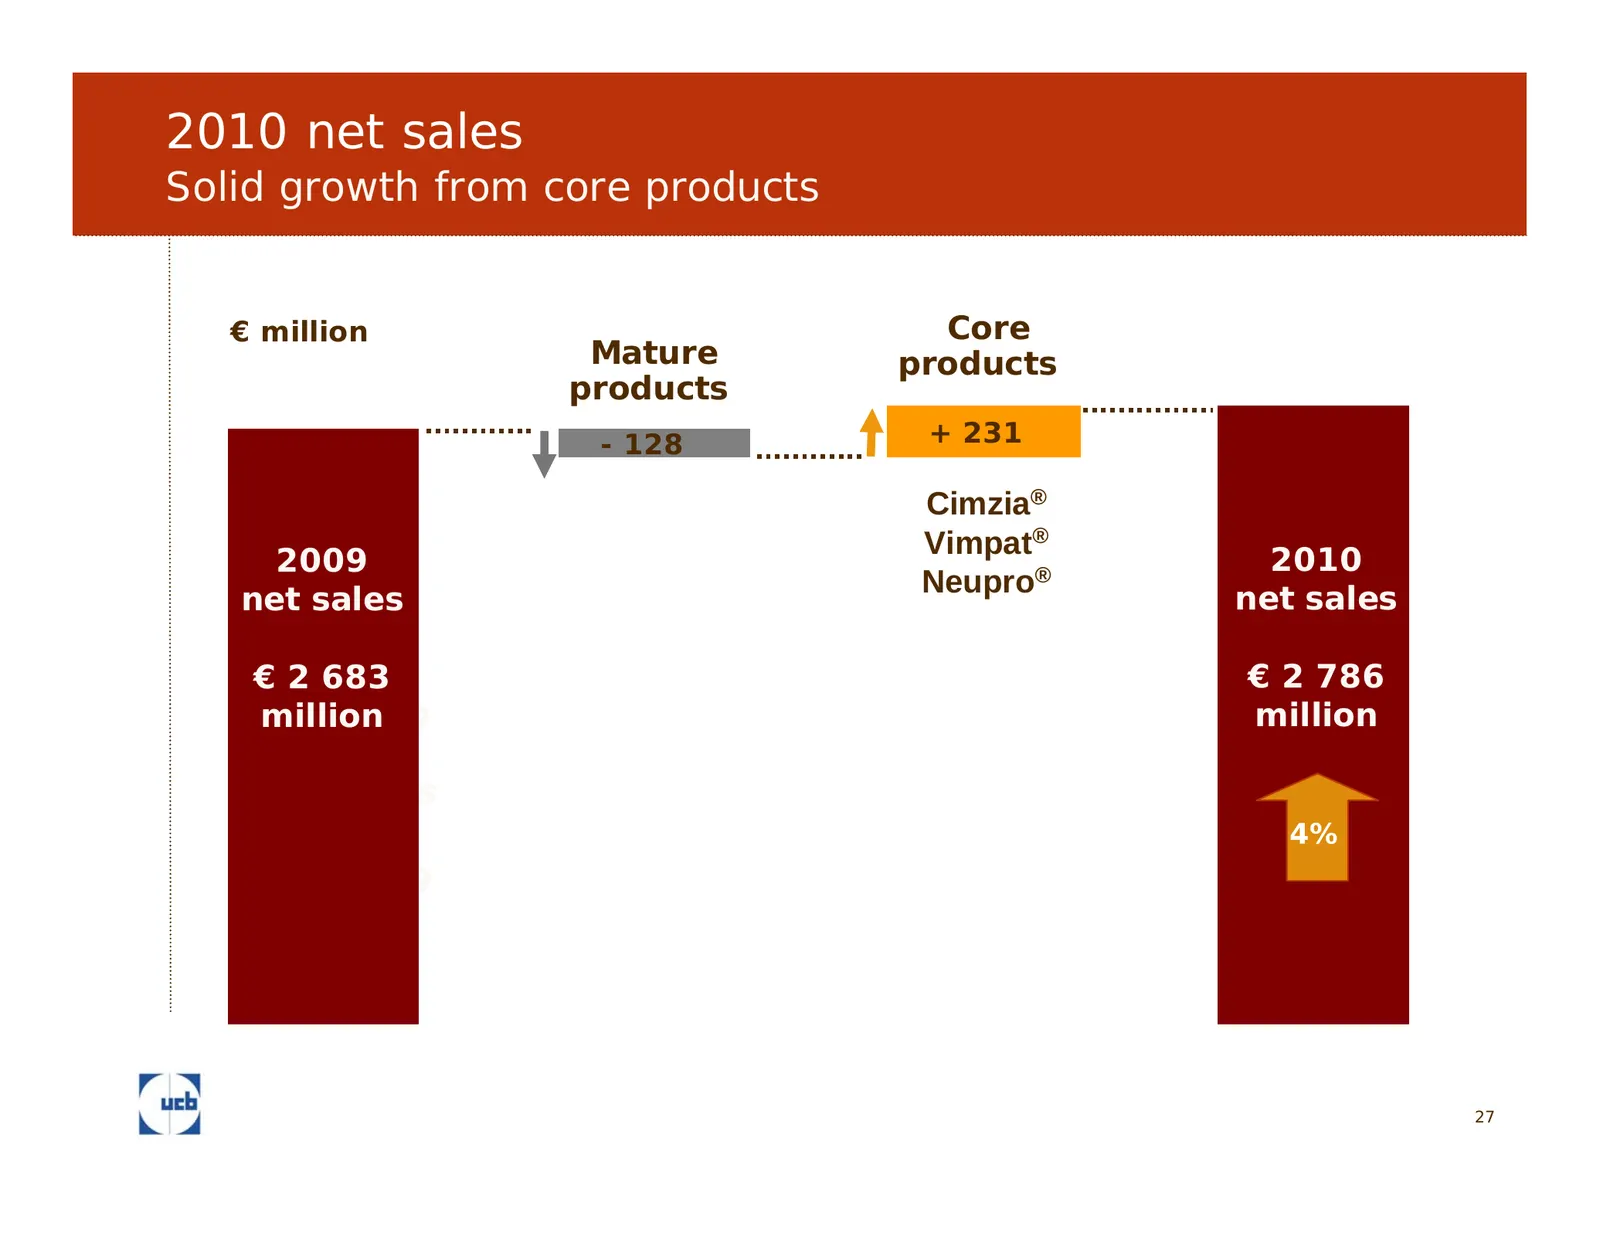
Slide 27: 2010 net sales
2010 net sales Solid growth from core products € million Core Mature products products - 128 + 231 Cimzia® Vimpat® 2009 2010 net2010 Neupro® net sales sales Net Sales € 2 683 € 2 786 million 2009 million Net 1 431 Sales 4% 1 379 27
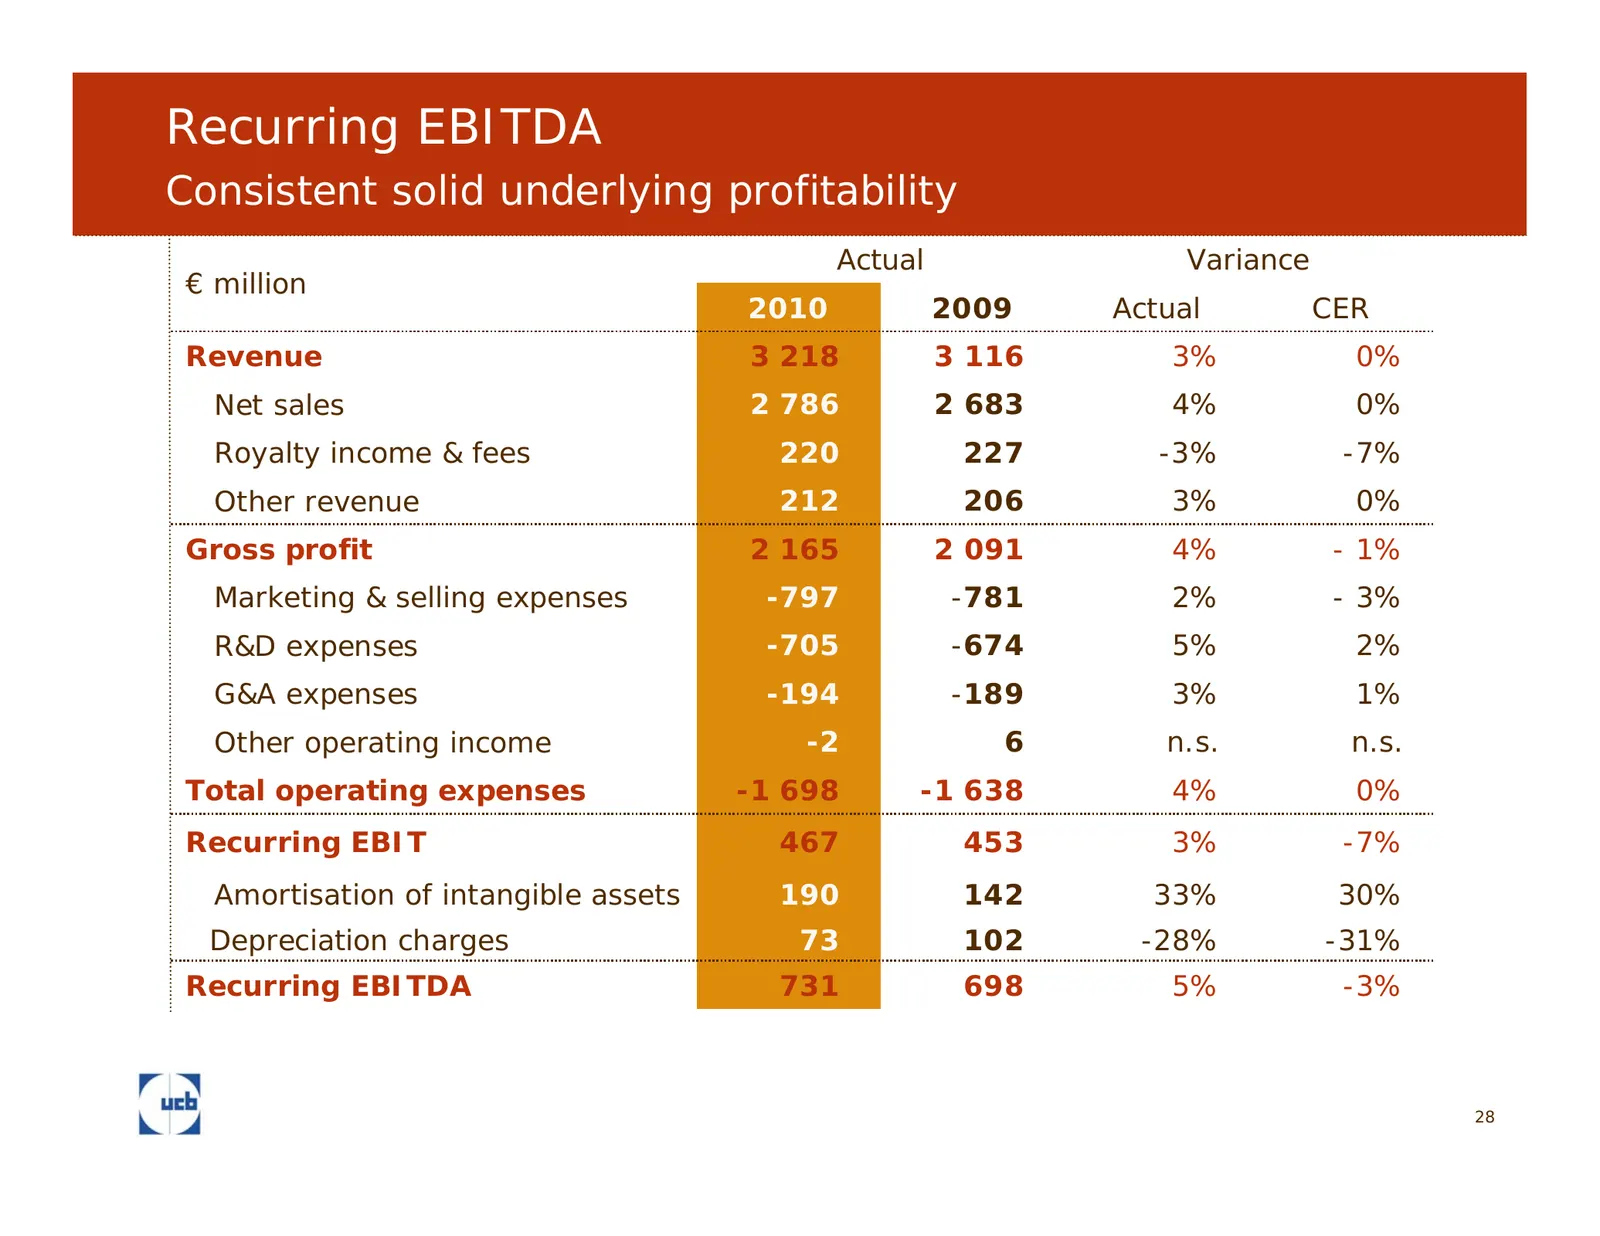
Slide 28: Recurring EBITDA
Recurring EBITDA Consistent solid underlying profitability Actual Variance € million 2010 2009 Actual CER Revenue 3 218 3 116 3% 0% Net sales 2 786 2 683 4% 0% Royalty income & fees 220 227 -3% -7% Other revenue 212 206 3% 0% Gross profit 2 165 2 091 4% - 1% Marketing & selling expenses -797 -781 2%
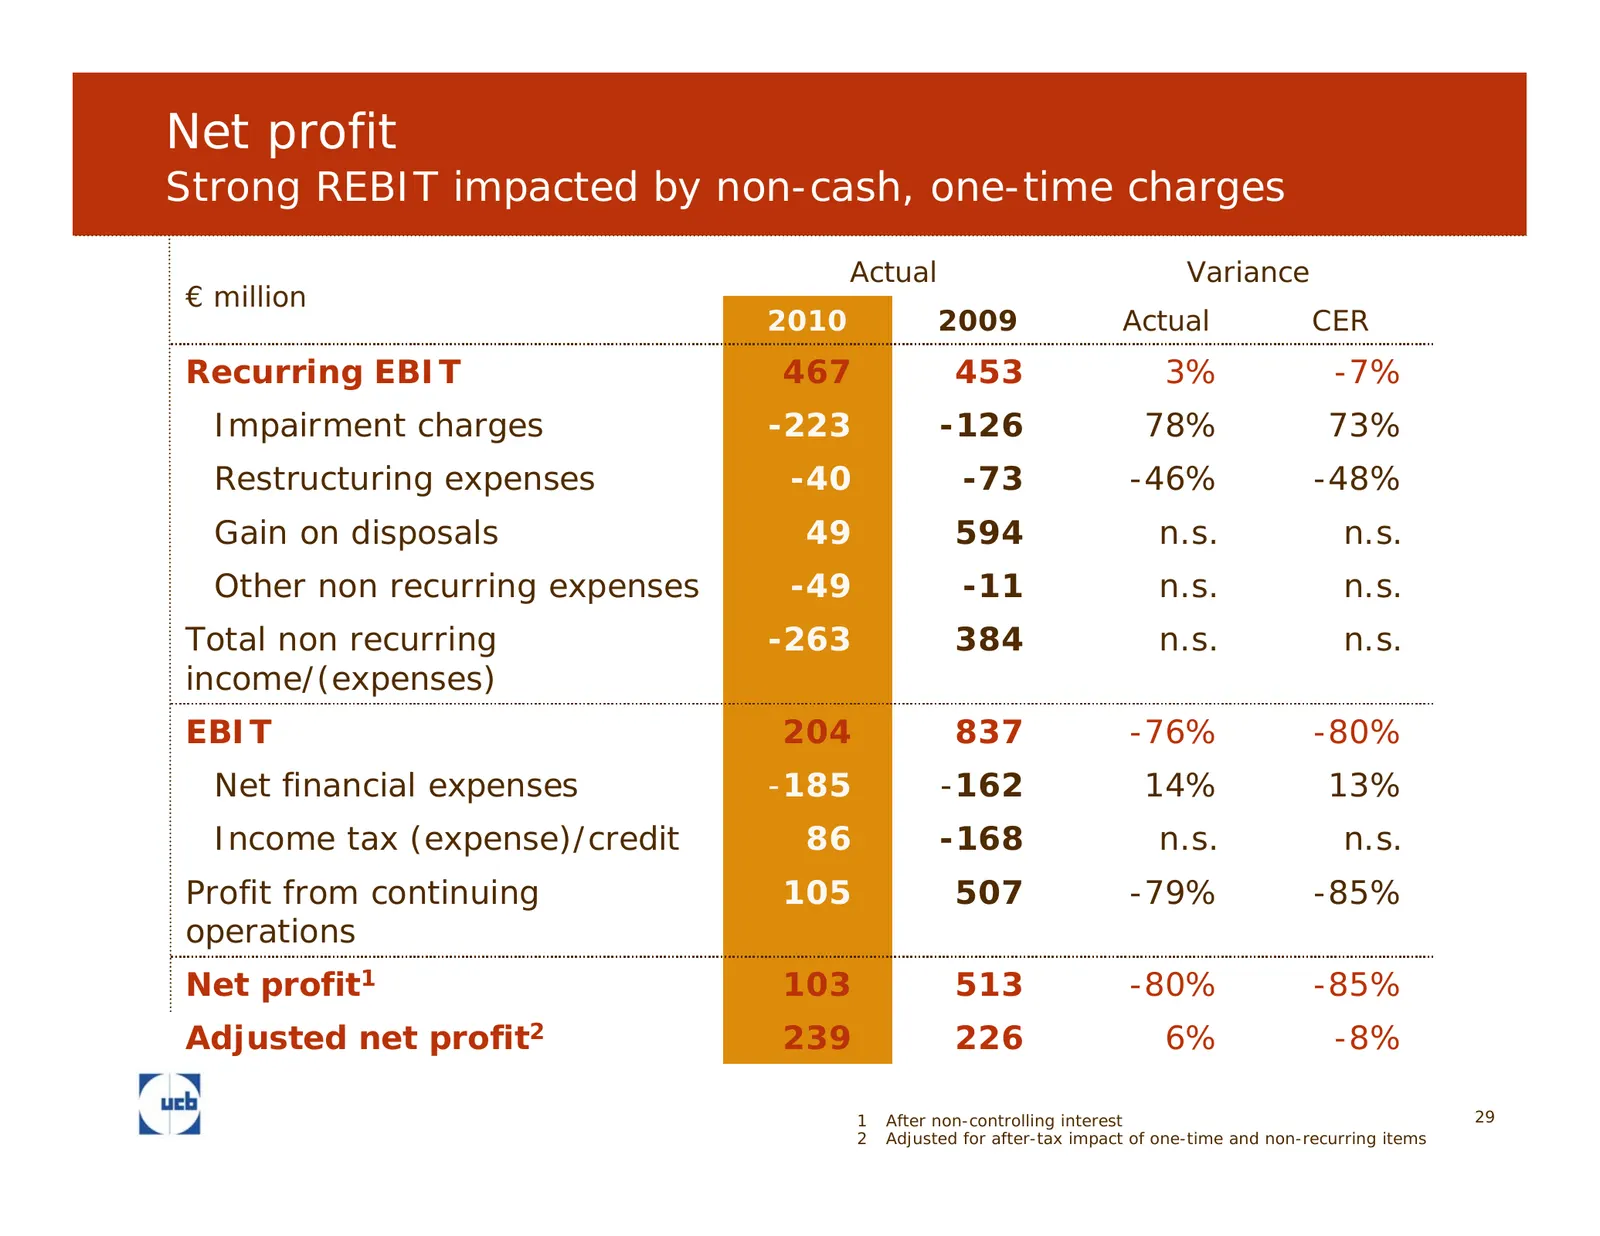
Slide 29: Net profit
Net profit Strong REBIT impacted by non-cash, one-time charges Actual Variance € million 2010 2009 Actual CER Recurring EBIT 467 453 3% -7% Impairment charges -223 -126 78% 73% Restructuring expenses -40 -73 -46% -48% Gain on disposals 49 594 n.s. n.s. Other non recurring expenses -49 -11 n.s. n.s.
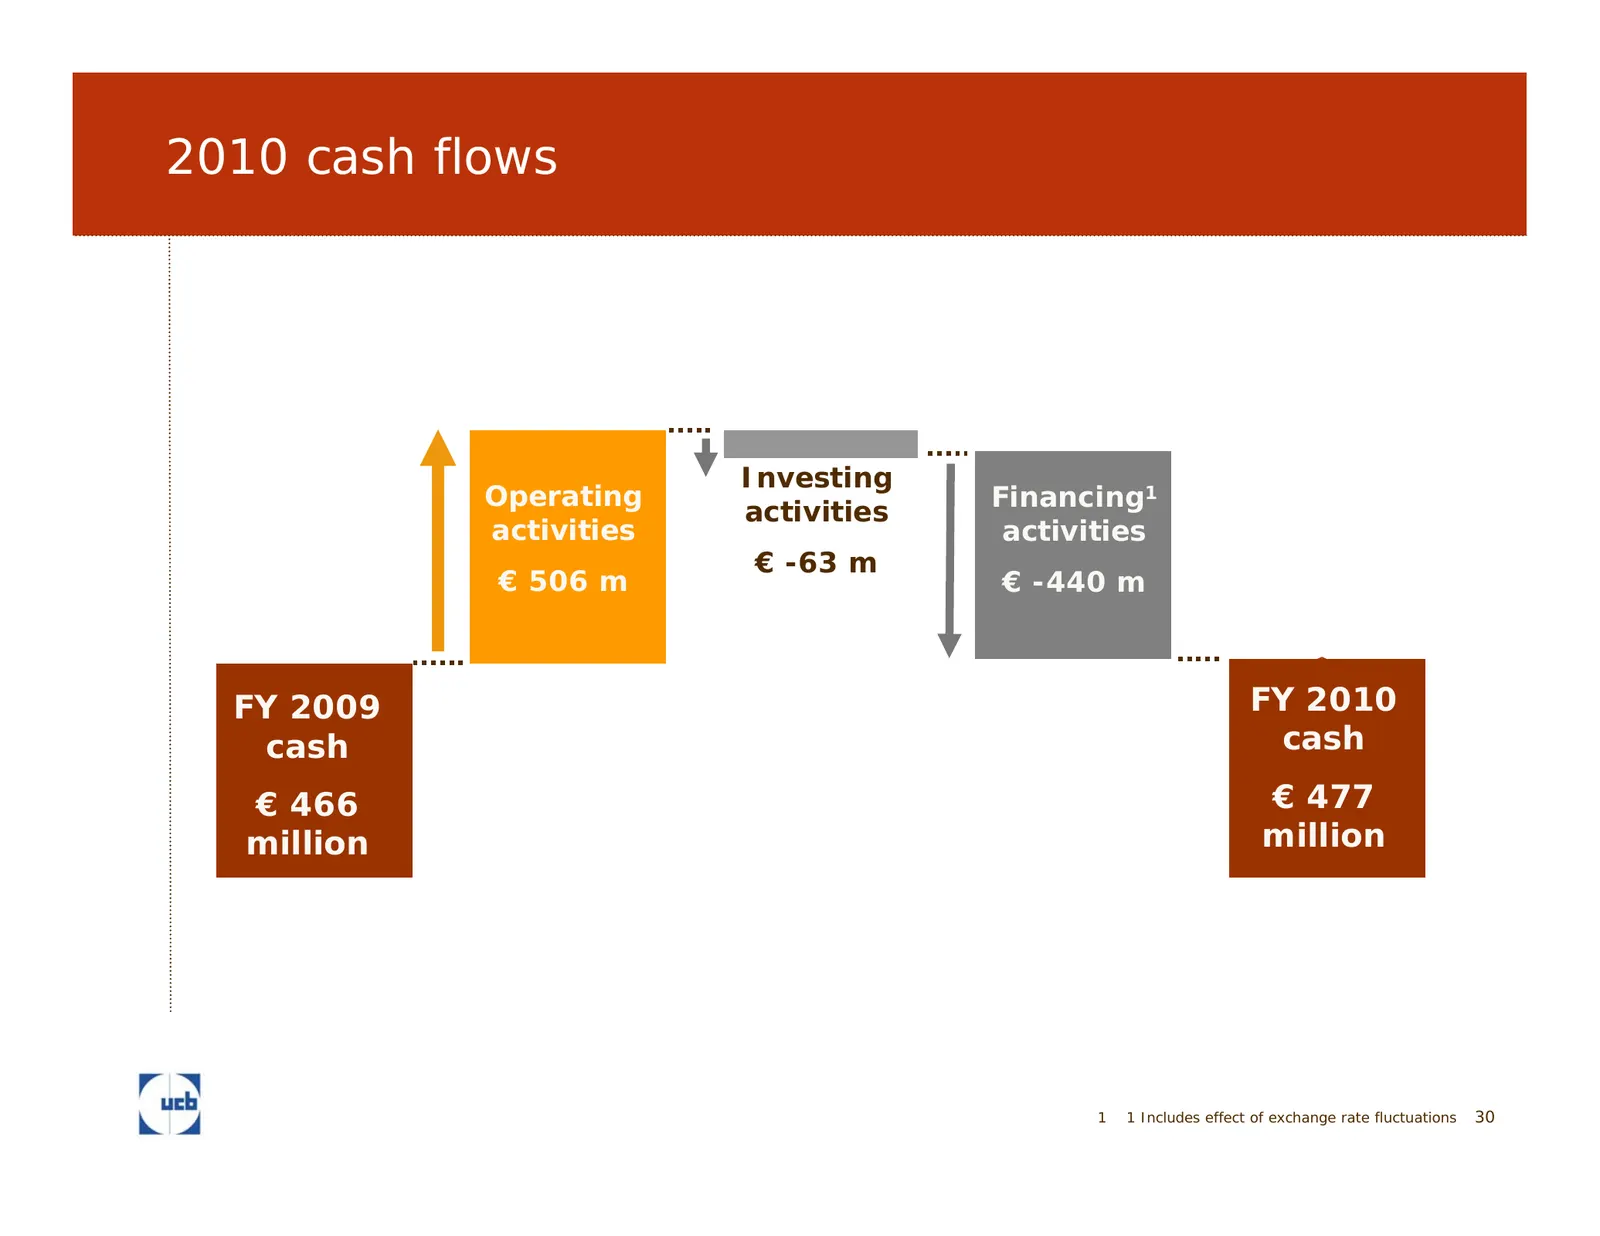
Slide 30: 2010 cash flows
2010 cash flows Investing Operating Financing1 activities activities activities € -63 m € 506 m € -440 m FY 2009 FY 2010 cash cash 87% € 466 € 477 million million 1 1 Includes effect of exchange rate fluctuations 30
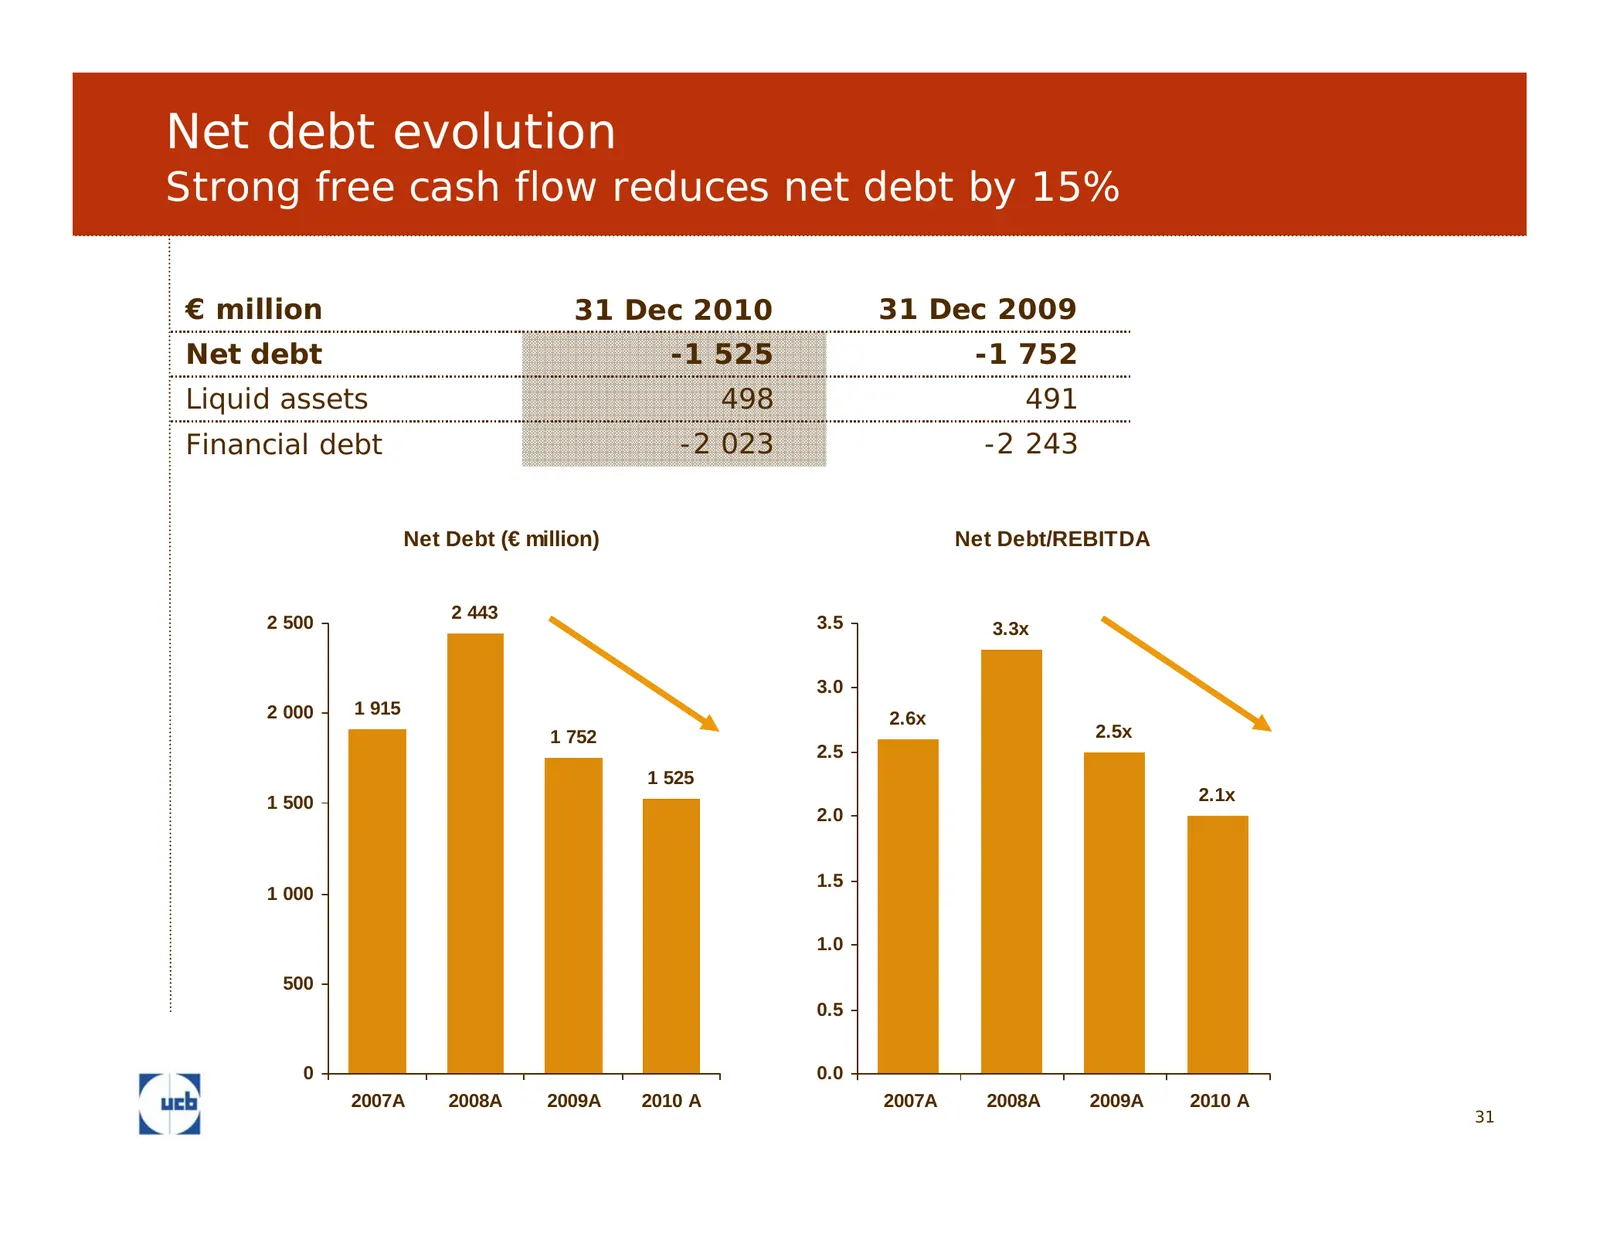
Slide 31: Net debt evolution
Net debt evolution Strong free cash flow reduces net debt by 15% € million 31 Dec 2010 31 Dec 2009 Net debt -1 525 -1 752 Liquid assets 498 491 Financial debt -2 023 -2 243 Net Debt (€ million) Net Debt/REBITDA 2 443 2 500 3.5 3.3x 3.0 2 000 1 915 2.6x 1 752 2.5x 2.5 1 525 1 500 2.1x 2.0 1.5 1 000 1
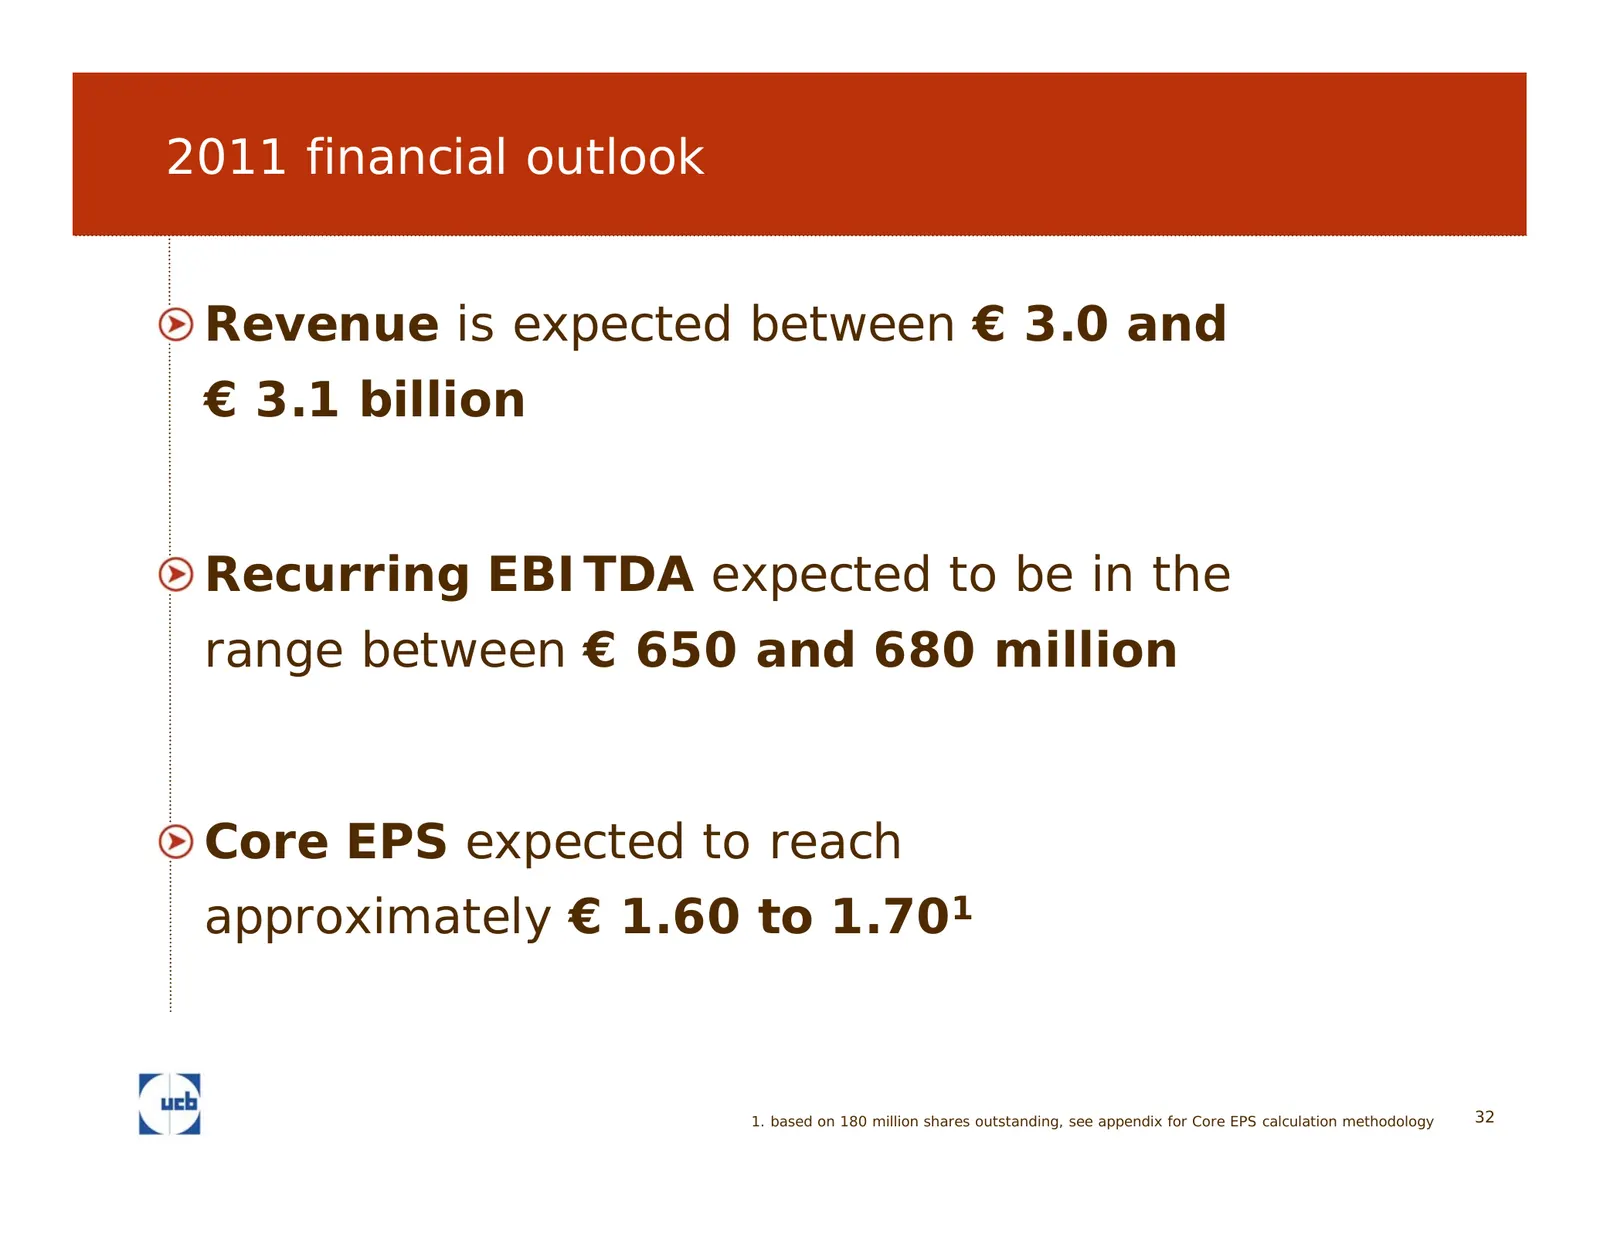
Slide 32: 2011 financial outlook
2011 financial outlook Revenue is expected between € 3.0 and € 3.1 billion Recurring EBITDA expected to be in the range between € 650 and 680 million Core EPS expected to reach approximately € 1.60 to 1.701 1. based on 180 million shares outstanding, see appendix for Core EPS calculation methodology

Slide 33: Advancing the pipeline
Advancing the pipeline Esperanza, living with RLS
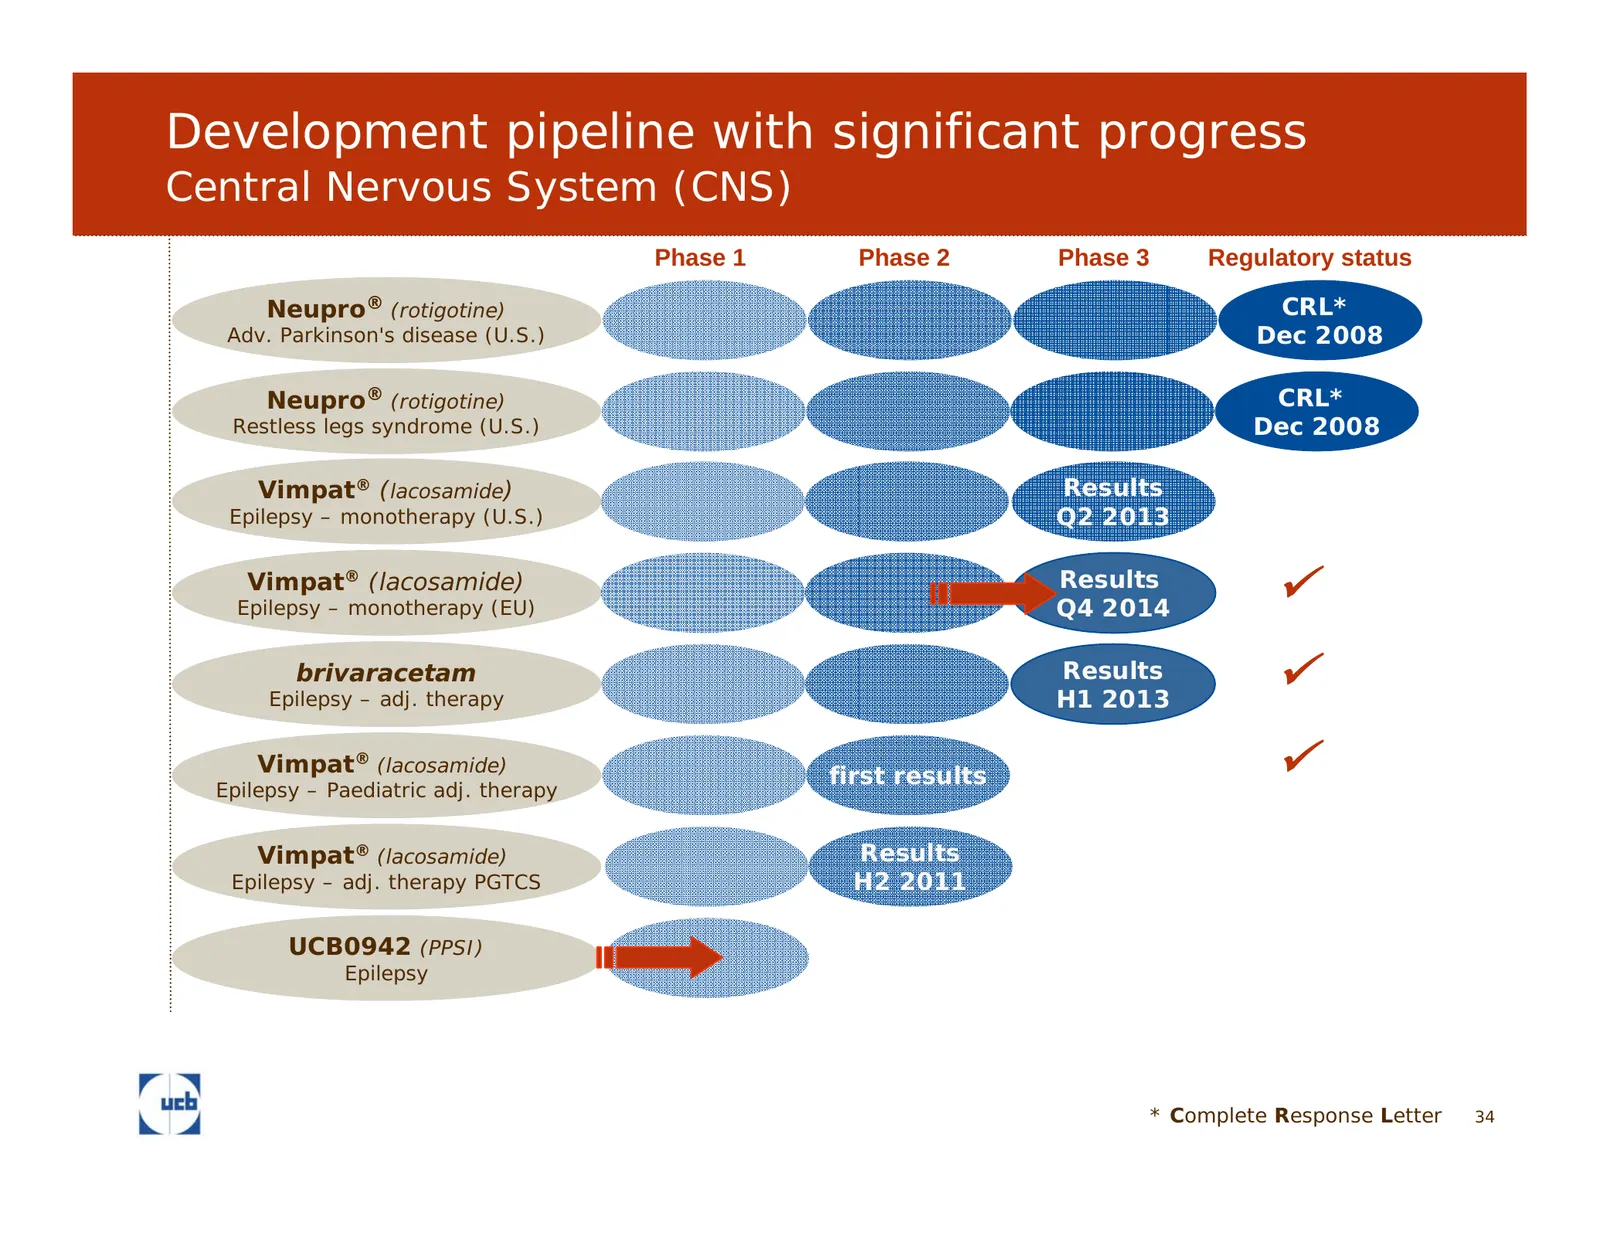
Slide 34: Development pipeline with significant progress: CNS
Development pipeline with significant progress Central Nervous System (CNS) Phase 1 Phase 2 Phase 3 Regulatory status Neupro® (rotigotine) Filed CRL* Adv. Parkinson's disease (U.S.) November Dec 20082008 Neupro® (rotigotine) CRL* Restless legs syndrome (U.S.) Dec 2008 Vimpat® (lacosamide) Results Ep
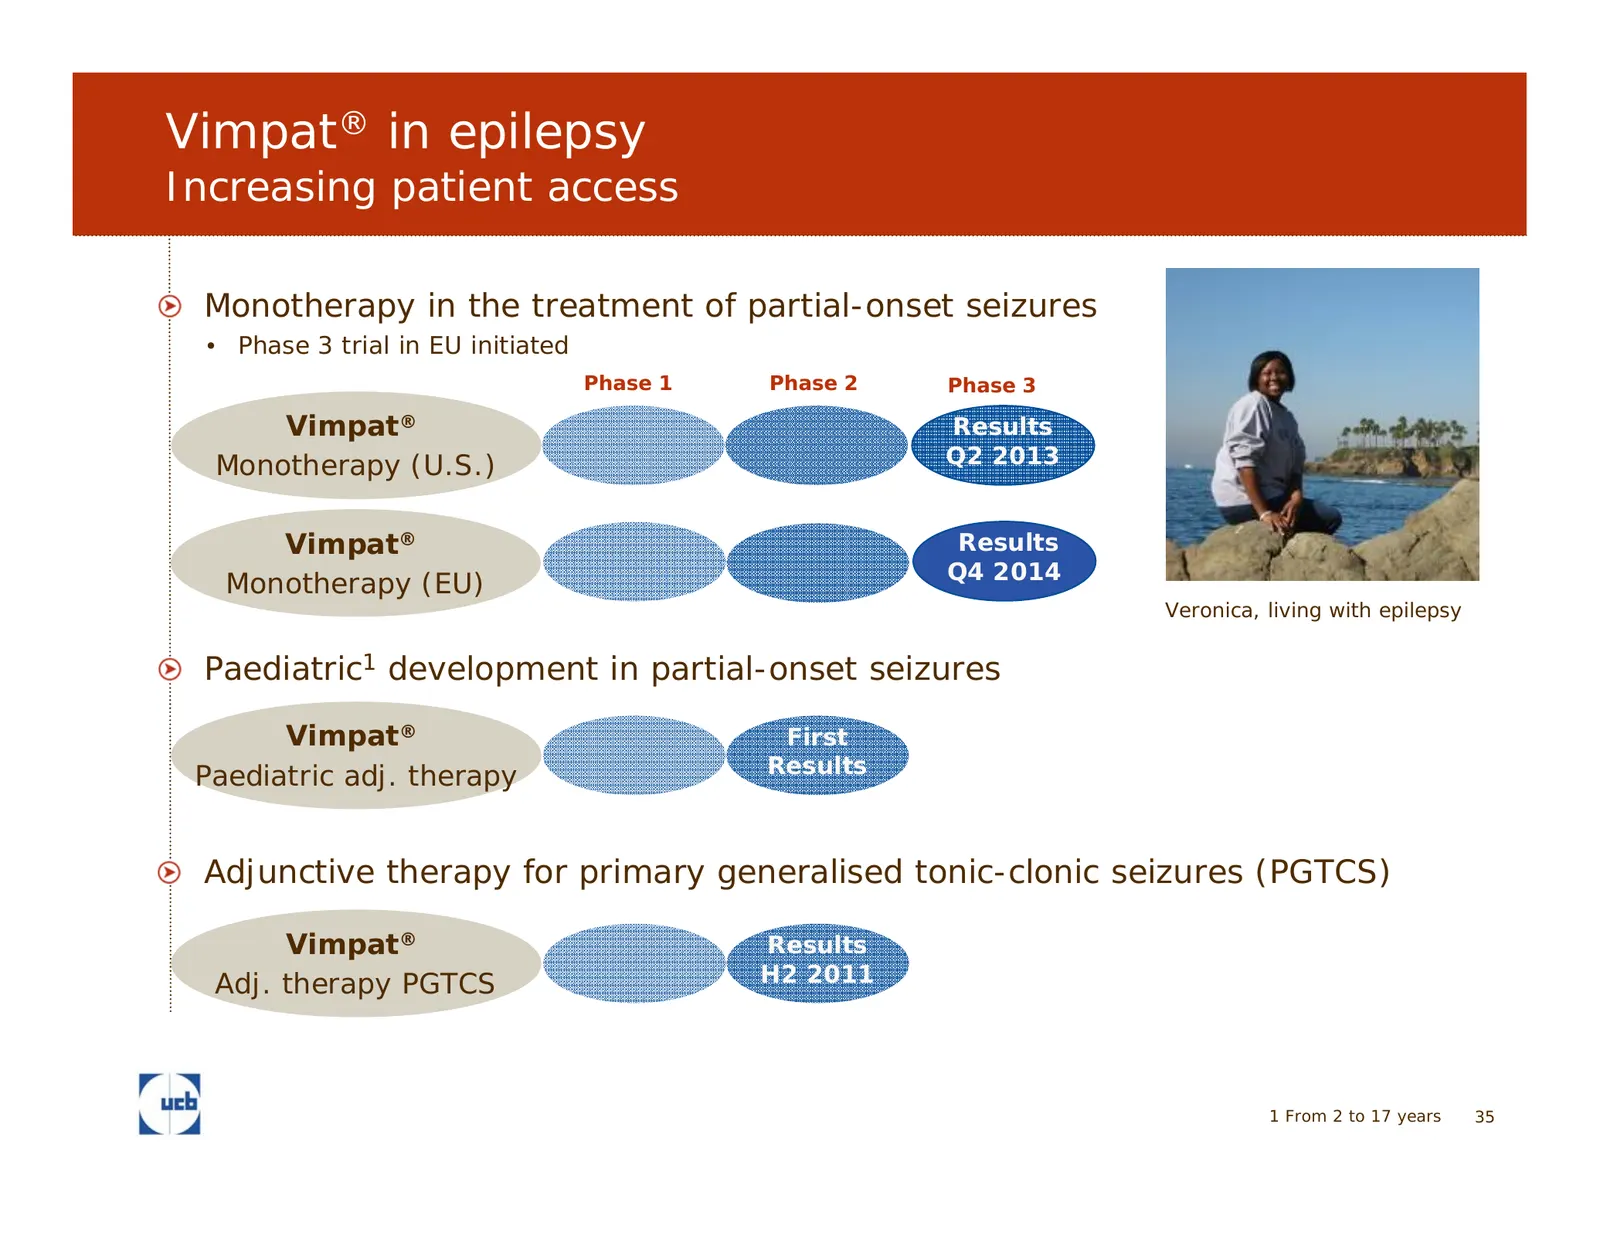
Slide 35: Vimpat in epilepsy: increasing patient access
Vimpat® in epilepsy Increasing patient access Monotherapy in the treatment of partial-onset seizures • Phase 3 trial in EU initiated Phase 1 Phase 2 Phase 3 Vimpat® Results Monotherapy (U.S.) Q2 2013 Vimpat® Results Q4 2014 Monotherapy (EU) Veronica, living with epilepsy Paediatric1 development in p
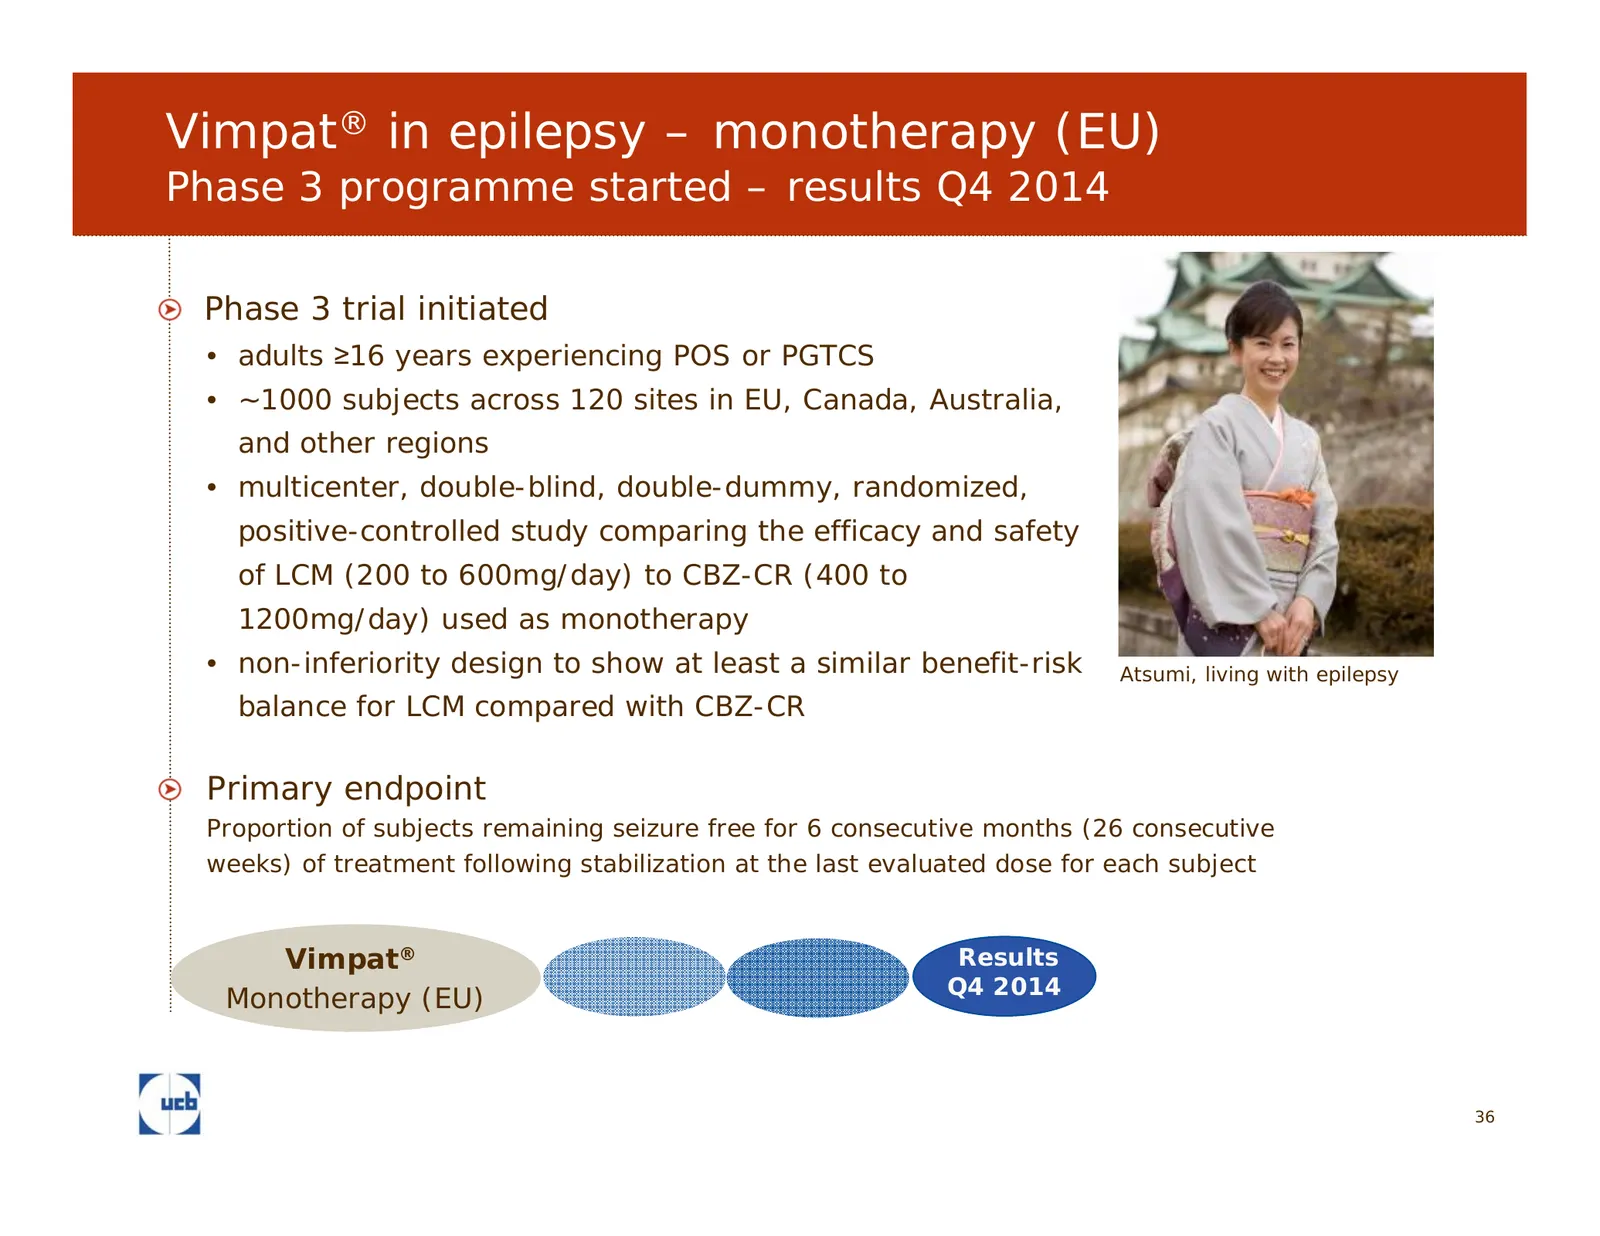
Slide 36: Vimpat in epilepsy – monotherapy (EU)
Vimpat® in epilepsy – monotherapy (EU) Phase 3 programme started – results Q4 2014 Phase 3 trial initiated • adults ≥16 years experiencing POS or PGTCS • ~1000 subjects across 120 sites in EU, Canada, Australia, and other regions • multicenter, double-blind, double-dummy, randomized, positive-contro
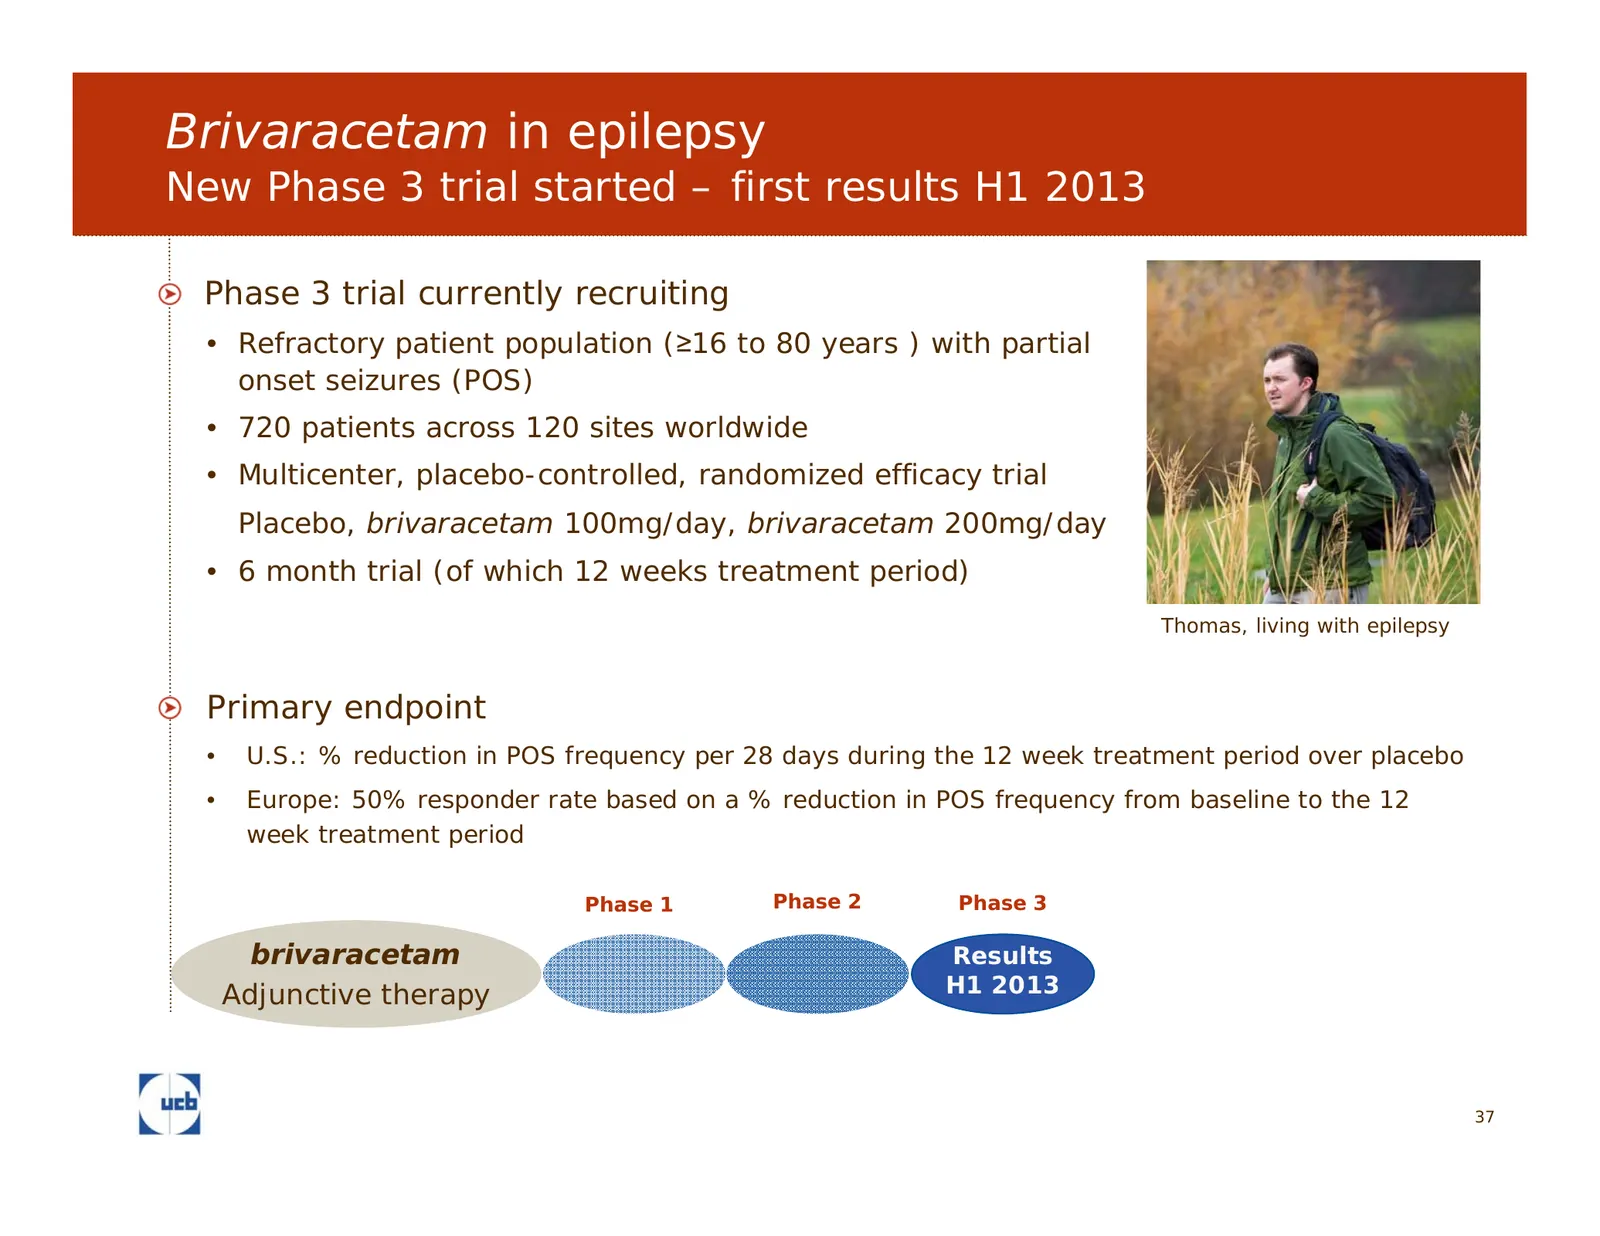
Slide 37: Brivaracetam in epilepsy
Brivaracetam in epilepsy New Phase 3 trial started – first results H1 2013 Phase 3 trial currently recruiting • Refractory patient population (≥16 to 80 years ) with partial onset seizures (POS) • 720 patients across 120 sites worldwide • Multicenter, placebo-controlled, randomized efficacy trial Pl
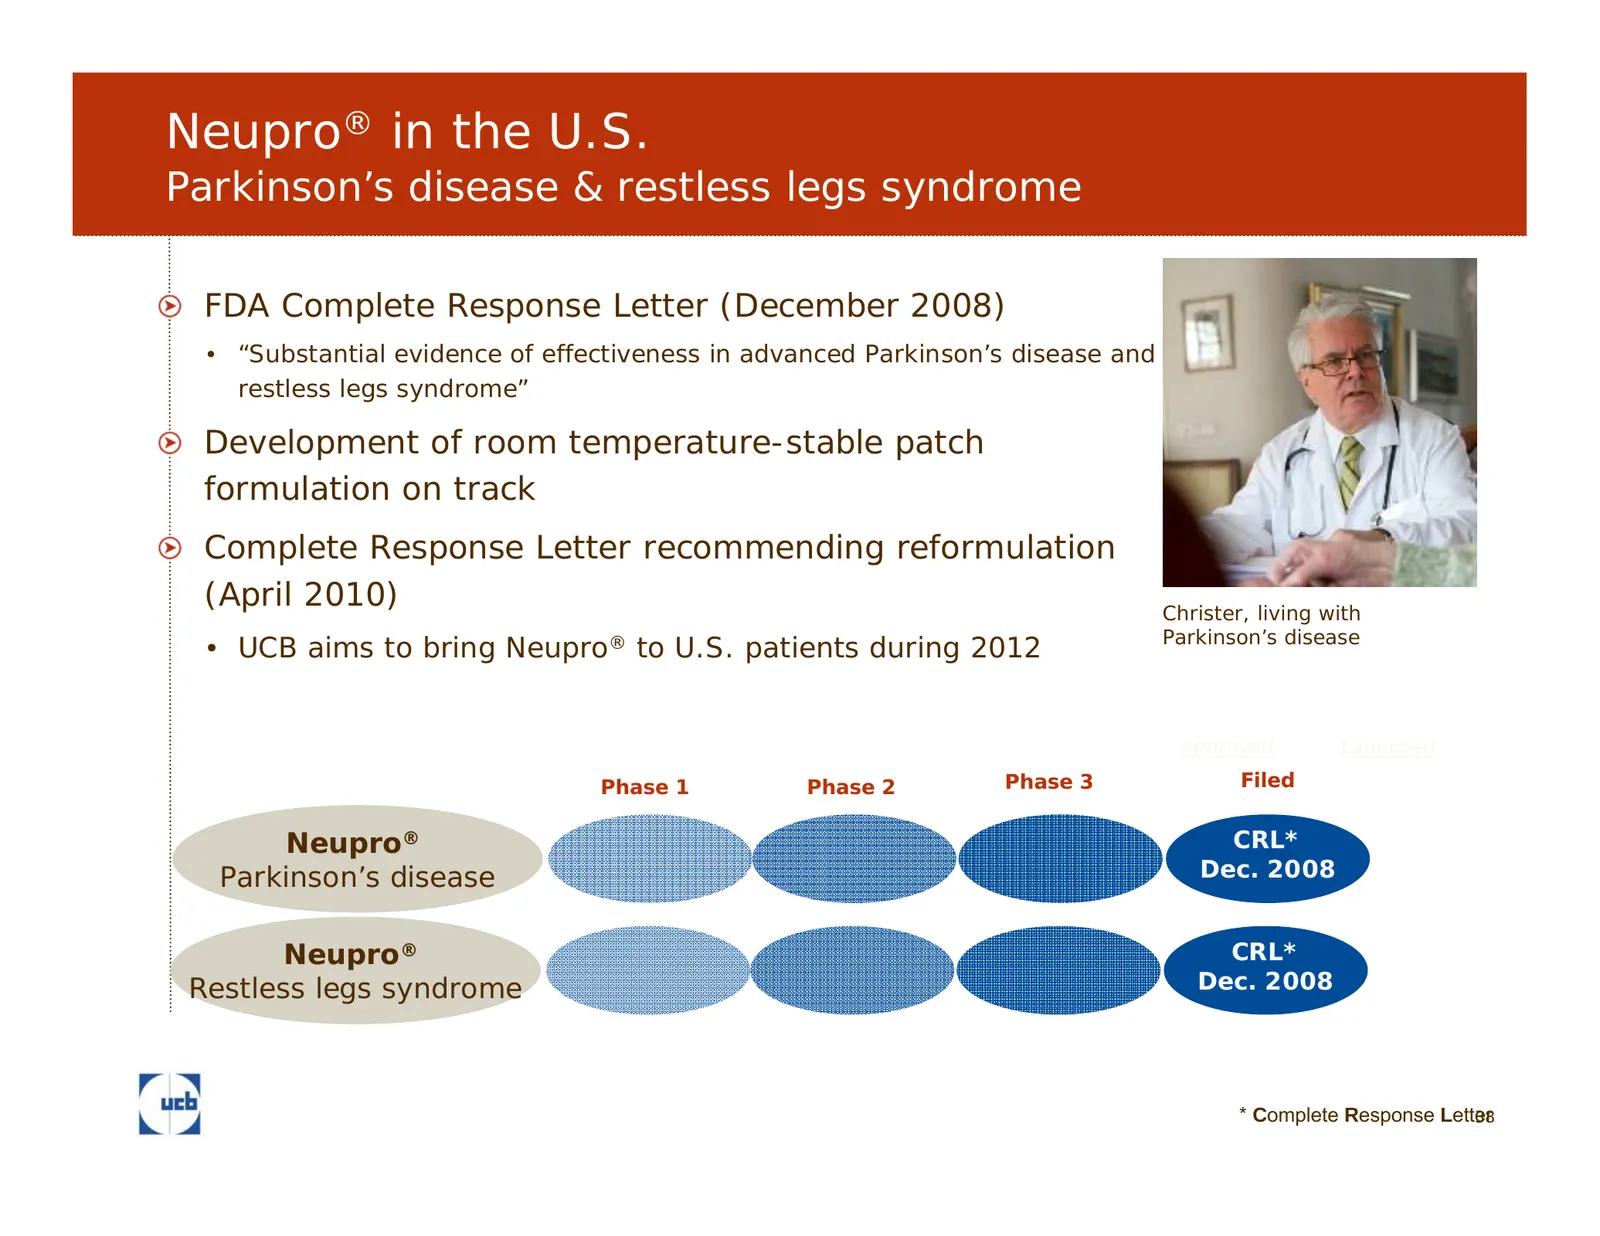
Slide 38: Neupro in the U.S.
Neupro® in the U.S. Parkinson’s disease & restless legs syndrome FDA Complete Response Letter (December 2008) • “Substantial evidence of effectiveness in advanced Parkinson’s disease and restless legs syndrome” Development of room temperature-stable patch formulation on track Complete Response Lette
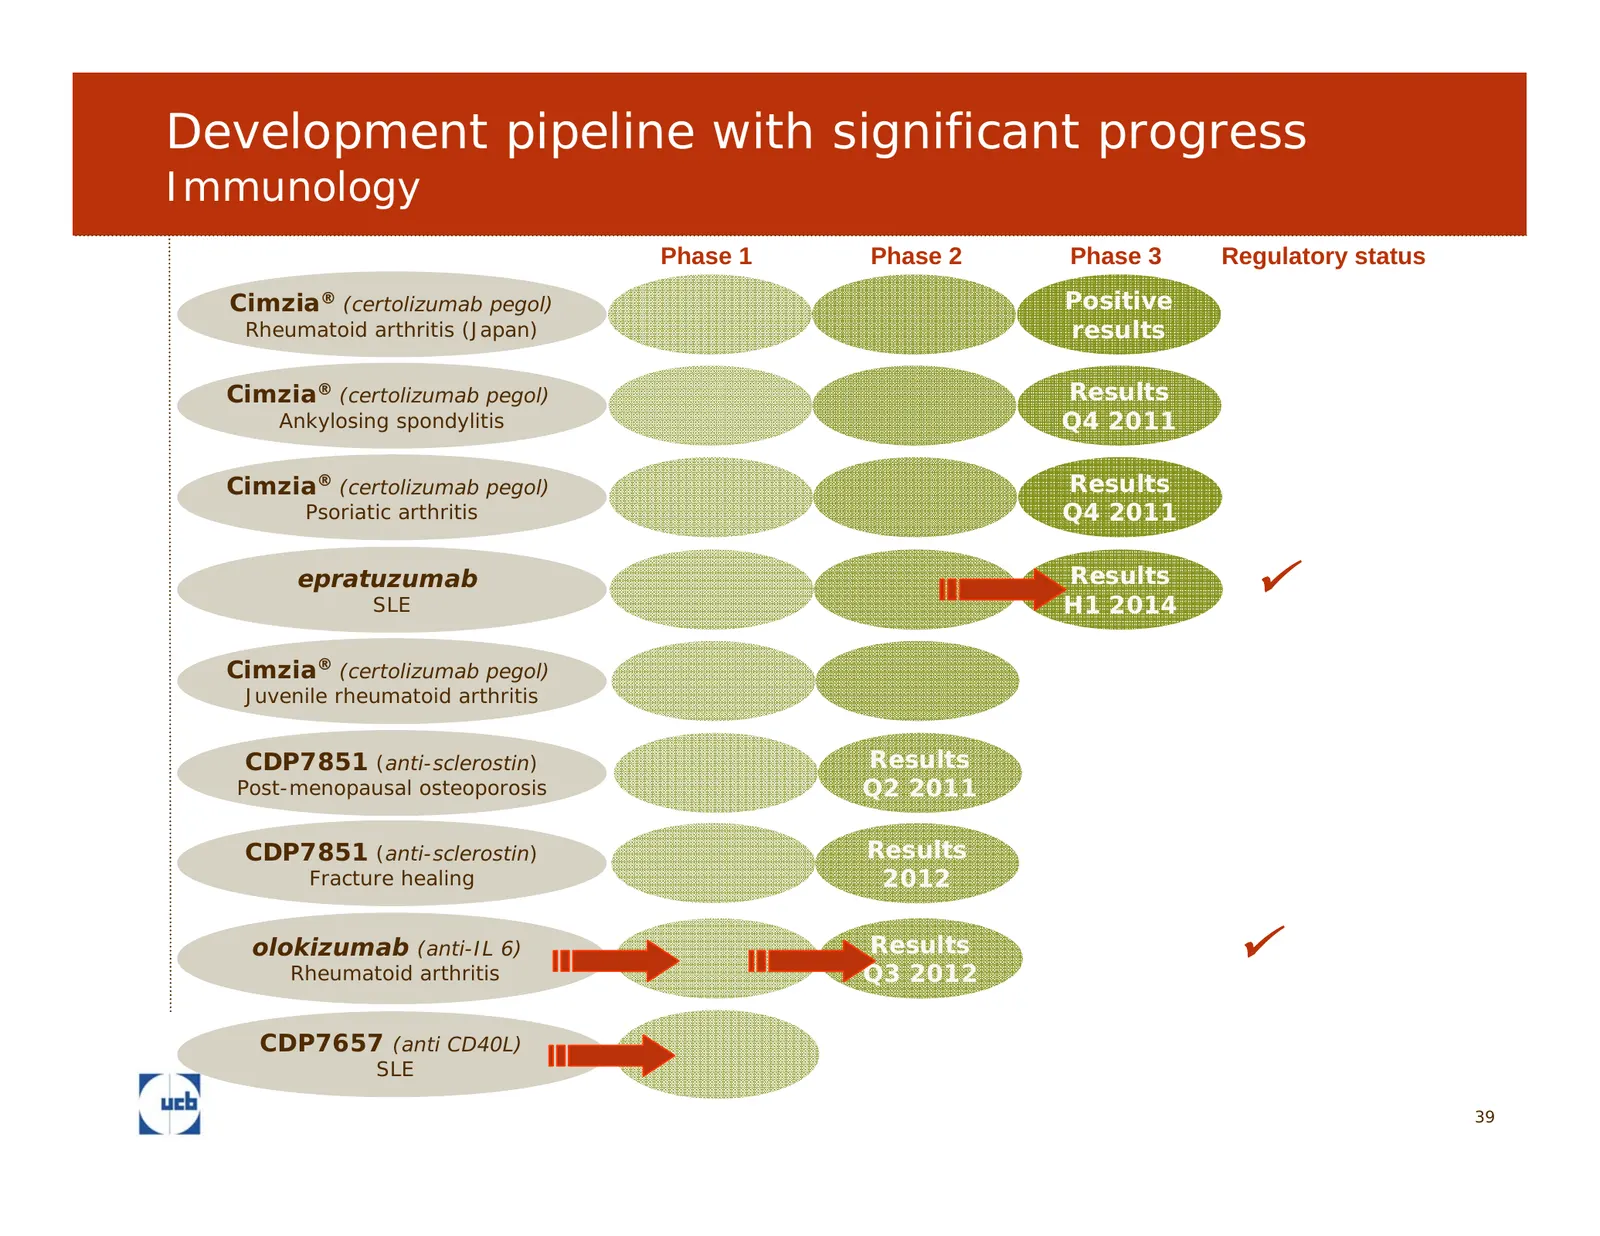
Slide 39: Development pipeline with significant progress: Immunology
Development pipeline with significant progress Immunology Phase 1 Phase 2 Phase 3 Regulatory status Cimzia® (certolizumab pegol) Positive Rheumatoid arthritis (Japan) results Cimzia® (certolizumab pegol) Results Ankylosing spondylitis Q4 2011 Cimzia® (certolizumab pegol) Results Psoriatic arthritis
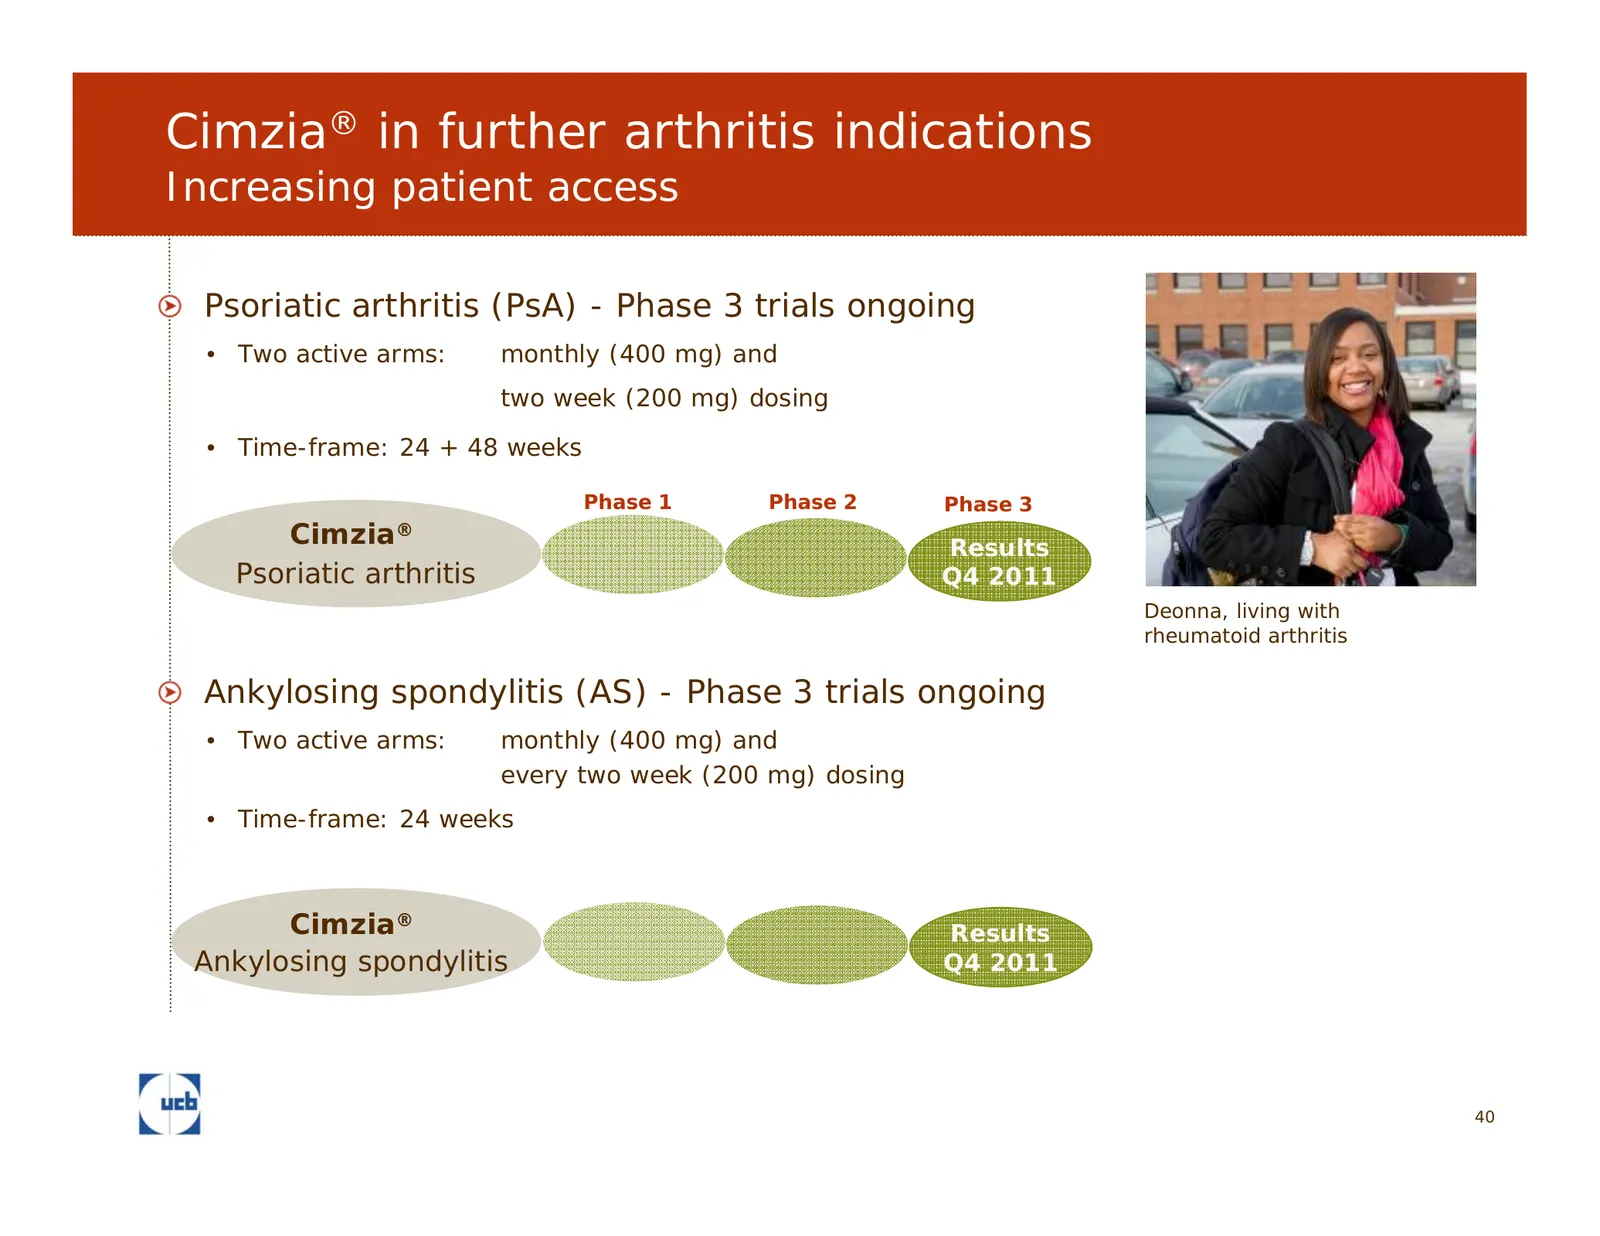
Slide 40: Cimzia in further arthritis indications
Cimzia® in further arthritis indications Increasing patient access Psoriatic arthritis (PsA) - Phase 3 trials ongoing • Two active arms: monthly (400 mg) and two week (200 mg) dosing • Time-frame: 24 + 48 weeks Phase 1 Phase 2 Phase 3 Cimzia® Results Psoriatic arthritis Q4 2011 Deonna, living with r
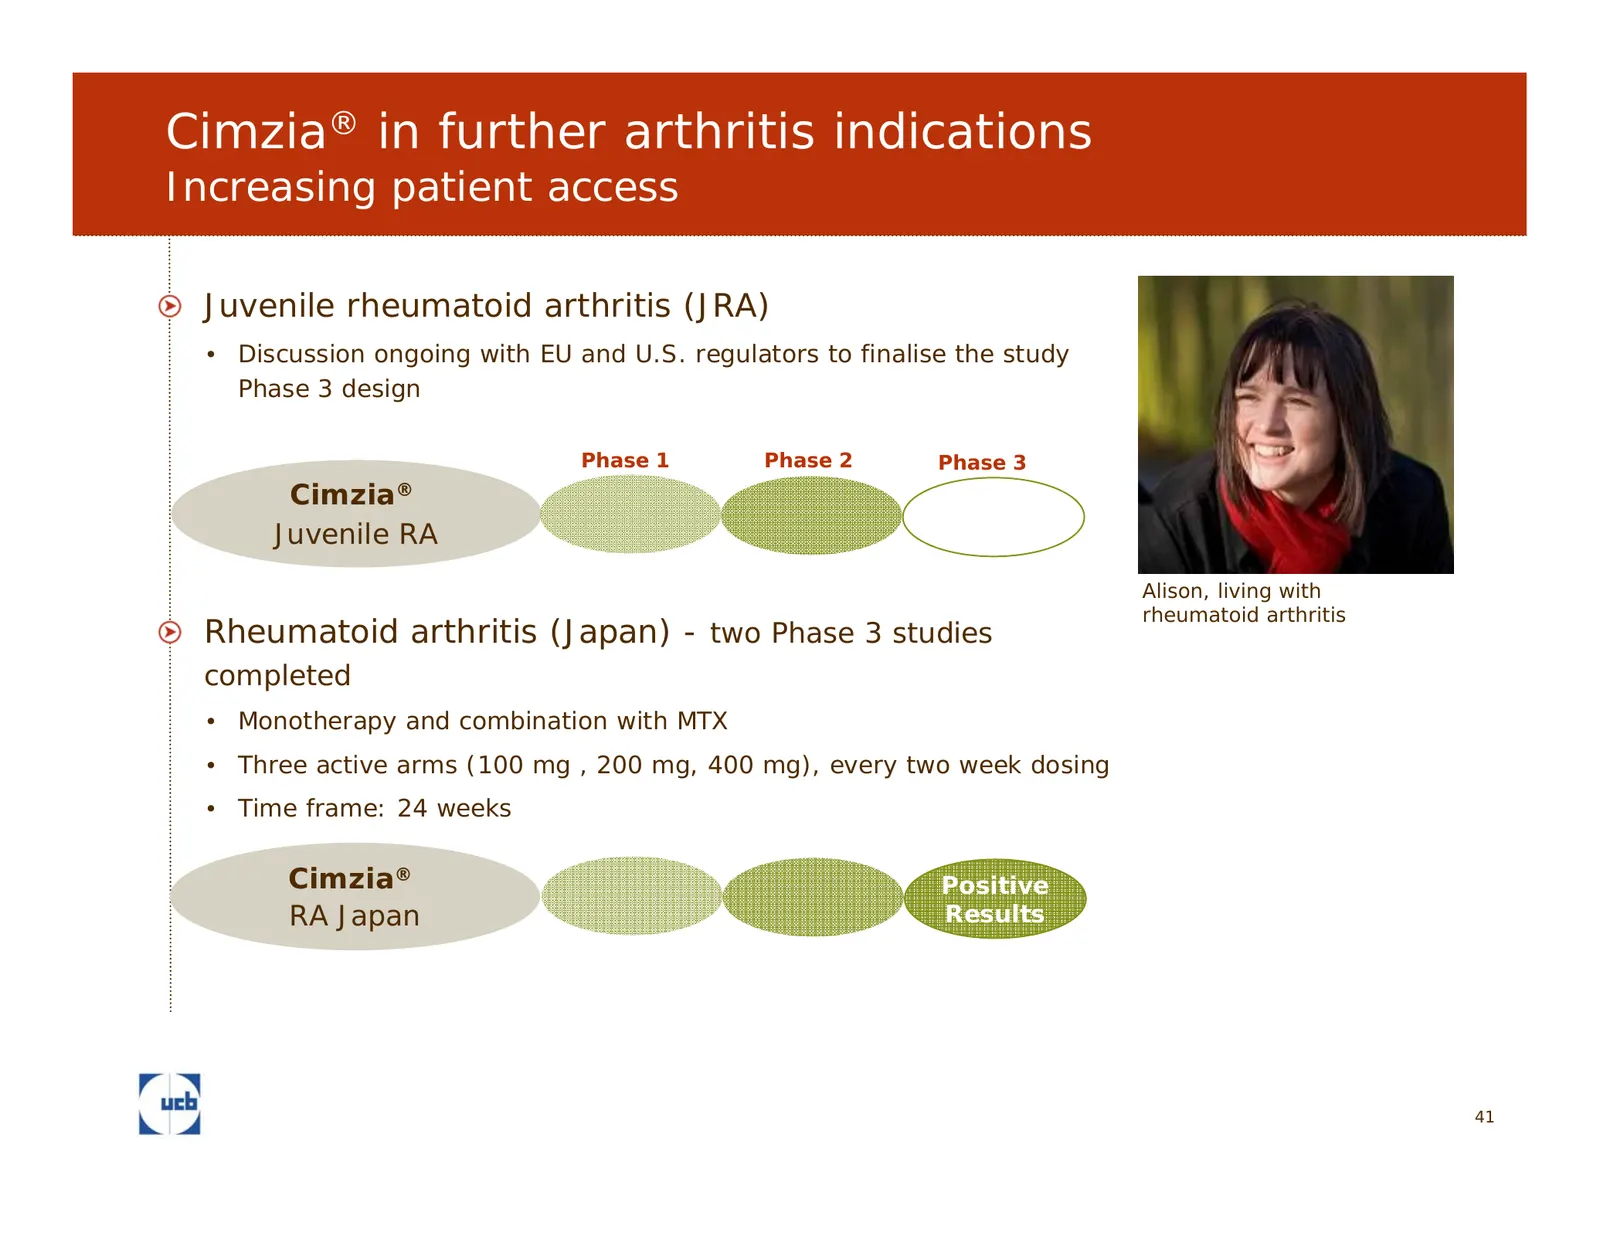
Slide 41: Cimzia in further arthritis indications
Cimzia® in further arthritis indications Increasing patient access Juvenile rheumatoid arthritis (JRA) • Discussion ongoing with EU and U.S. regulators to finalise the study Phase 3 design Phase 1 Phase 2 Phase 3 Cimzia® Juvenile RA Alison, living with rheumatoid arthritis Rheumatoid arthritis (Japa
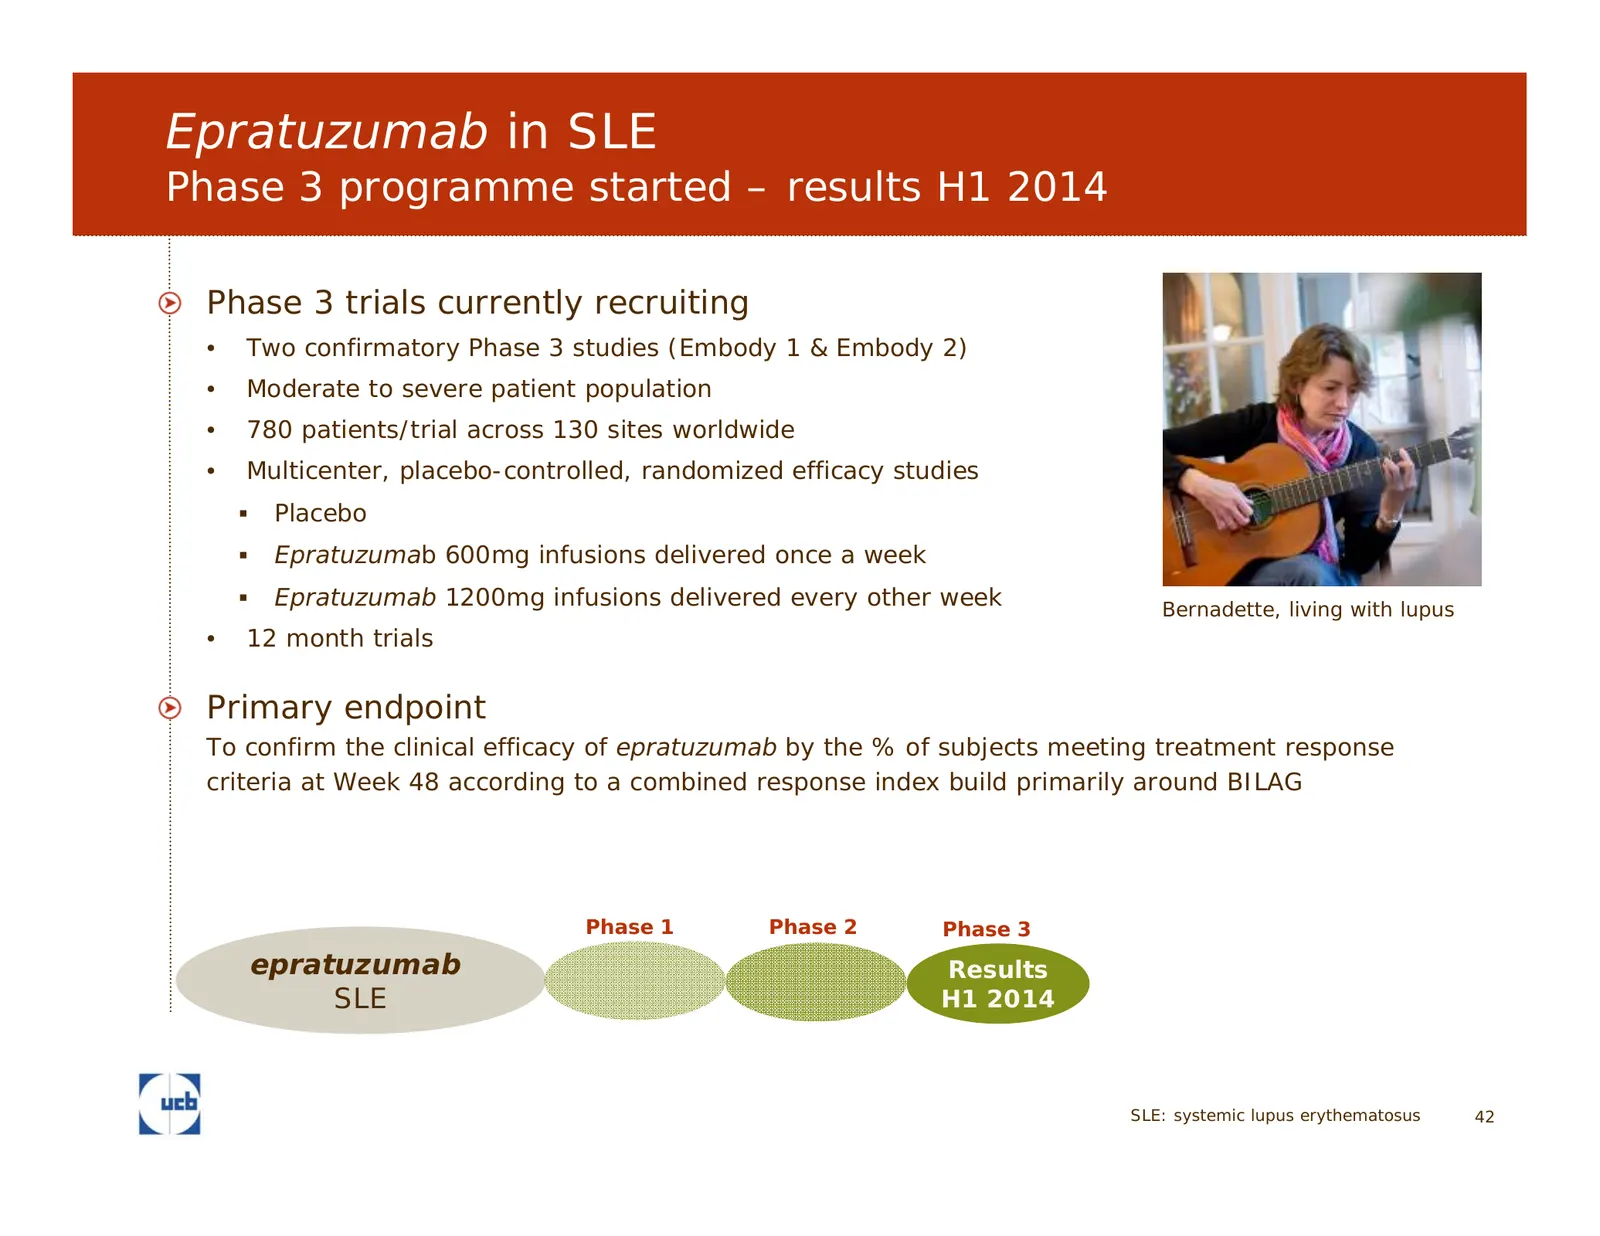
Slide 42: Epratuzumab in SLE
Epratuzumab in SLE Phase 3 programme started – results H1 2014 Phase 3 trials currently recruiting • Two confirmatory Phase 3 studies (Embody 1 & Embody 2) • Moderate to severe patient population • 780 patients/trial across 130 sites worldwide • Multicenter, placebo-controlled, randomized efficacy s
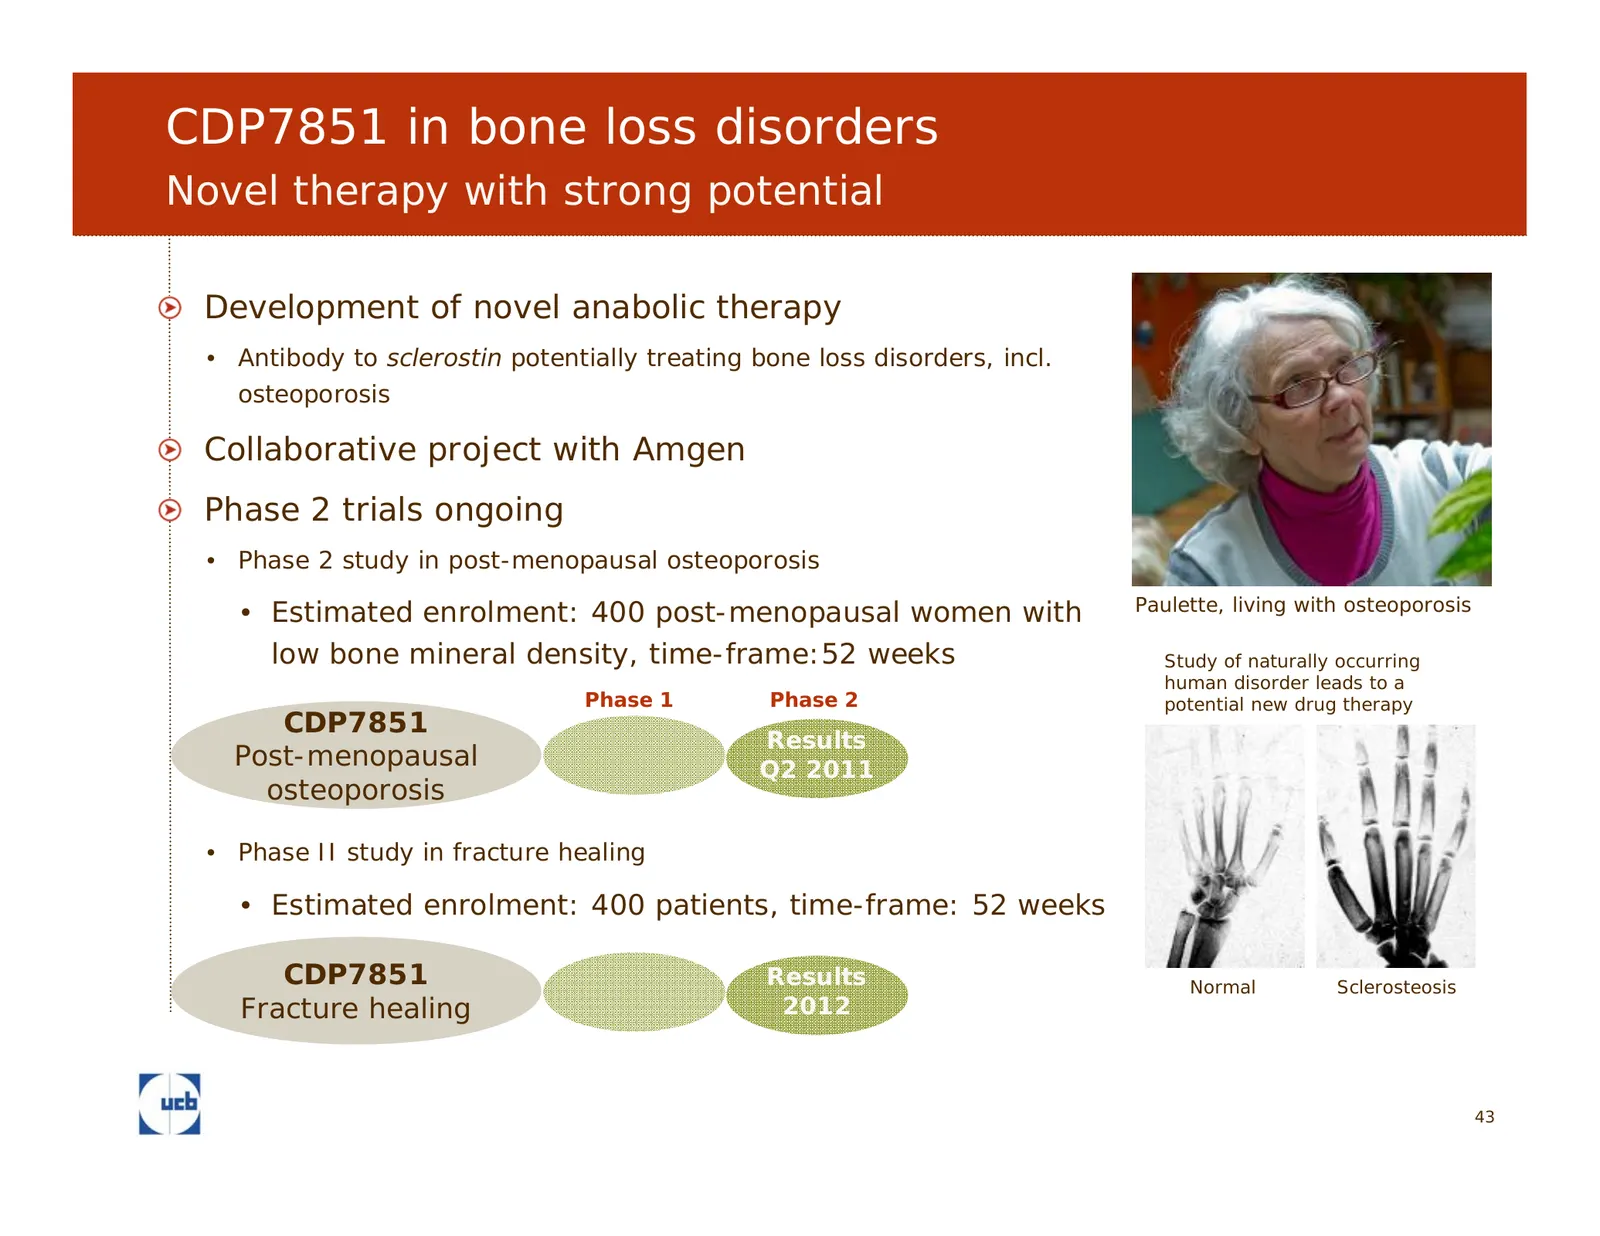
Slide 43: CDP7851 in bone loss disorders
CDP7851 in bone loss disorders Novel therapy with strong potential Development of novel anabolic therapy • Antibody to sclerostin potentially treating bone loss disorders, incl. osteoporosis Collaborative project with Amgen Phase 2 trials ongoing • Phase 2 study in post-menopausal osteoporosis • Est
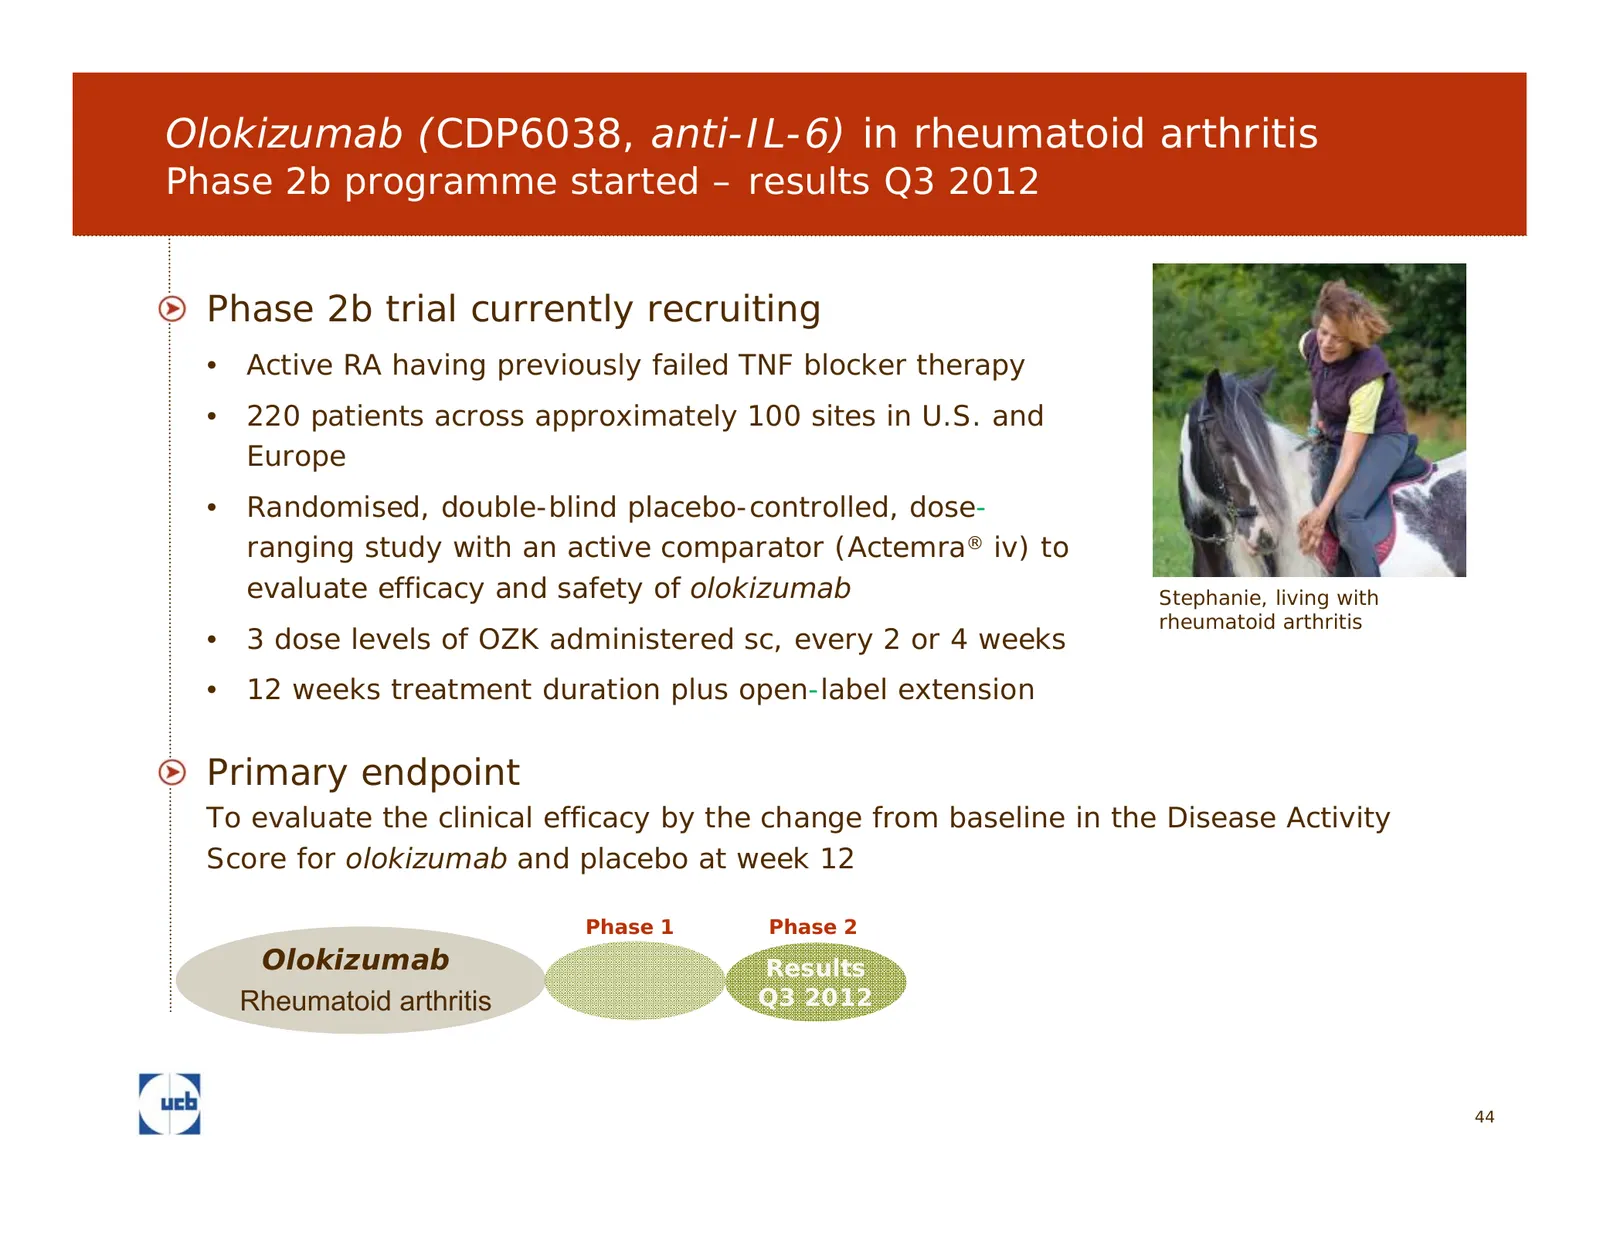
Slide 44: Olokizumab in rheumatoid arthritis
Olokizumab (CDP6038, anti-IL-6) in rheumatoid arthritis Phase 2b programme started – results Q3 2012 Phase 2b trial currently recruiting • Active RA having previously failed TNF blocker therapy • 220 patients across approximately 100 sites in U.S. and Europe • Randomised, double-blind placebo-contro
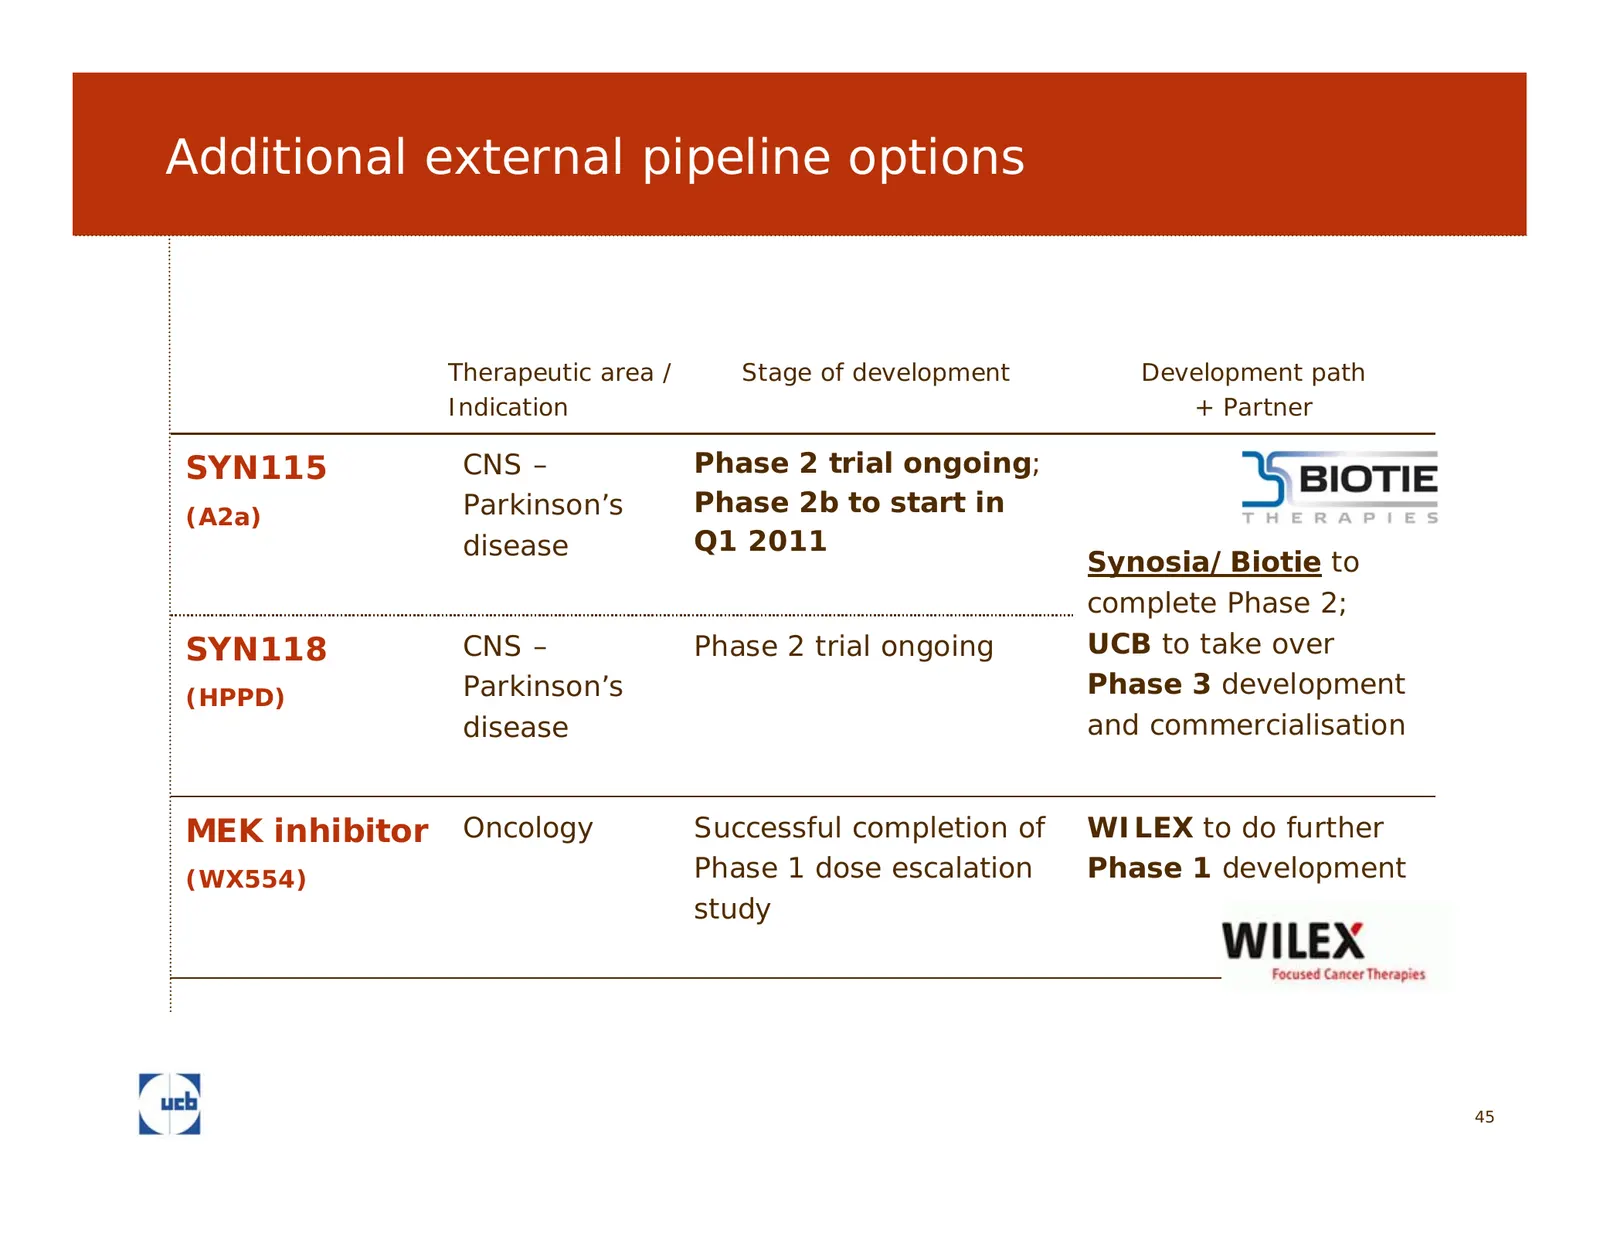
Slide 45: Additional external pipeline options
Additional external pipeline options Therapeutic area / Stage of development Development path Indication + Partner SYN115 CNS – Phase 2 trial ongoing; (A2a) Parkinson’s Phase 2b to start in disease Q1 2011 Synosia/Biotie to complete Phase 2; SYN118 CNS – Phase 2 trial ongoing UCB to take over (HPPD)

Slide 46: UCB NewMedicines
UCB NewMedicines 46 Juan, living with restless legs syndrome 46
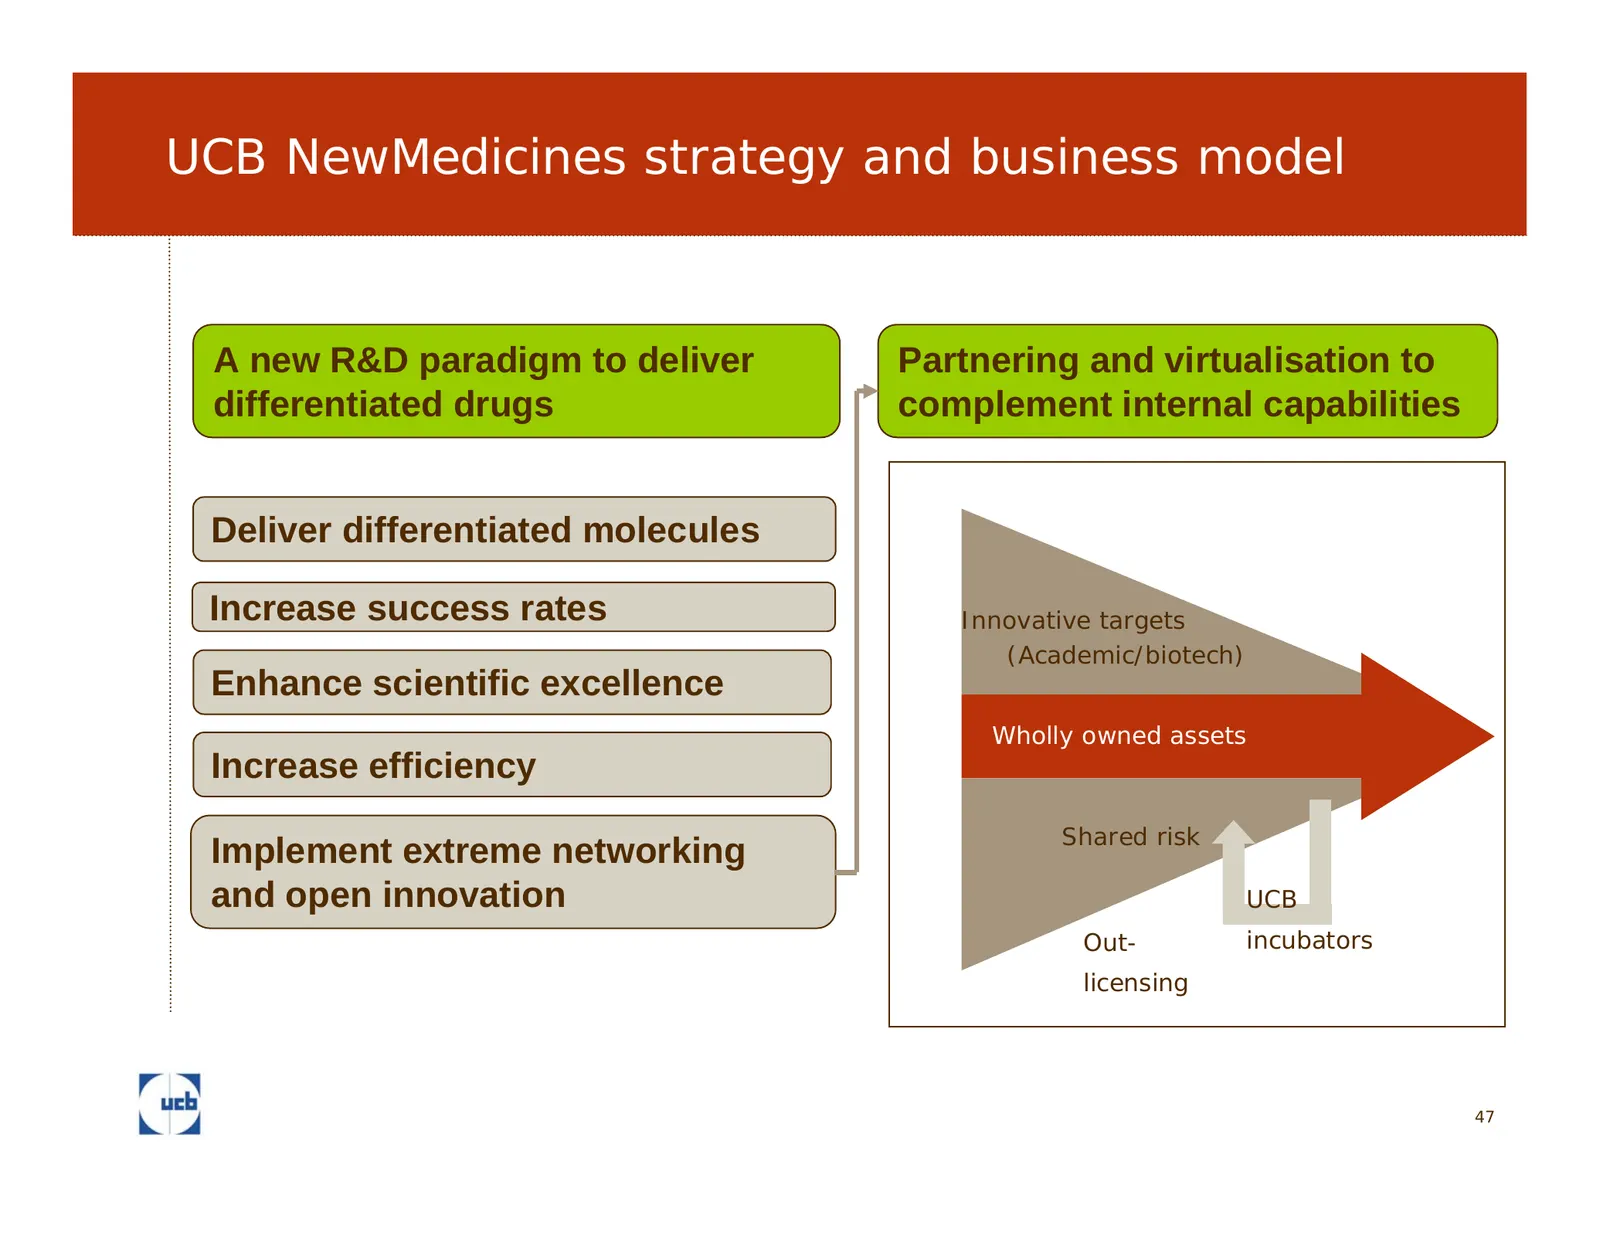
Slide 47: UCB NewMedicines strategy and business model
UCB NewMedicines strategy and business model A new R&D paradigm to deliver Partnering and virtualisation to differentiated drugs complement internal capabilities Deliver differentiated molecules Increase success rates Innovative targets (Academic/biotech) Enhance scientific excellence SEGMENTED Whol
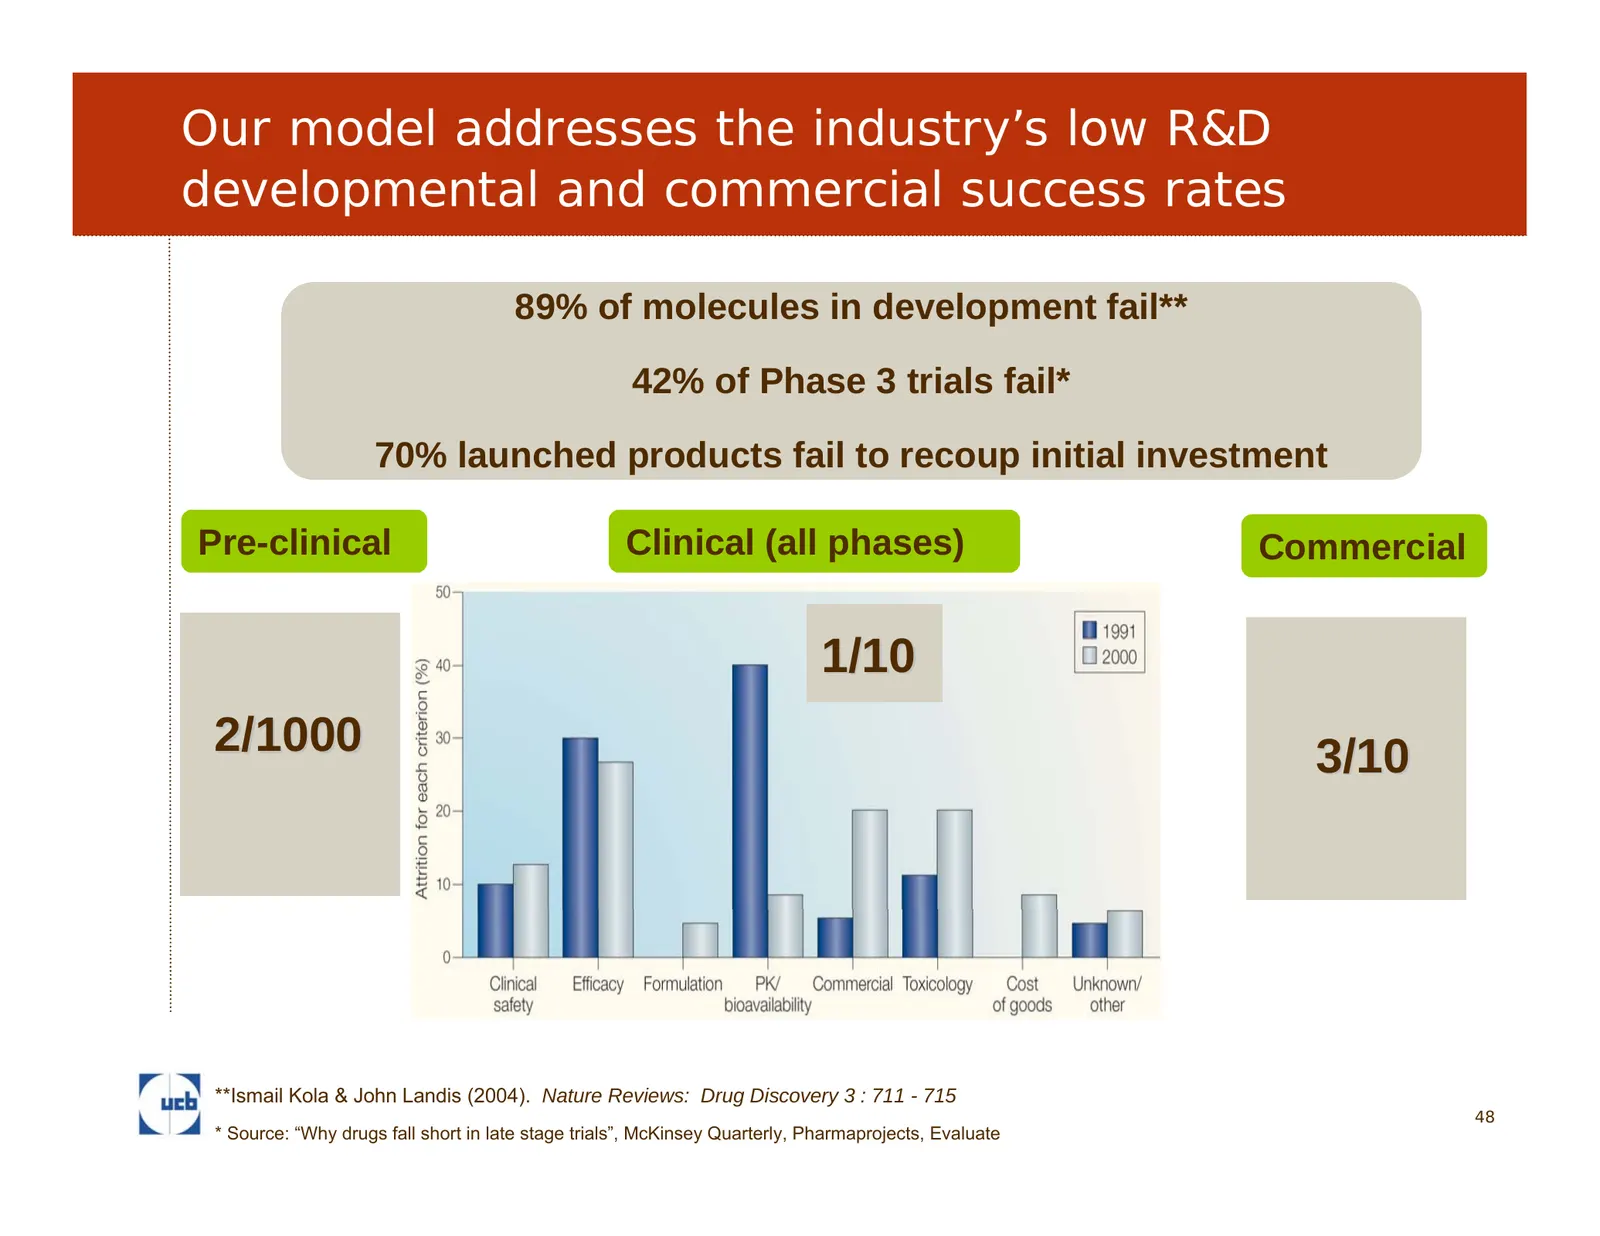
Slide 48: Our model addresses the industry's low R&D success rates
Our model addresses the industry’s low R&D developmental and commercial success rates 89% of molecules in development fail** 42% of Phase 3 trials fail* 70% launched products fail to recoup initial investment Pre-clinical Clinical (all phases) Commercial Reasons for attrition 1/10 2/1000 3/10 **Isma
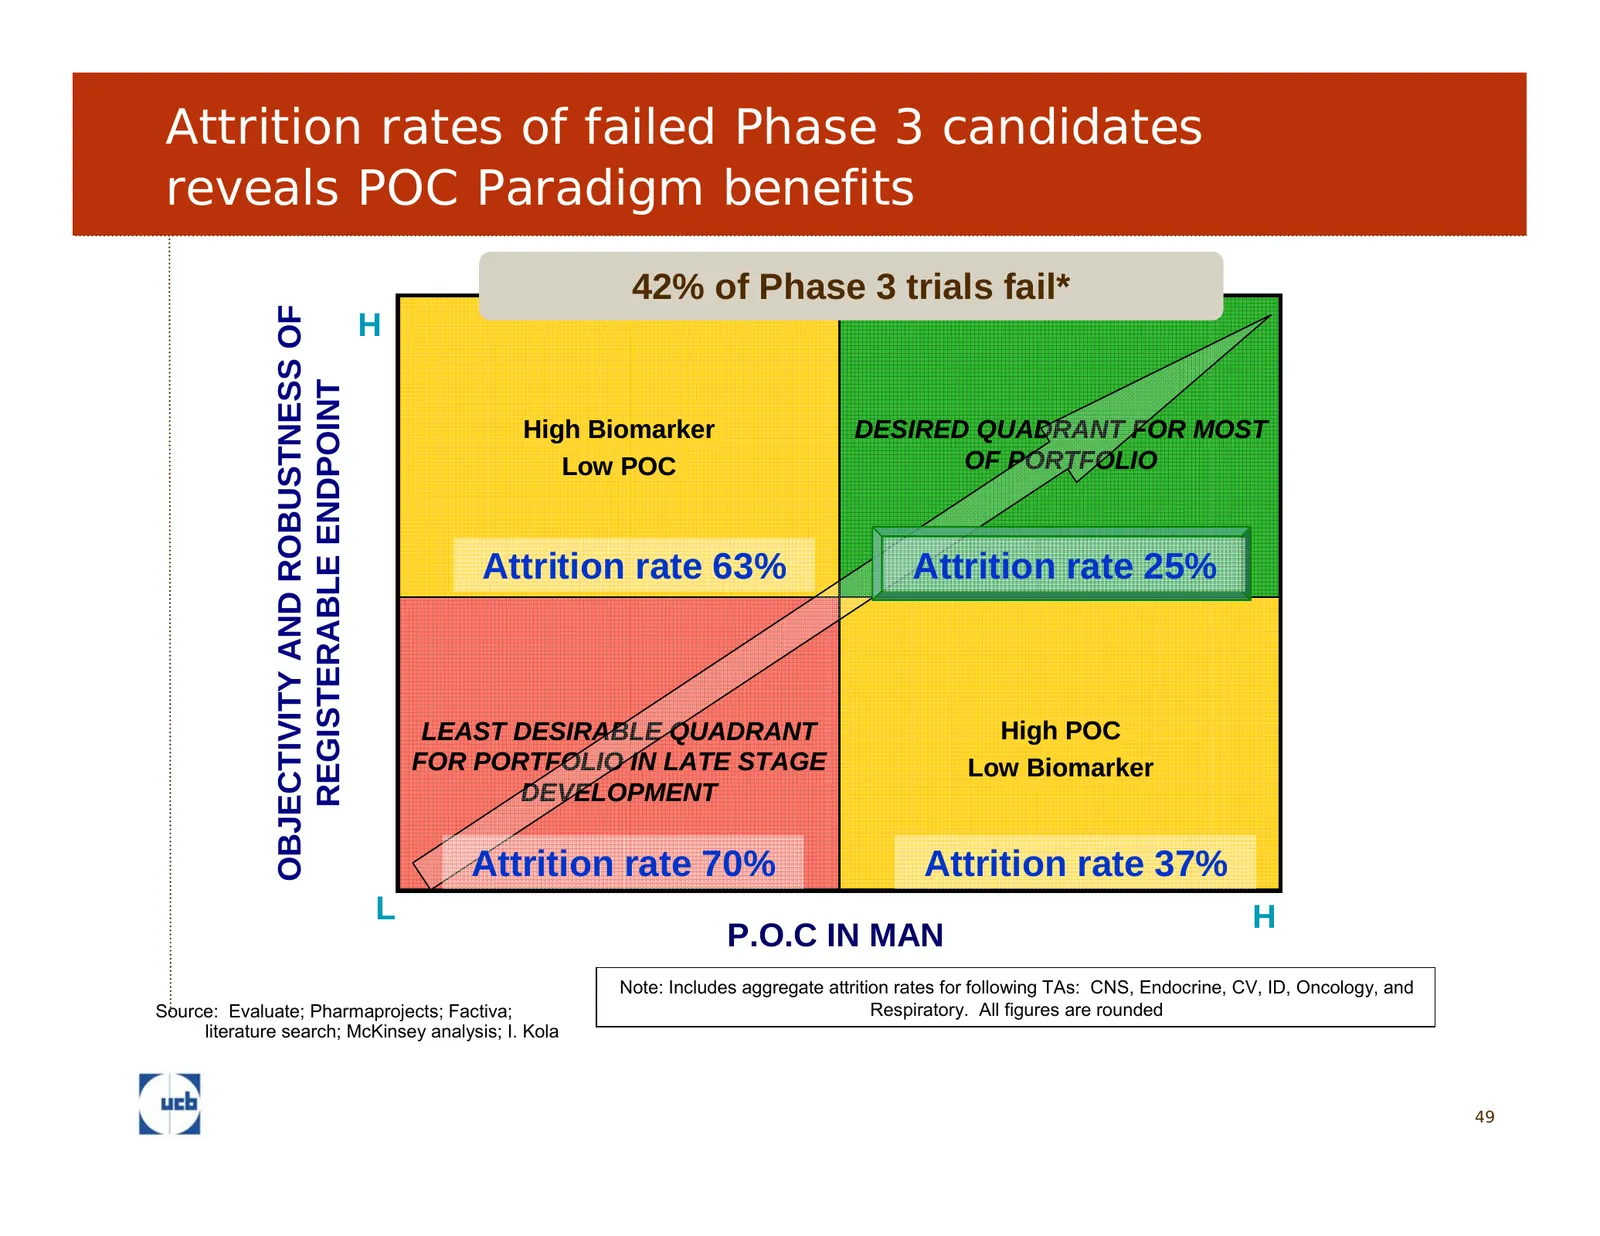
Slide 49: Attrition rates of failed Phase candidates reveal POC paradigm benefits
Attrition rates of failed Phase 3 candidates reveals POC Paradigm benefits OF 42% of Phase 3 trials fail* H ROBUSTNESS ROBUSTNESS ENDPOINT High Biomarker DESIRED QUADRANT FOR MOST OF PORTFOLIO OF BIOMARKER Low POC Attrition rate 63% Attrition rate 25% REGISTERABLE OBJECTIVITY OBJECTIVITY AND AND LEA
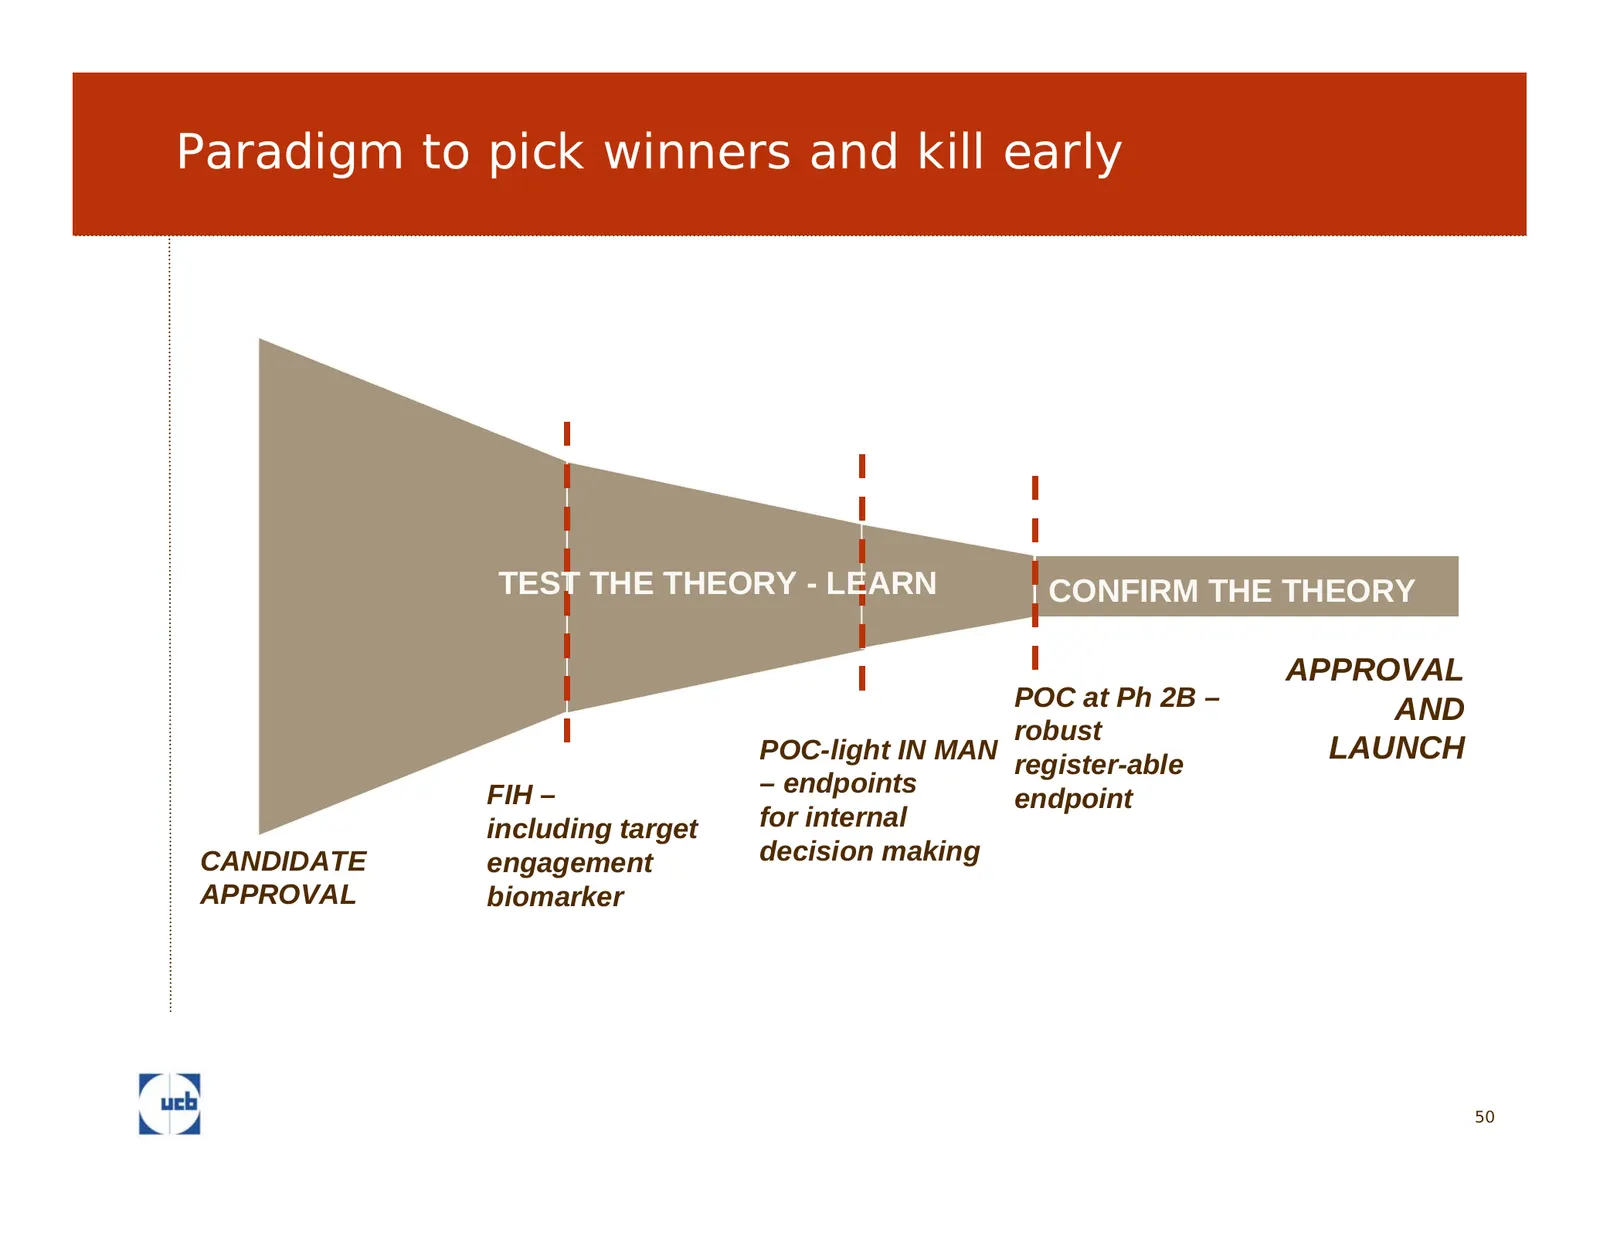
Slide 50: Paradigm to pick winners and kill early
Paradigm to pick winners and kill early TEST THE THEORY - LEARN CONFIRM THE THEORY APPROVAL POC at Ph 2B – AND robust POC-light IN MAN register-able LAUNCH FIH – – endpoints endpoint including target for internal CANDIDATE engagement decision making APPROVAL biomarker 50
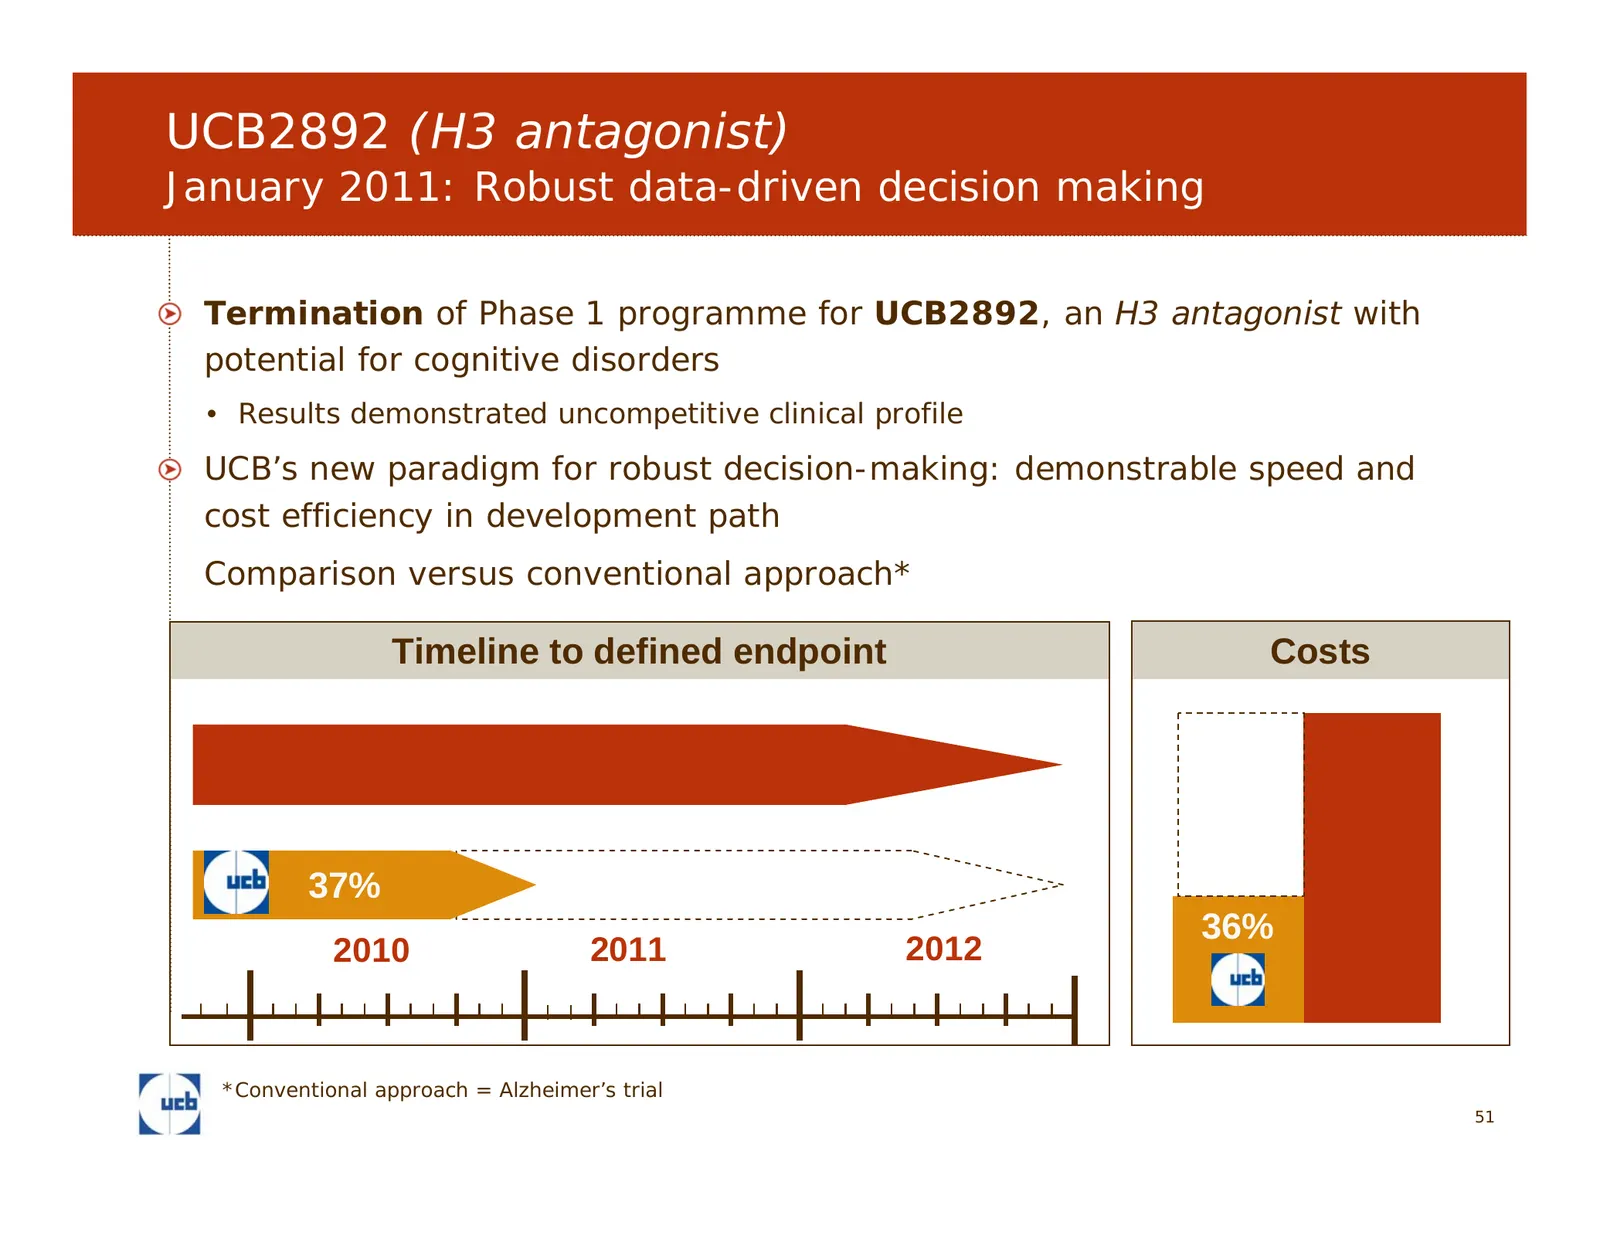
Slide 51: UCB2892 (H3 antagonist)
UCB2892 (H3 antagonist) January 2011: Robust data-driven decision making Termination of Phase 1 programme for UCB2892, an H3 antagonist with potential for cognitive disorders • Results demonstrated uncompetitive clinical profile UCB’s new paradigm for robust decision-making: demonstrable speed and c
Slide 52: UCB is delivering on... to achieve sustainable company growth
UCB is delivering on… Financial targets Core product launches – Cimzia®, Vimpat®, Neupro® Increased patient reach Strong pipeline … to achieve sustainable company growth 52
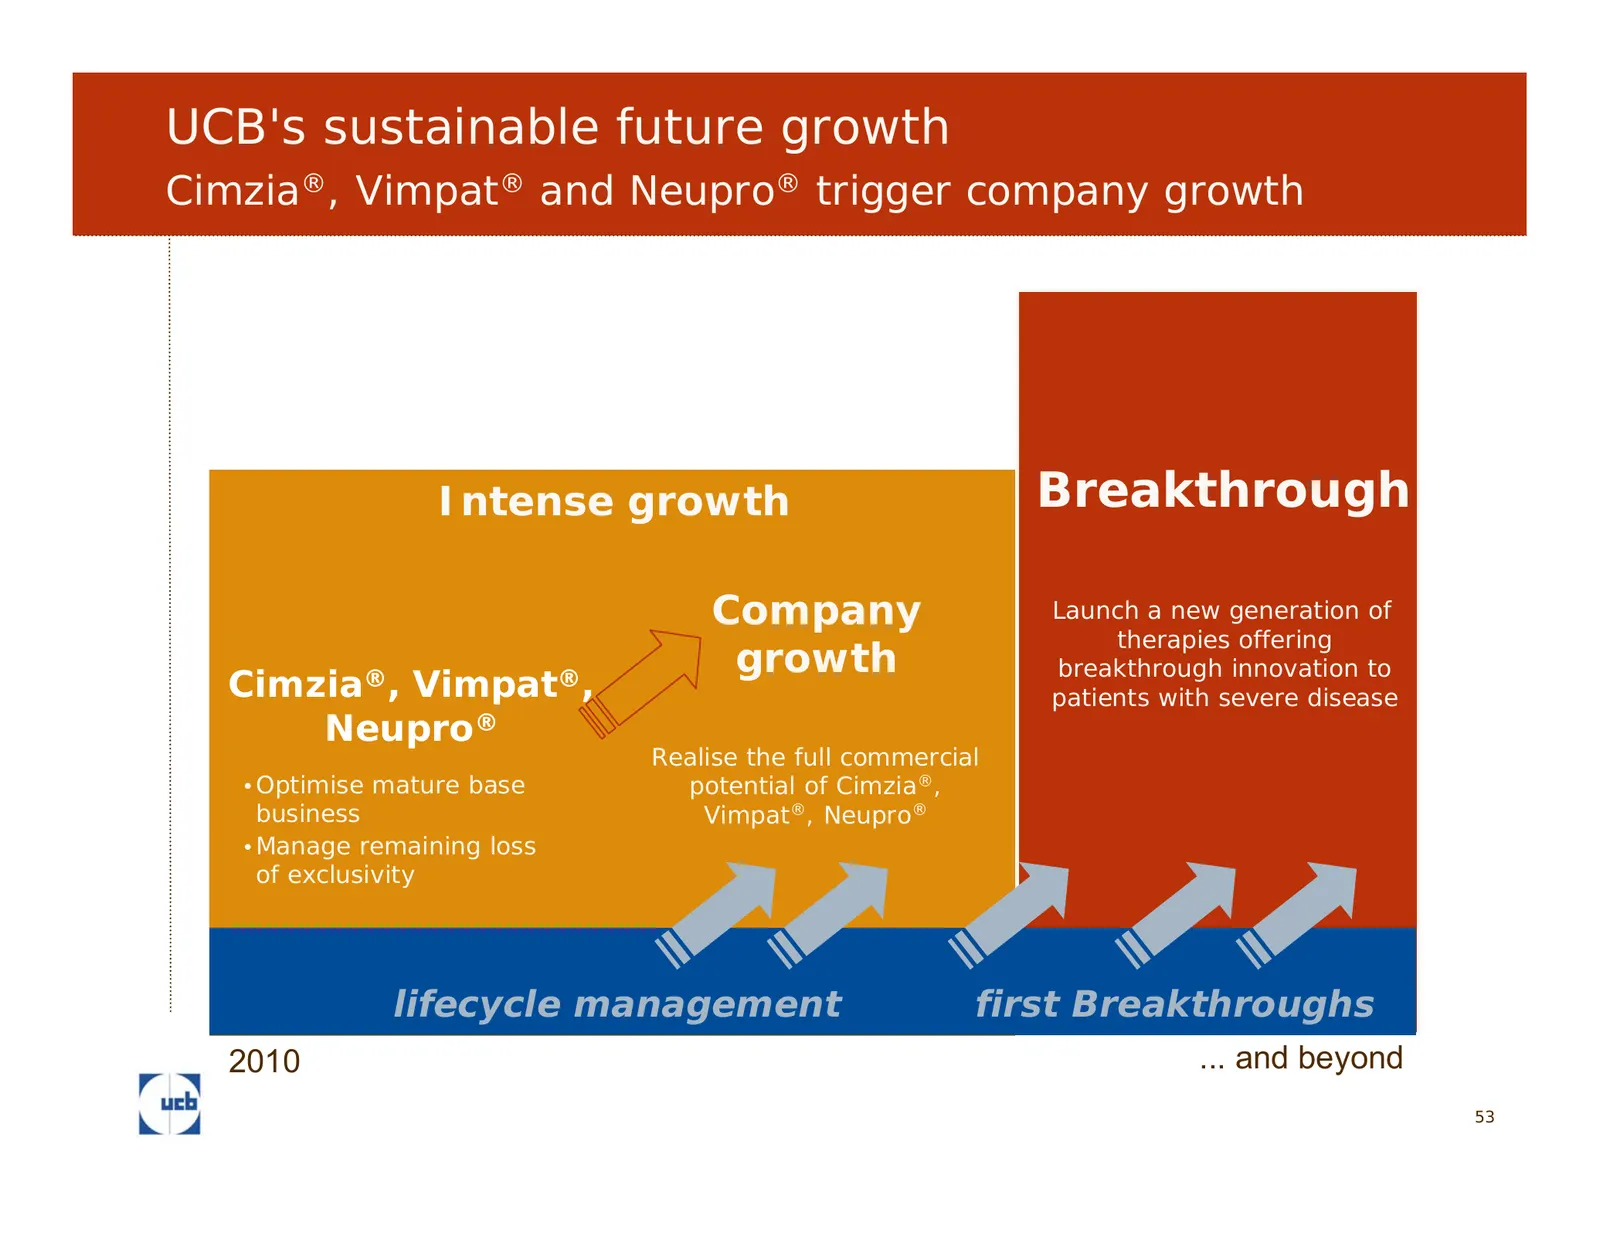
Slide 53: UCB's sustainable future growth
UCB's sustainable future growth Cimzia®, Vimpat® and Neupro® trigger company growth Intense growth Breakthrough Company Launch a new generation of therapies offering growth breakthrough innovation to Cimzia®, Vimpat®, patients with severe disease Neupro® Realise the full commercial • Optimise mature
Slide 54: Appendix
Appendix 54 54
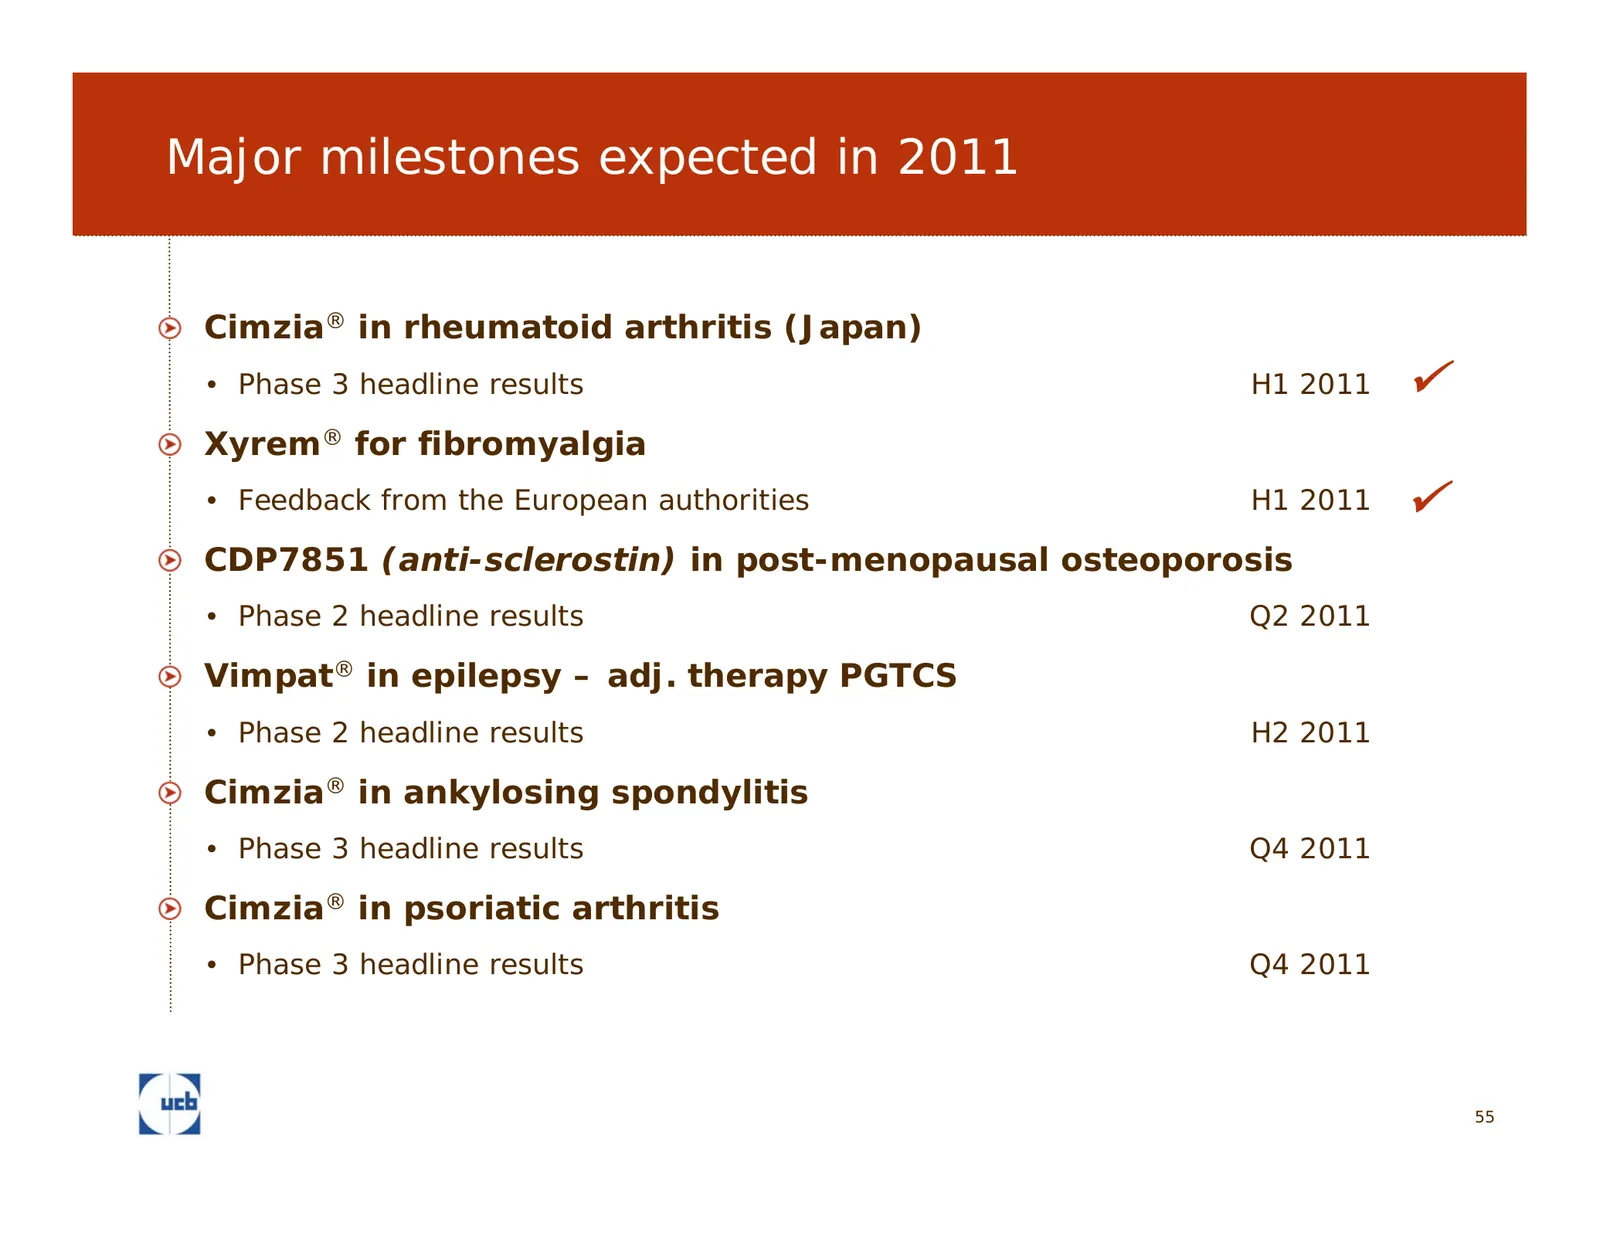
Slide 55: Major milestones expected in 2011
Major milestones expected in 2011 Cimzia® in rheumatoid arthritis (Japan) • Phase 3 headline results H1 2011 9 Xyrem® for fibromyalgia • Feedback from the European authorities H1 2011 9 CDP7851 (anti-sclerostin) in post-menopausal osteoporosis • Phase 2 headline results Q2 2011 Vimpat® in epilepsy –
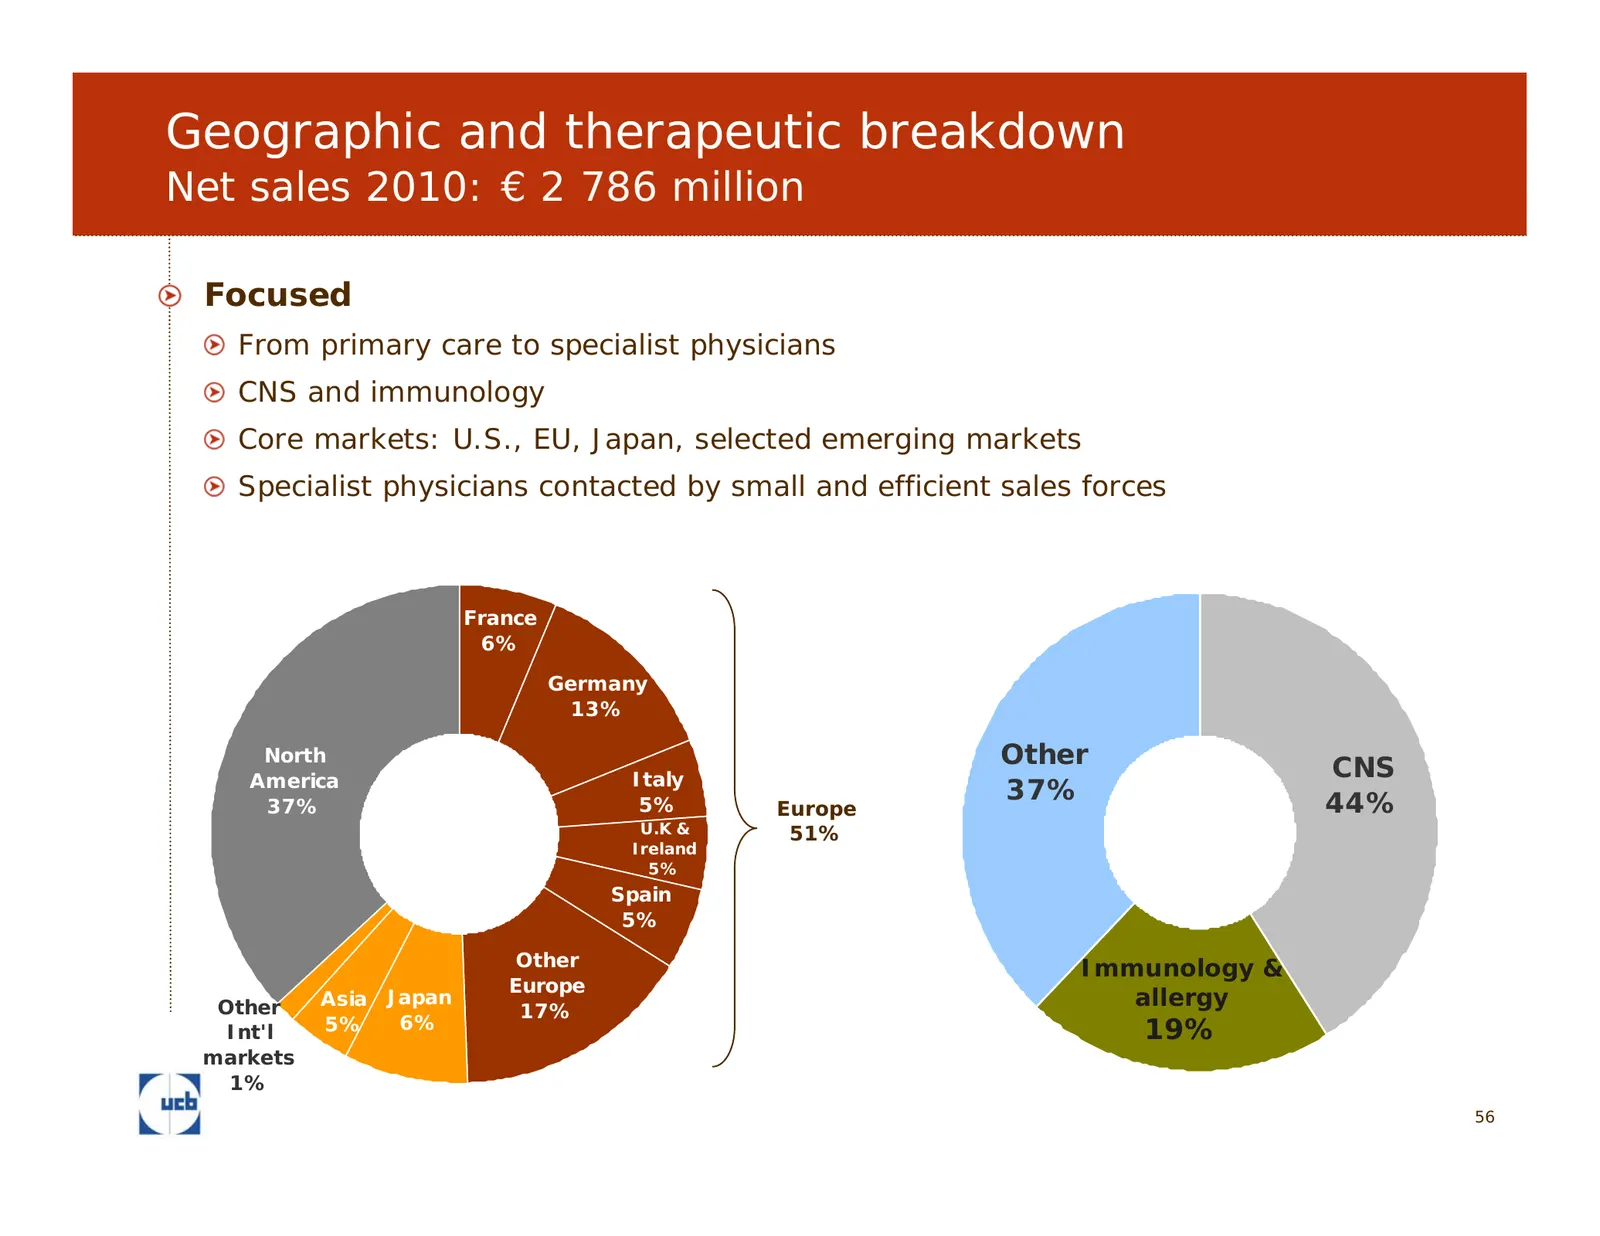
Slide 56: Geographic and therapeutic breakdown
Geographic and therapeutic breakdown Net sales 2010: € 2 786 million Focused From primary care to specialist physicians CNS and immunology Core markets: U.S., EU, Japan, selected emerging markets Specialist physicians contacted by small and efficient sales forces France 6% Germany 13% North Other CN
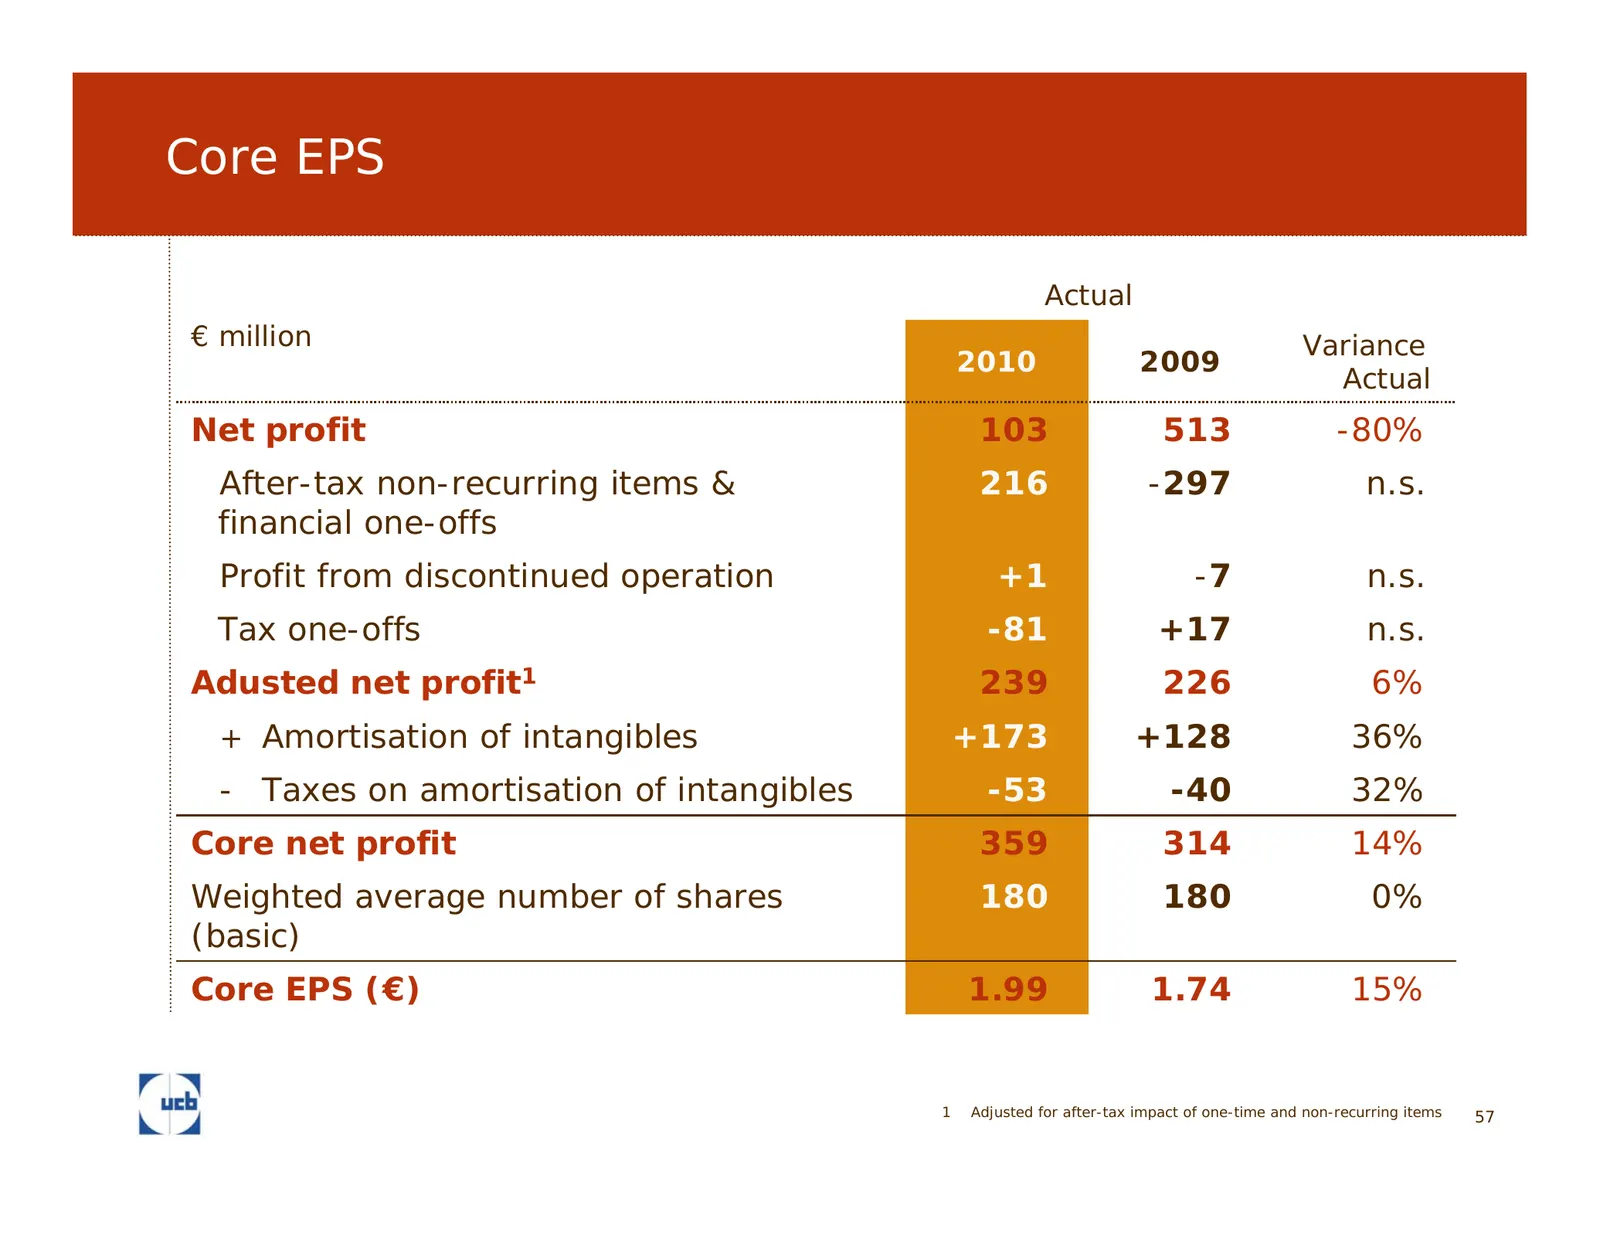
Slide 57: Core EPS
Core EPS Actual € million Variance 2010 2009 Actual Net profit 103 513 -80% After-tax non-recurring items & 216 -297 n.s. financial one-offs Profit from discontinued operation +1 -7 n.s. Tax one-offs -81 +17 n.s. Adusted net profit1 239 226 6% + Amortisation of intangibles +173 +128 36% - Taxes on a
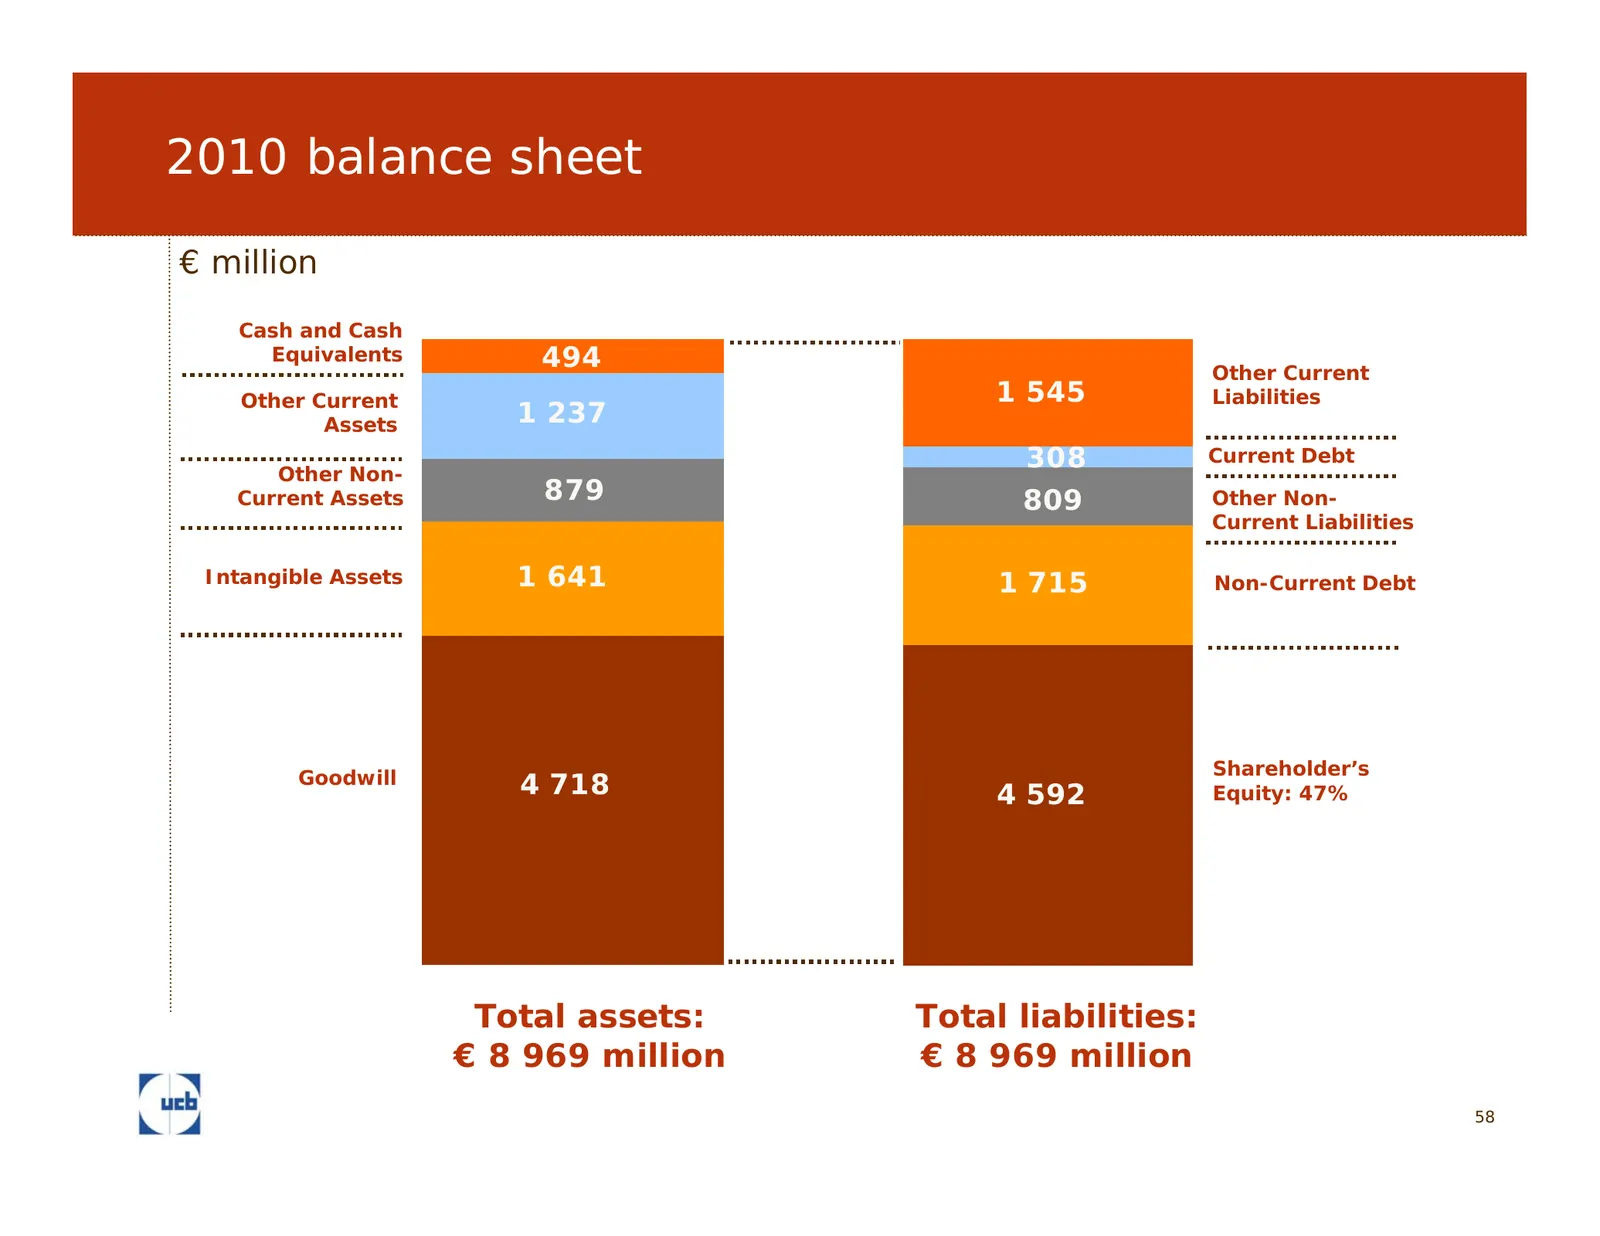
Slide 58: 2010 balance sheet
2010 balance sheet € million Cash and Cash Equivalents 494 Other Current Other Current 1 545 Liabilities Assets 1 237 Other Non- 308 Current Debt Current Assets 879 809 Other Non- Current Liabilities Intangible Assets 1 641 1 715 Non-Current Debt Goodwill Shareholder’s 4 718 4 4695 592 Equity: 47% T
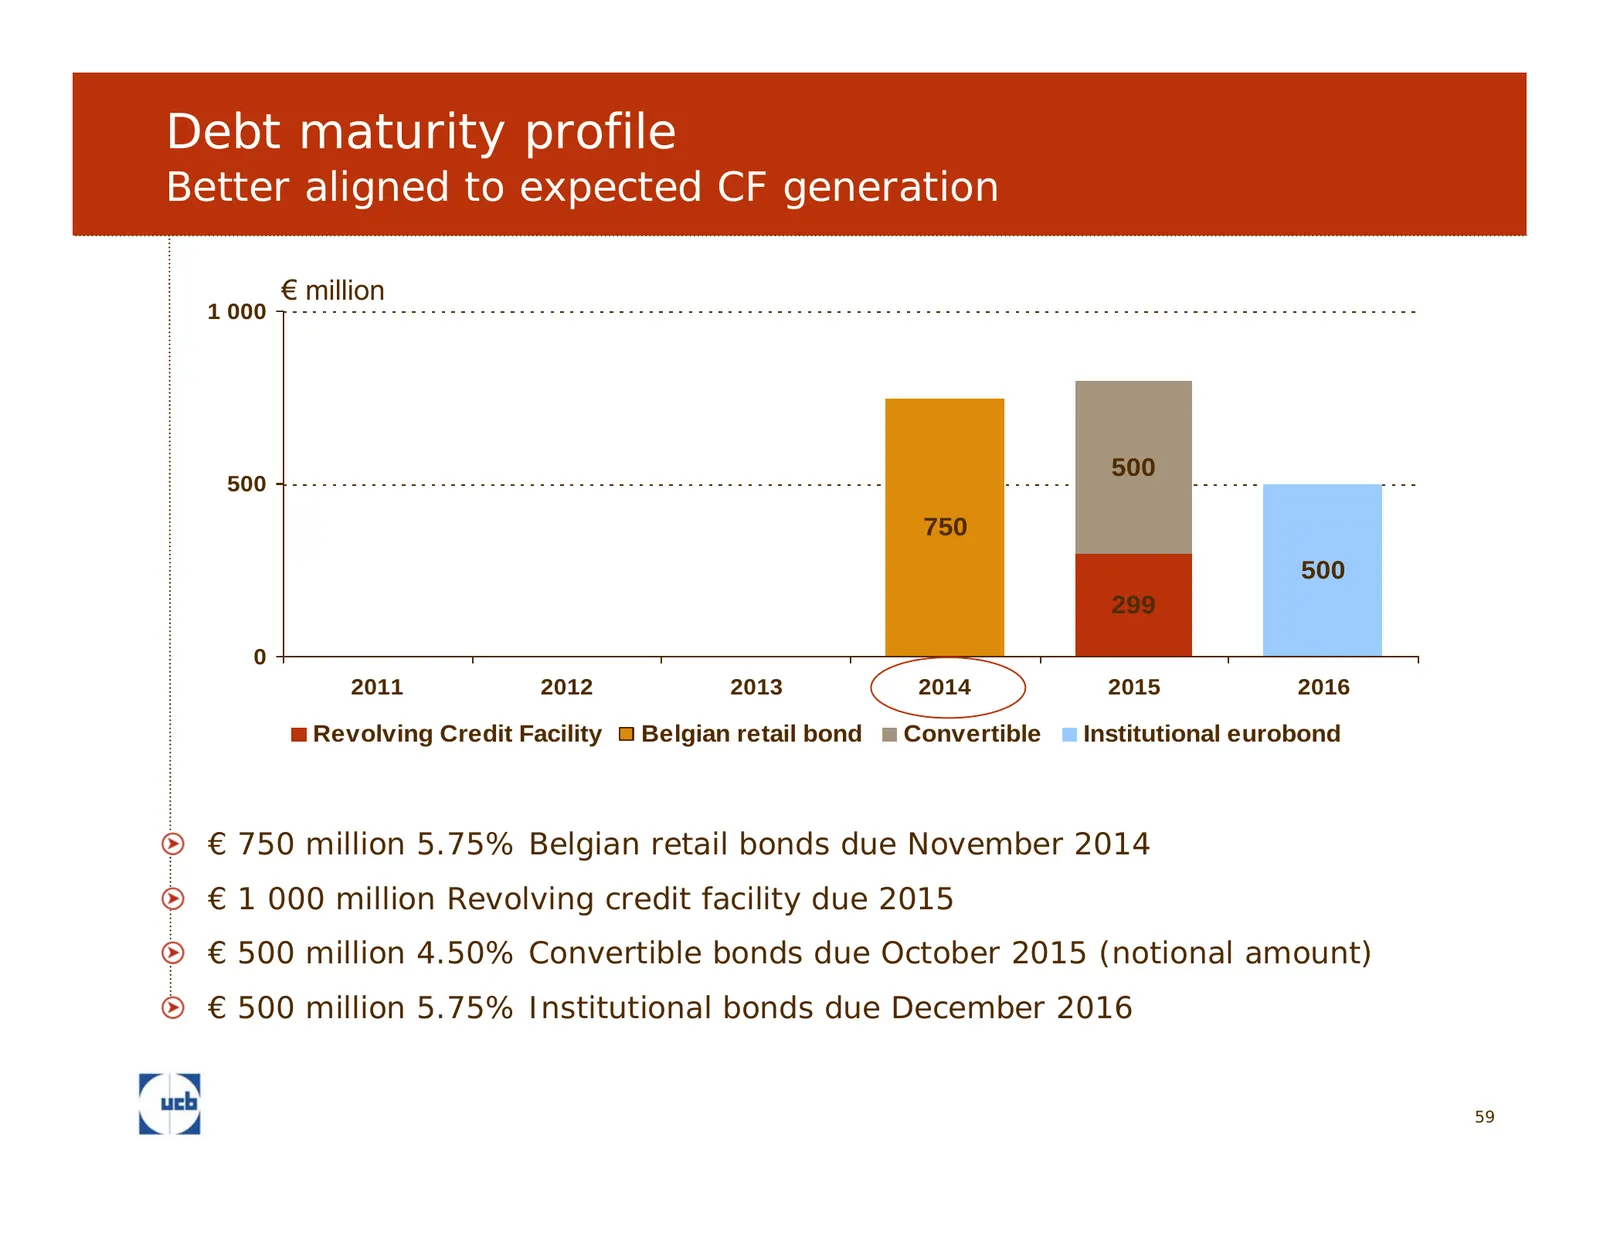
Slide 59: Debt maturity profile
Debt maturity profile Better aligned to expected CF generation € million 1 000 500 500 750 500 299 0 2011 2012 2013 2014 2015 2016 Revolving Credit Facility Belgian retail bond Convertible Institutional eurobond € 750 million 5.75% Belgian retail bonds due November 2014 € 1 000 million Revolving cre
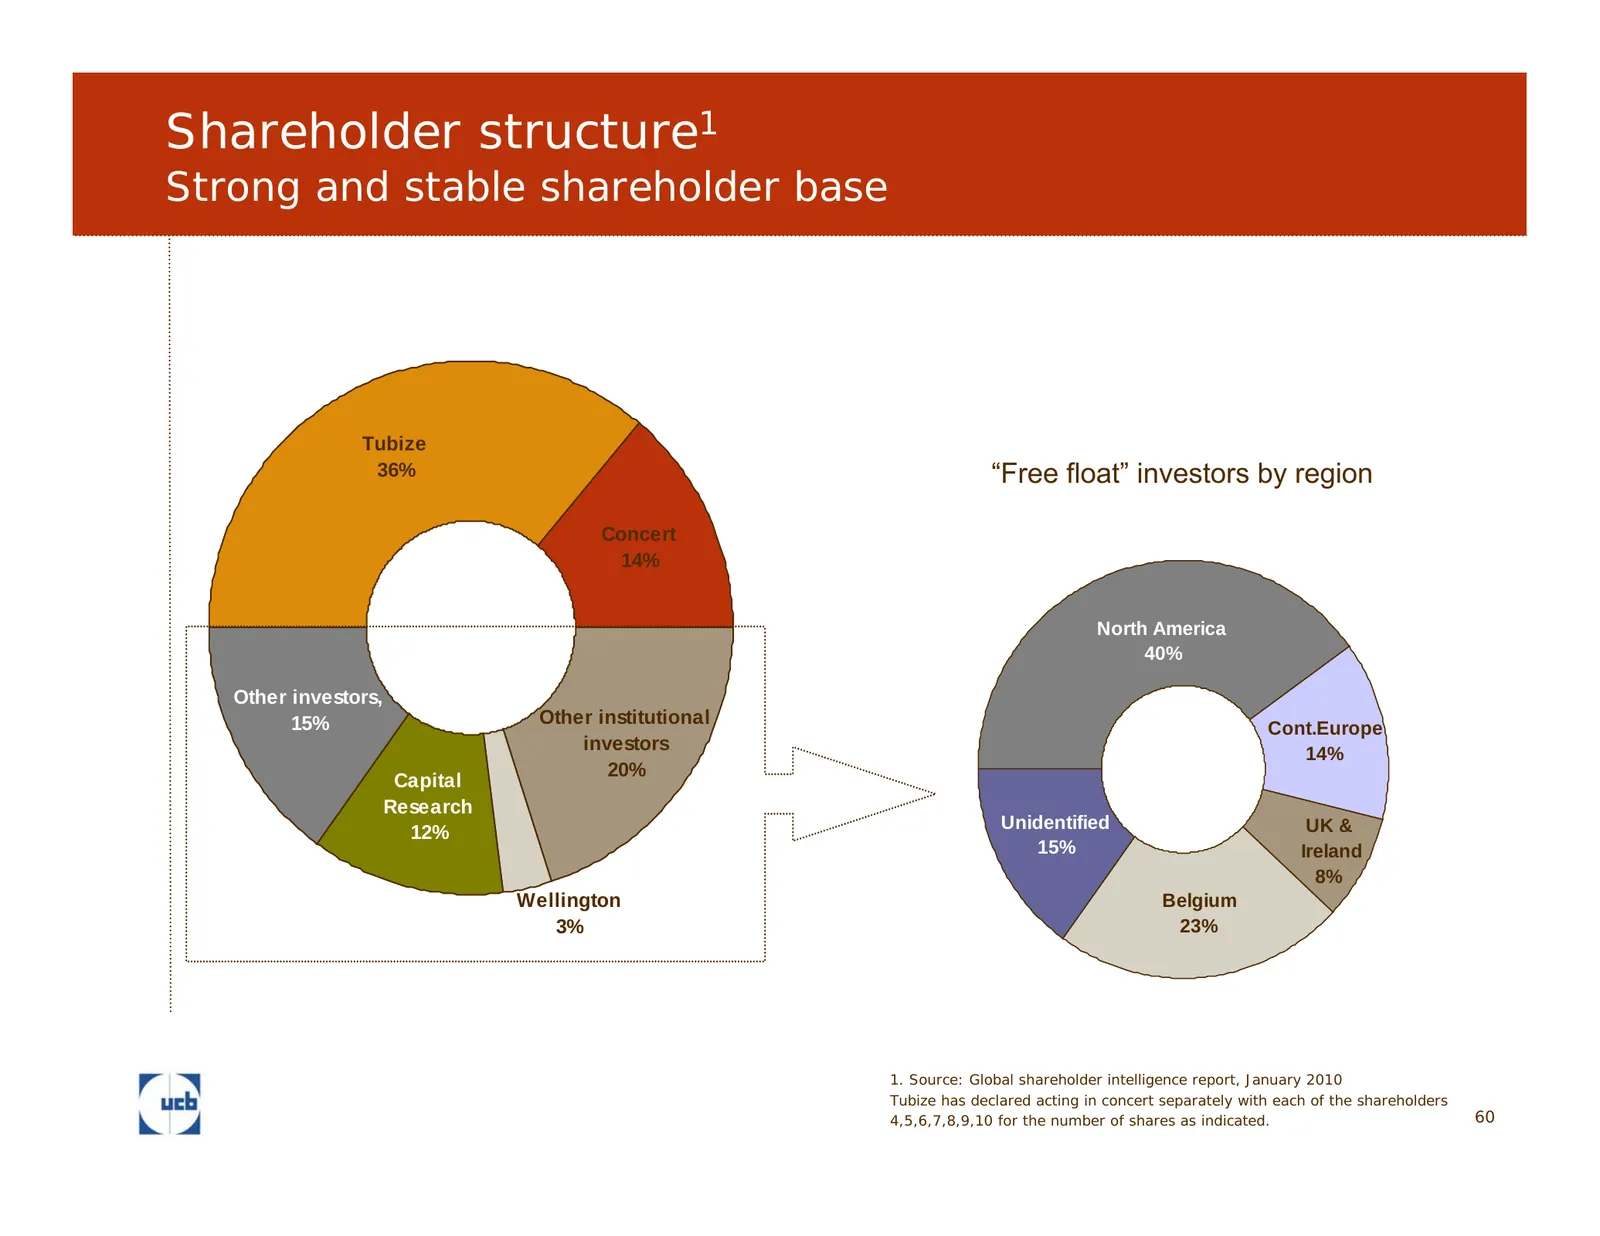
Slide 60: Shareholder structure
Shareholder structure1 Strong and stable shareholder base Tubize 36% “Free float” investors by region Concert 14% North America 40% Other investors, 15% Other institutional Cont.Europe investors 14% 20% Capital Research Unidentified UK & 12% 15% Ireland 8% Wellington Belgium 3% 23% 1. Source: Global
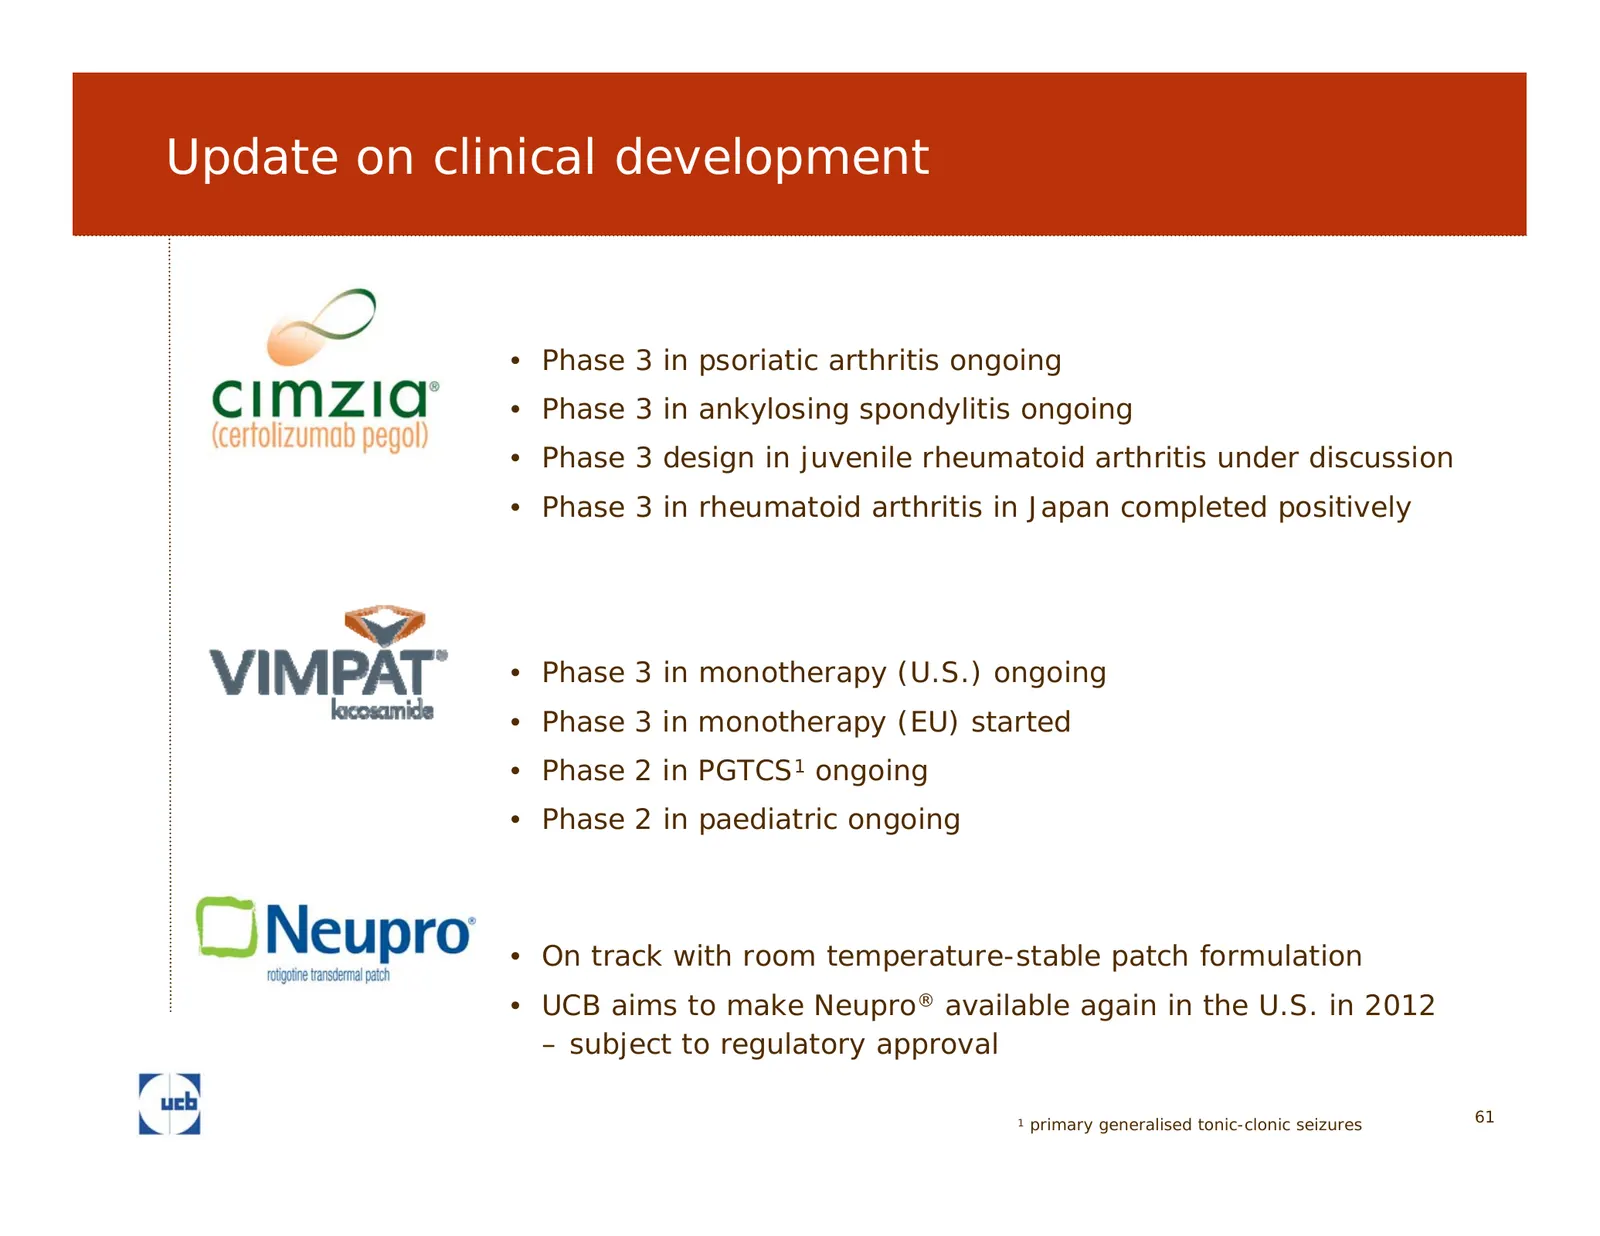
Slide 61: Update on clinical development
Update on clinical development • Phase 3 in psoriatic arthritis ongoing • Phase 3 in ankylosing spondylitis ongoing • Phase 3 design in juvenile rheumatoid arthritis under discussion • Phase 3 in rheumatoid arthritis in Japan completed positively • Phase 3 in monotherapy (U.S.) ongoing • Phase 3 in
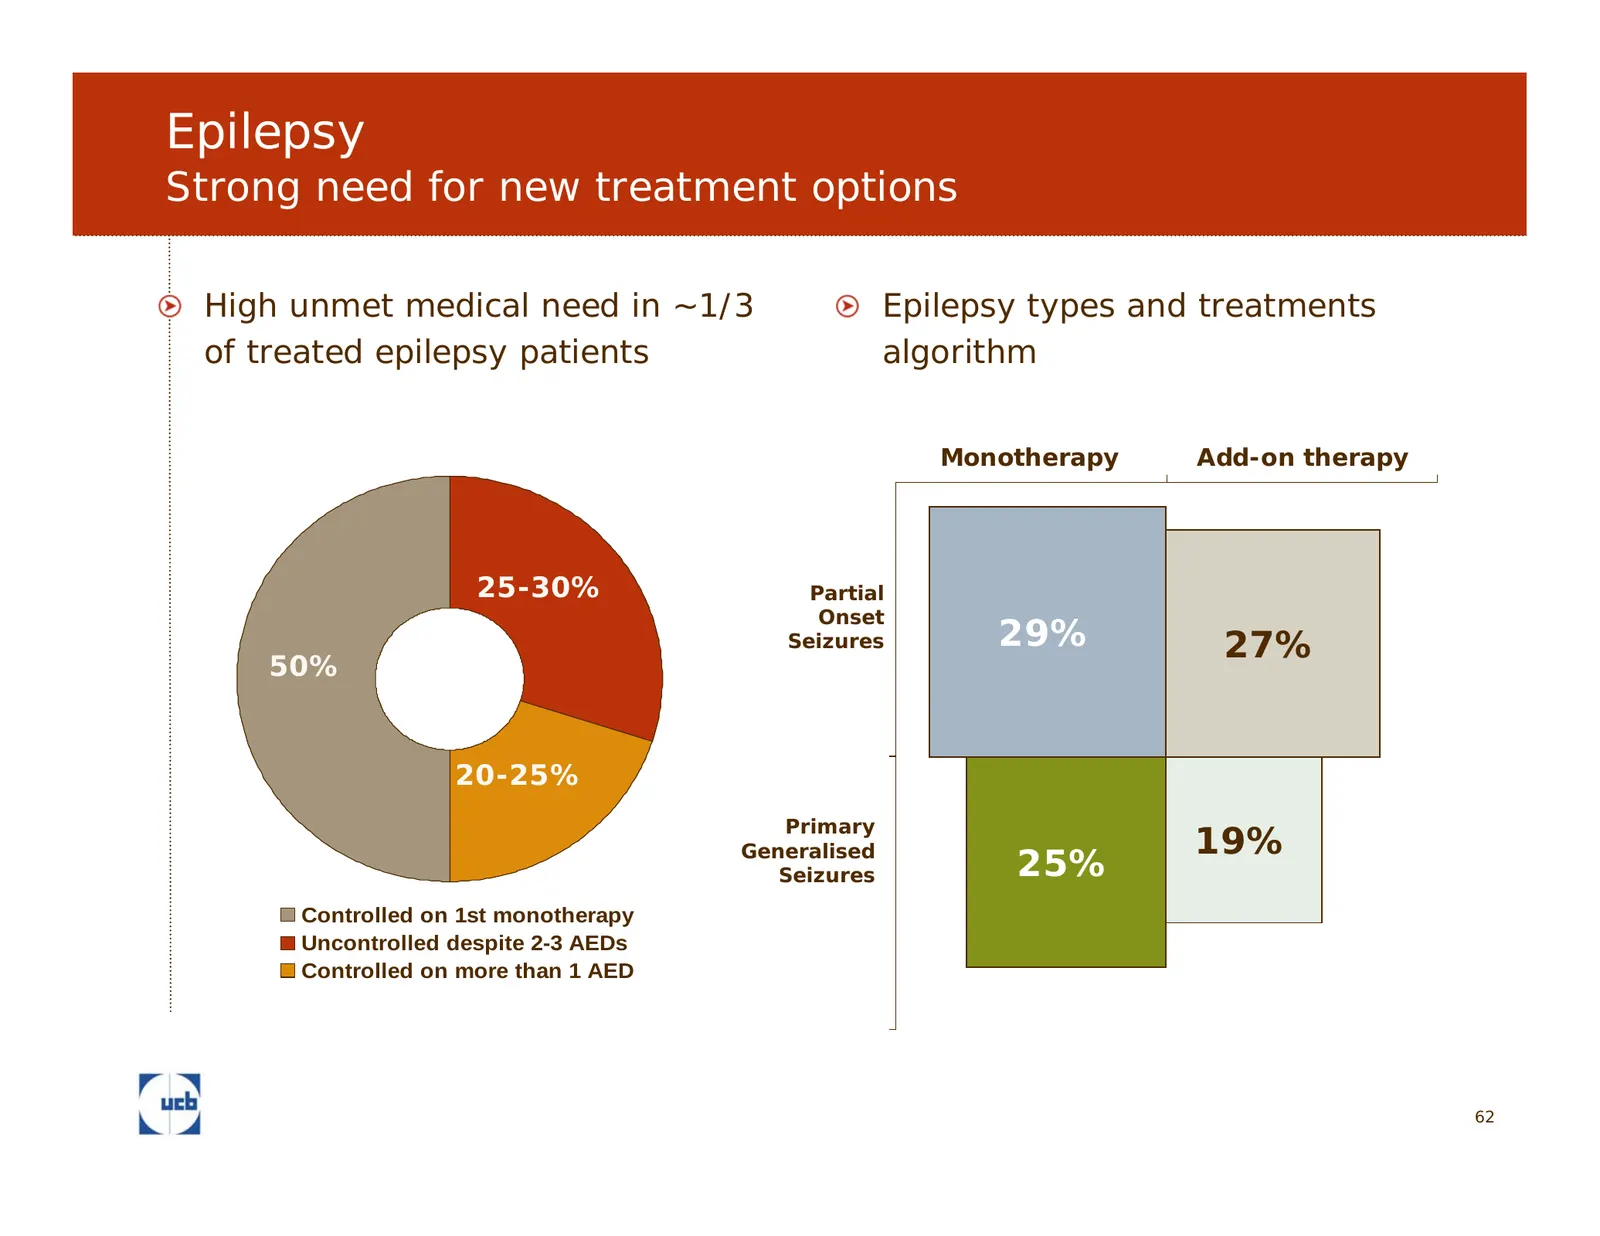
Slide 62: Epilepsy: strong need for new treatment options
Epilepsy Strong need for new treatment options High unmet medical need in ~1/3 Epilepsy types and treatments of treated epilepsy patients algorithm Monotherapy Add-on therapy 25-30% Partial Onset Seizures 29% 27% 50% 20-25% Primary Generalised 19% Seizures 25% Controlled on 1st monotherapy Uncontrol

Slide 63: Your UCB Investor Relations team
Your UCB Investor Relations team Antje Witte, Vice President Investor Relations • Phone: +32 2 559 9414 • E-mail: antje.witte@ucb.com Michael Tuck-Sherman, Investor Relations Manager • Phone: +32 2 559 9712 • E-mail: michael.tuck-sherman@ucb.com Isabelle Ghellynck, Investor Relations Project Manager
Source: Internet Archive copy of ucb.com
More decks from Ucb S.A.
 H1 2026 Earnings Presentation22 slides · Jul 30, 2026
 FY2025 Earnings Presentation22 slides · Feb 26, 2026
 44th Annual J.P. Morgan Healthcare Conference 202616 slides · Jan 14, 2026
 H1 2025 Earnings Presentation21 slides · Jul 31, 2025
 FY2024 Earnings Presentation18 slides · Feb 27, 2025
 43rd Annual J.P. Morgan Healthcare Conference (January 2025)13 slides · Jan 15, 2025