Ascom Holding AG · SIX:ASCN
Ascom — Investor Presentation (March 2016)
55 slides from Ascom's investor presentation, March 2016

Slide 1: Workflow intelligence in Healthcare
Ascom Investor Presentation March 2016 Workflow intelligence in Healthcare
Slide 2: Legal Disclaimer
Legal Disclaimer This document contains specific forward-looking statements, e.g. statements including terms like “believe”, “expect” or similar expressions. Such forward-looking statements are subject to known and unknown risks, uncertainties and other factors which may result in a substantial dive
Slide 3: 2015 results at a glance
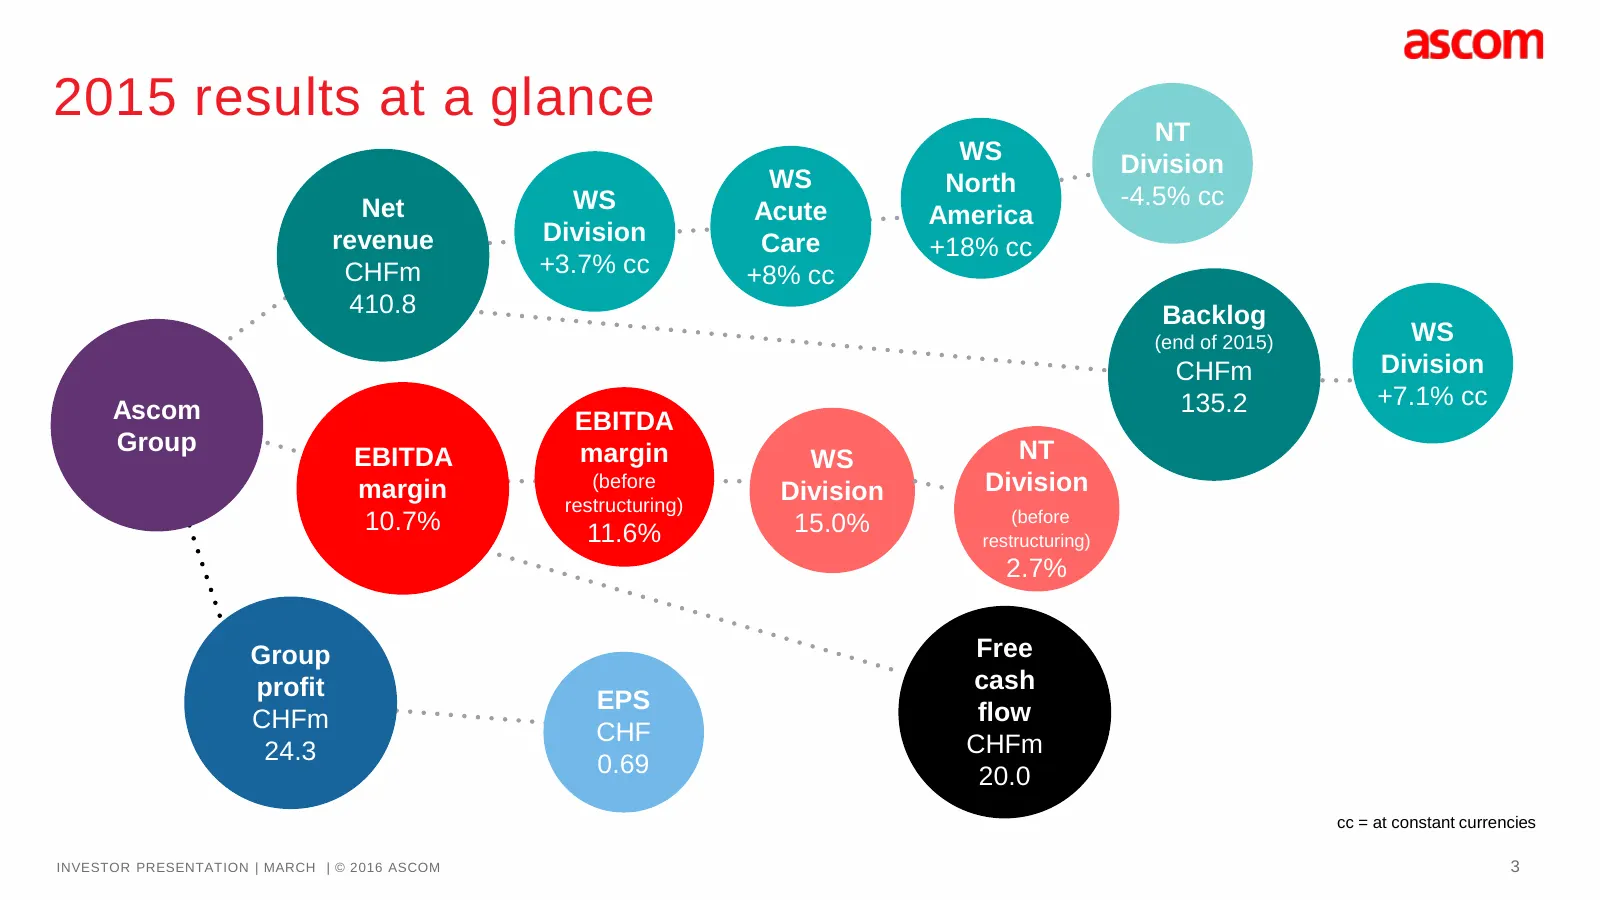
2015 results at a glance NT WS Division WS North Net WS -4.5% cc Acute America revenue Division Care +18% cc CHFm +3.7% cc +8% cc 410.8 Backlog (end of 2015) WS CHFm Division 135.2 +7.1% cc Ascom EBITDA Group margin NT EBITDA WS margin (before Division Division restructuring) 10.7% 15.0% (before 11.
Slide 4: Highlights 2015 – Progress towards Ascom 2020 (I)
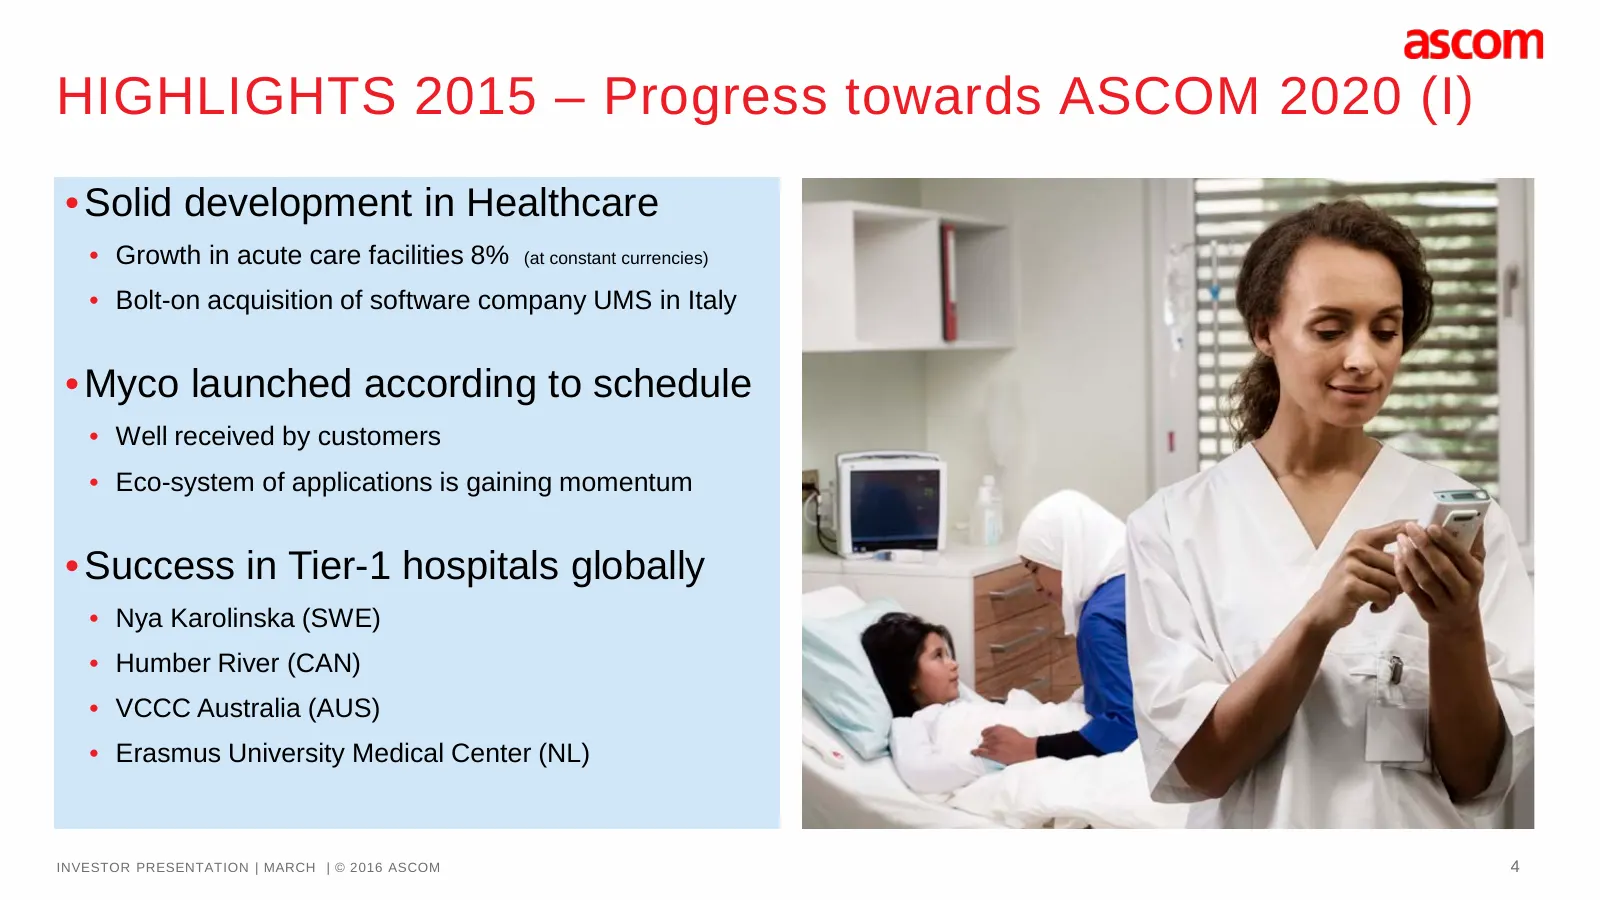
HIGHLIGHTS 2015 – Progress towards ASCOM 2020 (I) • Solid development in Healthcare • Growth in acute care facilities 8% (at constant currencies) • Bolt-on acquisition of software company UMS in Italy • Myco launched according to schedule • Well received by customers • Eco-system of applications is
Slide 5: Highlights 2015 – Progress towards Ascom 2020 (II)
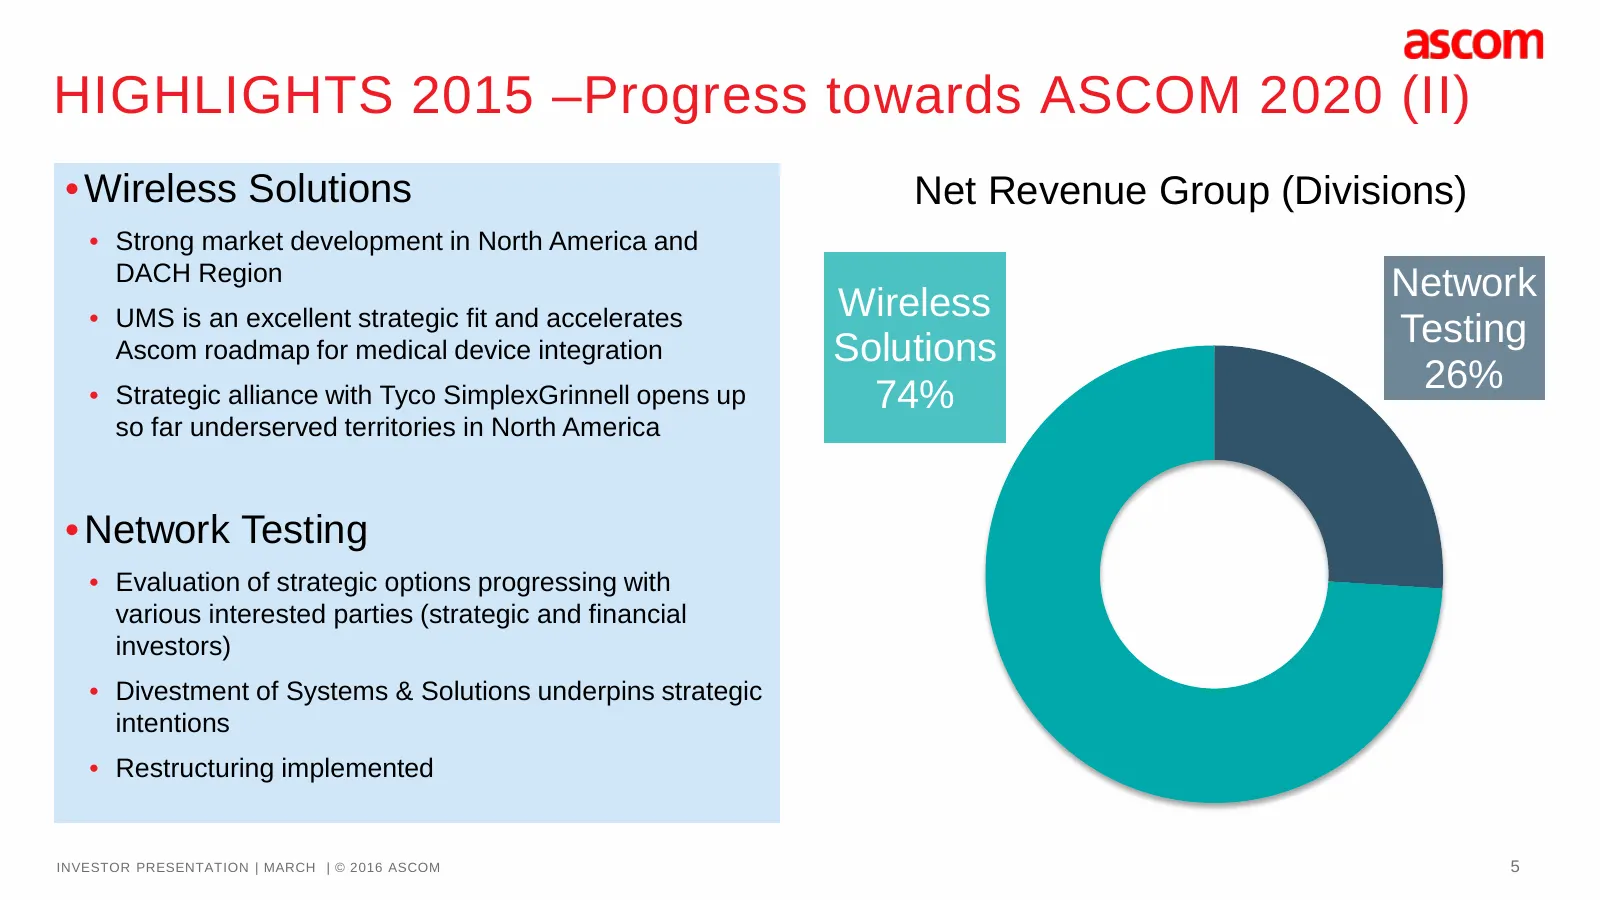
HIGHLIGHTS 2015 –Progress towards ASCOM 2020 (II) • Wireless Solutions Net Revenue Group (Divisions) • Strong market development in North America and DACH Region Wireless Network • UMS is an excellent strategic fit and accelerates Ascom roadmap for medical device integration Solutions Testing • Stra
Slide 6: Our businesses
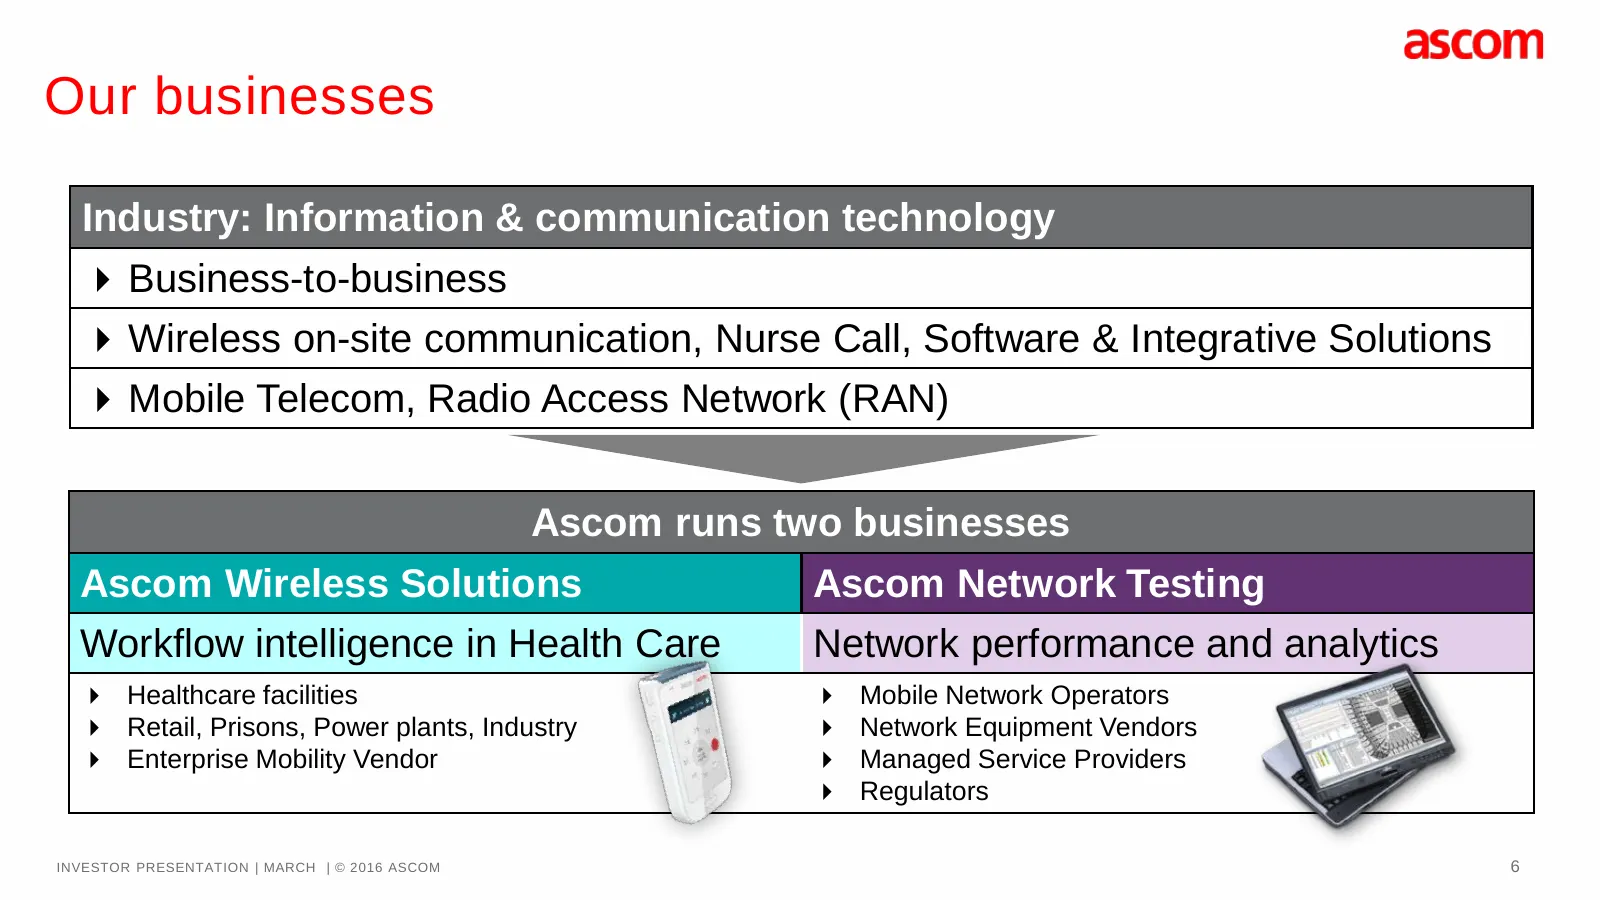
Our businesses Industry: Information & communication technology Business-to-business Wireless on-site communication, Nurse Call, Software & Integrative Solutions Mobile Telecom, Radio Access Network (RAN) Ascom runs two businesses Ascom Wireless Solutions Ascom Network Testing Workflow intelli
Slide 7: Strategic shift to achieve the Ascom 2020 ambition
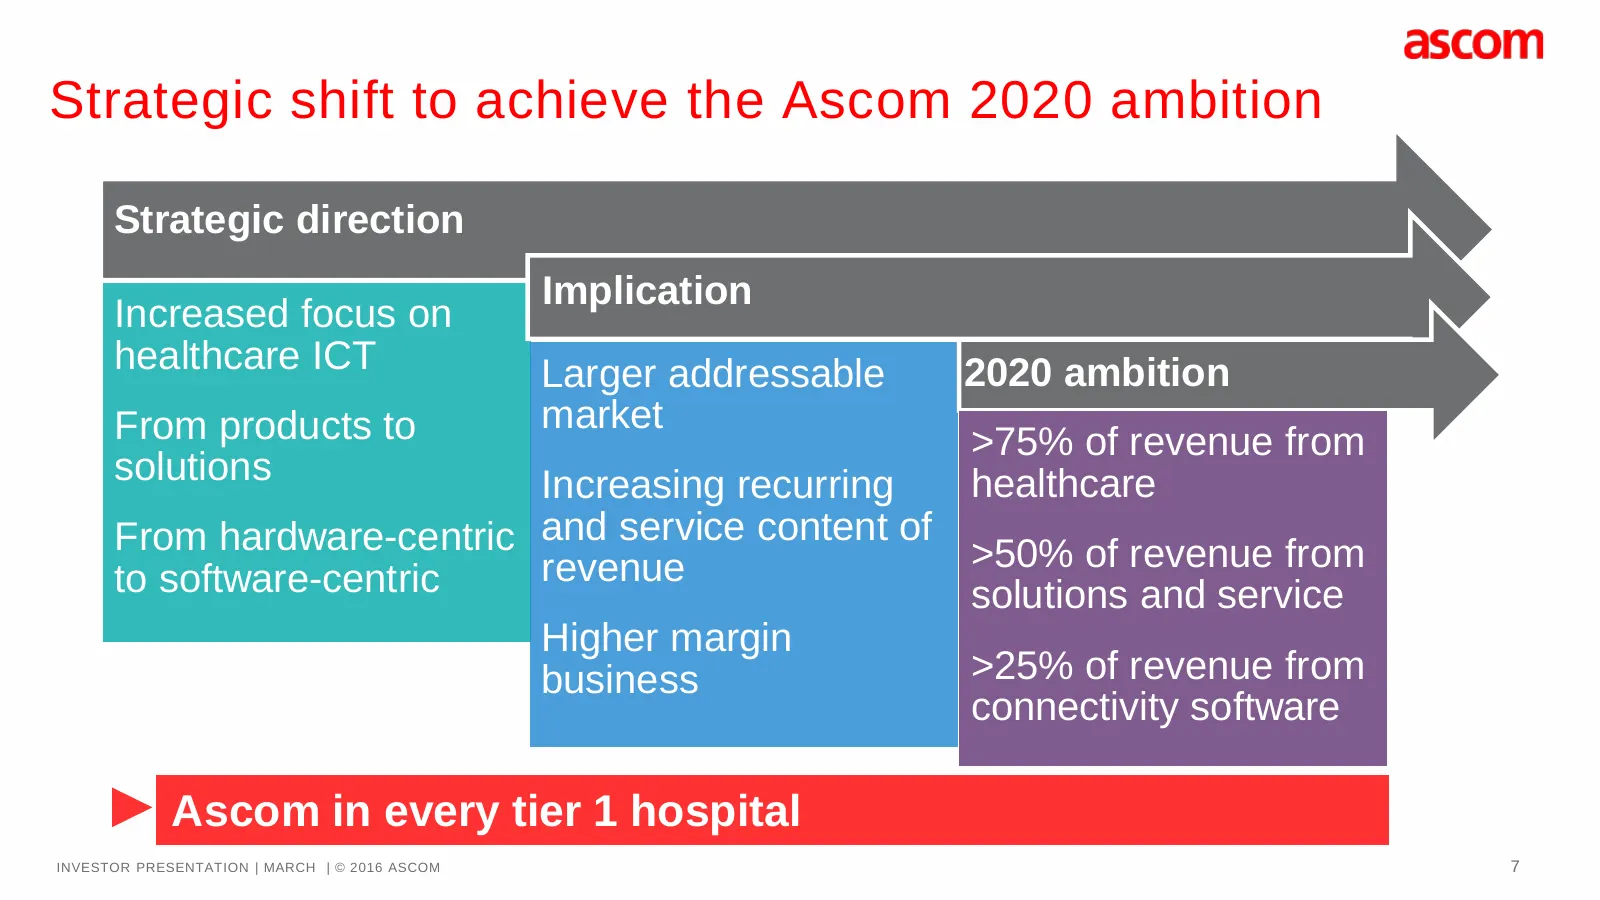
Strategic shift to achieve the Ascom 2020 ambition Strategic direction Implication Increased focus on healthcare ICT Larger addressable 2020 ambition From products to market >75% of revenue from solutions Increasing recurring healthcare From hardware-centric and service content of >50% of revenue fr
Slide 8: Ascom in Healthcare
Ascom in Healthcare INVESTOR PRESENTATION | MARCH | © 2016 ASCOM 8
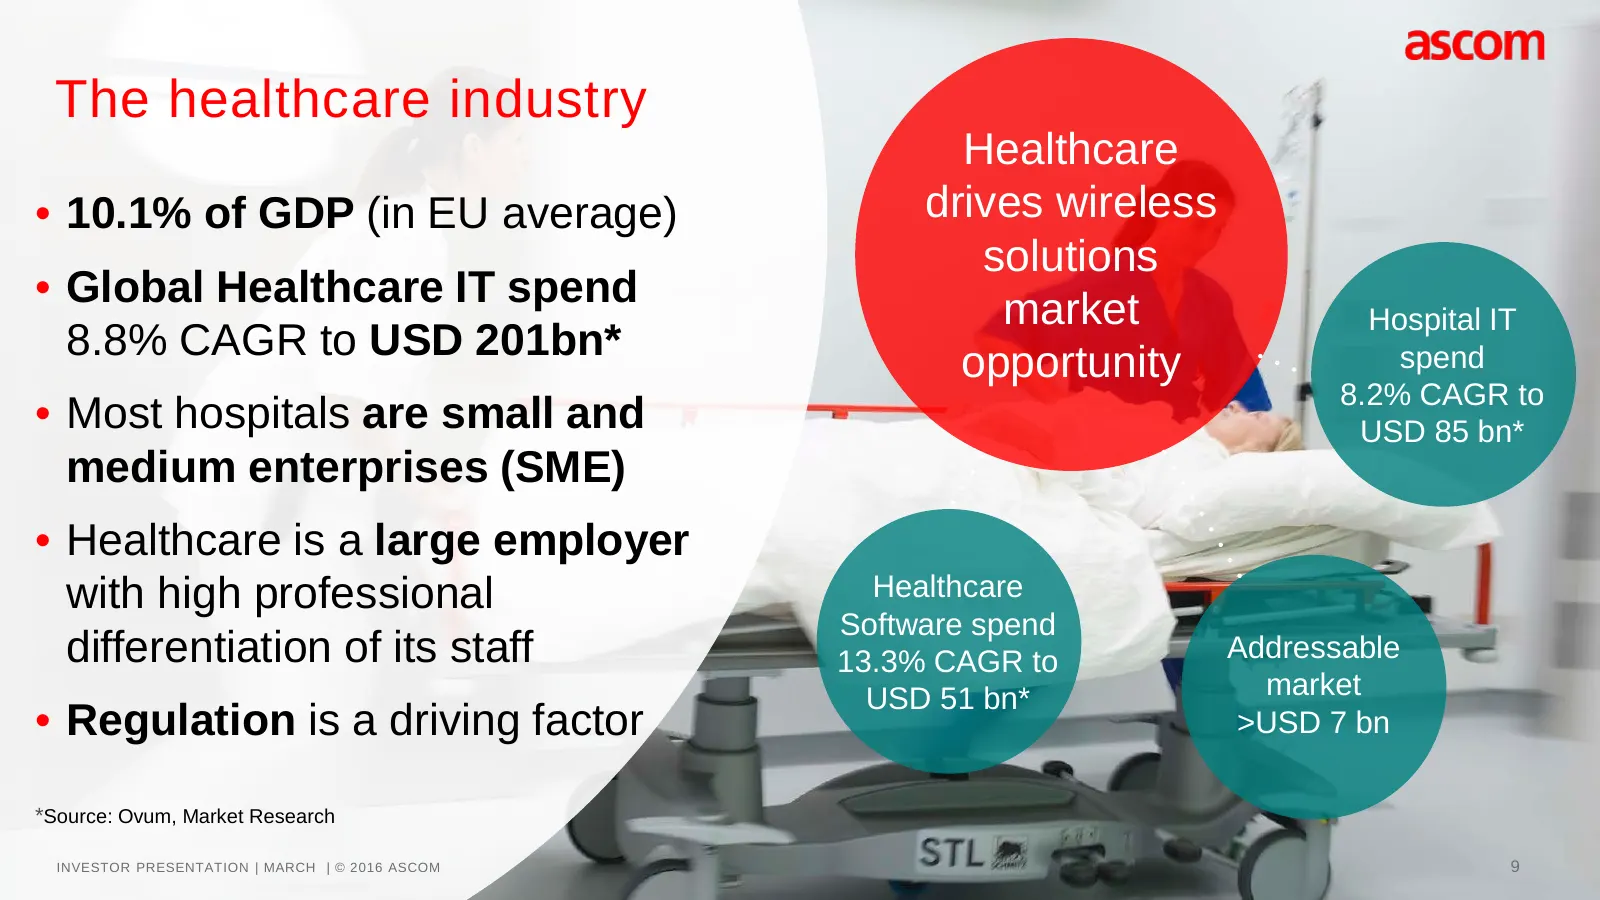
Slide 9: The healthcare industry
The healthcare industry Healthcare • 10.1% of GDP (in EU average) drives wireless solutions • Global Healthcare IT spend market Hospital IT 8.8% CAGR to USD 201bn* spend opportunity 8.2% CAGR to • Most hospitals are small and USD 85 bn* medium enterprises (SME) • Healthcare is a large employer with
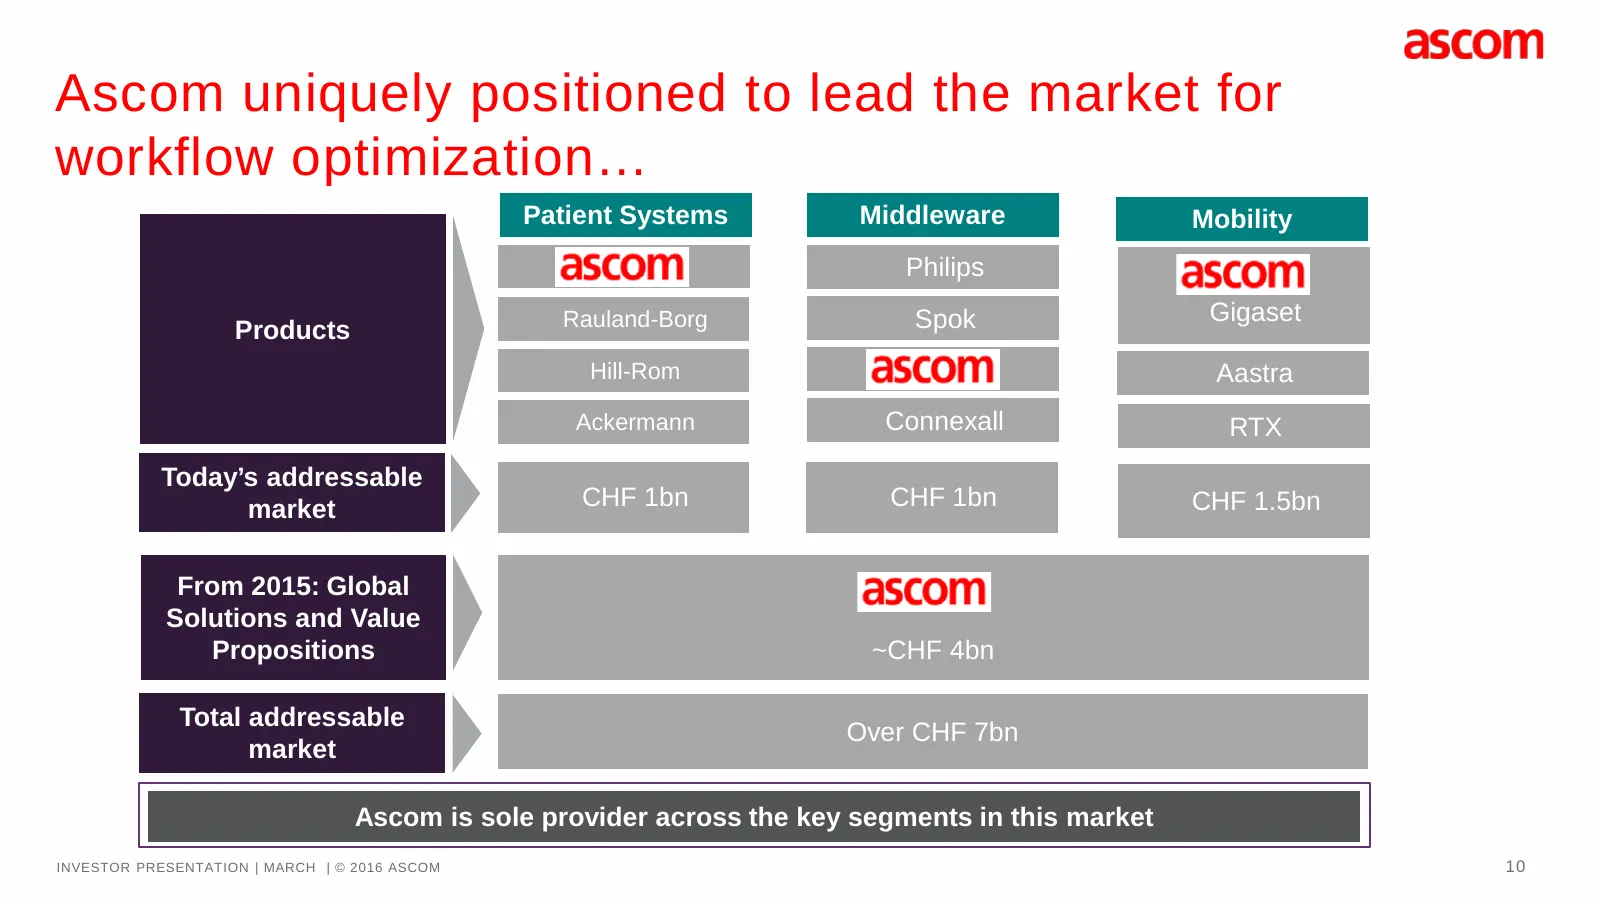
Slide 10: Ascom uniquely positioned to lead the market for workflow optimization
Ascom uniquely positioned to lead the market for workflow optimization… Patient Systems Middleware Mobility Philips Rauland-Borg Spok Gigaset Products Hill-Rom Aastra Ackermann Connexall RTX Today’s addressable market CHF 1bn CHF 1bn CHF 1.5bn From 2015: Global Solutions and Value Propositions ~CHF
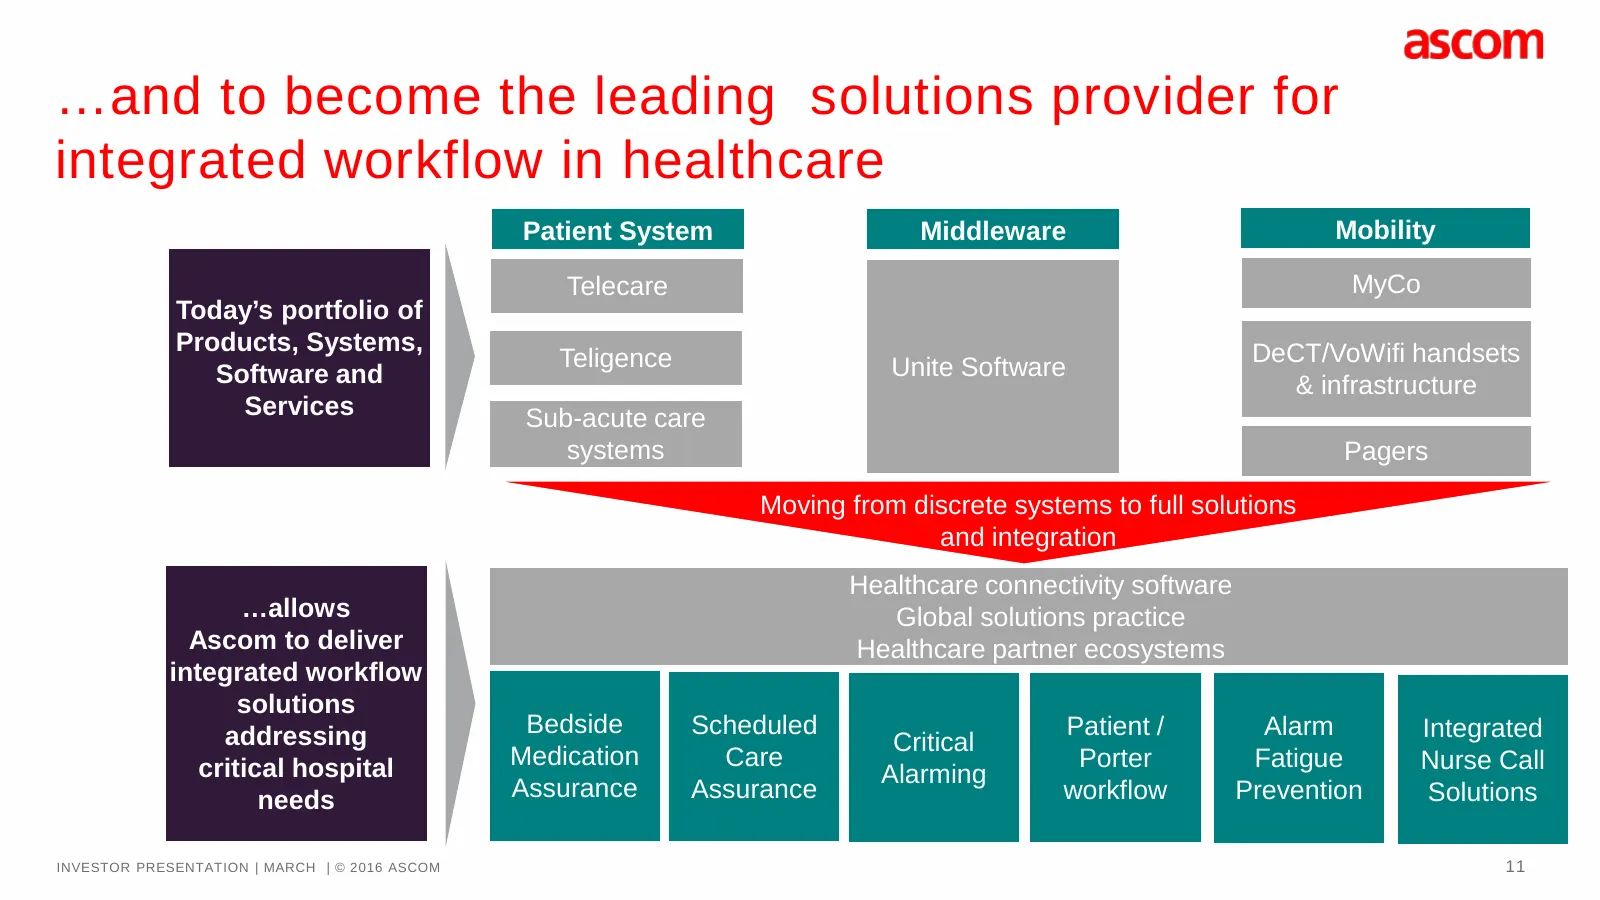
Slide 11: …and to become the leading solutions provider for integrated workflow in healthcare
…and to become the leading solutions provider for integrated workflow in healthcare Patient System Middleware Mobility Telecare MyCo Today’s portfolio of Products, Systems, DeCT/VoWifi handsets Teligence Unite Software Software and & infrastructure Services Sub-acute care systems Pagers Moving from
Slide 12: Healthcare – growing in importance
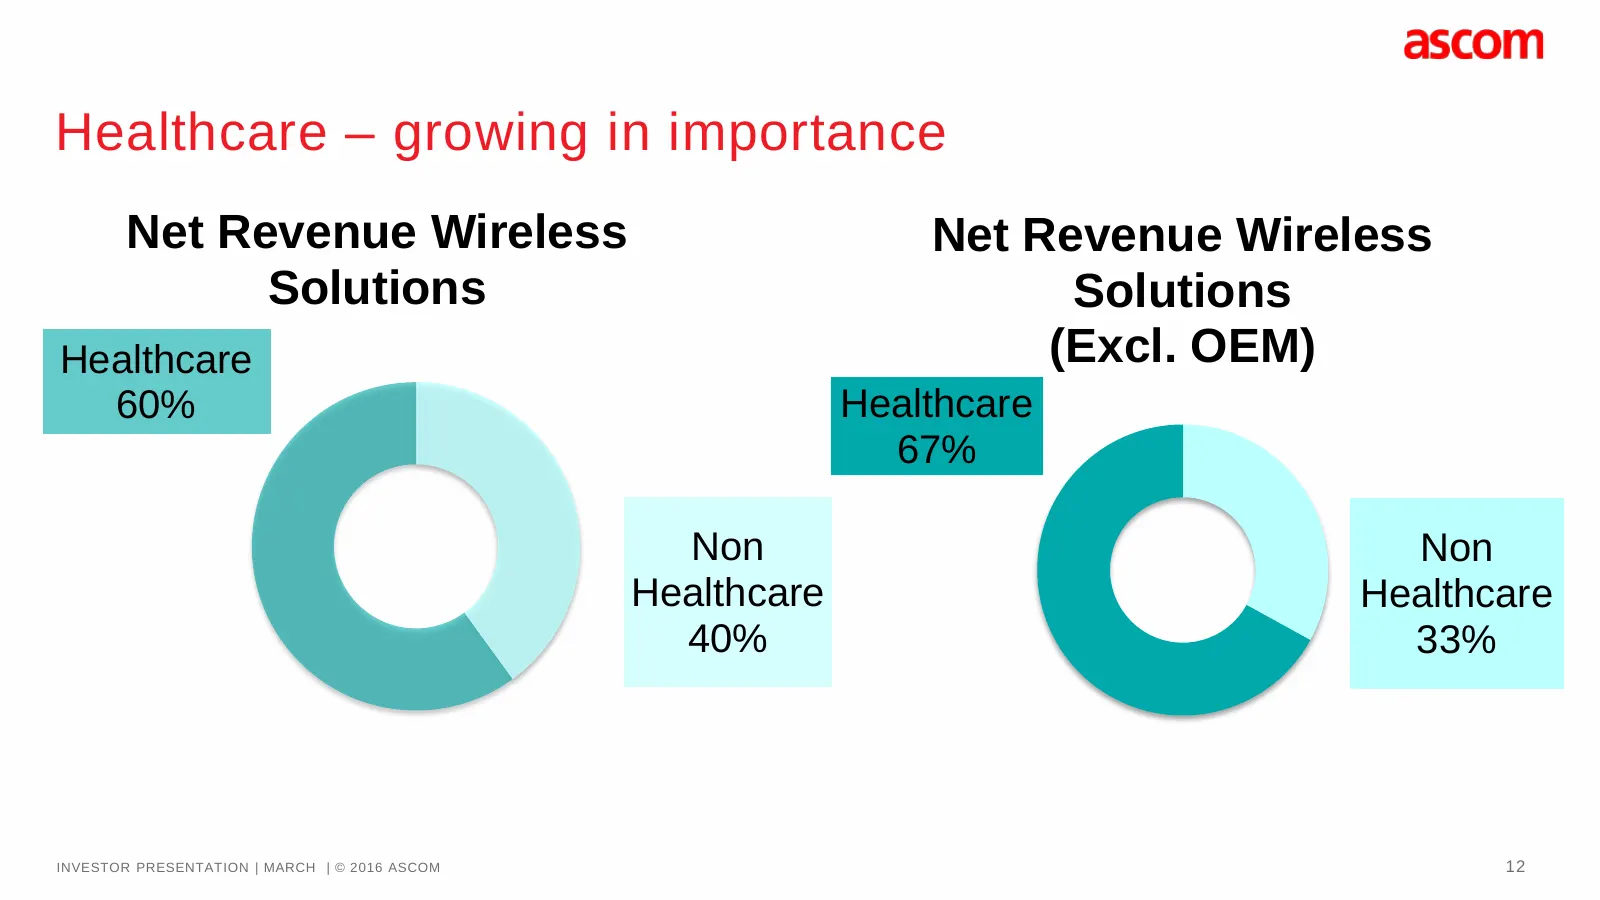
Healthcare – growing in importance Net Revenue Wireless Net Revenue Wireless Solutions Solutions Healthcare (Excl. OEM) 60% Healthcare 67% Non Non Healthcare Healthcare 40% 33% INVESTOR PRESENTATION | MARCH | © 2016 ASCOM 12
Slide 13: Net revenue development – WS 75% of Ascom Group
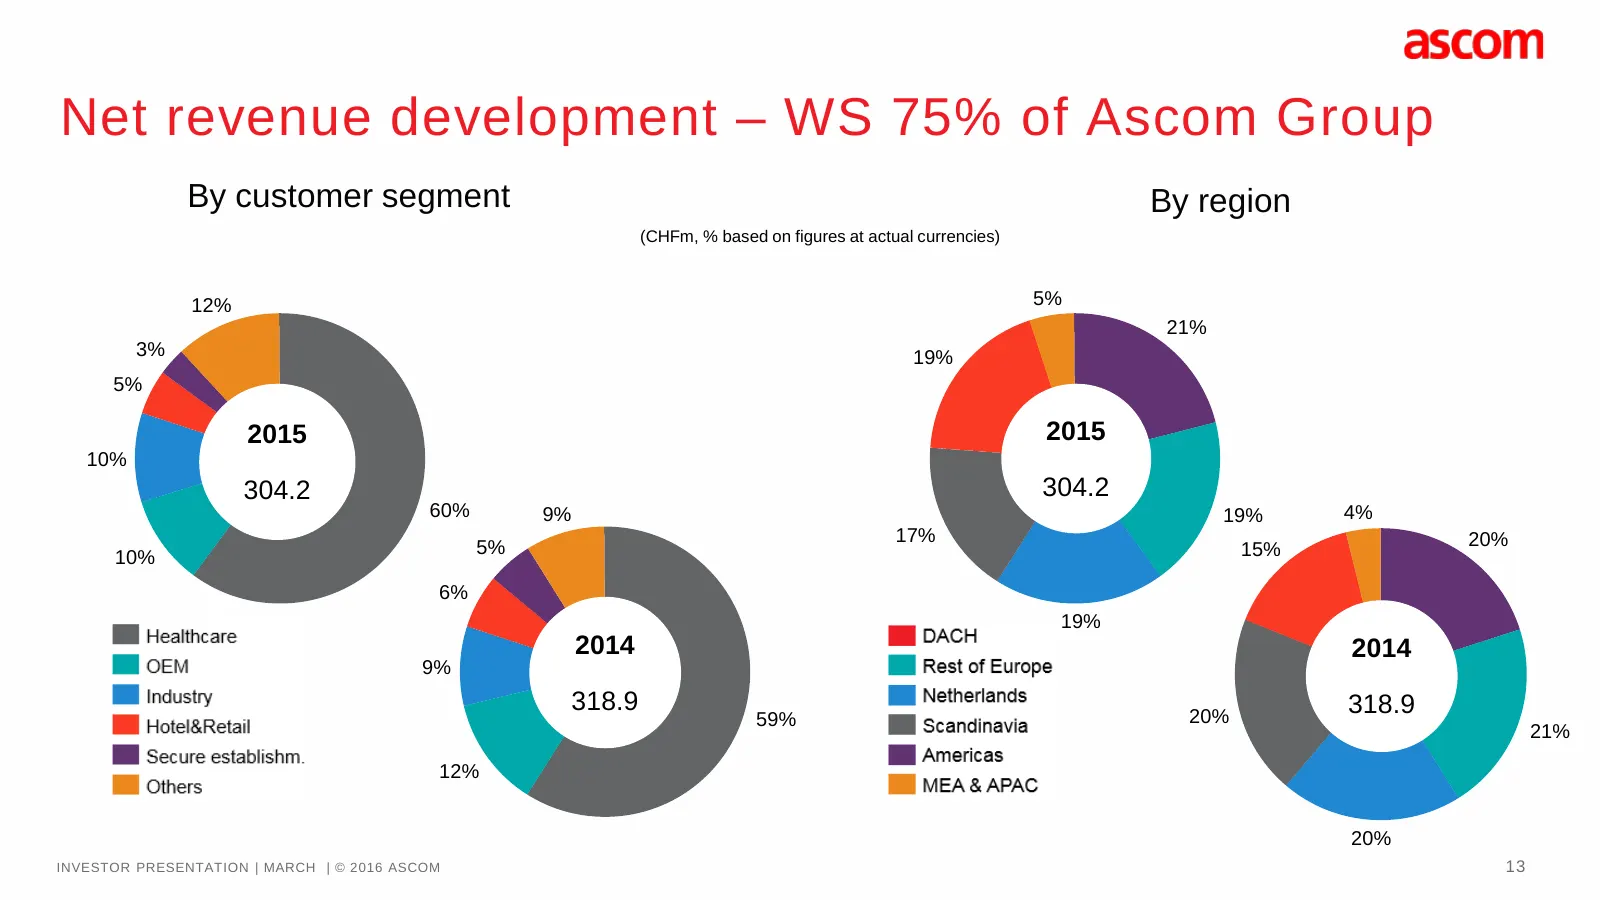
Net revenue development – WS 75% of Ascom Group By customer segment By region (CHFm, % based on figures at actual currencies) 12% 5% 21% 3% 19% 5% 2015 2015 10% 304.2 304.2 60% 9% 19% 4% 17% 20% 5% 15% 10% 6% 19% 2014 2014 9% 318.9 20% 318.9 59% 21% 12% 20% INVESTOR PRESENTATION | MARCH | © 2016 ASC
Slide 14: The Healthcare industry’s needs
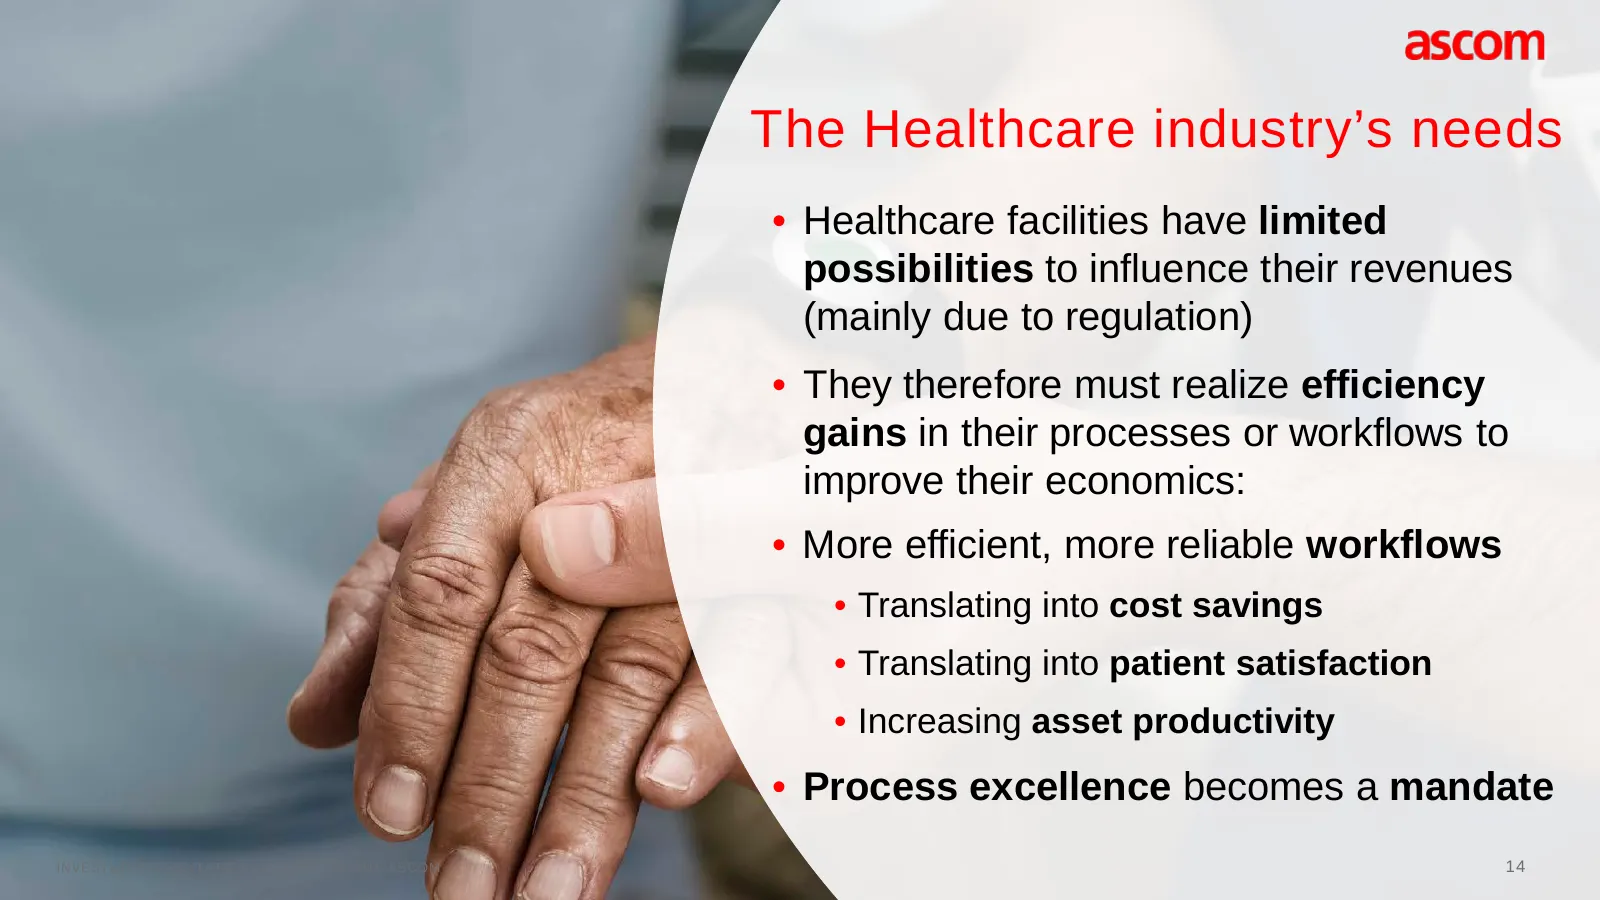
The Healthcare industry’s needs • Healthcare facilities have limited possibilities to influence their revenues (mainly due to regulation) • They therefore must realize efficiency gains in their processes or workflows to improve their economics: • More efficient, more reliable workflows • Translating
Slide 15: Integrating communication into workflow intelligence solutions
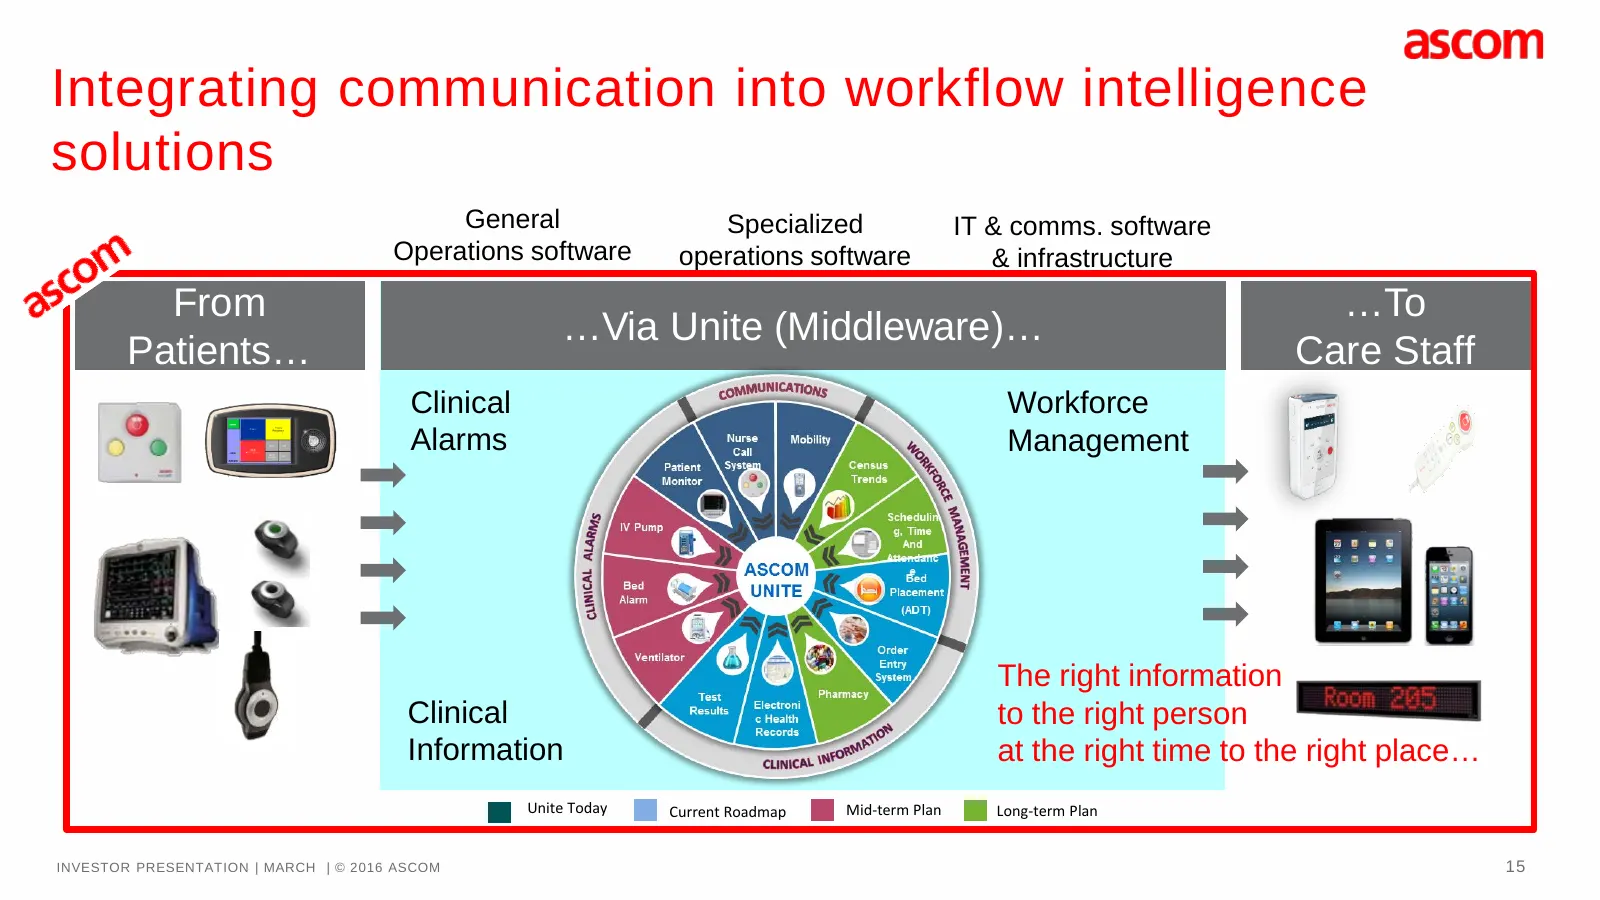
Integrating communication into workflow intelligence solutions General Specialized IT & comms. software Operations software operations software & infrastructure From …To …Via Unite (Middleware)… Patients… Care Staff Clinical Workforce Alarms Management The right information Clinical to the right per
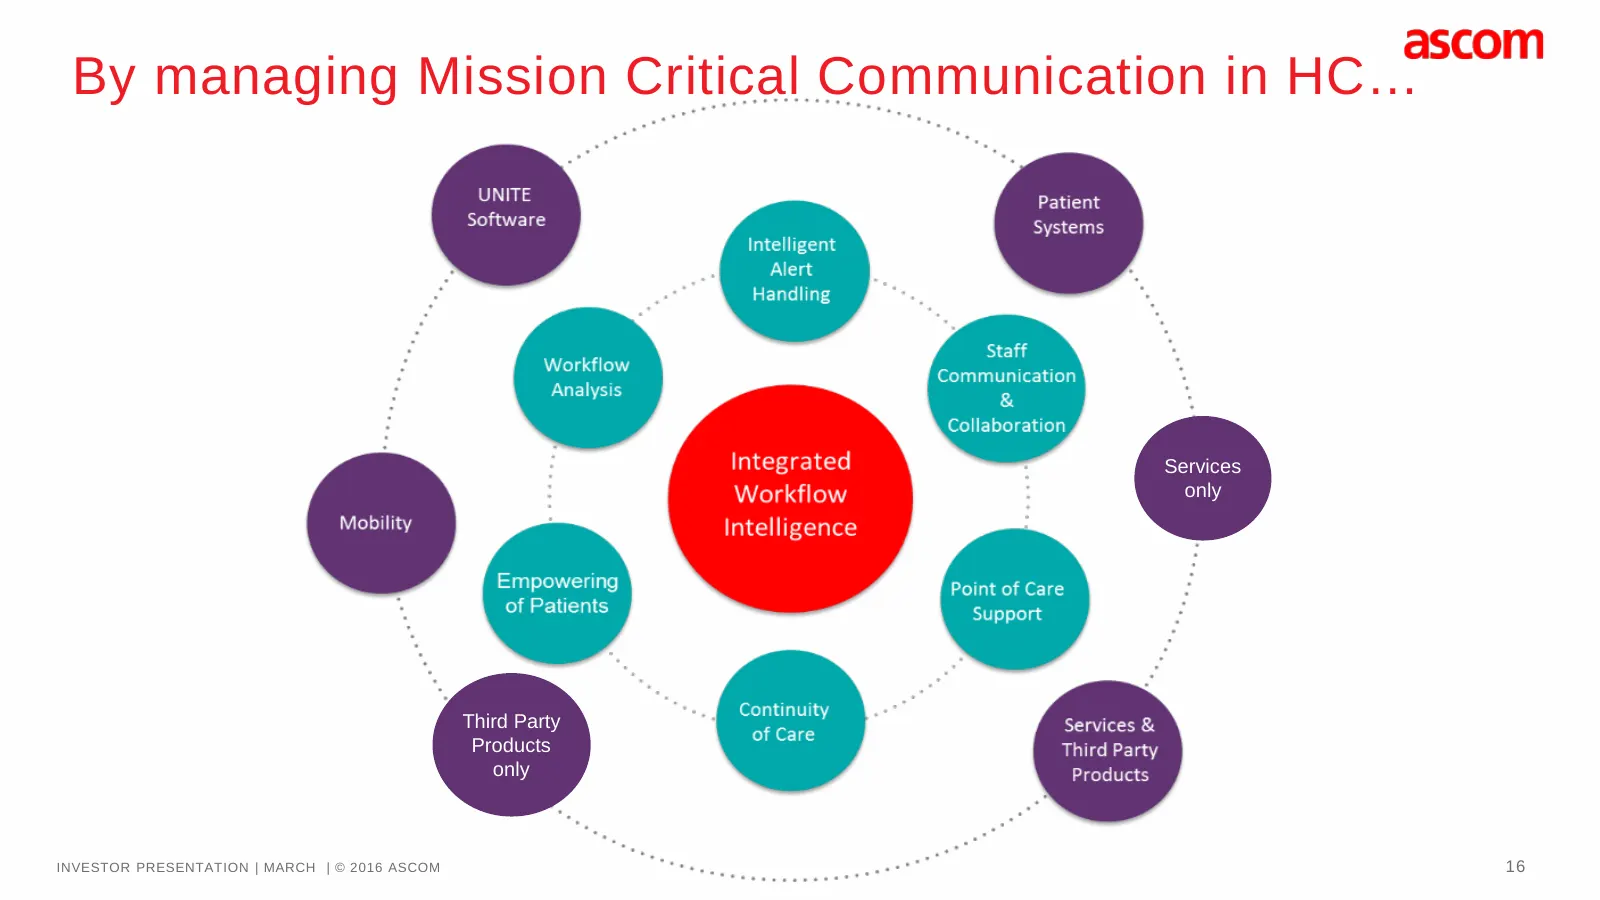
Slide 16: By managing Mission Critical Communication in HC…
By managing Mission Critical Communication in HC… Services only Third Party Products only INVESTOR PRESENTATION | MARCH | © 2016 ASCOM 16
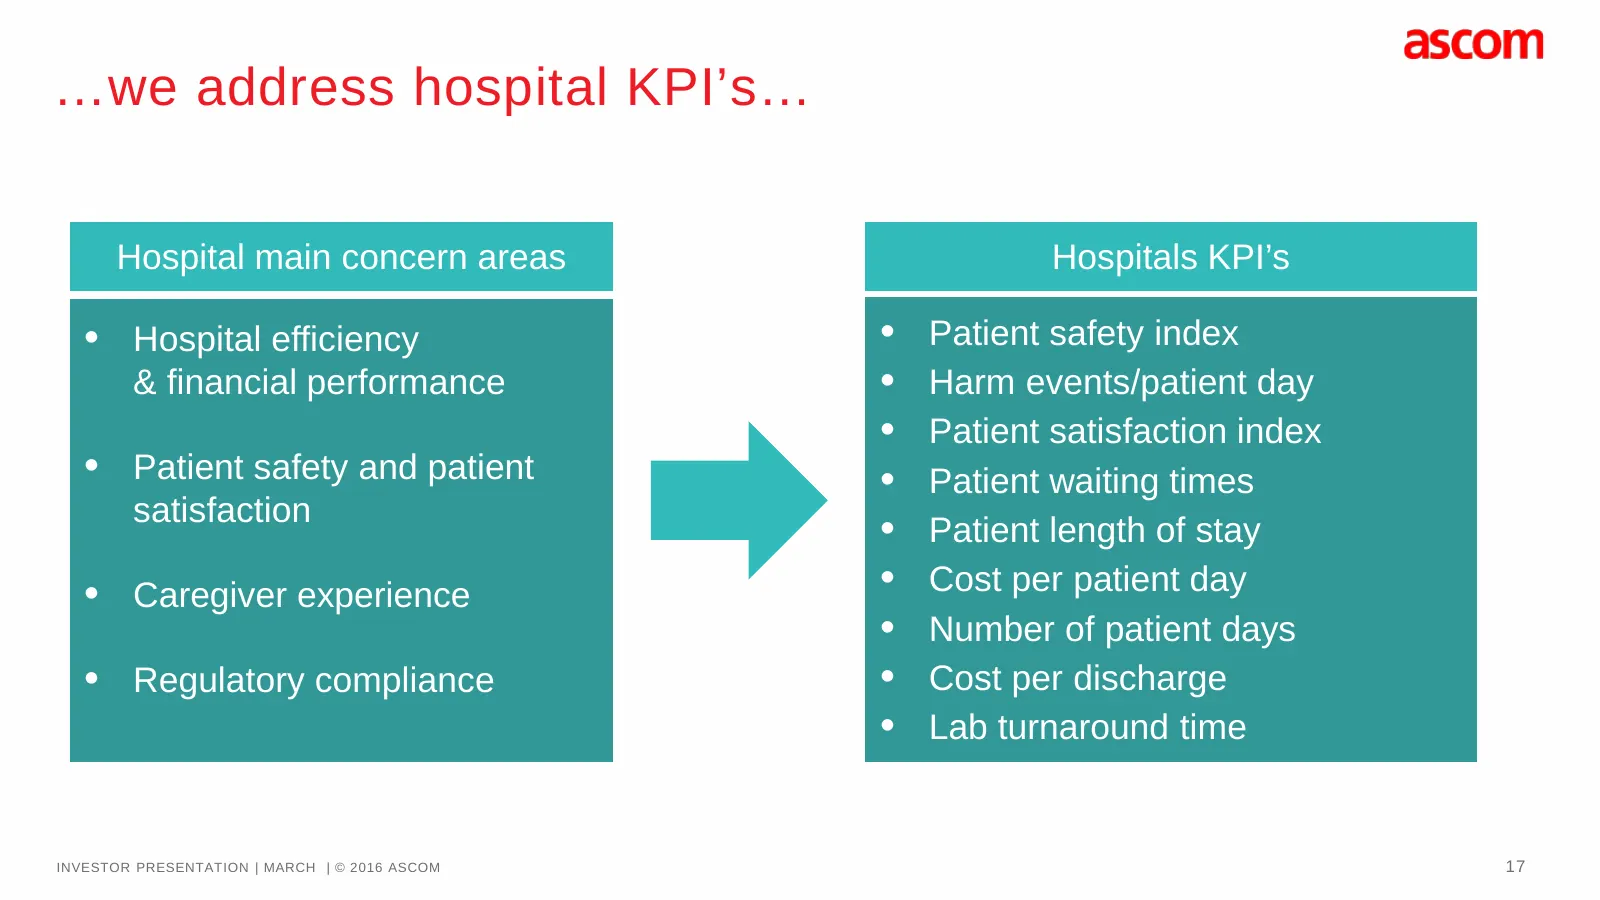
Slide 17: …we address hospital KPI’s…
…we address hospital KPI’s… • Hospital main concern areas Hospitals KPI’s • Hospital efficiency • Patient safety index & financial performance • Harm events/patient day • Patient satisfaction index • Patient safety and patient • Patient waiting times satisfaction • Patient length of stay • Caregiver
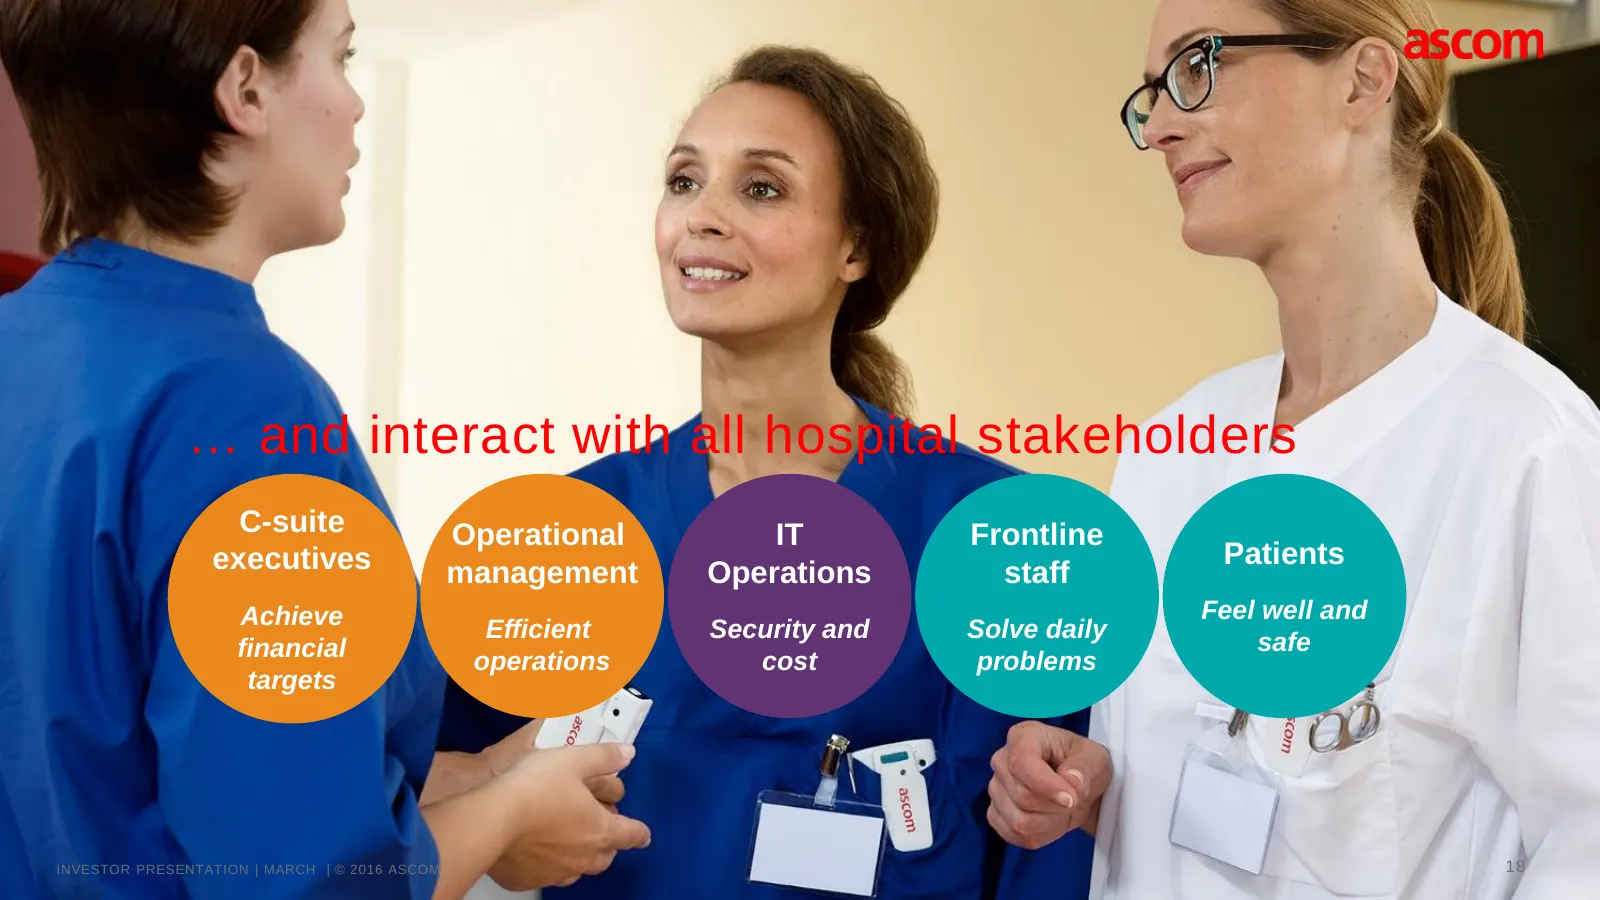
Slide 18: … and interact with all hospital stakeholders
… and interact with all hospital stakeholders C-suite Operational IT Frontline executives Patients management Operations staff Achieve Feel well and Efficient Security and Solve daily financial safe operations cost problems targets INVESTOR PRESENTATION | MARCH | © 2016 ASCOM 18
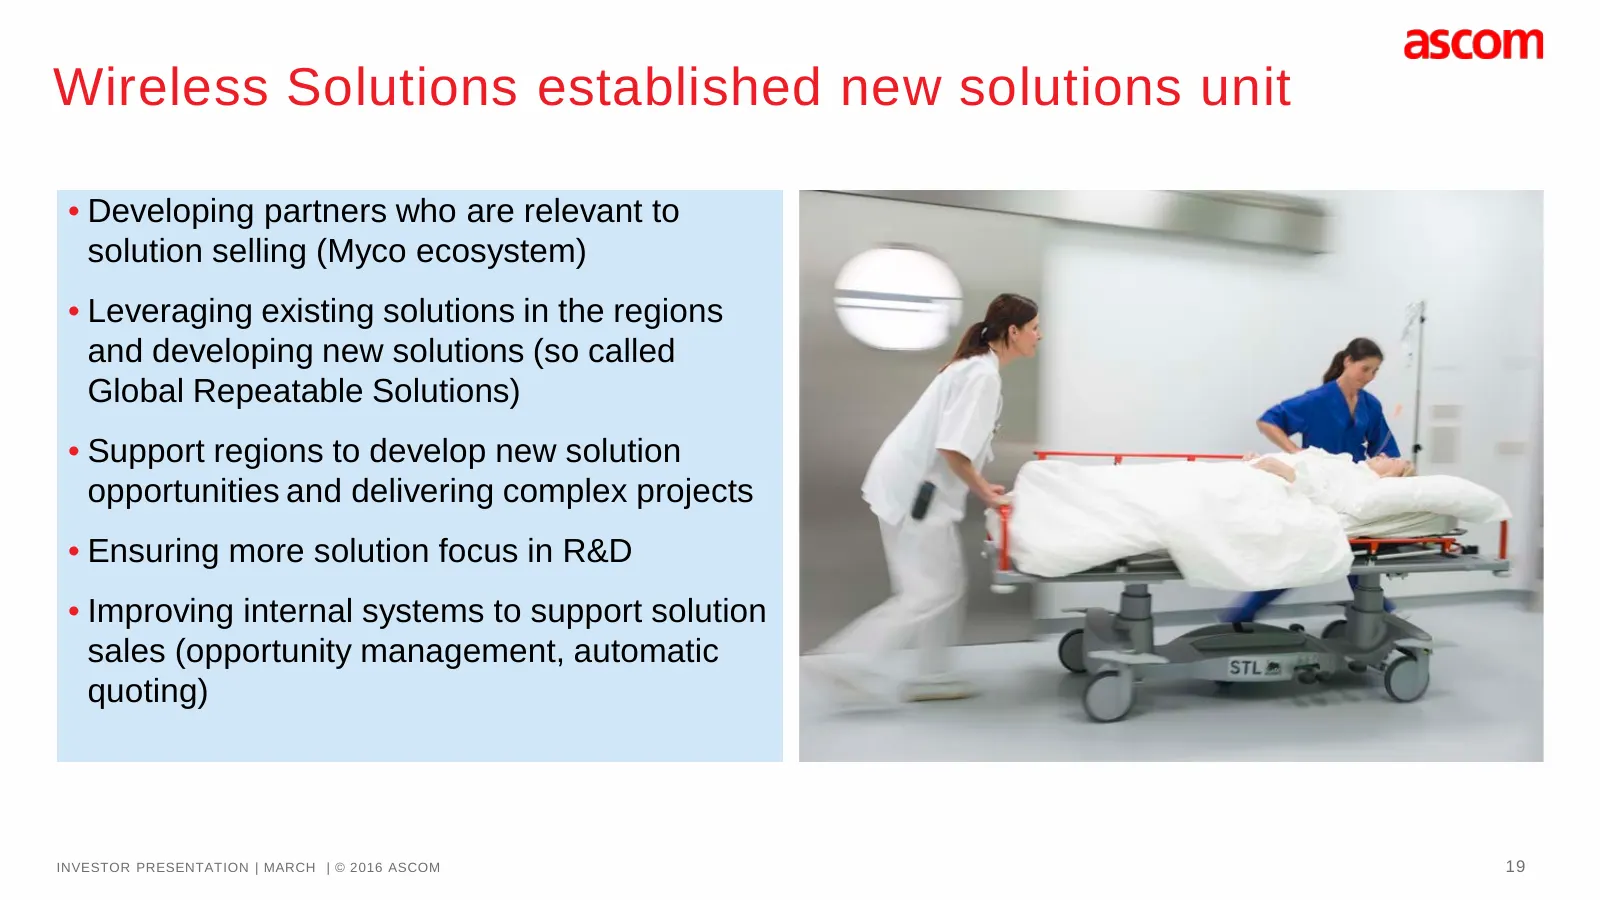
Slide 19: Wireless Solutions established new solutions unit
Wireless Solutions established new solutions unit • Developing partners who are relevant to solution selling (Myco ecosystem) • Leveraging existing solutions in the regions and developing new solutions (so called Global Repeatable Solutions) • Support regions to develop new solution opportunities an
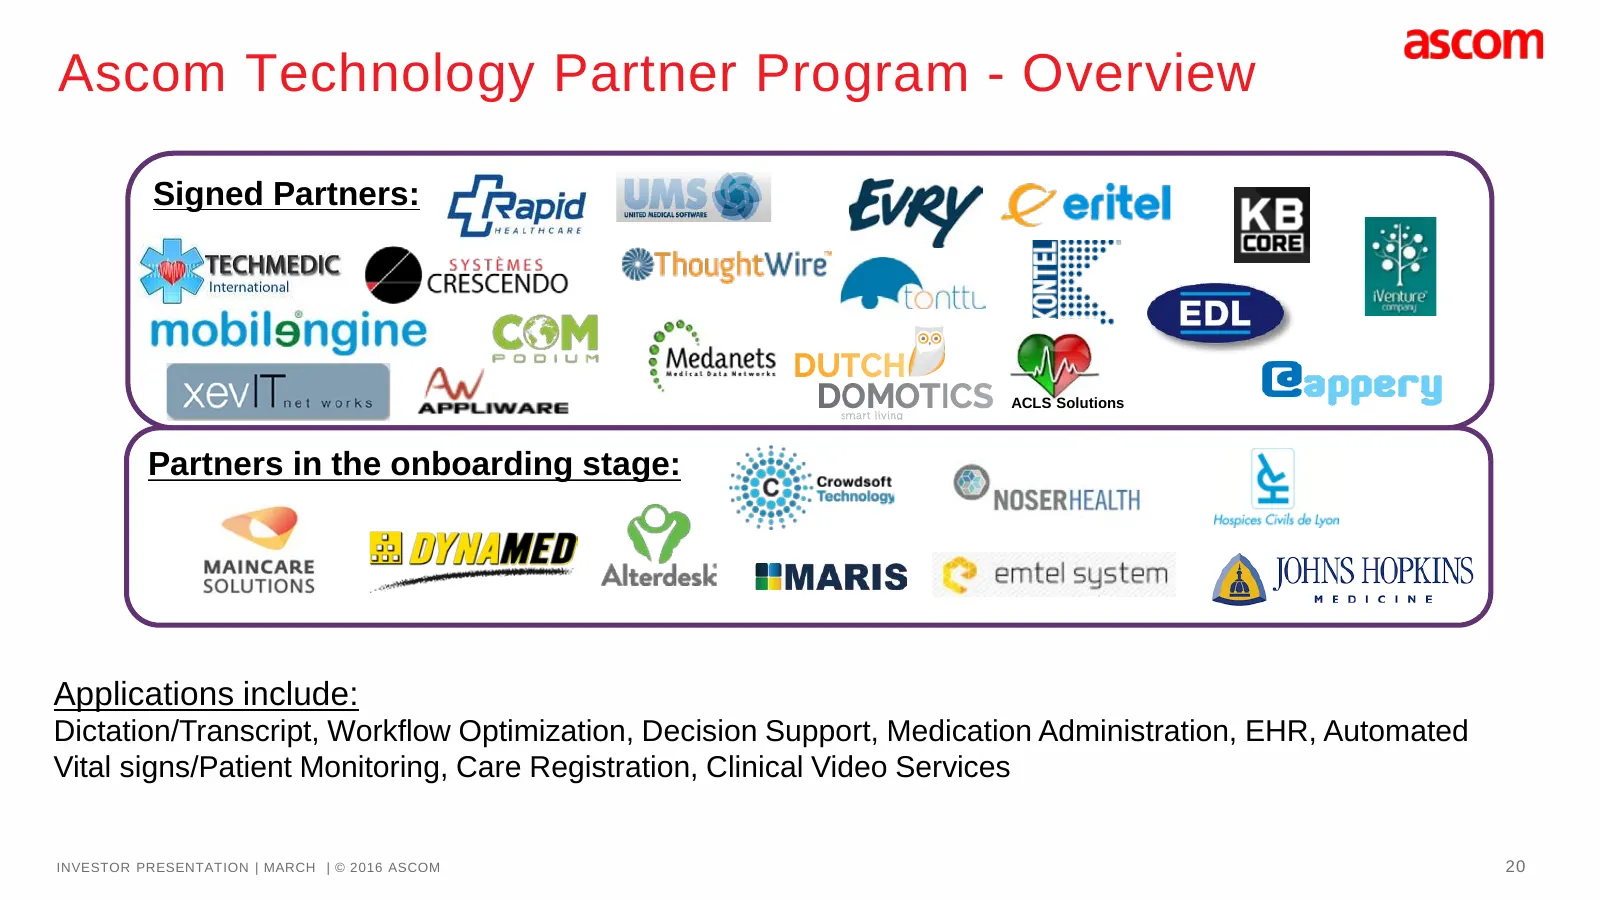
Slide 20: Ascom Technology Partner Program - Overview
Ascom Technology Partner Program - Overview Signed Partners: ACLS Solutions Partners in the onboarding stage: Applications include: Dictation/Transcript, Workflow Optimization, Decision Support, Medication Administration, EHR, Automated Vital signs/Patient Monitoring, Care Registration, Clinical Vid
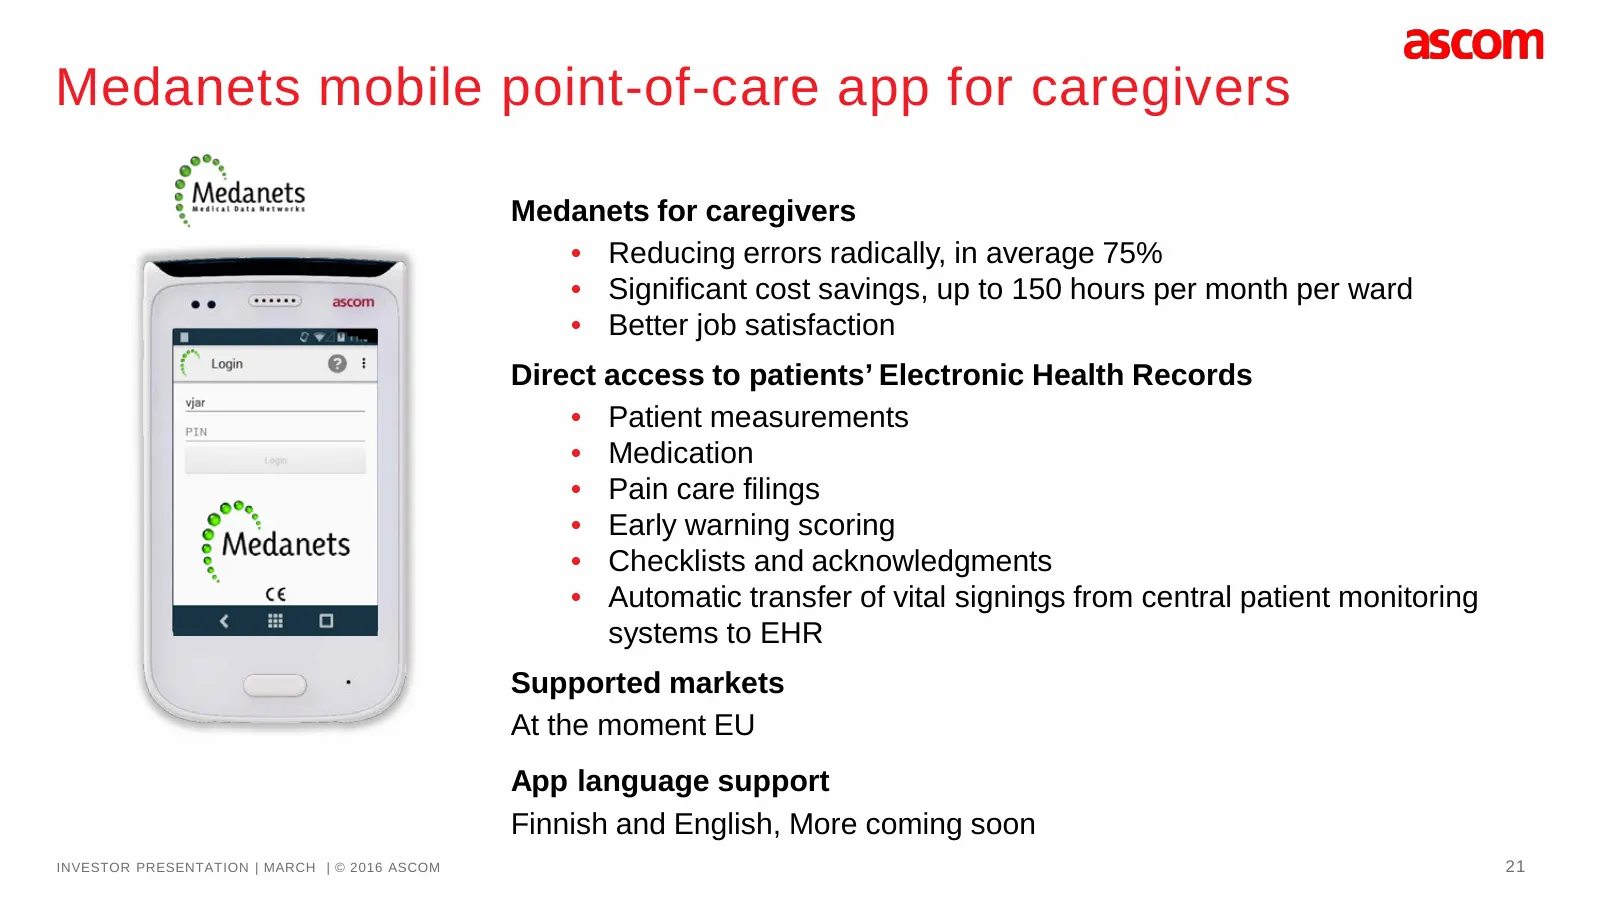
Slide 21: Medanets mobile point-of-care app for caregivers
Medanets mobile point-of-care app for caregivers Medanets for caregivers • Reducing errors radically, in average 75% • Significant cost savings, up to 150 hours per month per ward • Better job satisfaction Direct access to patients’ Electronic Health Records • Patient measurements • Medication • Pai
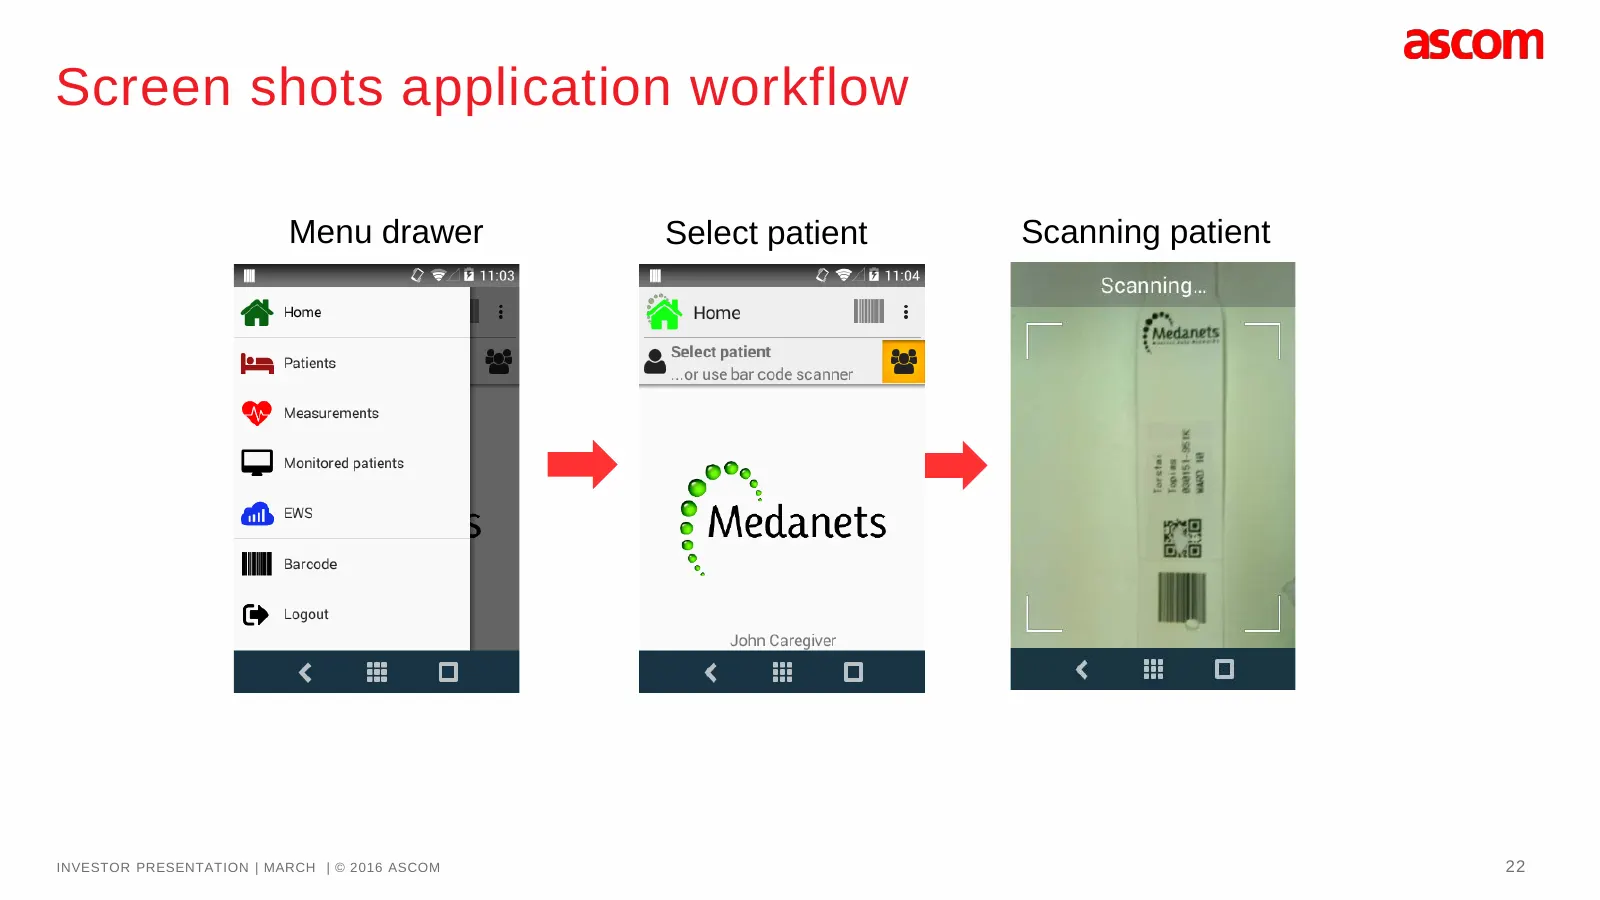
Slide 22: Screen shots application workflow
Screen shots application workflow Menu drawer Select patient Scanning patient INVESTOR PRESENTATION | MARCH | © 2016 ASCOM 22
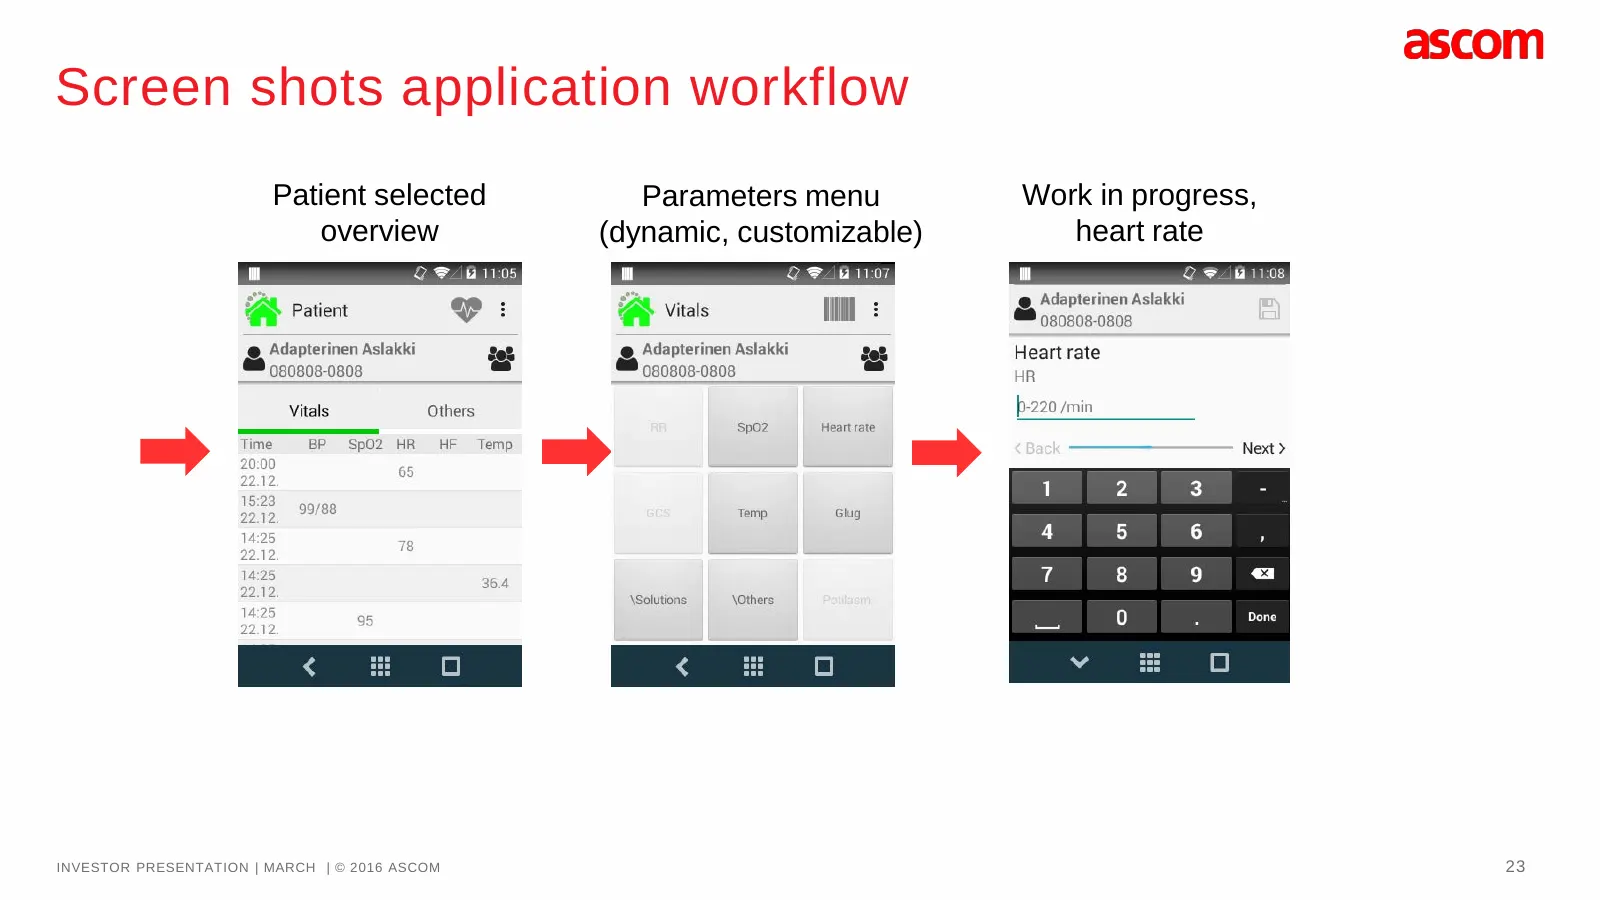
Slide 23: Screen shots application workflow
Screen shots application workflow Patient selected Parameters menu Work in progress, overview (dynamic, customizable) heart rate INVESTOR PRESENTATION | MARCH | © 2016 ASCOM 23
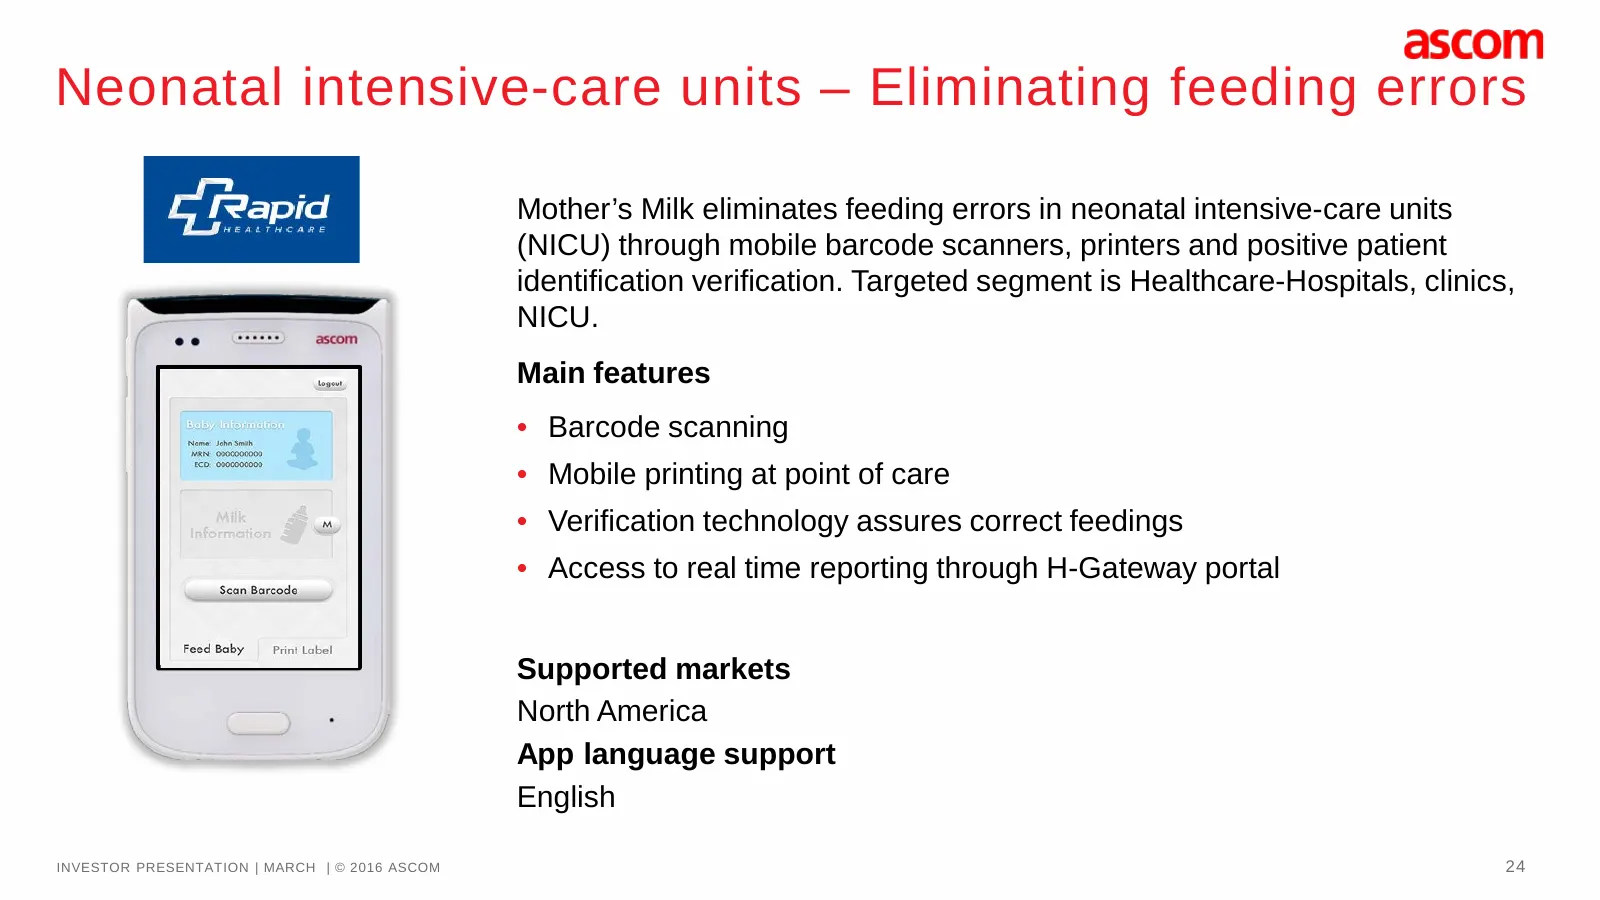
Slide 24: Neonatal intensive-care units – Eliminating feeding errors
Neonatal intensive-care units – Eliminating feeding errors Mother’s Milk eliminates feeding errors in neonatal intensive-care units (NICU) through mobile barcode scanners, printers and positive patient identification verification. Targeted segment is Healthcare-Hospitals, clinics, NICU. Main feature
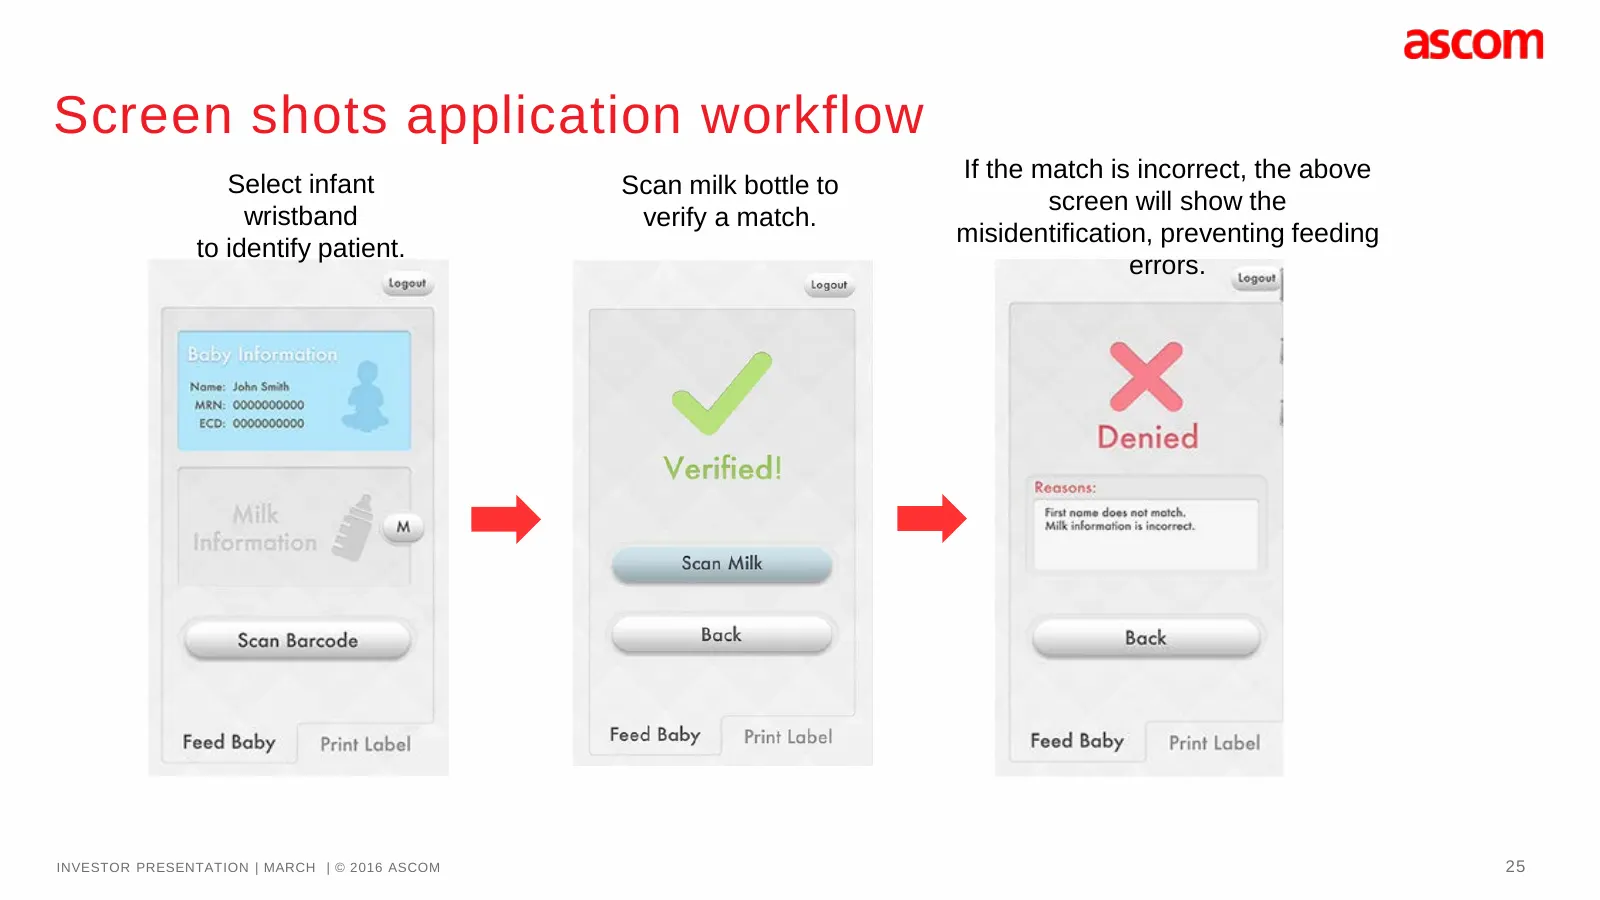
Slide 25: Screen shots application workflow
Screen shots application workflow If the match is incorrect, the above Select infant Scan milk bottle to screen will show the wristband verify a match. misidentification, preventing feeding to identify patient. errors. INVESTOR PRESENTATION | MARCH | © 2016 ASCOM 25
Slide 26: Wireless Solutions is well under way
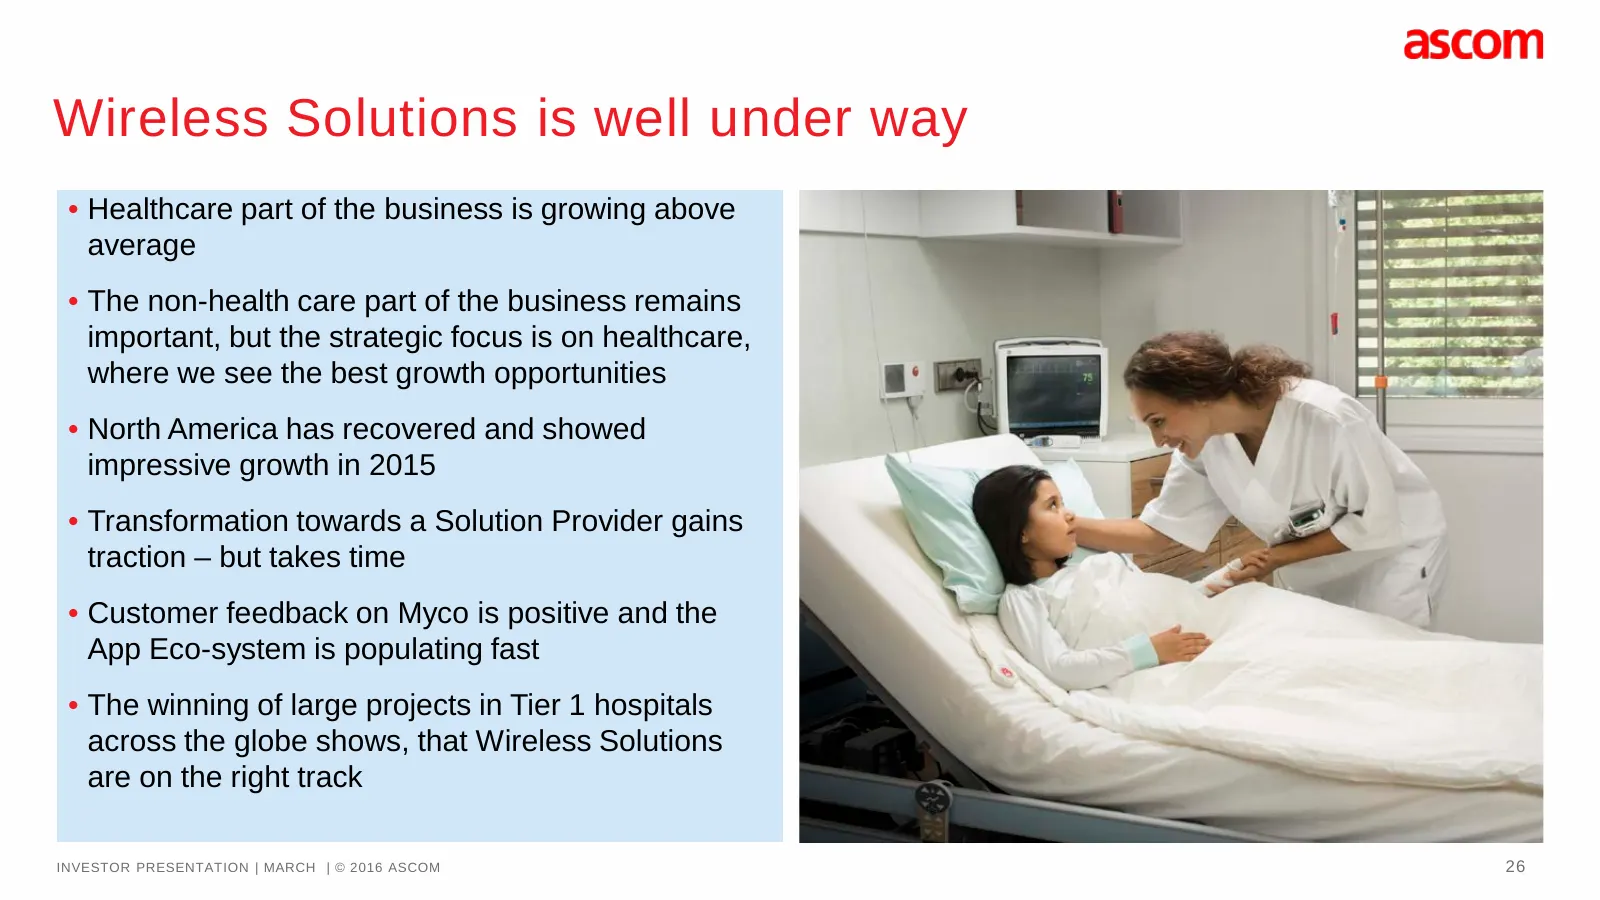
Wireless Solutions is well under way • Healthcare part of the business is growing above average • The non-health care part of the business remains important, but the strategic focus is on healthcare, where we see the best growth opportunities • North America has recovered and showed impressive growt
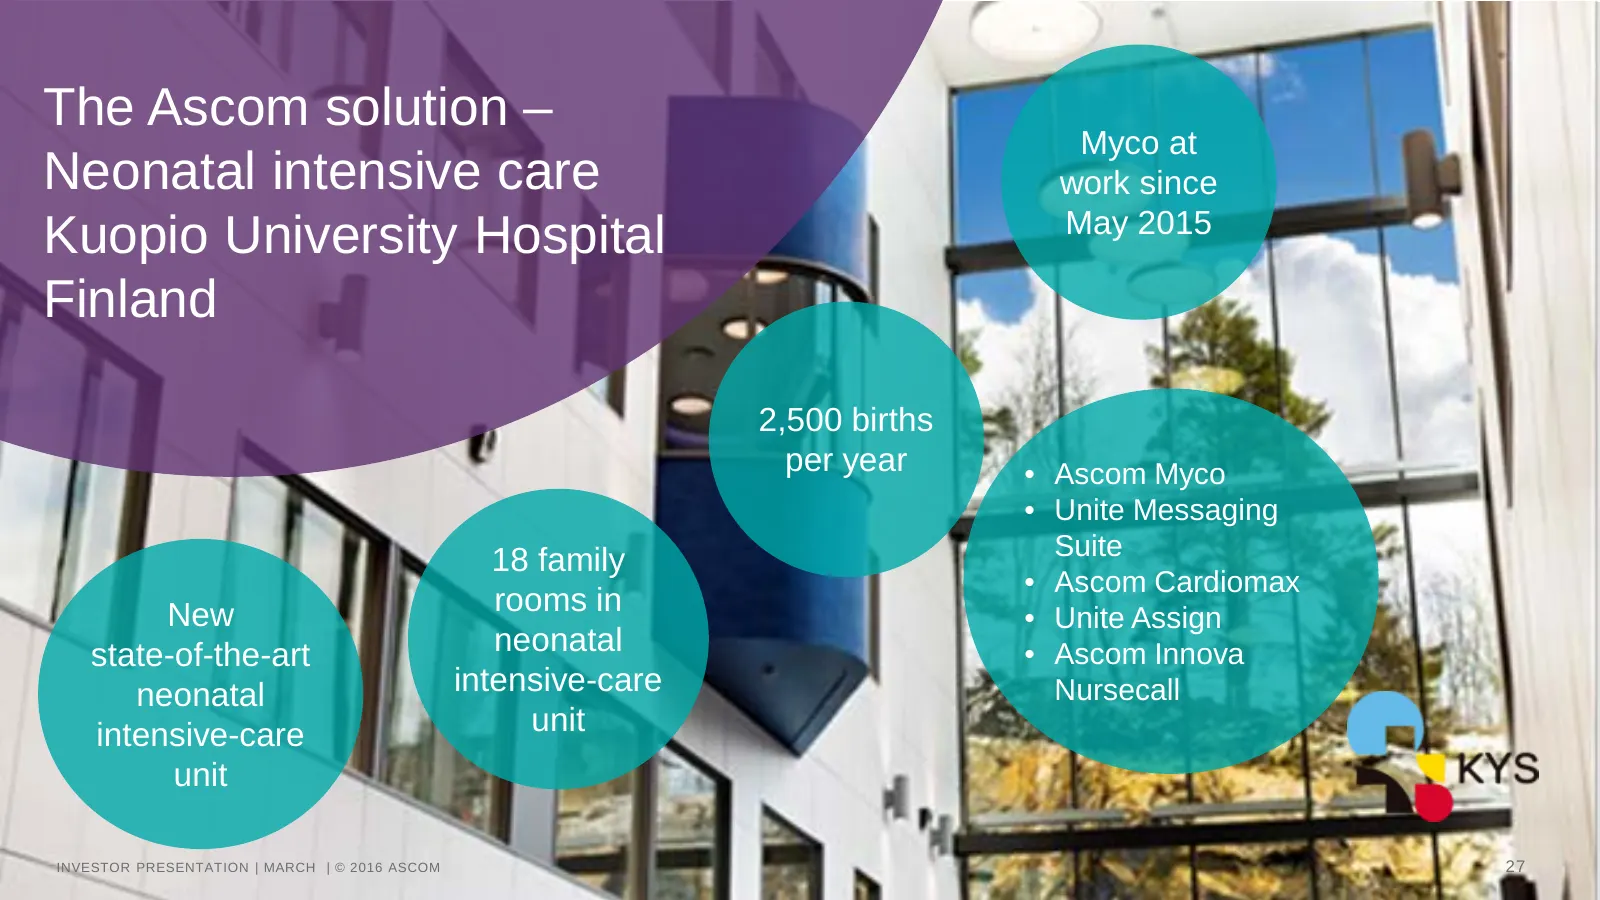
Slide 27: The Ascom solution – Neonatal intensive care Kuopio University Hospital
The Ascom solution – Myco at Neonatal intensive care work since May 2015 Kuopio University Hospital Finland 2,500 births per year • Ascom Myco • Unite Messaging Suite 18 family • Ascom Cardiomax New rooms in • Unite Assign state-of-the-art neonatal • Ascom Innova neonatal intensive-care Nursecall in
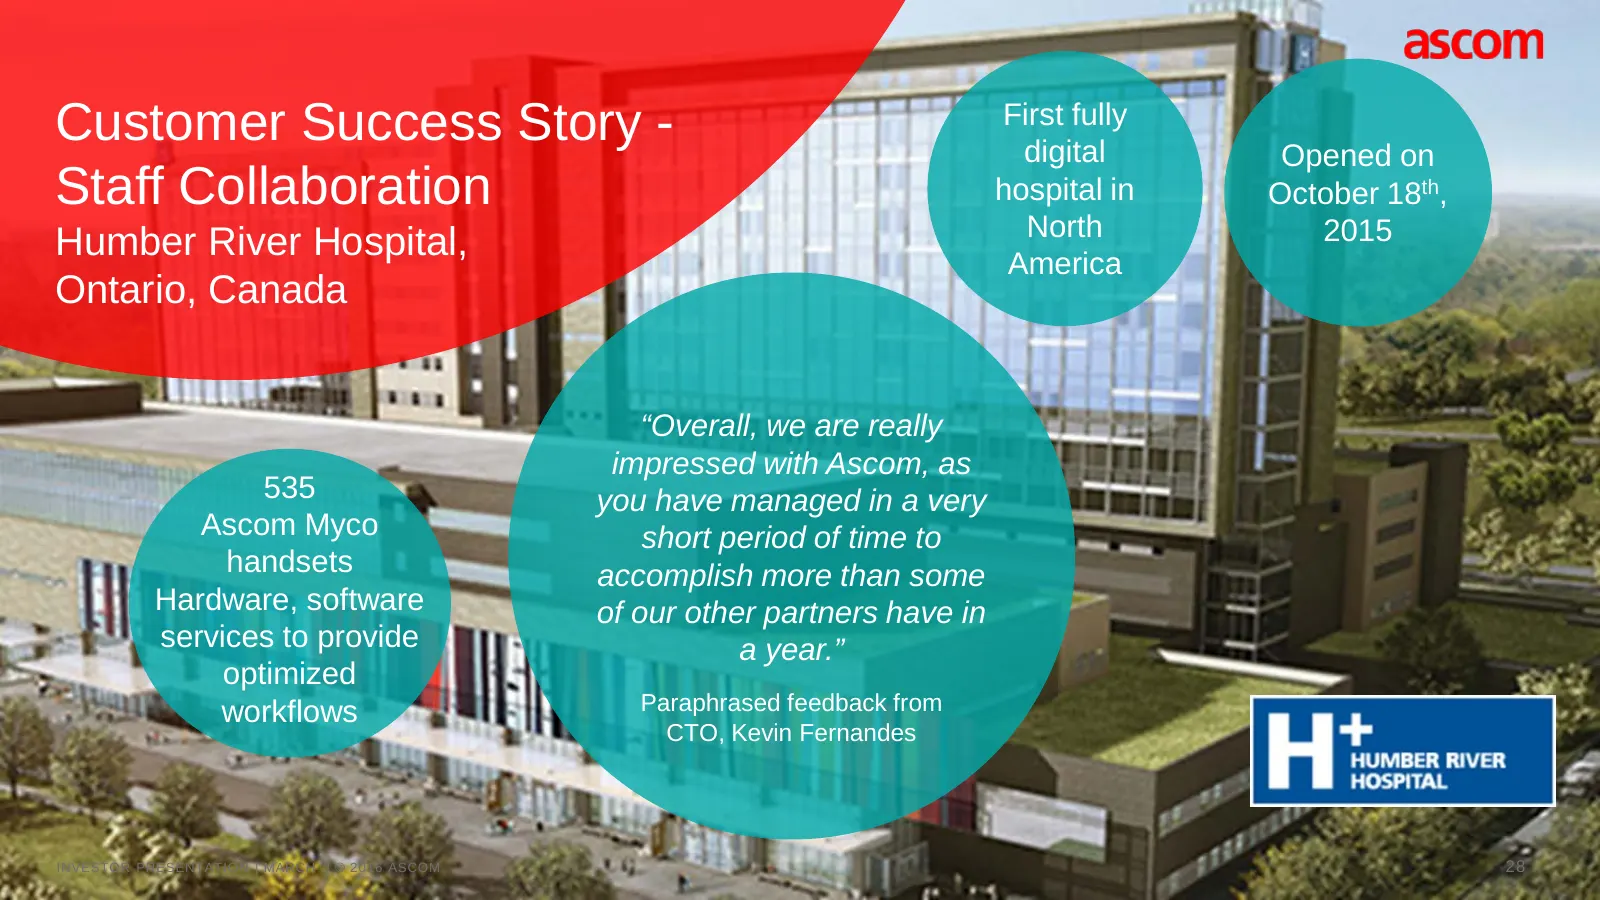
Slide 28: Customer Success Story - Staff Collaboration
Customer Success Story - First fully digital Opened on Staff Collaboration hospital in October 18th, North 2015 Humber River Hospital, America Ontario, Canada “Overall, we are really impressed with Ascom, as 535 you have managed in a very Ascom Myco short period of time to handsets accomplish more t
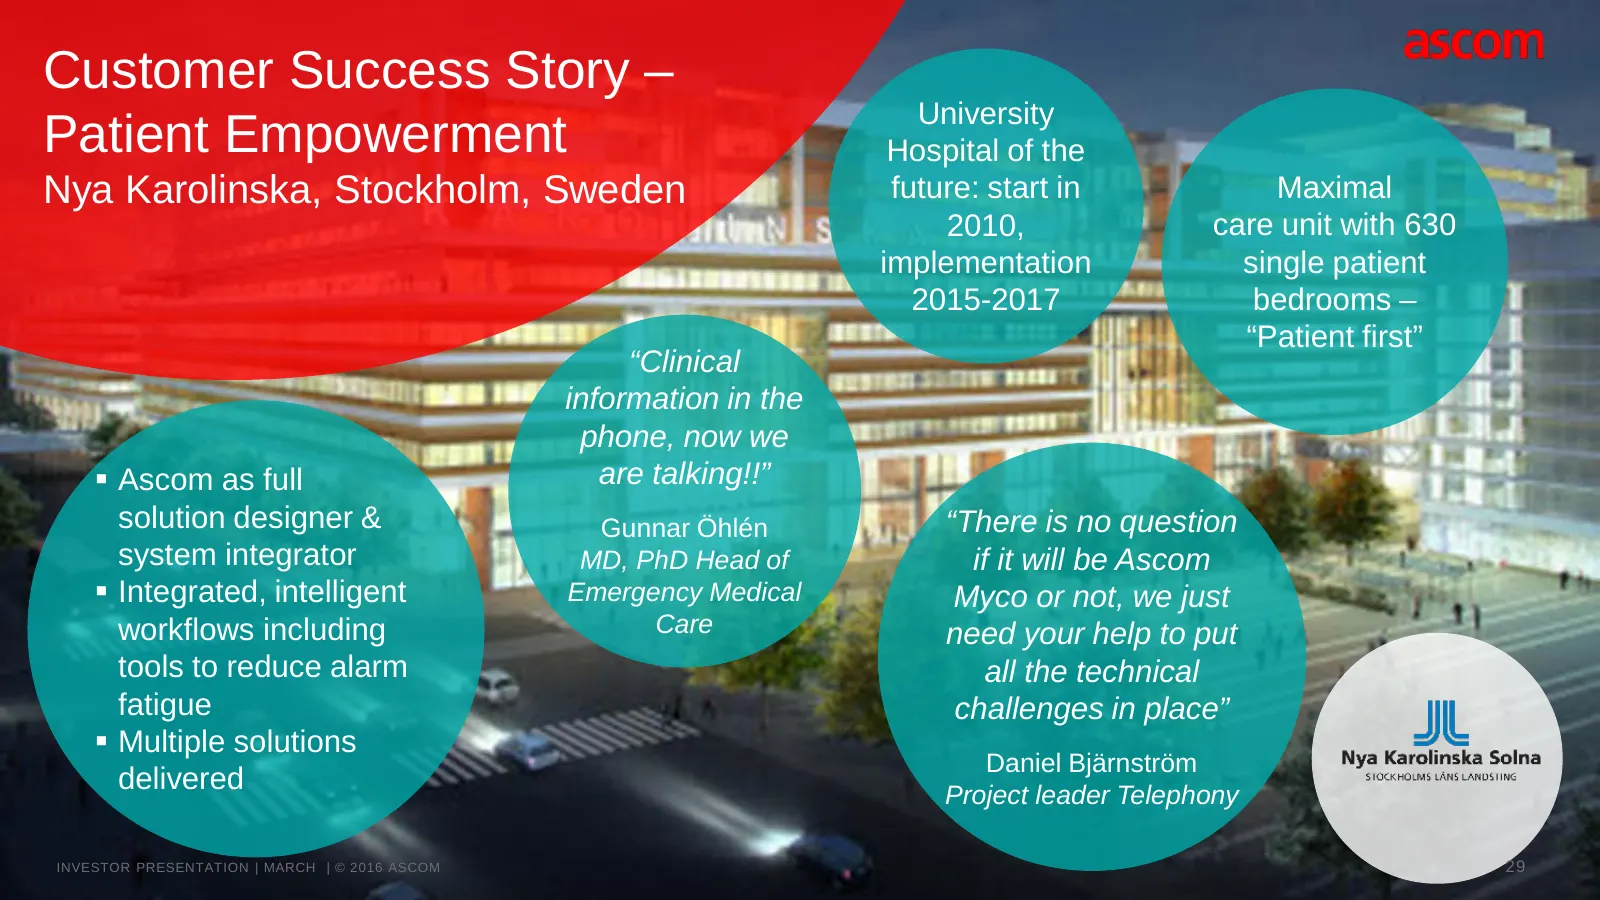
Slide 29: Customer Success Story – Patient Empowerment
Customer Success Story – University Patient Empowerment Hospital of the Nya Karolinska, Stockholm, Sweden future: start in Maximal 2010, care unit with 630 implementation single patient 2015-2017 bedrooms – “Patient first” “Clinical information in the phone, now we Ascom as full are talking!!” sol
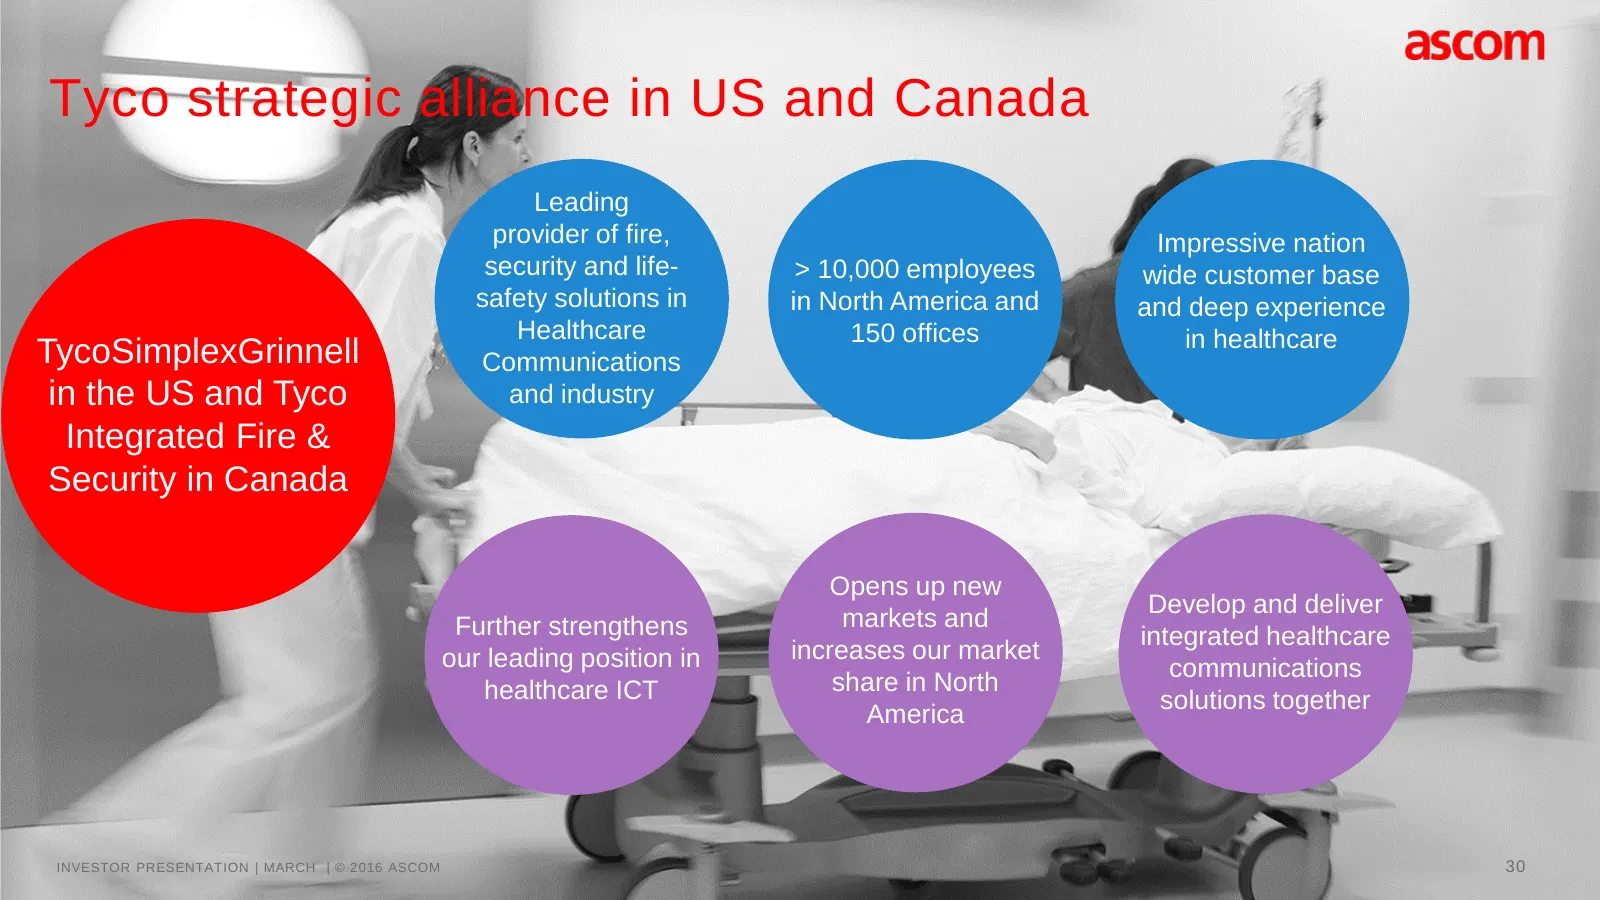
Slide 30: Tyco strategic alliance in US and Canada
Tyco strategic alliance in US and Canada Leading provider of fire, Impressive nation security and life- > 10,000 employees wide customer base safety solutions in in North America and and deep experience Healthcare 150 offices in healthcare TycoSimplexGrinnell Communications in the US and Tyco and in
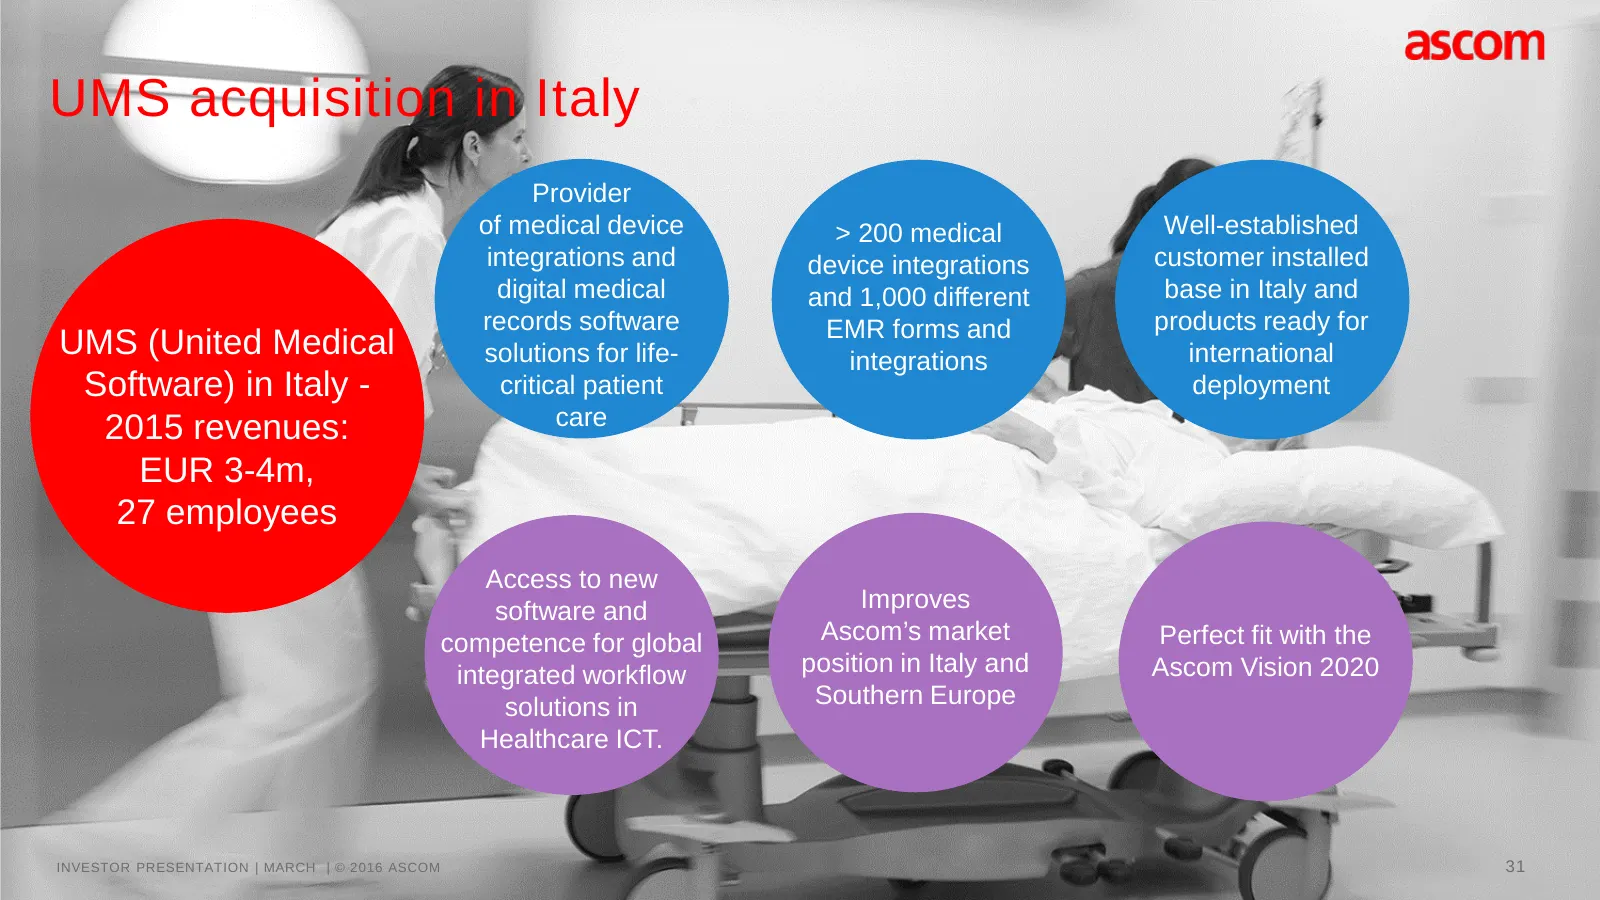
Slide 31: UMS acquisition in Italy
UMS acquisition in Italy Provider of medical device > 200 medical Well-established integrations and device integrations customer installed digital medical and 1,000 different base in Italy and records software EMR forms and products ready for UMS (United Medical solutions for life- integrations inte
Slide 32: 2015 profitability impacted by investments and FX
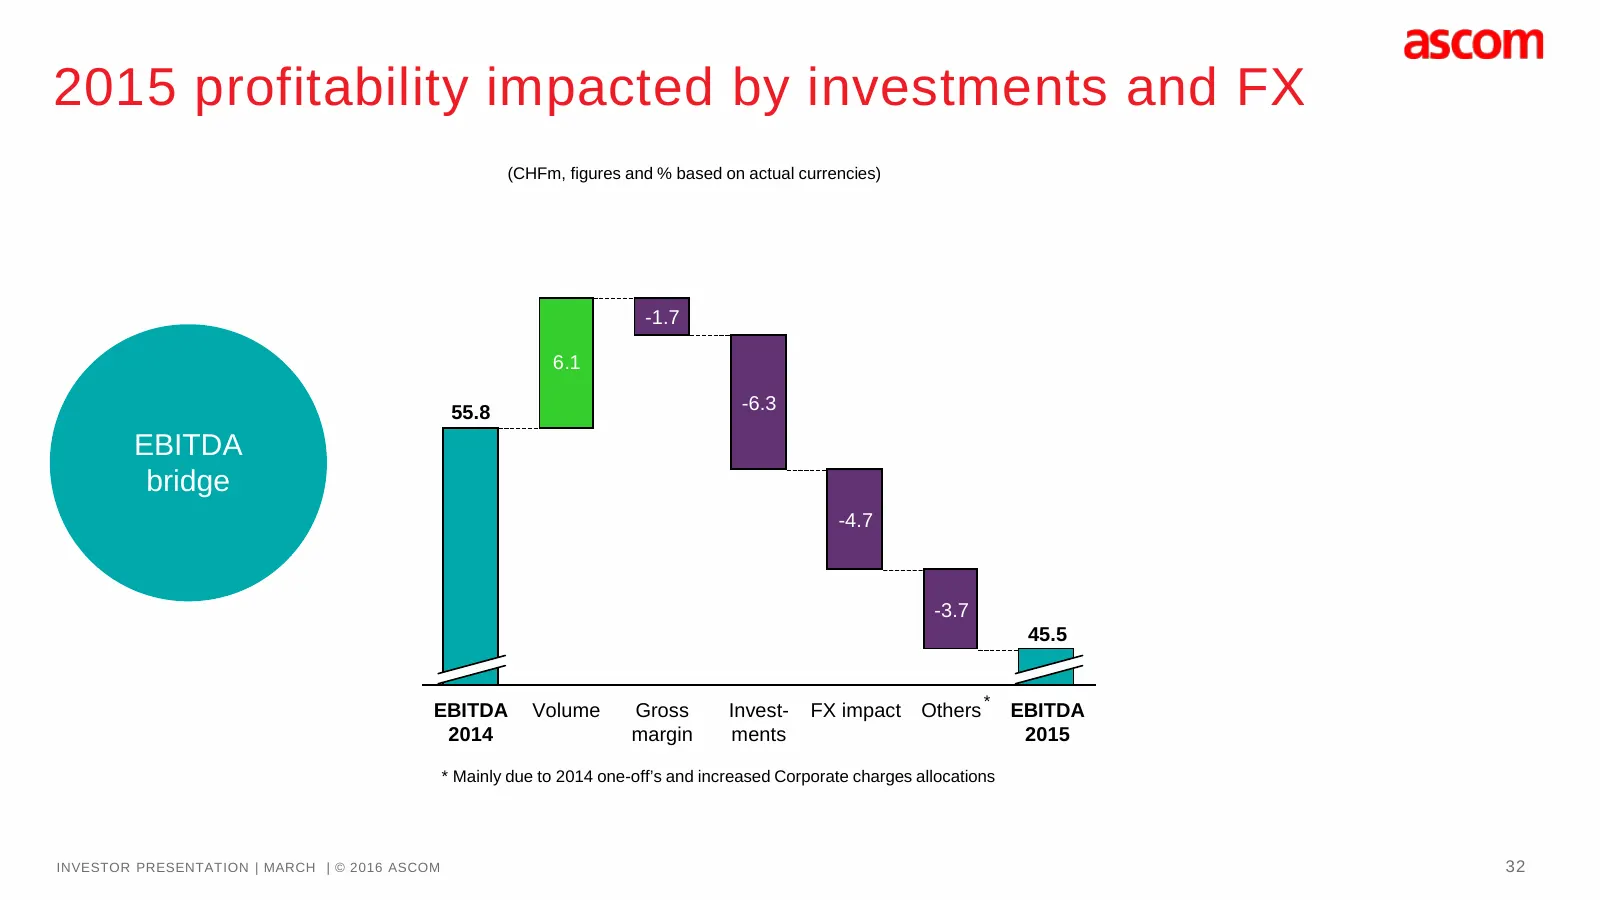
2015 profitability impacted by investments and FX (CHFm, figures and % based on actual currencies) -1.7 6.1 55.8 -6.3 EBITDA bridge -4.7 -3.7 45.5 EBITDA Volume Gross Invest- FX impact Others * EBITDA 2014 margin ments 2015 * Mainly due to 2014 one-off’s and increased Corporate charges allocations I
Slide 33: Half-yearly seasonality
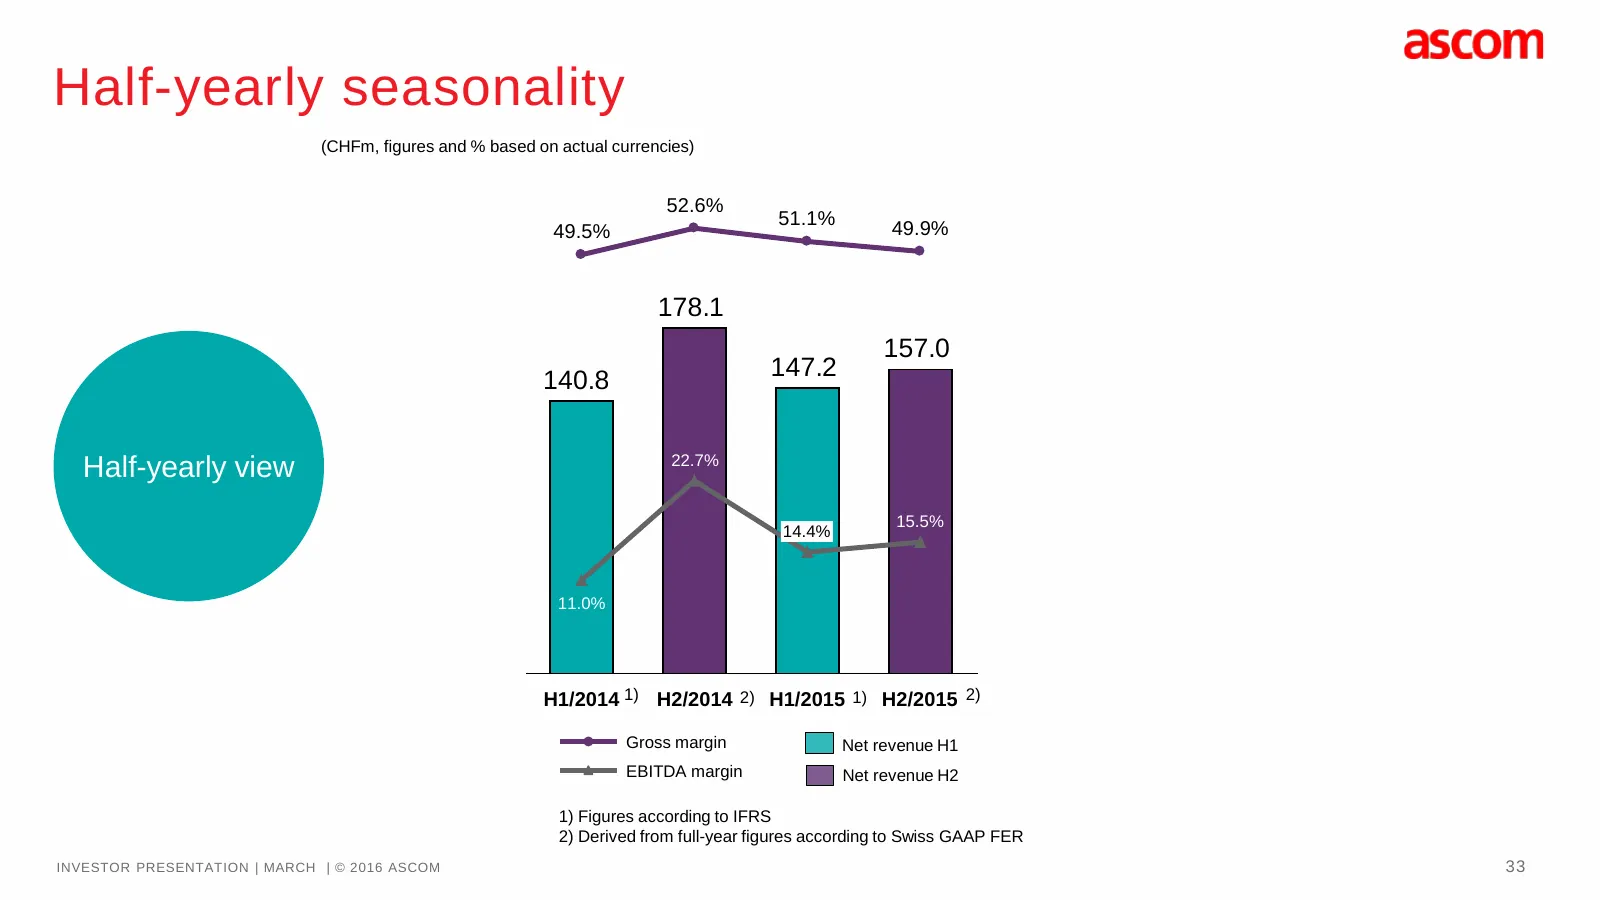
Half-yearly seasonality (CHFm, figures and % based on actual currencies) 52.6% 51.1% 49.9% 49.5% 178.1 157.0 140.8 147.2 22.7% Half-yearly view 15.5% 14.4% 11.0% H1/2014 1) H2/2014 2) H1/2015 1) H2/2015 2) Gross margin Net revenue H1 EBITDA margin Net revenue H2 1) Figures according to IFRS 2) Deriv

Slide 34: Ascom in Telecommunications
Ascom in Telecommunications INVESTOR PRESENTATION | MARCH | © 2016 ASCOM 34
Slide 35: Net revenue development – NT 25% of Ascom Group
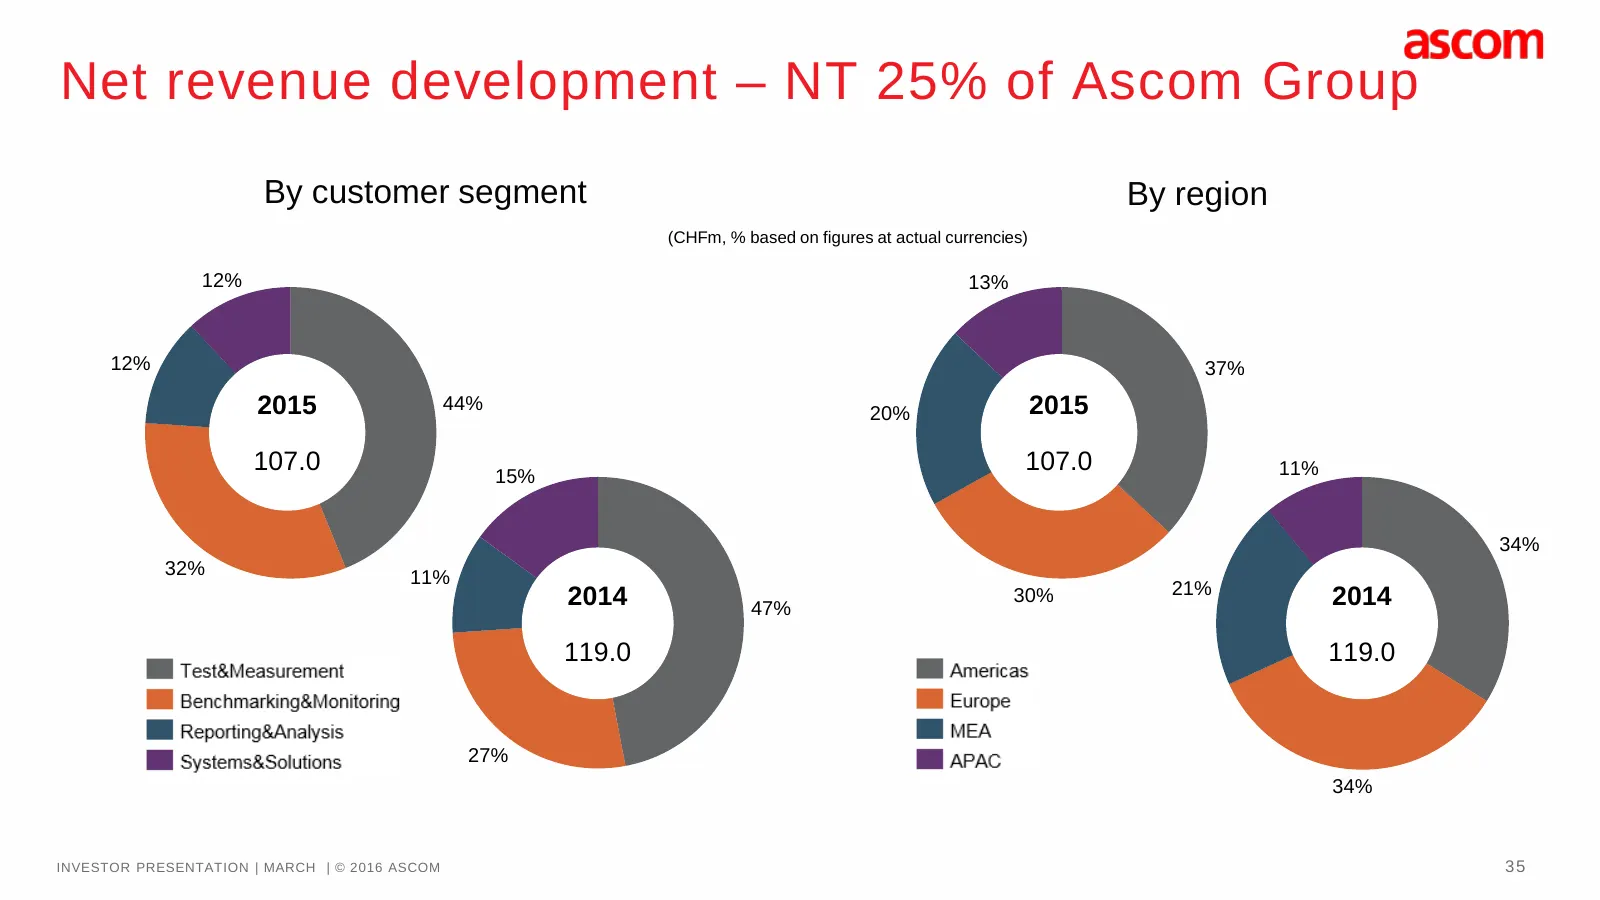
Net revenue development – NT 25% of Ascom Group By customer segment By region (CHFm, % based on figures at actual currencies) 12% 13% 12% 37% 2015 44% 20% 2015 107.0 15% 107.0 11% 34% 32% 11% 2014 30% 21% 2014 47% 119.0 119.0 27% 34% INVESTOR PRESENTATION | MARCH | © 2016 ASCOM 35
Slide 36: Expanded addressable market
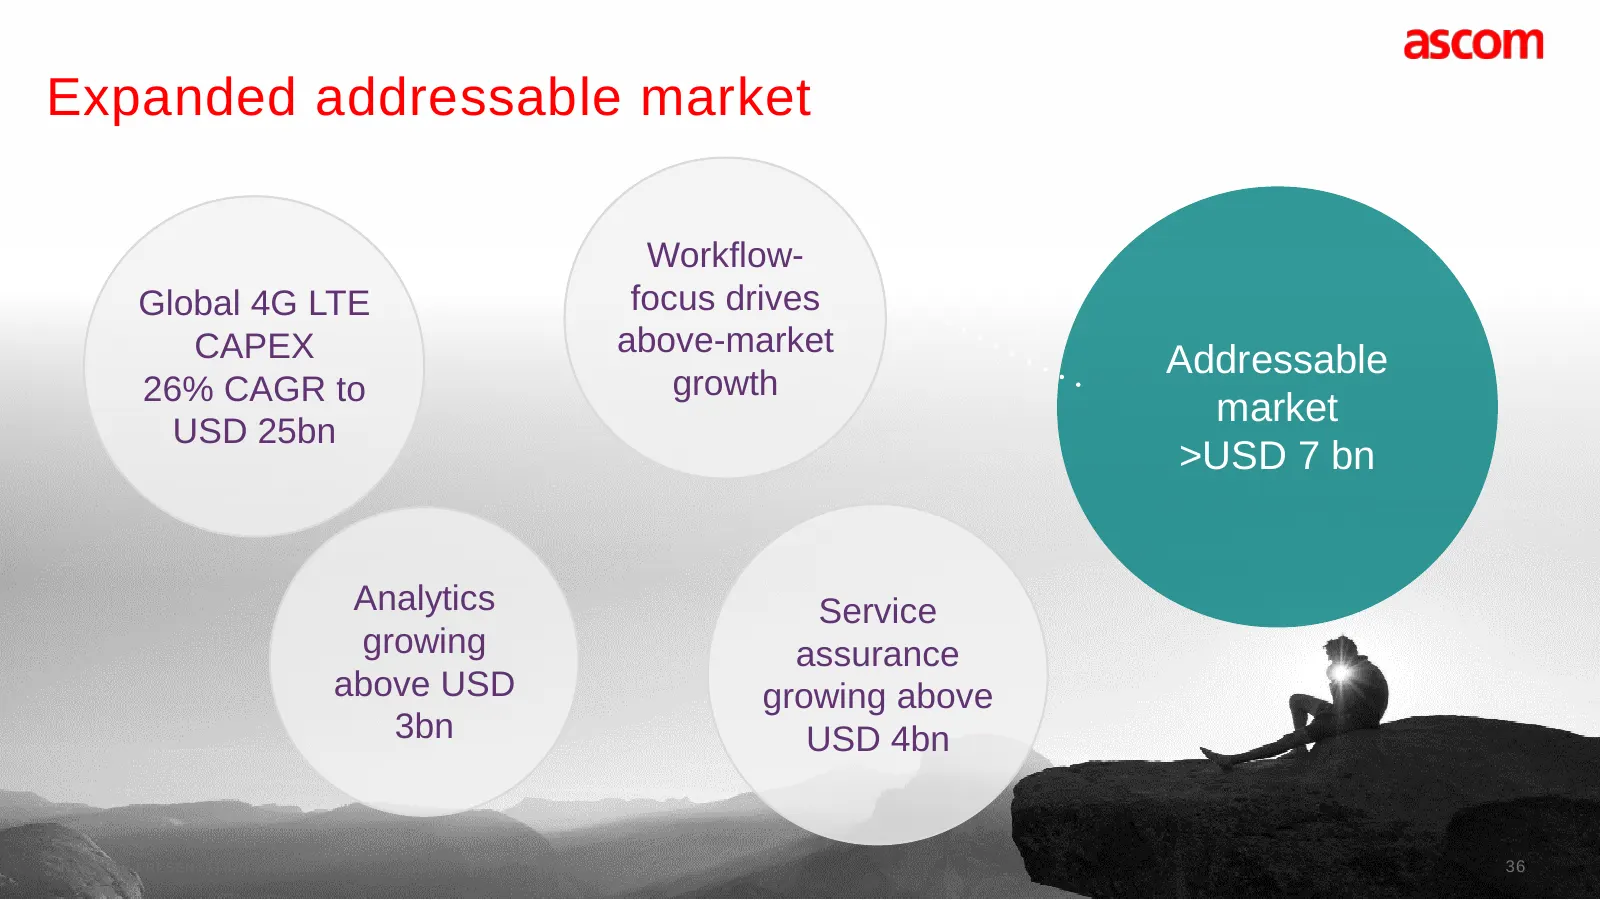
Expanded addressable market Workflow- Global 4G LTE focus drives CAPEX above-market Addressable 26% CAGR to growth market USD 25bn >USD 7 bn Analytics Service growing assurance above USD growing above 3bn USD 4bn INVESTOR PRESENTATION | MARCH | © 2016 ASCOM 36
Slide 37: Fast changing environment
Fast changing environment • The rapidly evolving market environment in Mobile Telecommunications creates attractive growth pockets • Ascom is evaluating strategic options for Network Testing • Ascom divested business unit Systems & Solutions in December 2015 INVESTOR PRESENTATION | MARCH | © 2016 AS
Slide 38: Ranplan partnering improves market position of Network Testing
Ranplan partnering improves market position of Network Testing • In-building and small cells increasing rapidly to meet capacity demands • Number and location of sites makes rollouts costly and hard to manage • Ranplan partnering gives Network Testing exclusive ability to integrate, market and sell
Slide 39: Network Testing with exclusive access to China Mobile
Network Testing with exclusive access to China Mobile • China Mobile, the worlds largest wireless operator, in 2015 selected only 3 partners to provide network testing solutions for LTE and VoLTE deployments • Based on extensive evaluations Network Testing was the only non-Chinese vendor selected •
Slide 40: Service assurance business reflects market growth
Service assurance business reflects market growth • Complex networks are difficult to test – end-user experience is true measure • Diverse services are impacted by various degradations and failures that need to be identified in order to solve performance problems for operators • Service assurance so
Slide 41: VoLTE-Testing is a key business driver for Network Testing
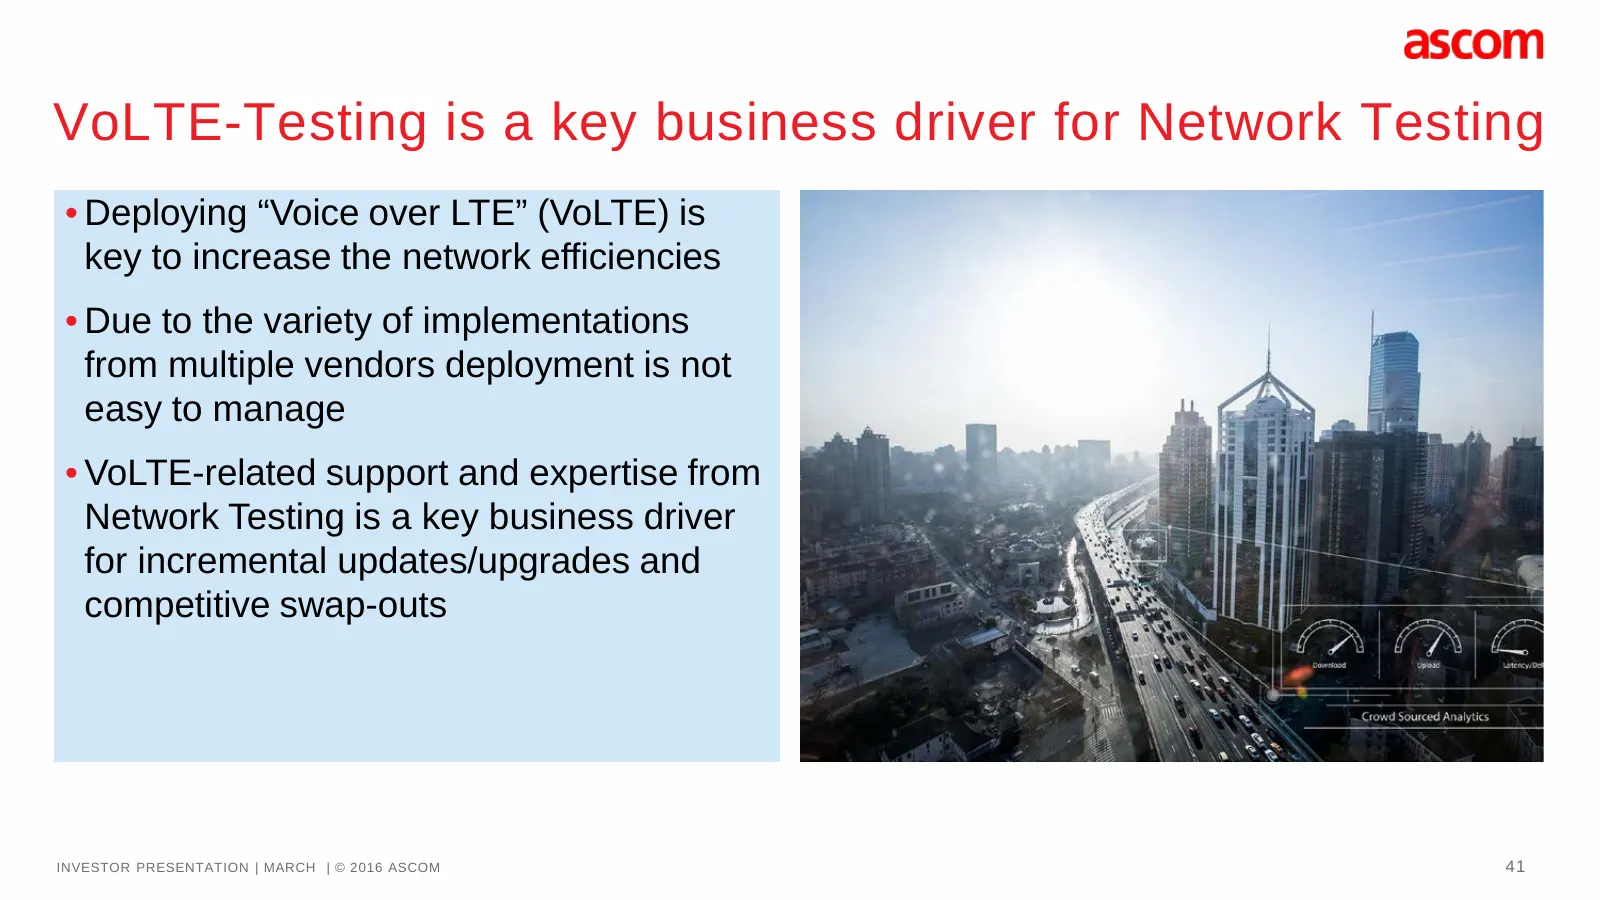
VoLTE-Testing is a key business driver for Network Testing • Deploying “Voice over LTE” (VoLTE) is key to increase the network efficiencies • Due to the variety of implementations from multiple vendors deployment is not easy to manage • VoLTE-related support and expertise from Network Testing is a k
Slide 42: 2015 profitability impacted by difficult H2 and restructuring
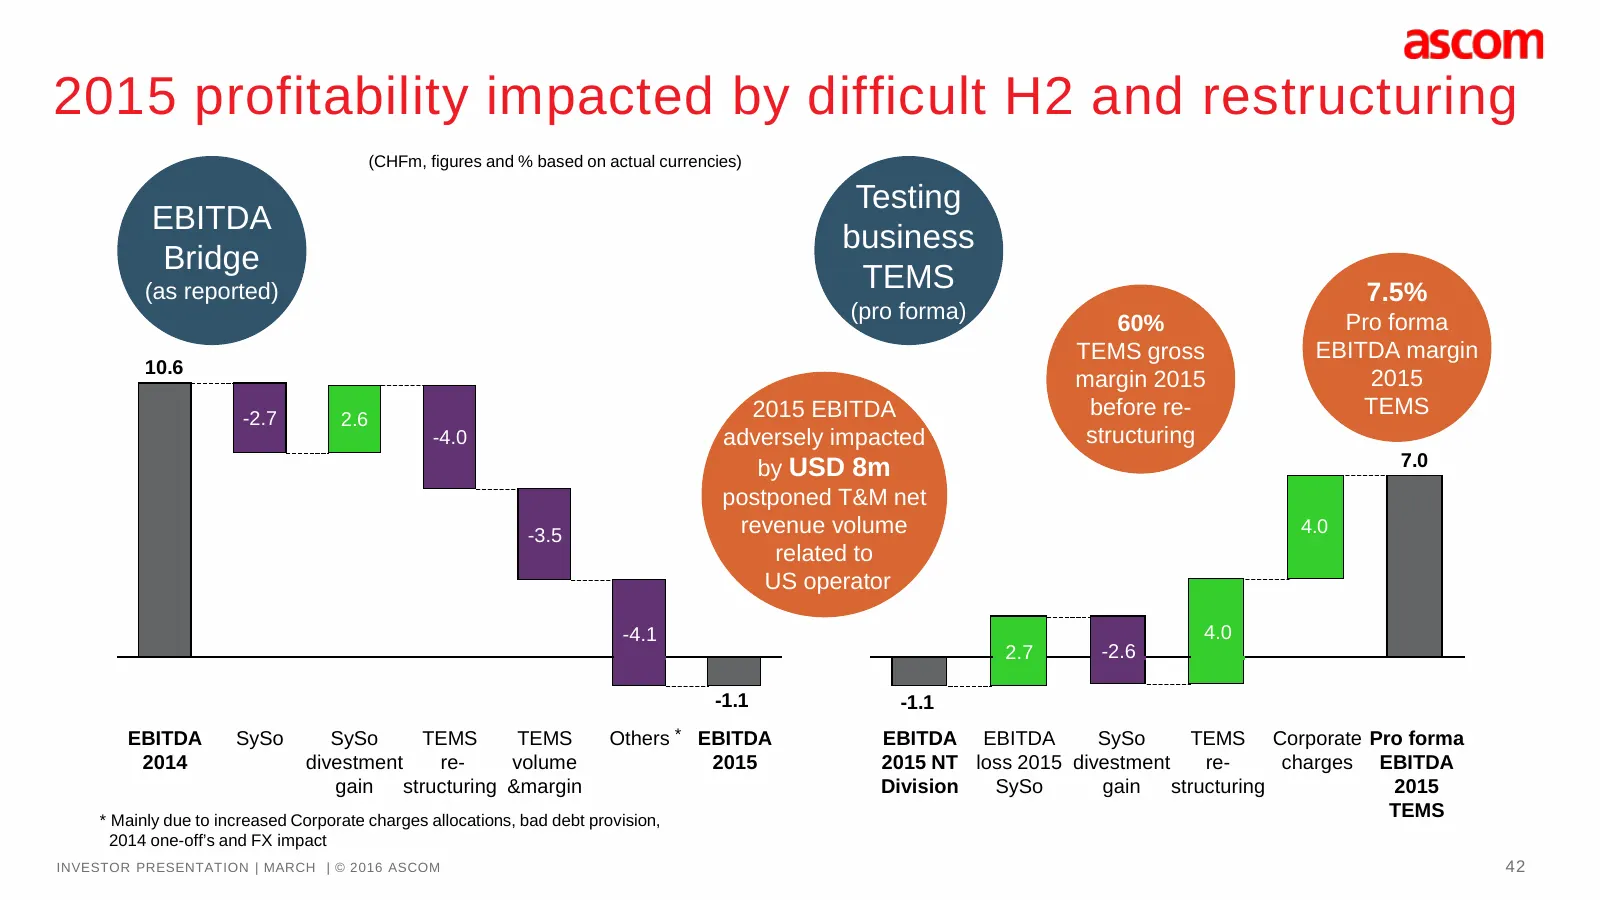
2015 profitability impacted by difficult H2 and restructuring (CHFm, figures and % based on actual currencies) Testing EBITDA business Bridge (as reported) TEMS 7.5% (pro forma) Pro forma 60% TEMS gross EBITDA margin 10.6 margin 2015 2015 -2.7 2015 EBITDA before re- TEMS 2.6 -4.0 adversely impacted
Slide 43: Half-yearly seasonality
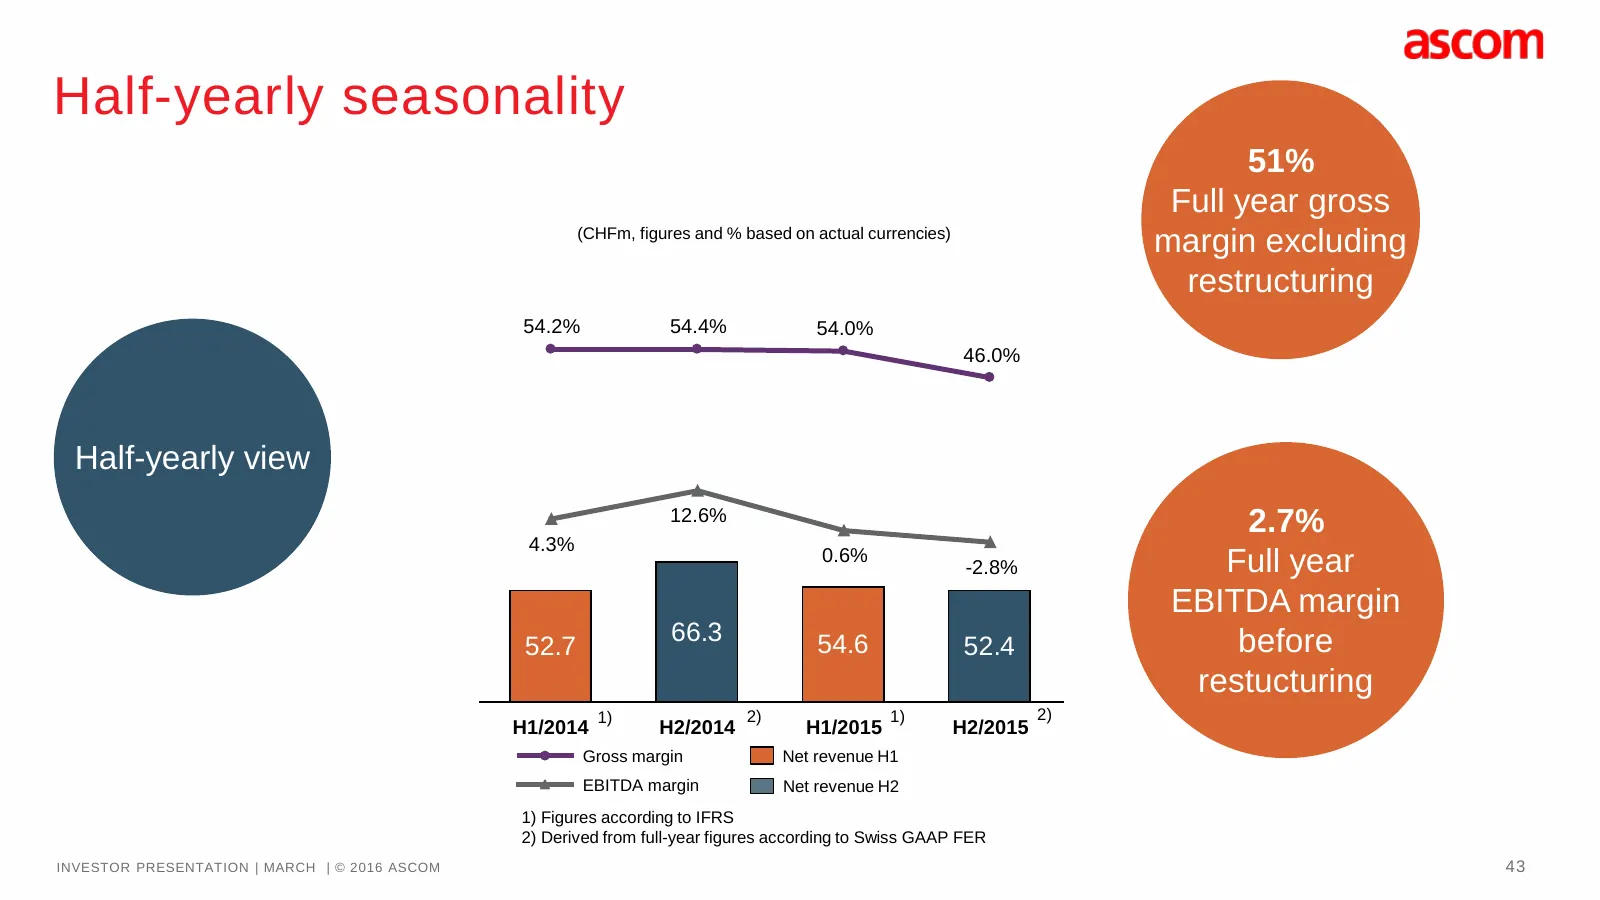
Half-yearly seasonality 51% Full year gross (CHFm, figures and % based on actual currencies) margin excluding restructuring 54.2% 54.4% 54.0% 46.0% Half-yearly view 12.6% 2.7% 4.3% 0.6% Full year -2.8% EBITDA margin 66.3 54.6 before 52.7 52.4 restucturing 1) 2) 1) 2) H1/2014 H2/2014 H1/2015 H2/2015
Slide 44: Ascom Group Financials & Outlook
Ascom Group Financials & Outlook INVESTOR PRESENTATION | MARCH | © 2016 ASCOM 44
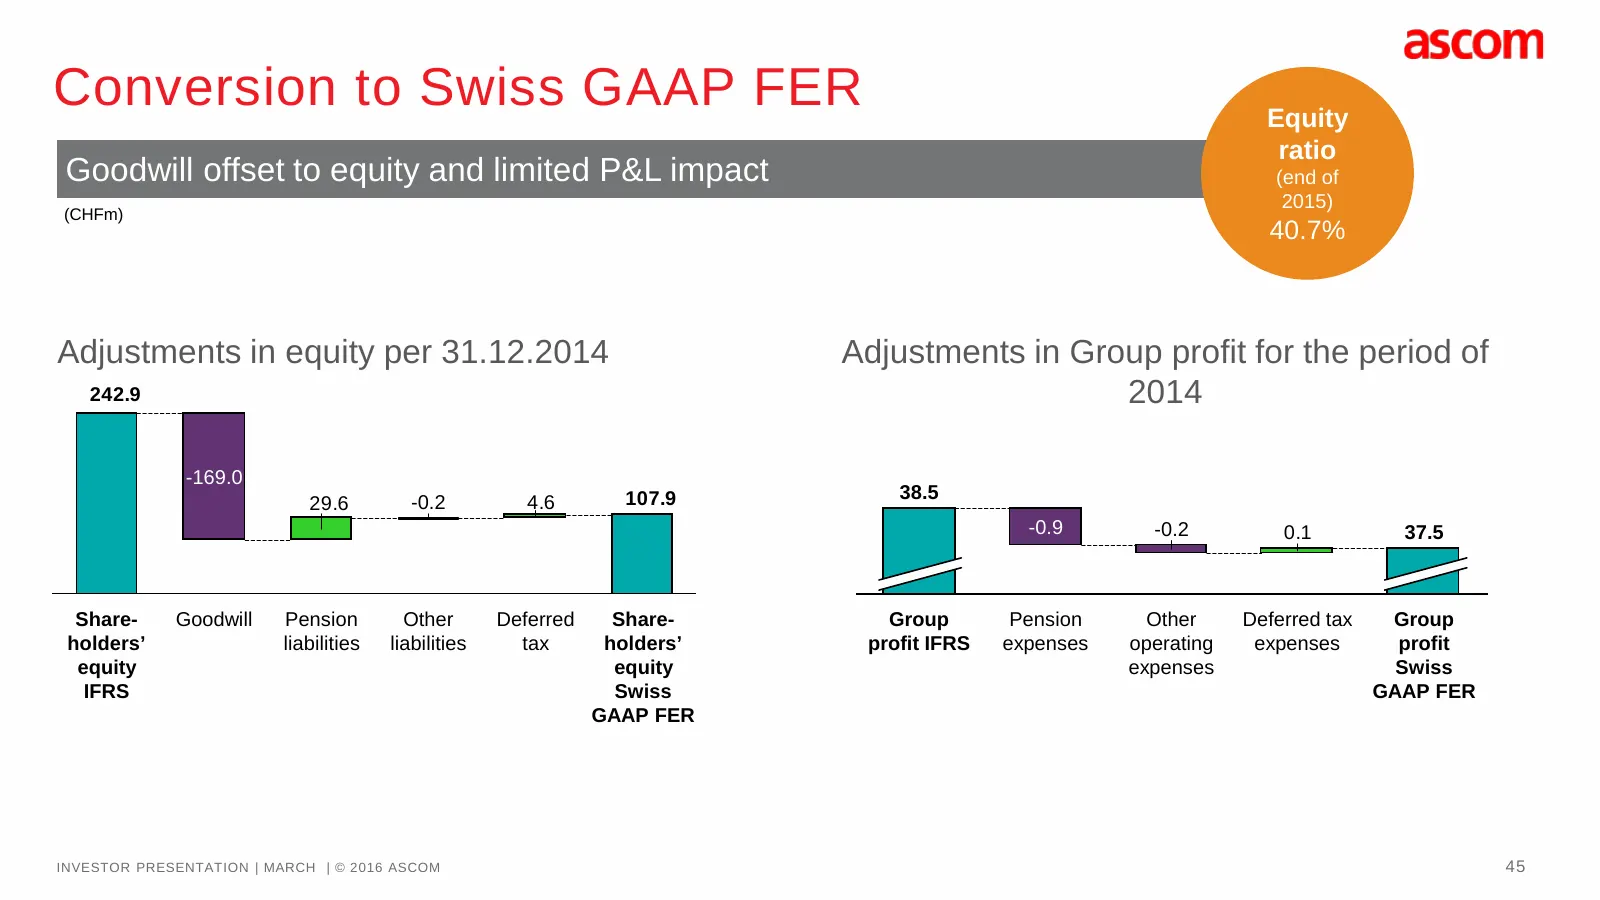
Slide 45: Conversion to Swiss GAAP FER
Conversion to Swiss GAAP FER Equity ratio Goodwill offset to equity and limited P&L impact (end of 2015) (CHFm) 40.7% Adjustments in equity per 31.12.2014 Adjustments in Group profit for the period of 242.9 2014 -169.0 4.6 107.9 38.5 29.6 -0.2 -0.9 -0.2 0.1 37.5 Share- Goodwill Pension Other Deferre
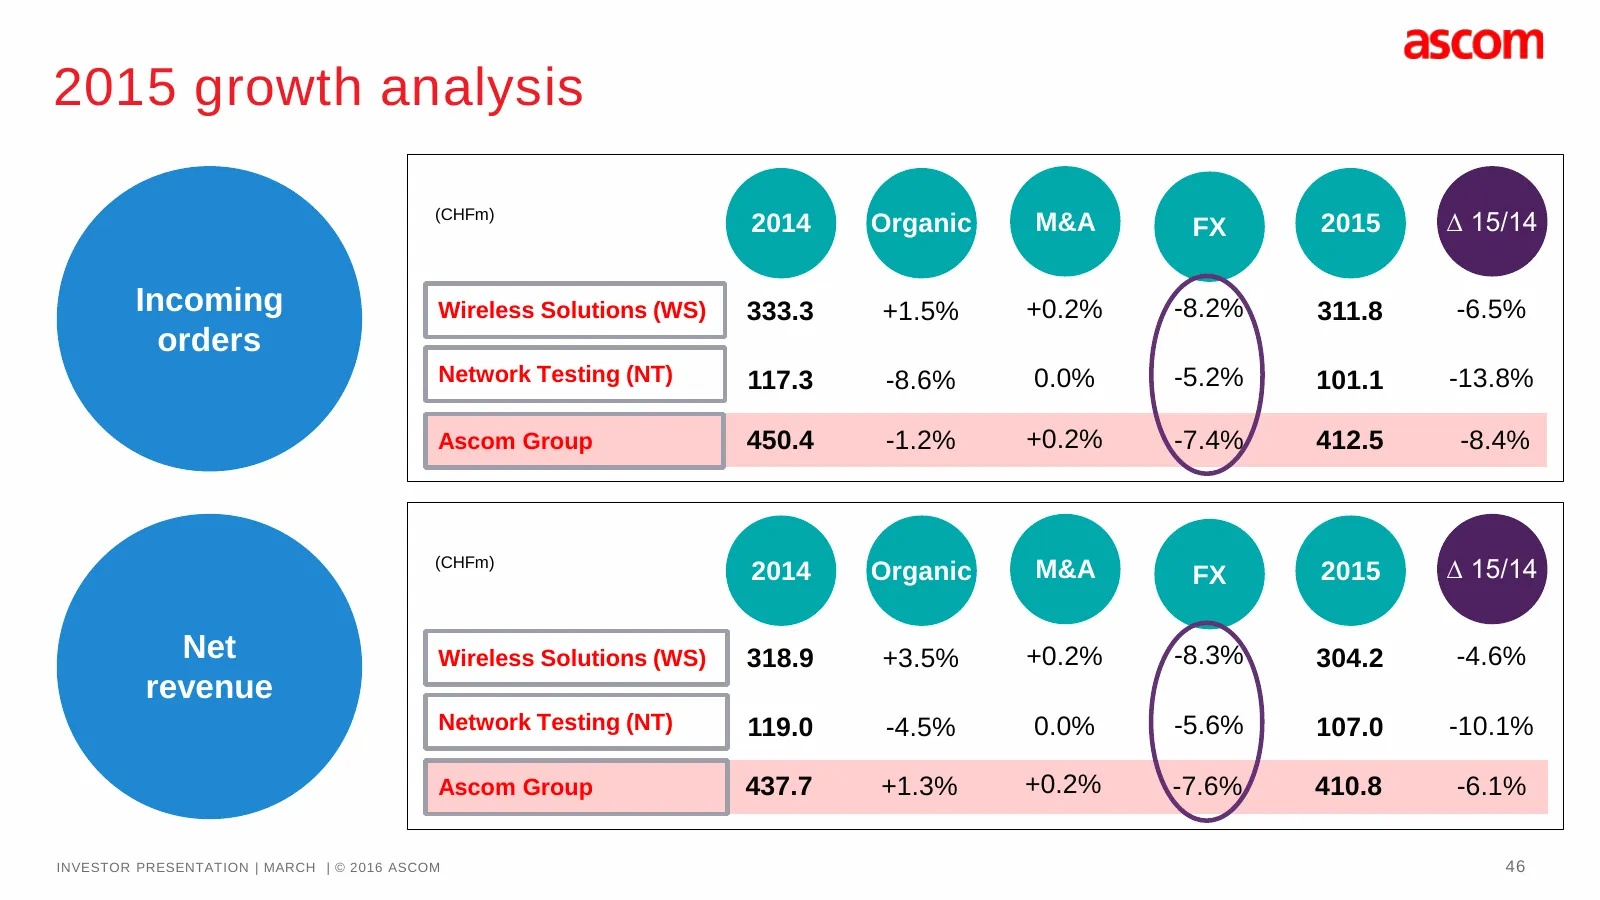
Slide 46: 2015 growth analysis
2015 growth analysis (CHFm) 2014 Organic M&A FX 2015 ∆ 15/14 Incoming Wireless Solutions (WS) 333.3 +1.5% +0.2% -8.2% 311.8 -6.5% orders Network Testing (NT) 117.3 -8.6% 0.0% -5.2% 101.1 -13.8% Ascom Group 450.4 -1.2% +0.2% -7.4% 412.5 -8.4% (CHFm) 2014 Organic M&A FX 2015 ∆ 15/14 Net Wireless Solut
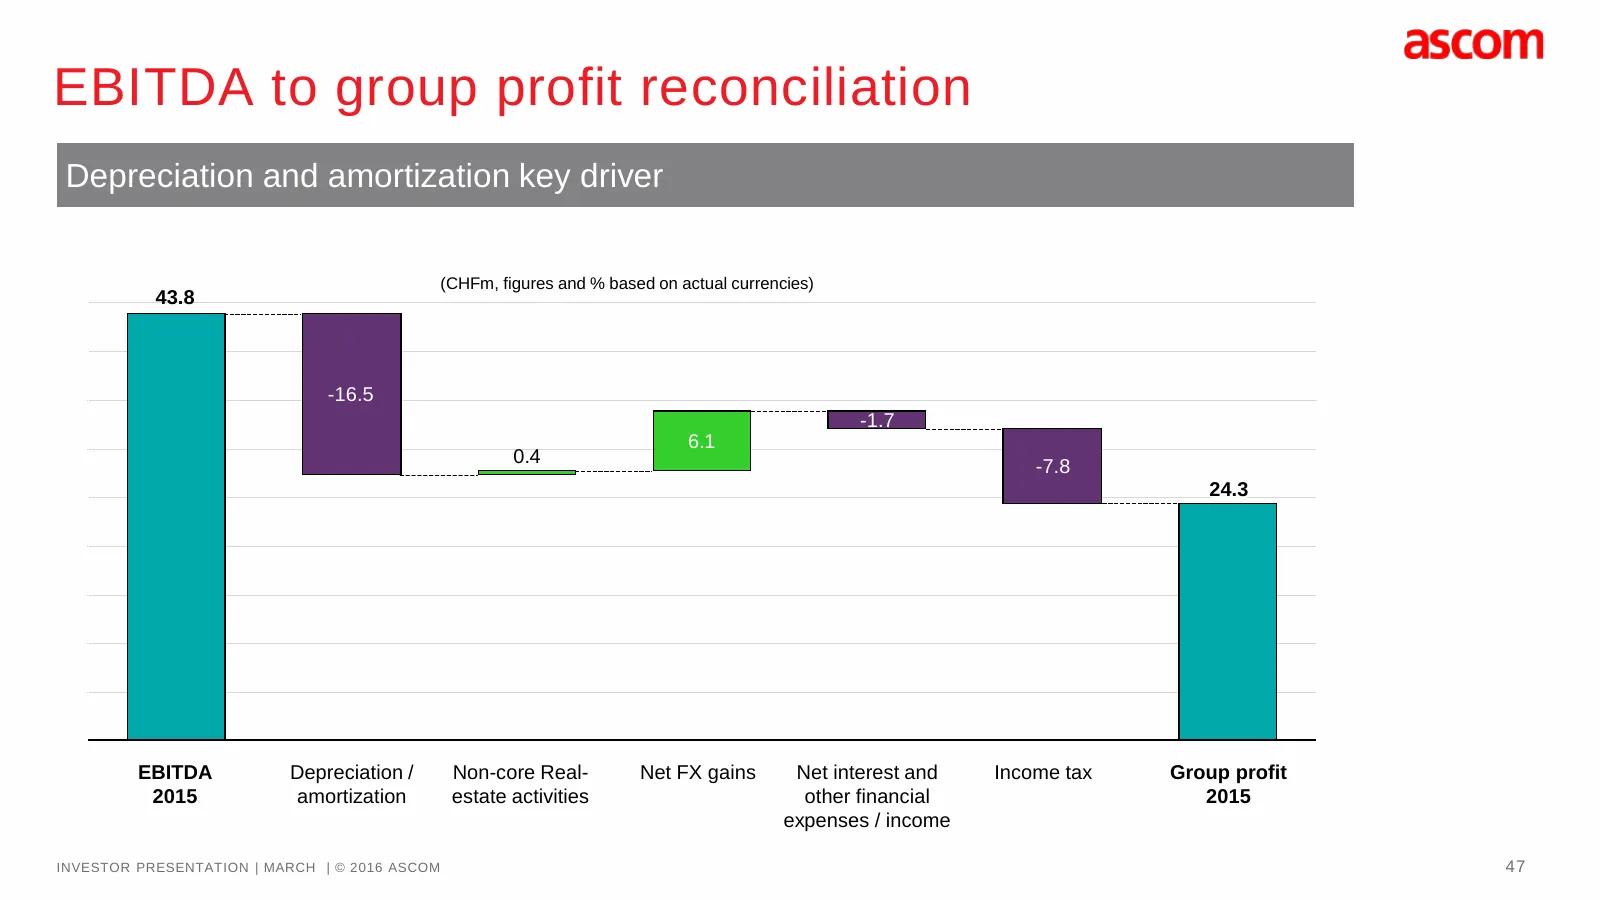
Slide 47: EBITDA to group profit reconciliation
EBITDA to group profit reconciliation Depreciation and amortization key driver (CHFm, figures and % based on actual currencies) 43.8 -16.5 -1.7 6.1 0.4 -7.8 24.3 EBITDA Depreciation / Non-core Real- Net FX gains Net interest and Income tax Group profit 2015 amortization estate activities other finan
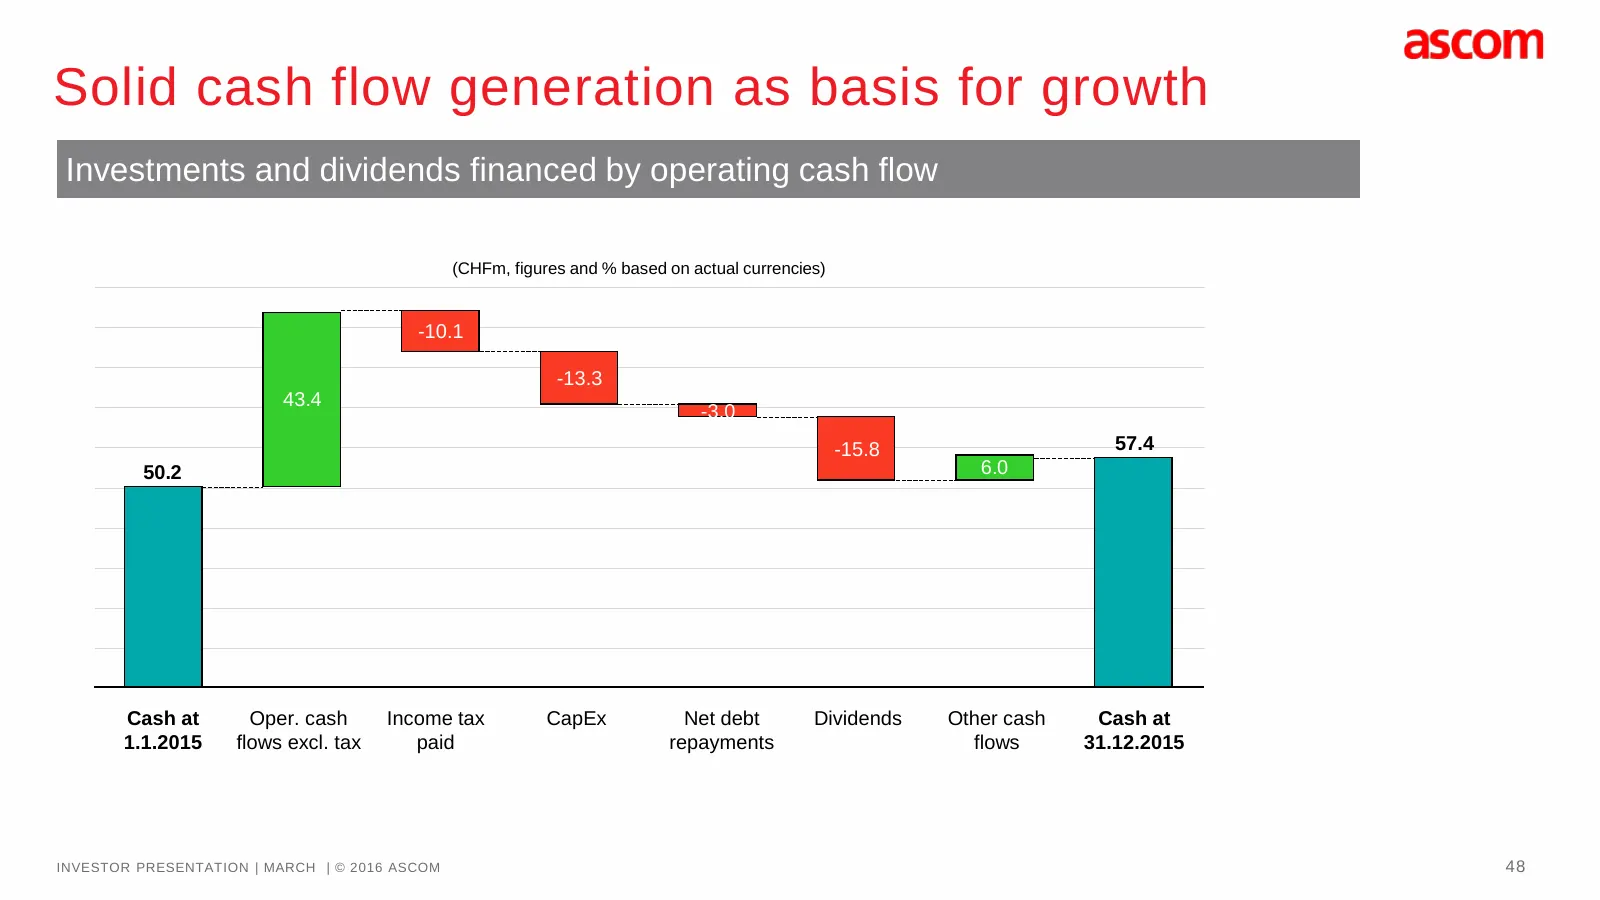
Slide 48: Solid cash flow generation as basis for growth
Solid cash flow generation as basis for growth Investments and dividends financed by operating cash flow (CHFm, figures and % based on actual currencies) -10.1 -13.3 43.4 -3.0 -15.8 57.4 50.2 6.0 Cash at Oper. cash Income tax CapEx Net debt Dividends Other cash Cash at 1.1.2015 flows excl. tax paid
Slide 49: Healthy balance sheet
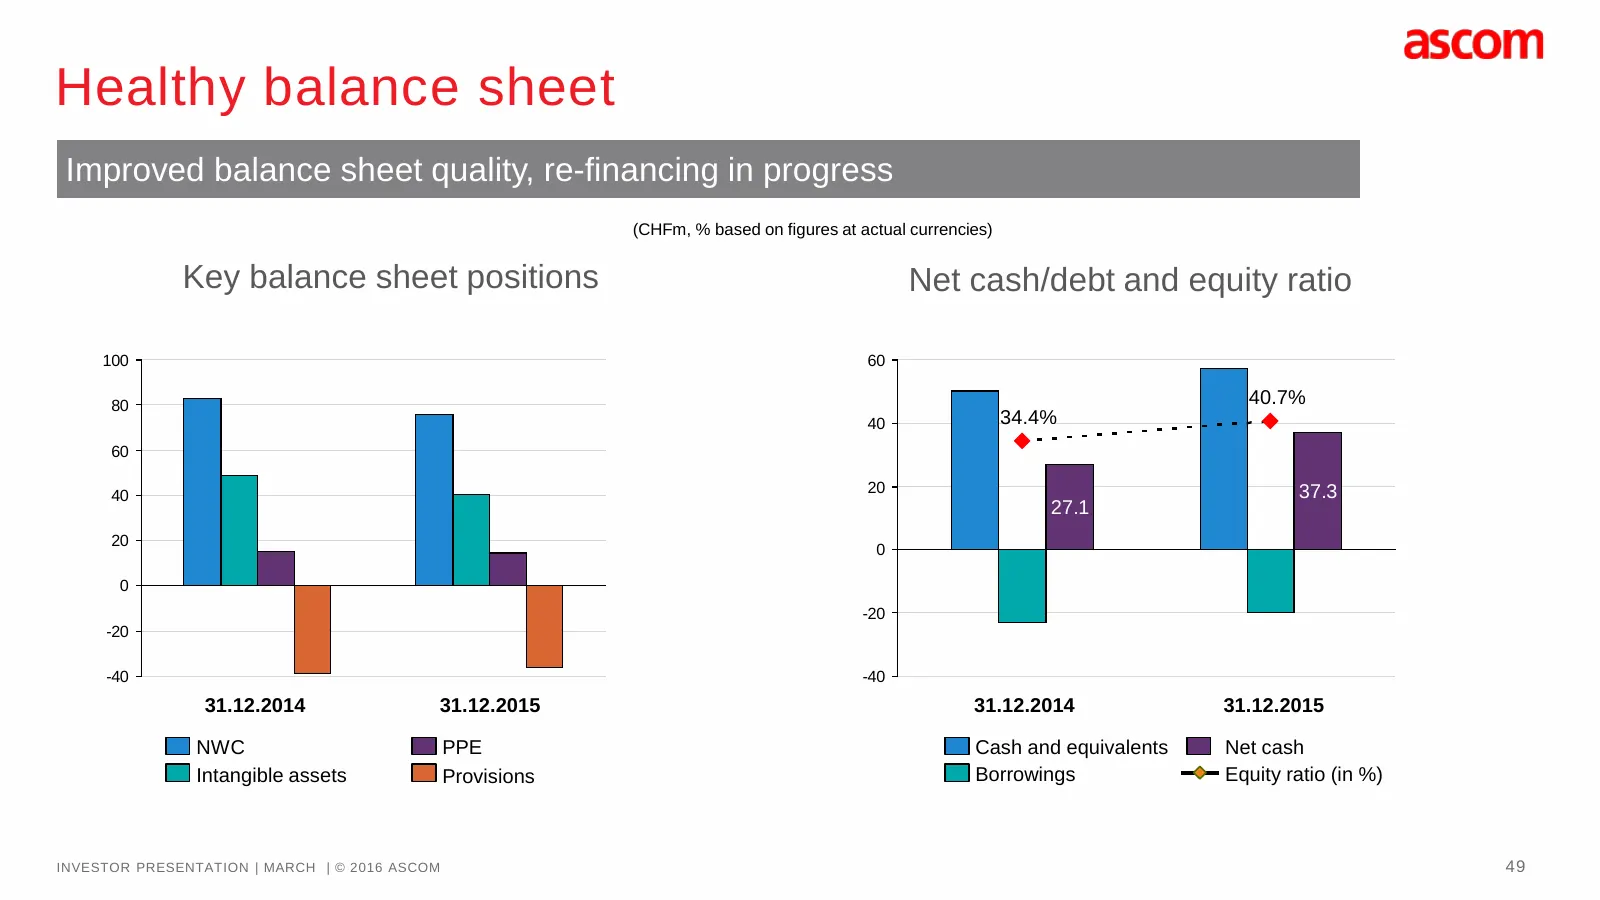
Healthy balance sheet Improved balance sheet quality, re-financing in progress (CHFm, % based on figures at actual currencies) Key balance sheet positions Net cash/debt and equity ratio 100 60 80 40.7% 40 34.4% 60 20 37.3 40 27.1 20 0 0 -20 -20 -40 -40 31.12.2014 31.12.2015 31.12.2014 31.12.2015 NWC
Slide 50: Return to shareholders
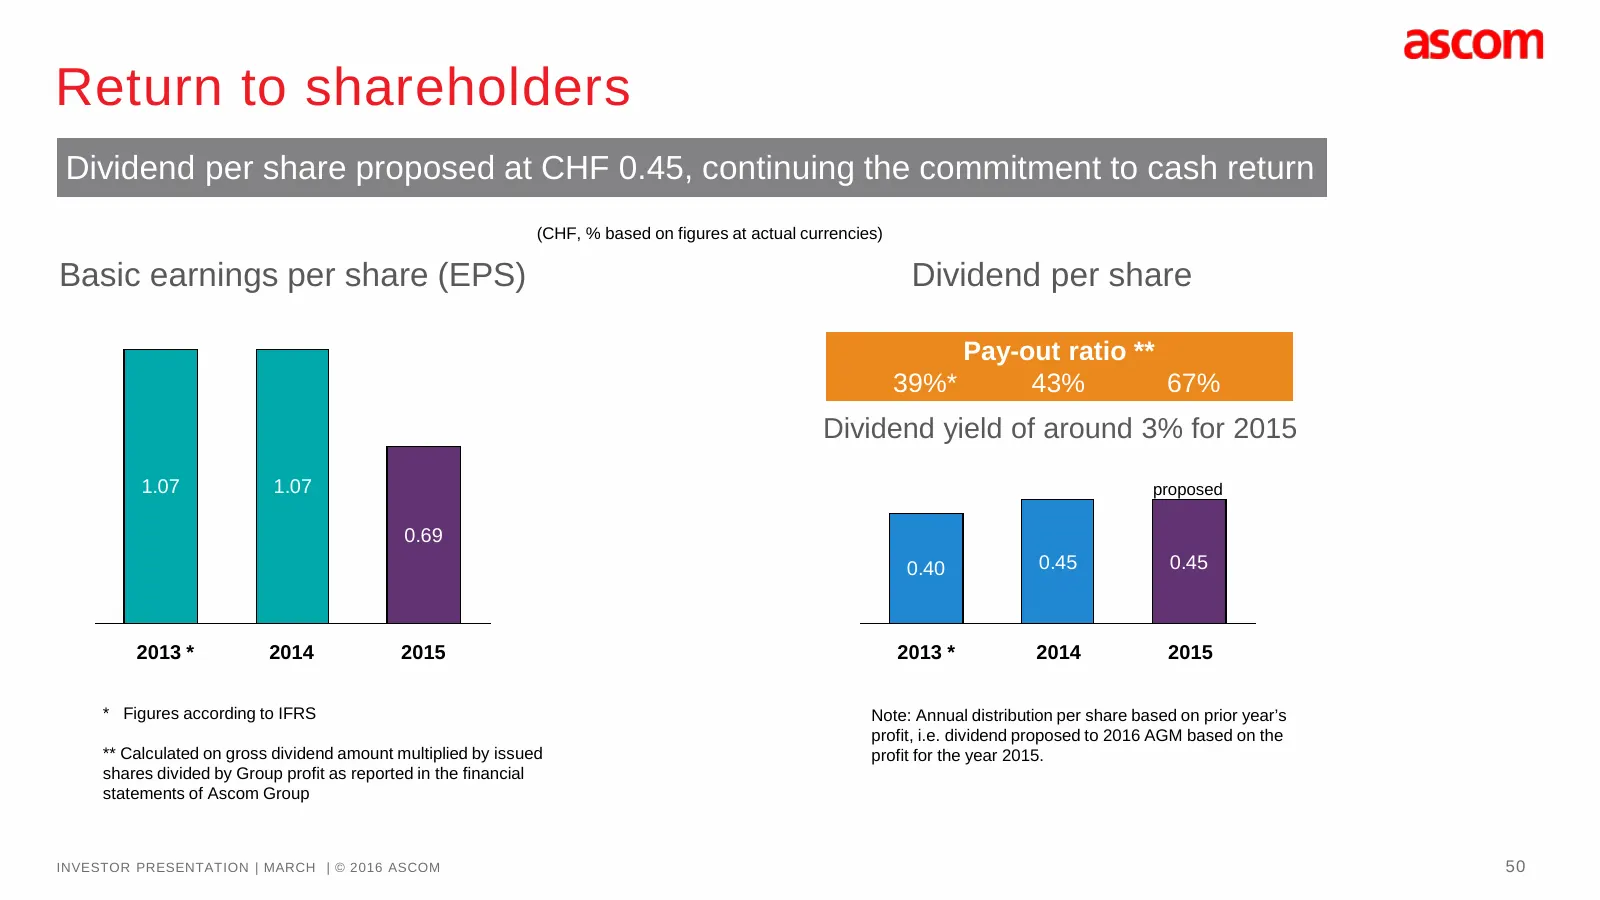
Return to shareholders Dividend per share proposed at CHF 0.45, continuing the commitment to cash return (CHF, % based on figures at actual currencies) Basic earnings per share (EPS) Dividend per share Pay-out ratio ** 39%* 43% 67% Dividend yield of around 3% for 2015 1.07 1.07 proposed 0.69 0.40 0.
Slide 51: Outlook
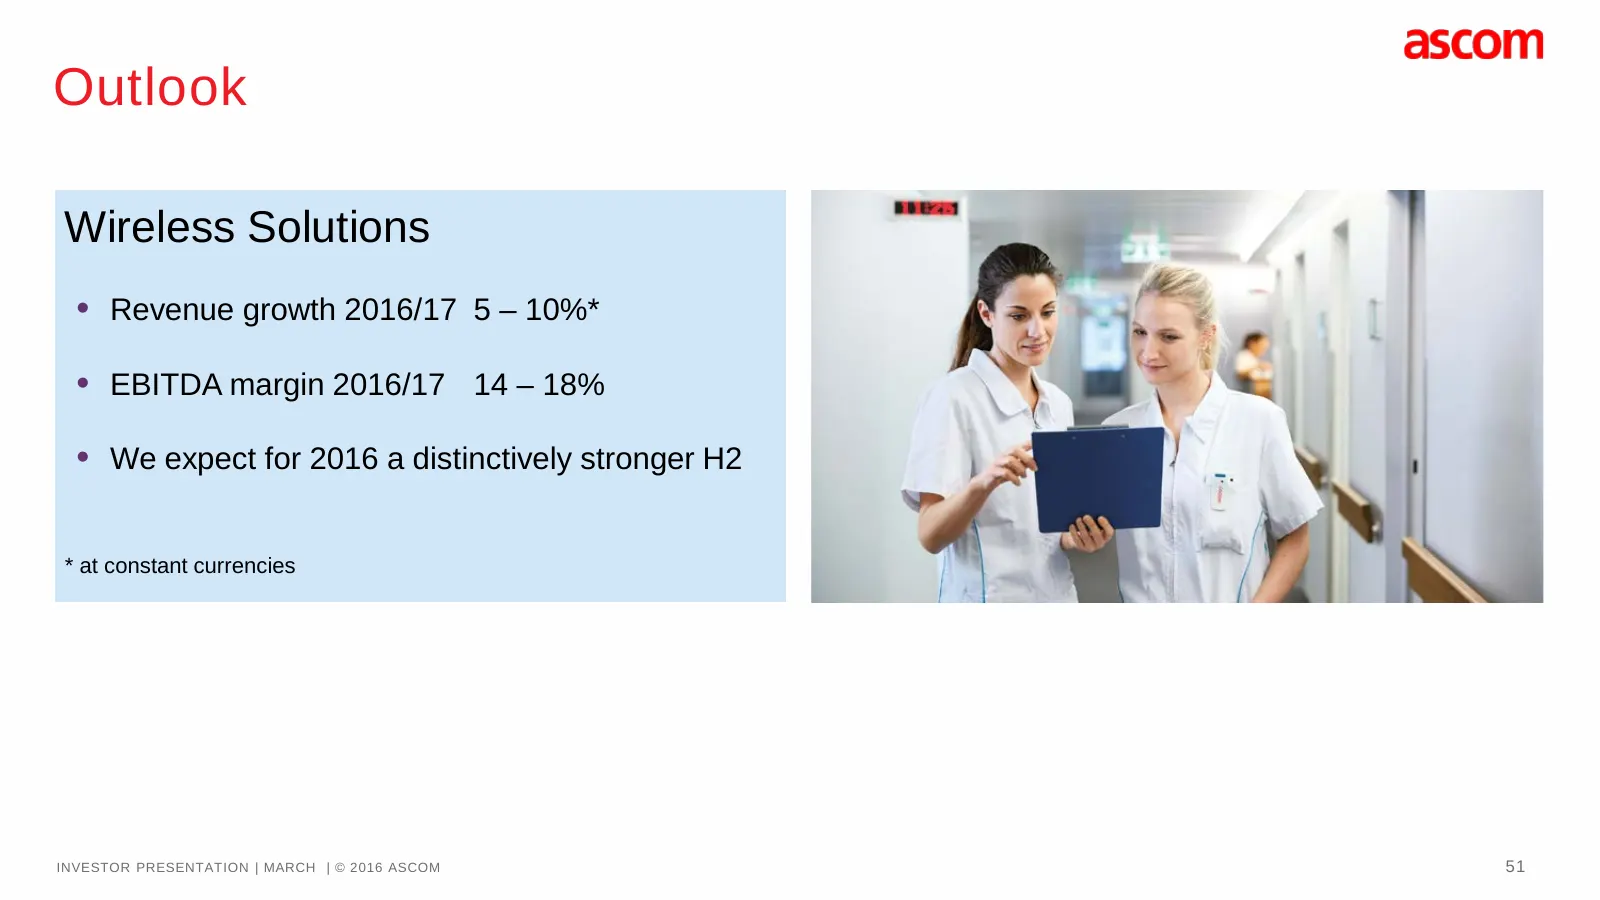
Outlook Wireless Solutions • Revenue growth 2016/17 5 – 10%* • EBITDA margin 2016/17 14 – 18% • We expect for 2016 a distinctively stronger H2 * at constant currencies INVESTOR PRESENTATION | MARCH | © 2016 ASCOM 51
Slide 52: Outlook
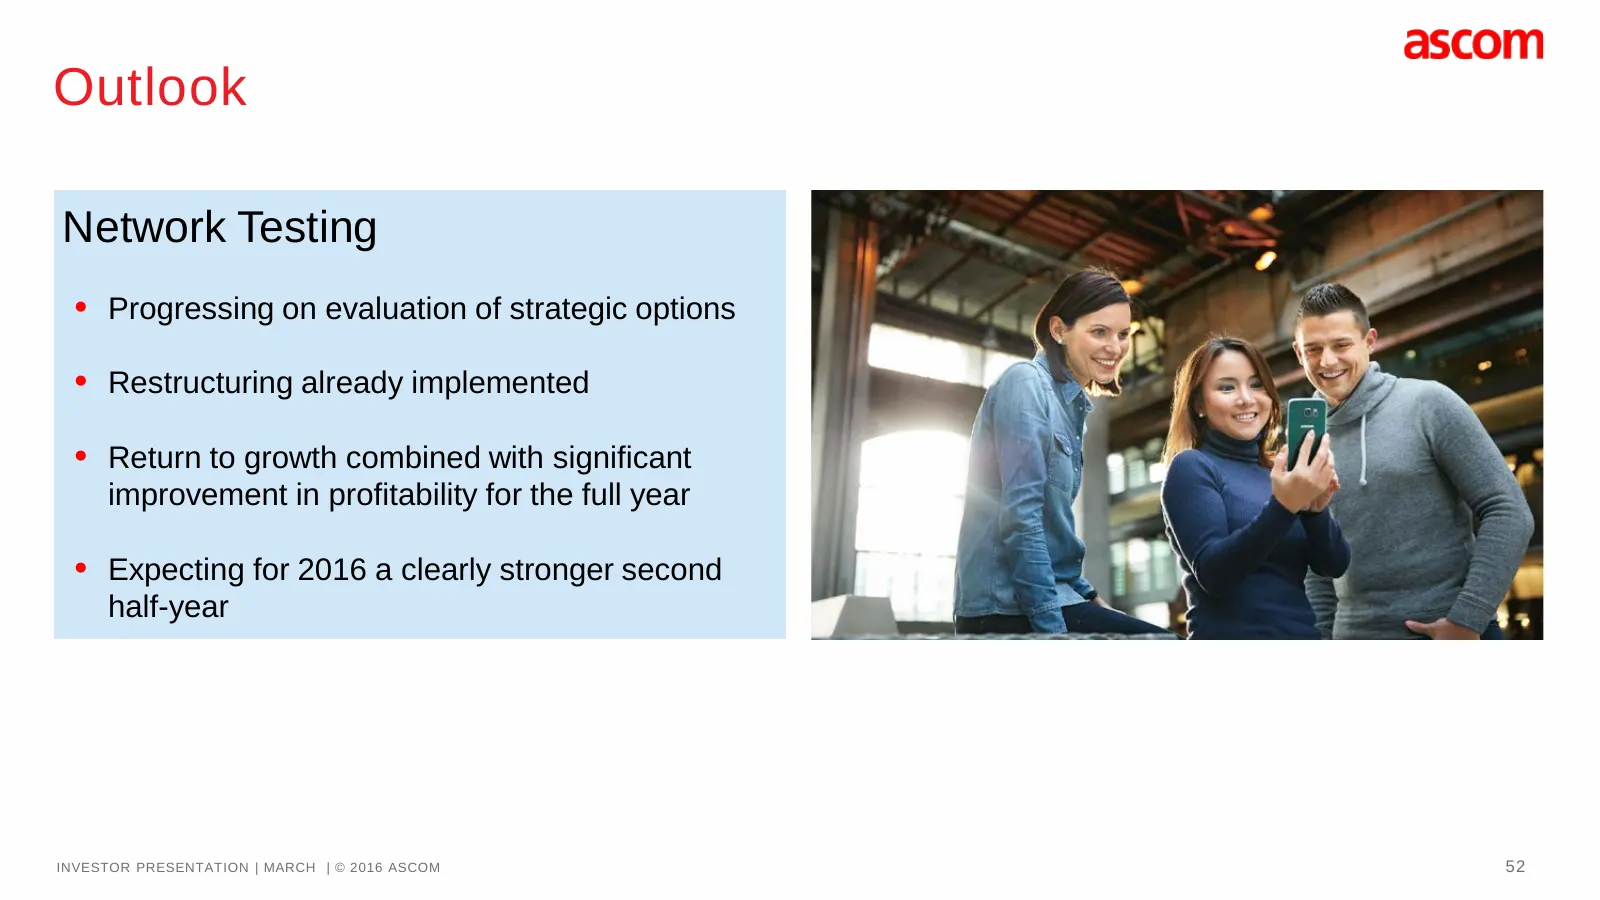
Outlook Network Testing • Progressing on evaluation of strategic options • Restructuring already implemented • Return to growth combined with significant improvement in profitability for the full year • Expecting for 2016 a clearly stronger second half-year INVESTOR PRESENTATION | MARCH | © 2016 ASC
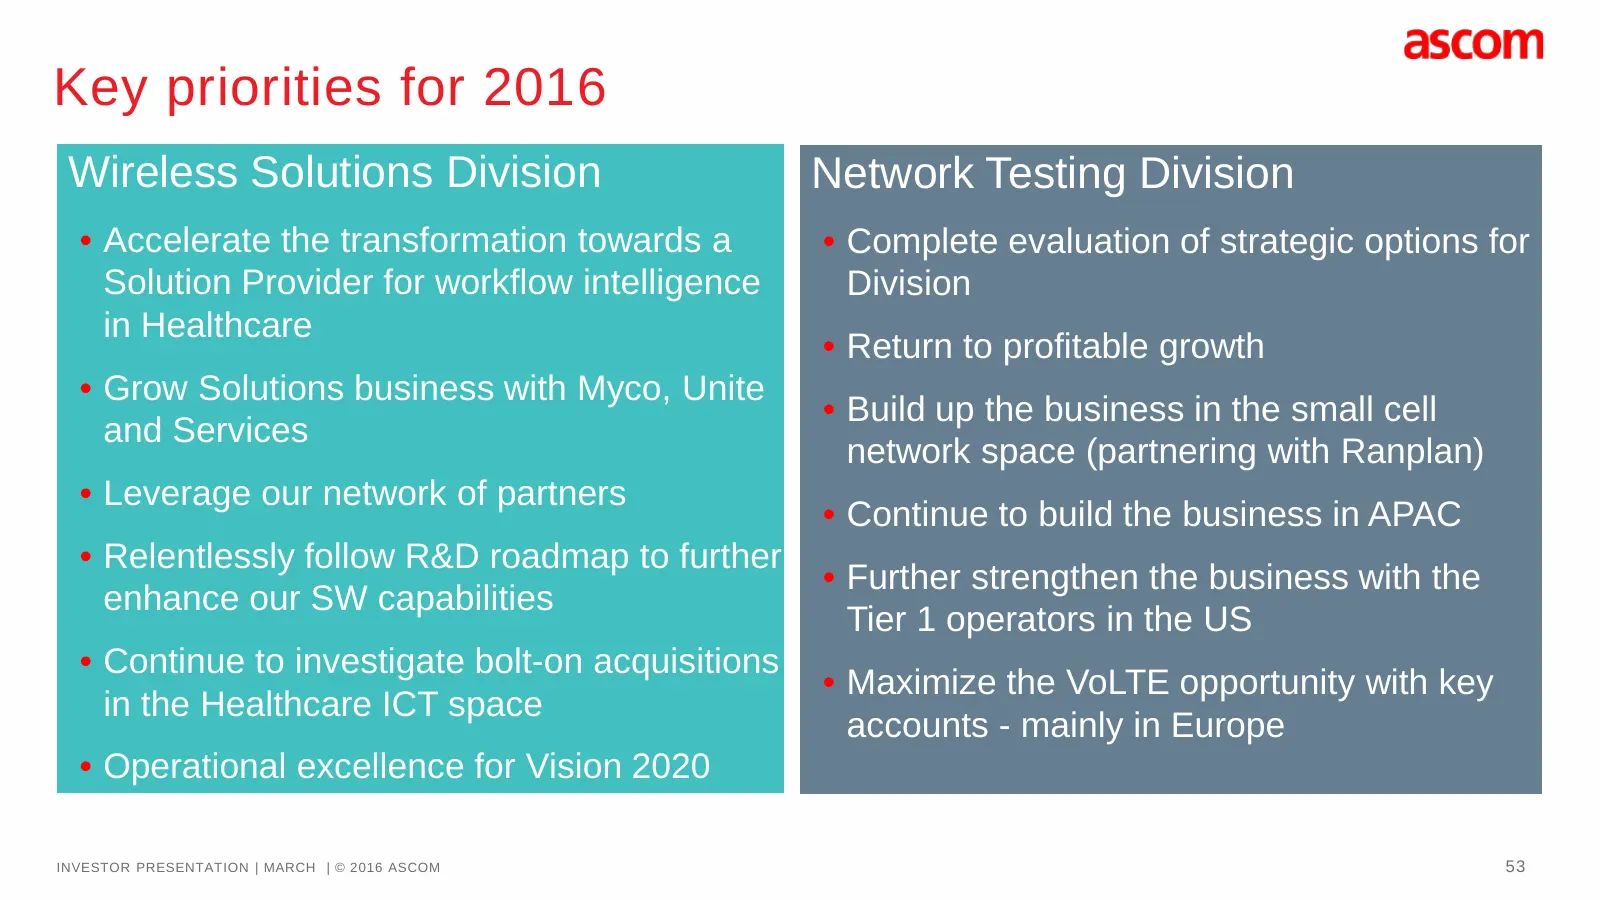
Slide 53: Key priorities for 2016
Key priorities for 2016 Wireless Solutions Division Network Testing Division • Accelerate the transformation towards a • Complete evaluation of strategic options for Solution Provider for workflow intelligence Division in Healthcare • Return to profitable growth • Grow Solutions business with Myco,
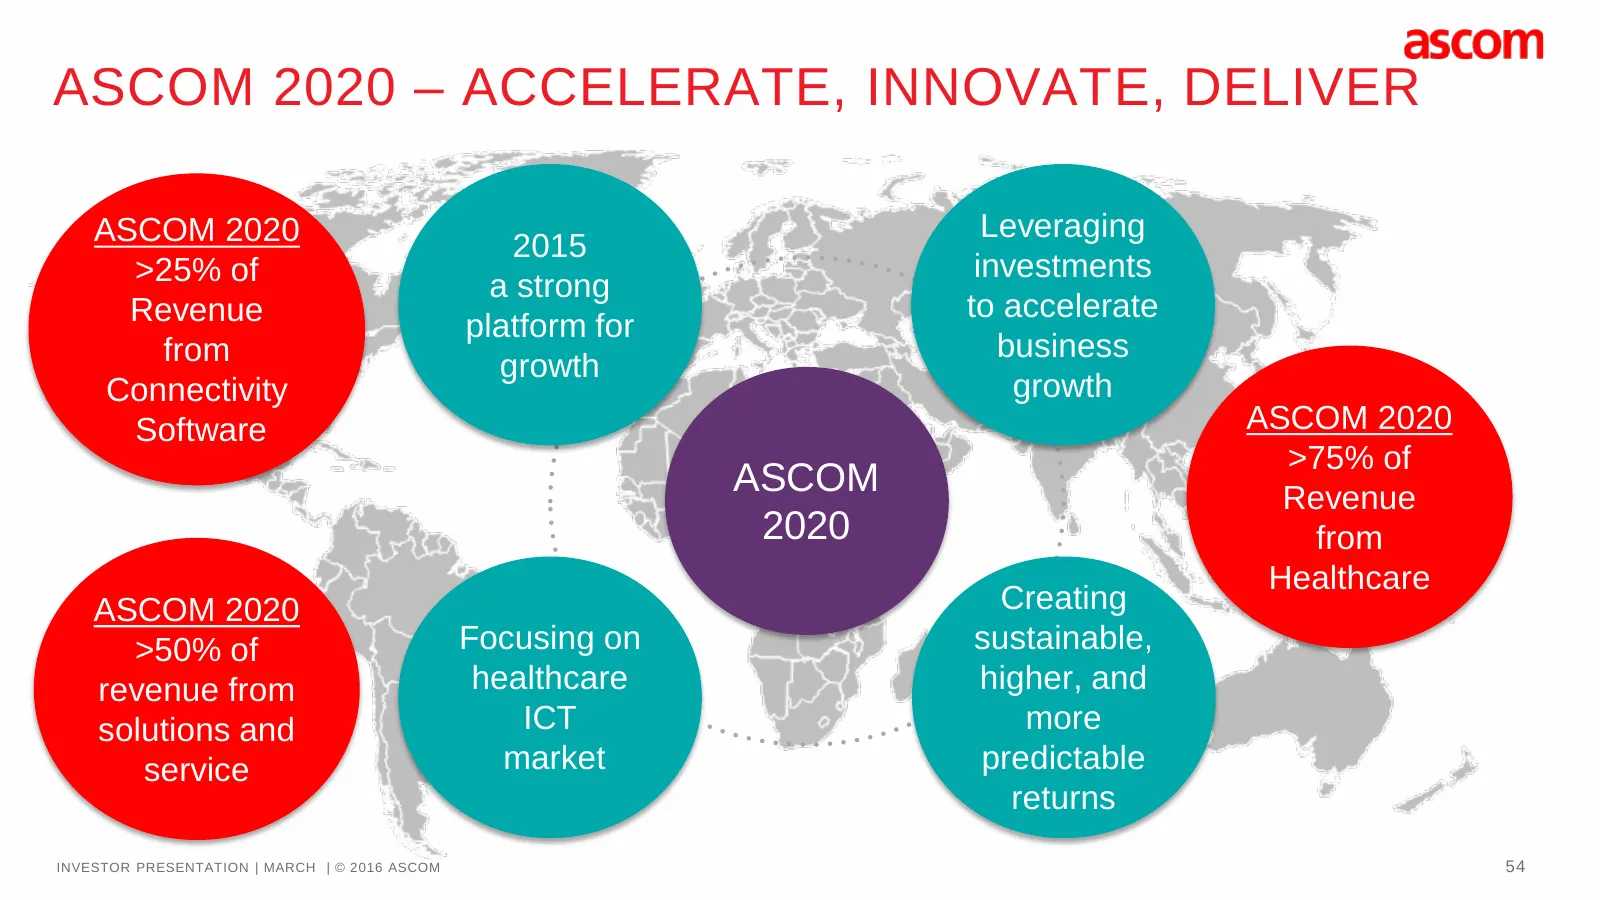
Slide 54: ASCOM 2020 – Accelerate, Innovate, Deliver
ASCOM 2020 – ACCELERATE, INNOVATE, DELIVER ASCOM 2020 Leveraging 2015 >25% of investments a strong Revenue to accelerate platform for from business growth Connectivity growth Software ASCOM 2020 >75% of ASCOM Revenue 2020 from Healthcare ASCOM 2020 Creating >50% of Focusing on sustainable, revenue f
Slide 55: Thank you!
Ascom Holding AG Investor Relations Zugerstrasse 32 6340 Baar, Switzerland Phone: + 41 41 544 78 00 Fax: + 41 41 761 97 25 investor@ascom.com Thank you! INVESTOR PRESENTATION | MARCH | © 2016 ASCOM 55
Source: Internet Archive copy of ascom.com