ATS Corporation · TSX:ATS
ATS — ATS Automation Tooling Systems — Investor Day (September 2018)
86 slides from ATS's investor day presentation, Sep 18, 2018
Slide 1: ATS Automation – 2018 Investor Day
ATS AUTOMATION – 2018 INVESTOR DAY - TSX:ATA
Slide 2: Sonya Mehan
SONYA MEHAN Director, Investor Relations & Corporate Communications
Slide 3: ATS Investor Day – Agenda
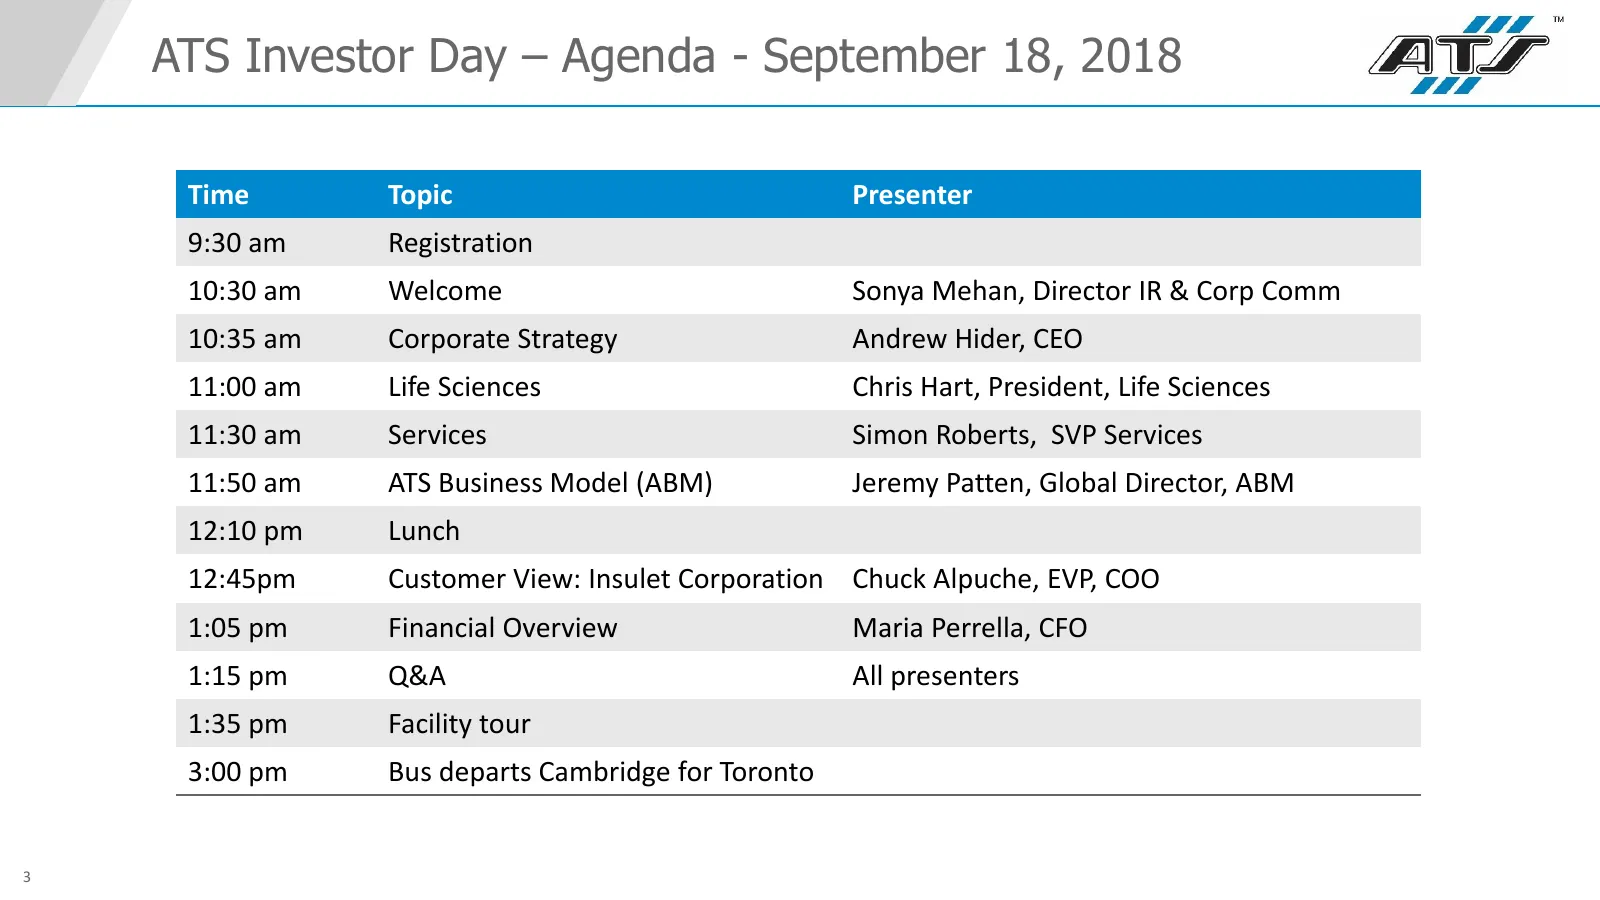
ATS Investor Day – Agenda - September 18, 2018 Time Topic Presenter 9:30 am Registration 10:30 am Welcome Sonya Mehan, Director IR & Corp Comm 10:35 am Corporate Strategy Andrew Hider, CEO 11:00 am Life Sciences Chris Hart, President, Life Sciences 11:30 am Services Simon Roberts, SVP Services 11:50
Slide 4: Forward-Looking Statements
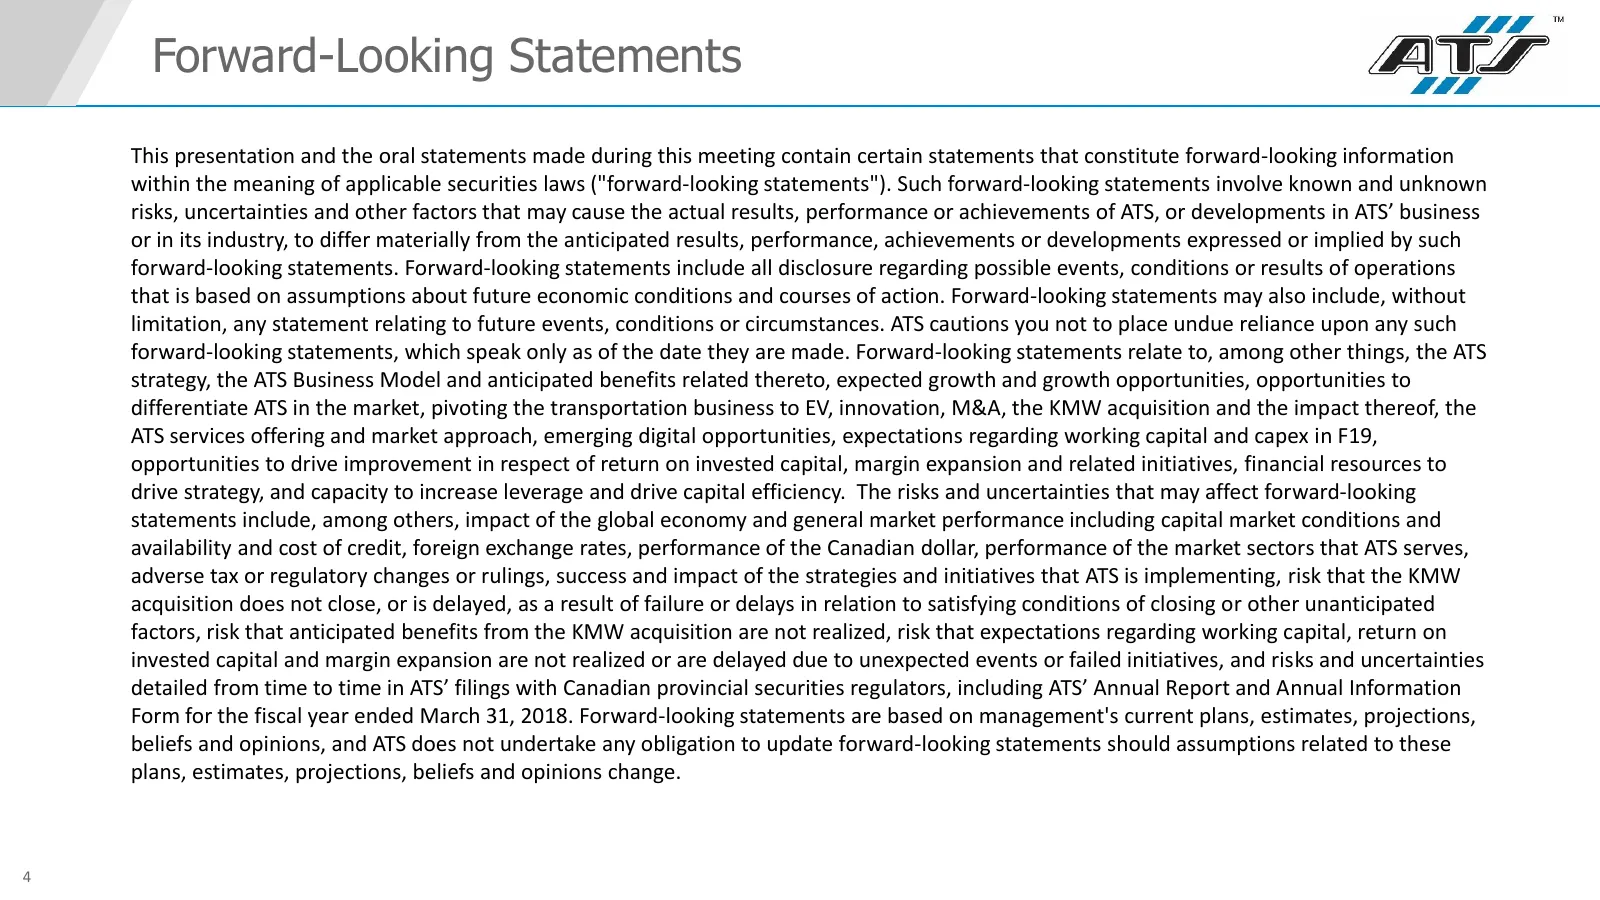
Forward-Looking Statements This presentation and the oral statements made during this meeting contain certain statements that constitute forward-looking information within the meaning of applicable securities laws ("forward-looking statements"). Such forward-looking statements involve known and unkn
Slide 5: Andrew Hider
ANDREW HIDER Chief Executive Officer
Slide 6: ATS Executive Team
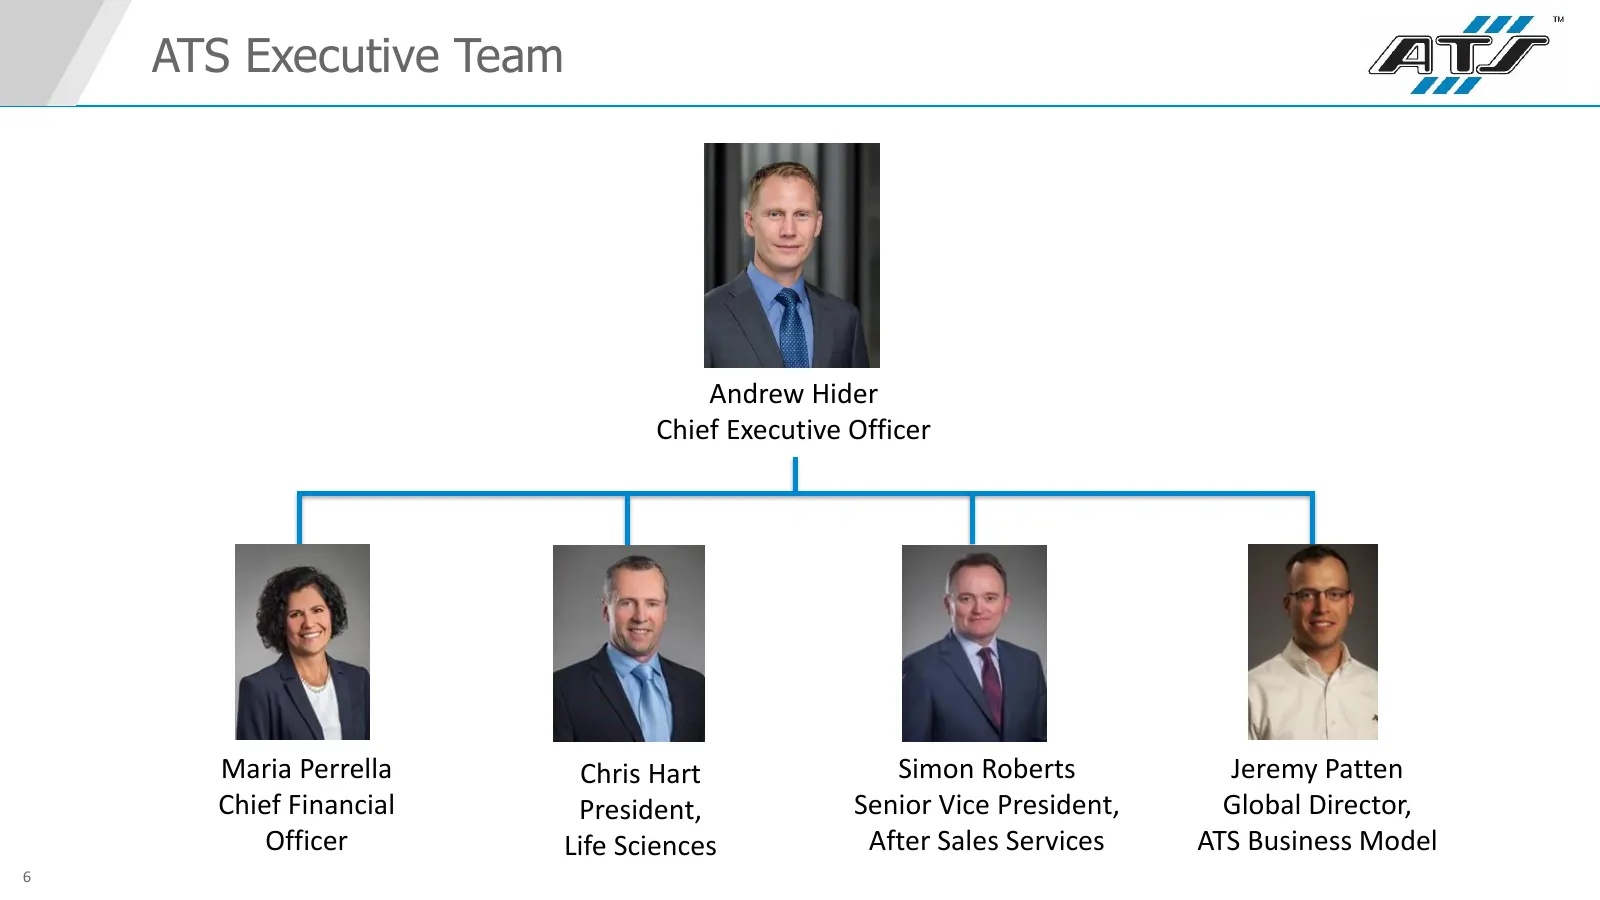
ATS Executive Team Andrew Hider Chief Executive Officer Maria Perrella Chris Hart Simon Roberts Jeremy Patten Chief Financial President, Senior Vice President, Global Director, Officer Life Sciences After Sales Services ATS Business Model 6
Slide 7: ATS at a Glance
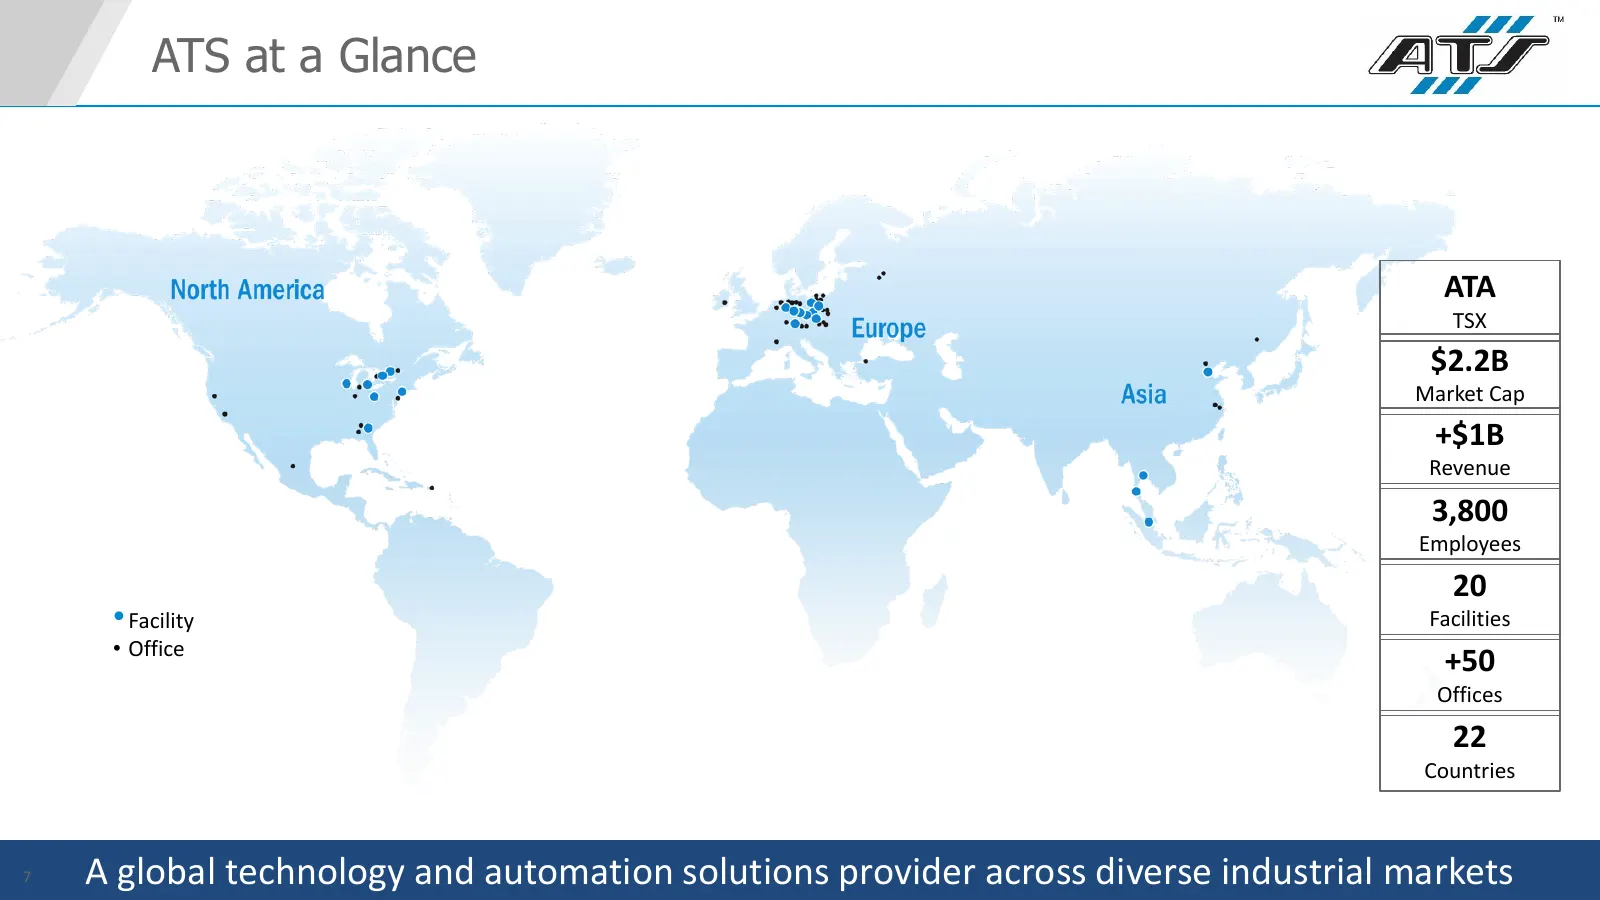
ATS at a Glance ATA TSX $2.2B Market Cap +$1B Revenue 3,800 Employees 20 • Facility Facilities • Office +50 Offices 22 Countries 7 A global technology and automation solutions provider across diverse industrial markets
Slide 8: What We Do
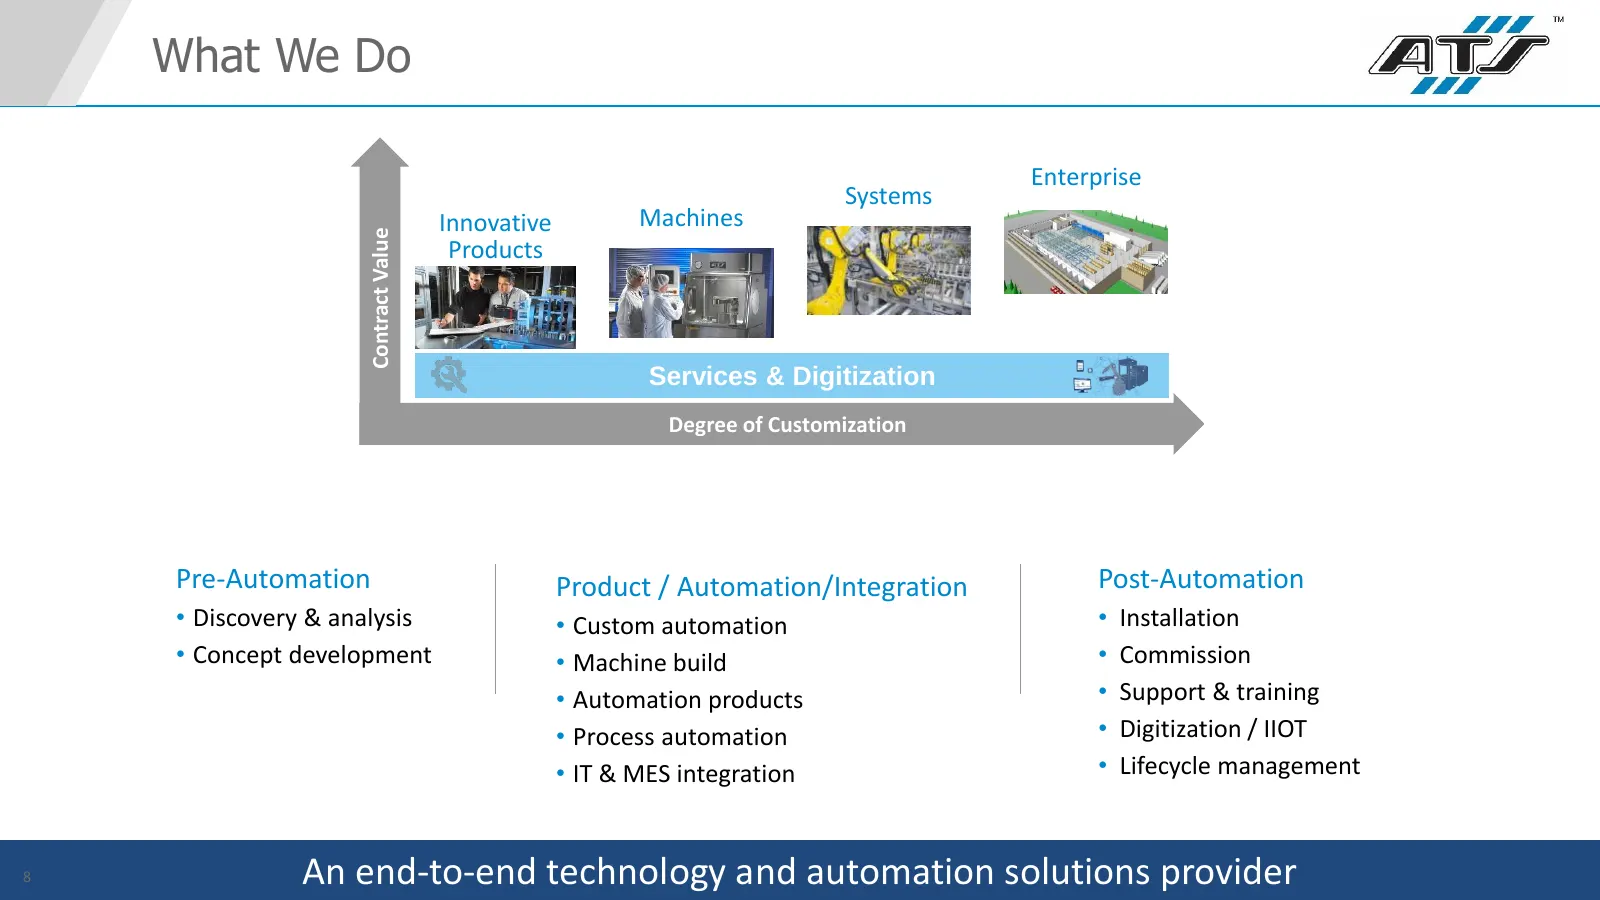
What We Do Enterprise Systems Innovative Machines Contract Value Products Services & Digitization Degree of Customization Pre-Automation Product / Automation/Integration Post-Automation • Discovery & analysis • Custom automation • Installation • Concept development • Machine build • Commission • Aut
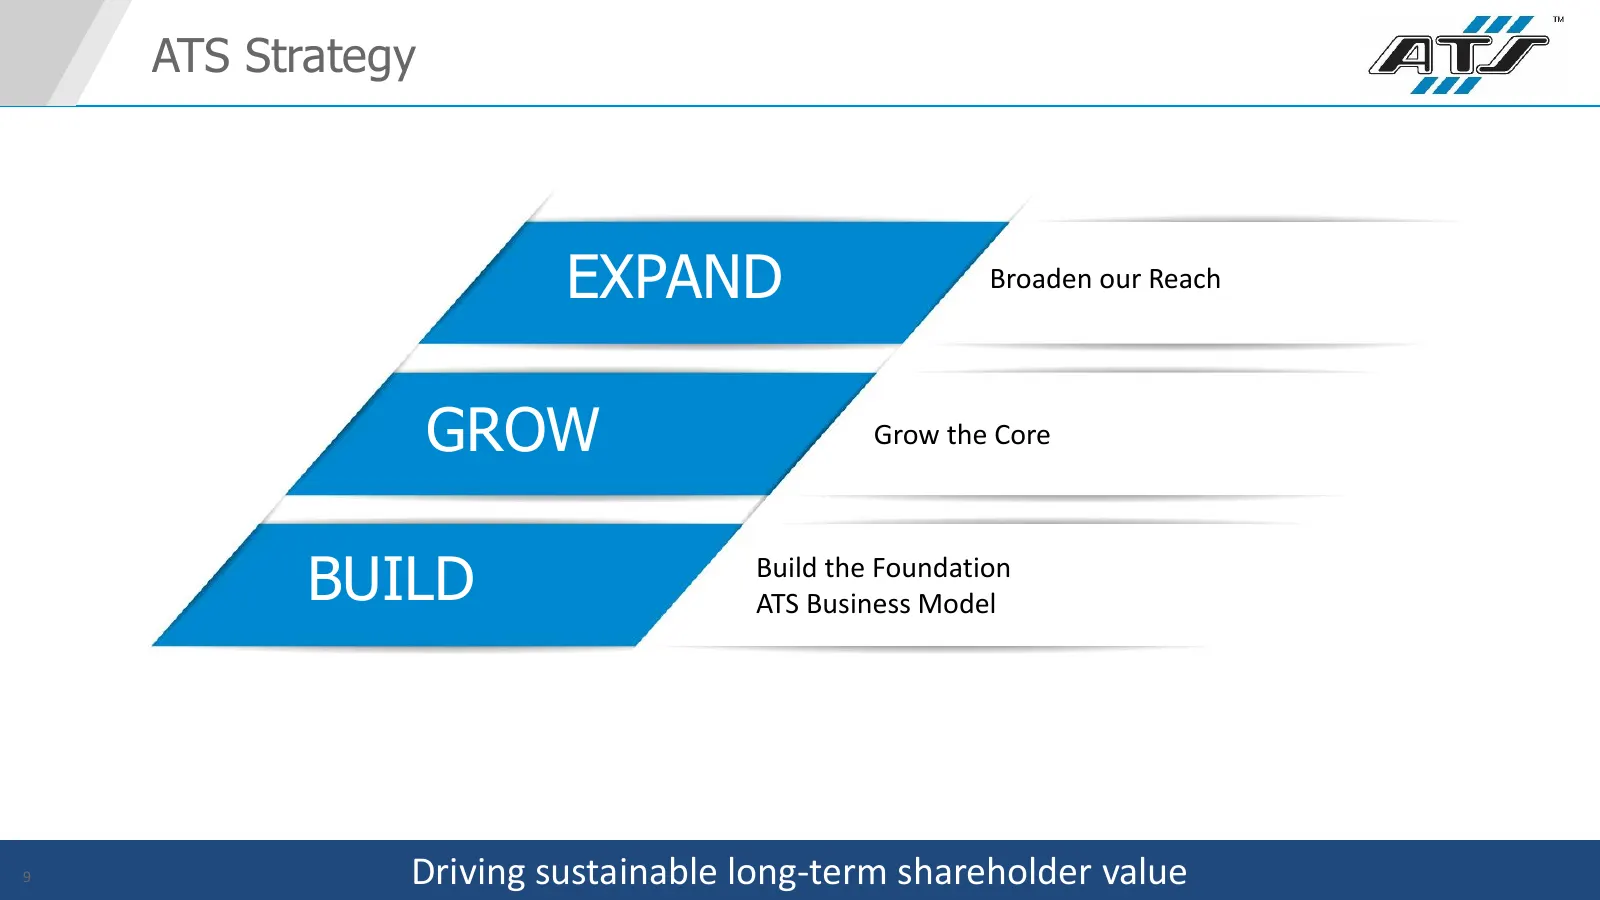
Slide 9: ATS Strategy: Expand, Grow, Build
ATS Strategy EXPAND Broaden our Reach GROW Grow the Core BUILD Build the Foundation ATS Business Model 9 Driving sustainable long-term shareholder value
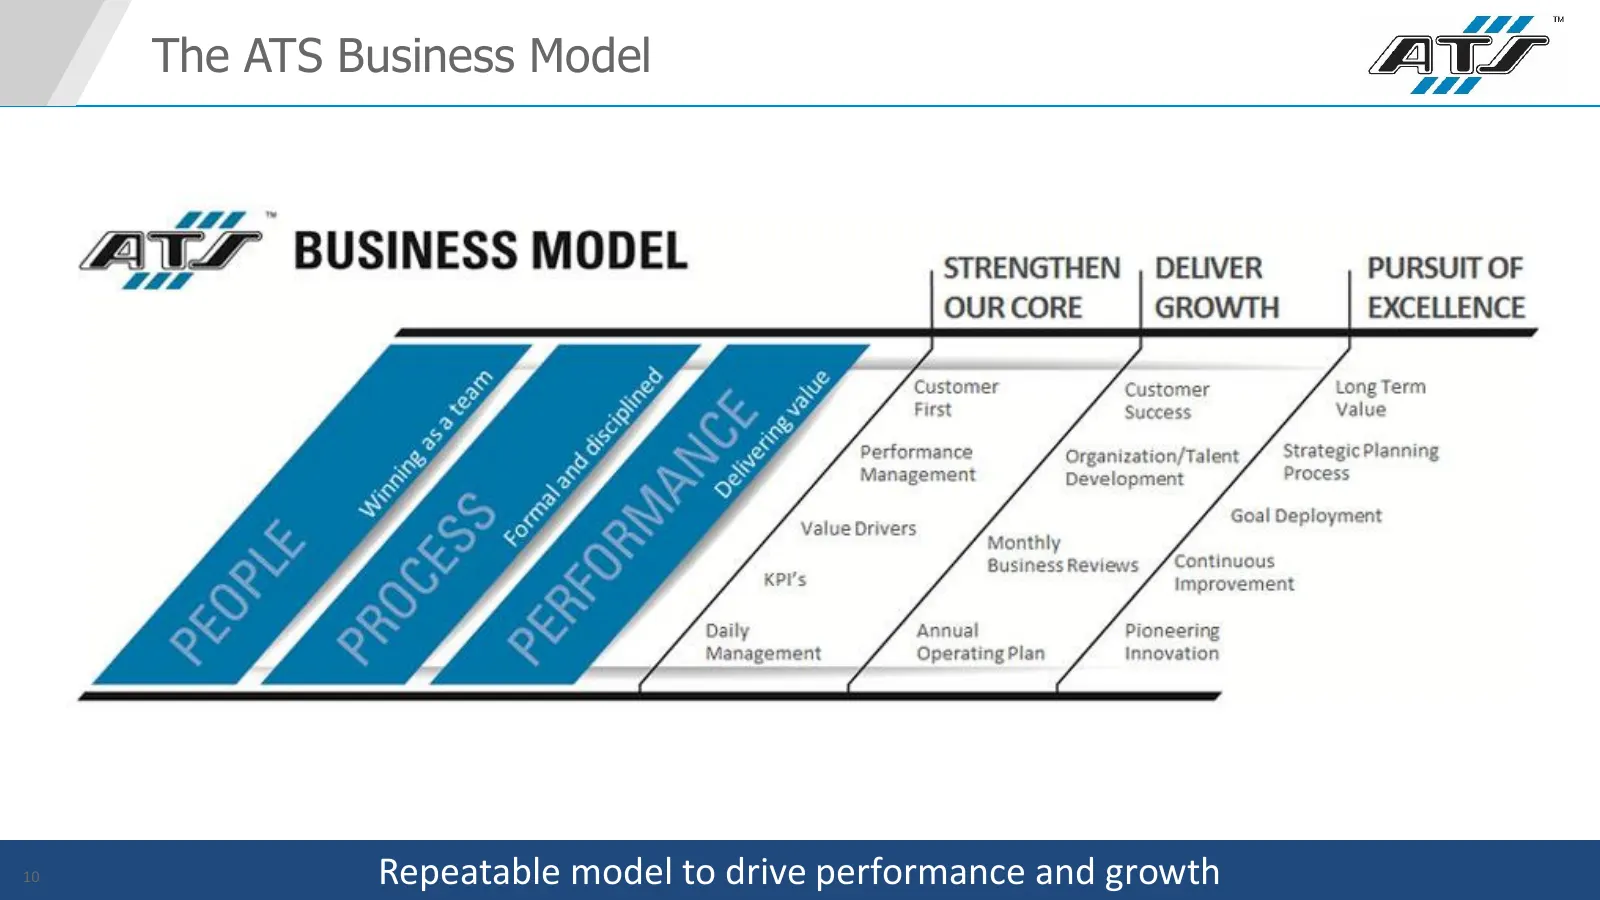
Slide 10: The ATS Business Model
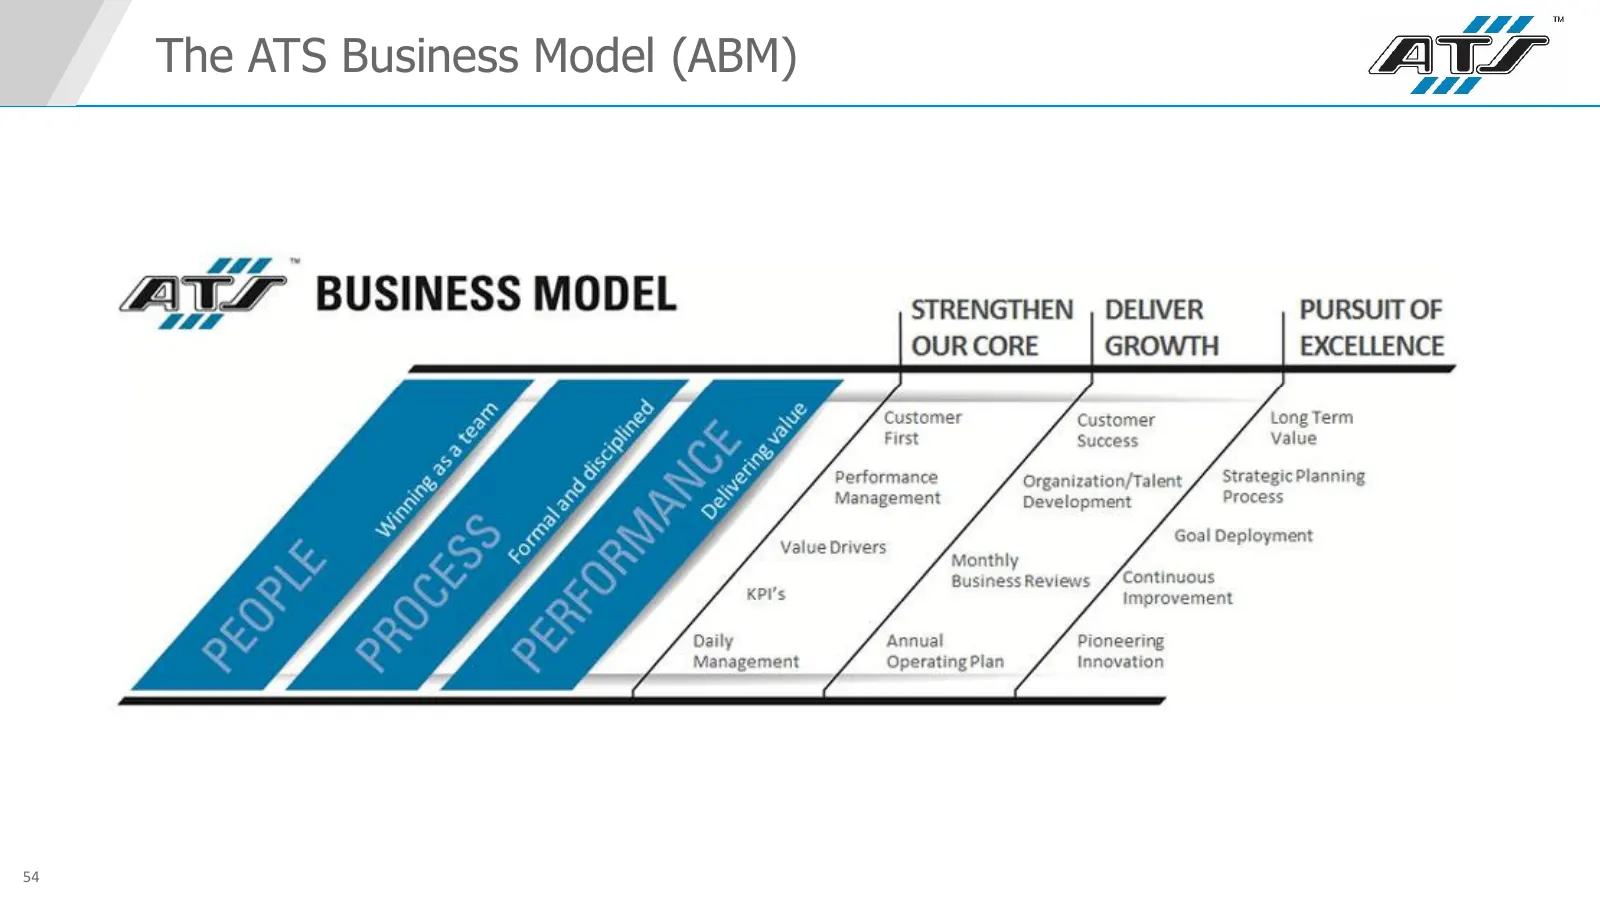
The ATS Business Model 10 Repeatable model to drive performance and growth
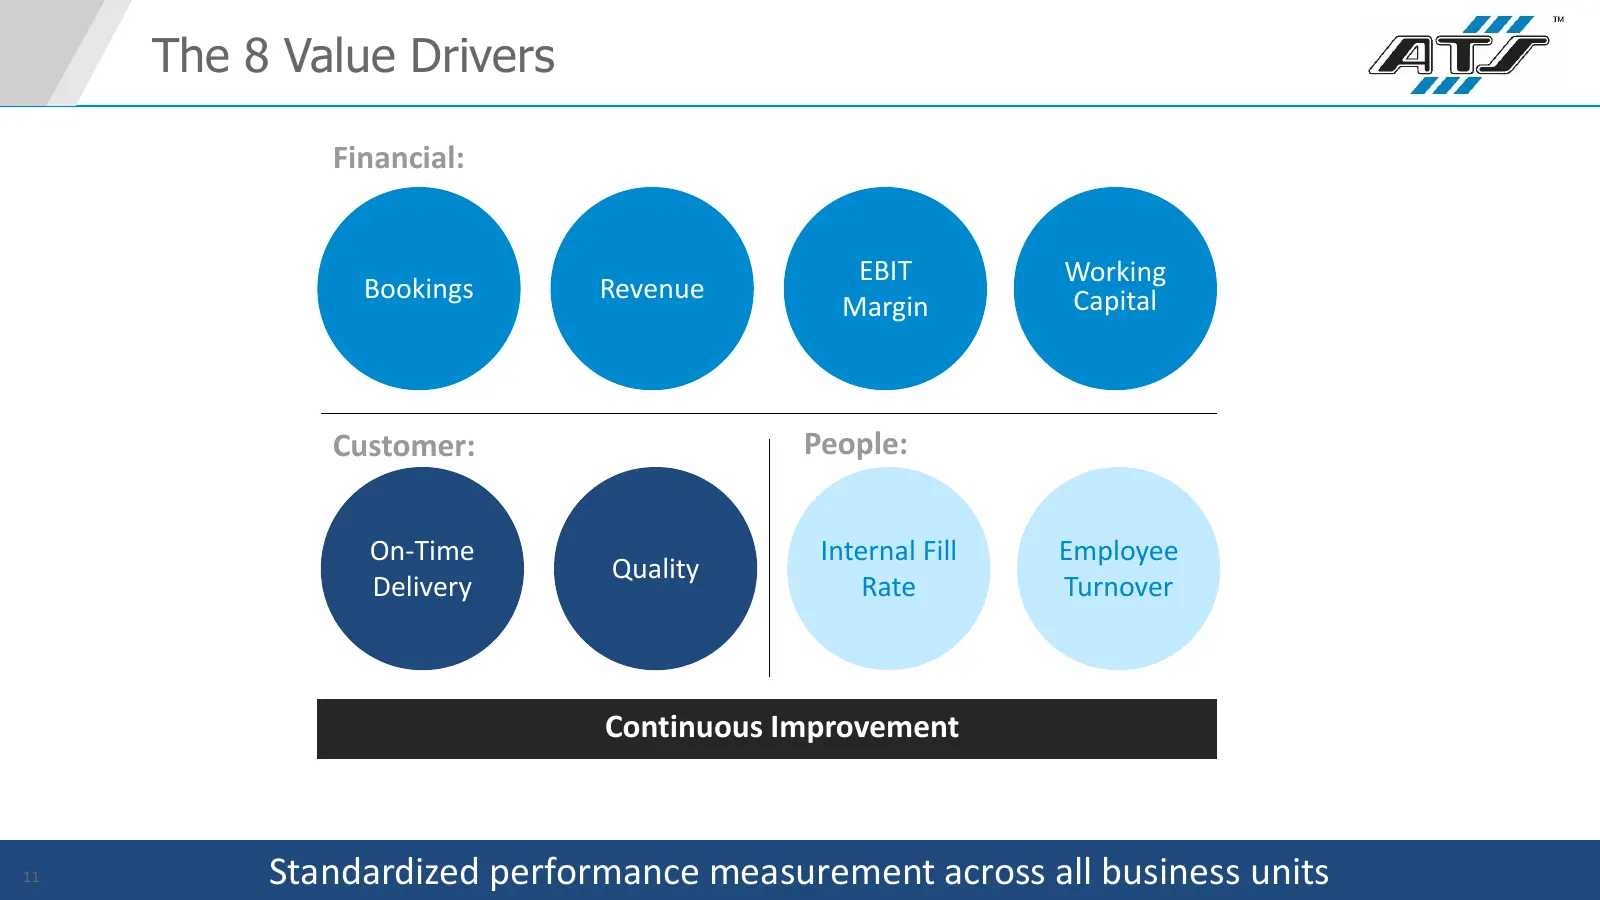
Slide 11: The Value Drivers
The 8 Value Drivers Financial: EBIT Working Bookings Revenue Capital Margin Customer: People: On-Time Internal Fill Employee Quality Delivery Rate Turnover Continuous Improvement 11 Standardized performance measurement across all business units
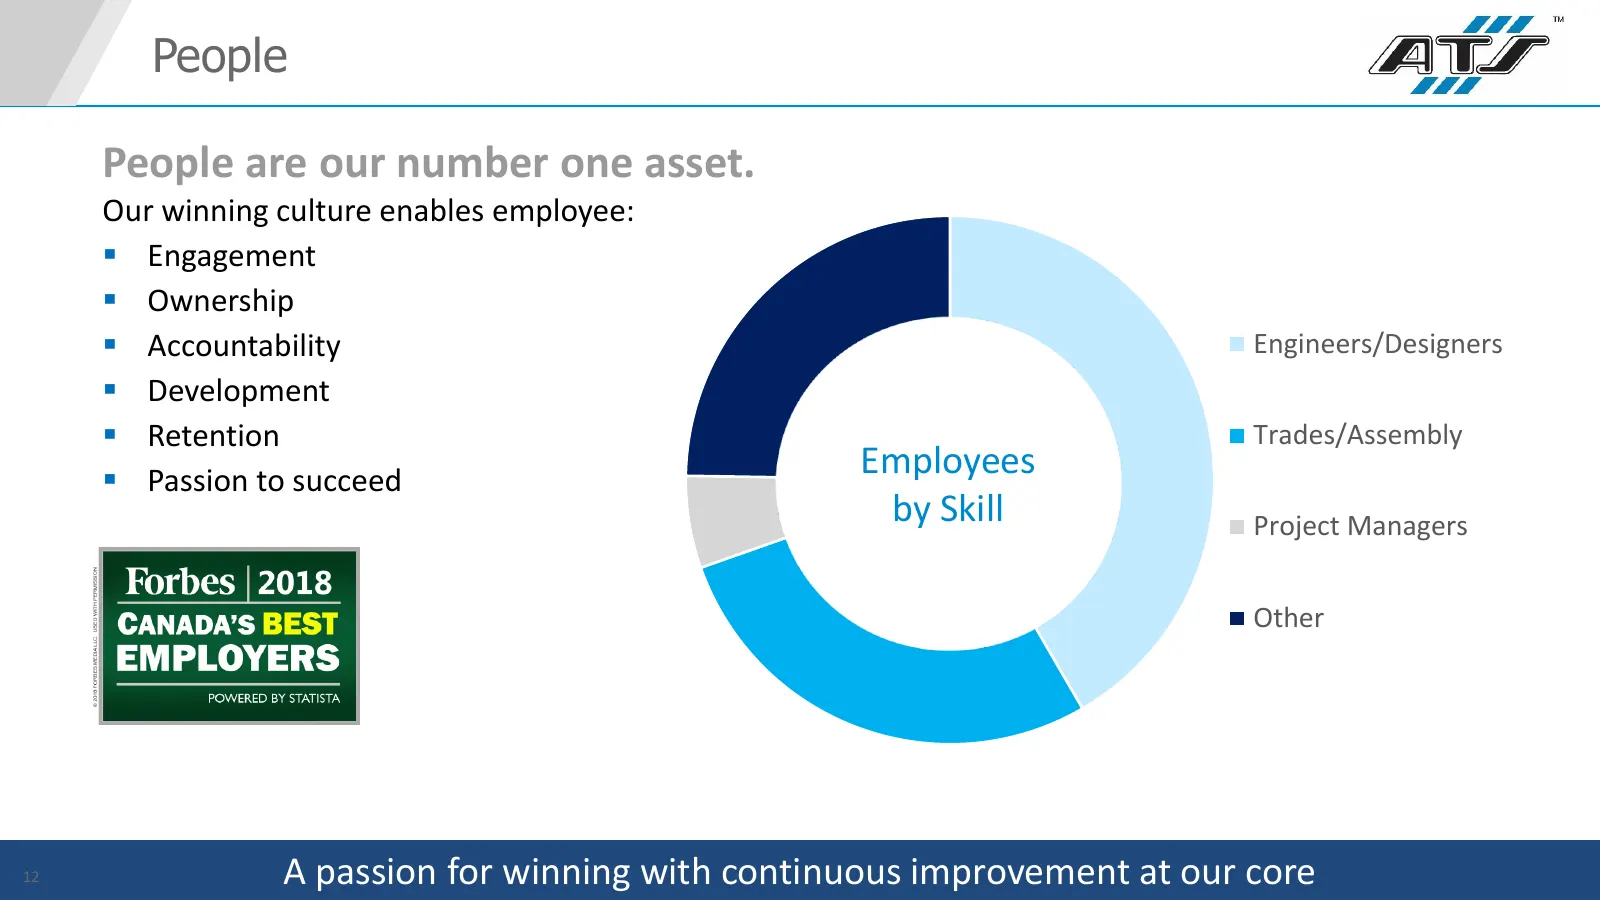
Slide 12: People
People People are our number one asset. Our winning culture enables employee: Engagement Ownership Accountability Engineers/Designers Development Retention Trades/Assembly Passion to succeed Employees by Skill Project Managers Other 12 A passion for winning with continuous improvement at
Slide 13: Our Markets
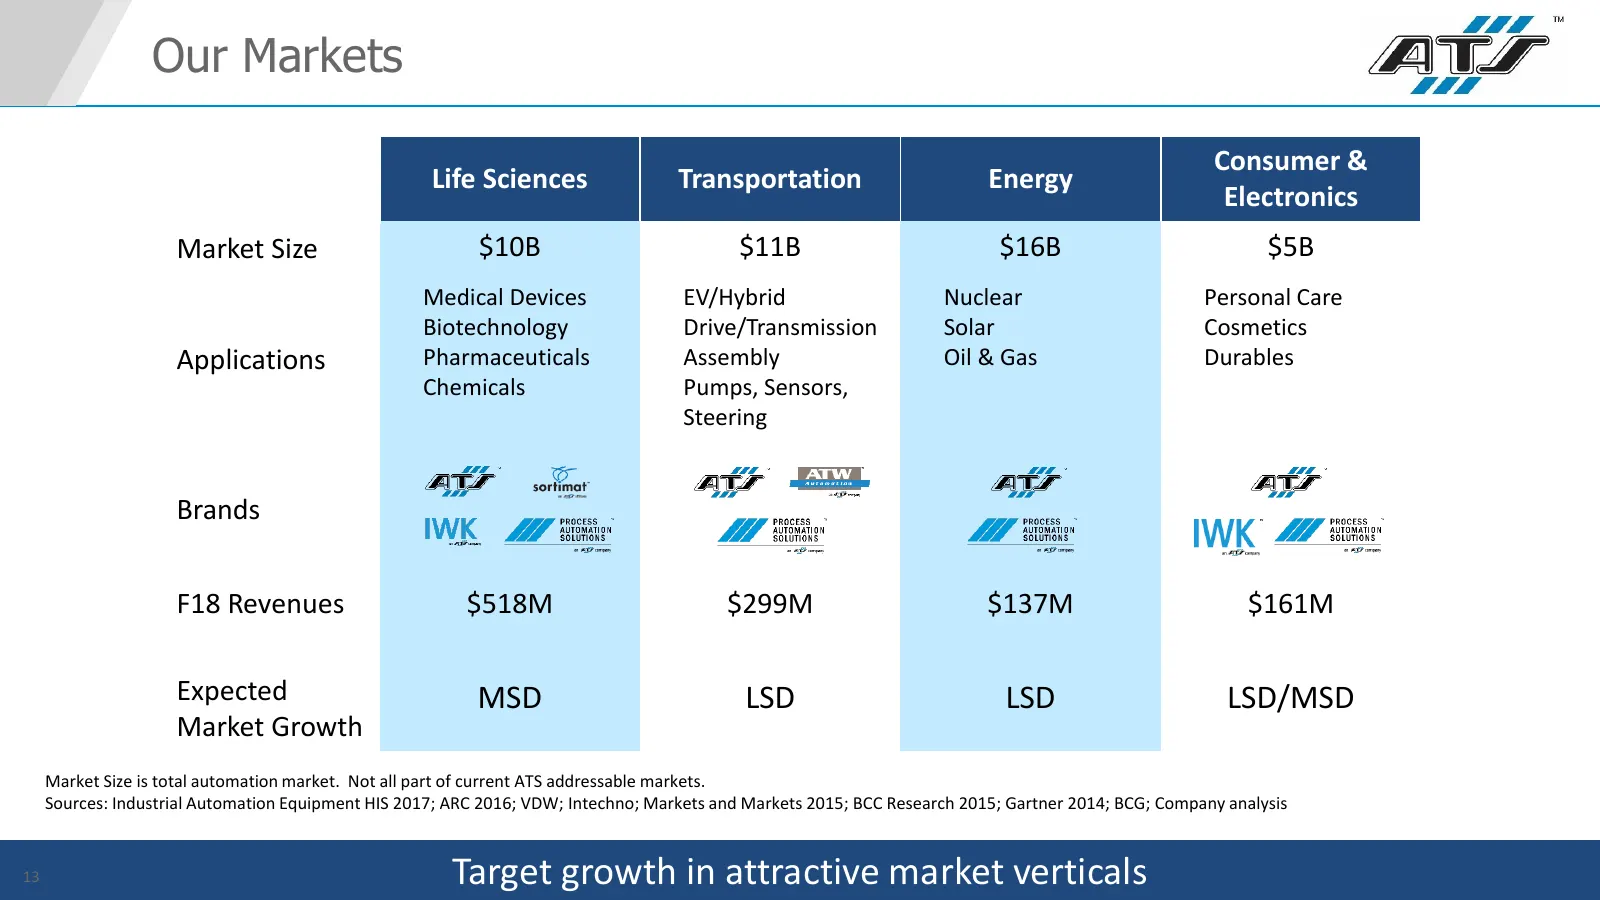
Our Markets Consumer & Life Sciences Transportation Energy Electronics Market Size $10B $11B $16B $5B Medical Devices EV/Hybrid Nuclear Personal Care Biotechnology Drive/Transmission Solar Cosmetics Applications Pharmaceuticals Assembly Oil & Gas Durables Chemicals Pumps, Sensors, Steering Brands F1
Slide 14: Growth Platforms
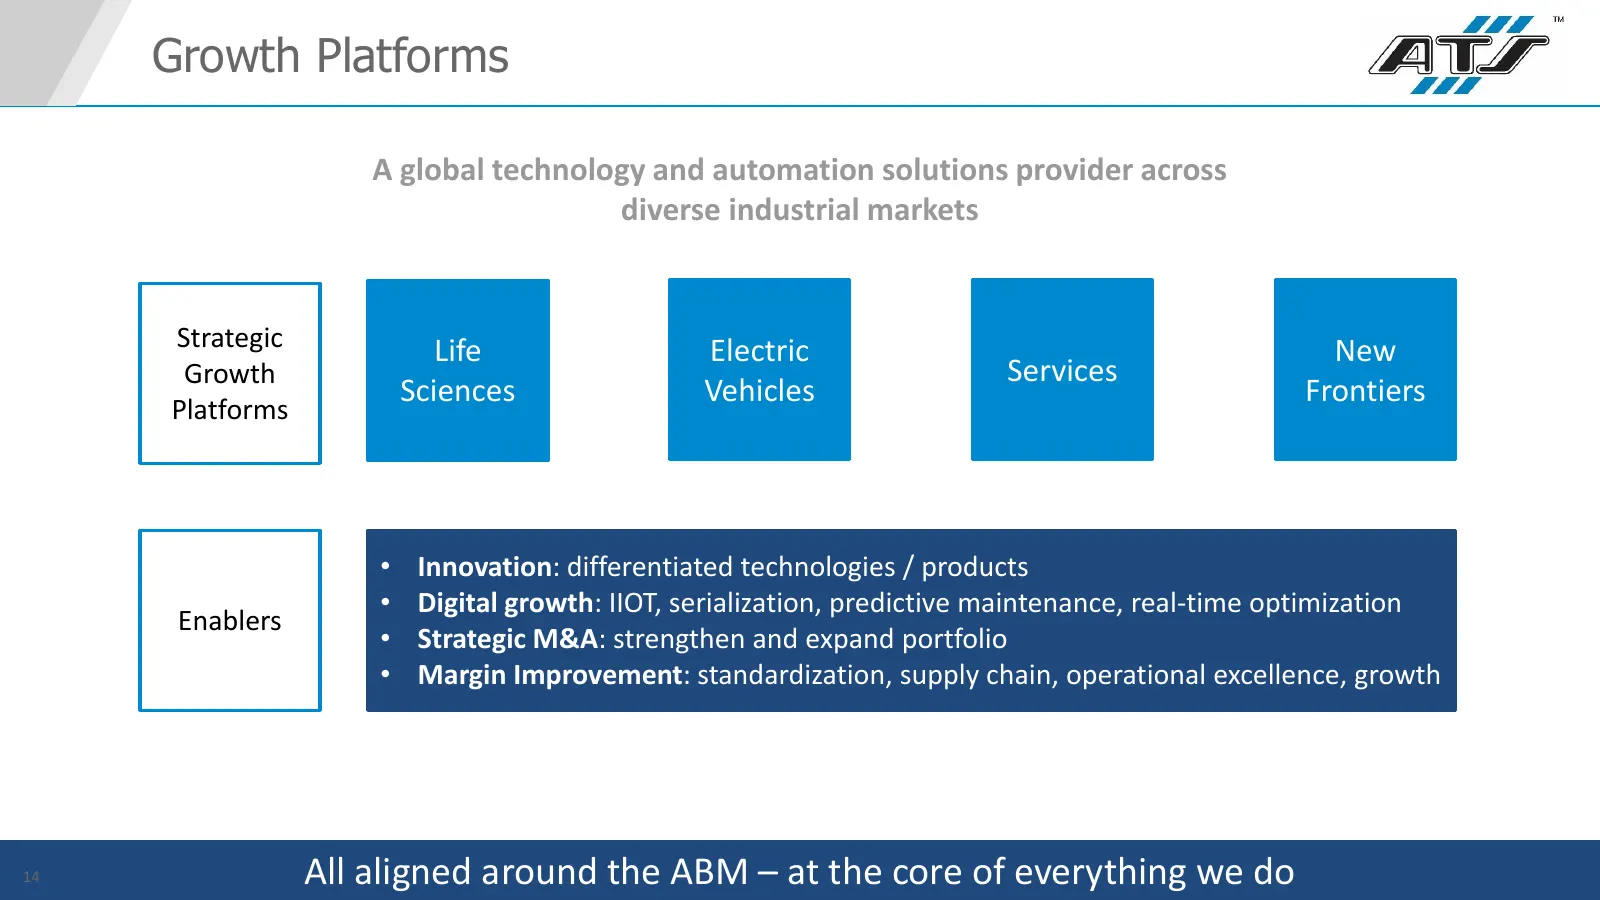
Growth Platforms A global technology and automation solutions provider across diverse industrial markets Strategic Life Electric New Growth Services Sciences Vehicles Frontiers Platforms • Innovation: differentiated technologies / products • Digital growth: IIOT, serialization, predictive maintenanc
Slide 15: Transportation: EV
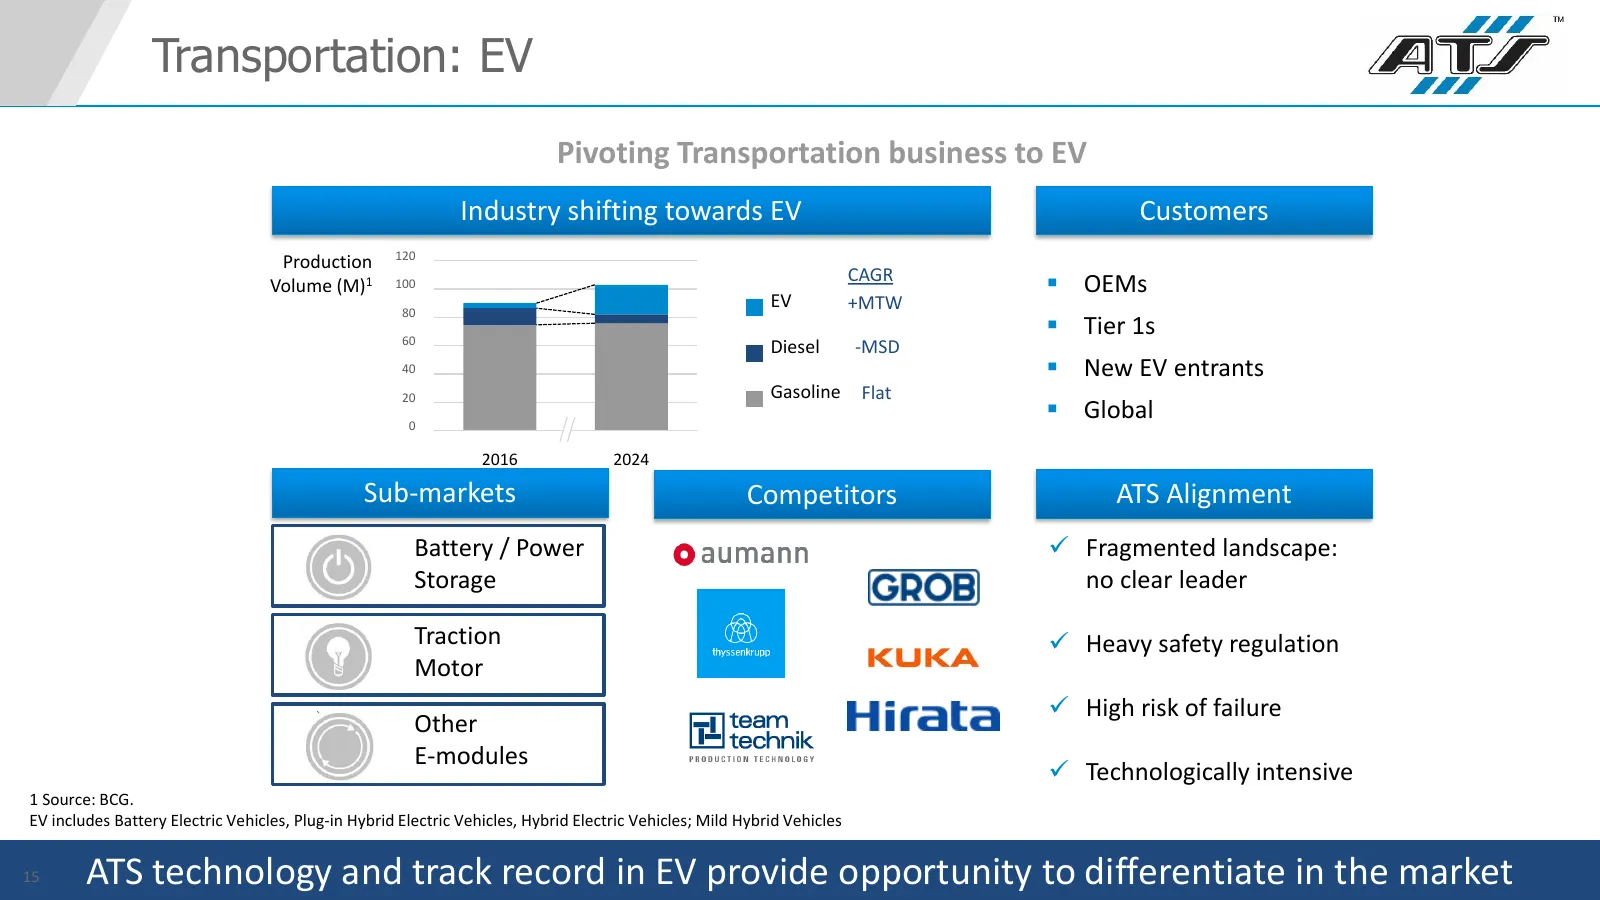
Transportation: EV Pivoting Transportation business to EV Industry shifting towards EV Customers 120 Production CAGR Volume (M)1 100 OEMs 80 EV +MTW 60 Tier 1s Diesel -MSD 40 New EV entrants 20 Gasoline Flat 0 Global 2016 2024 Sub-markets Competitors ATS Alignment Battery / Power Fragmente
Slide 16: KMW Acquisition
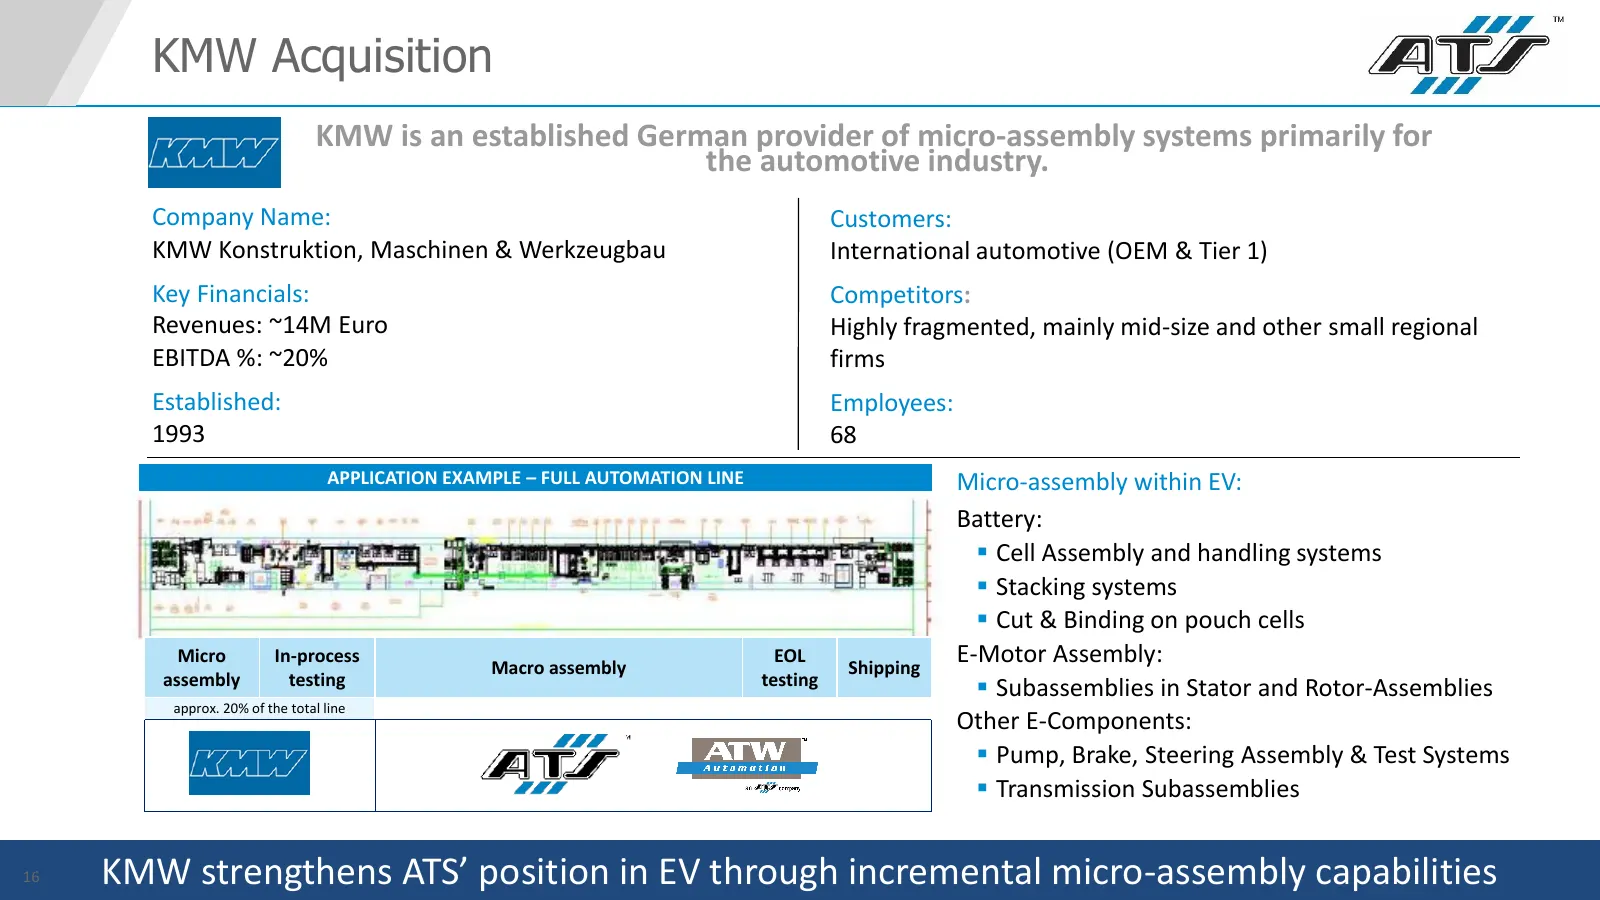
KMW Acquisition KMW is an established German provider of micro-assembly systems primarily for the automotive industry. Company Name: Customers: KMW Konstruktion, Maschinen & Werkzeugbau International automotive (OEM & Tier 1) Key Financials: Competitors: Revenues: ~14M Euro Highly fragmented, mainly
Slide 17: Disciplined M&A Approach
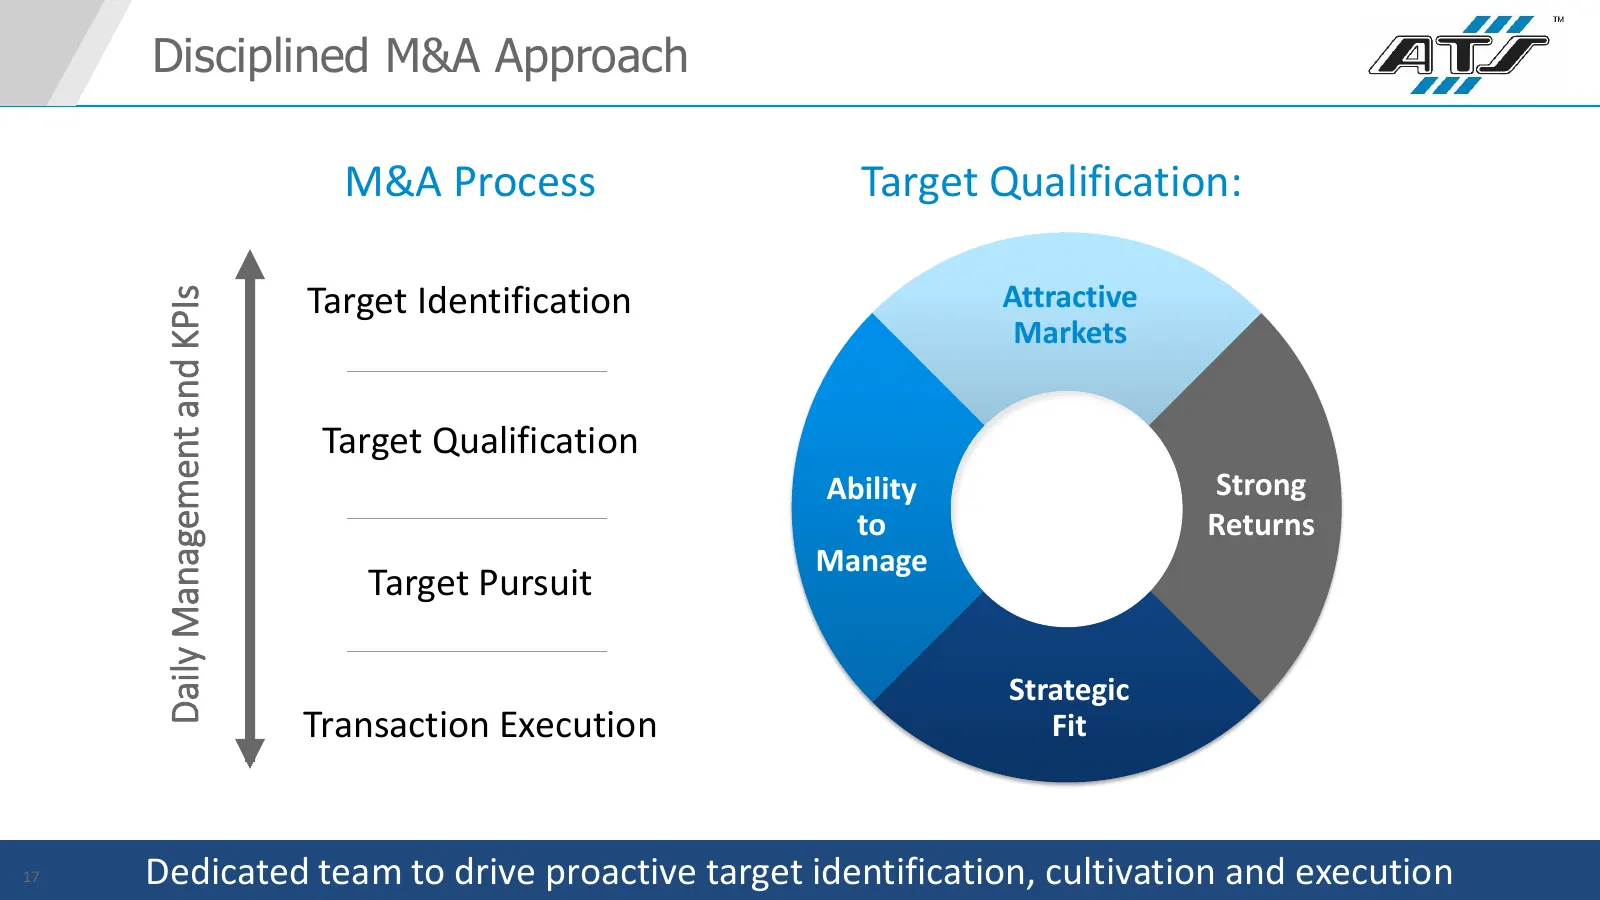
Disciplined M&A Approach M&A Process Target Qualification: Target Identification Attractive Daily Management and KPIs Markets Target Qualification Ability Strong to Returns Manage Target Pursuit Strategic Transaction Execution Fit 17 Dedicated team to drive proactive target identification, cultivati
Slide 18: Innovation
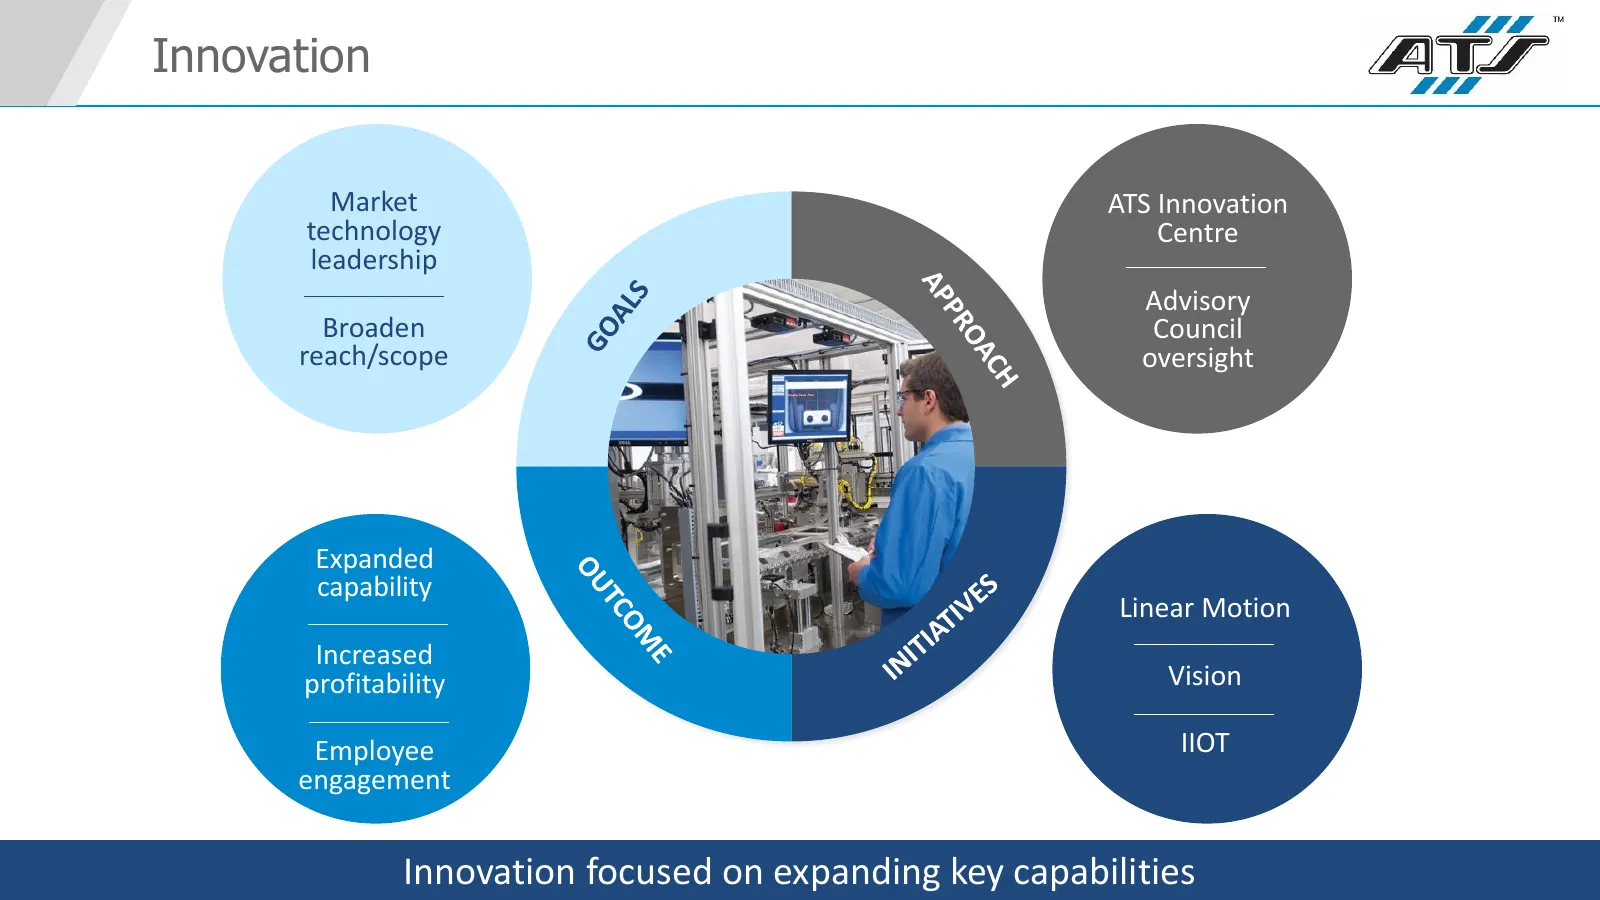
Innovation Market ATS Innovation technology Centre leadership Advisory Broaden Council reach/scope oversight Expanded capability Linear Motion Increased profitability Vision Employee IIOT engagement 18 Innovation focused on expanding key capabilities
Slide 19: Fiscal 2018 Overview
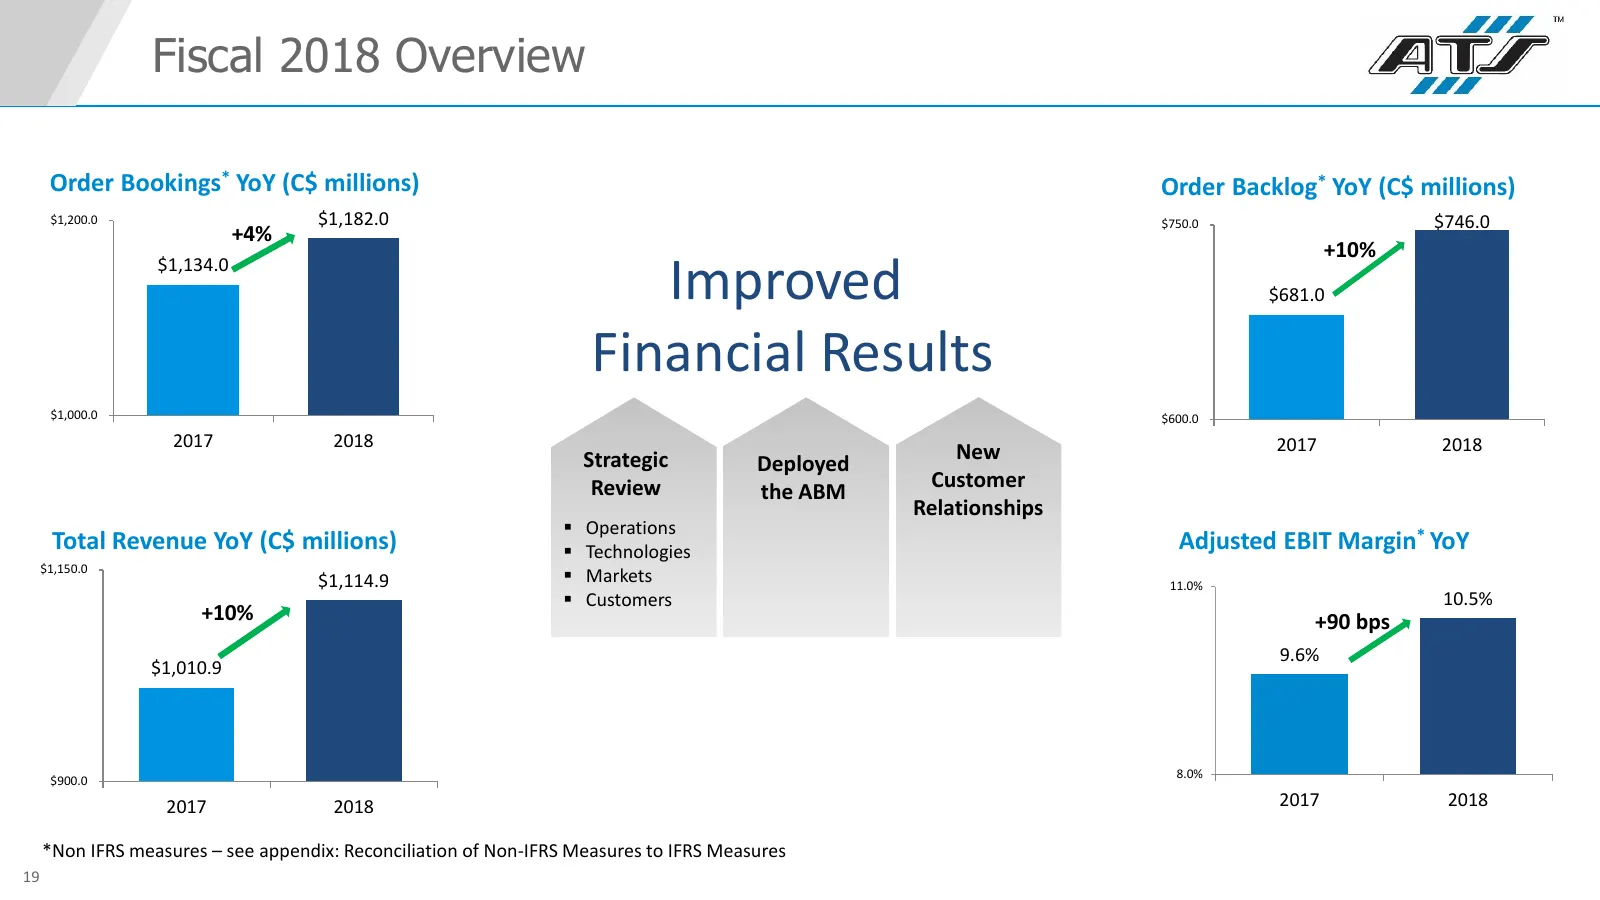
Fiscal 2018 Overview Order Bookings* YoY (C$ millions) Order Backlog* YoY (C$ millions) $1,200.0 $1,182.0 $750.0 $746.0 +4% +10% $1,134.0 Improved $681.0 Financial Results $1,000.0 $600.0 2017 2018 2017 2018 Strategic New Deployed Review Customer the ABM Relationships Operations Total Revenue YoY
Slide 20: Chris Hart
CHRIS HART President, Life Sciences
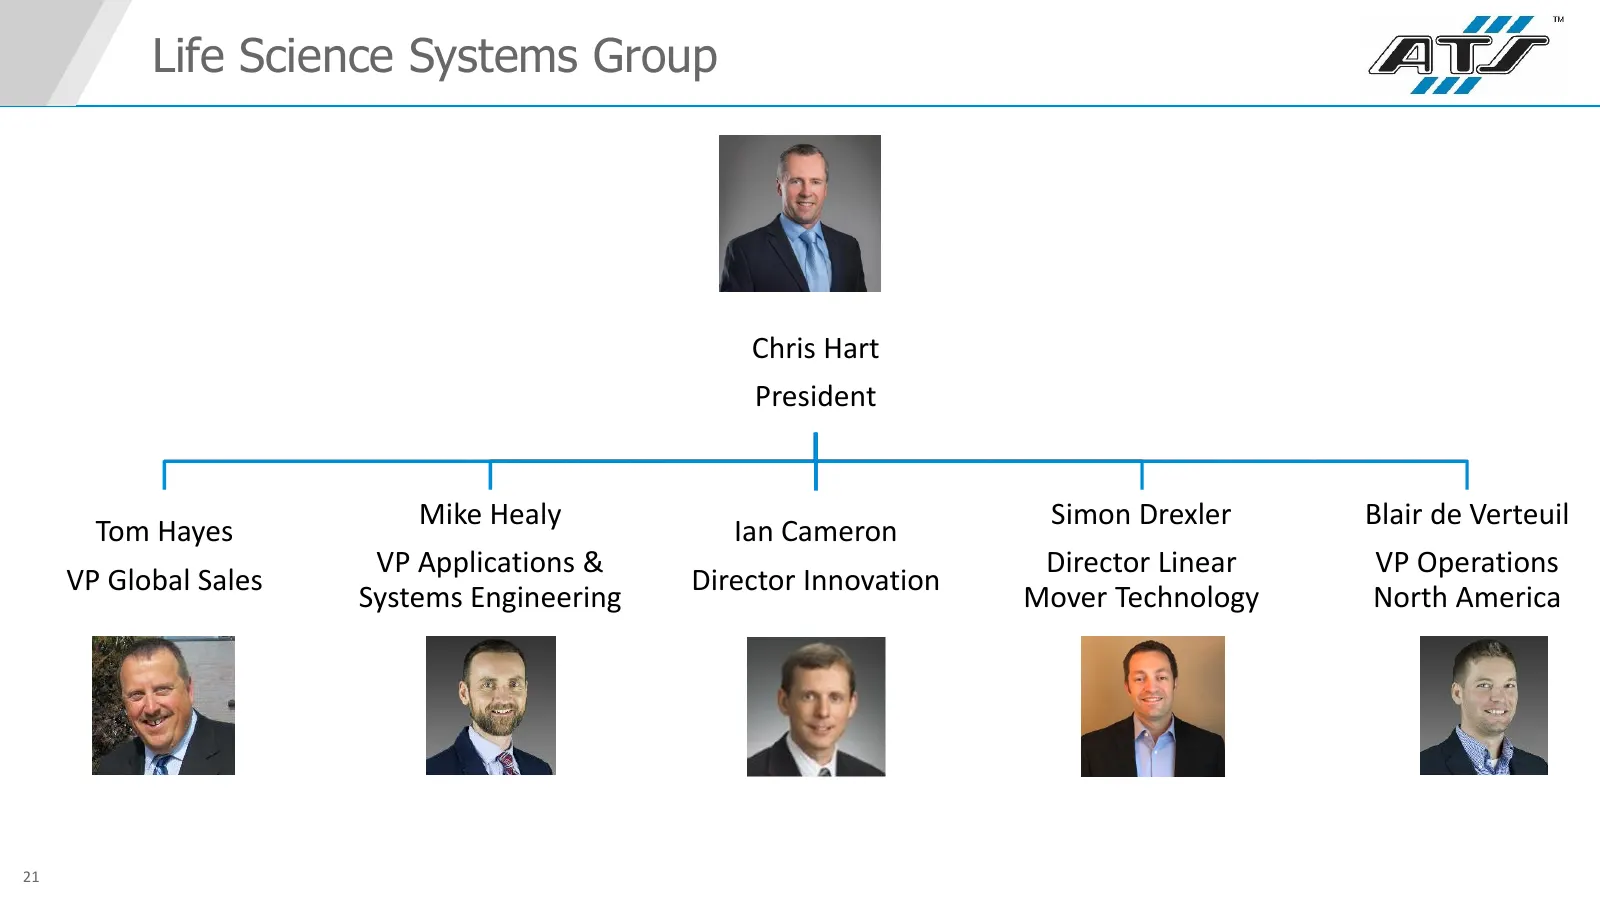
Slide 21: Life Science Systems Group
Life Science Systems Group Chris Hart President Mike Healy Simon Drexler Blair de Verteuil Tom Hayes Ian Cameron VP Applications & Director Linear VP Operations VP Global Sales Director Innovation Systems Engineering Mover Technology North America 21
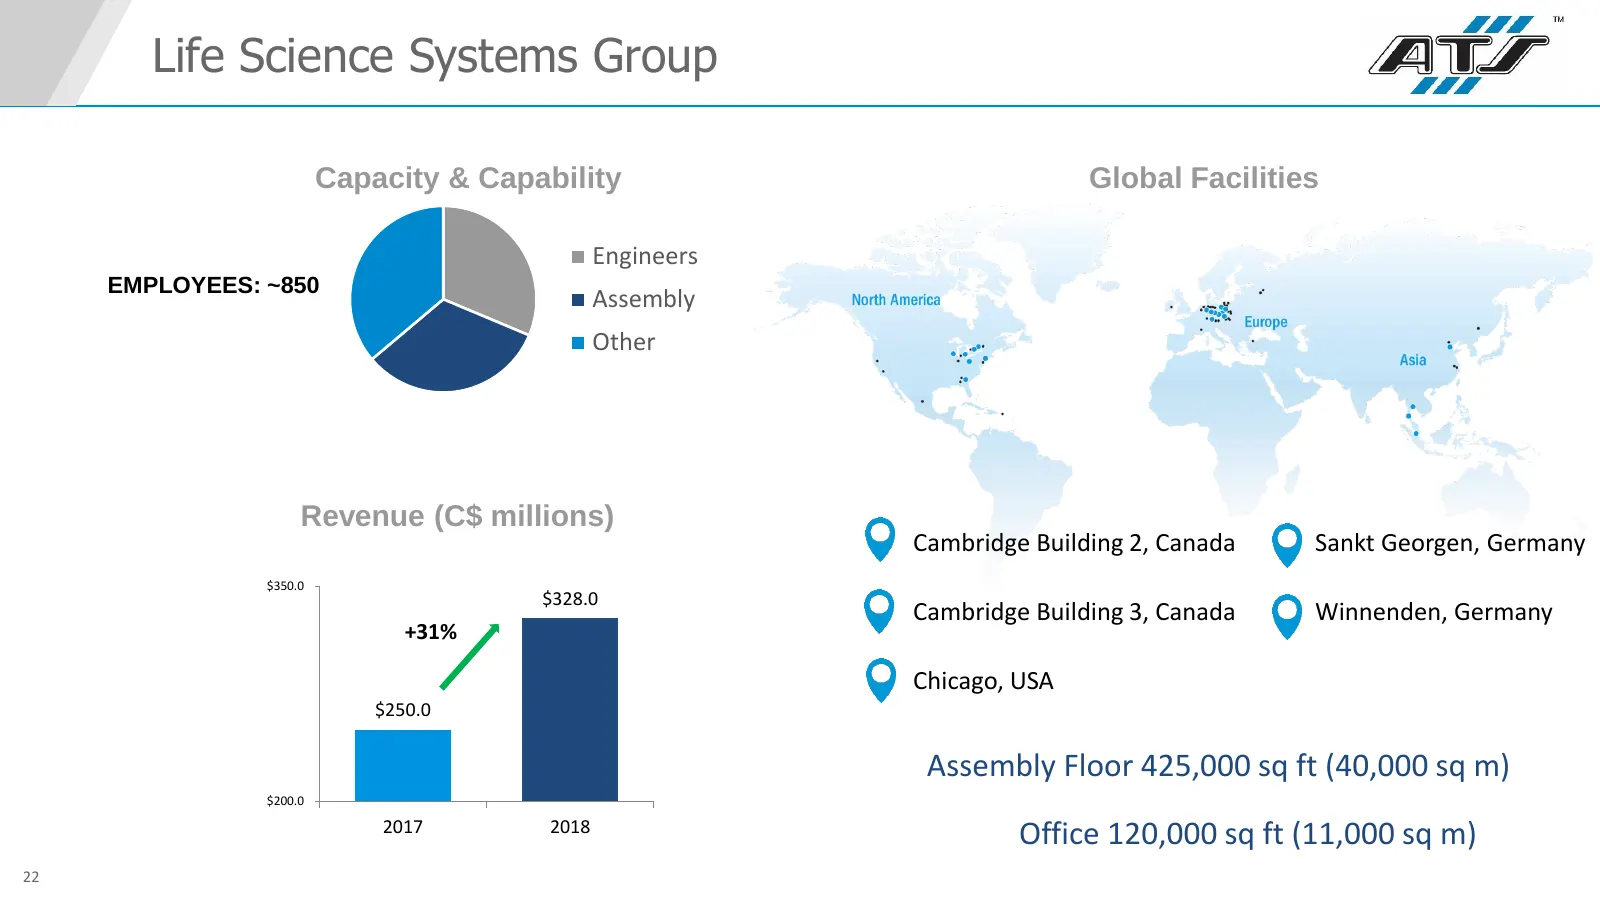
Slide 22: Life Science Systems Group: Capacity & Capability
Life Science Systems Group Capacity & Capability Global Facilities Engineers EMPLOYEES: ~850 Assembly Other Revenue (C$ millions) Cambridge Building 2, Canada Sankt Georgen, Germany $350.0 $328.0 Cambridge Building 3, Canada Winnenden, Germany +31% Chicago, USA $250.0 Assembly Floor 425,000 sq ft (4
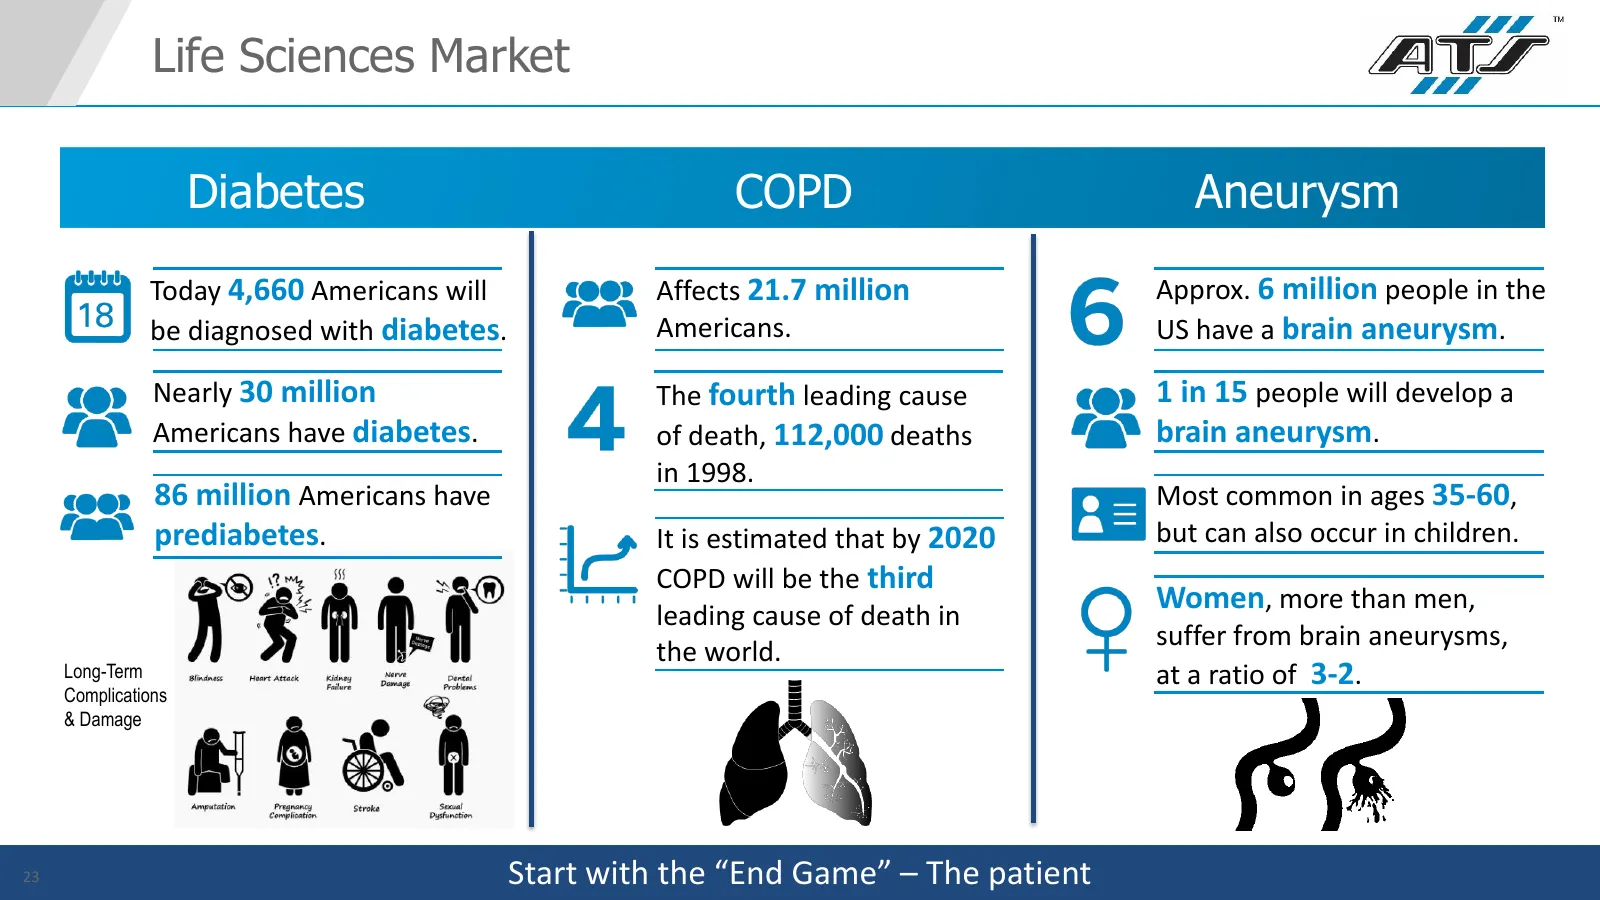
Slide 23: Life Sciences Market
Life Sciences Market Diabetes COPD Aneurysm Today 4,660 Americans will Affects 21.7 million Approx. 6 million people in the be diagnosed with diabetes. Americans. US have a brain aneurysm. Nearly 30 million The fourth leading cause 1 in 15 people will develop a Americans have diabetes. of death, 112
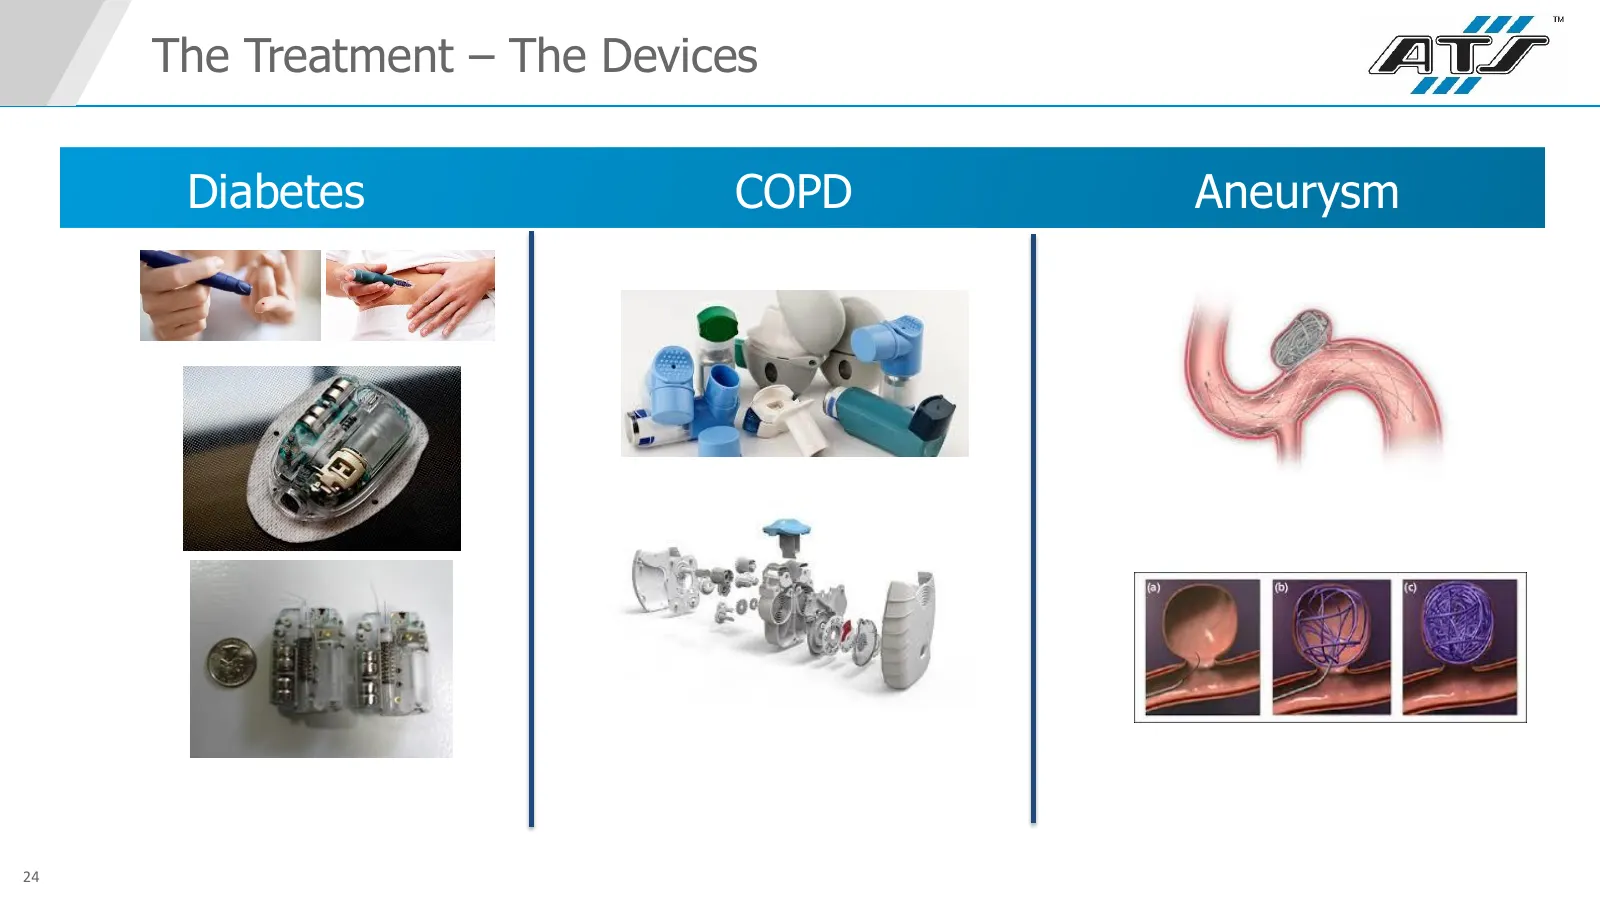
Slide 24: The Treatment – The Devices
The Treatment – The Devices Diabetes COPD Aneurysm 24
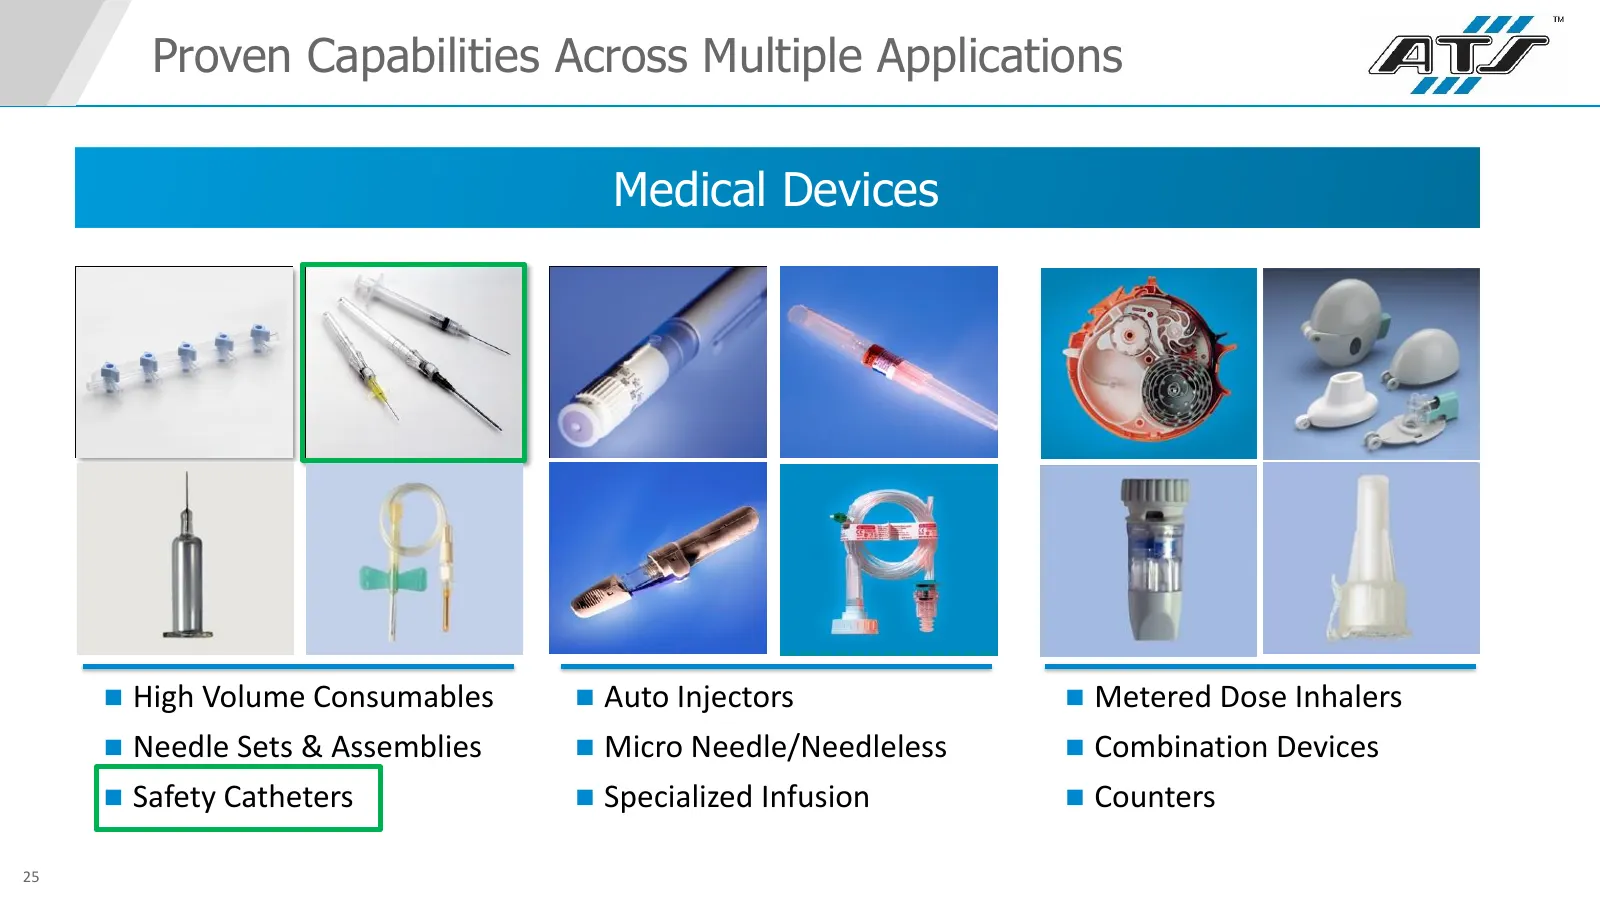
Slide 25: Proven Capabilities: Medical Devices
Proven Capabilities Across Multiple Applications Medical Devices High Volume Consumables Auto Injectors Metered Dose Inhalers Needle Sets & Assemblies Micro Needle/Needleless Combination Devices Safety Catheters Specialized Infusion Counters 25
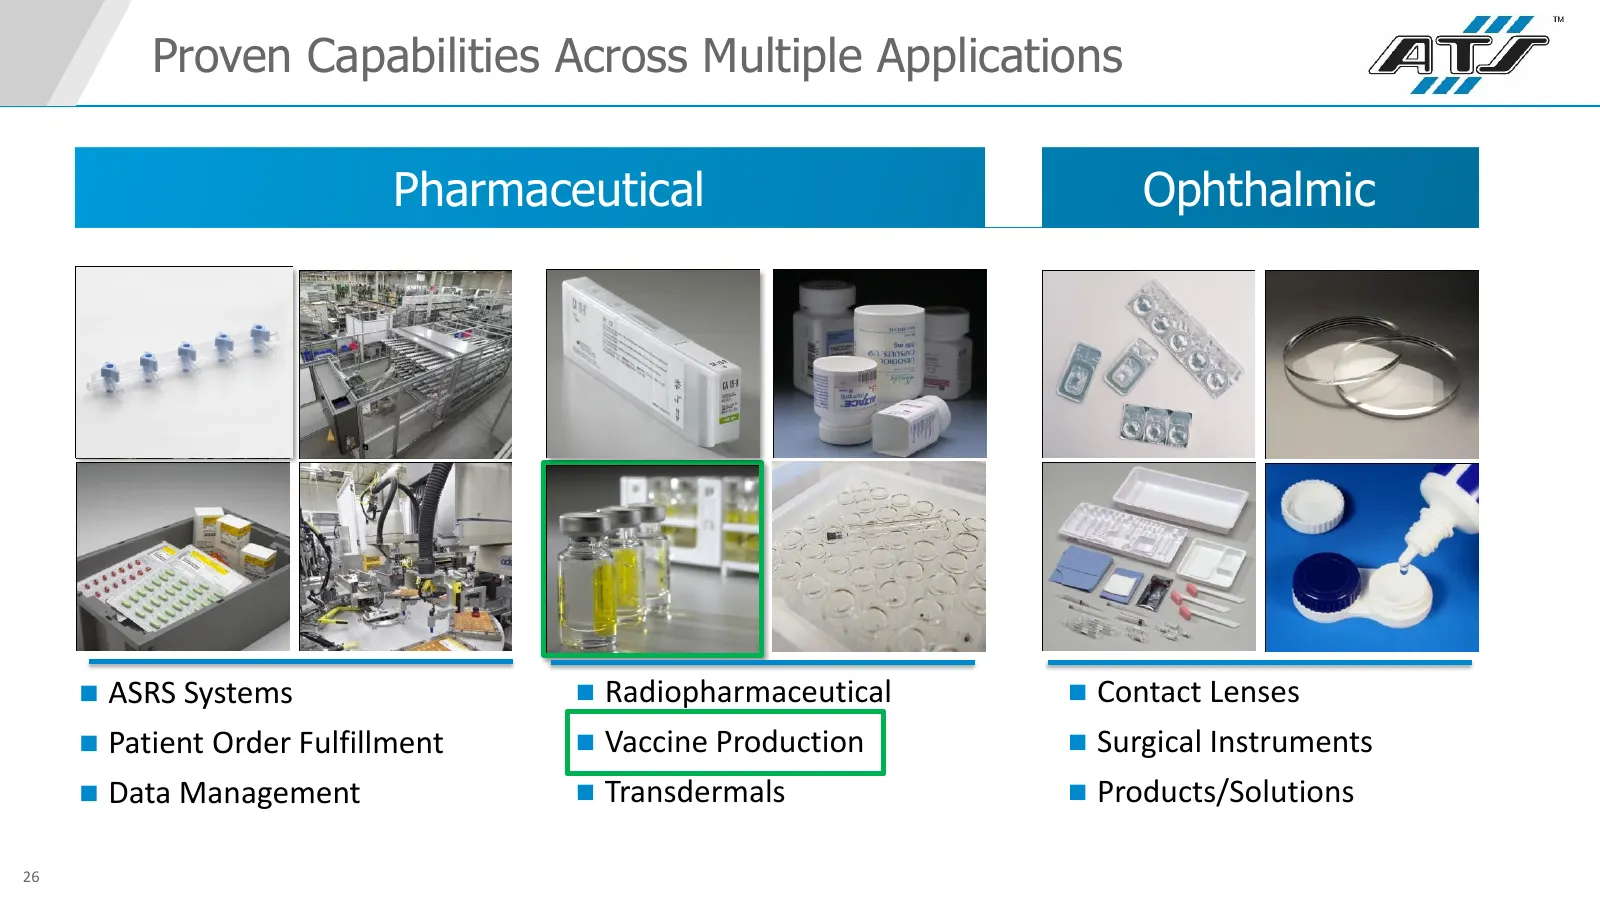
Slide 26: Proven Capabilities: Pharmaceutical and Ophthalmic
Proven Capabilities Across Multiple Applications Pharmaceutical Ophthalmic ASRS Systems Radiopharmaceutical Contact Lenses Patient Order Fulfillment Vaccine Production Surgical Instruments Data Management Transdermals Products/Solutions 26
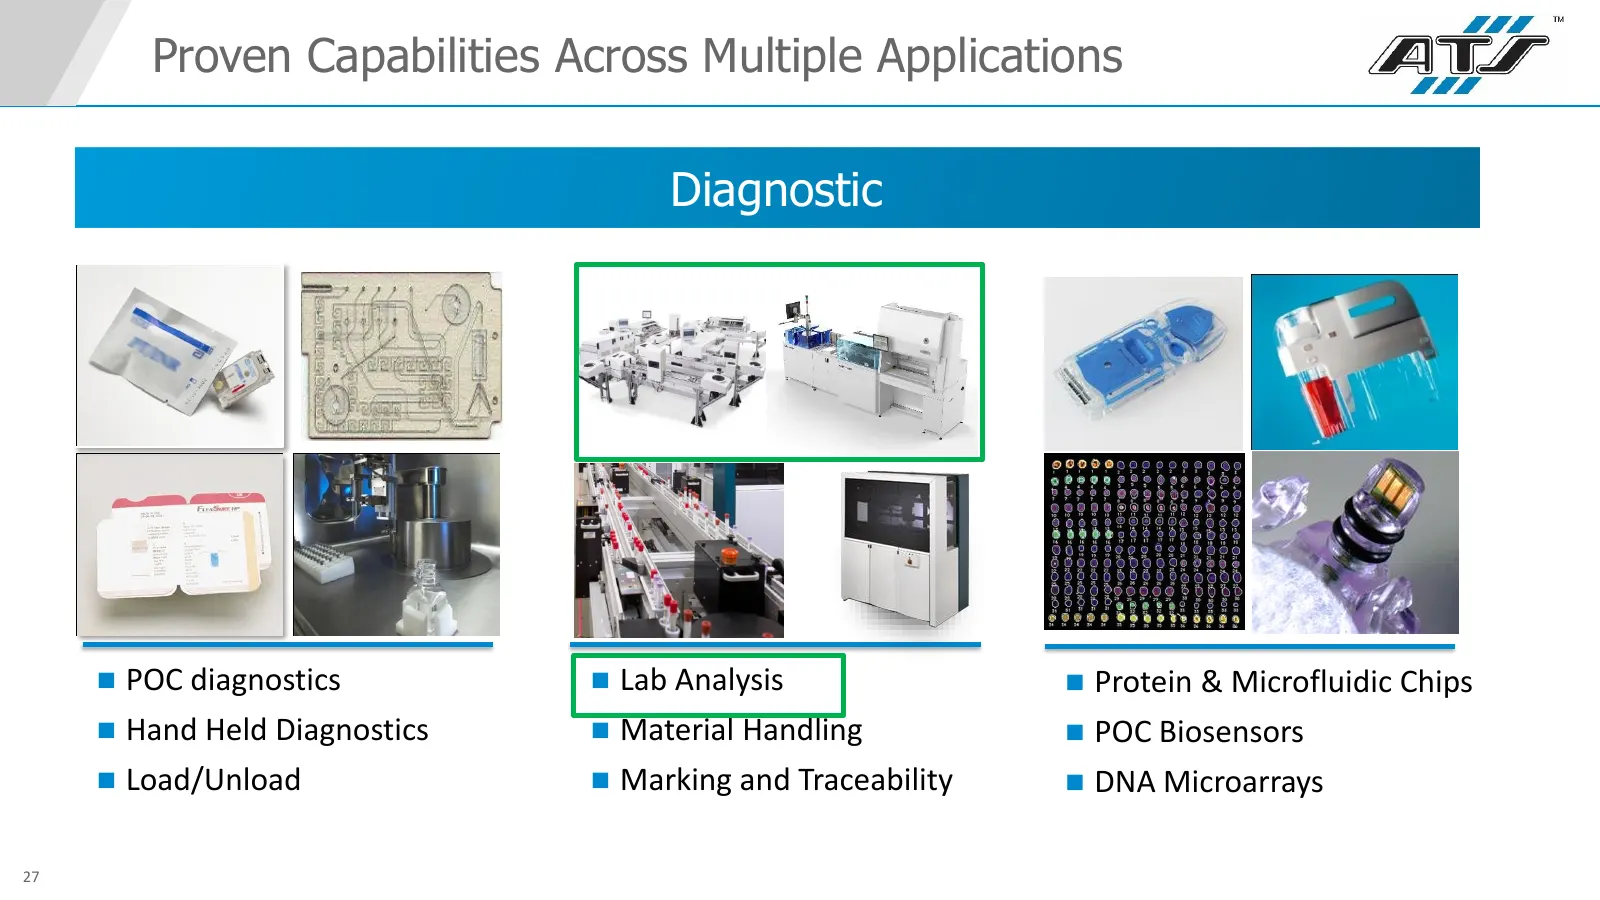
Slide 27: Proven Capabilities: Diagnostic
Proven Capabilities Across Multiple Applications Diagnostic POC diagnostics Lab Analysis Protein & Microfluidic Chips Hand Held Diagnostics Material Handling POC Biosensors Load/Unload Marking and Traceability DNA Microarrays 27
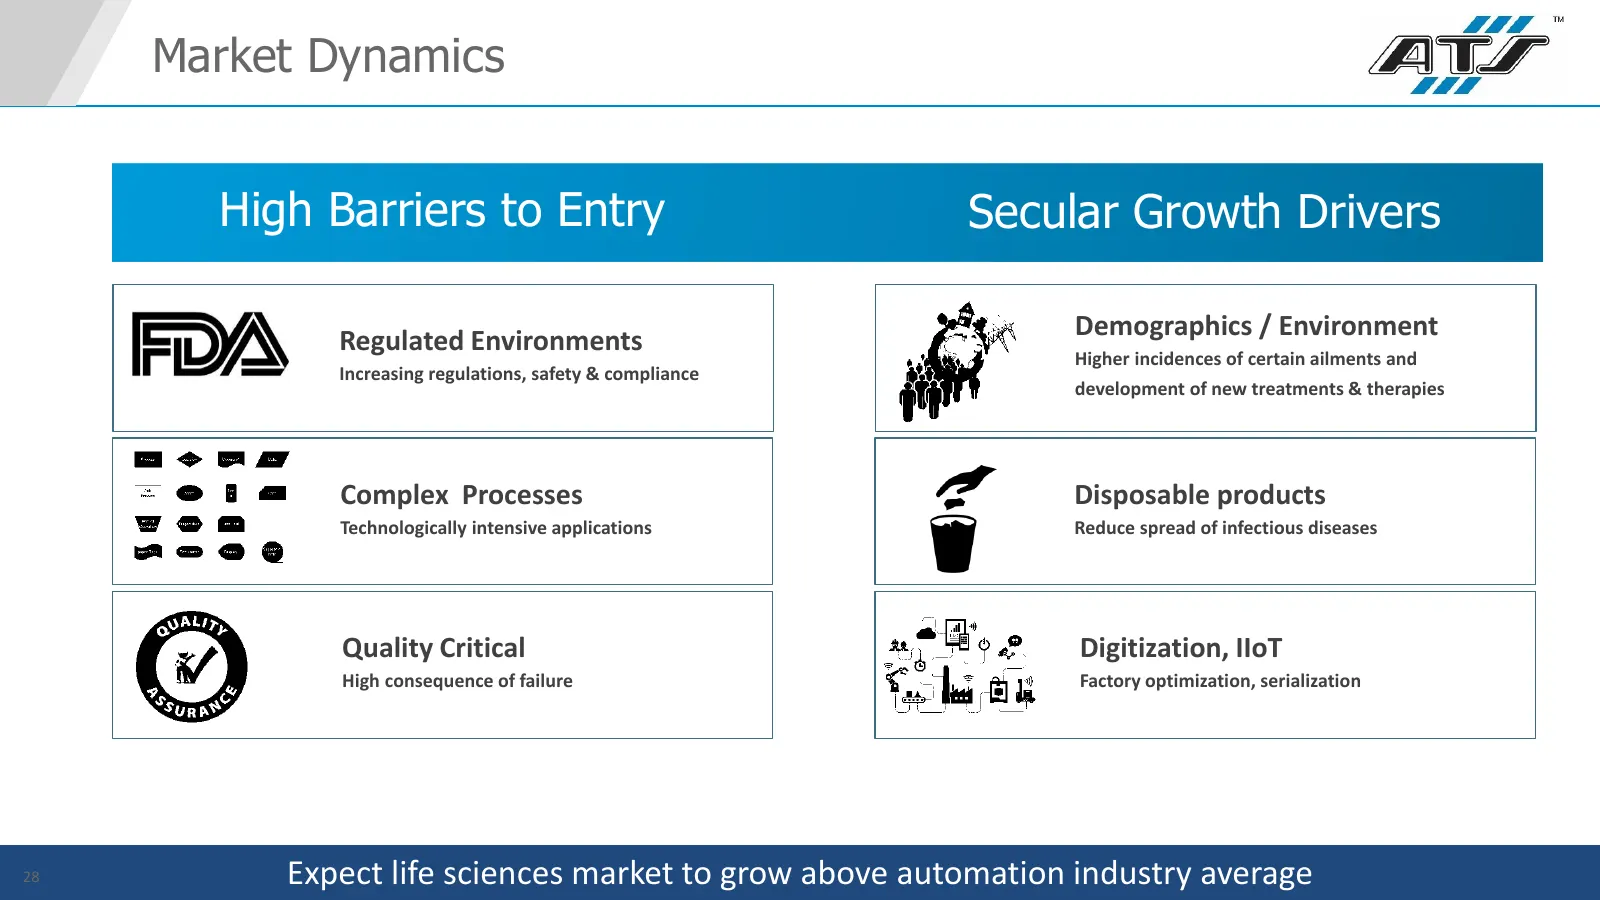
Slide 28: Market Dynamics
Market Dynamics High Barriers to Entry Secular Growth Drivers Demographics / Environment Regulated Environments Higher incidences of certain ailments and Increasing regulations, safety & compliance development of new treatments & therapies Complex Processes Disposable products Technologically intens
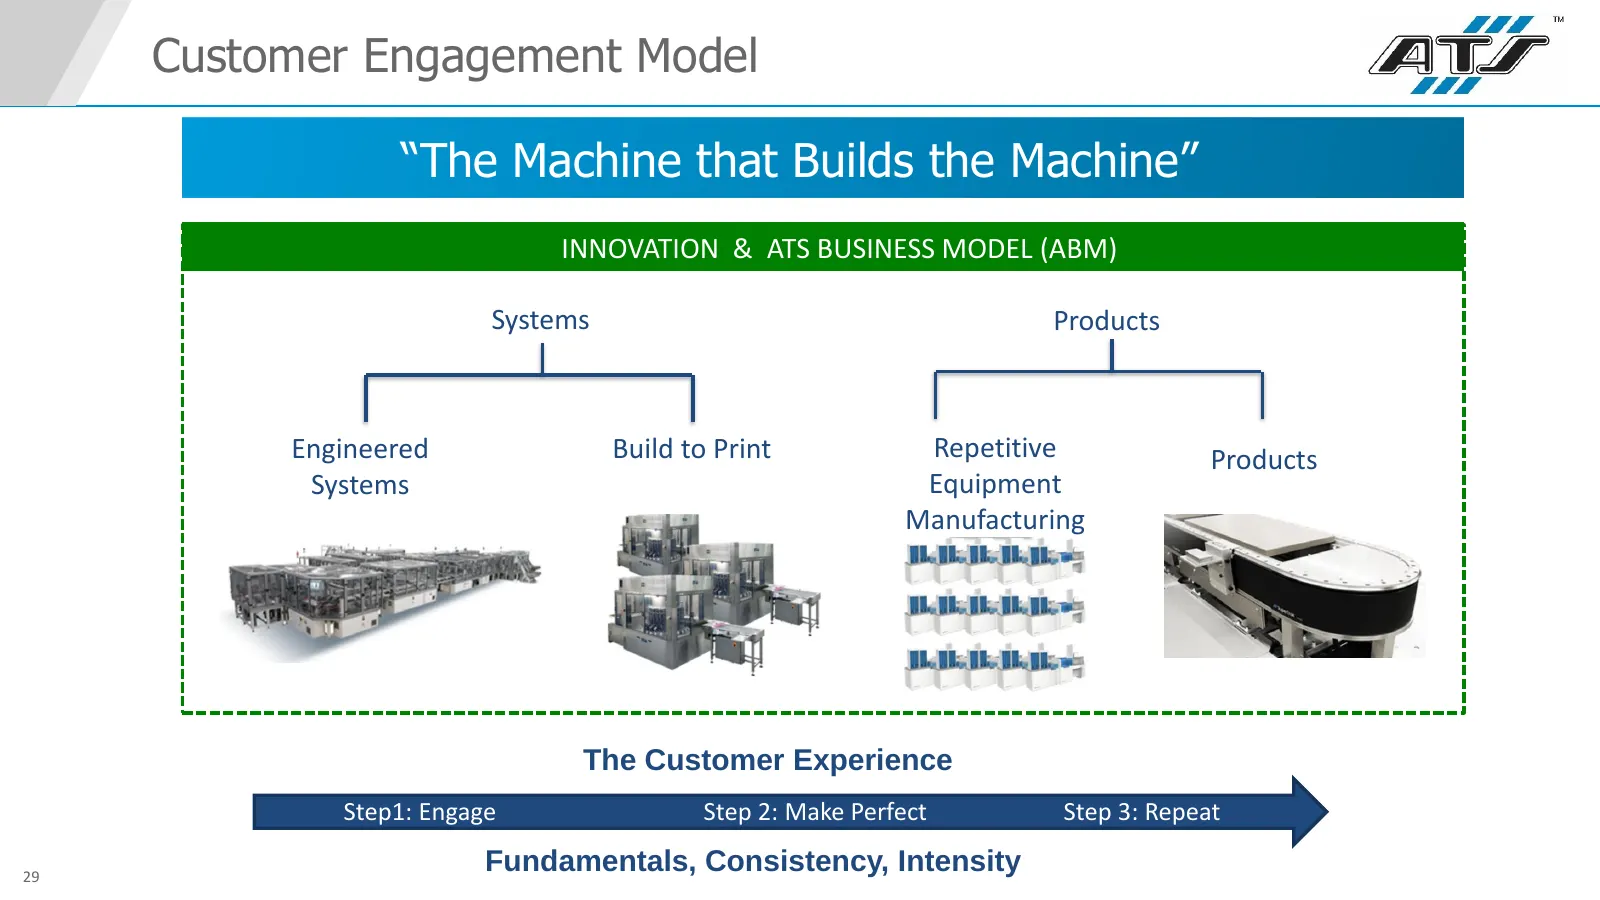
Slide 29: Customer Engagement Model
Customer Engagement Model “The Machine that Builds the Machine” INNOVATION & ATS BUSINESS MODEL (ABM) Systems Products Engineered Build to Print Repetitive Products Systems Equipment Manufacturing The Customer Experience Step1: Engage Step 2: Make Perfect Step 3: Repeat 29 Fundamentals, Consistency,
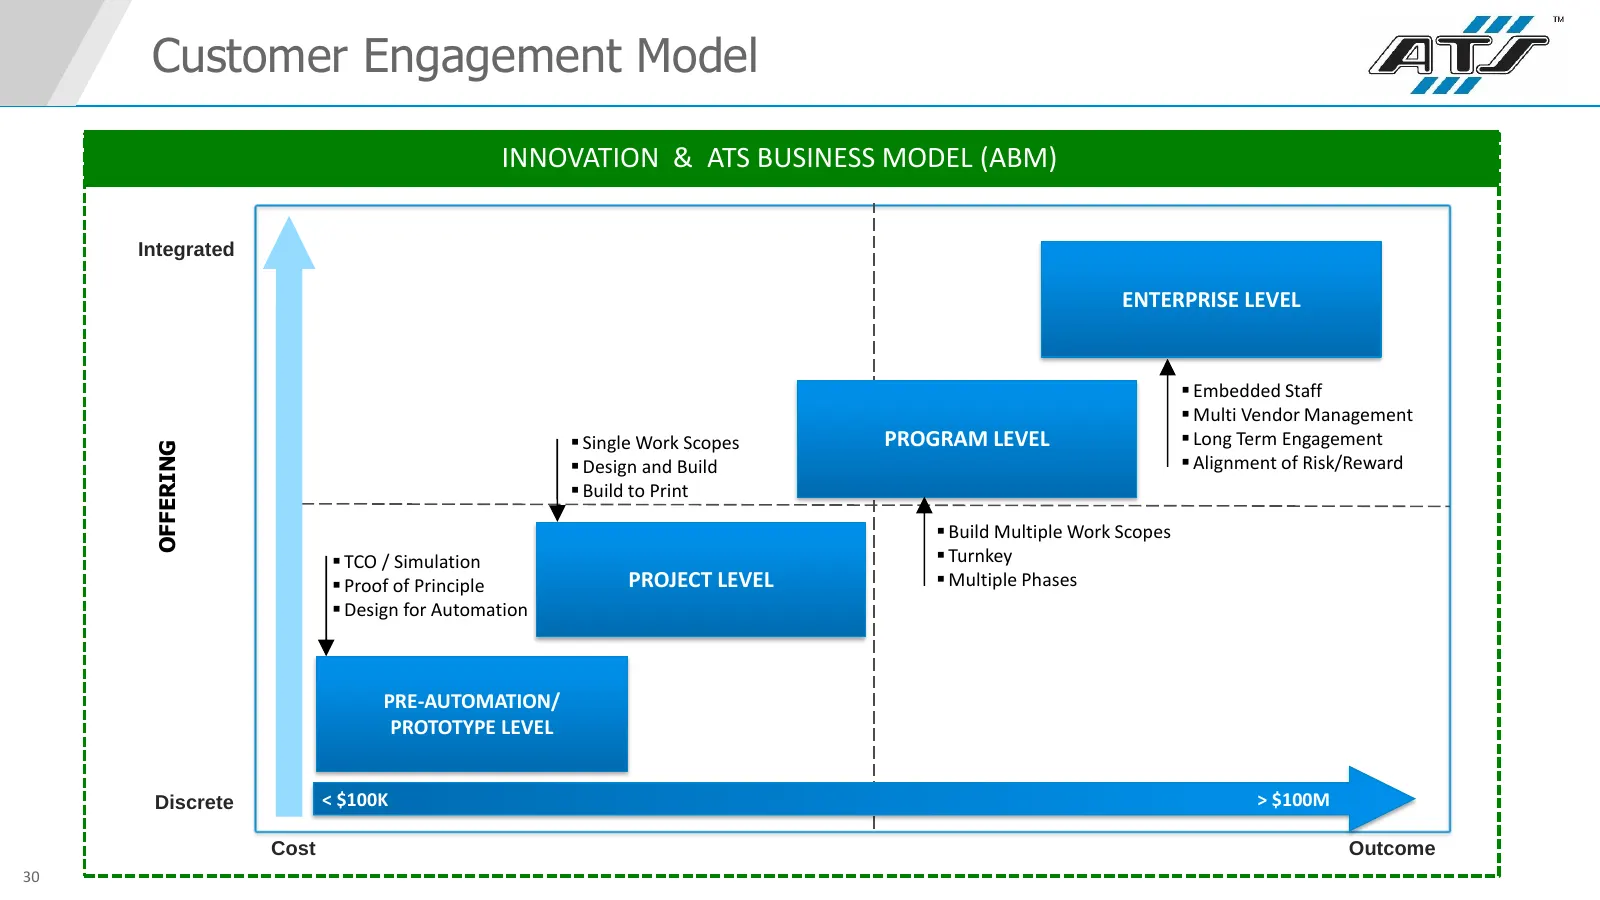
Slide 30: Customer Engagement Model: Offering
Customer Engagement Model INNOVATION & ATS BUSINESS MODEL (ABM) Integrated ENTERPRISE LEVEL Embedded Staff Multi Vendor Management Single Work Scopes PROGRAM LEVEL Long Term Engagement OFFERING Design and Build Alignment of Risk/Reward Build to Print Build Multiple Work Scopes TCO
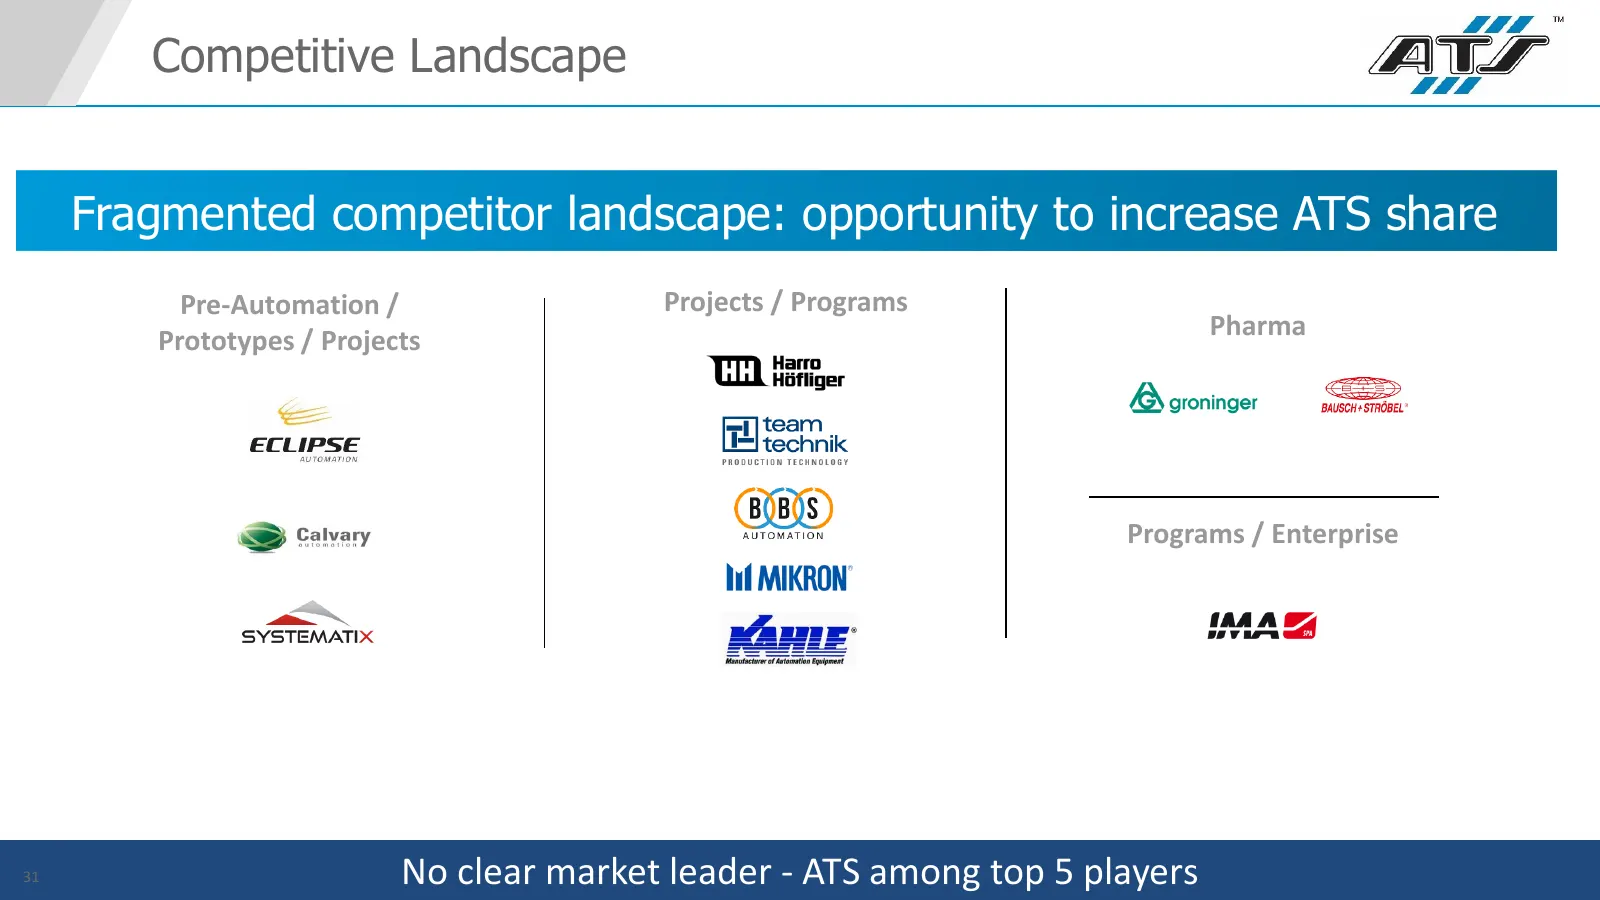
Slide 31: Competitive Landscape
Competitive Landscape Fragmented competitor landscape: opportunity to increase ATS share Pre-Automation / Projects / Programs Pharma Prototypes / Projects Programs / Enterprise 31 No clear market leader - ATS among top 5 players
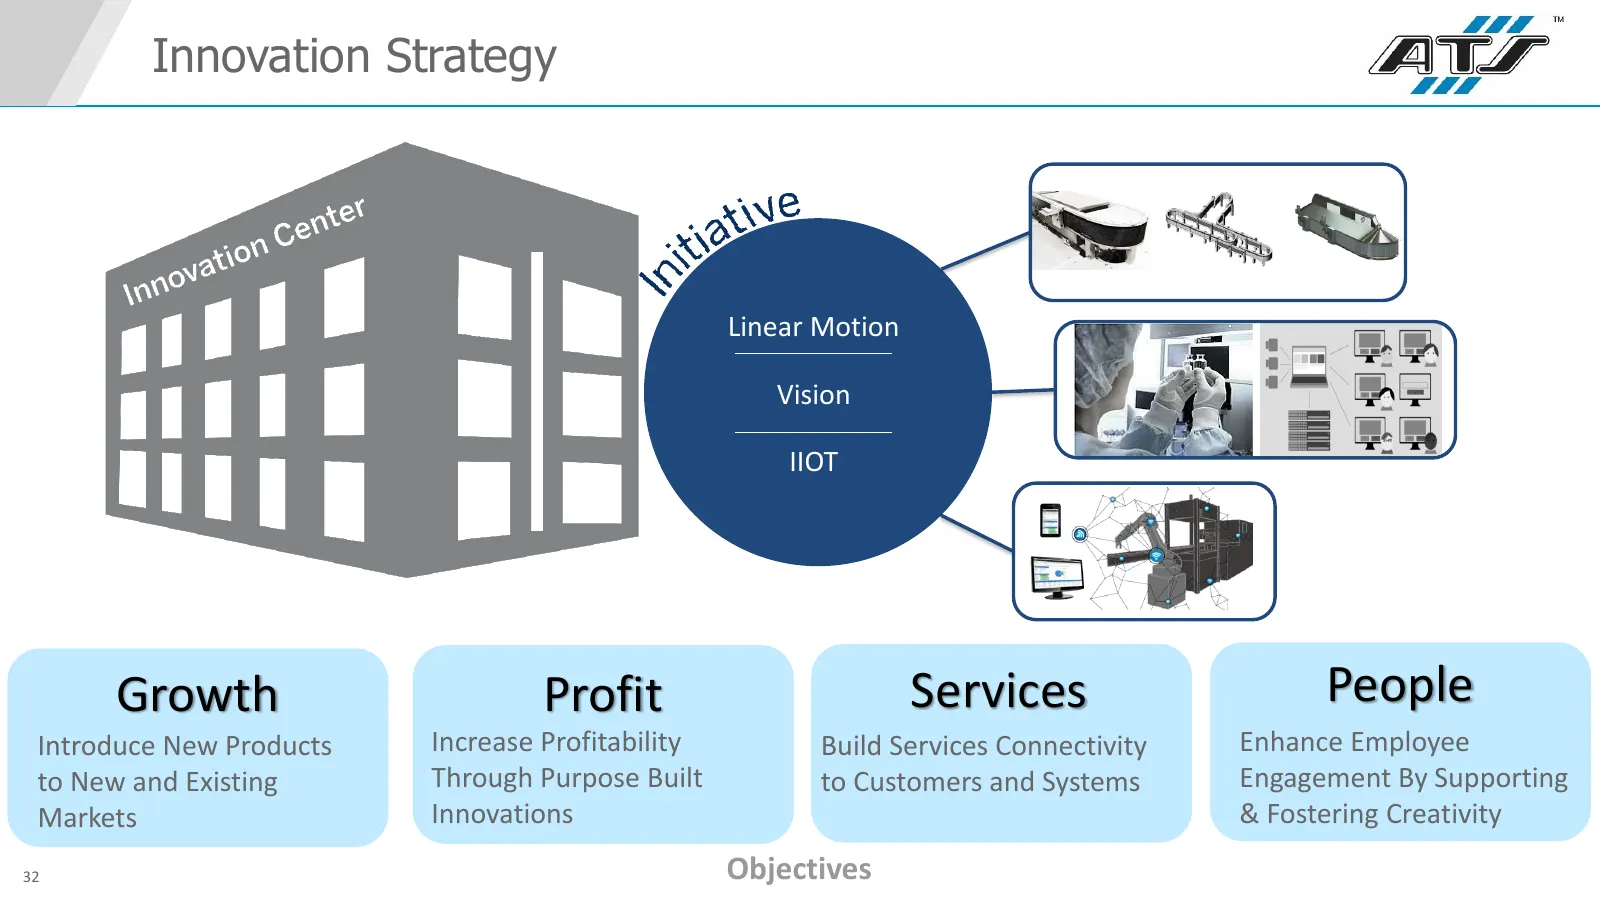
Slide 32: Innovation Strategy
Innovation Strategy Linear Motion Vision IIOT Growth Profit Services People Introduce New Products Increase Profitability Build Services Connectivity Enhance Employee to New and Existing Through Purpose Built to Customers and Systems Engagement By Supporting Markets Innovations & Fostering Creativit
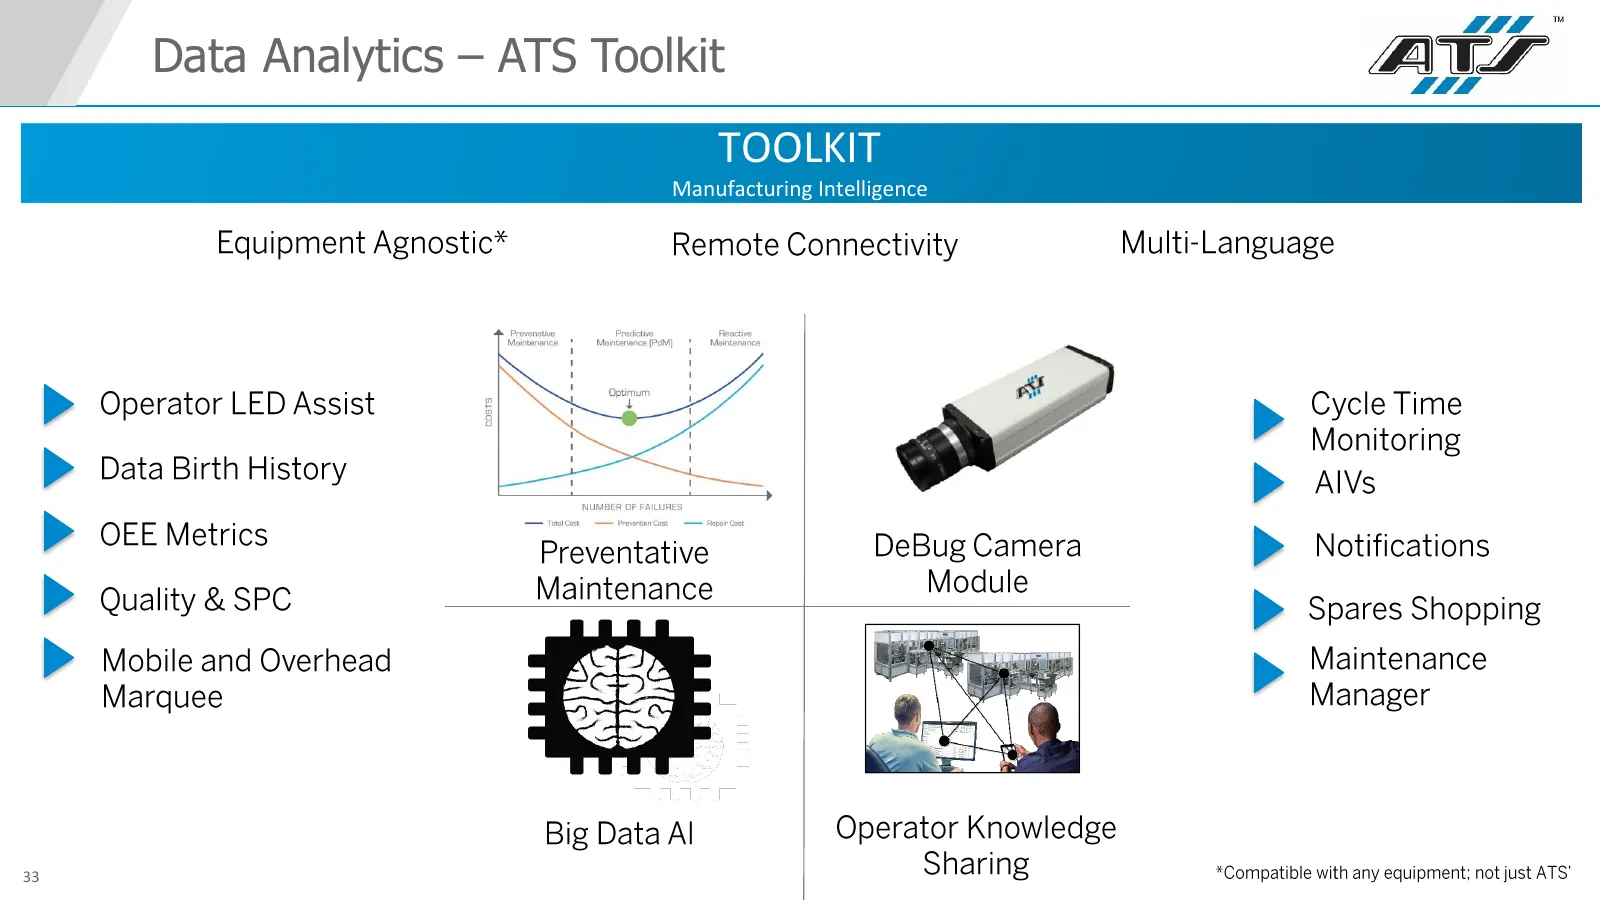
Slide 33: Data Analytics – ATS Toolkit
Data Analytics – ATS Toolkit TOOLKIT Manufacturing Intelligence 33
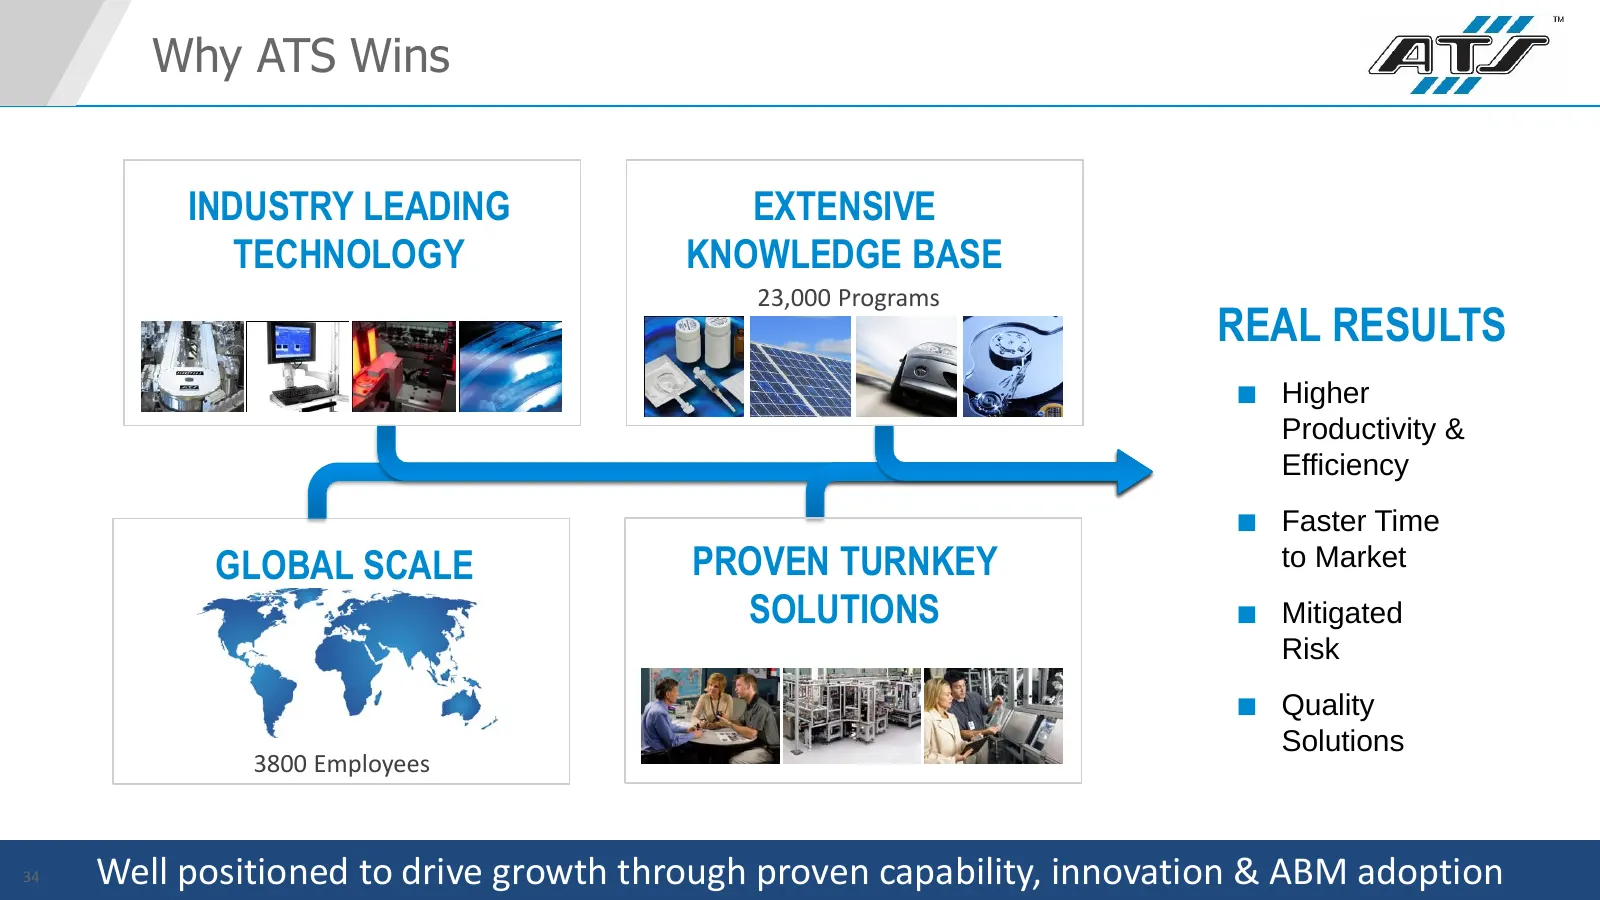
Slide 34: Why ATS Wins
Why ATS Wins INDUSTRY LEADING EXTENSIVE TECHNOLOGY KNOWLEDGE BASE 23,000 Programs REAL RESULTS ■ Higher Productivity & Efficiency ■ Faster Time GLOBAL SCALE PROVEN TURNKEY to Market SOLUTIONS ■ Mitigated Risk ■ Quality Solutions 3800 Employees 34 Well positioned to drive growth through proven capabi
Slide 35: Simon Roberts
SIMON ROBERTS Senior Vice President, After Sales Services
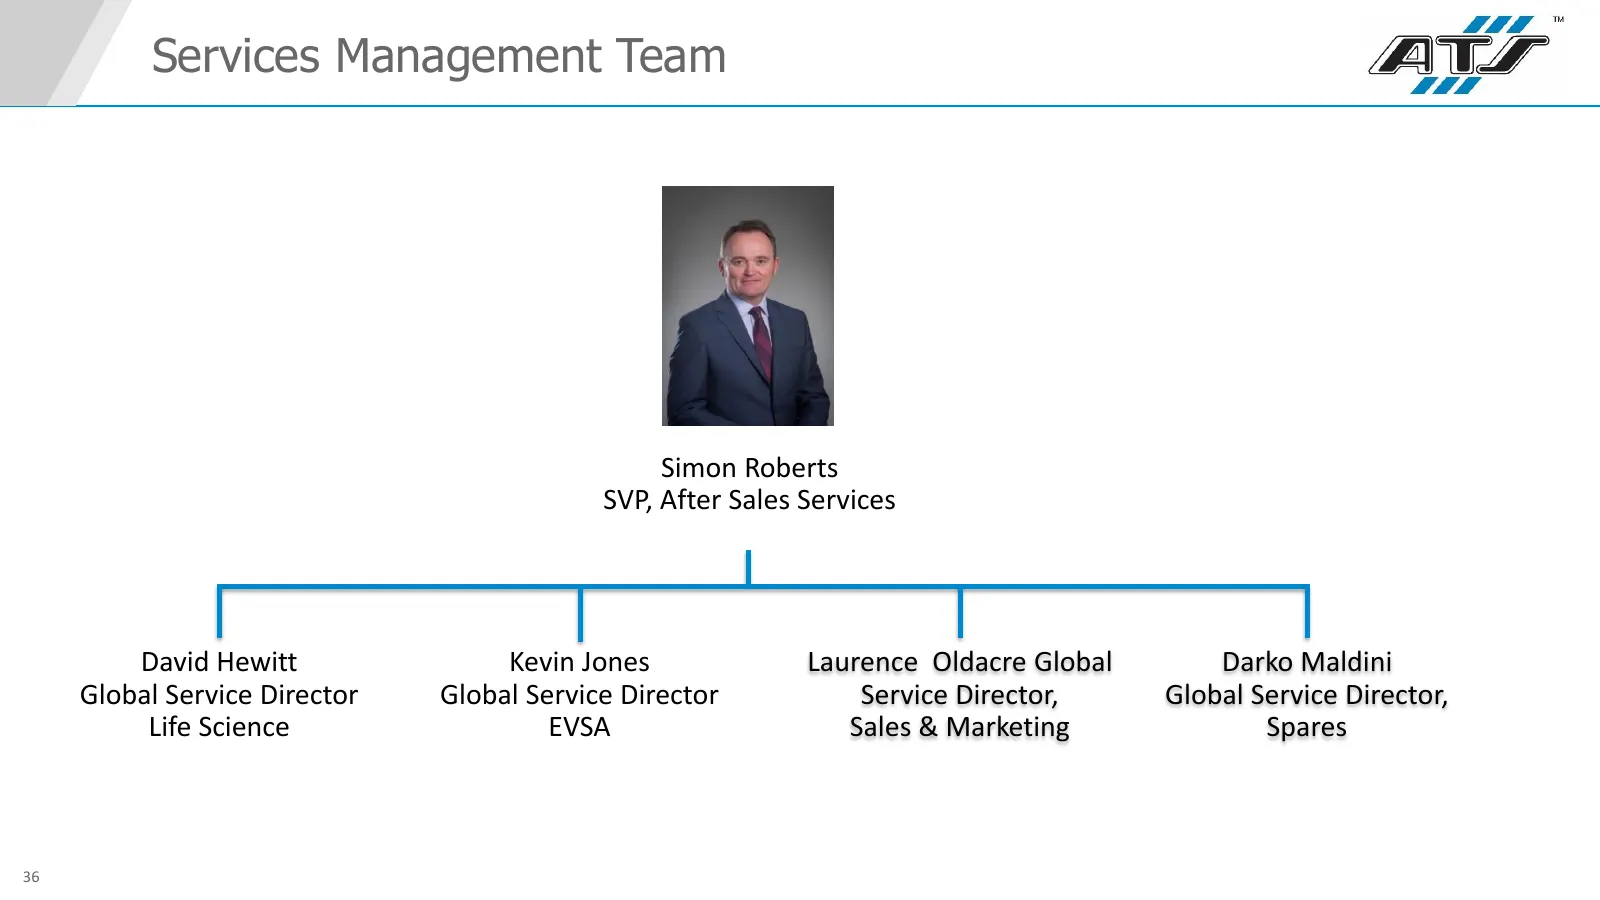
Slide 36: Services Management Team
Services Management Team Simon Roberts SVP, After Sales Services David Hewitt Kevin Jones Laurence Oldacre Global Darko Maldini Global Service Director Global Service Director Service Director, Global Service Director, Life Science EVSA Sales & Marketing Spares 36
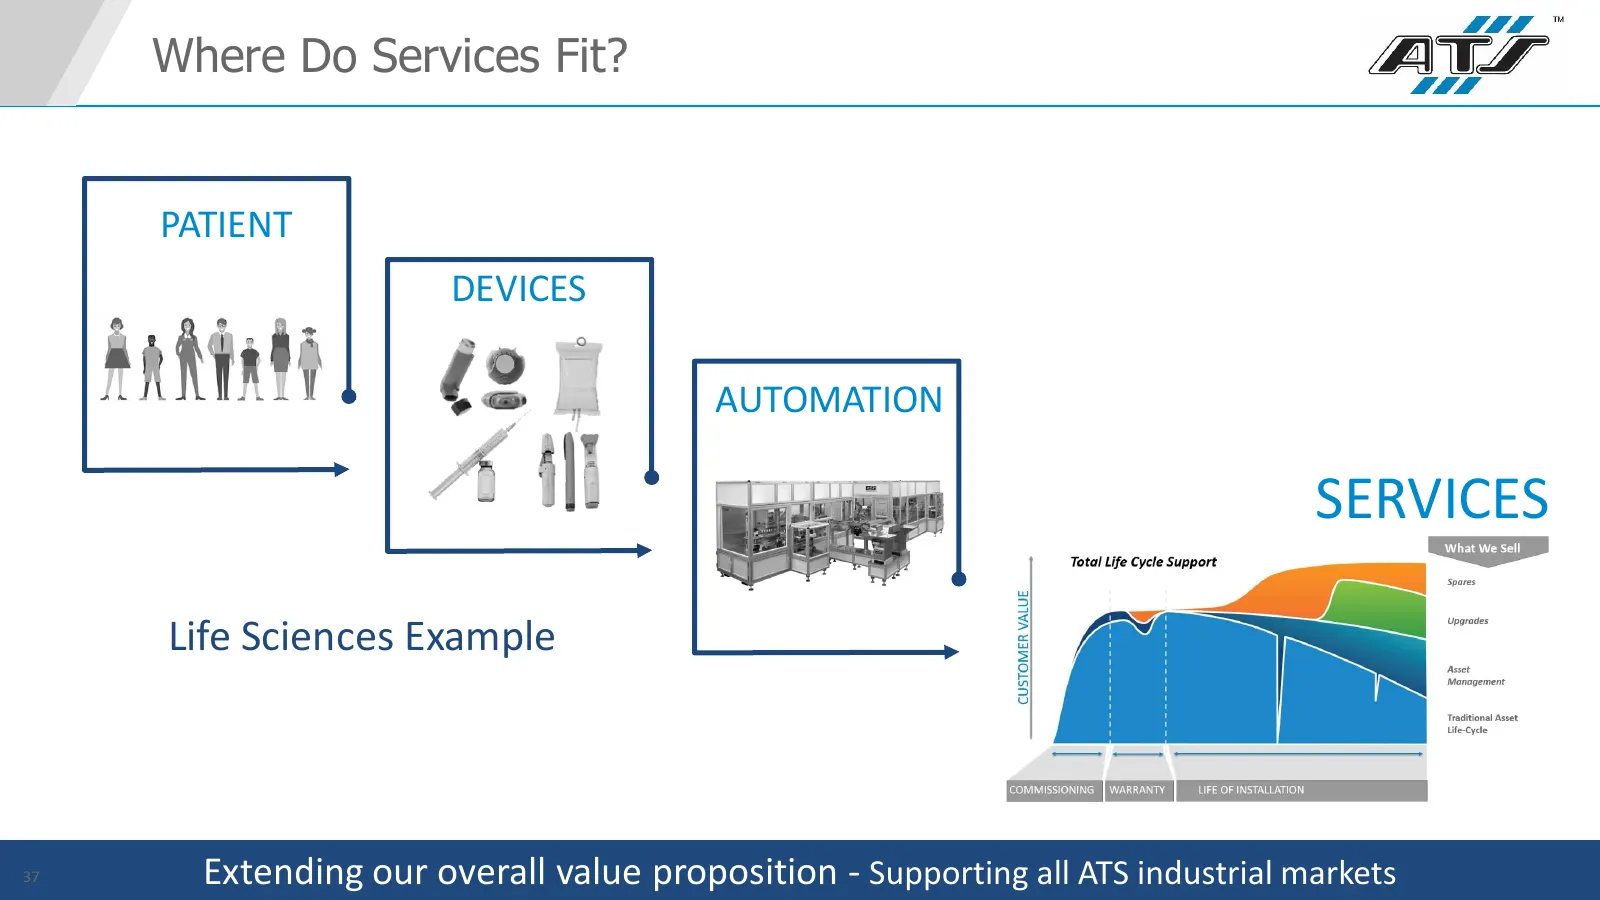
Slide 37: Where Do Services Fit?
Where Do Services Fit? PATIENT DEVICES AUTOMATION SERVICES Life Sciences Example 37 Extending our overall value proposition - Supporting all ATS industrial markets
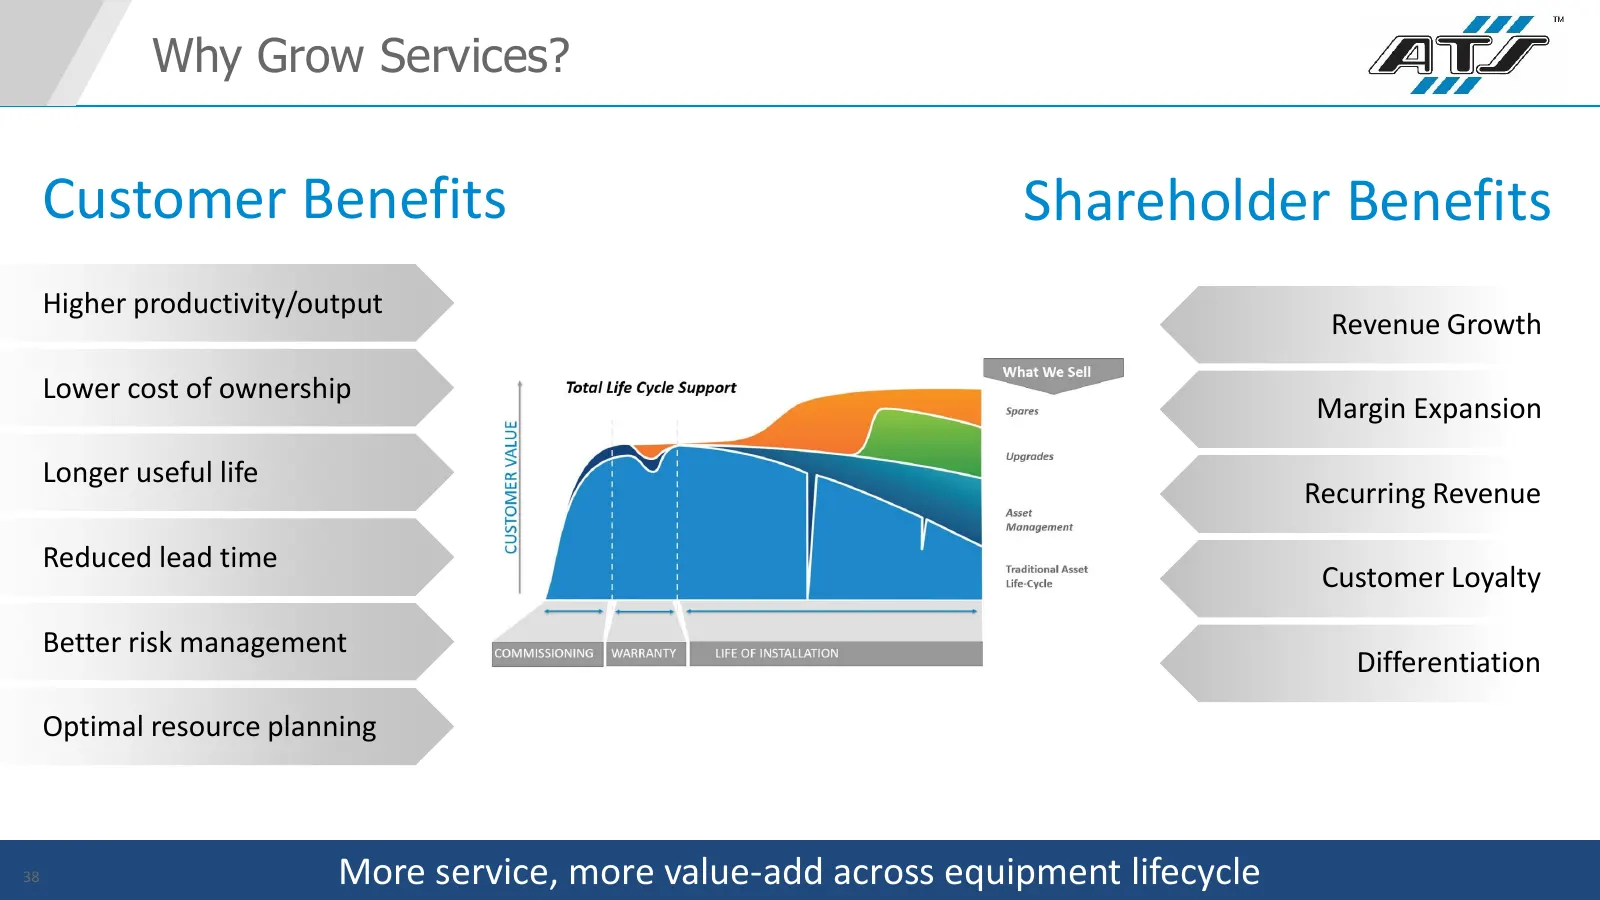
Slide 38: Why Grow Services?
Why Grow Services? Customer Benefits Shareholder Benefits Higher productivity/output Revenue Growth Lower cost of ownership Margin Expansion Longer useful life Recurring Revenue Reduced lead time Customer Loyalty Better risk management Differentiation Optimal resource planning 38 More service, more
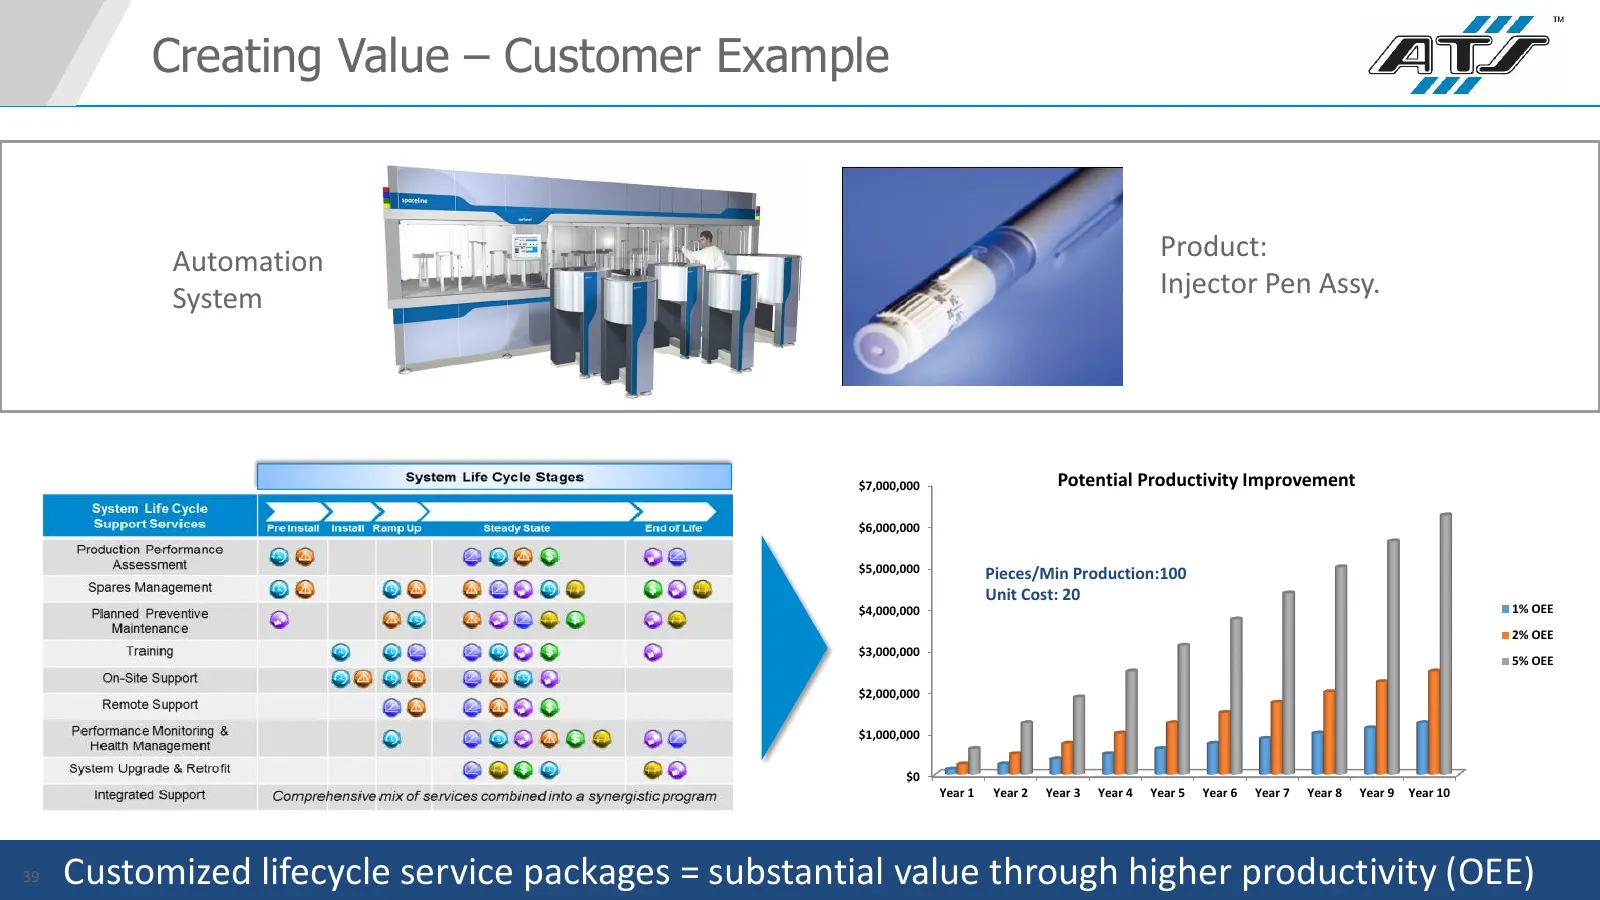
Slide 39: Creating Value – Customer Example
Creating Value – Customer Example Automation Product: System Injector Pen Assy. $7,000,000 Potential Productivity Improvement $6,000,000 $5,000,000 Pieces/Min Production:100 Unit Cost: 20 $4,000,000 1% OEE 2% OEE $3,000,000 5% OEE $2,000,000 $1,000,000 $0 Year 1 Year 2 Year 3 Year 4 Year 5 Year 6 Ye
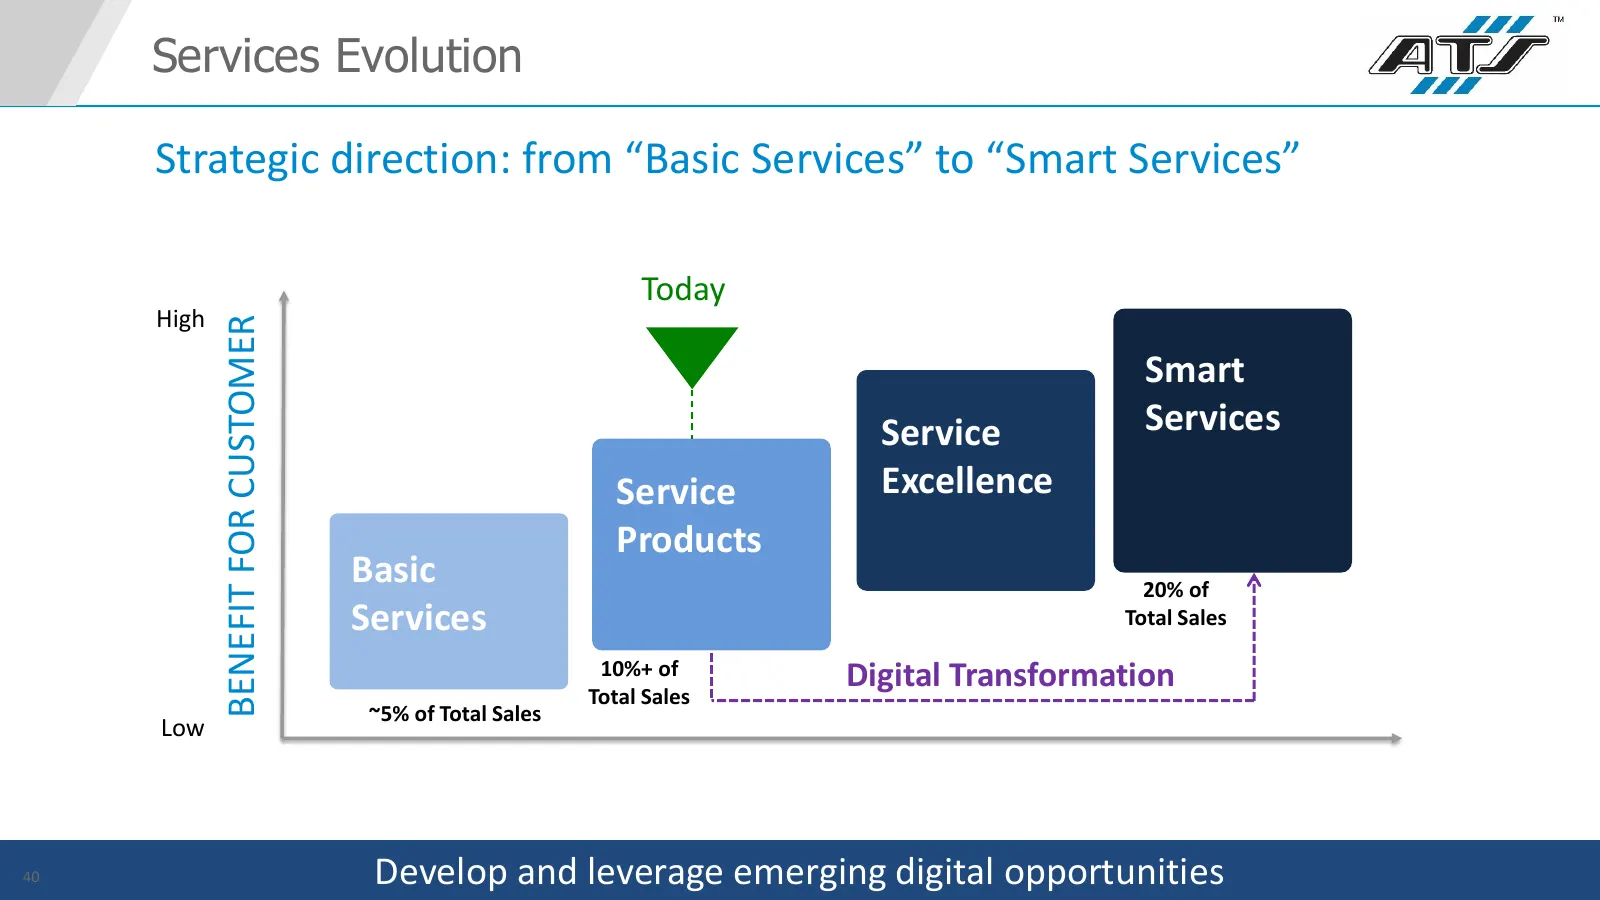
Slide 40: Services Evolution
Services Evolution Strategic direction: from “Basic Services” to “Smart Services” Today High BENEFIT FOR CUSTOMER Smart Service Services Service Excellence Products Basic 20% of Services Total Sales 10%+ of Digital Transformation Total Sales ~5% of Total Sales Low 40 Develop and leverage emerging di
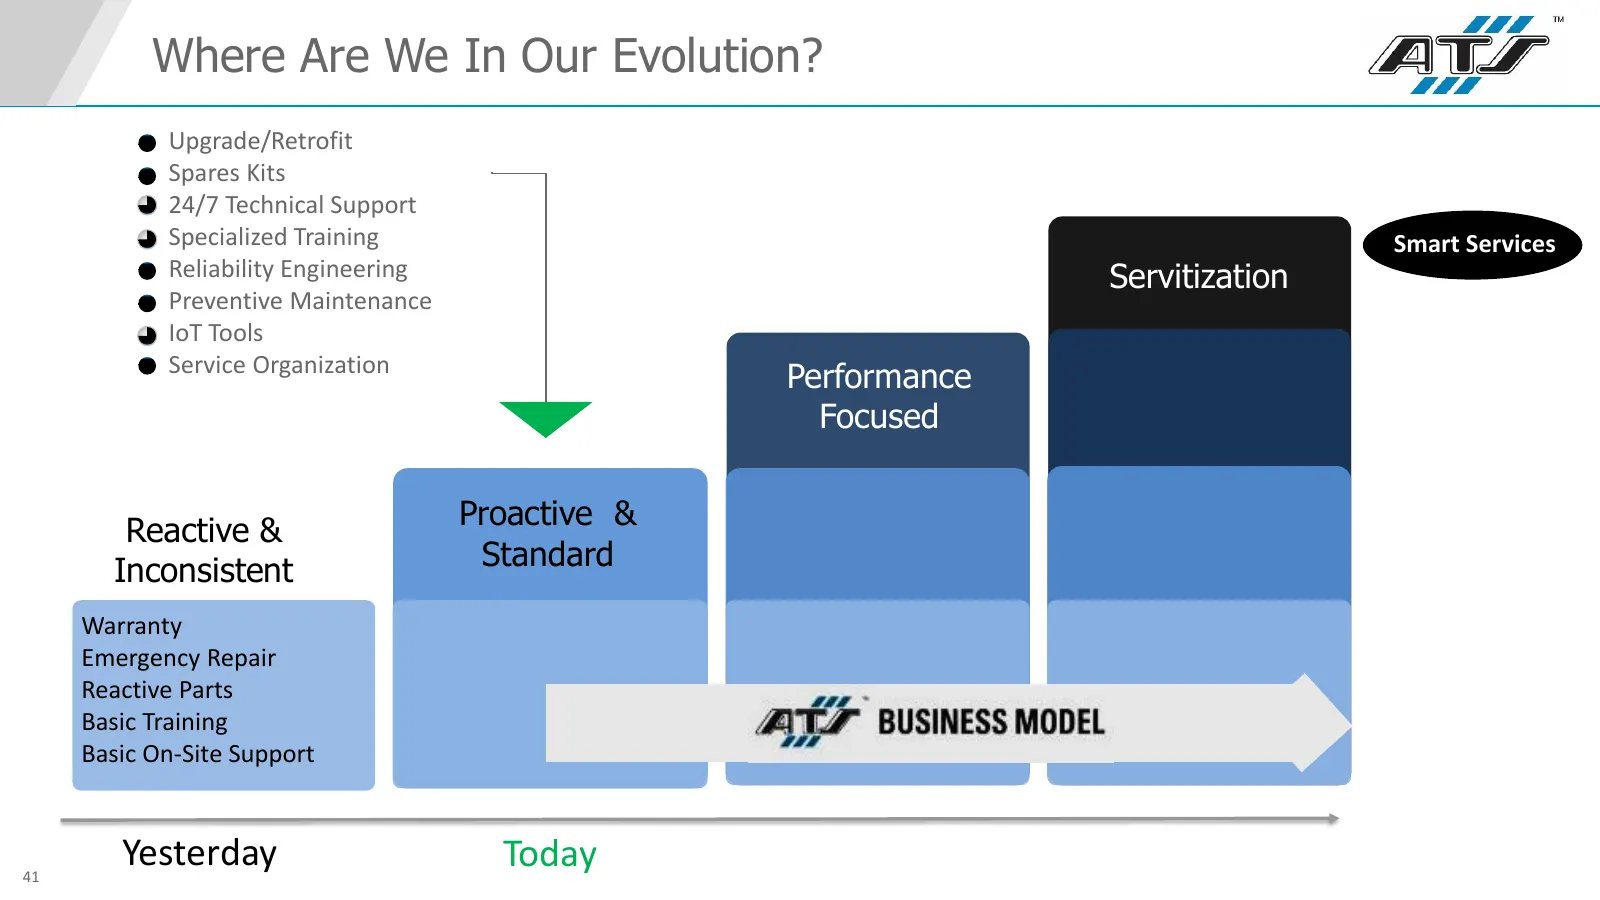
Slide 41: Where Are We In Our Evolution?
Where Are We In Our Evolution? Upgrade/Retrofit Spares Kits 24/7 Technical Support Specialized Training Smart Services Reliability Engineering Servitization Preventive Maintenance IoT Tools Service Organization Performance Focused Smart Proactive & Service Reactive & Services Standard Service Excell
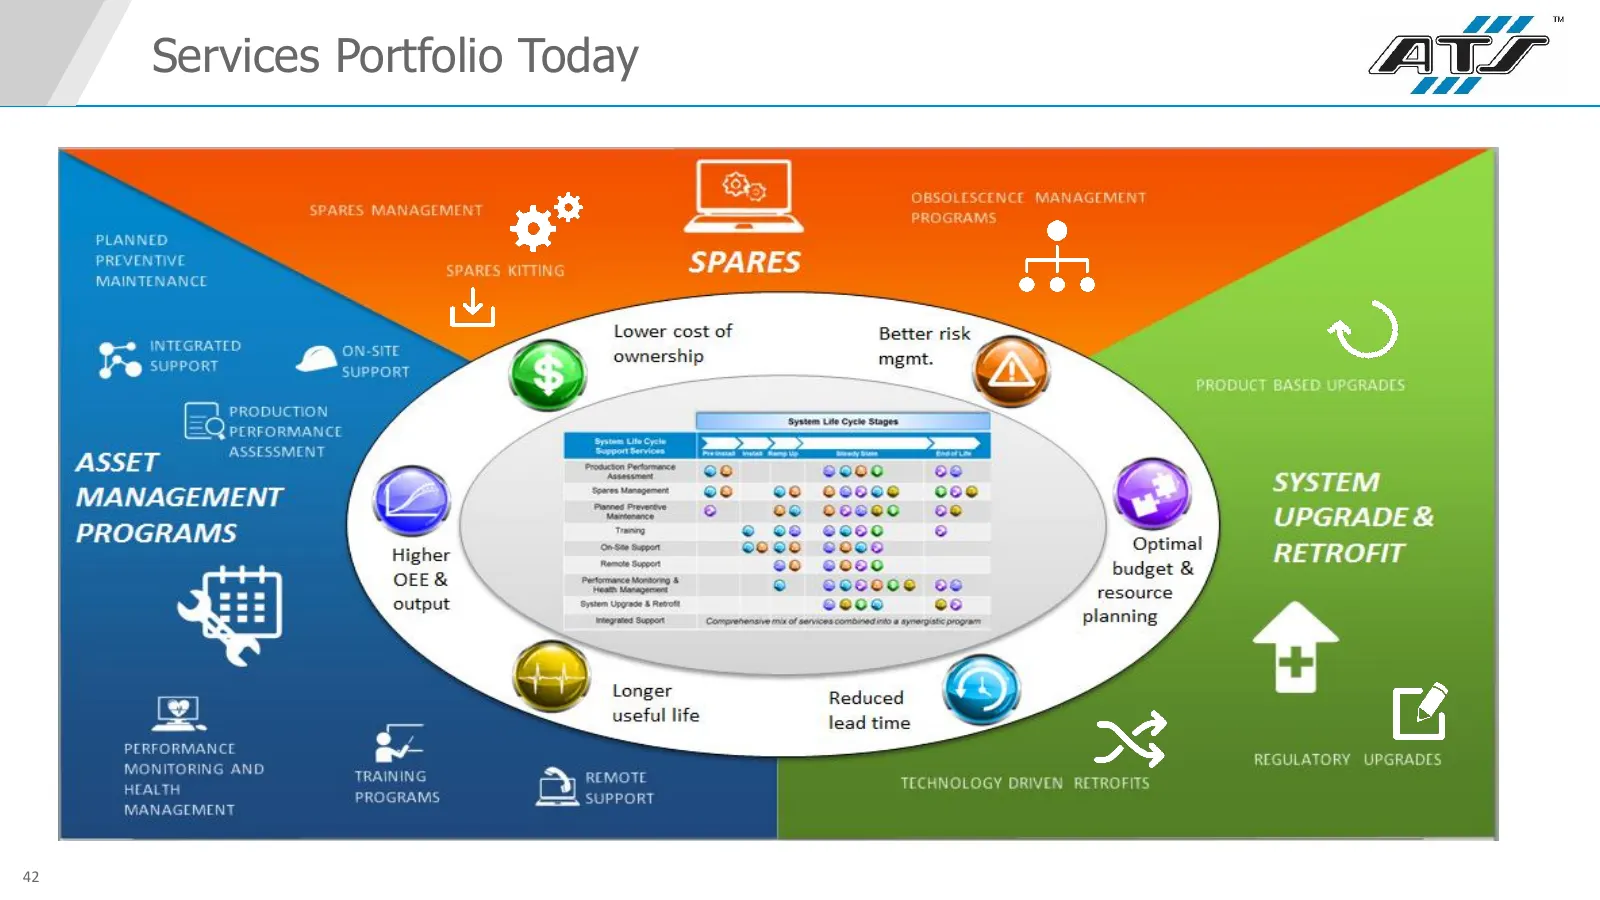
Slide 42: Services Portfolio Today
Services Portfolio Today ASSET MANAGEMENT PROGRAMS 42 Lower cost of ownership Better risk mgmt. PRODUCT BASED UPGRADES SYSTEM UPGRADE & Optimal bu pals RETROFIT resource planning useful life Reduced lead time REGULATORY UP! TECHNOLOGY DRIVEN
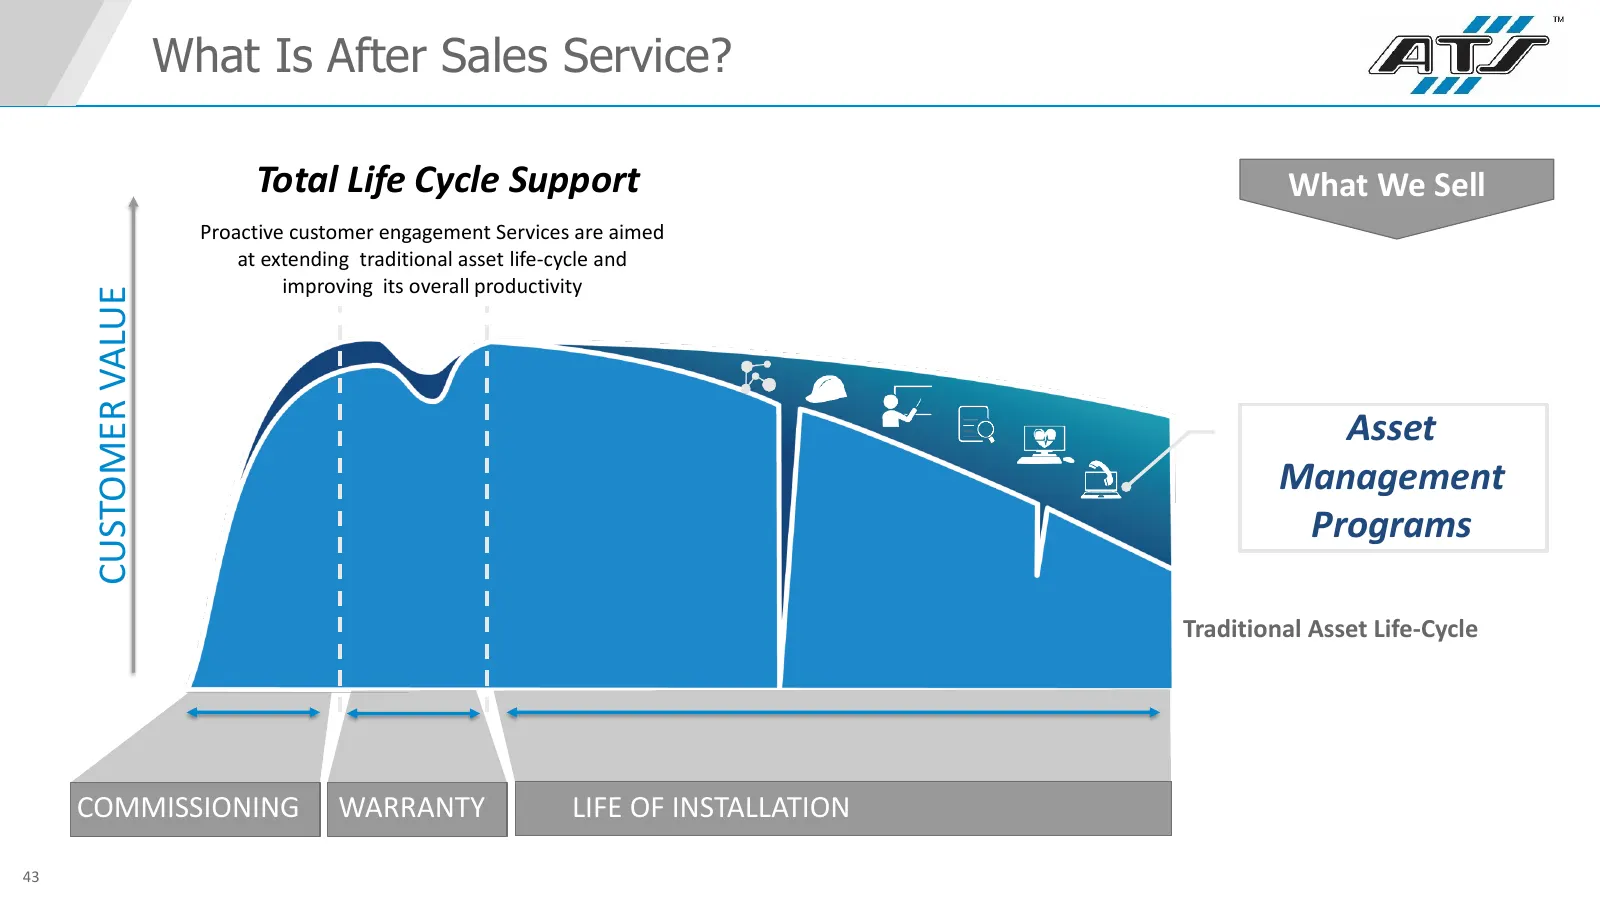
Slide 43: What Is After Sales Service?
What Is After Sales Service? Total Life Cycle Support What We Sell Proactive customer engagement Services are aimed at extending traditional asset life-cycle and improving its overall productivity CUSTOMER VALUE Asset Management Programs Traditional Asset Life-Cycle COMMISSIONING WARRANTY LIFE OF IN
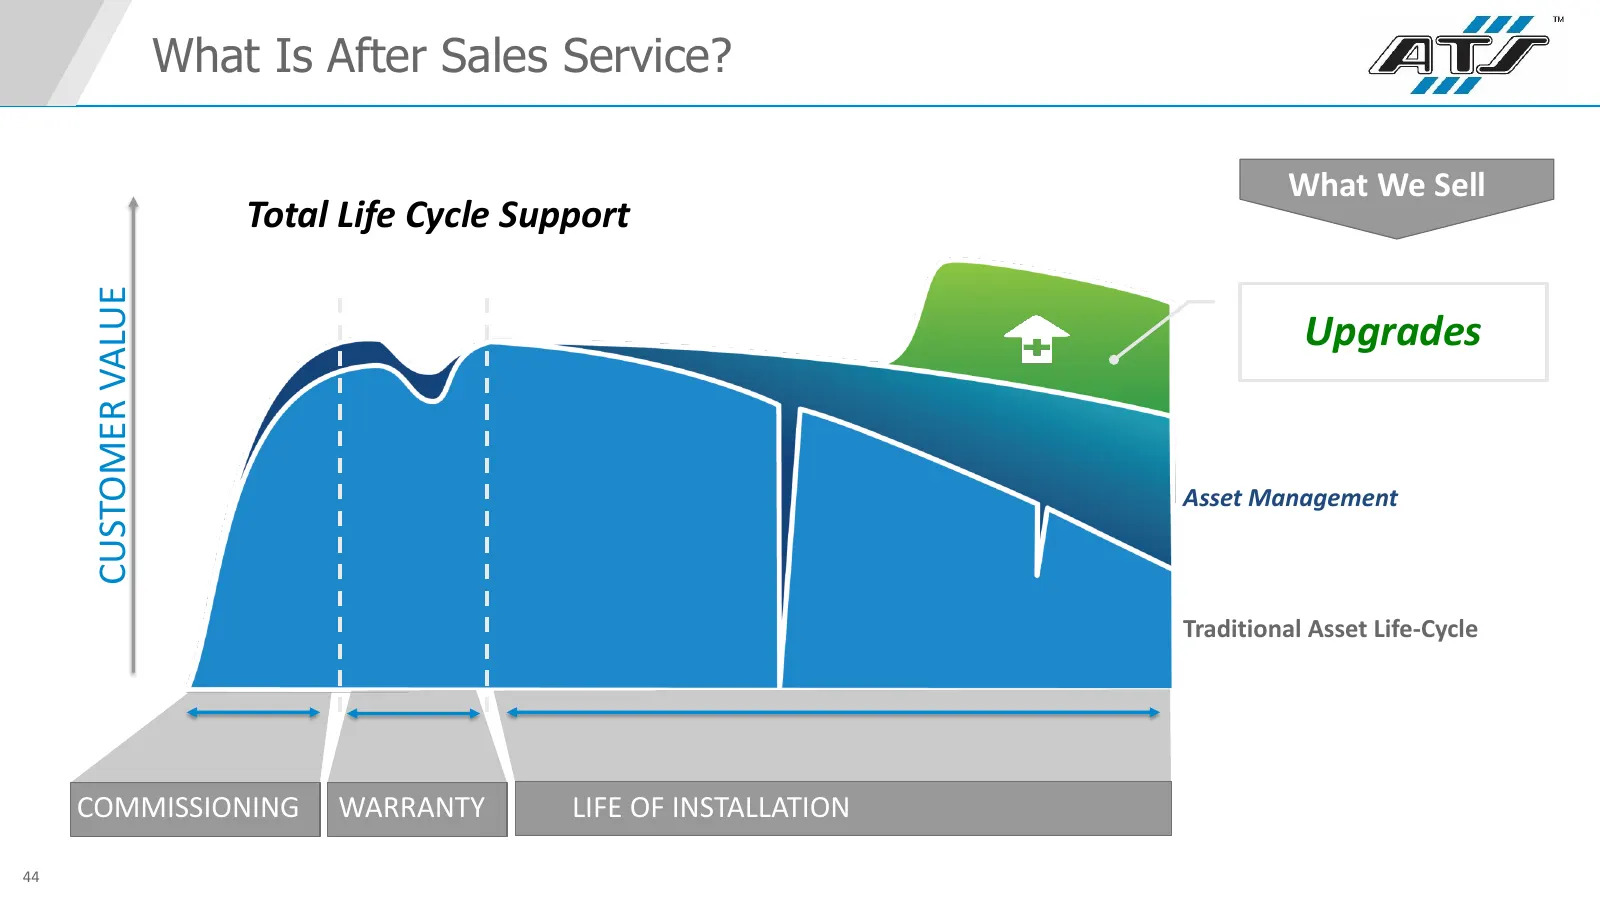
Slide 44: What Is After Sales Service? Upgrades
What Is After Sales Service? What We Sell Total Life Cycle Support CUSTOMER VALUE Upgrades Asset Management Traditional Asset Life-Cycle COMMISSIONING WARRANTY LIFE OF INSTALLATION 44
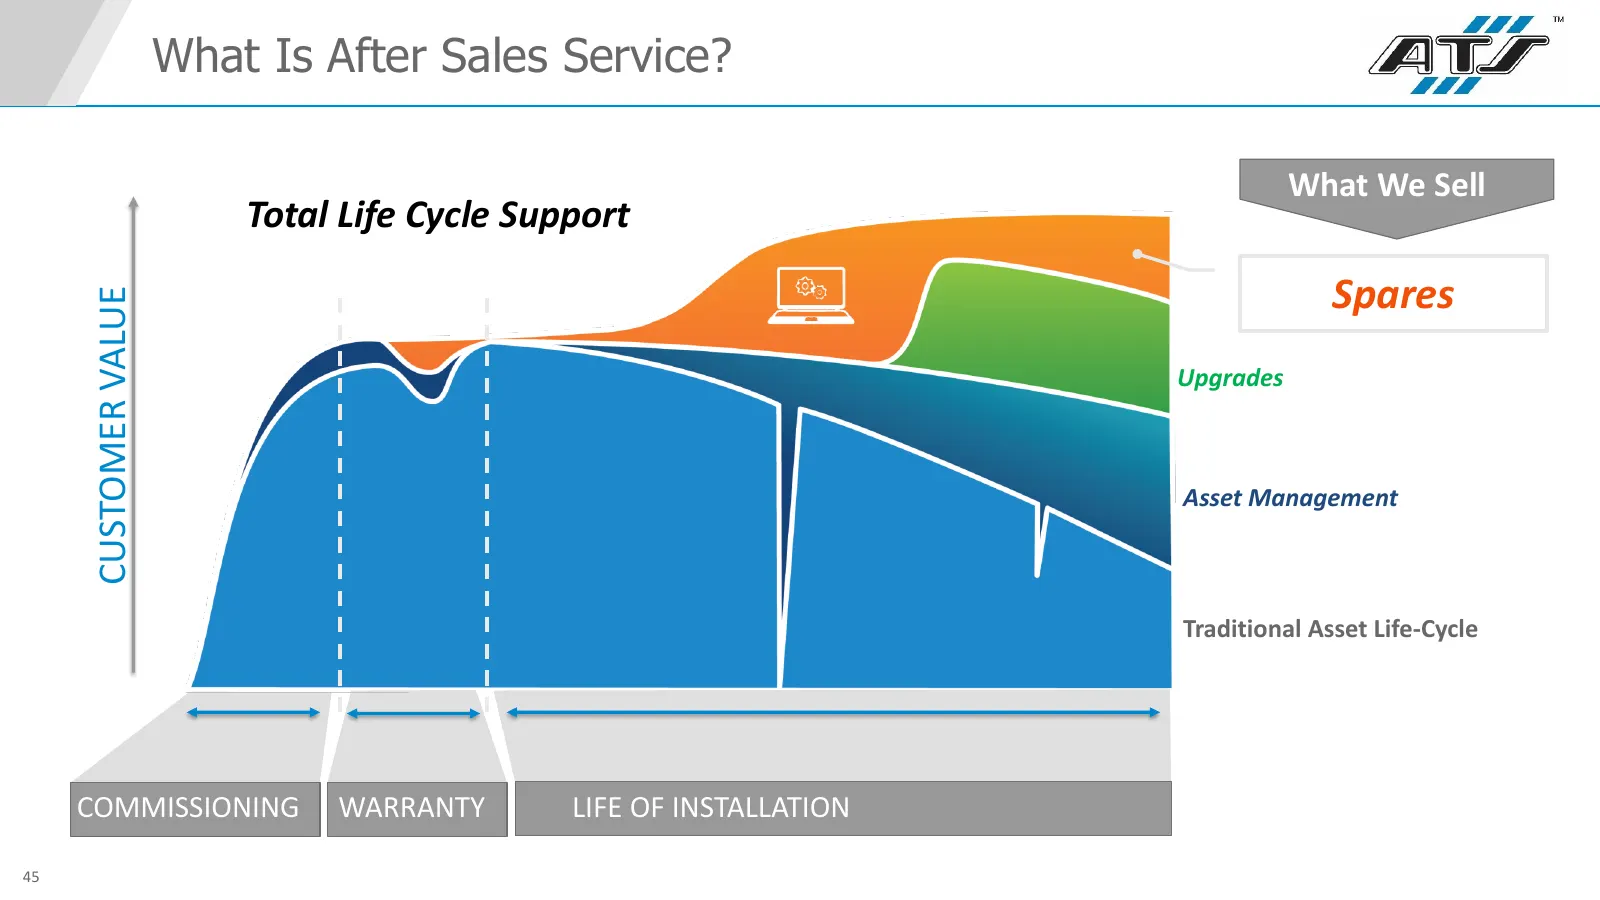
Slide 45: What Is After Sales Service? Spares
What Is After Sales Service? What We Sell Total Life Cycle Support Spares CUSTOMER VALUE Upgrades Asset Management Traditional Asset Life-Cycle COMMISSIONING WARRANTY LIFE OF INSTALLATION 45
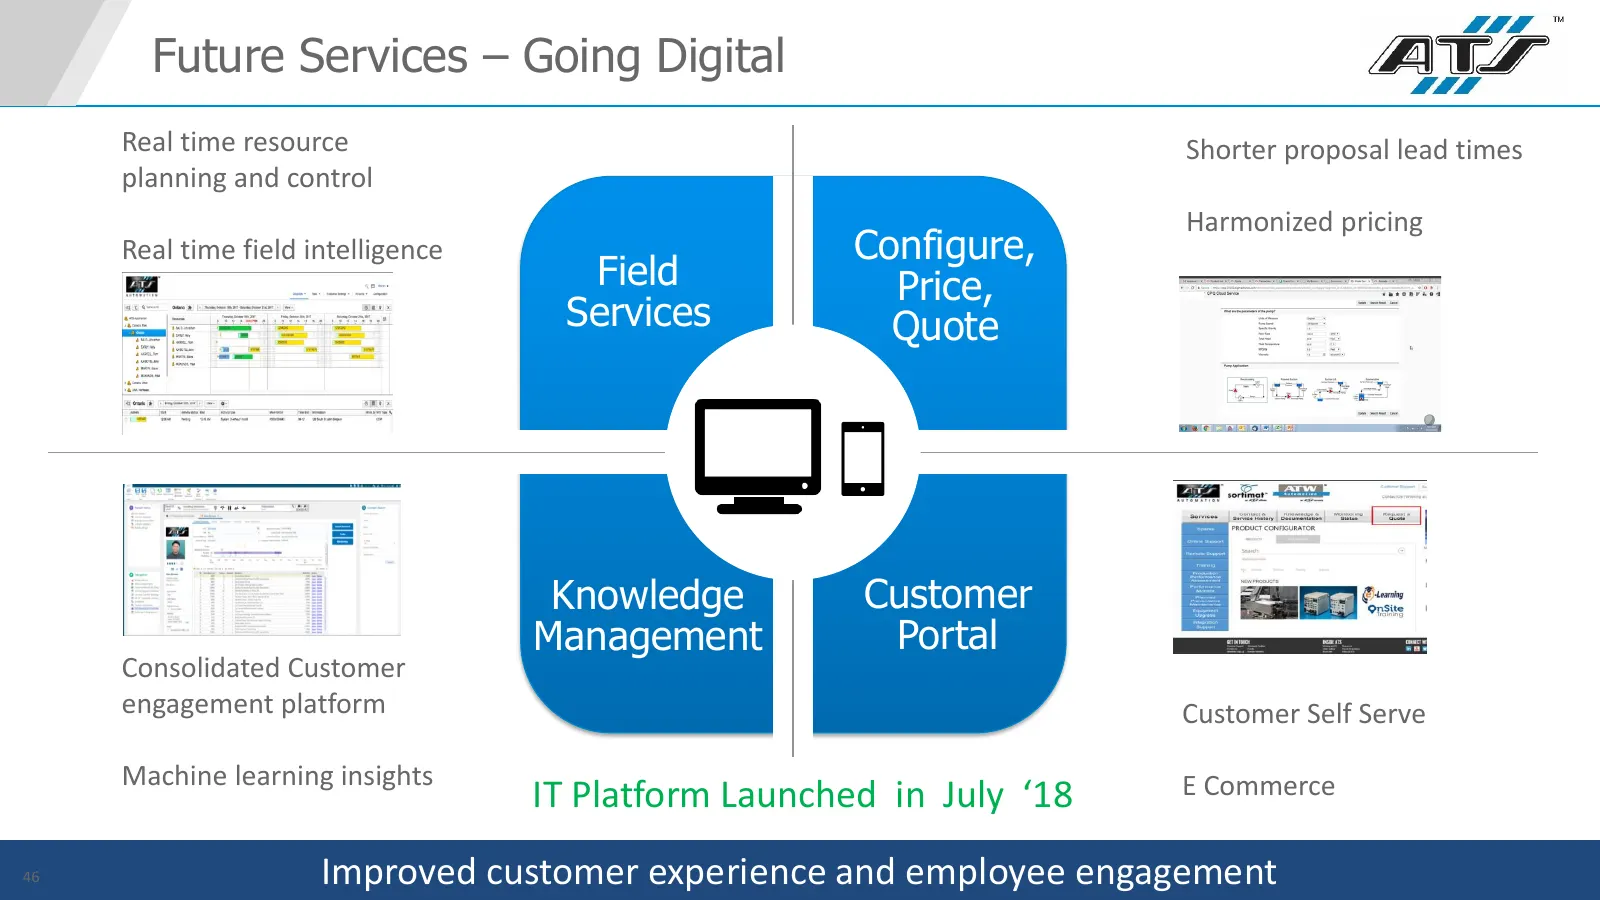
Slide 46: Future Services – Going Digital
Future Services – Going Digital Real time resource Shorter proposal lead times planning and control Harmonized pricing Real time field intelligence Configure, Field Price, Services Quote Knowledge Customer Management Portal Consolidated Customer engagement platform Customer Self Serve Machine learni
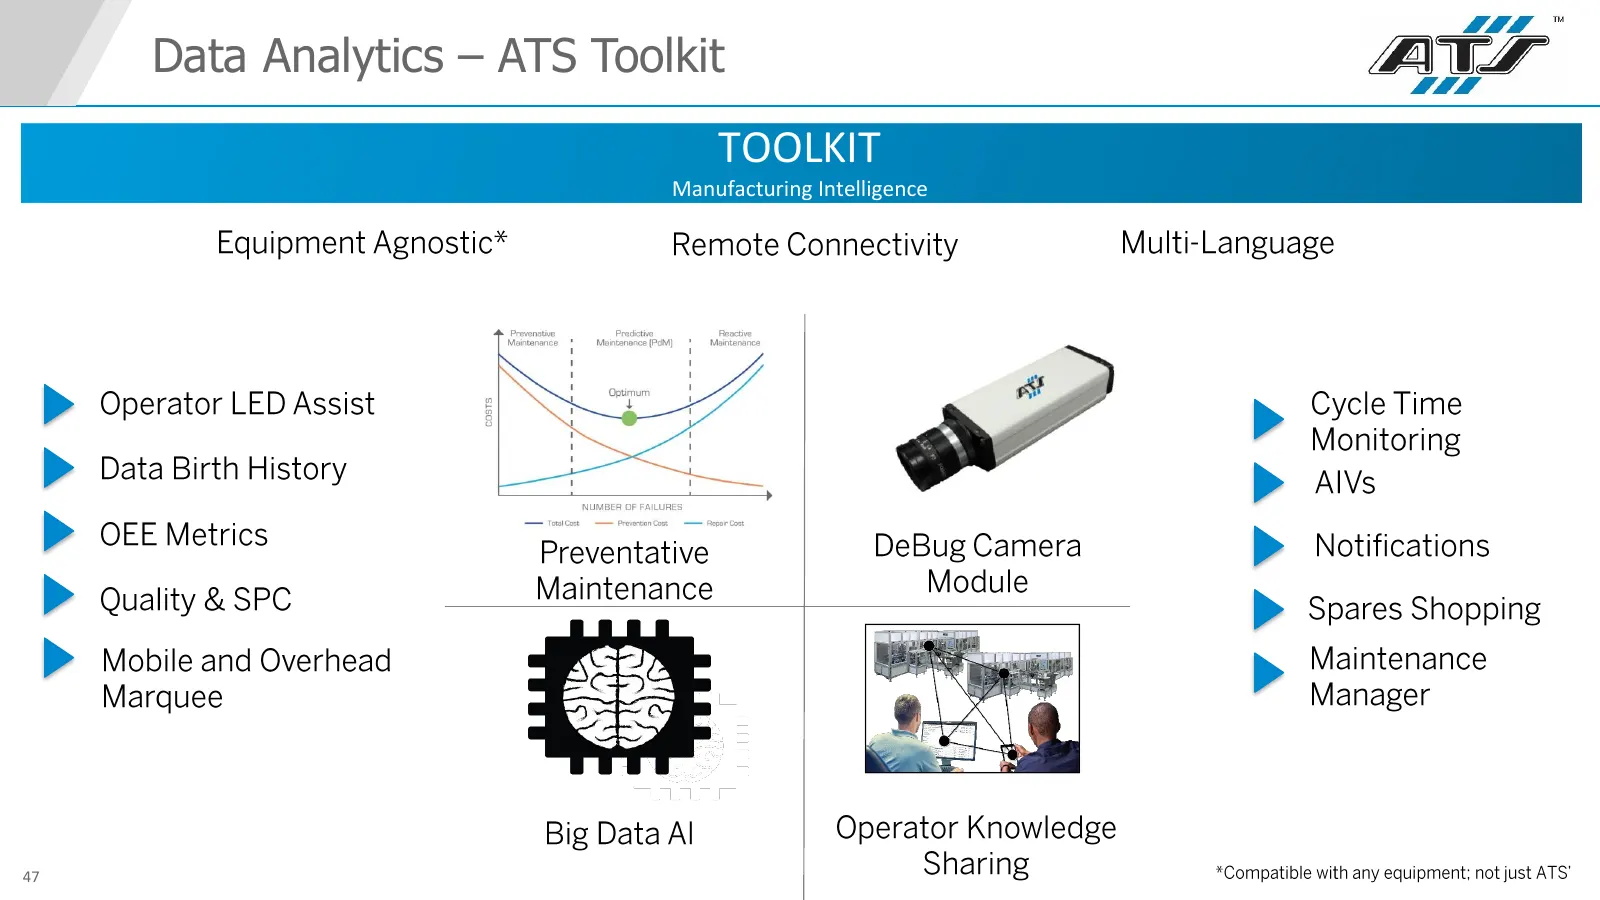
Slide 47: Data Analytics – ATS Toolkit
Data Analytics – ATS Toolkit TOOLKIT Manufacturing Intelligence 47
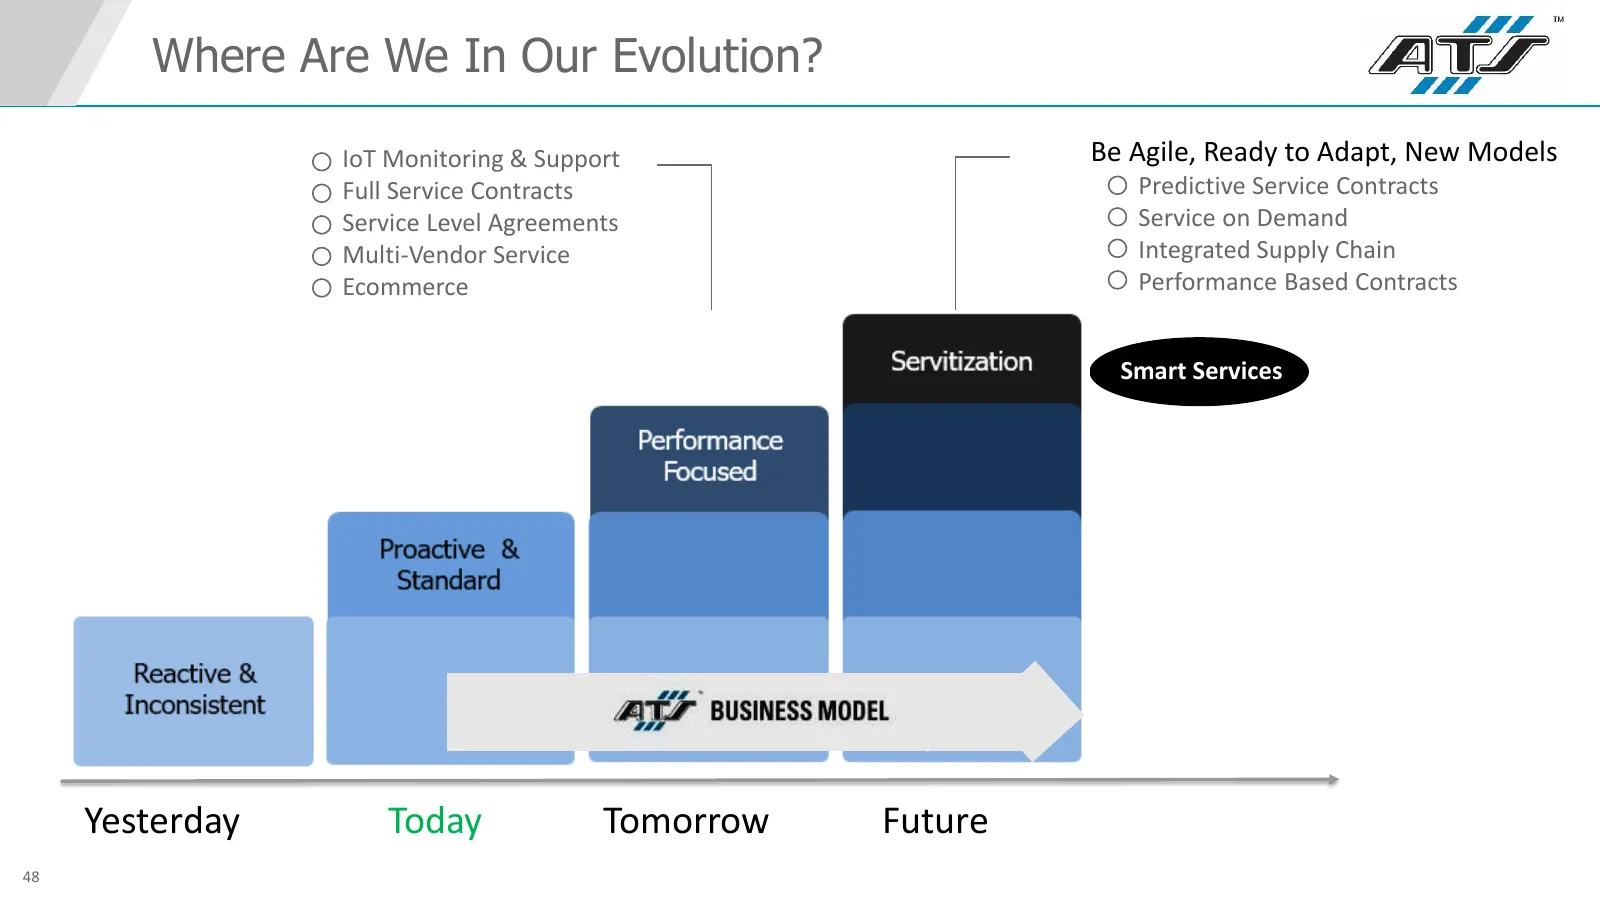
Slide 48: Where Are We In Our Evolution?
Where Are We In Our Evolution? IoT Monitoring & Support Be Agile, Ready to Adapt, New Models Full Service Contracts Predictive Service Contracts Service Level Agreements Service on Demand Multi-Vendor Service Integrated Supply Chain Ecommerce Performance Based Contracts Smart Services Yesterday Toda
Slide 49: Go To Market Approach
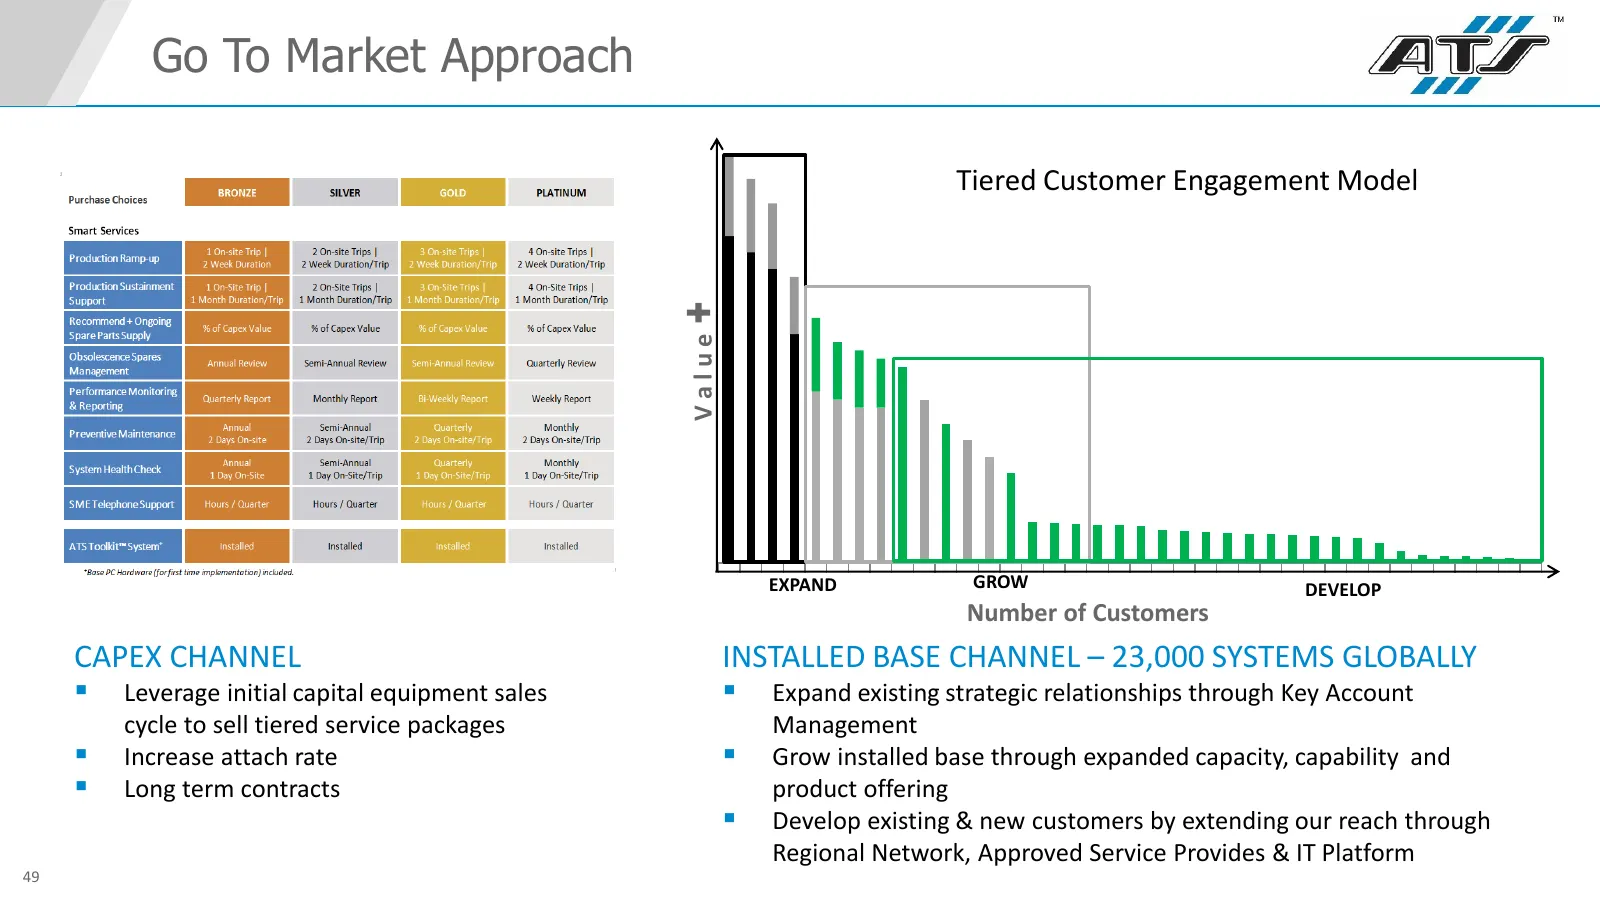
Go To Market Approach Tiered Customer Engagement Model Value EXPAND GROW DEVELOP Number of Customers CAPEX CHANNEL INSTALLED BASE CHANNEL – 23,000 SYSTEMS GLOBALLY Leverage initial capital equipment sales Expand existing strategic relationships through Key Account cycle to sell tiered service pa
Slide 50: Delivery Infrastructure
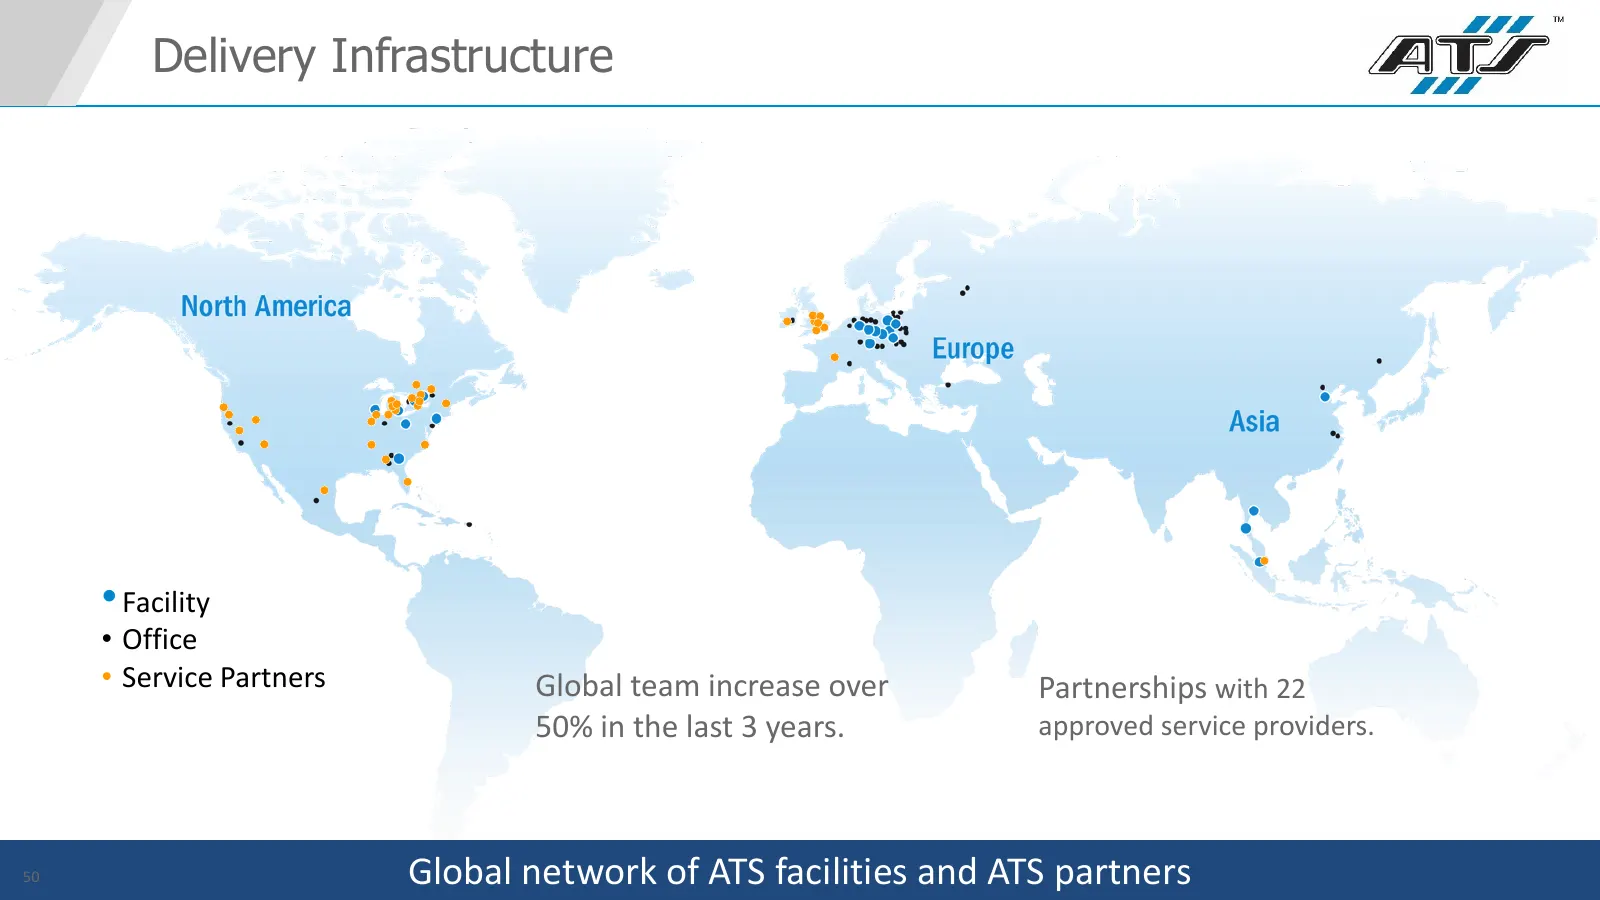
Delivery Infrastructure • Facility • Office • Service Partners Global team increase over Partnerships with 22 50% in the last 3 years. approved service providers. 50 Global network of ATS facilities and ATS partners
Slide 51: Why Grow Services?
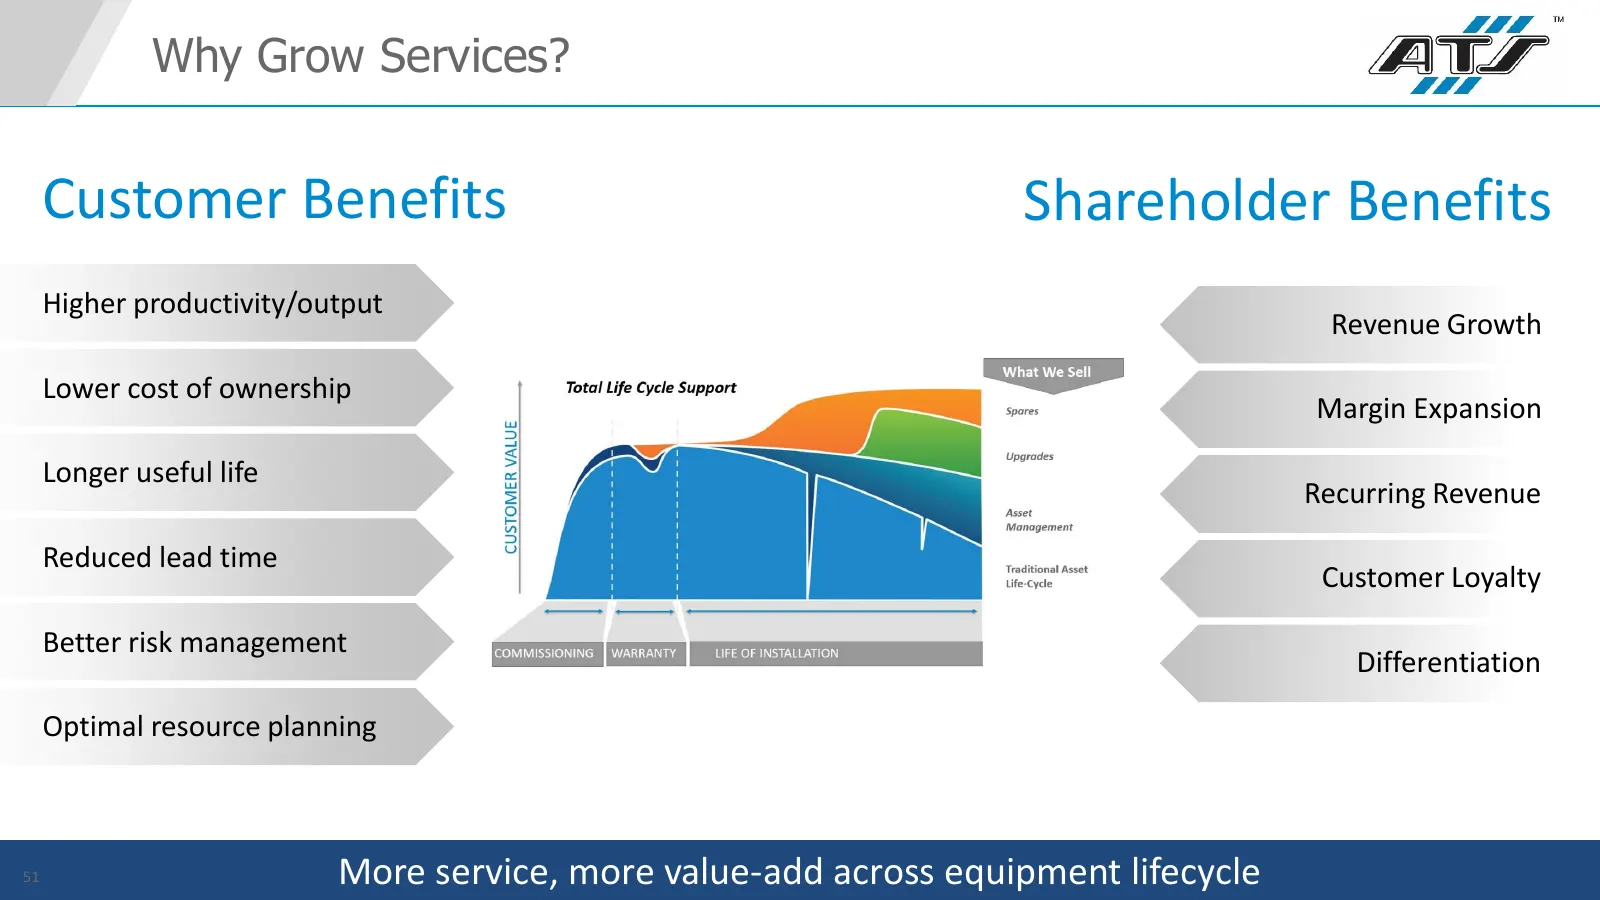
Why Grow Services? Customer Benefits Shareholder Benefits Higher productivity/output Revenue Growth Lower cost of ownership Margin Expansion Longer useful life Recurring Revenue Reduced lead time Customer Loyalty Better risk management Differentiation Optimal resource planning 51 More service, more
Slide 52: Jeremy Patten – ATS Business Model
JEREMY PATTEN ATS Business Model (ABM) Overview & Introduction
Slide 53: ABM Organizational Support
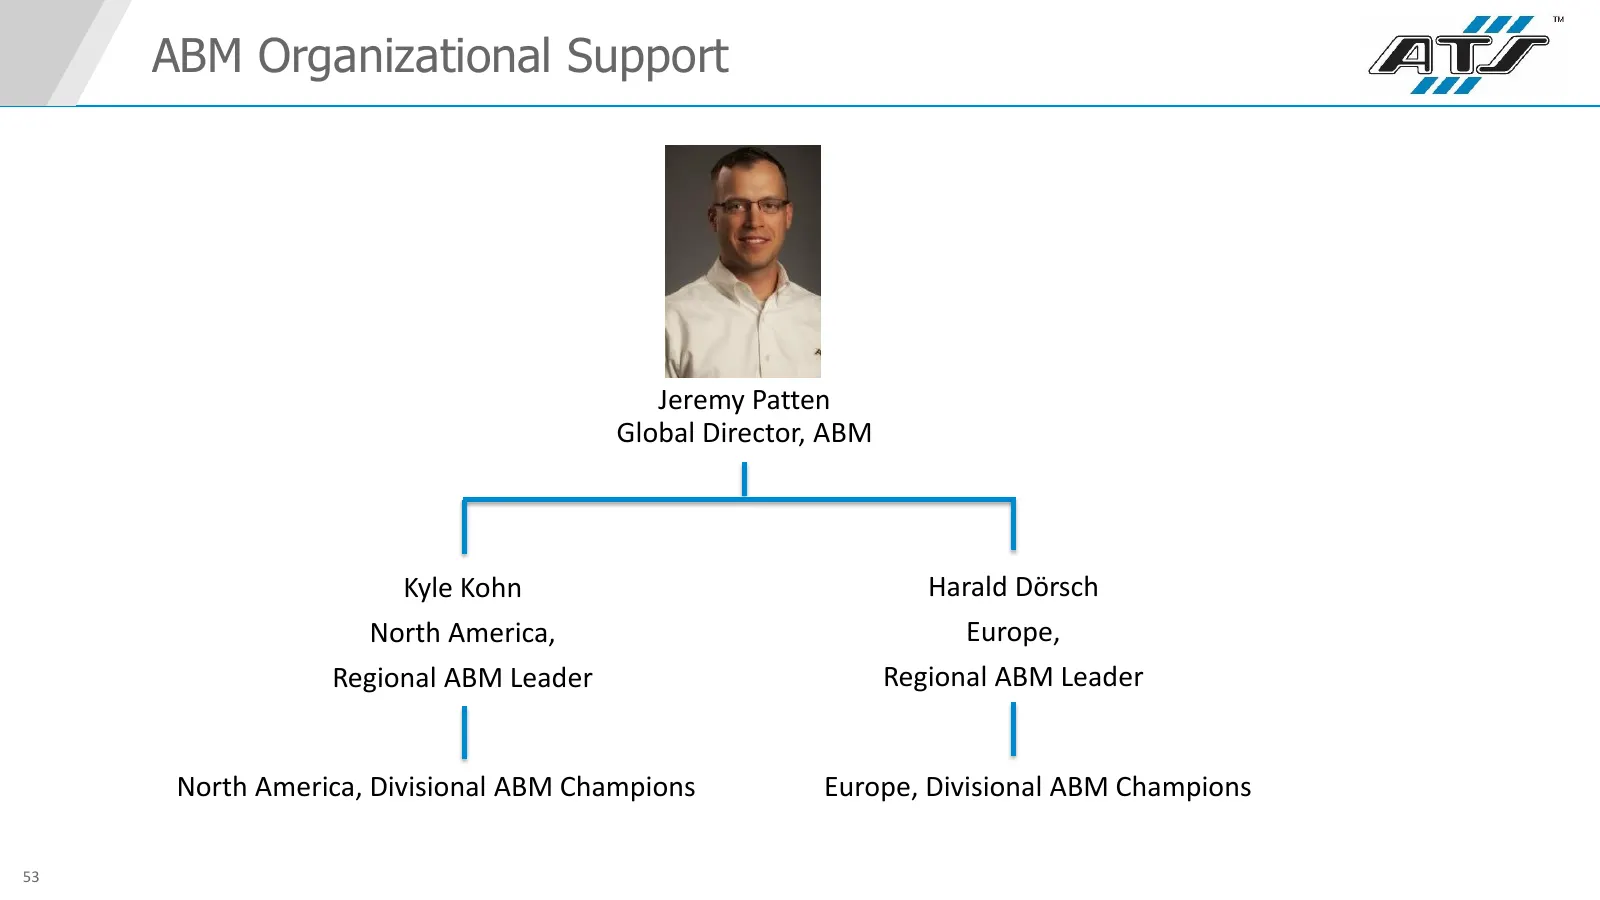
ABM Organizational Support Jeremy Patten Global Director, ABM Kyle Kohn Harald Dörsch North America, Europe, Regional ABM Leader Regional ABM Leader North America, Divisional ABM Champions Europe, Divisional ABM Champions 53
Slide 54: The ATS Business Model (ABM)
The ATS Business Model (ABM) 54
Slide 55: ABM Phased Approach
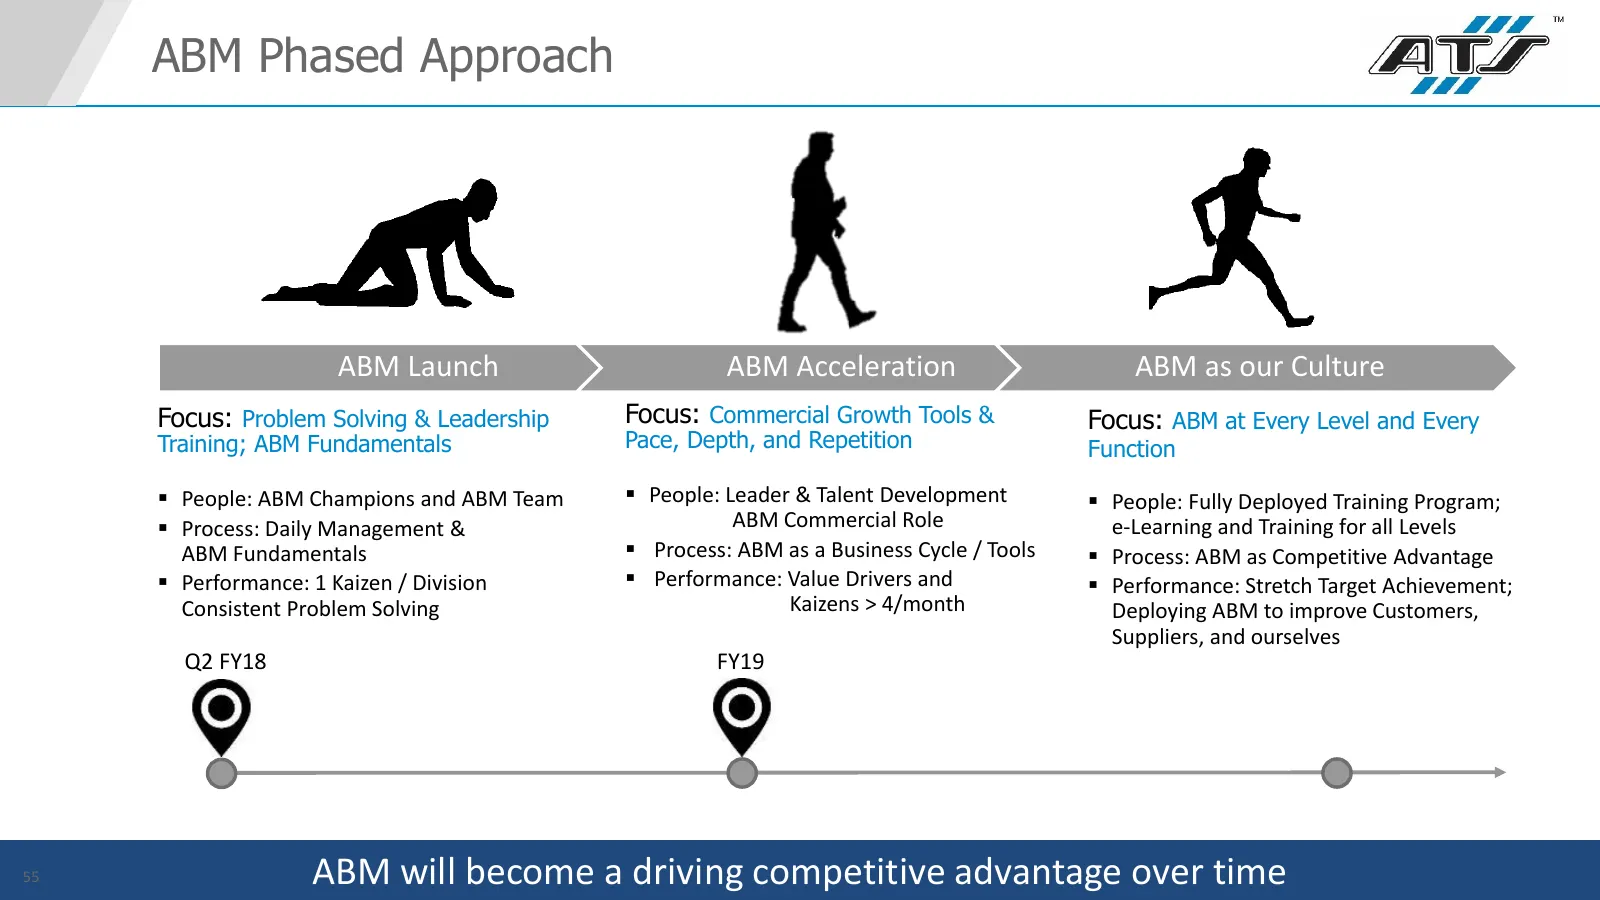
ABM Phased Approach ABM Launch ABM Acceleration ABM as our Culture Focus: Problem Solving & Leadership Focus: Commercial Growth Tools & Focus: ABM at Every Level and Every Training; ABM Fundamentals Pace, Depth, and Repetition Function People: ABM Champions and ABM Team People: Leader & Talent D
Slide 56: ATS Business Model – The Fundamentals
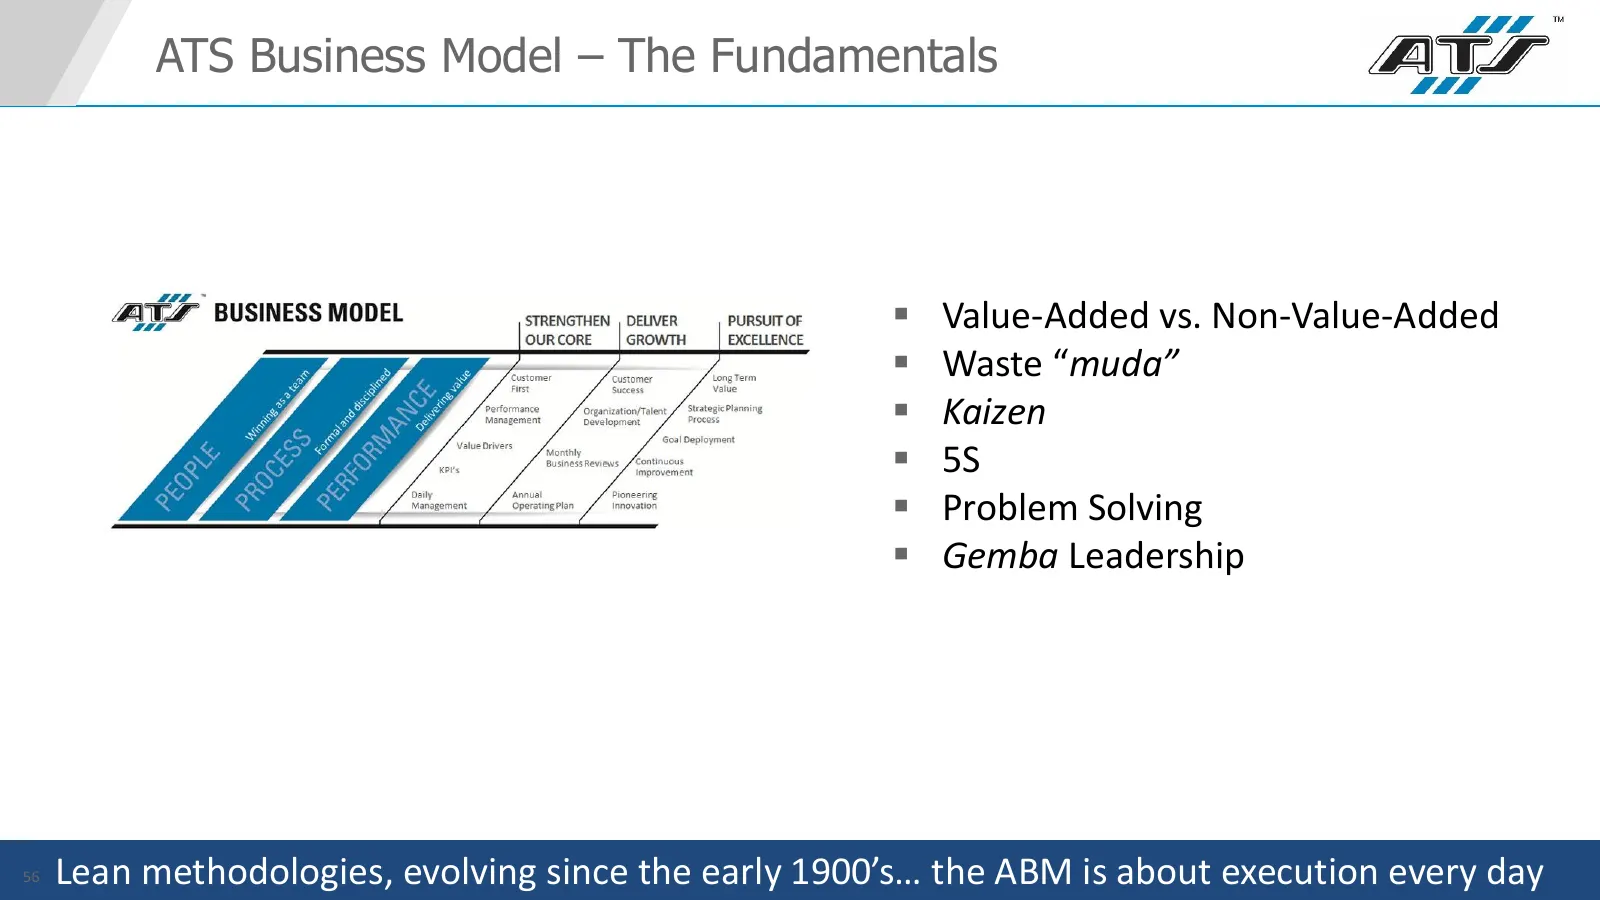
ATS Business Model – The Fundamentals Value-Added vs. Non-Value-Added Waste “muda” Kaizen 5S Problem Solving Gemba Leadership 56 Lean methodologies, evolving since the early 1900’s… the ABM is about execution every day
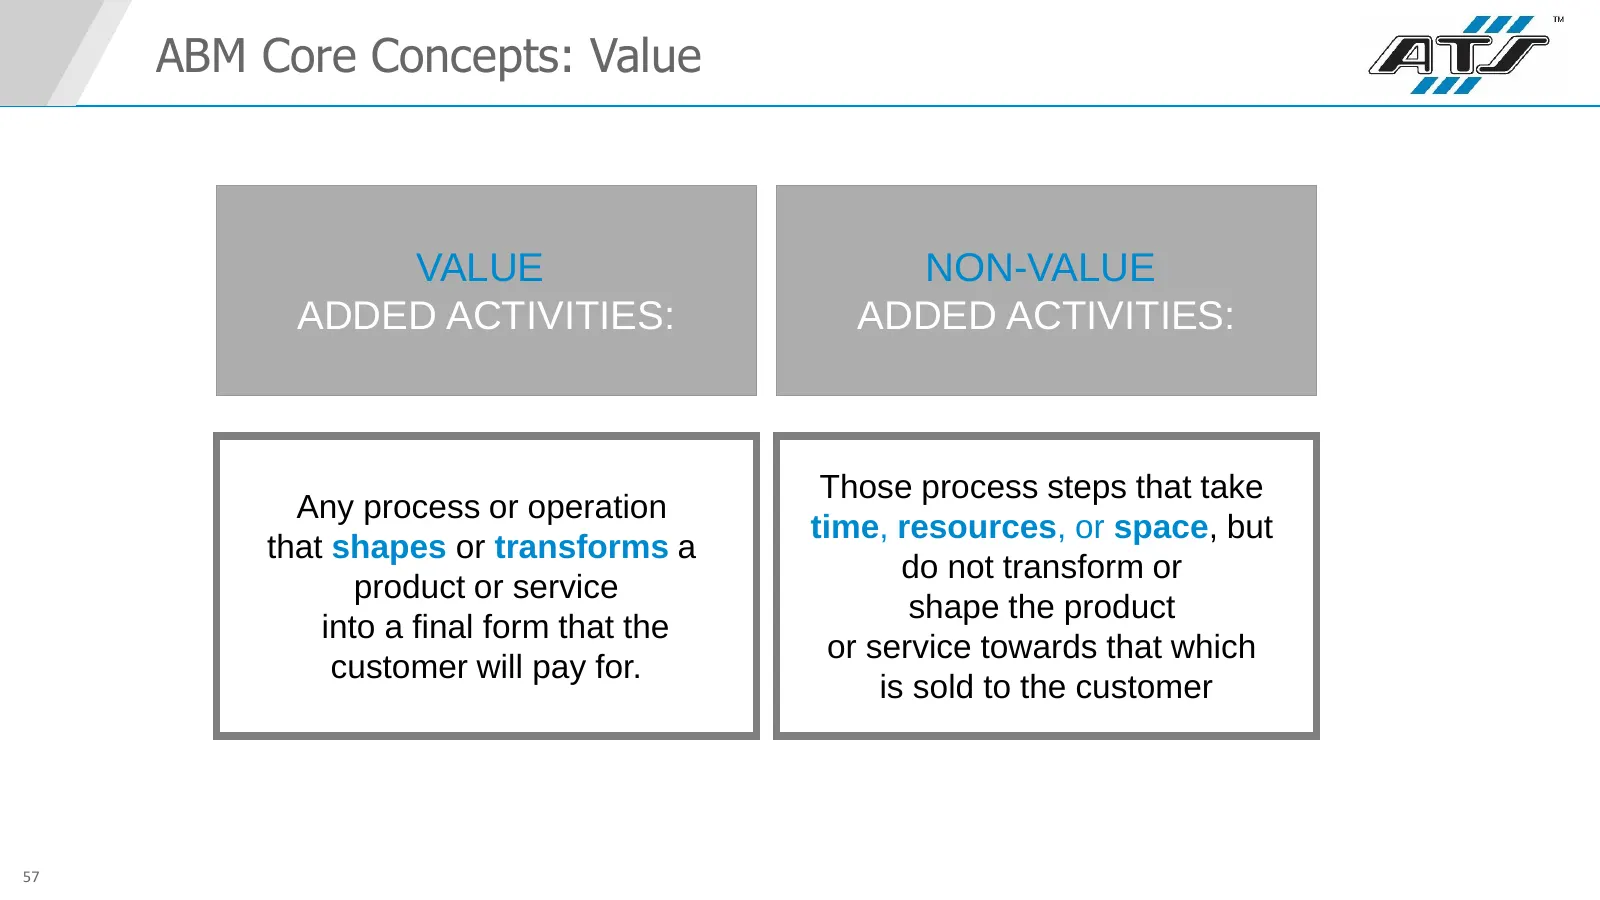
Slide 57: ABM Core Concepts: Value
ABM Core Concepts: Value VALUE NON-VALUE ADDED ACTIVITIES: ADDED ACTIVITIES: Those process steps that take Any process or operation time, resources, or space, but that shapes or transforms a do not transform or product or service shape the product into a final form that the or service towards that w
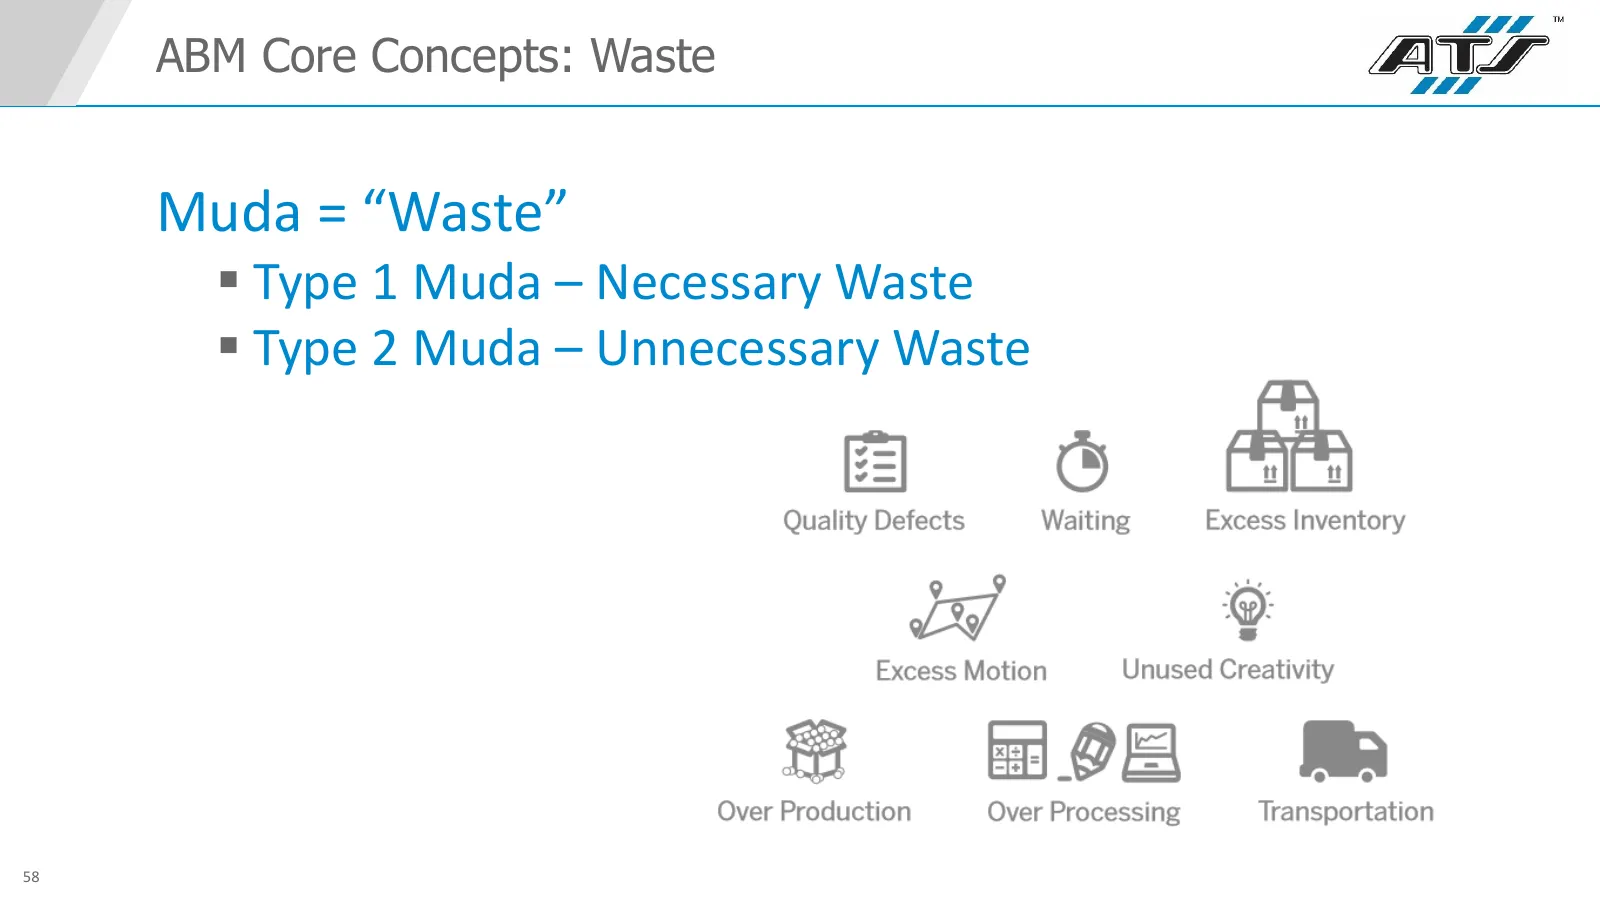
Slide 58: ABM Core Concepts: Waste
ABM Core Concepts: Waste Muda = “Waste” Type 1 Muda – Necessary Waste Type 2 Muda – Unnecessary Waste 58
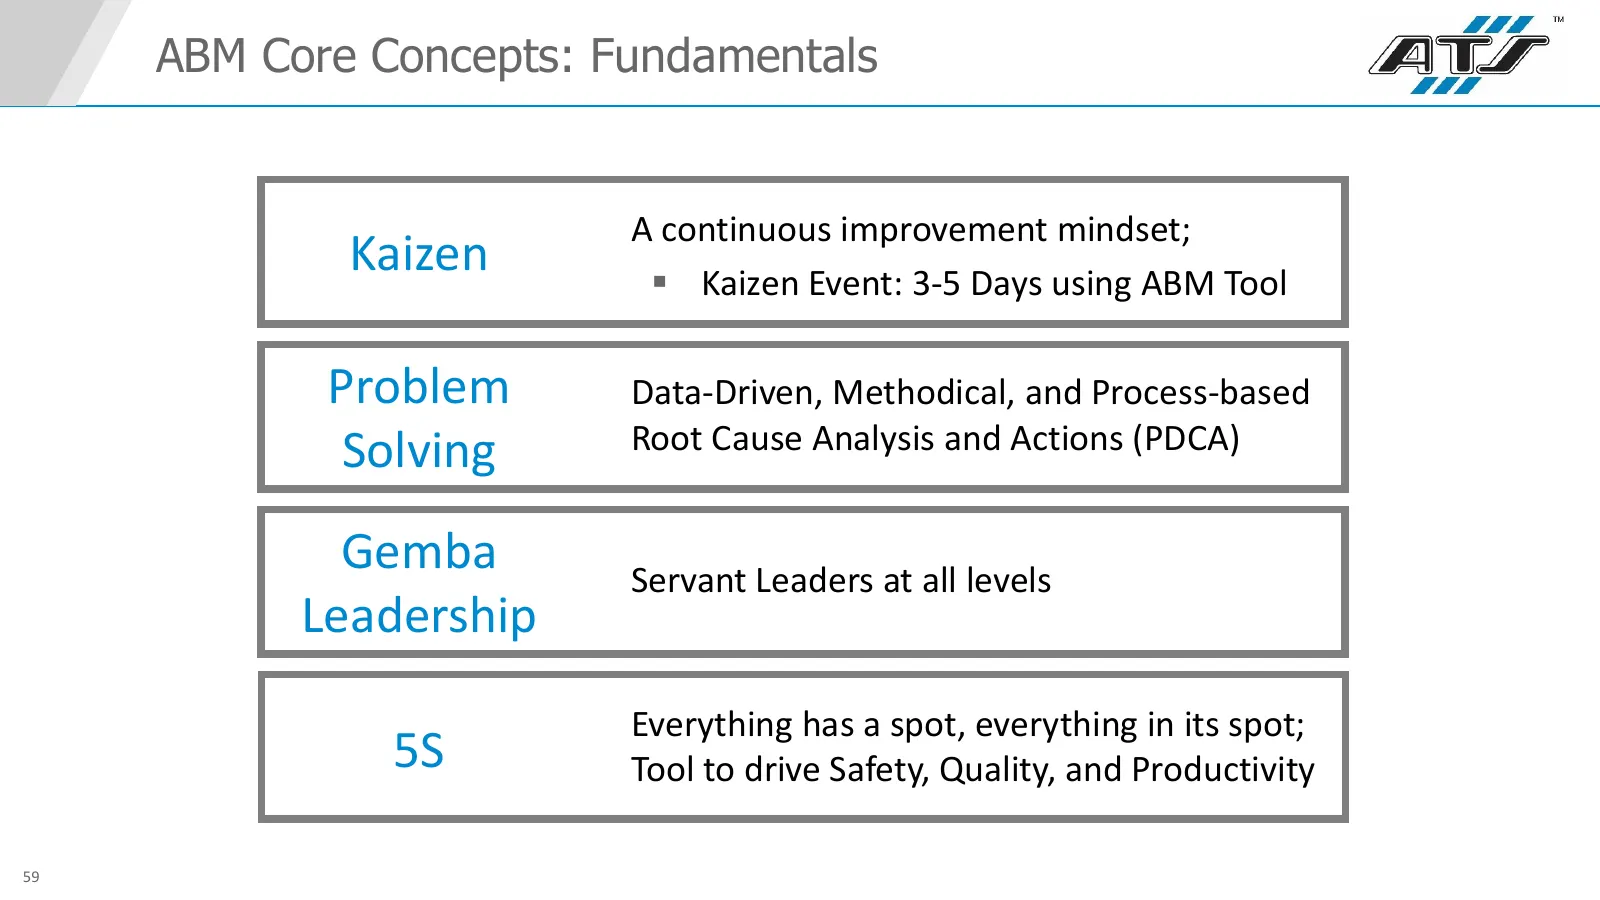
Slide 59: ABM Core Concepts: Fundamentals
ABM Core Concepts: Fundamentals A continuous improvement mindset; Kaizen Kaizen Event: 3-5 Days using ABM Tool Problem Data-Driven, Methodical, and Process-based Solving Root Cause Analysis and Actions (PDCA) Gemba Servant Leaders at all levels Leadership Everything has a spot, everything in its s
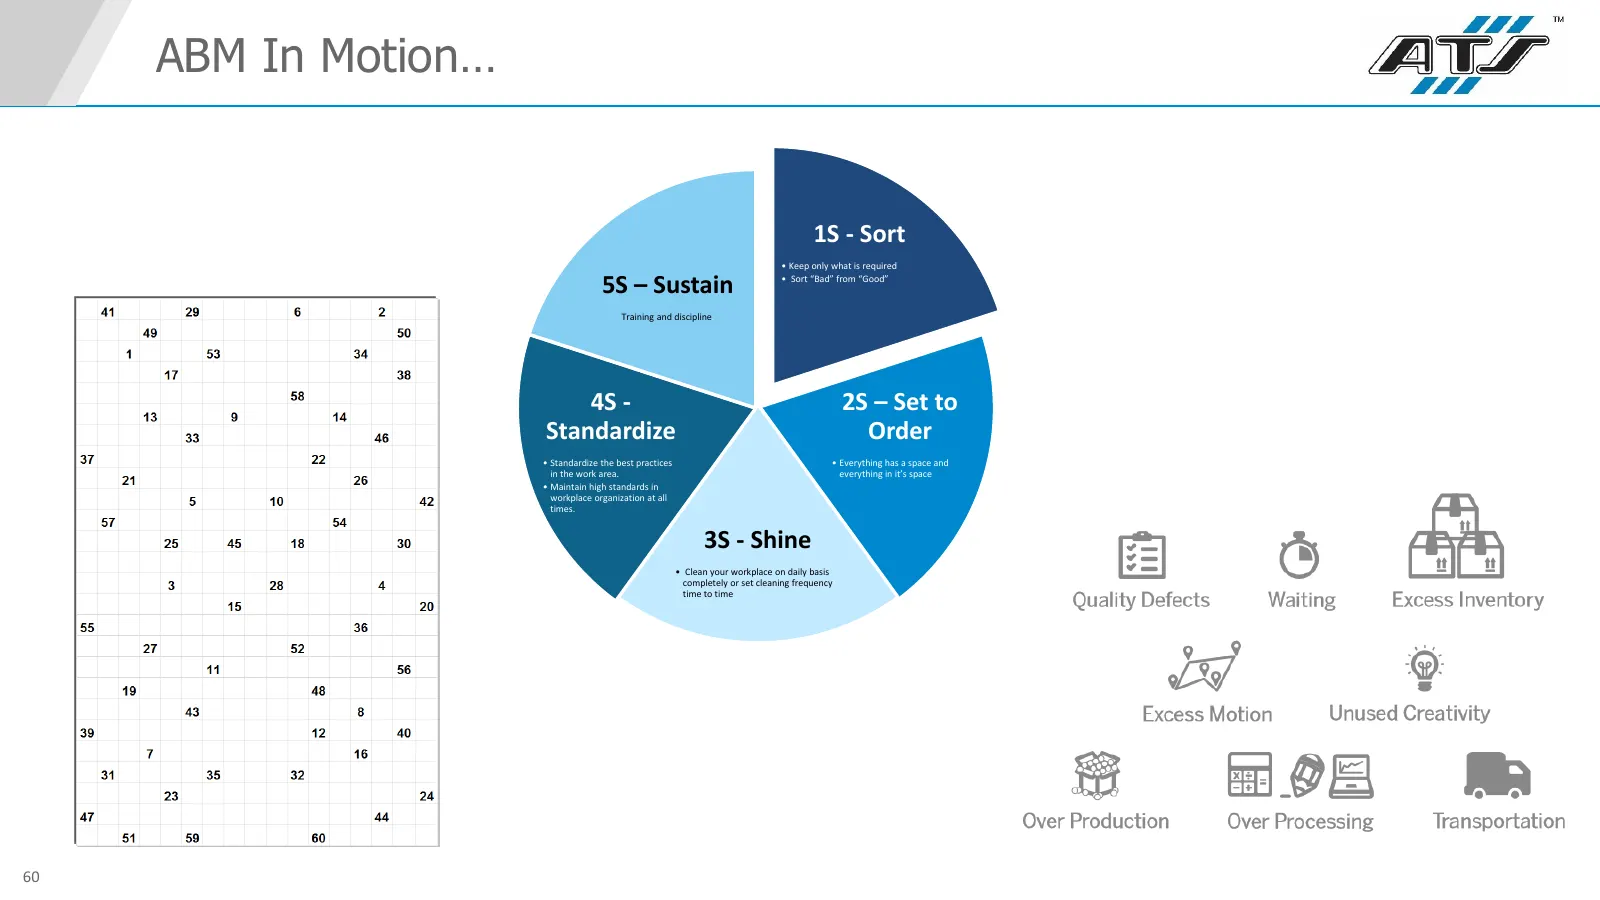
Slide 60: ABM In Motion
ABM In Motion… 1S - Sort • Keep only what is required 5S – Sustain • Sort “Bad” from “Good” Training and discipline. 4S - 2S – Set to Standardize Order • Standardize the best practices • Everything has a space and in the work area. everything in it’s space • Maintain high standards in workplace orga
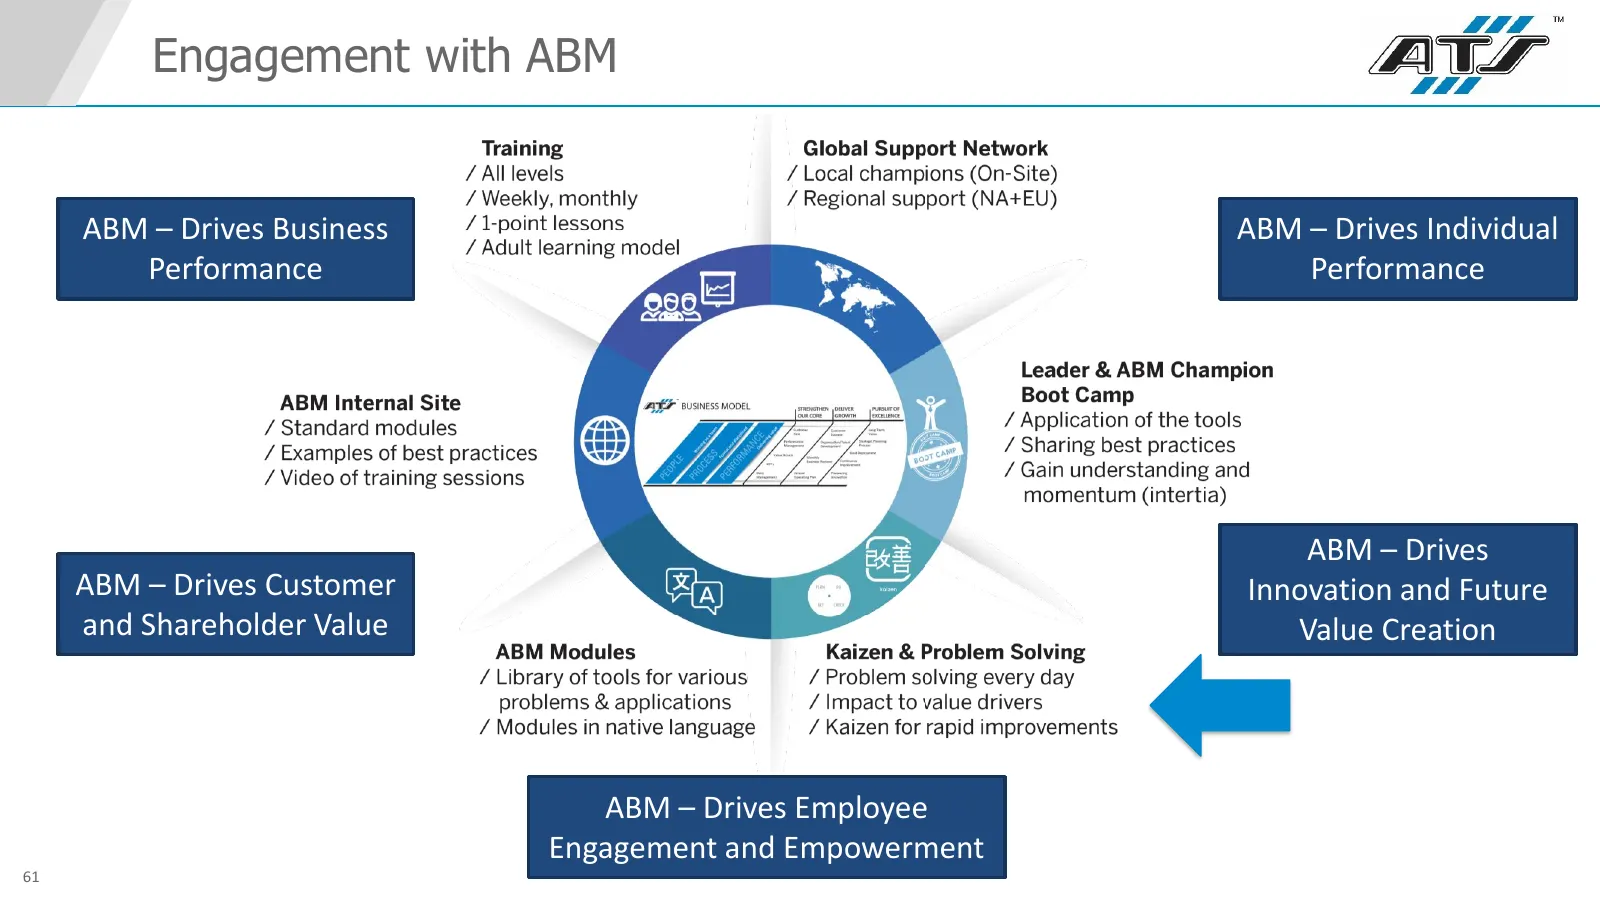
Slide 61: Engagement with ABM
Engagement with ABM ABM – Drives Business ABM – Drives Individual Performance Performance ABM – Drives ABM – Drives Customer Innovation and Future and Shareholder Value Value Creation ABM – Drives Employee Engagement and Empowerment 61
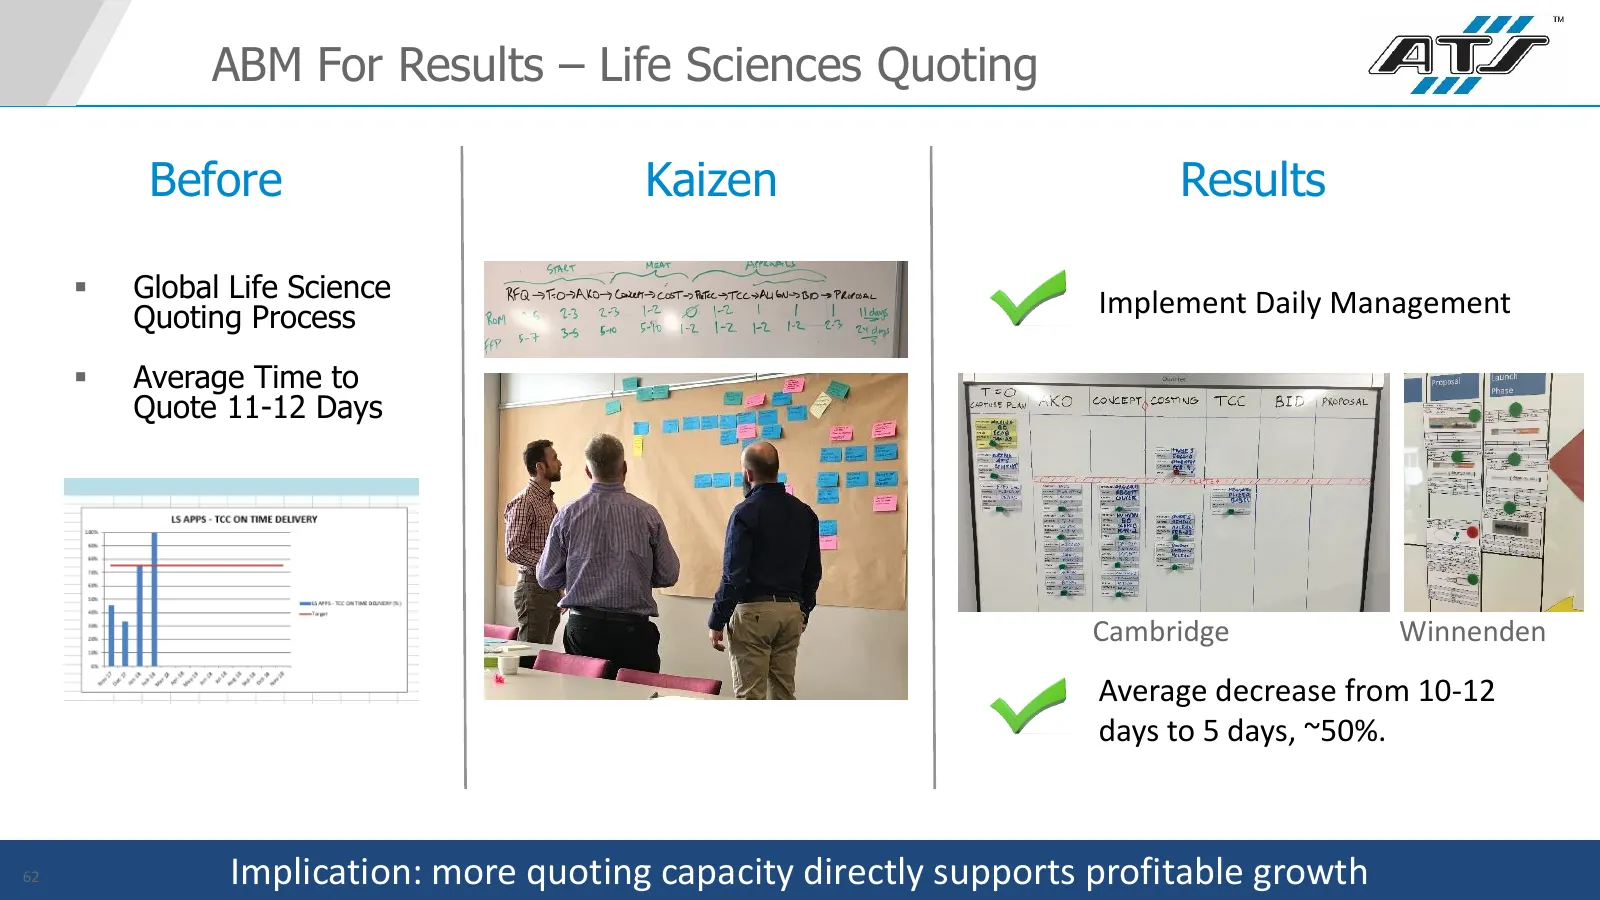
Slide 62: ABM For Results – Life Sciences Quoting
ABM For Results – Life Sciences Quoting Before Kaizen Results Global Life Science Implement Daily Management Quoting Process Average Time to Quote 11-12 Days Cambridge Winnenden Average decrease from 10-12 days to 5 days, ~50%. 62 Implication: more quoting capacity directly supports profitable g
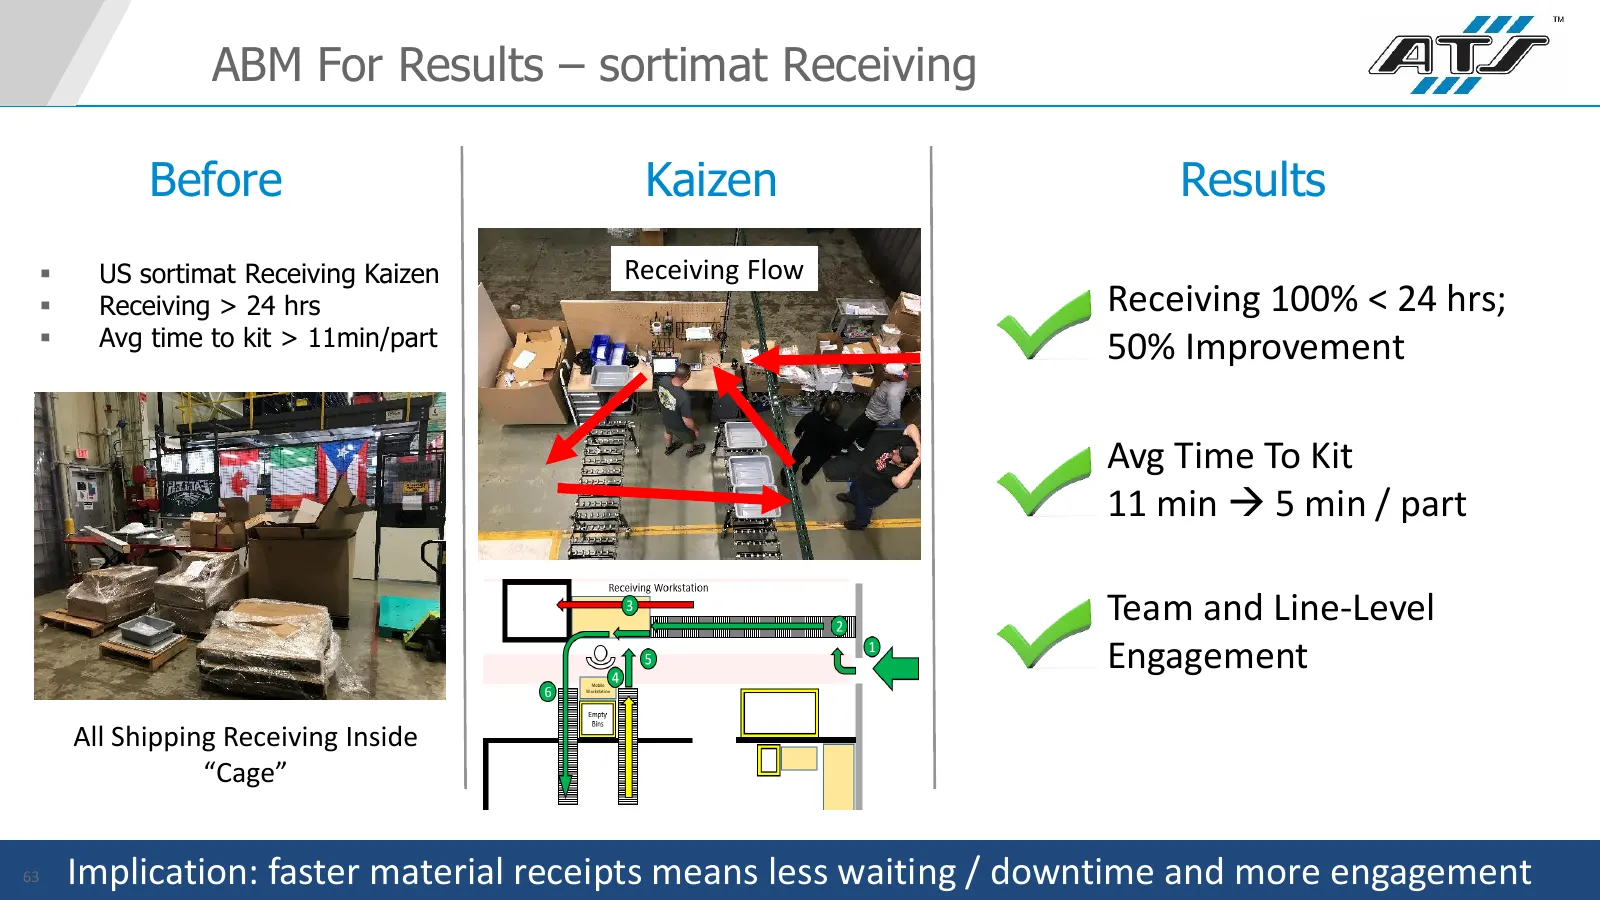
Slide 63: ABM For Results – sortimat Receiving
ABM For Results – sortimat Receiving Before Kaizen Results US sortimat Receiving Kaizen Receiving Flow Receiving > 24 hrs Receiving 100% < 24 hrs; Avg time to kit > 11min/part 50% Improvement Avg Time To Kit 11 min 5 min / part Team and Line-Level Engagement All Shipping Receiving Inside “Ca
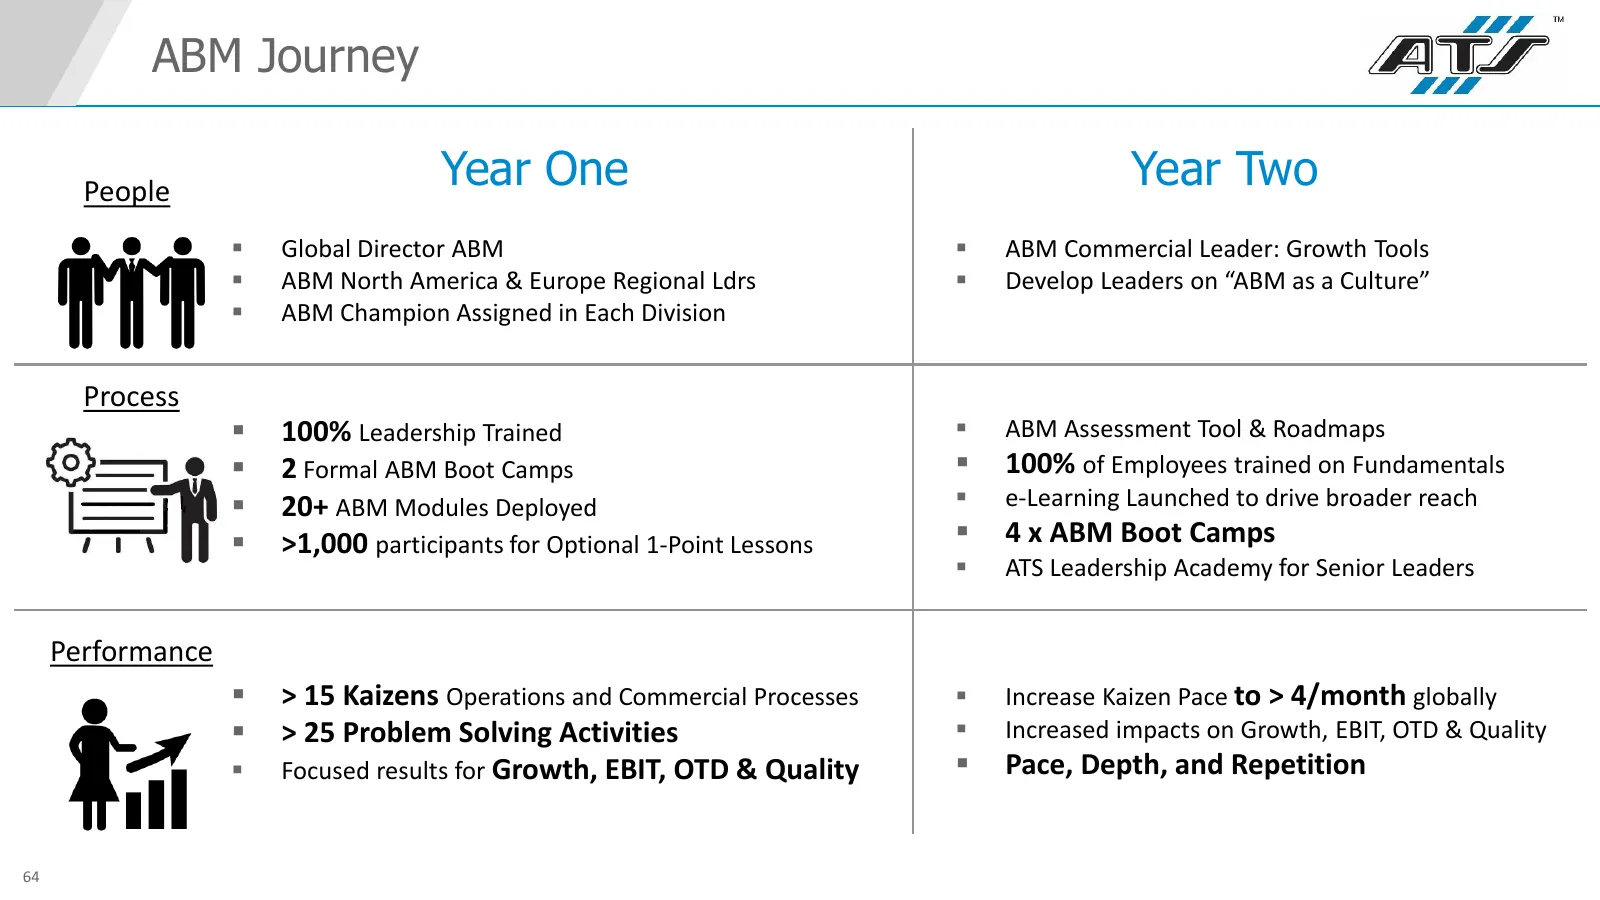
Slide 64: ABM Journey
ABM Journey People Year One Year Two Global Director ABM ABM Commercial Leader: Growth Tools ABM North America & Europe Regional Ldrs Develop Leaders on “ABM as a Culture” ABM Champion Assigned in Each Division Process 100% Leadership Trained ABM Assessment Tool & Roadmaps 2 Formal A
Slide 65: ATS Automation – 2018 Investor Day
ATS AUTOMATION – 2018 INVESTOR DAY - TSX:ATA
Slide 66: ATS Investor Day – Agenda
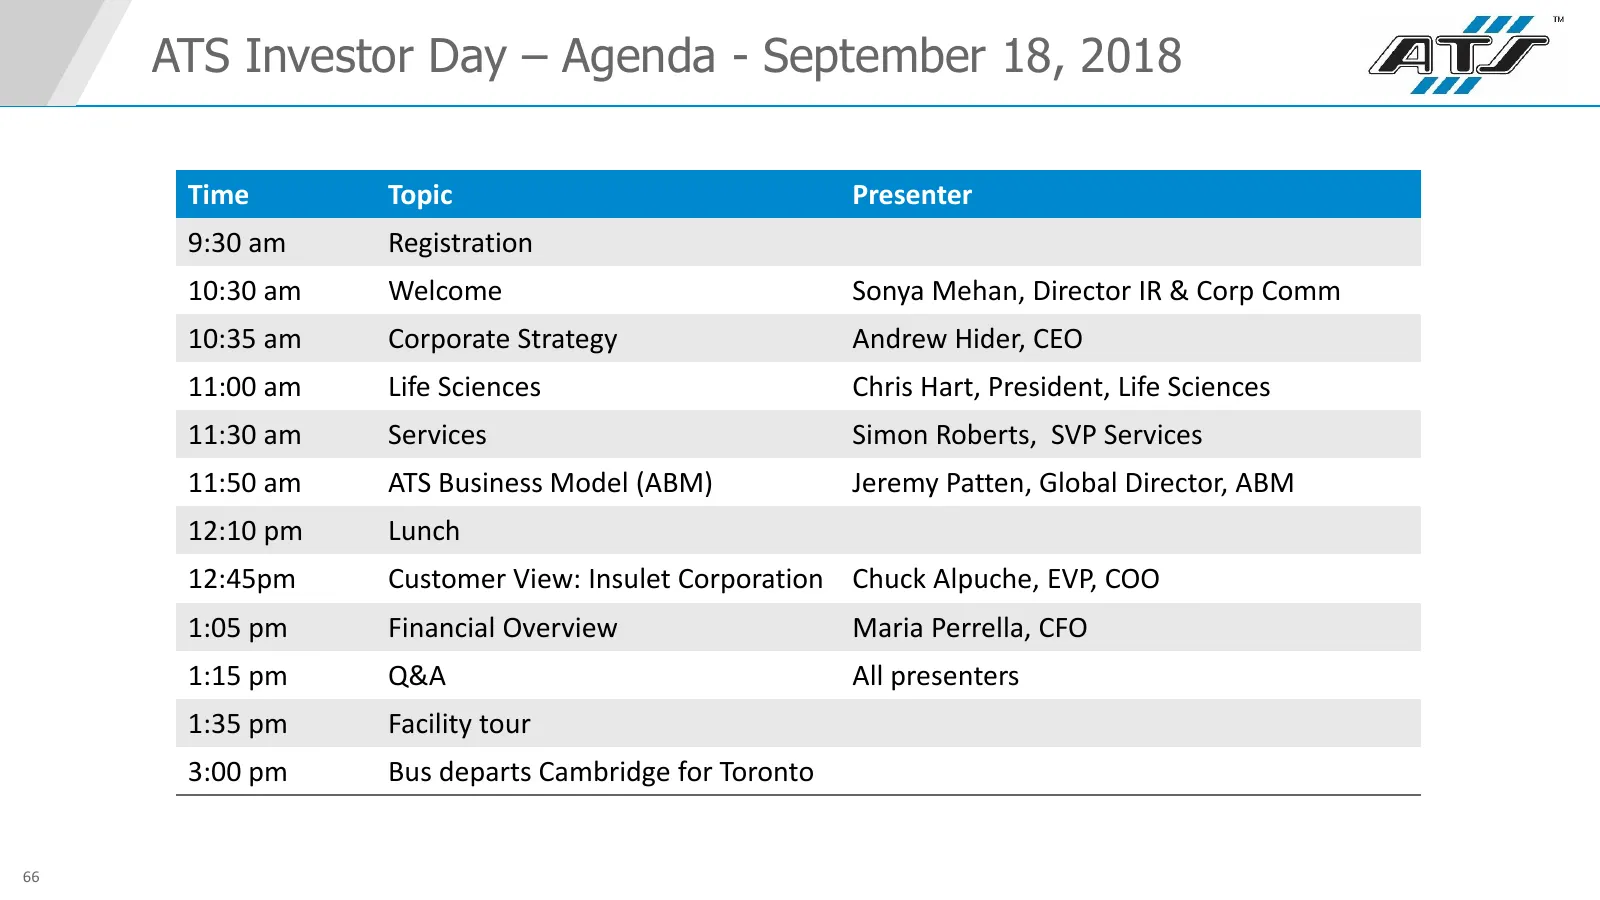
ATS Investor Day – Agenda - September 18, 2018 Time Topic Presenter 9:30 am Registration 10:30 am Welcome Sonya Mehan, Director IR & Corp Comm 10:35 am Corporate Strategy Andrew Hider, CEO 11:00 am Life Sciences Chris Hart, President, Life Sciences 11:30 am Services Simon Roberts, SVP Services 11:50
Slide 67: ATS Automation – 2018 Investor Day
ATS AUTOMATION – 2018 INVESTOR DAY - TSX:ATA
Slide 68: Customer Success Story: Insulet Corporation
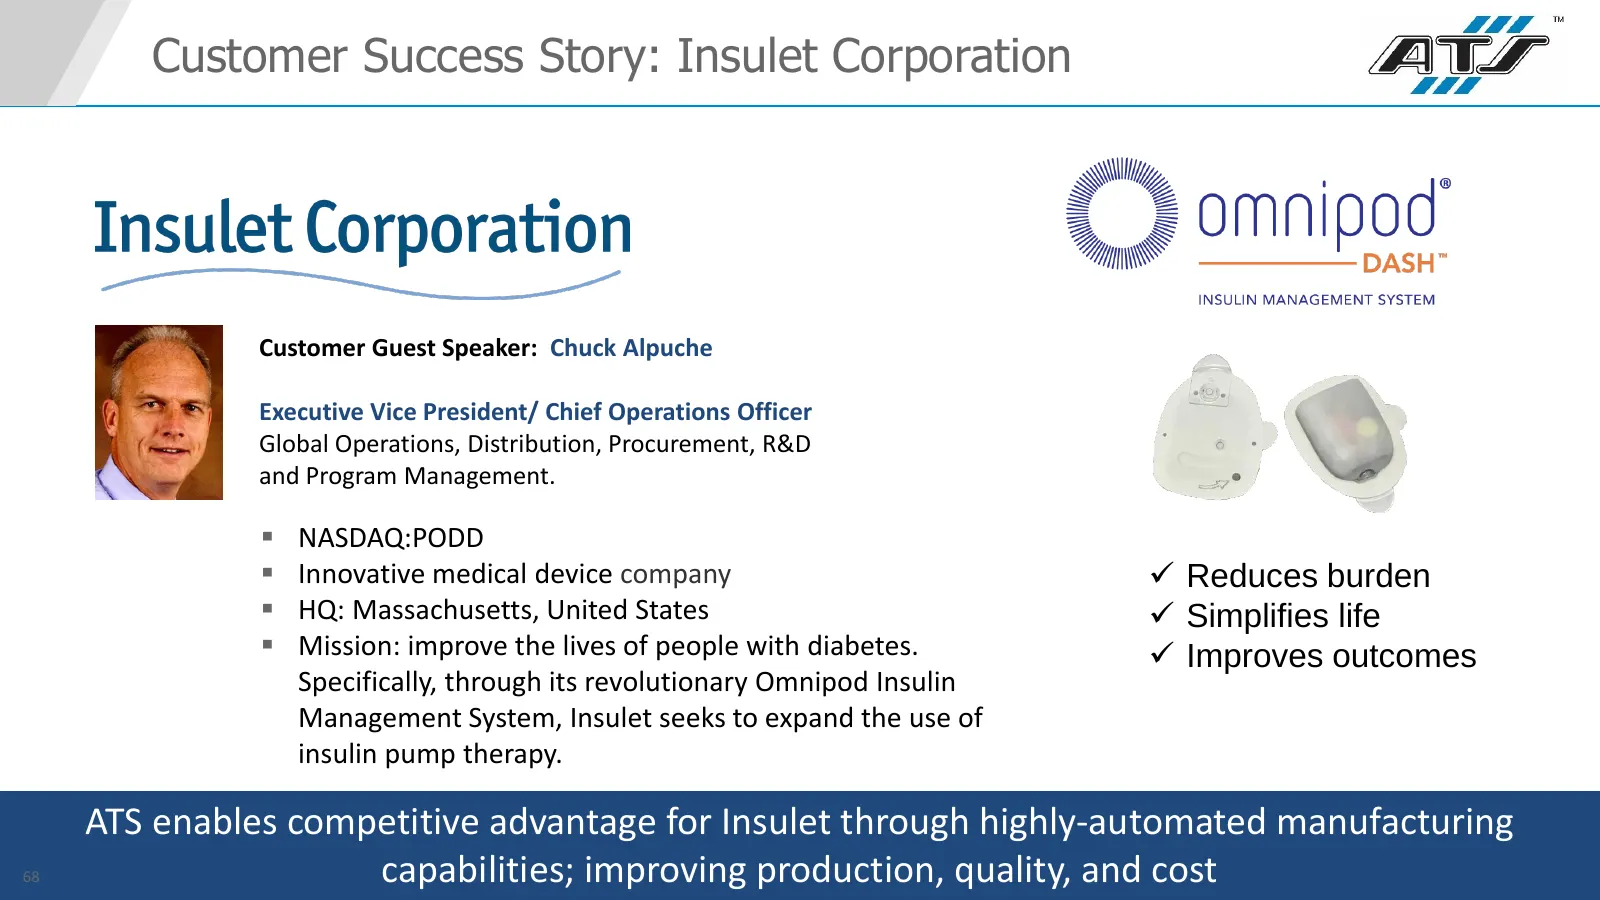
Customer Success Story: Insulet Corporation Customer Guest Speaker: Chuck Alpuche EXPAND Executive Vice President/ Chief Operations Officer Global Operations, Distribution, Procurement, R&D and Program Management. NASDAQ:PODD Innovative medical device company Reduces burden HQ: Massachusetts
Slide 69: Maria Perrella
MARIA PERRELLA Chief Financial Officer
Slide 70: Order Bookings and Order Backlog
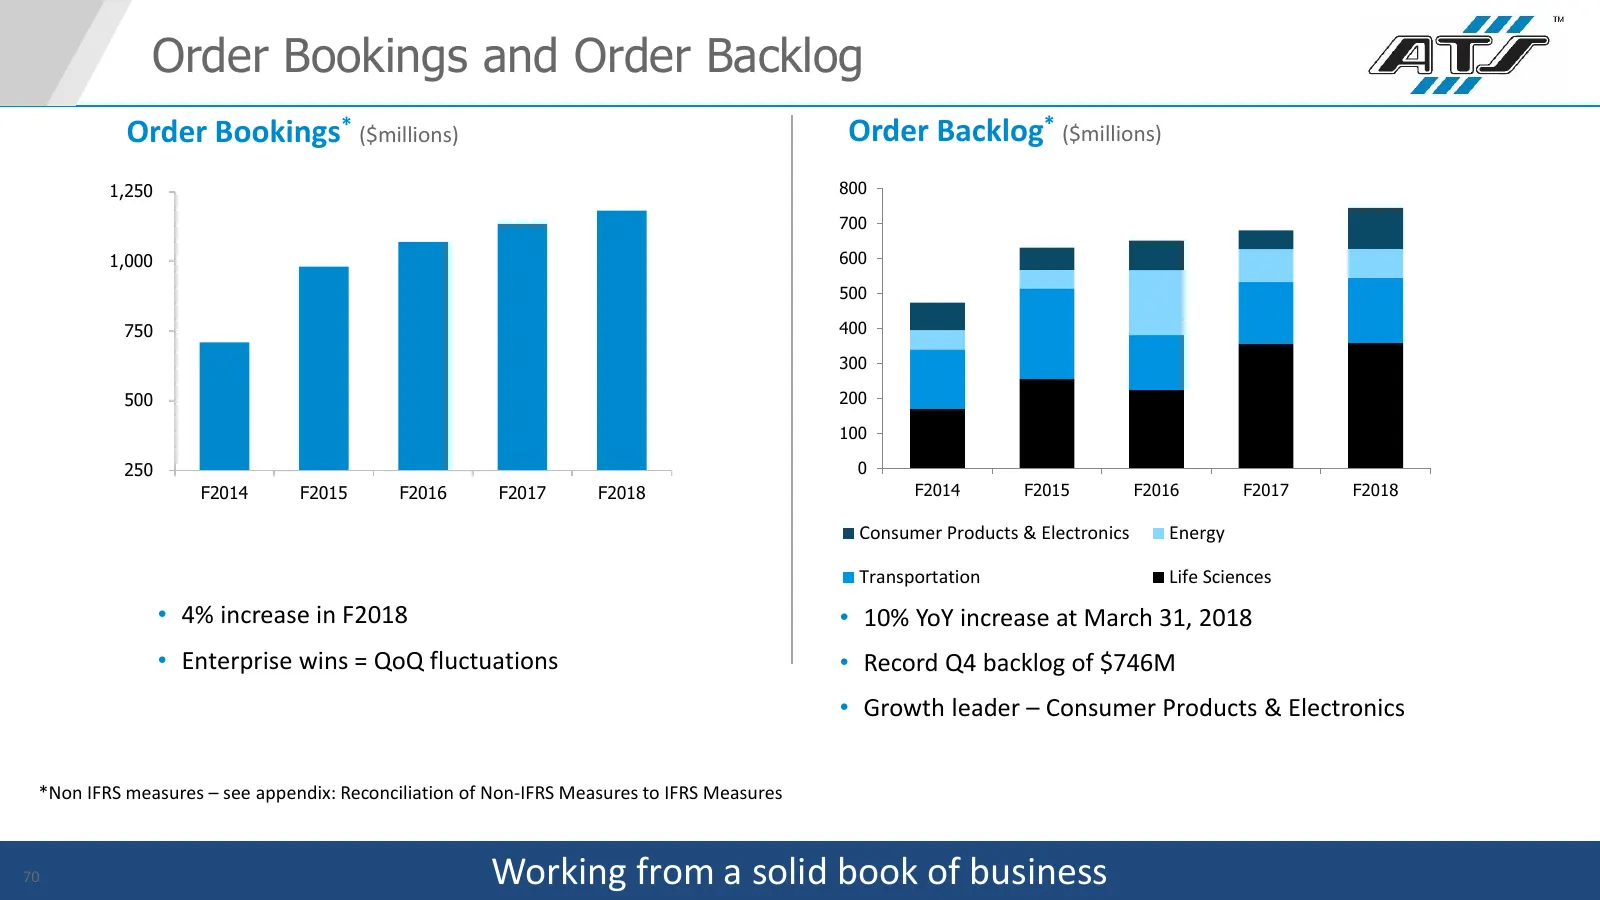
Order Bookings and Order Backlog Order Bookings* ($millions) Order Backlog* ($millions) 1,250 800 700 1,000 600 500 750 400 300 500 200 100 250 0 F2014 F2015 F2016 F2017 F2018 F2014 F2015 F2016 F2017 F2018 Consumer Products & Electronics Energy Transportation Life Sciences • 4% increase in F2018 • 1
Slide 71: Revenues, Margins, EPS
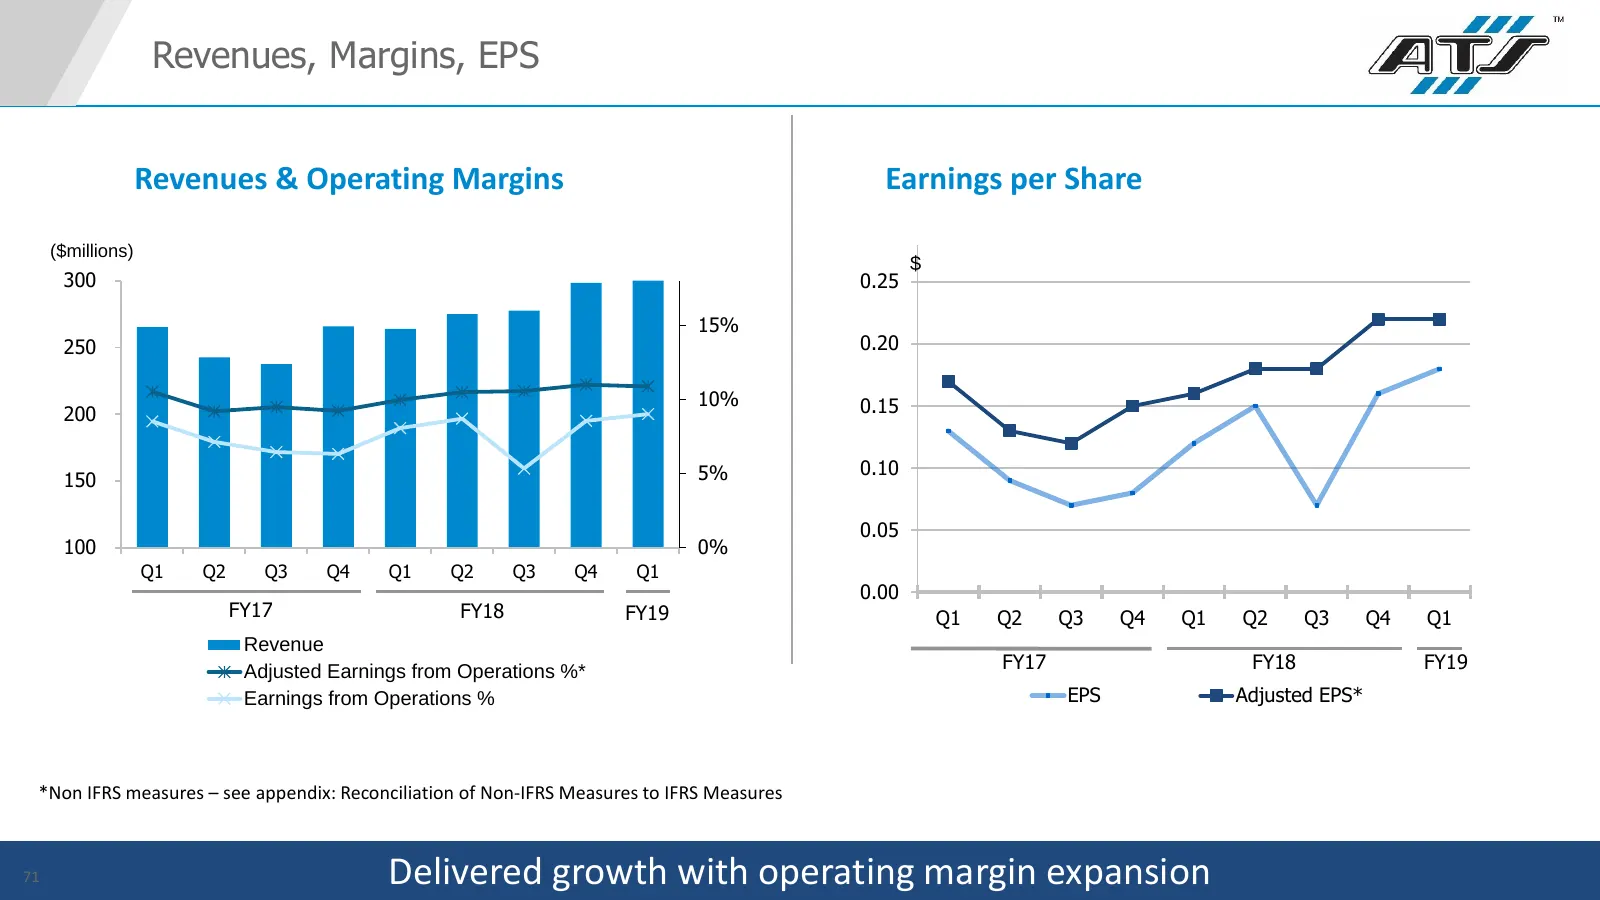
Revenues, Margins, EPS Revenues & Operating Margins Earnings per Share ($millions) $ 300 0.25 15% 250 0.20 10% 0.15 200 5% 0.10 150 0.05 100 0% Q1 Q2 Q3 Q4 Q1 Q2 Q3 Q4 Q1 0.00 FY17 FY18 FY19 Q1 Q2 Q3 Q4 Q1 Q2 Q3 Q4 Q1 Revenue Adjusted Earnings from Operations %* FY17 FY18 FY19 Earnings from Operatio
Slide 72: Working Capital & Capex
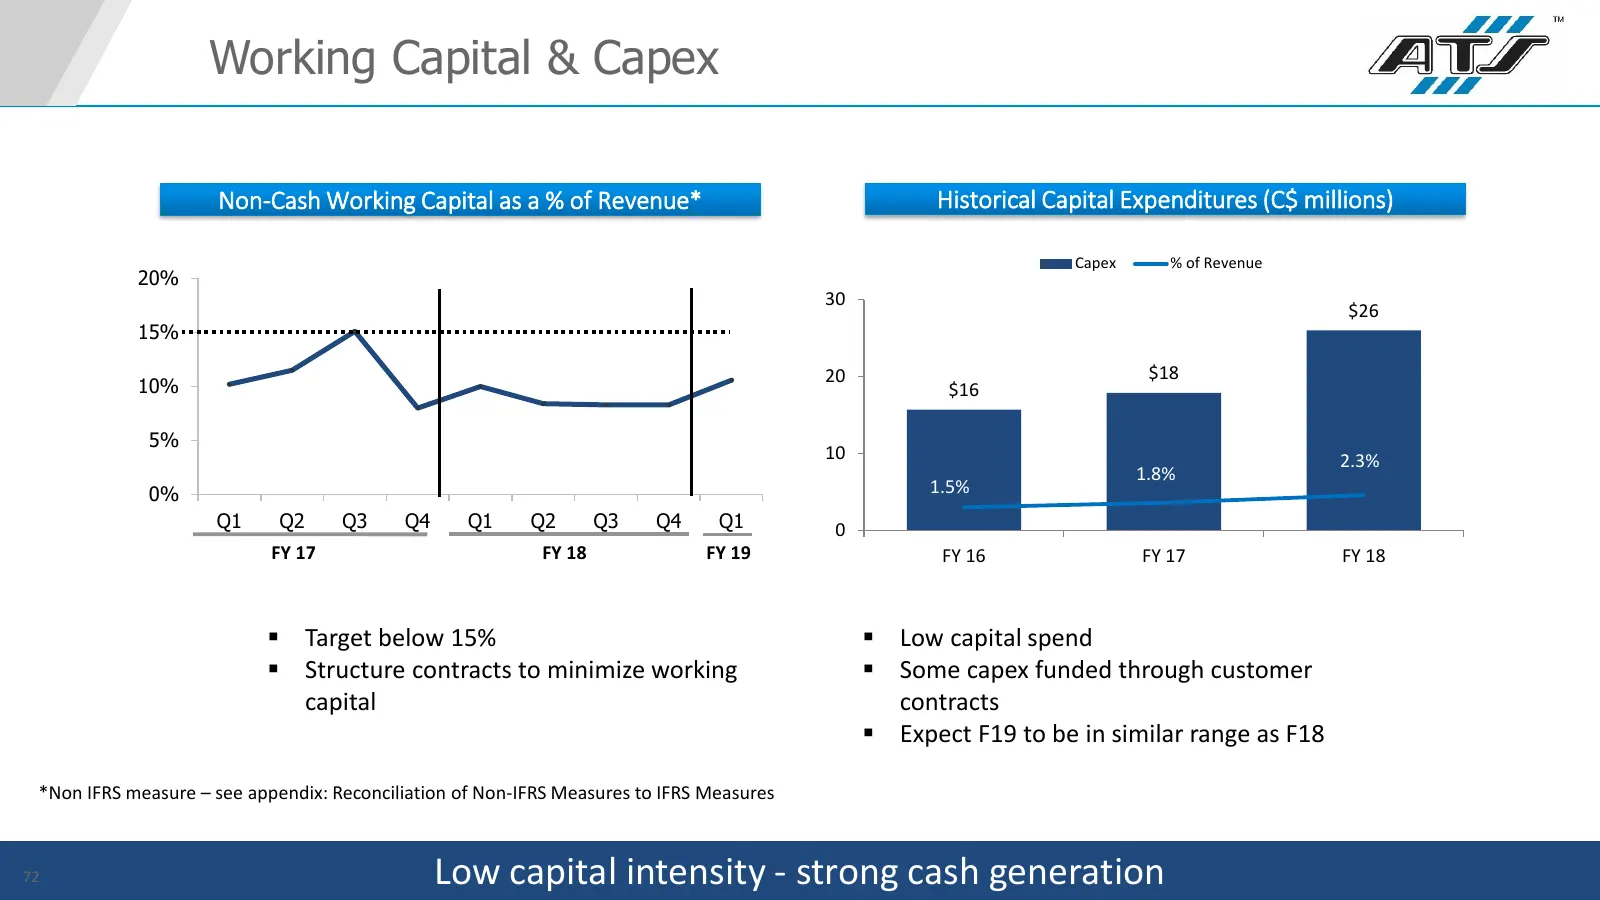
Working Capital & Capex Non-Cash Working Capital as a % of Revenue* Historical Capital Expenditures (C$ millions) Capex % of Revenue 20% 30 $26 15% 20 $18 10% $16 5% 10 2.3% 1.8% 0% 1.5% Q1 Q2 Q3 Q4 Q1 Q2 Q3 Q4 Q1 0 FY 17 FY 18 FY 19 FY 16 FY 17 FY 18 Target below 15% Low capital spend Structu
Slide 73: Return on Invested Capital
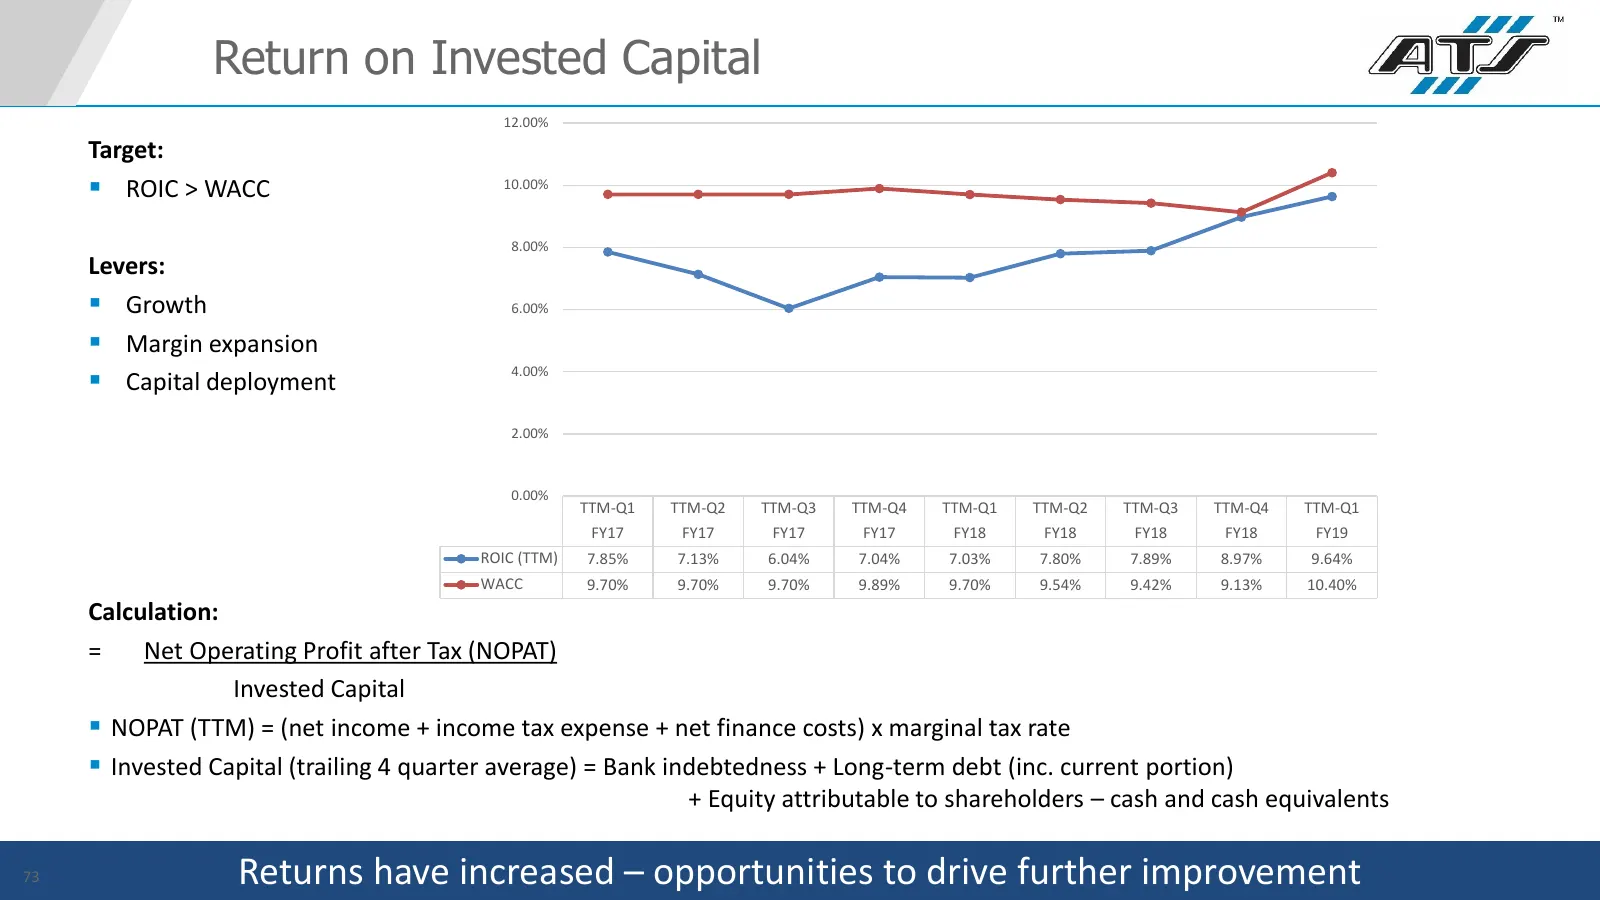
Return on Invested Capital 12.00% Target: ROIC > WACC 10.00% 8.00% Levers: Growth 6.00% Margin expansion Capital deployment 4.00% 2.00% 0.00% TTM-Q1 TTM-Q2 TTM-Q3 TTM-Q4 TTM-Q1 TTM-Q2 TTM-Q3 TTM-Q4 TTM-Q1 FY17 FY17 FY17 FY17 FY18 FY18 FY18 FY18 FY19 ROIC (TTM) 7.85% 7.13% 6.04% 7.04% 7.03% 7
Slide 74: Margin Expansion
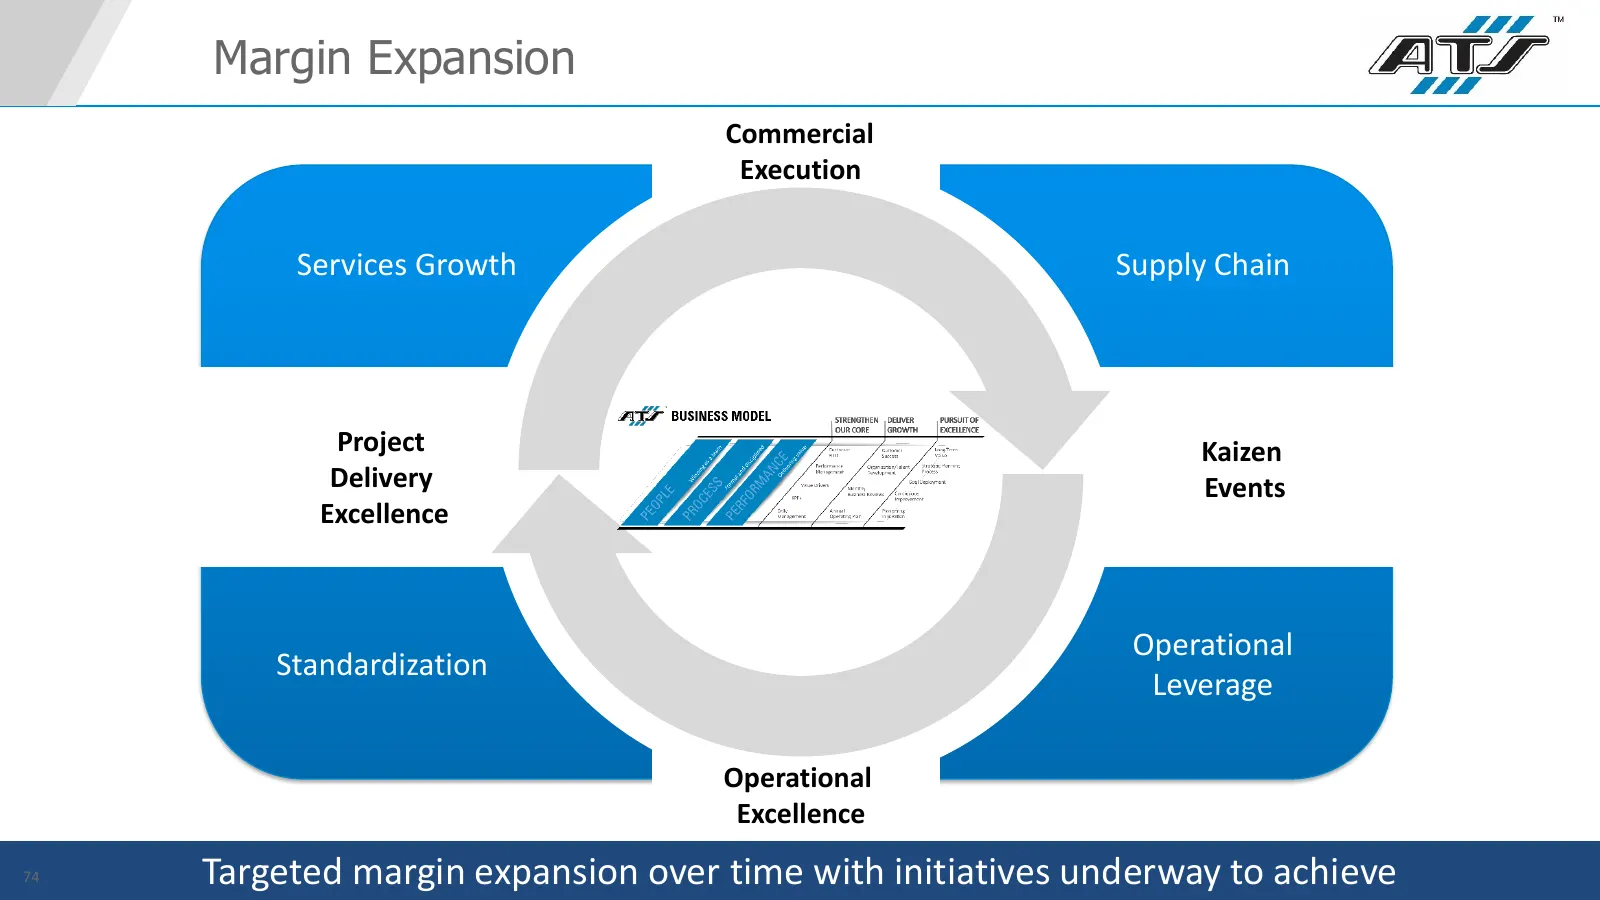
Margin Expansion Commercial Execution Services Growth Supply Chain Project Kaizen Delivery Events Excellence Operational Standardization Leverage Operational Excellence 74 Targeted margin expansion over time with initiatives underway to achieve
Slide 75: Capital Structure
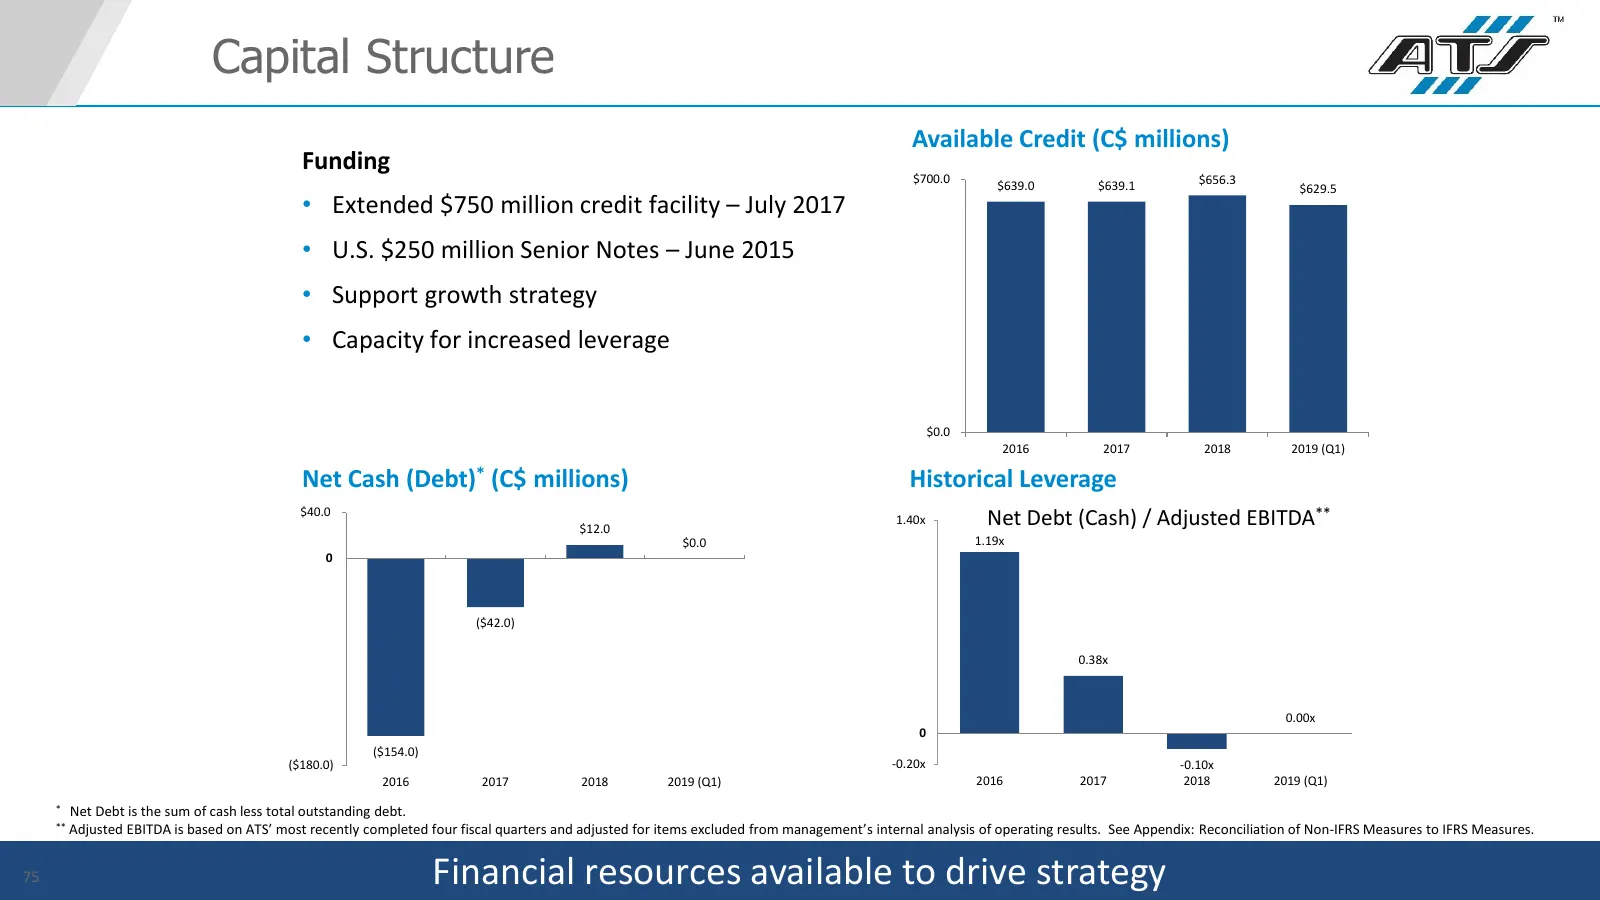
Capital Structure Available Credit (C$ millions) Funding $700.0 $656.3 $639.0 $639.1 $629.5 • Extended $750 million credit facility – July 2017 • U.S. $250 million Senior Notes – June 2015 • Support growth strategy • Capacity for increased leverage $0.0 2016 2017 2018 2019 (Q1) Net Cash (Debt)* (C$
Slide 76: Capital Structure – Leverage
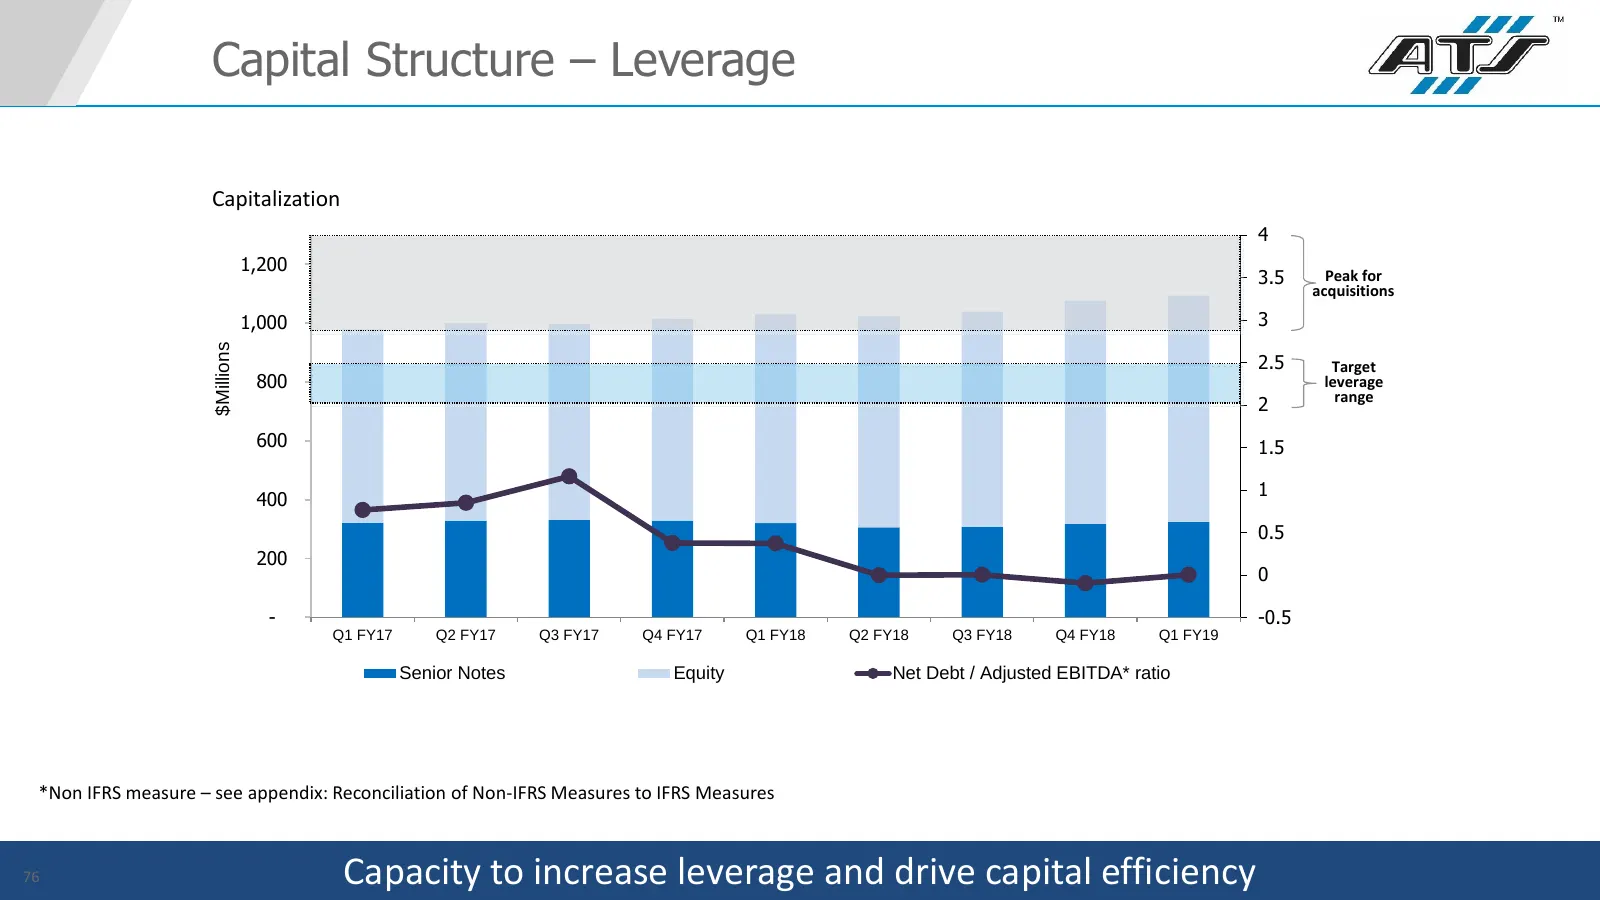
Capital Structure – Leverage Capitalization 4 1,200 3.5 Peak for acquisitions 1,000 3 $Millions 2.5 Target 800 leverage range 2 600 1.5 1 400 0.5 200 0 - -0.5 Q1 FY17 Q2 FY17 Q3 FY17 Q4 FY17 Q1 FY18 Q2 FY18 Q3 FY18 Q4 FY18 Q1 FY19 Senior Notes Equity Net Debt / Adjusted EBITDA* ratio *Non IFRS measu
Slide 77: ATS Automation – 2018 Investor Day
ATS AUTOMATION – 2018 INVESTOR DAY - TSX:ATA
Slide 78: Q&A
ATT | Q&A
Slide 79: Summary
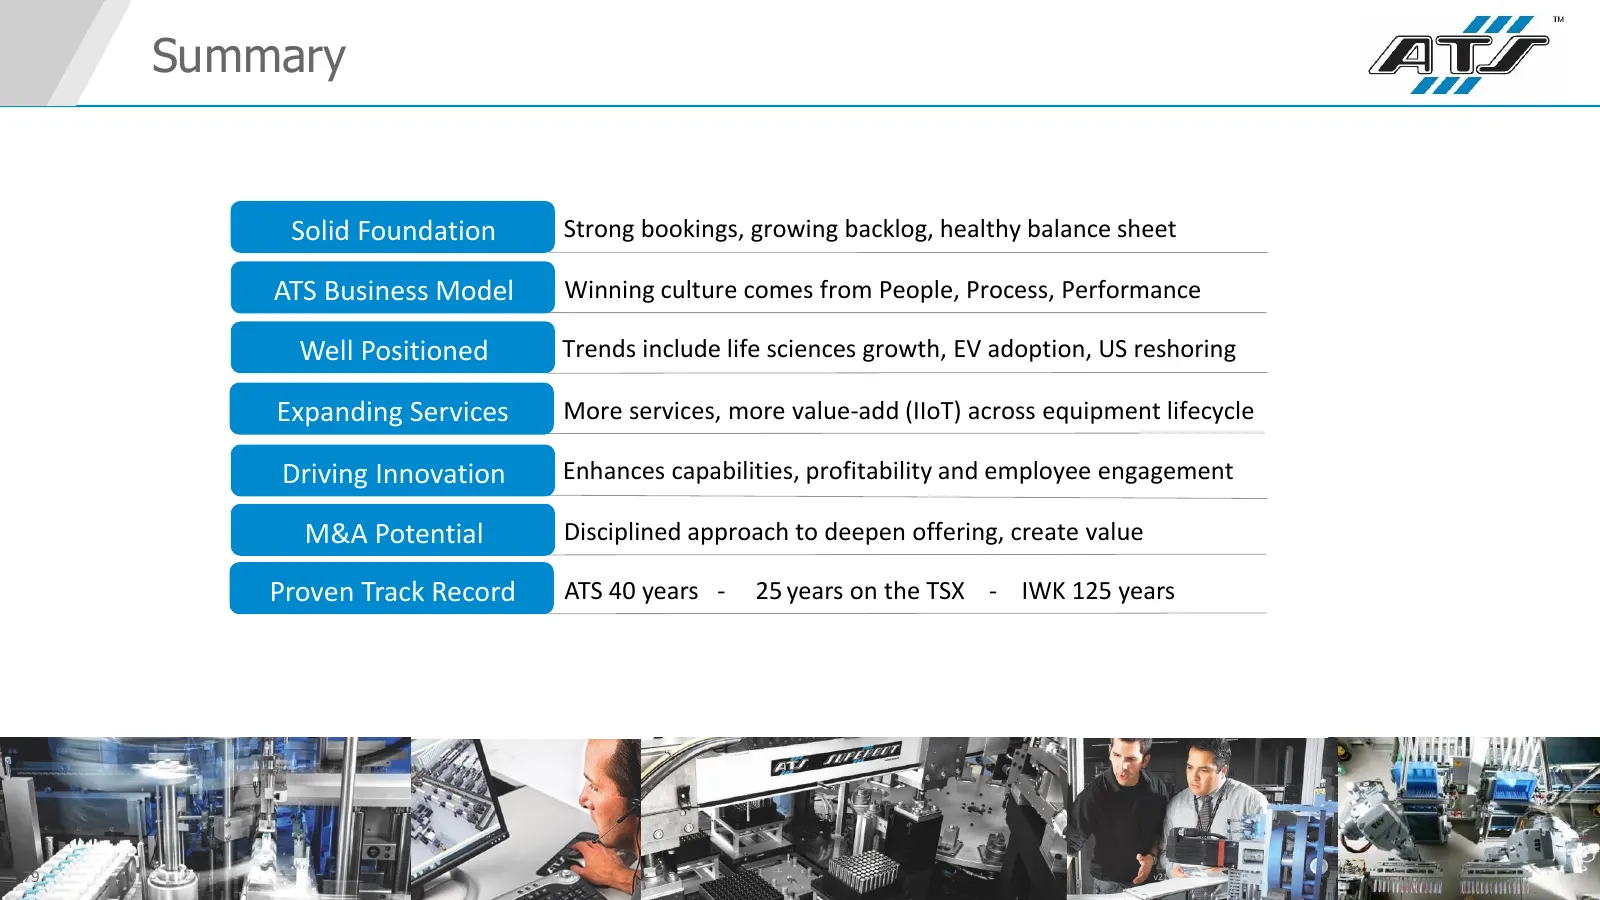
Summary Solid Foundation Strong bookings, growing backlog, healthy balance sheet Solid ATS Foundation Business Model Winning culture comes from People, Process, Performance ATS Business Well Model Positioned Trends include life sciences growth, EV adoption, US reshoring Expanding Services More servi
Slide 80: ATS Automation – 2018 Investor Day
ATS AUTOMATION – 2018 INVESTOR DAY - TSX:ATA
Slide 81: Appendix: Reconciliation of Non-IFRS Measures to IFRS Measures
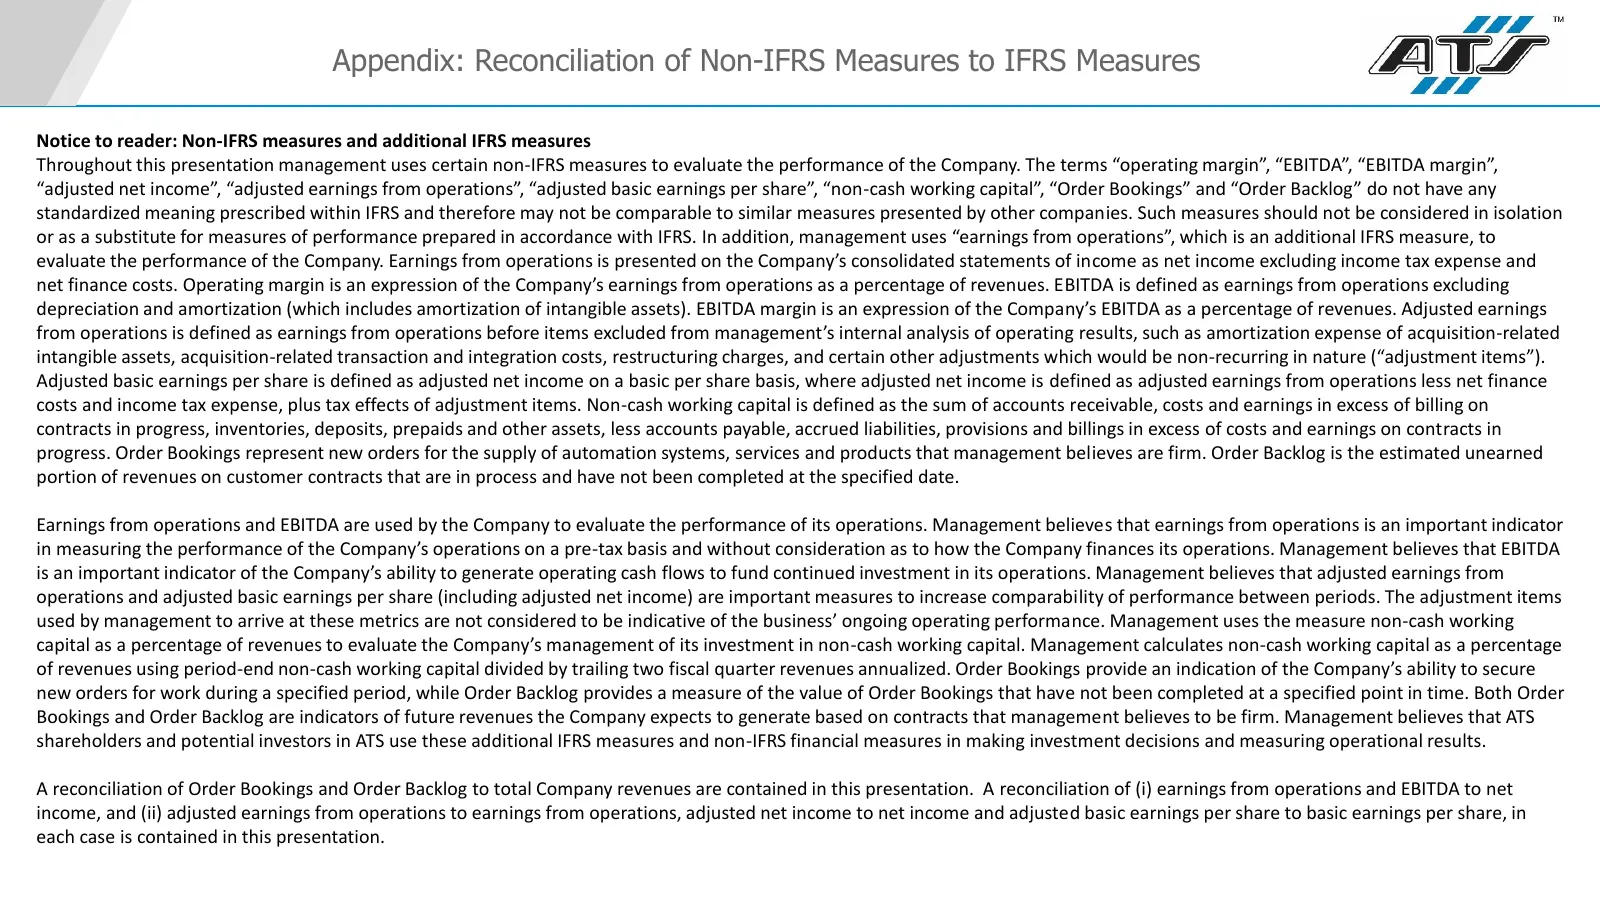
Appendix: Reconciliation of Non-IFRS Measures to IFRS Measures Notice to reader: Non-IFRS measures and additional IFRS measures Throughout this presentation management uses certain non-IFRS measures to evaluate the performance of the Company. The terms “operating margin”, “EBITDA”, “EBITDA margin”,
Slide 82: Appendix: Reconciliation of Non-IFRS Measures to IFRS Measures
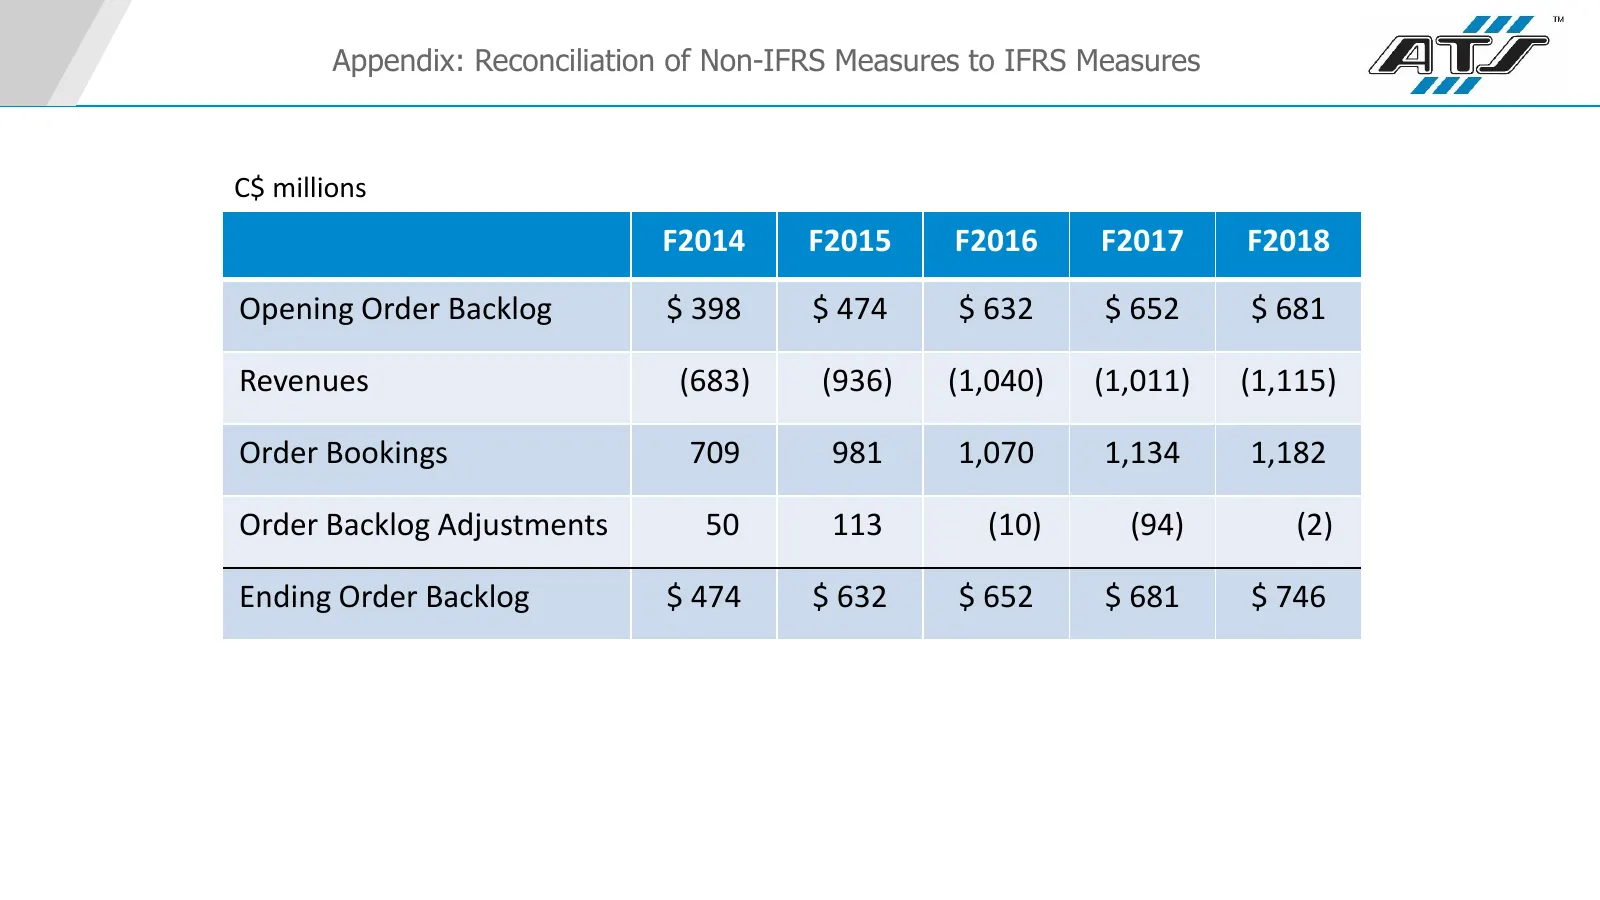
Appendix: Reconciliation of Non-IFRS Measures to IFRS Measures C$ millions F2014 F2015 F2016 F2017 F2018 Opening Order Backlog $ 398 $ 474 $ 632 $ 652 $ 681 Revenues (683) (936) (1,040) (1,011) (1,115) Order Bookings 709 981 1,070 1,134 1,182 Order Backlog Adjustments 50 113 (10) (94) (2) Ending Ord
Slide 83: Appendix: Reconciliation of Non-IFRS Measures to IFRS Measures
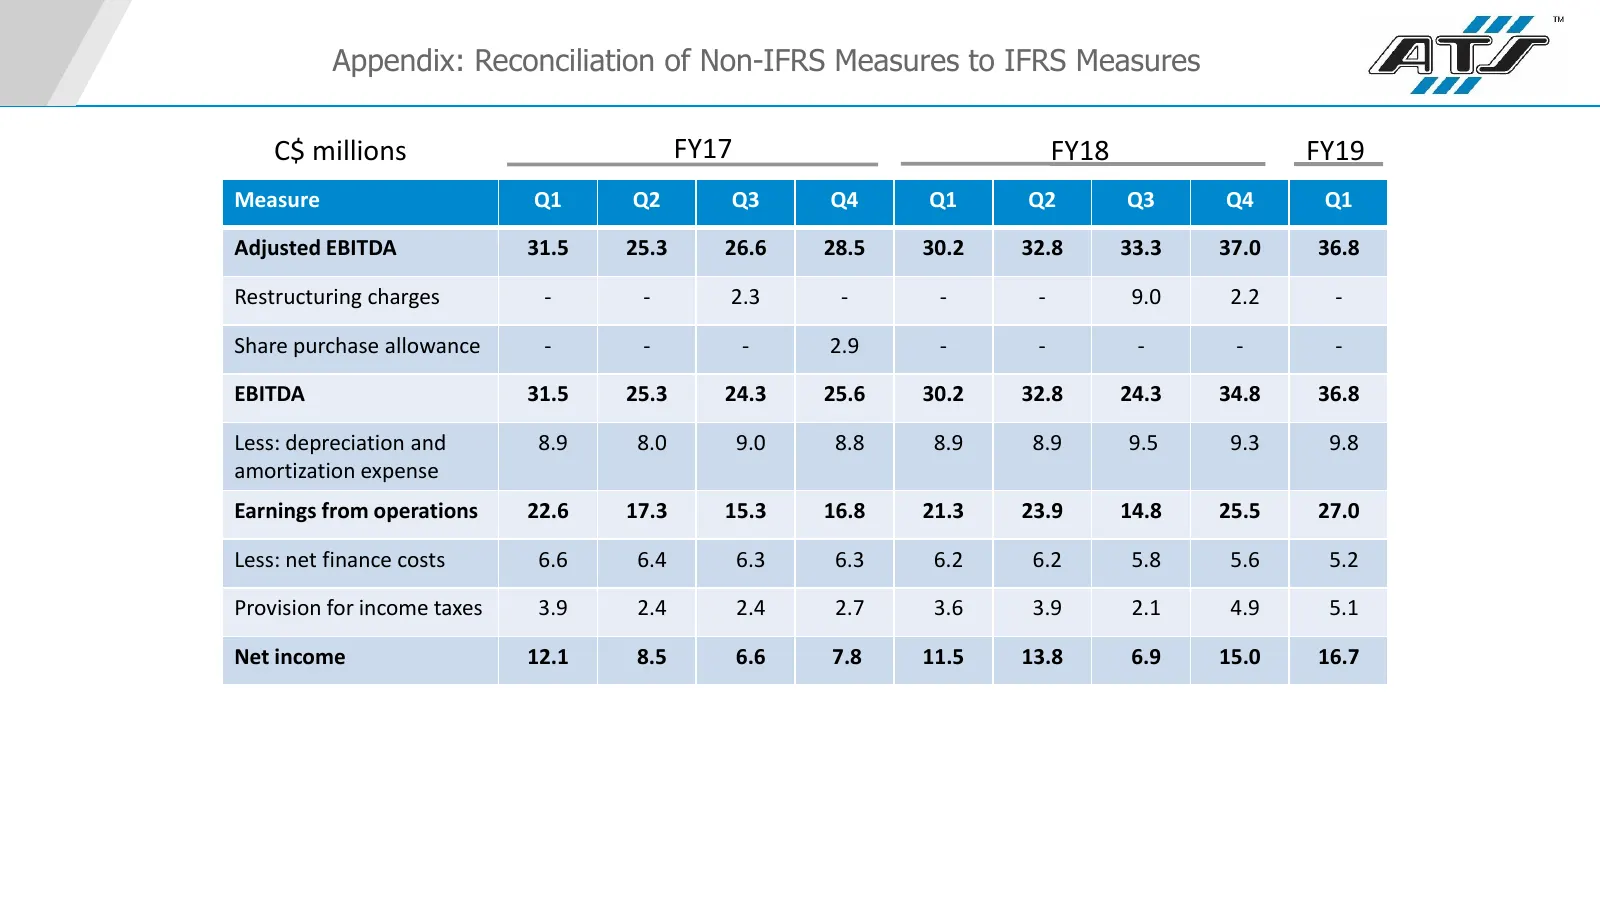
Appendix: Reconciliation of Non-IFRS Measures to IFRS Measures C$ millions FY17 FY18 FY19 Measure Q1 Q2 Q3 Q4 Q1 Q2 Q3 Q4 Q1 Adjusted EBITDA 31.5 25.3 26.6 28.5 30.2 32.8 33.3 37.0 36.8 Restructuring charges - - 2.3 - - - 9.0 2.2 - Share purchase allowance - - - 2.9 - - - - - EBITDA 31.5 25.3 24.3 2
Slide 84: Appendix: Reconciliation of Non-IFRS Measures to IFRS Measures
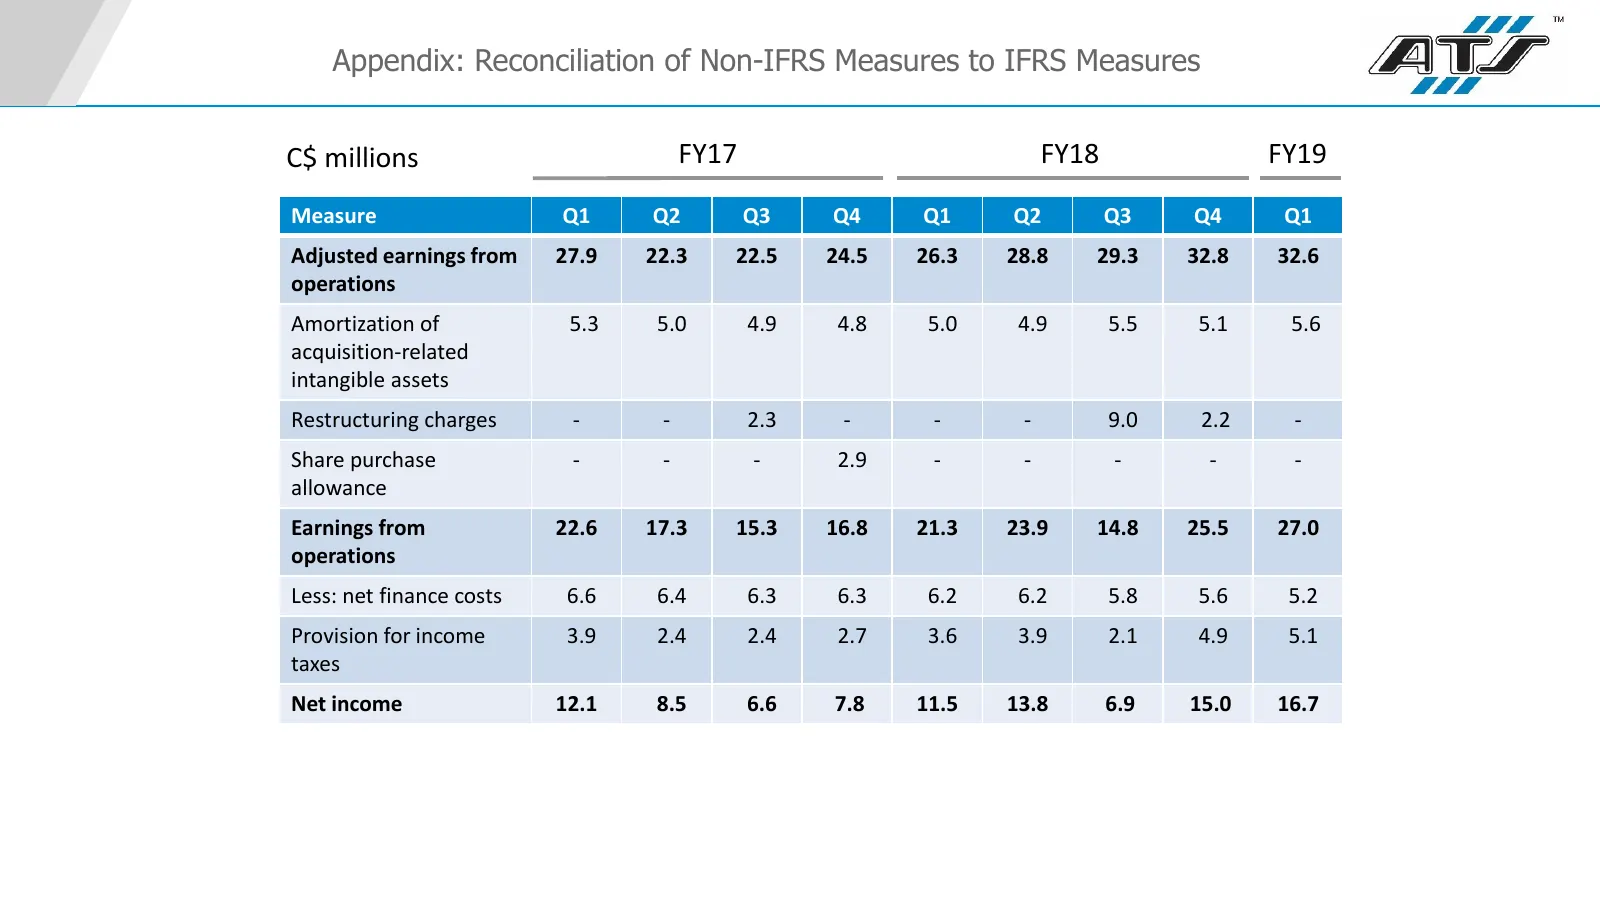
Appendix: Reconciliation of Non-IFRS Measures to IFRS Measures C$ millions FY17 FY18 FY19 Measure Q1 Q2 Q3 Q4 Q1 Q2 Q3 Q4 Q1 Adjusted earnings from 27.9 22.3 22.5 24.5 26.3 28.8 29.3 32.8 32.6 operations Amortization of 5.3 5.0 4.9 4.8 5.0 4.9 5.5 5.1 5.6 acquisition-related intangible assets Restru
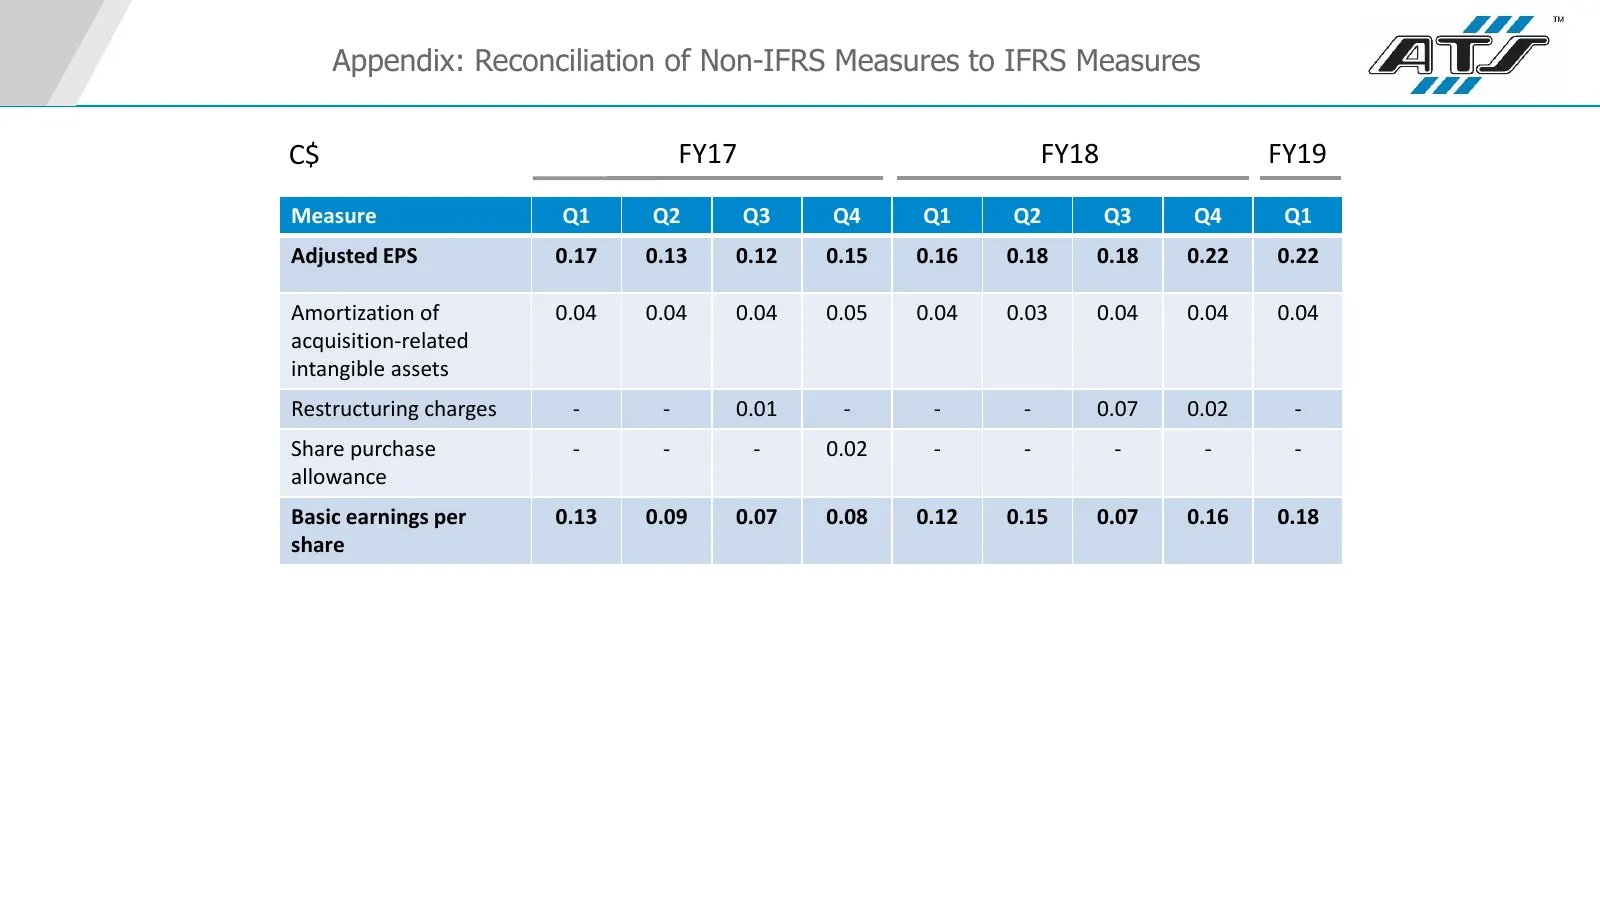
Slide 85: Appendix: Reconciliation of Non-IFRS Measures to IFRS Measures
Appendix: Reconciliation of Non-IFRS Measures to IFRS Measures C$ FY17 FY18 FY19 Measure Q1 Q2 Q3 Q4 Q1 Q2 Q3 Q4 Q1 Adjusted EPS 0.17 0.13 0.12 0.15 0.16 0.18 0.18 0.22 0.22 Amortization of 0.04 0.04 0.04 0.05 0.04 0.03 0.04 0.04 0.04 acquisition-related intangible assets Restructuring charges - - 0
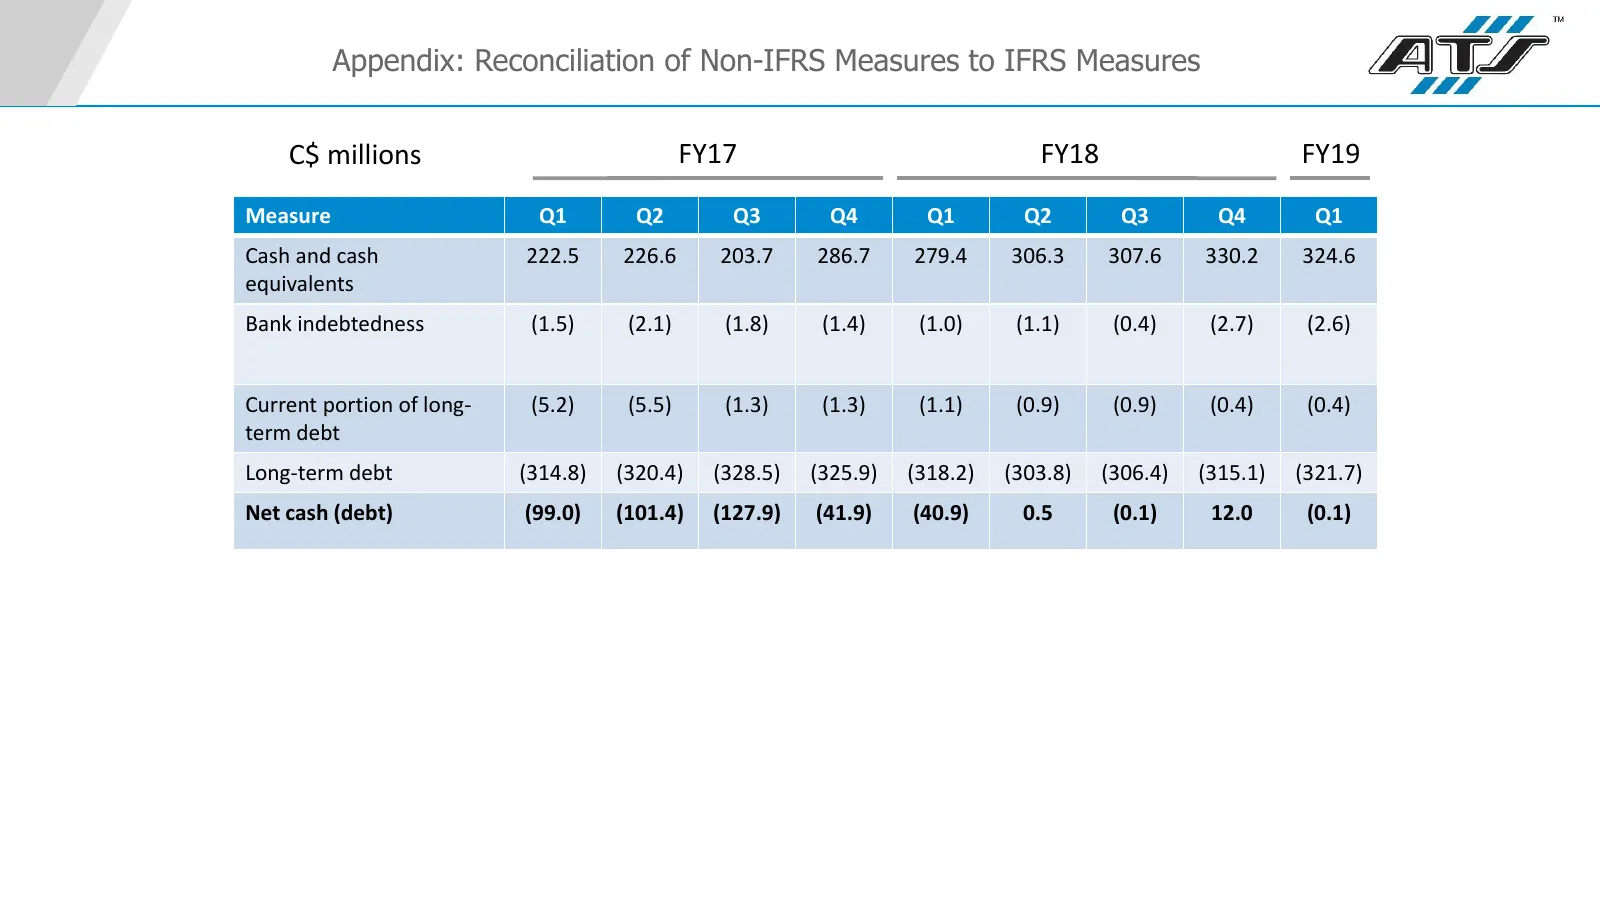
Slide 86: Appendix: Reconciliation of Non-IFRS Measures to IFRS Measures
Appendix: Reconciliation of Non-IFRS Measures to IFRS Measures C$ millions FY17 FY18 FY19 Measure Q1 Q2 Q3 Q4 Q1 Q2 Q3 Q4 Q1 Cash and cash 222.5 226.6 203.7 286.7 279.4 306.3 307.6 330.2 324.6 equivalents Bank indebtedness (1.5) (2.1) (1.8) (1.4) (1.0) (1.1) (0.4) (2.7) (2.6) Current portion of long
Source: Internet Archive copy of atsautomation.com
More decks from ATS Corporation
 Q2 2027 Earnings Presentation15 slides · Nov 4, 2026
 Q1 2027 Earnings Presentation15 slides · Aug 6, 2026
 Q4 2026 Earnings Presentation15 slides · May 28, 2026
 Q3 2026 Earnings Presentation15 slides · Feb 4, 2026
 Q2 2026 Earnings Presentation15 slides · Nov 5, 2025
 Q1 2026 Earnings Presentation15 slides · Aug 7, 2025