Enel SpA · MIL:ENEL
Enel SpA — IPO Roadshow (June 2005)
63 slides from Enel SpA's IPO roadshow presentation, June 2005
Slide 1: Investor presentation
Investor presentation June 2005
Slide 2: Disclaimer
Disclaimer Cautionary statement: This presentation does not constitute an offer of, or an invitation to make an offer for or purchase, any securities of Enel S.p.A. (“Enel”) in the United States or to any person in any other jurisdiction where such offer or invitation would be unlawful. No securitie
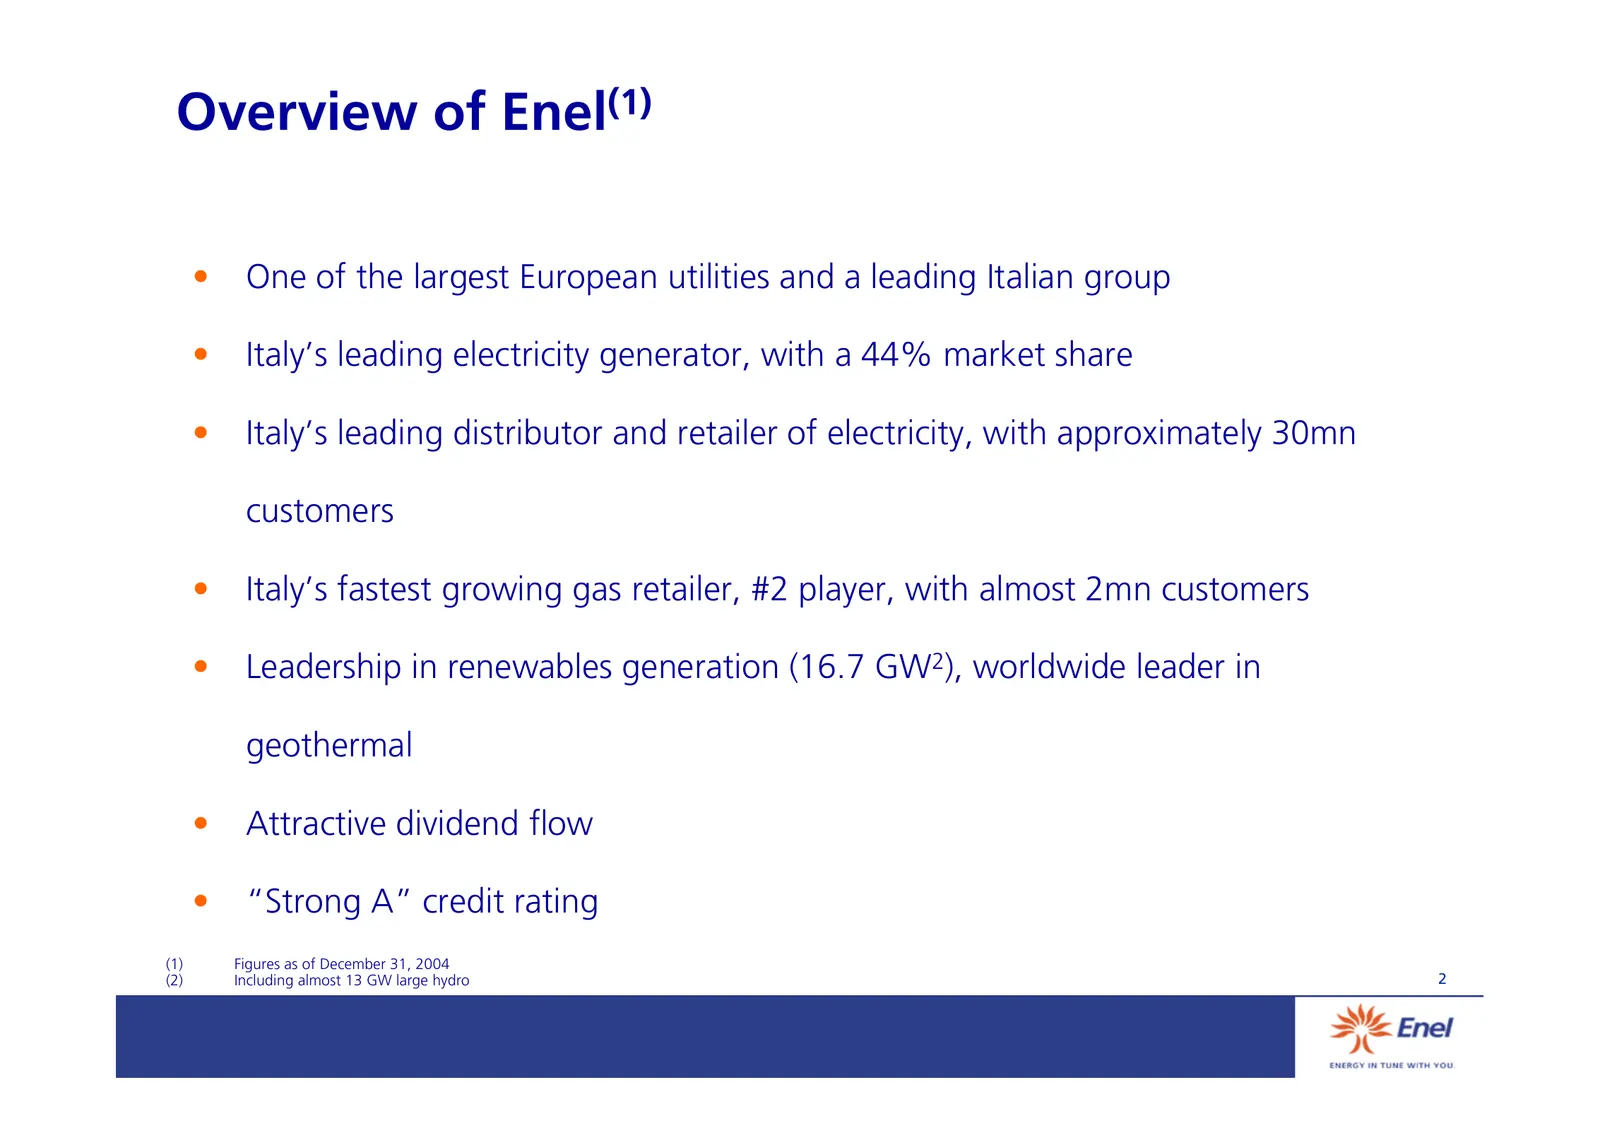
Slide 3: Overview of Enel
Overview of Enel(1) • One of the largest European utilities and a leading Italian group • Italy’s leading electricity generator, with a 44% market share • Italy’s leading distributor and retailer of electricity, with approximately 30mn customers • Italy’s fastest growing gas retailer, #2 player, wit
Slide 4: Agenda
Agenda • Group strategy • Dividends • Offer details and timetable • Q&A • Annexes 3
Slide 5: Strategic framework
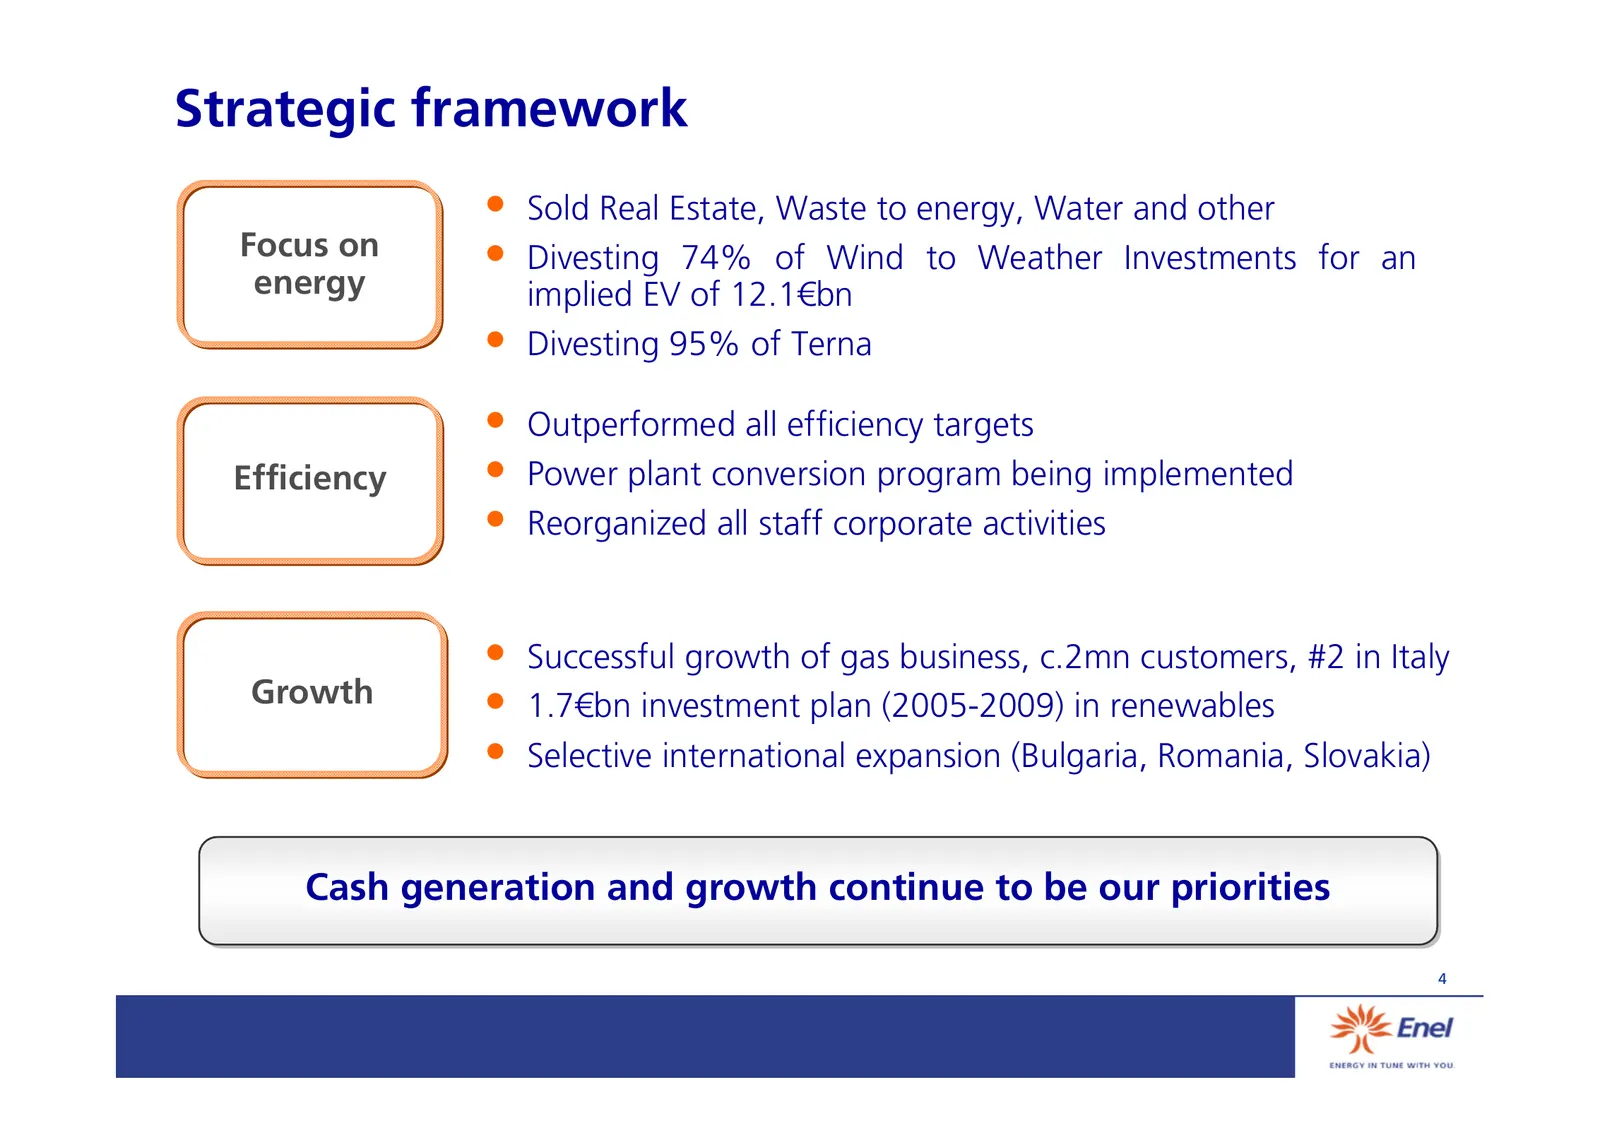
Strategic framework • Sold Real Estate, Waste to energy, Water and other Focus on • Divesting 74% of Wind to Weather Investments for an energy implied EV of 12.1€bn • Divesting 95% of Terna • Outperformed all efficiency targets Efficiency • Power plant conversion program being implemented • Reorgani
Slide 6: Focus: Wind disposal
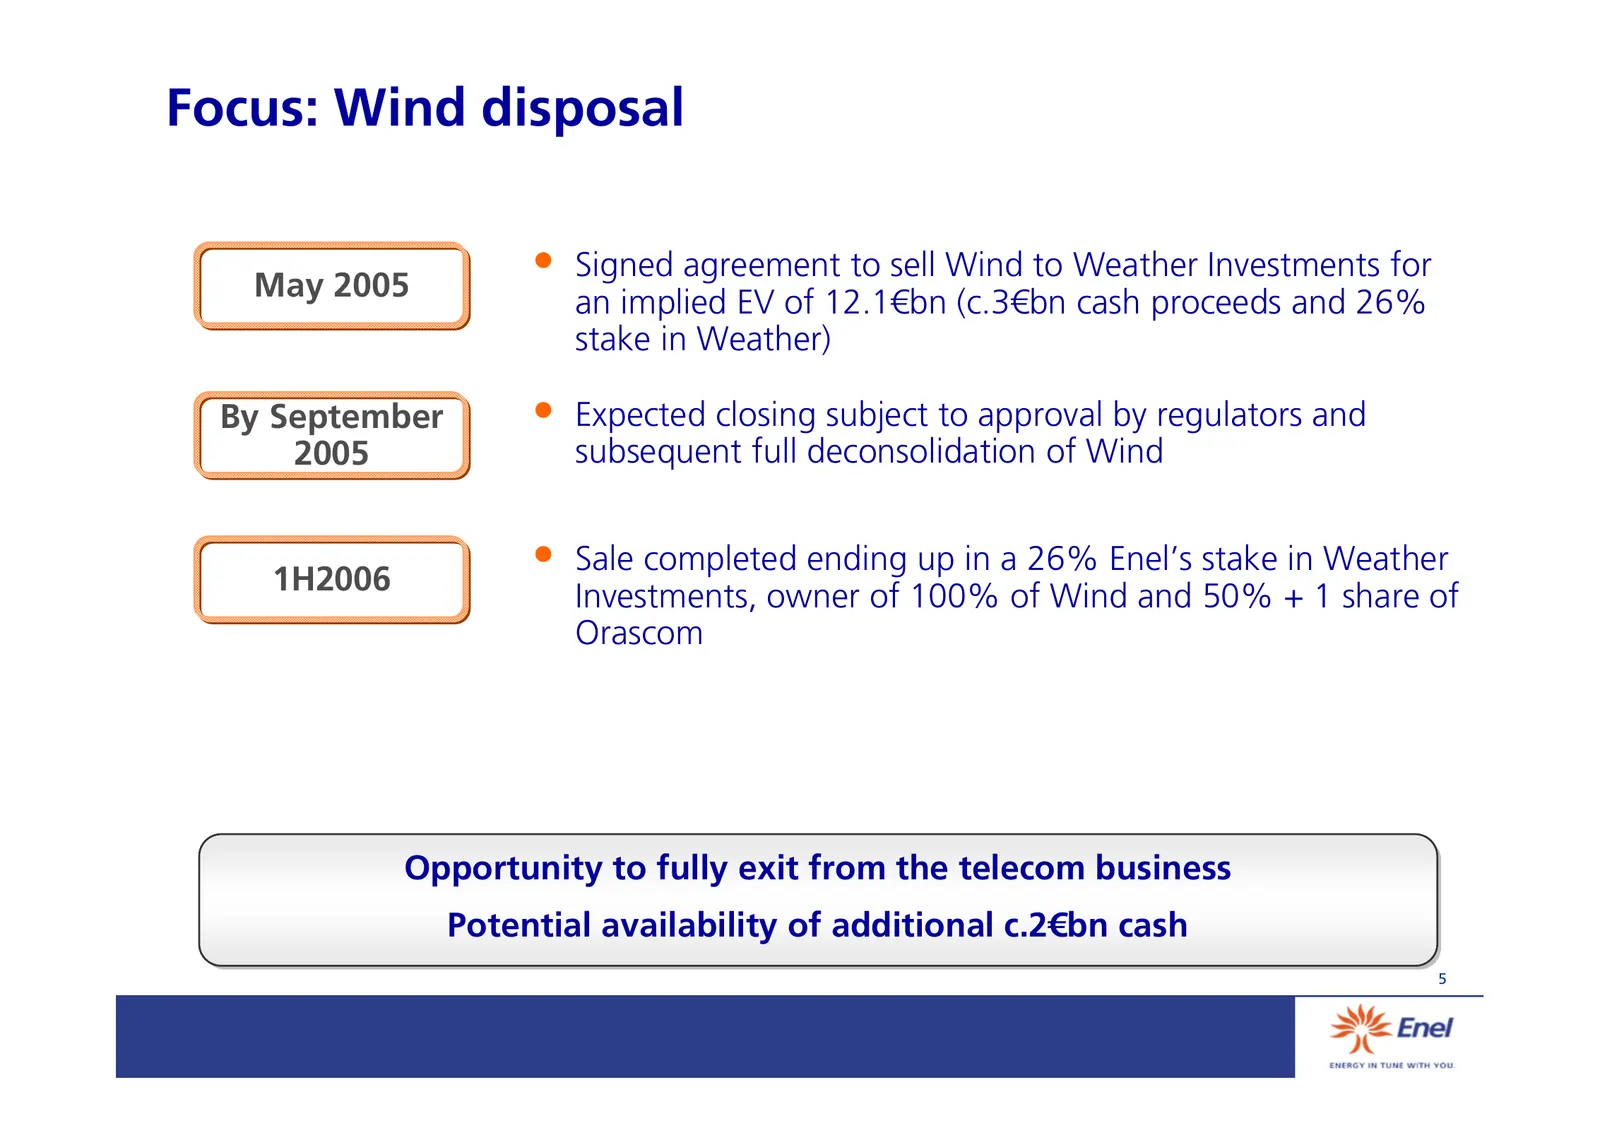
Focus: Wind disposal May 2005 • Signed agreement to sell Wind to Weather Investments for an implied EV of 12.1€bn (c.3€bn cash proceeds and 26% stake in Weather) By September • Expected closing subject to approval by regulators and 2005 subsequent full deconsolidation of Wind 1H2006 • Sale completed
Slide 7: Focus: Terna disposal
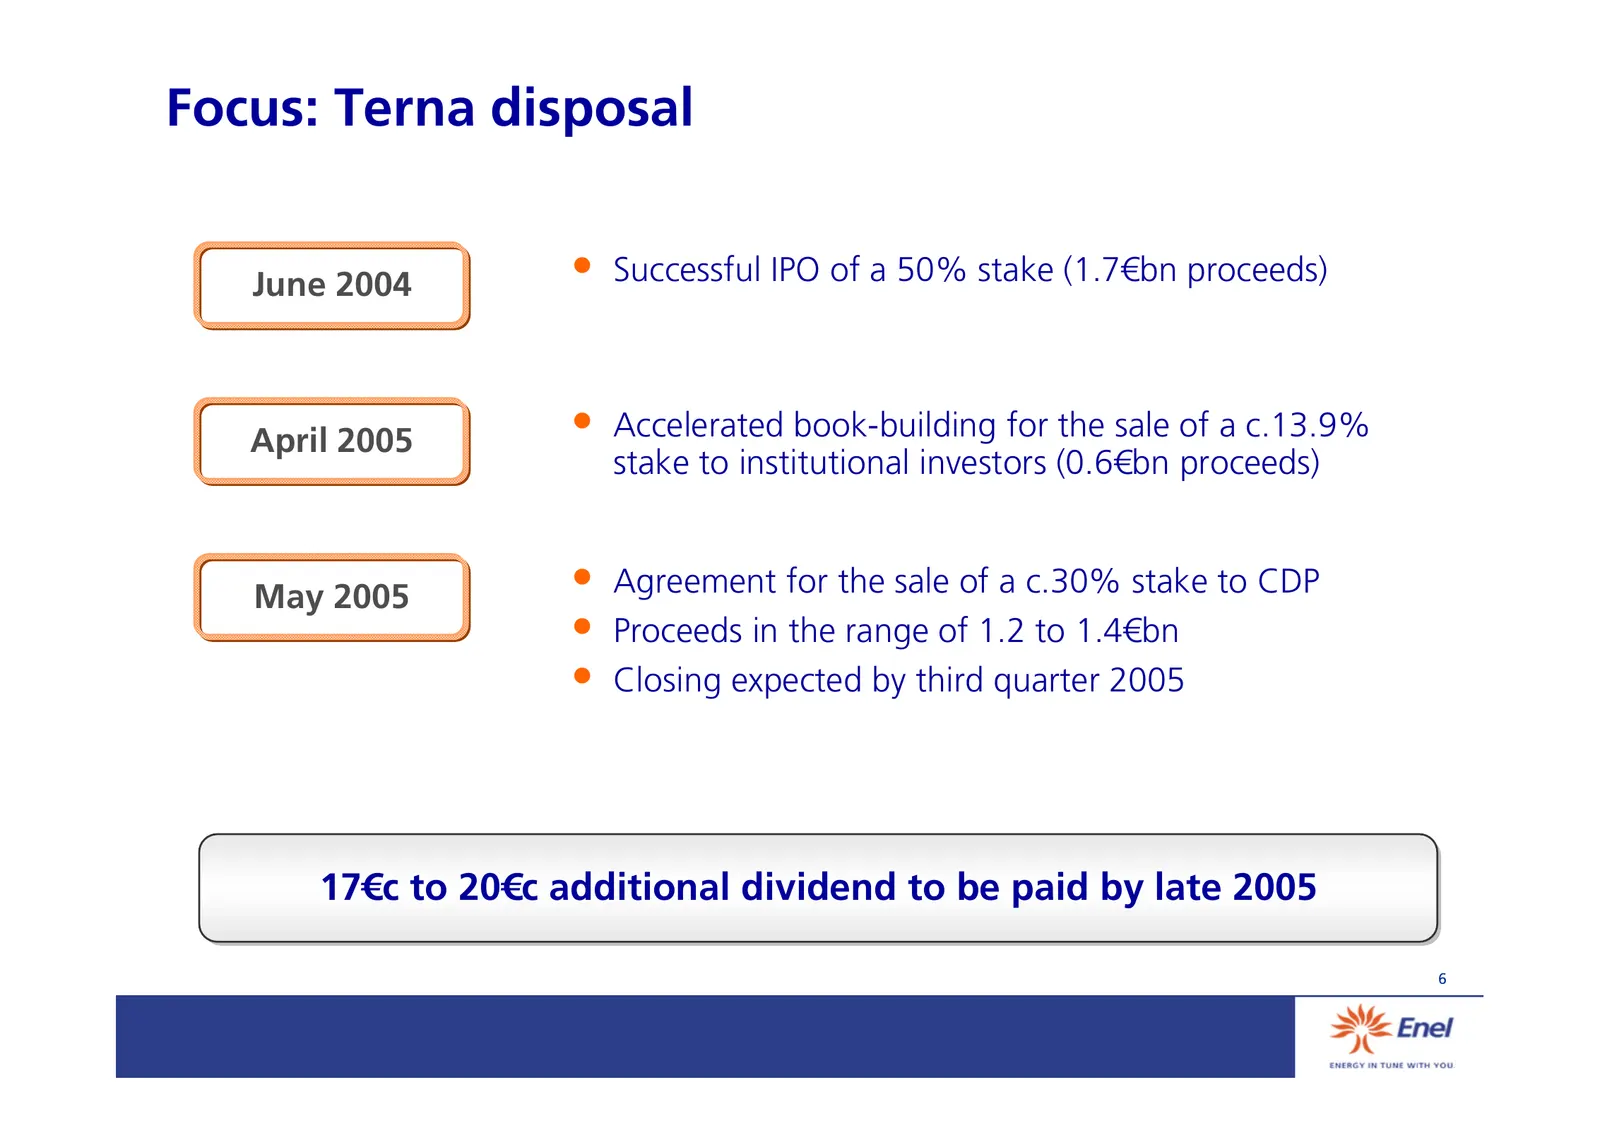
Focus: Terna disposal June 2004 • Successful IPO of a 50% stake (1.7€bn proceeds) April 2005 • Accelerated book-building for the sale of a c.13.9% stake to institutional investors (0.6€bn proceeds) May 2005 • Agreement for the sale of a c.30% stake to CDP • Proceeds in the range of 1.2 to 1.4€bn • C
Slide 8: Efficiency: generation
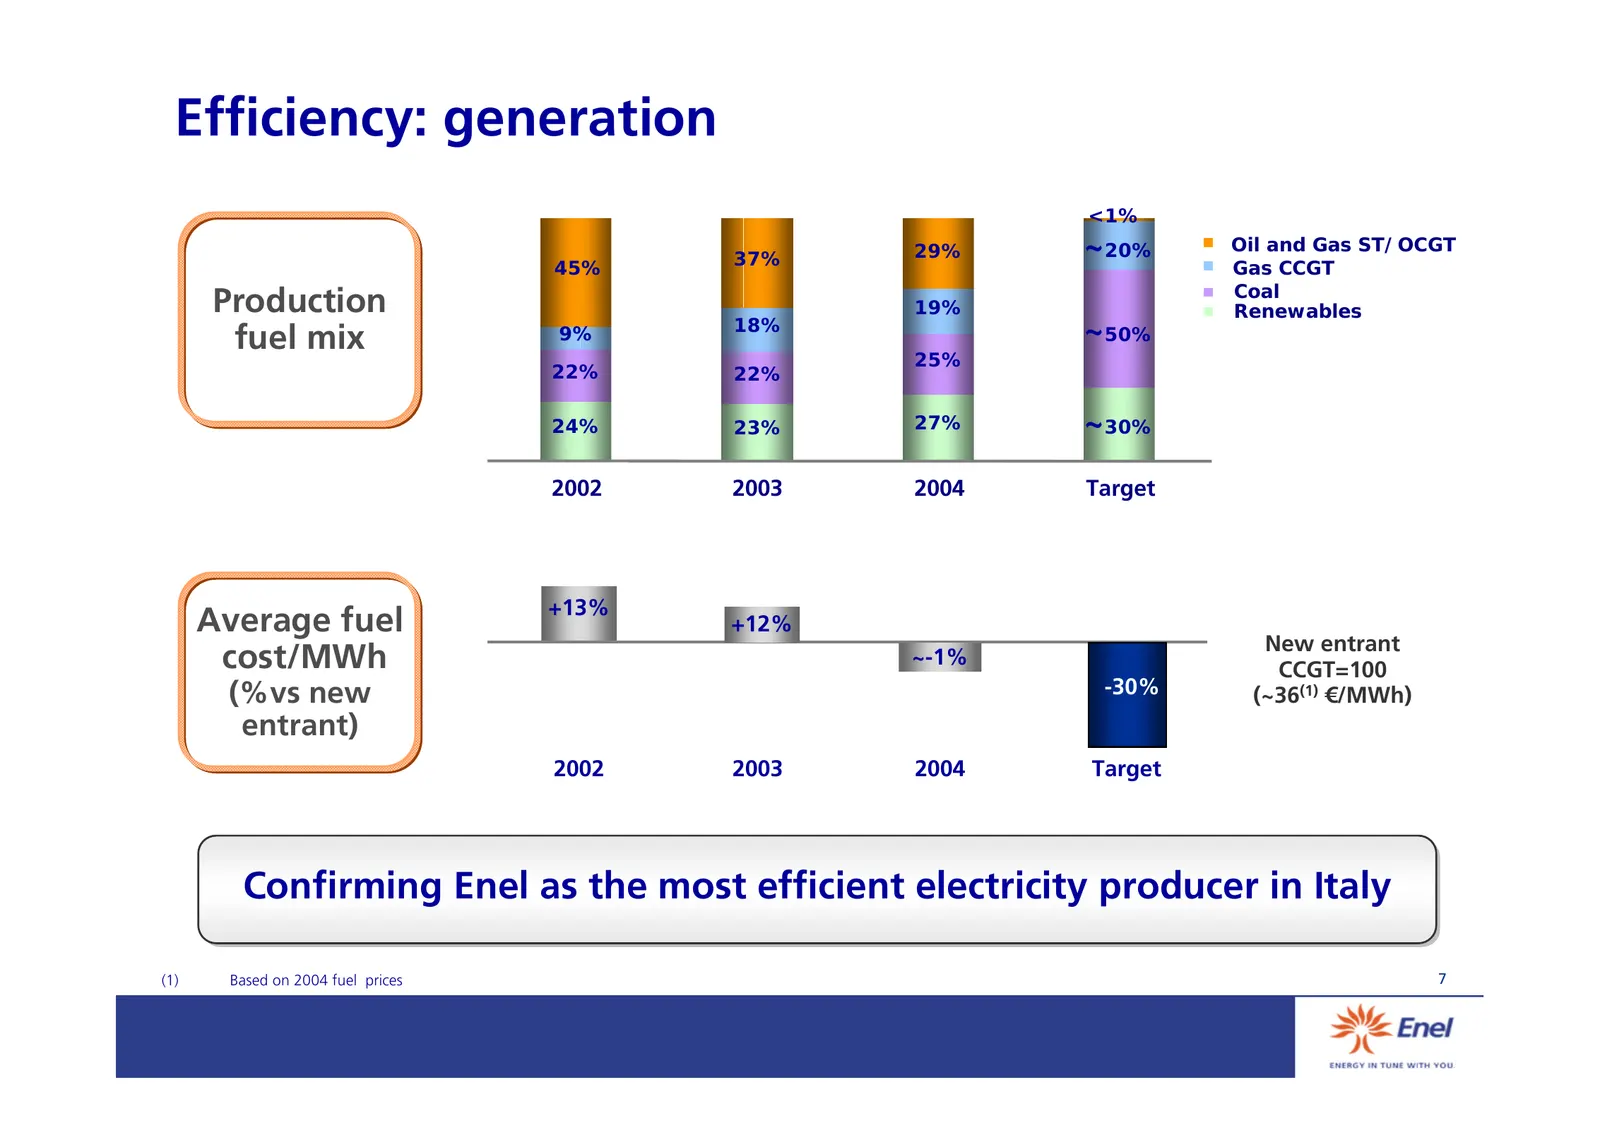
Efficiency: generation <1% 37% 29% ~20% Oil and Gas ST/OCGT 45% Gas CCGT Coal Production 19% Renewables 9% 18% ~50% fuel mix 25% 22% 22% 24% 23% 27% ~30% 2002 2003 2004 Target +13% Average fuel +12% New entrant cost/MWh ~-1% CCGT=100 (%vs new -30% (~36(1) €/MWh) entrant) 2002 2003 2004 Target Confir
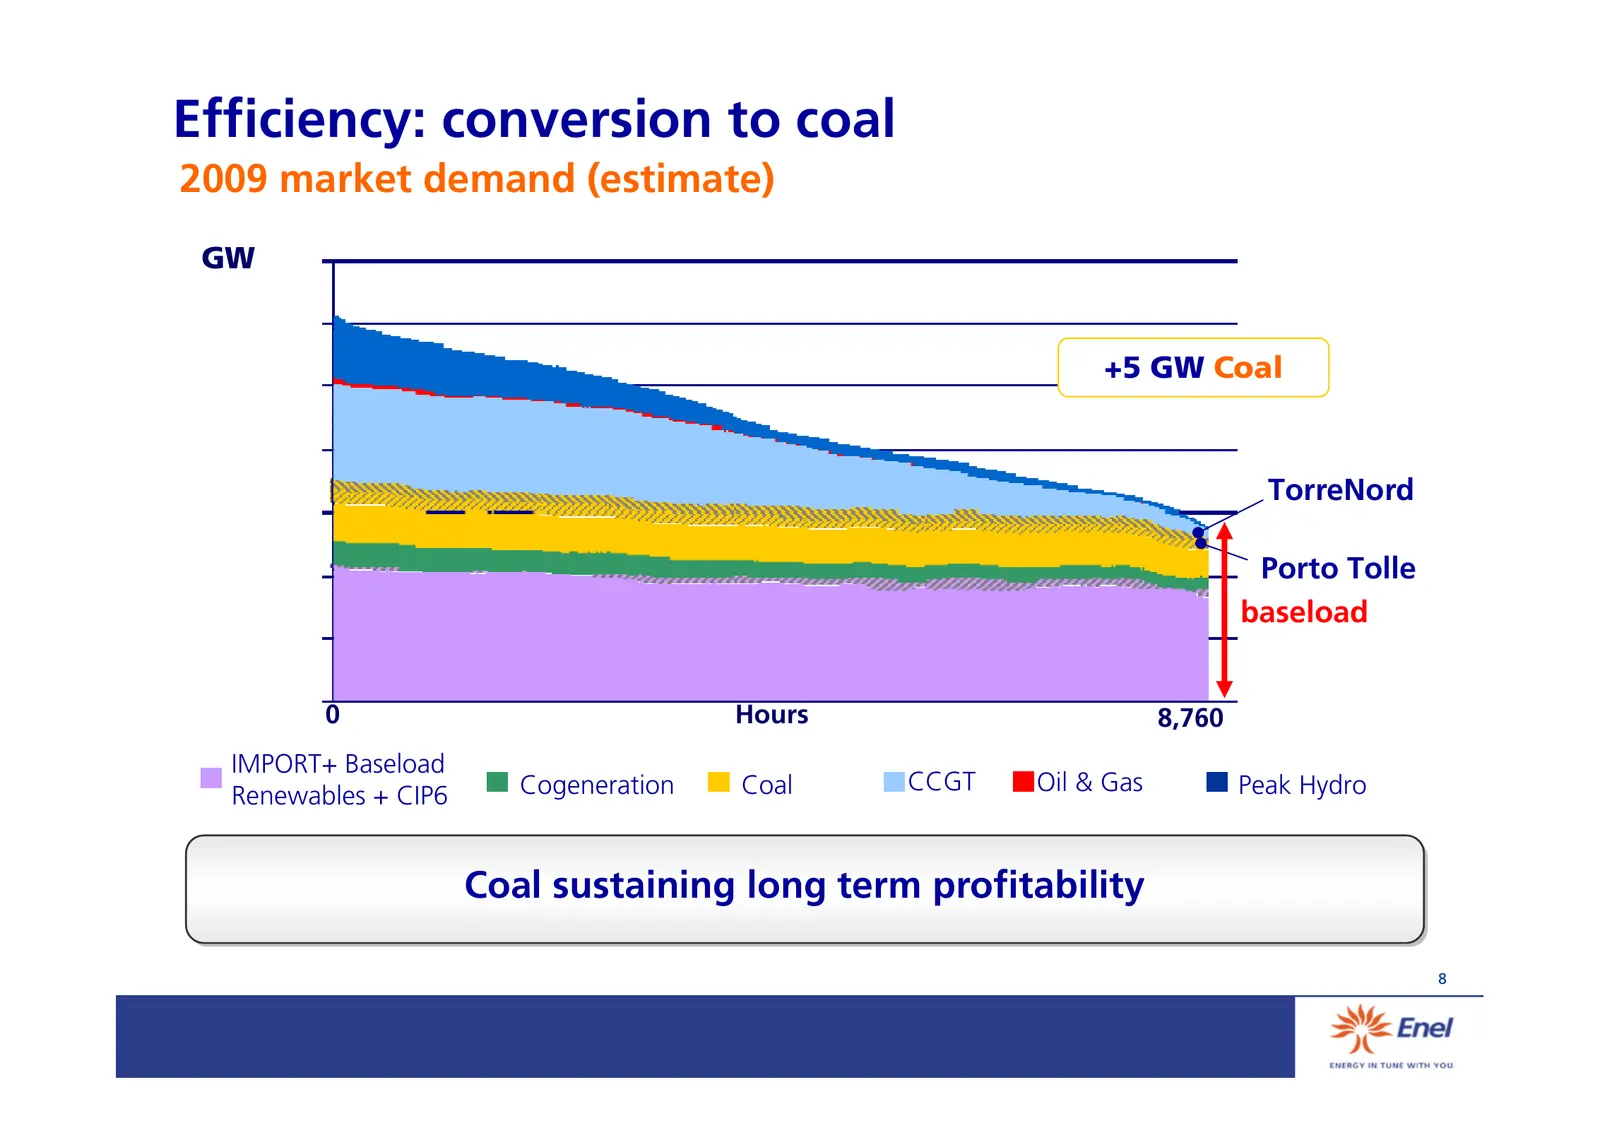
Slide 9: Efficiency: conversion to coal
Efficiency: conversion to coal 2009 market demand (estimate) GW +5 GW Coal TorreNord Porto Tolle baseload 0 Hours 8,760 IMPORT+ Baseload Cogeneration Coal CCGT Oil & Gas Peak Hydro Renewables + CIP6 Coal sustaining long term profitability 8
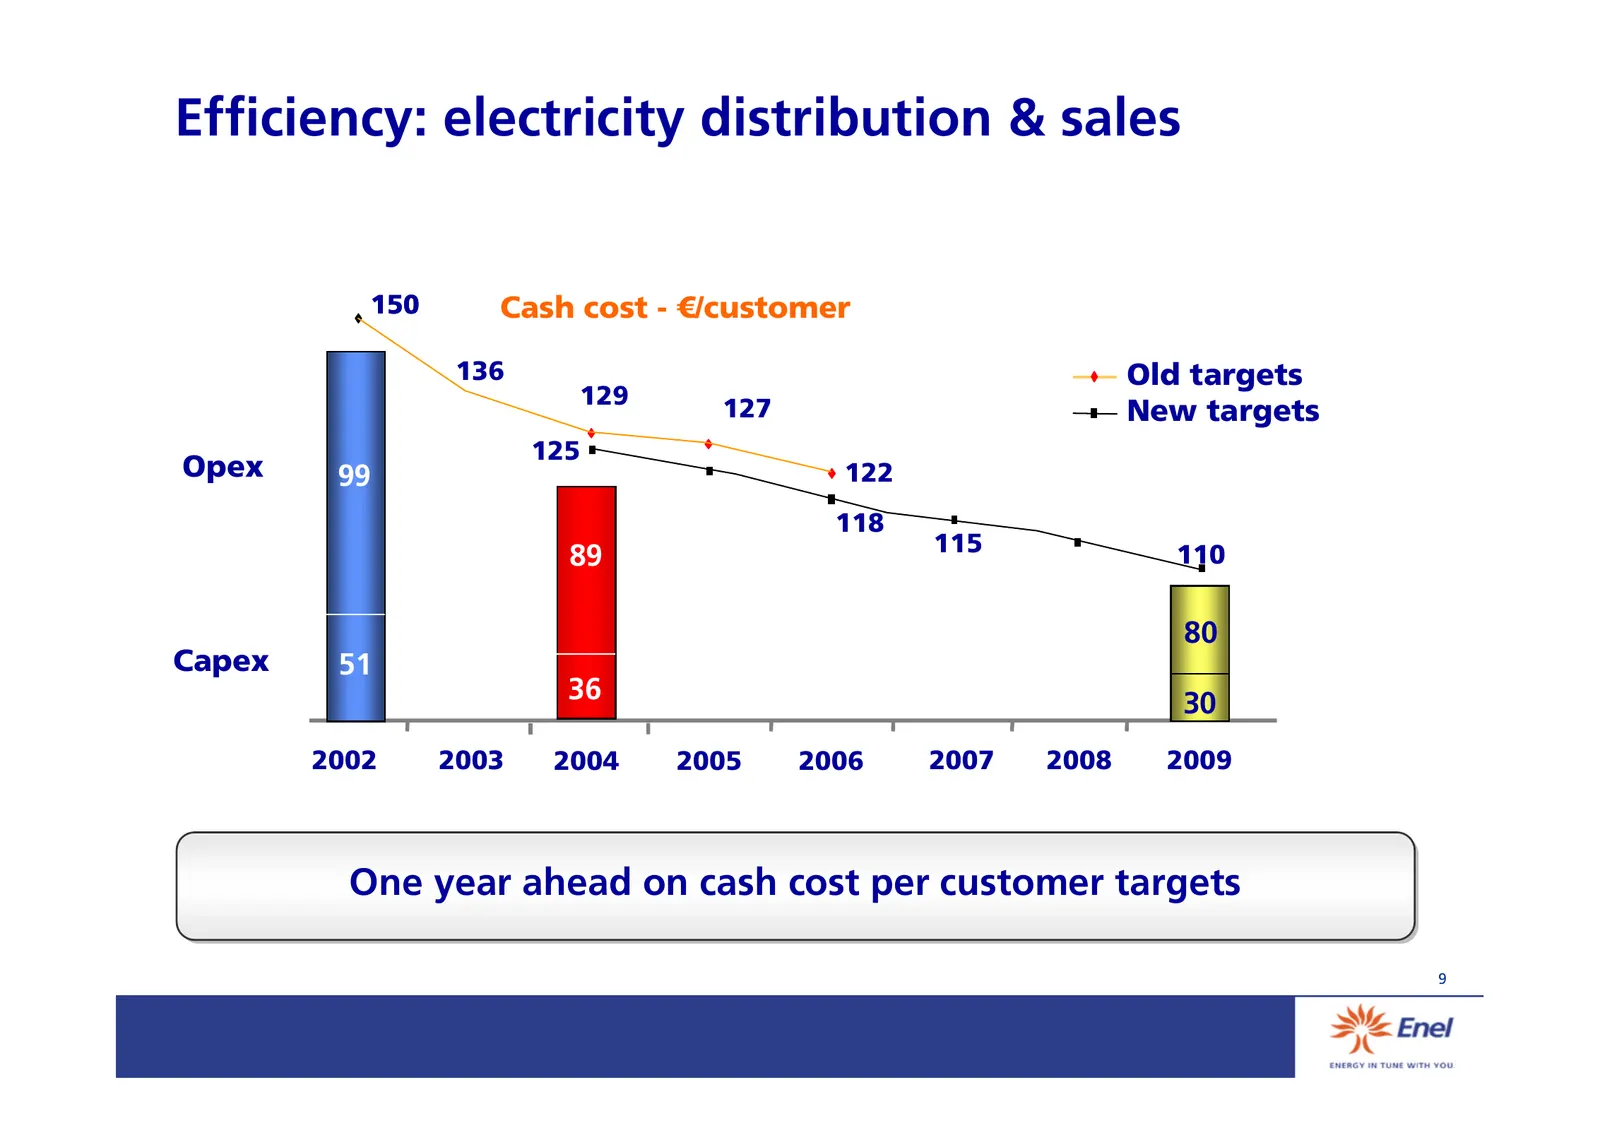
Slide 10: Efficiency: electricity distribution & sales
Efficiency: electricity distribution & sales 150 Cash cost - €/customer 136 Old targets 129 127 New targets 125 Opex 99 122 118 115 89 110 83 80 Capex 51 36 32 30 2002 2003 2004 2005 2006 2007 2008 2009 One year ahead on cash cost per customer targets 9
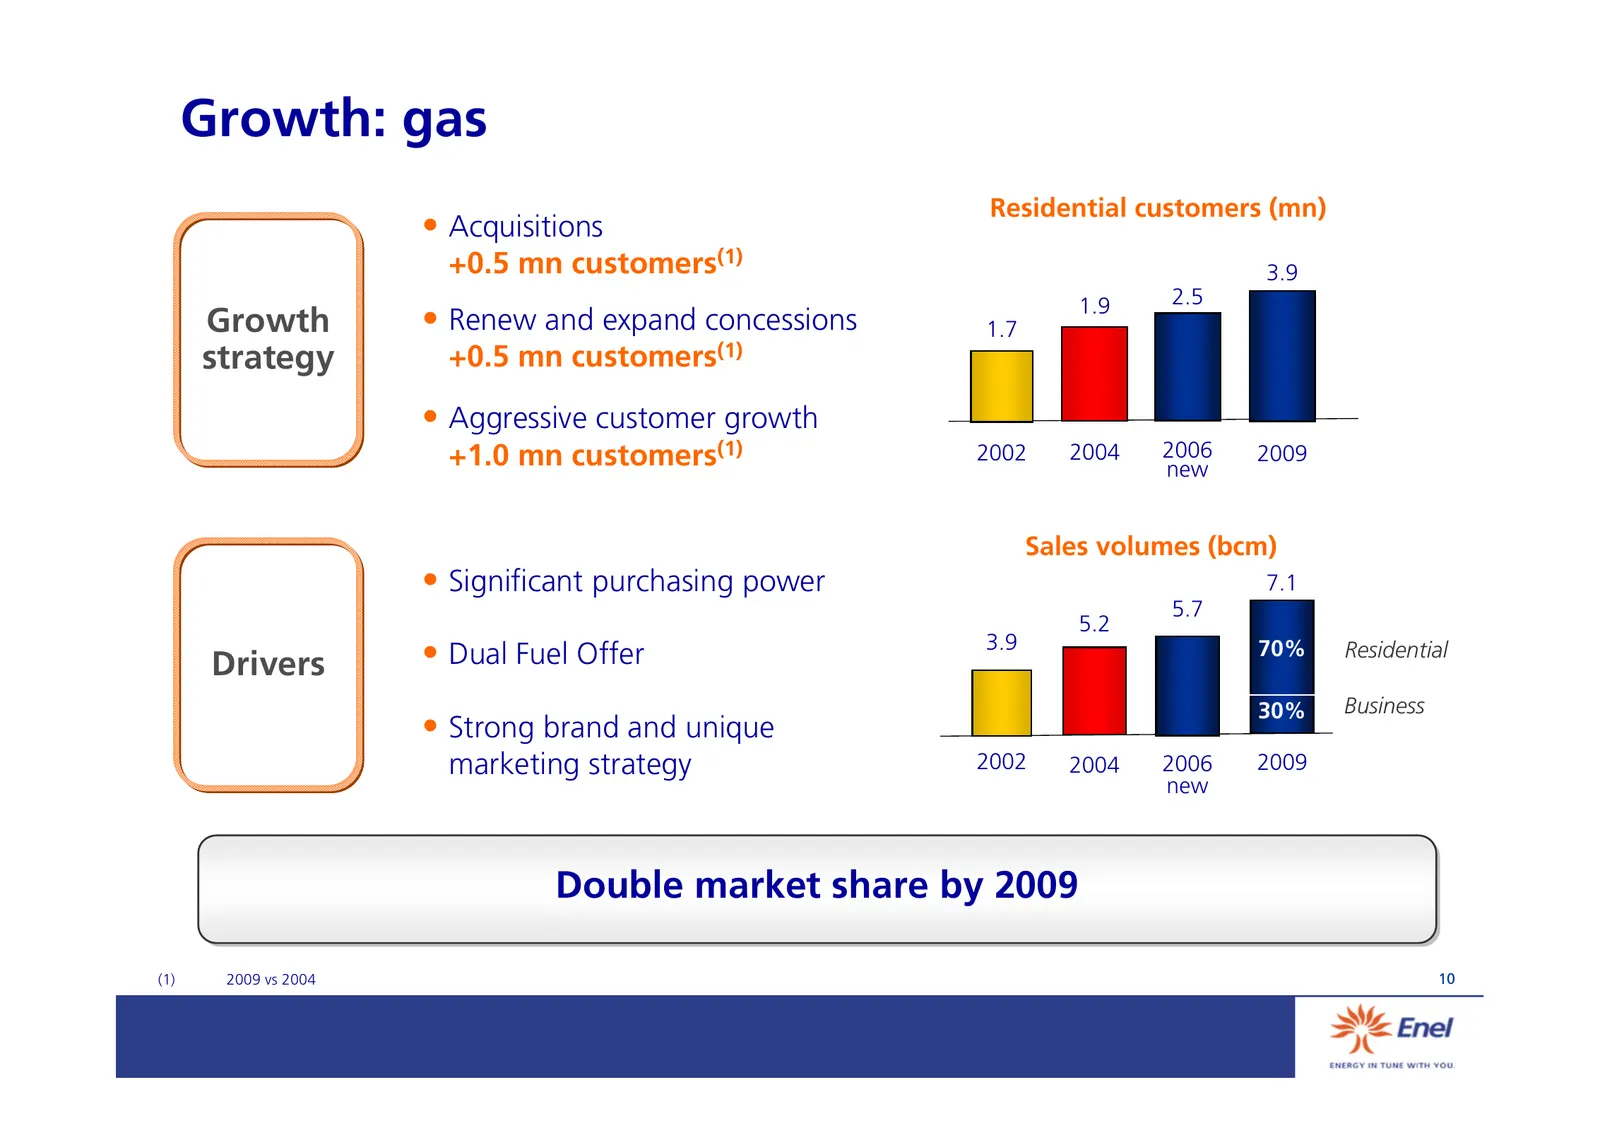
Slide 11: Growth: gas
Growth: gas Residential customers (mn) • Acquisitions +0.5 mn customers(1) 3.9 1.9 2.5 Growth • Renew and expand concessions 1.7 strategy +0.5 mn customers(1) • Aggressive customer growth +1.0 mn customers(1) 2002 2004 2006 new 2009 Sales volumes (bcm) • Significant purchasing power 7.1 5.7 5.2 3.9
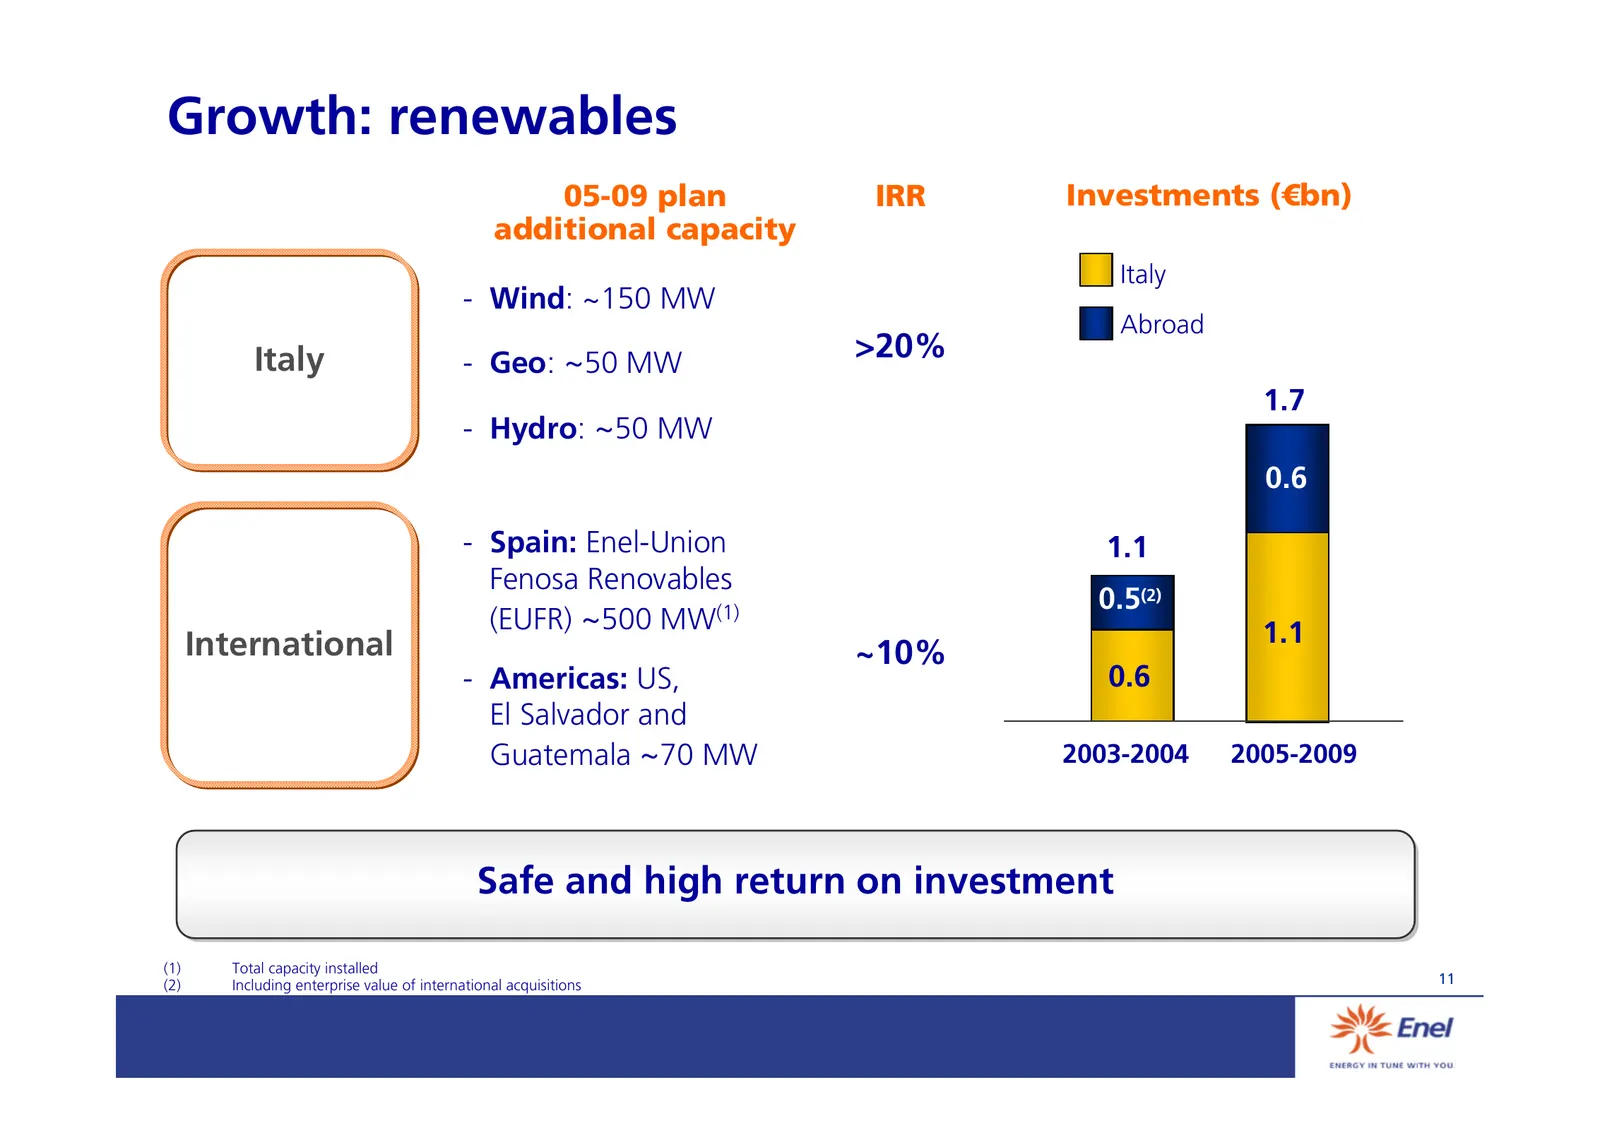
Slide 12: Growth: renewables
Growth: renewables 05-09 plan IRR Investments (€bn) additional capacity Italy - Wind: ~150 MW Abroad Italy - Geo: ~50 MW >20% 1.7 - Hydro: ~50 MW 0.6 - Spain: Enel-Union 1.1 Fenosa Renovables 0.5(2) (EUFR) ~500 MW(1) 1.1 International ~10% - Americas: US, 0.6 El Salvador and Guatemala ~70 MW 2003-20
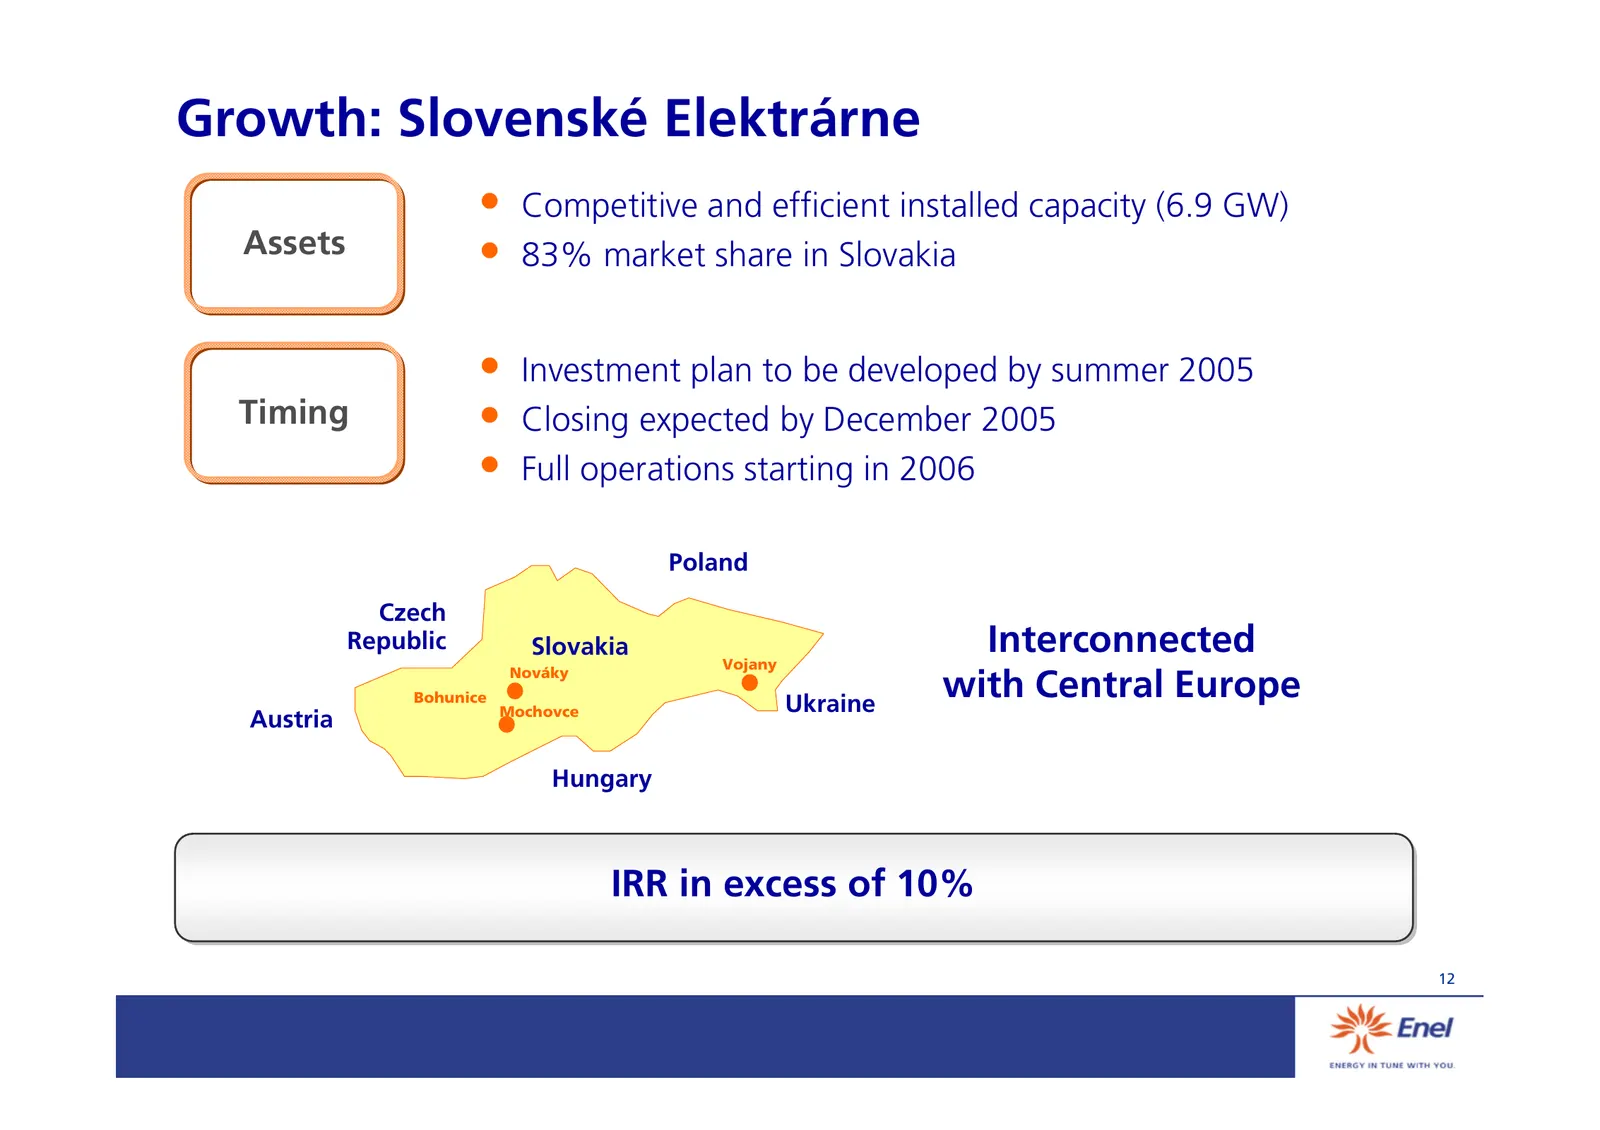
Slide 13: Growth: Slovenské Elektrárne
Growth: Slovenské Elektrárne • Competitive and efficient installed capacity (6.9 GW) Assets • 83% market share in Slovakia • Investment plan to be developed by summer 2005 Timing • Closing expected by December 2005 • Full operations starting in 2006 Poland Czech Republic Slovakia Vojany Interconnect
Slide 14: Agenda
Agenda • Group strategy • Dividends • Offer details and timetable • Q&A • Annexes 13
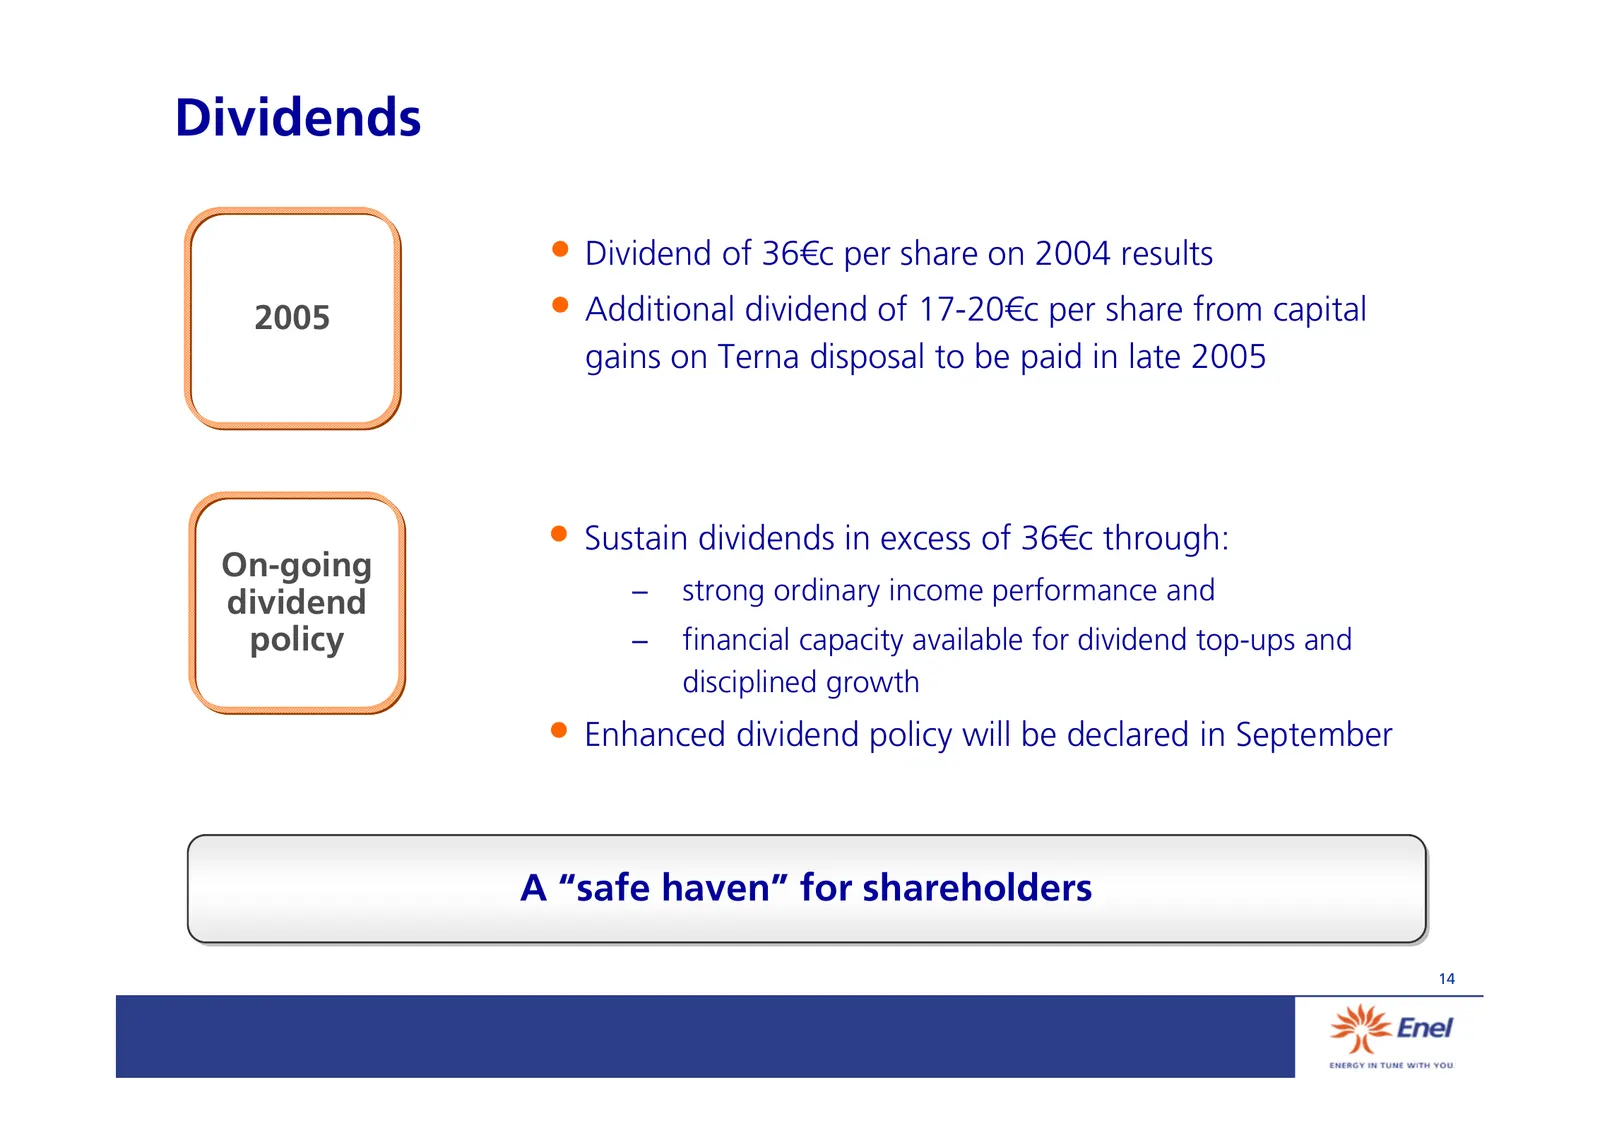
Slide 15: Dividends
Dividends • Dividend of 36€c per share on 2004 results 2005 • Additional dividend of 17-20€c per share from capital gains on Terna disposal to be paid in late 2005 • Sustain dividends in excess of 36€c through: On-going dividend strong ordinary income performance and policy financial capacity av
Slide 16: Agenda
Agenda • Group strategy • Dividends • Offer details and timetable • Q&A • Annexes 15
Slide 17: Offer details and timetable
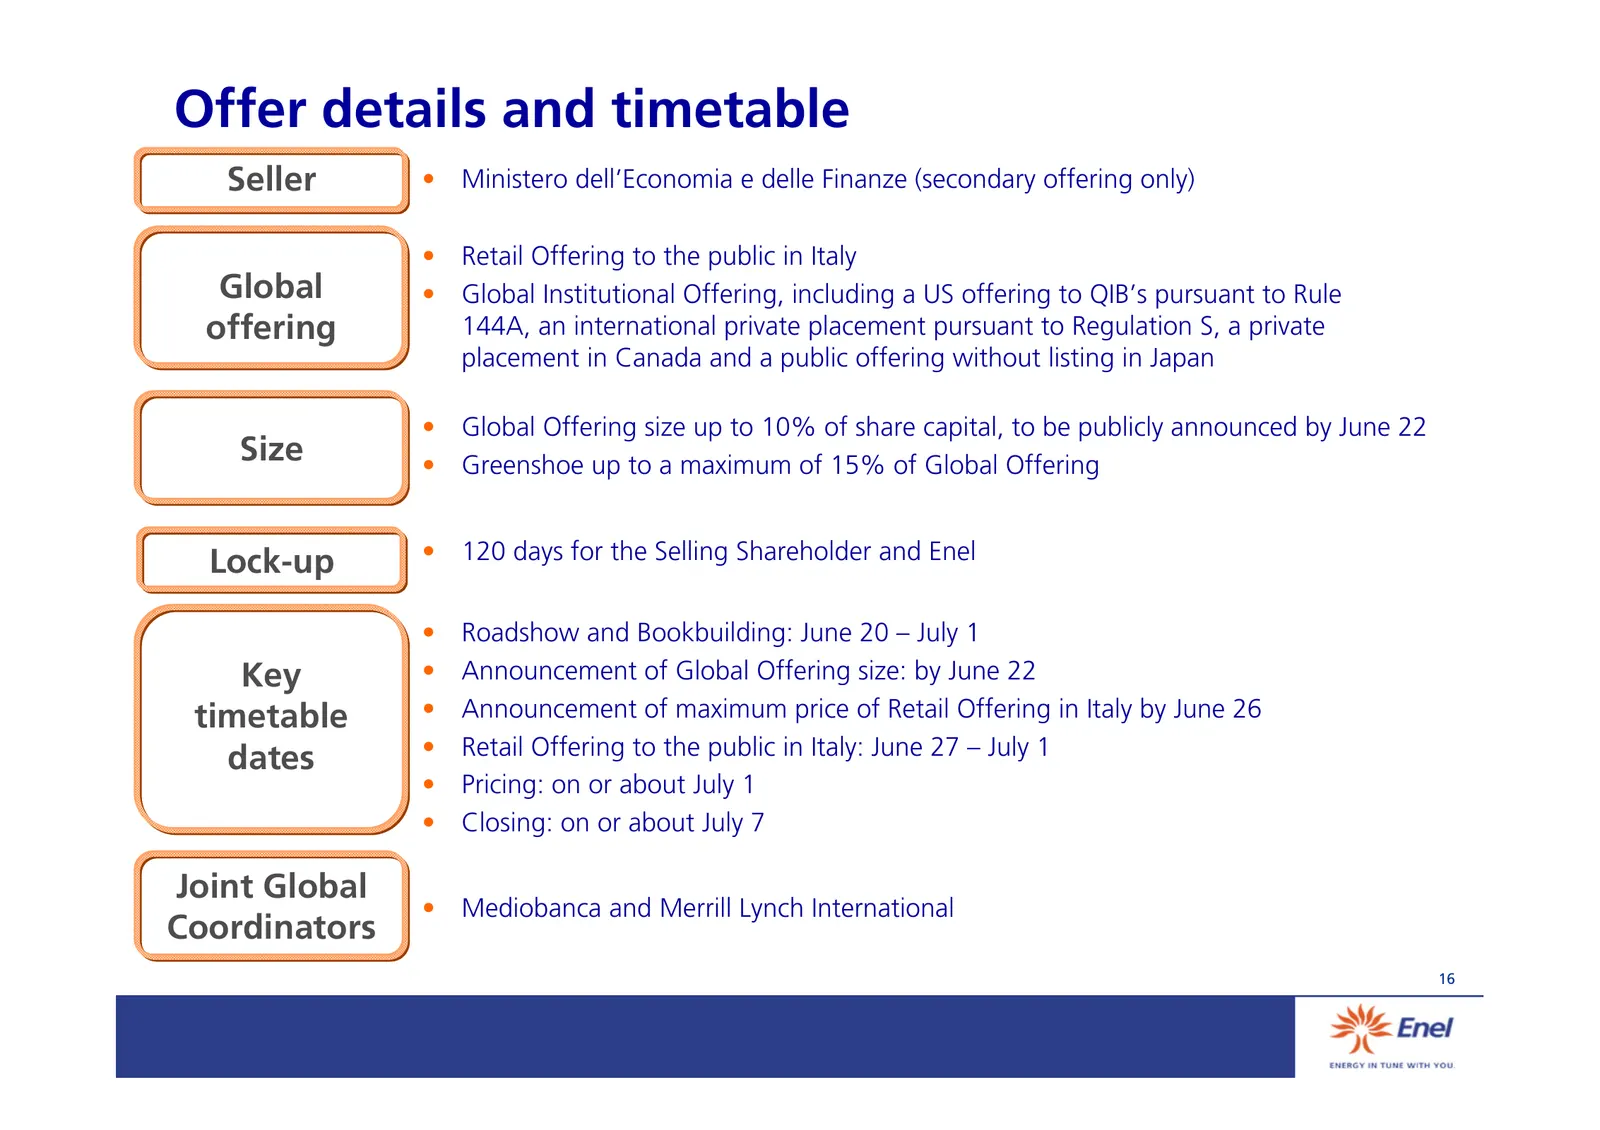
Offer details and timetable Seller • Ministero dell’Economia e delle Finanze (secondary offering only) • Retail Offering to the public in Italy Global • Global Institutional Offering, including a US offering to QIB’s pursuant to Rule offering 144A, an international private placement pursuant to Regu
Slide 18: Agenda
Agenda • Group strategy • Dividends • Offer details and timetable • Q&A • Annexes 17
Slide 19: Agenda
Agenda • Group strategy • Dividends • Offer details and timetable • Q&A • Annexes 18
Slide 20: Financial Annexes 2004 Results
Financial Annexes 2004 Results(1) (1) Both consolidated and pro-forma results are according to Italian GAAP 19
Slide 21: Income statement
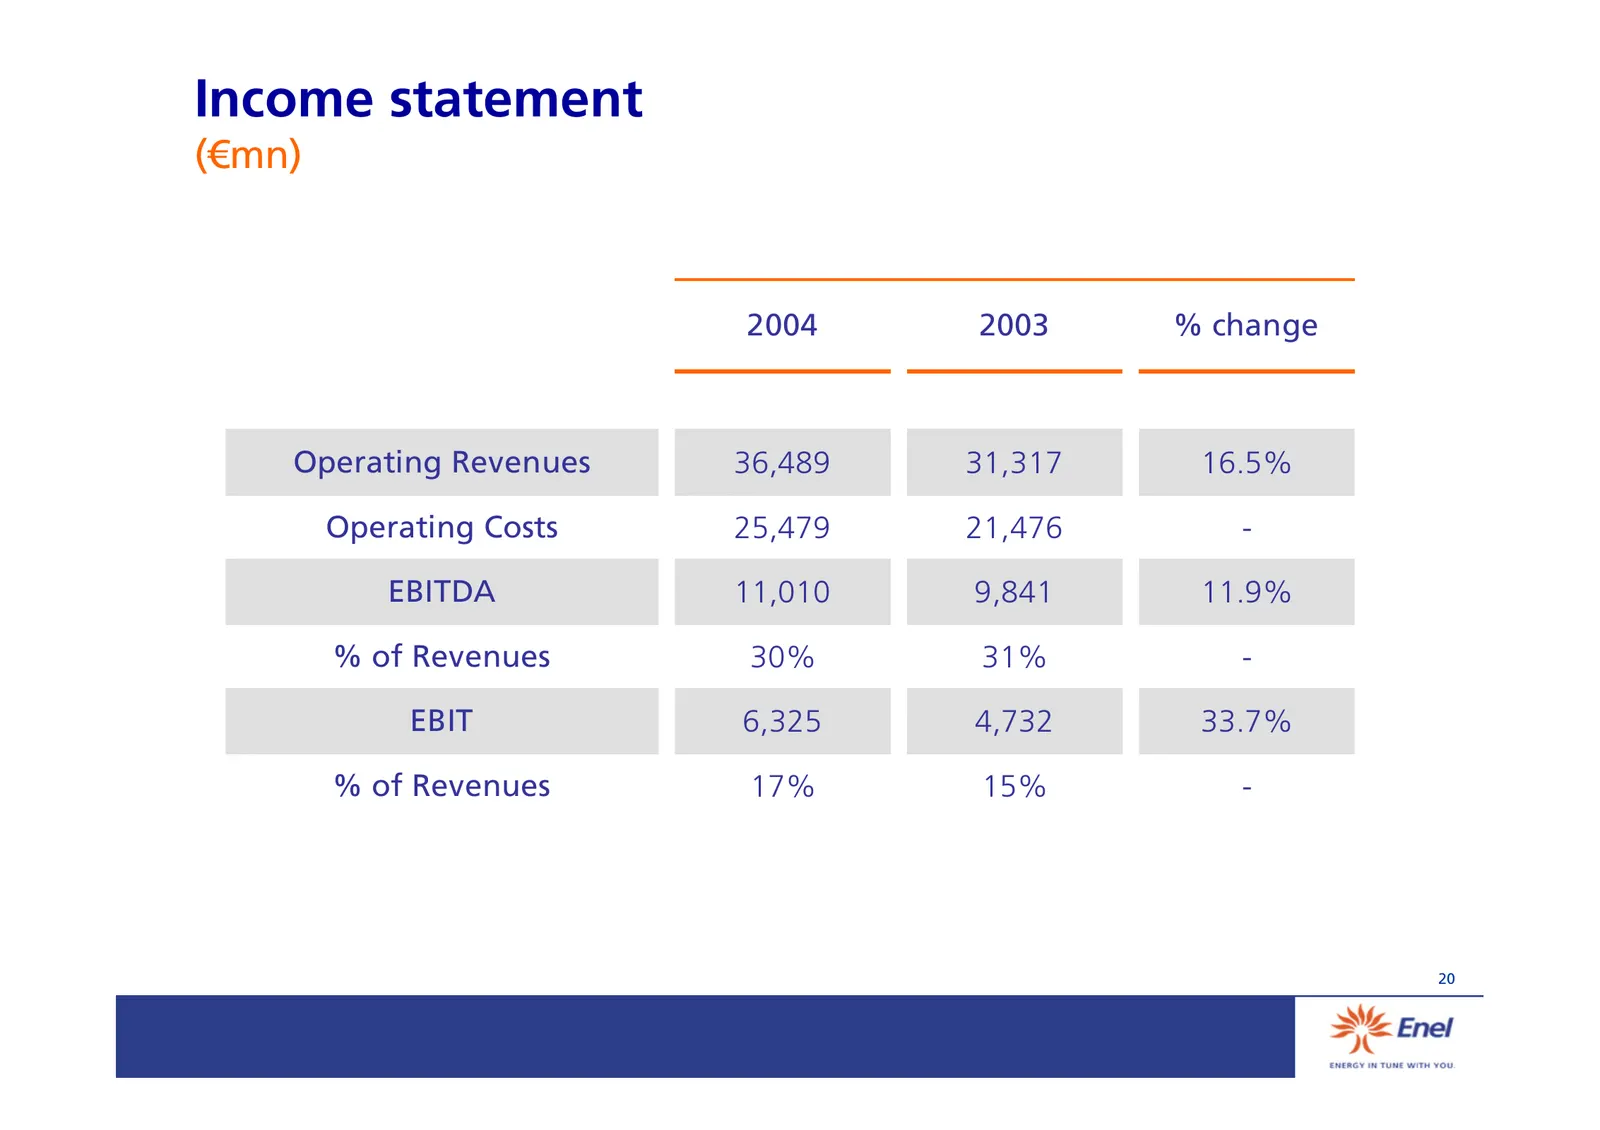
Income statement (€mn) 2004 2003 % change Operating Revenues 36,489 31,317 16.5% Operating Costs 25,479 21,476 - EBITDA 11,010 9,841 11.9% % of Revenues 30% 31% - EBIT 6,325 4,732 33.7% % of Revenues 17% 15% - 20
Slide 22: From EBIT to EPS
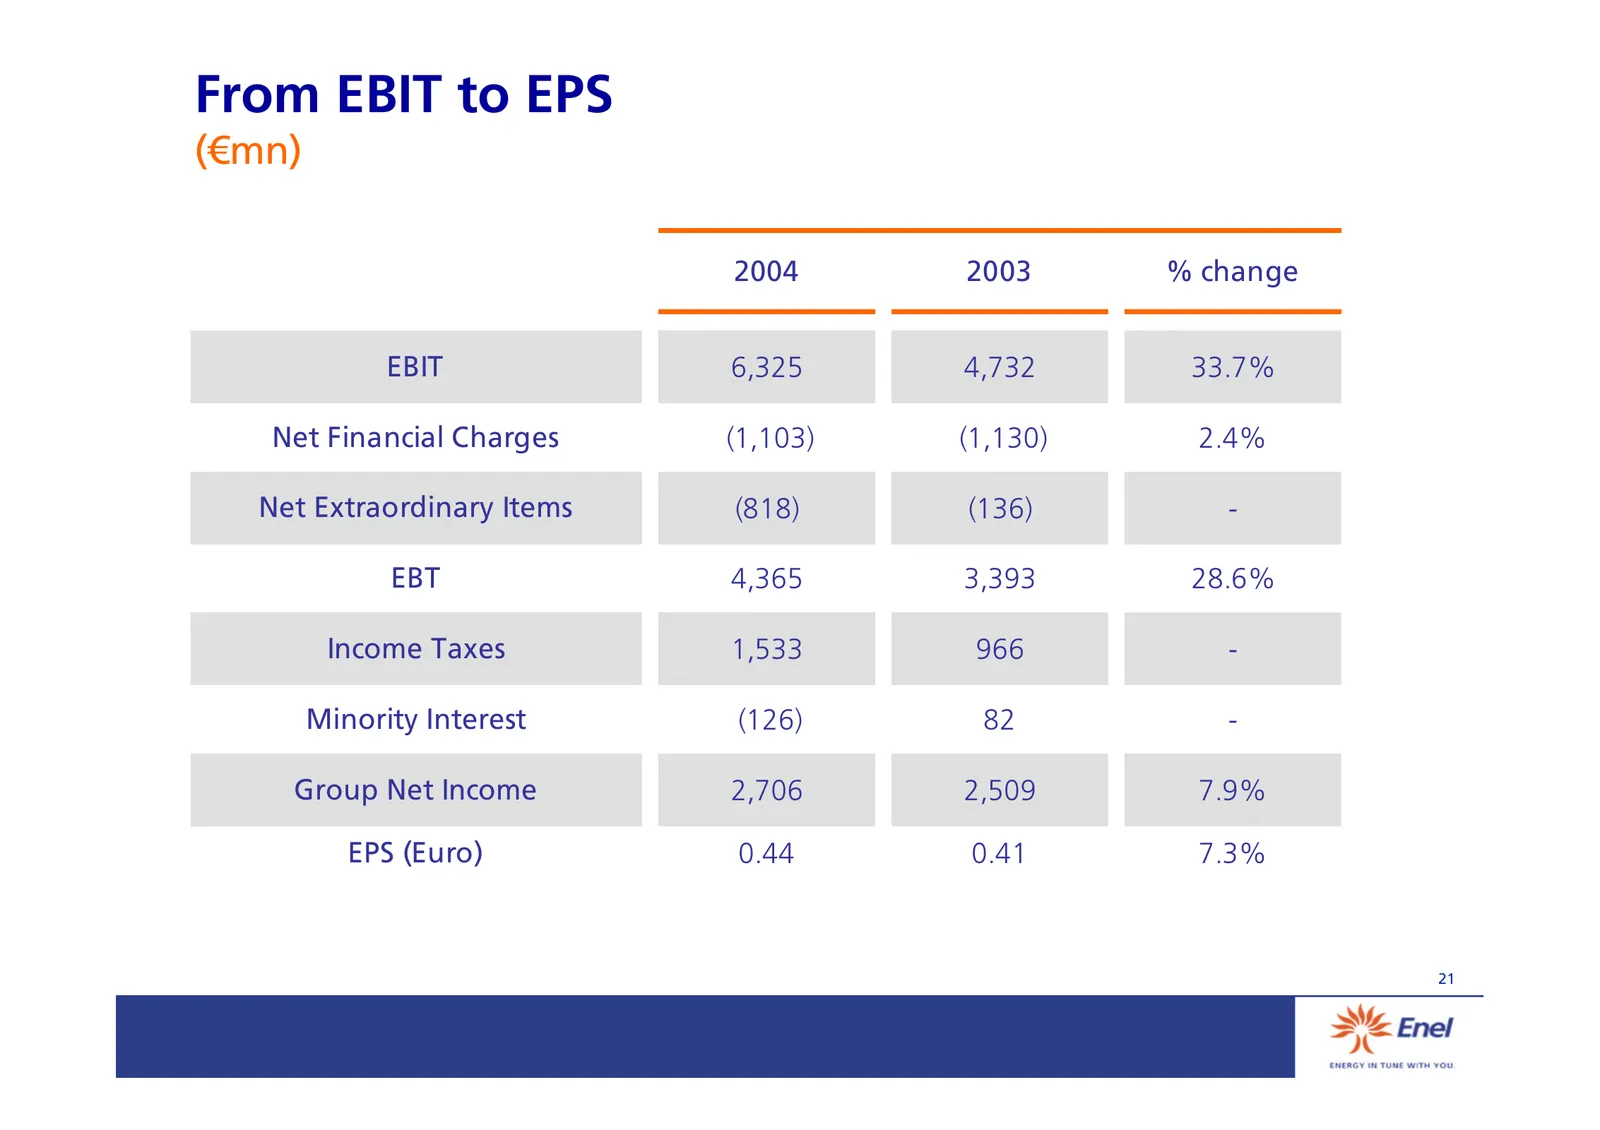
From EBIT to EPS (€mn) 2004 2003 % change EBIT 6,325 4,732 33.7% Net Financial Charges (1,103) (1,130) 2.4% Net Extraordinary Items (818) (136) - EBT 4,365 3,393 28.6% Income Taxes 1,533 966 - Minority Interest (126) 82 - Group Net Income 2,706 2,509 7.9% EPS (Euro) 0.44 0.41 7.3% 21
Slide 23: Proforma income statement
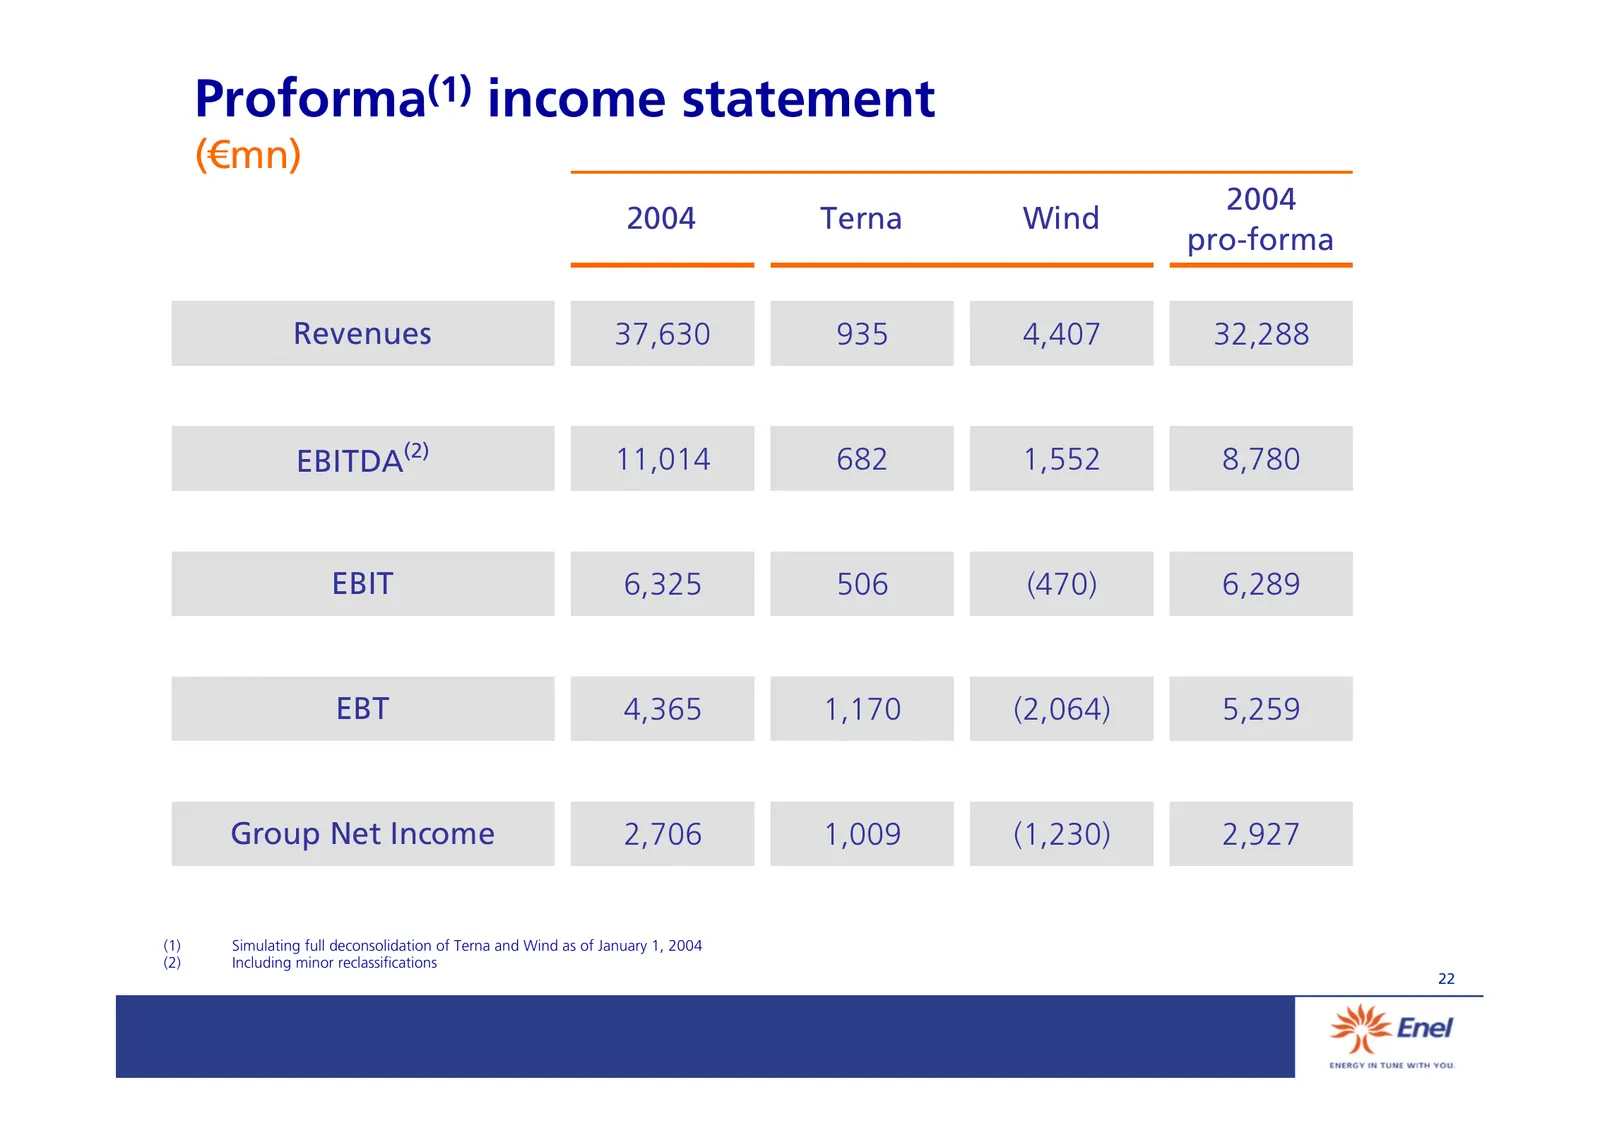
Proforma(1) income statement (€mn) 2004 2004 Terna Wind pro-forma Revenues 37,630 935 4,407 32,288 EBITDA(2) 11,014 682 1,552 8,780 EBIT 6,325 506 (470) 6,289 EBT 4,365 1,170 (2,064) 5,259 Group Net Income 2,706 1,009 (1,230) 2,927 (1) Simulating full deconsolidation of Terna and Wind as of January
Slide 24: Proforma balance sheet
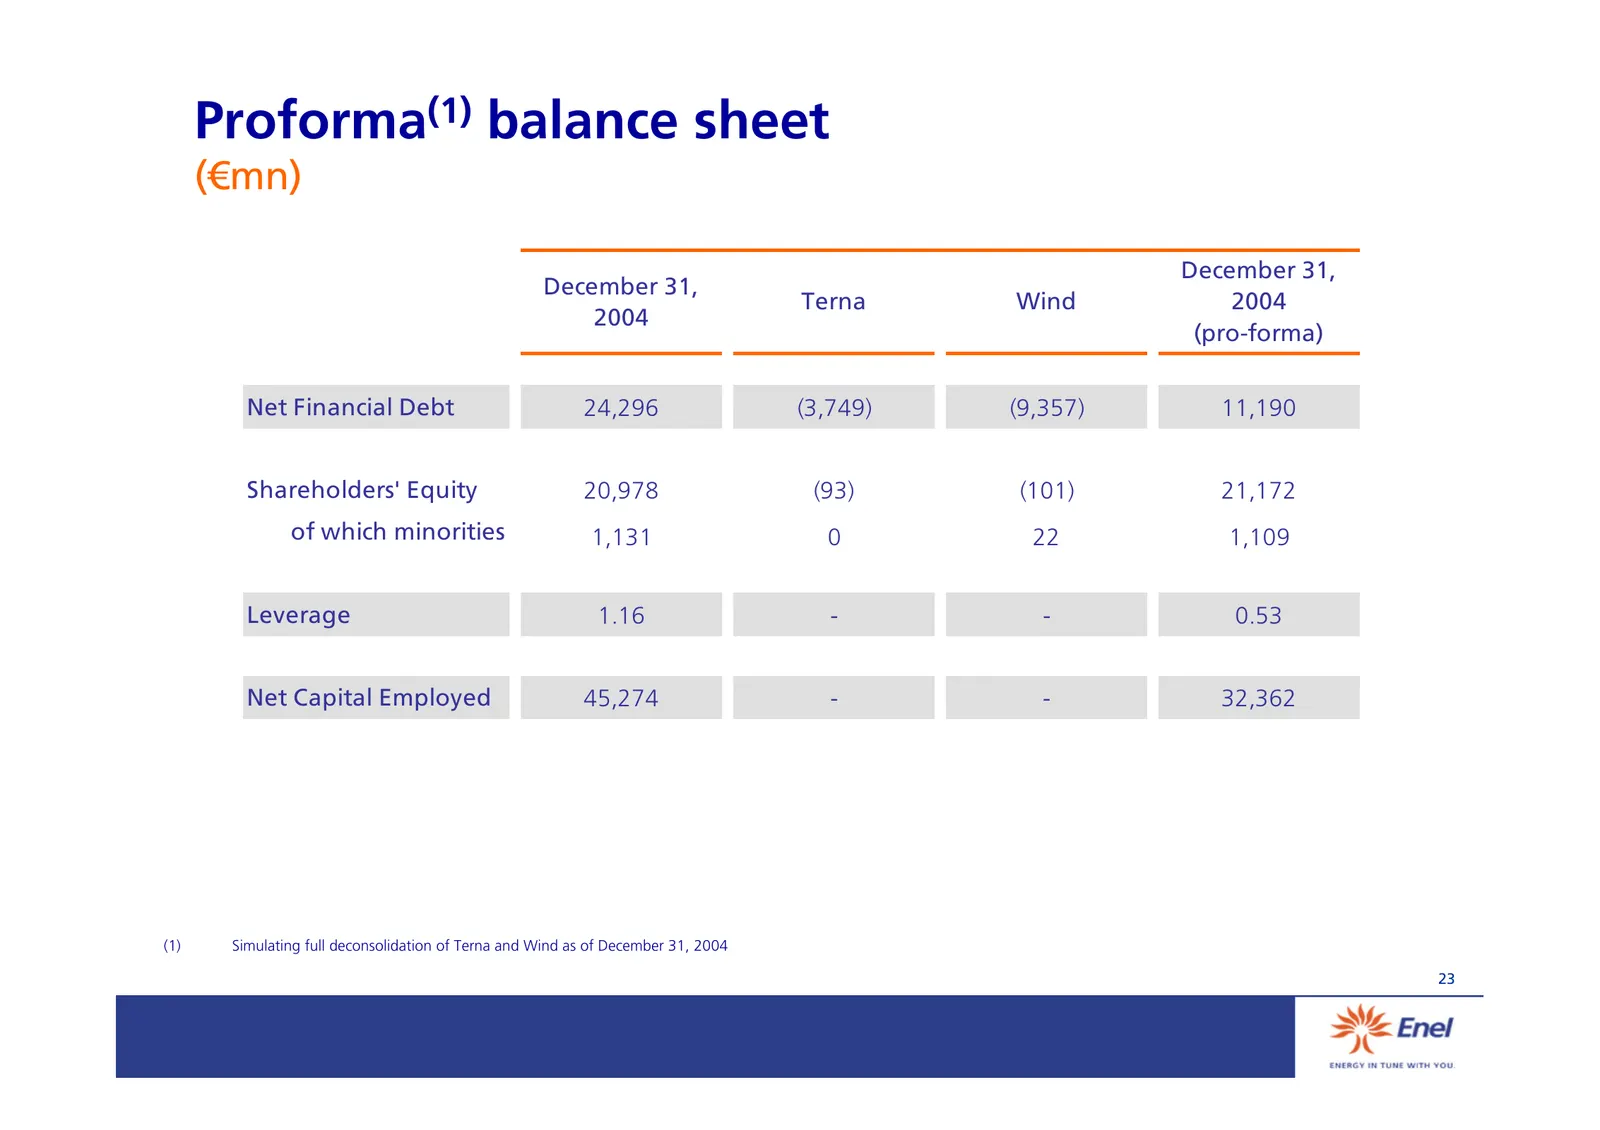
Proforma(1) balance sheet (€mn) December 31, December 31, Terna Wind 2004 2004 (pro-forma) Net Financial Debt 24,296 (3,749) (9,357) 11,190 Shareholders' Equity 20,978 (93) (101) 21,172 of which minorities 1,131 0 22 1,109 Leverage 1.16 - - 0.53 Net Capital Employed 45,274 - - 32,362 (1) Simulating
Slide 25: EBIT by business area
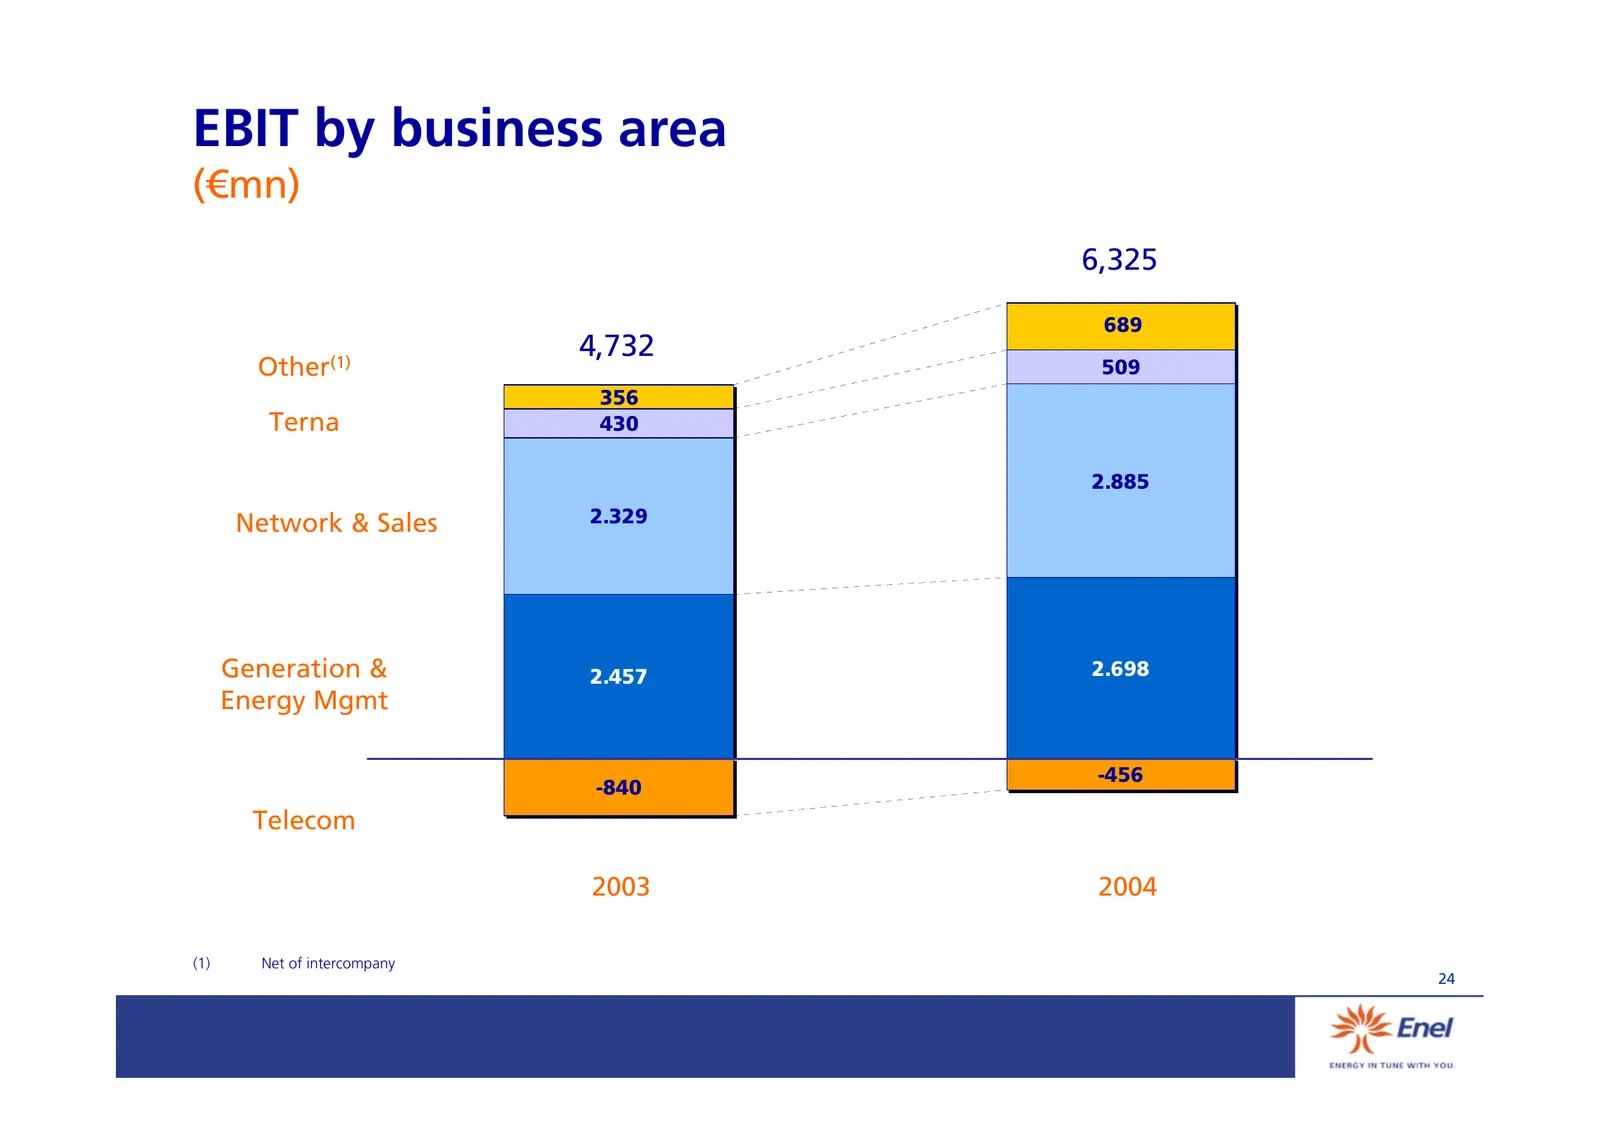
EBIT by business area (€mn) 6,325 689 4,732 Other(1) 509 356 Terna 430 2.885 Network & Sales 2.329 Generation & 2.457 2.698 Energy Mgmt -456 -840 Telecom 2003 2004 (1) Net of intercompany 24
Slide 26: Generation & Energy Management
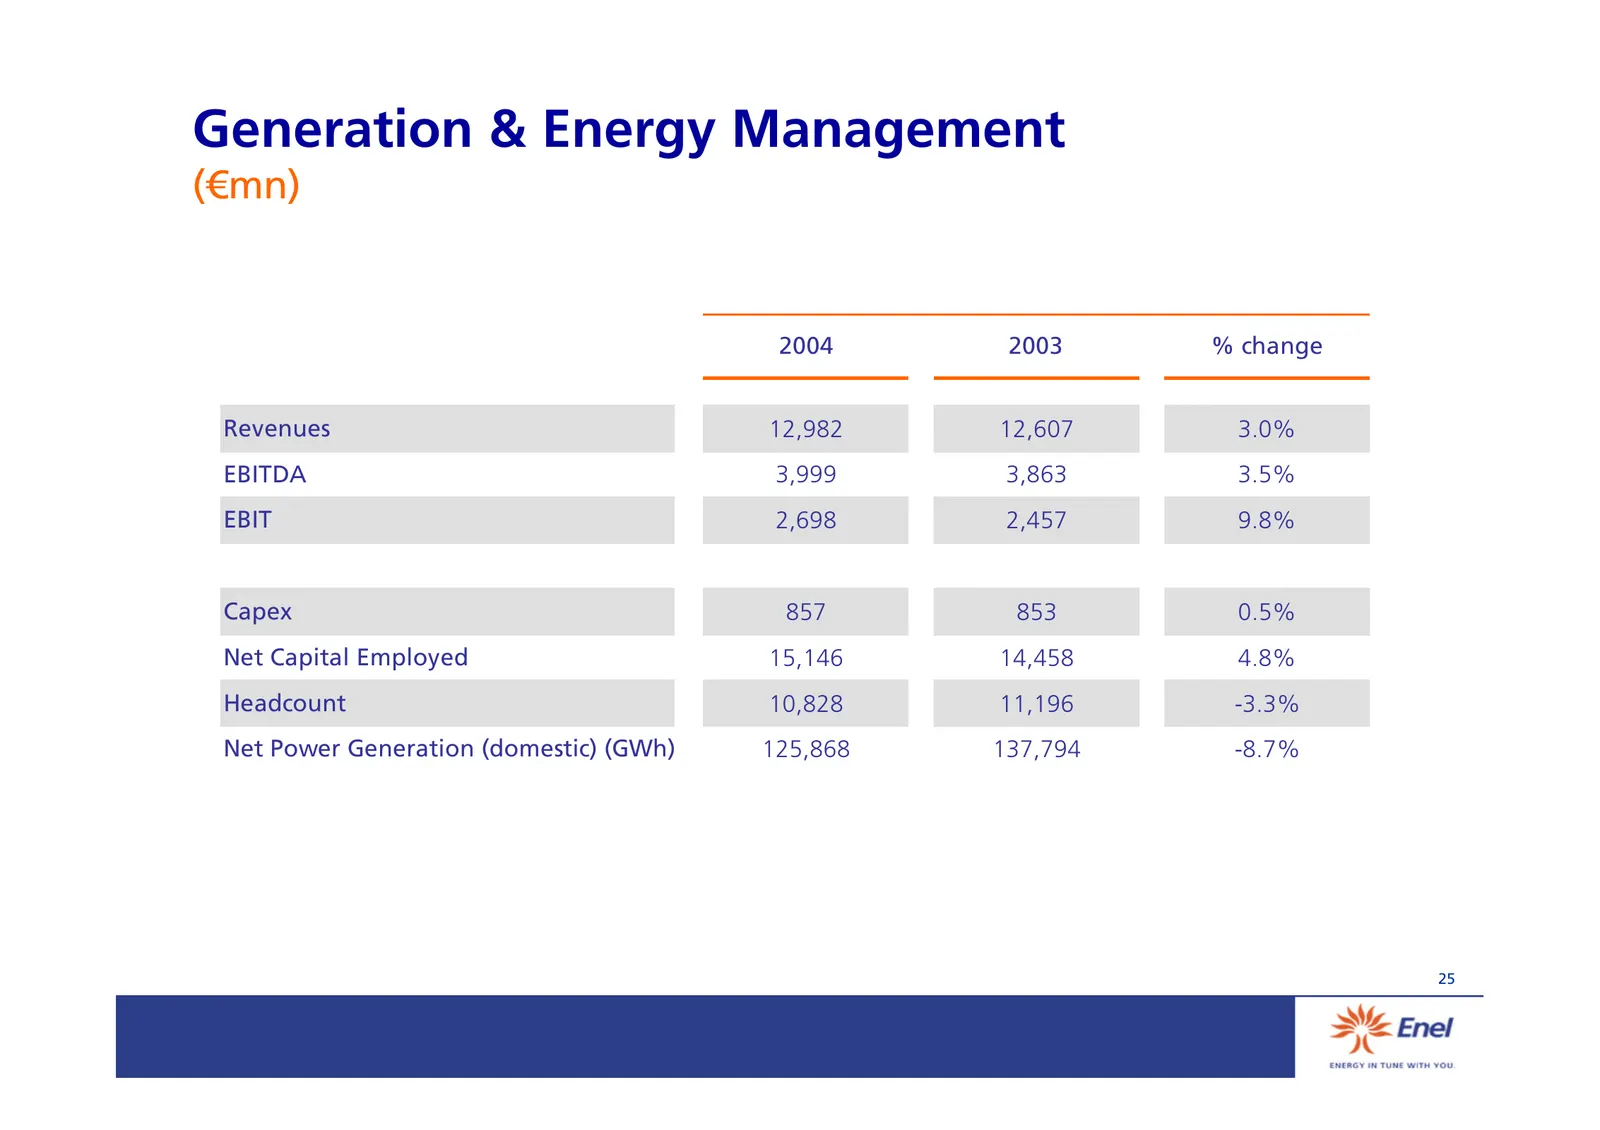
Generation & Energy Management (€mn) 2004 2003 % change Revenues 12,982 12,607 3.0% EBITDA 3,999 3,863 3.5% EBIT 2,698 2,457 9.8% Capex 857 853 0.5% Net Capital Employed 15,146 14,458 4.8% Headcount 10,828 11,196 -3.3% Net Power Generation (domestic) (GWh) 125,868 137,794 -8.7% 25
Slide 27: Network & Sales
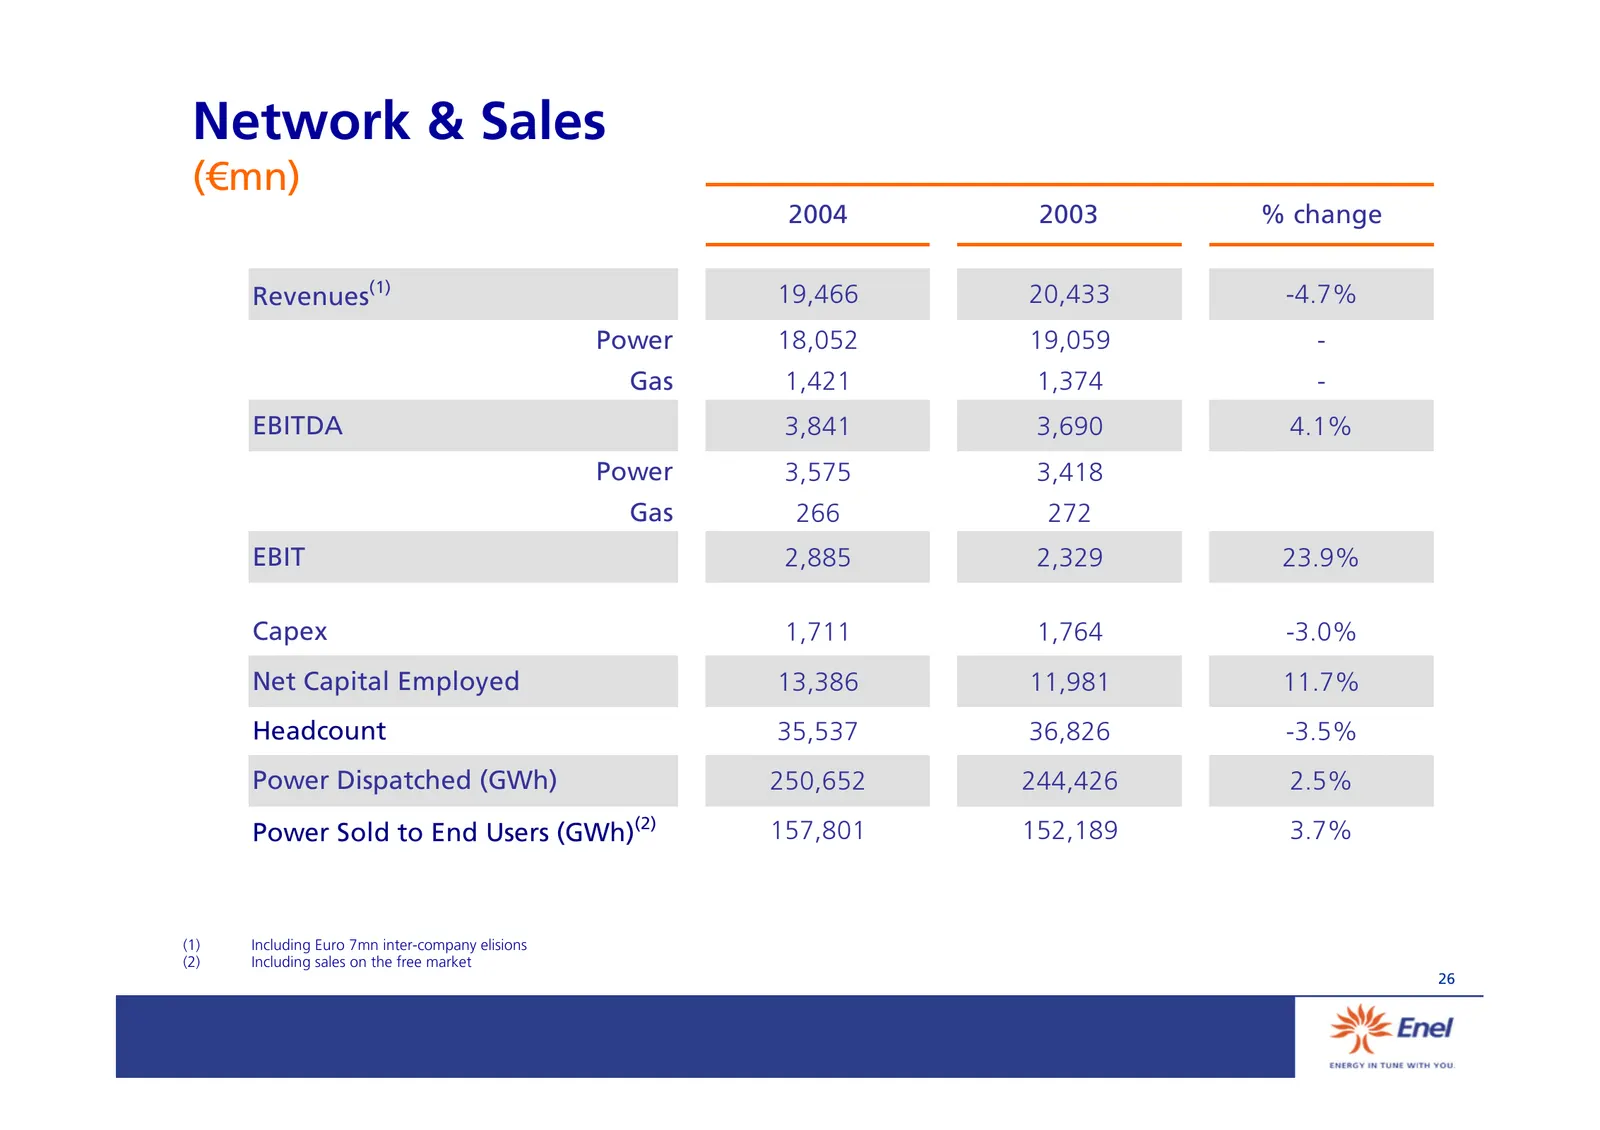
Network & Sales (€mn) 2004 2003 % change Revenues(1) 19,466 20,433 -4.7% Power 18,052 19,059 - Gas 1,421 1,374 - EBITDA 3,841 3,690 4.1% Power 3,575 3,418 Gas 266 272 EBIT 2,885 2,329 23.9% Capex 1,711 1,764 -3.0% Net Capital Employed 13,386 11,981 11.7% Headcount 35,537 36,826 -3.5% Power Dispatche
Slide 28: Operational data
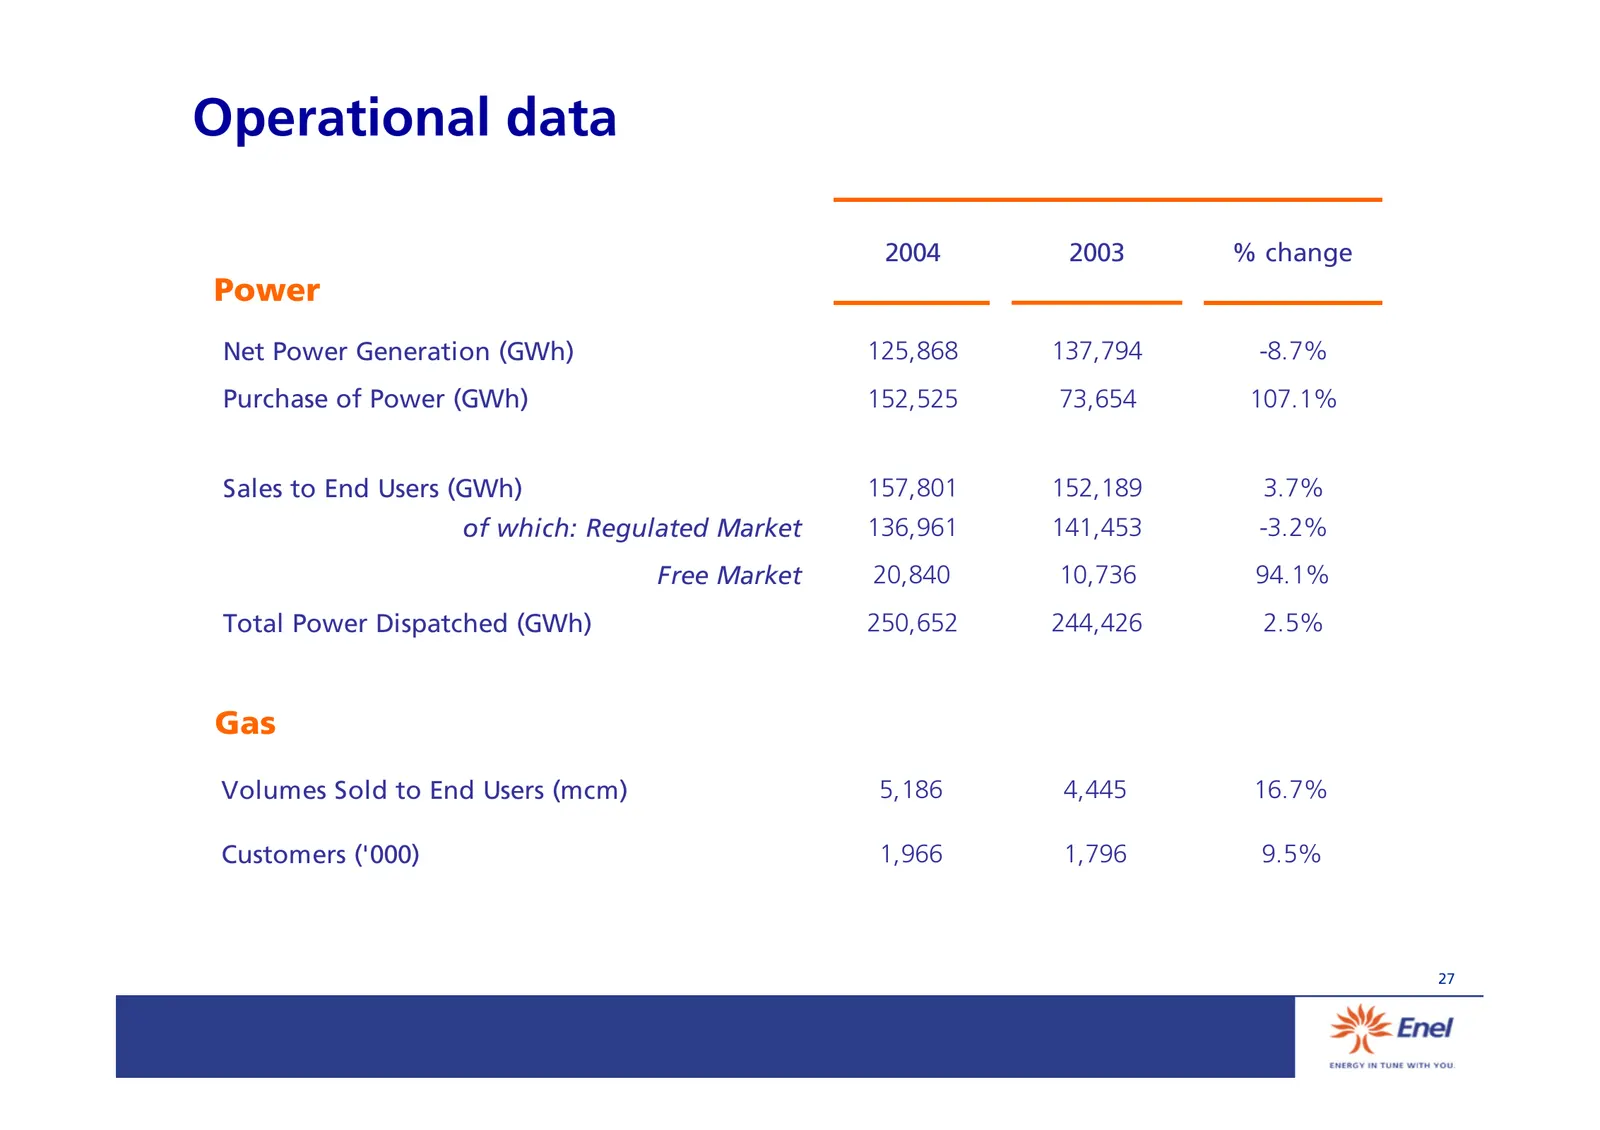
Operational data 2004 2003 % change Power Net Power Generation (GWh) 125,868 137,794 -8.7% Purchase of Power (GWh) 152,525 73,654 107.1% Sales to End Users (GWh) 157,801 152,189 3.7% of which: Regulated Market 136,961 141,453 -3.2% Free Market 20,840 10,736 94.1% Total Power Dispatched (GWh) 250,652
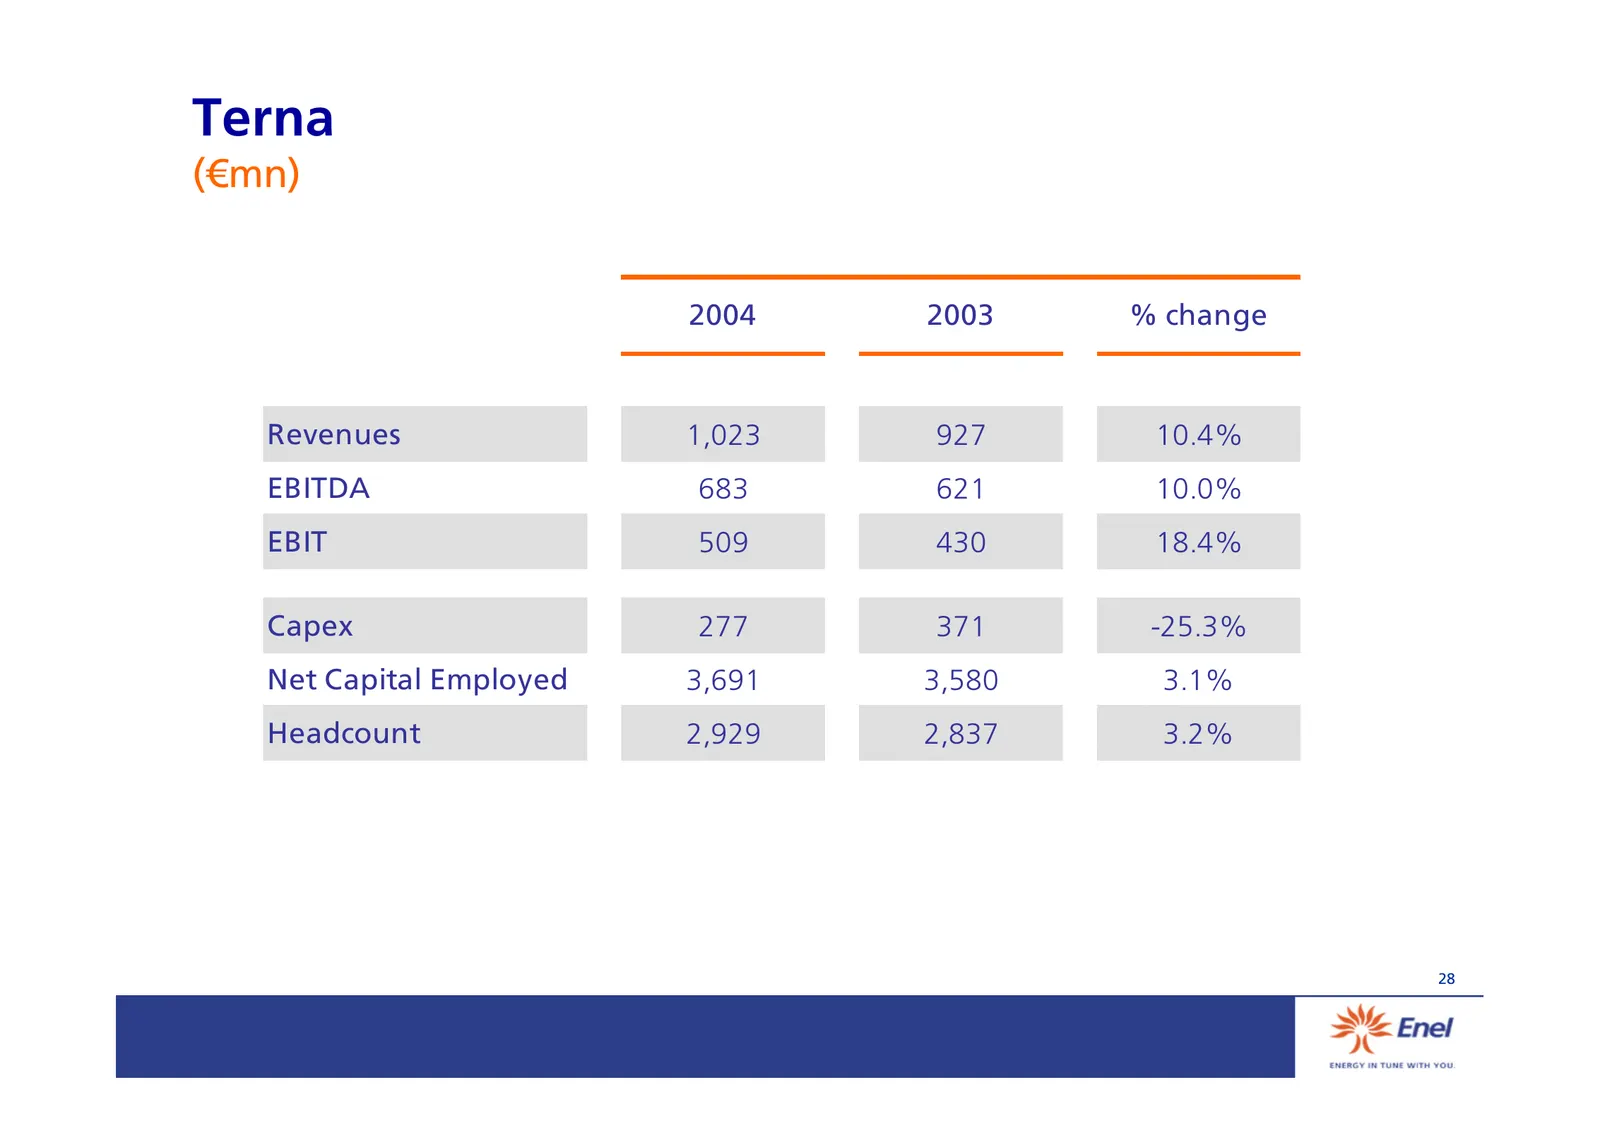
Slide 29: Terna
Terna (€mn) 2004 2003 % change Revenues 1,023 927 10.4% EBITDA 683 621 10.0% EBIT 509 430 18.4% Capex 277 371 -25.3% Net Capital Employed 3,691 3,580 3.1% Headcount 2,929 2,837 3.2% 28
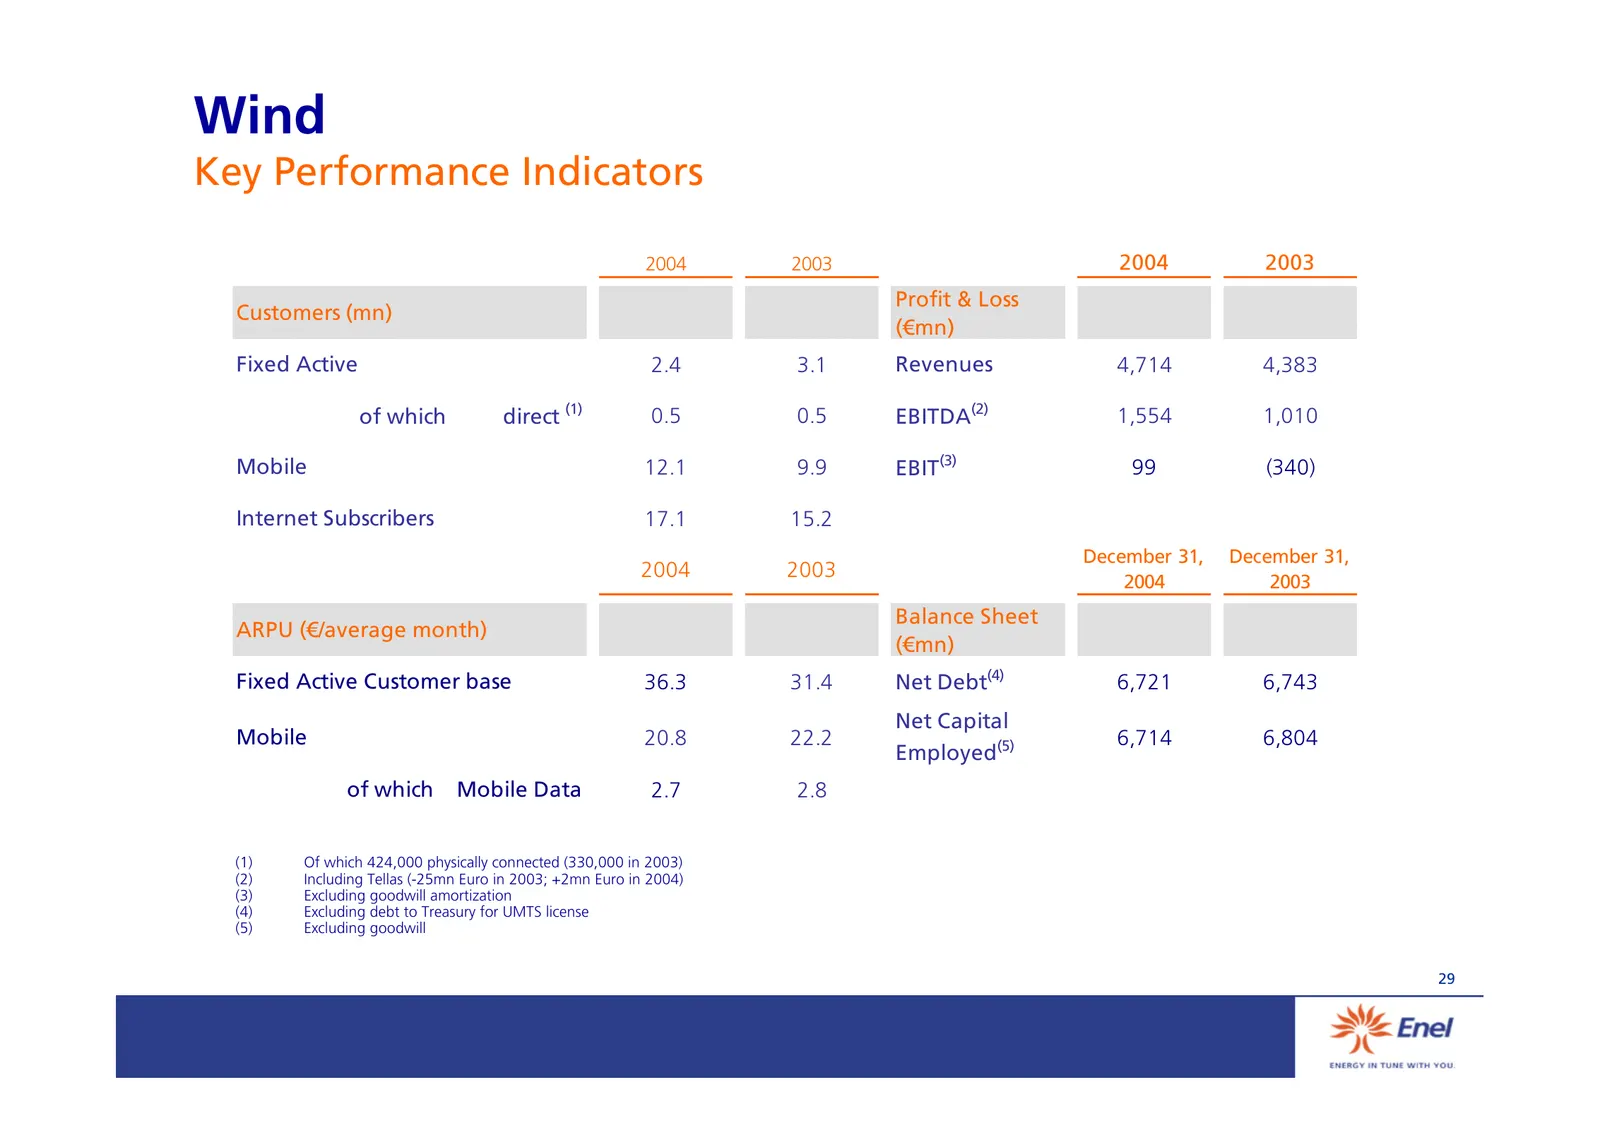
Slide 30: Wind
Wind Key Performance Indicators 2004 2003 2004 2003 Profit & Loss Customers (mn) (€mn) Fixed Active 2.4 3.1 Revenues 4,714 4,383 of which direct (1) 0.5 0.5 EBITDA(2) 1,554 1,010 Mobile 12.1 9.9 EBIT(3) 99 (340) Internet Subscribers 17.1 15.2 December 31, December 31, 2004 2003 2004 2003 Balance She
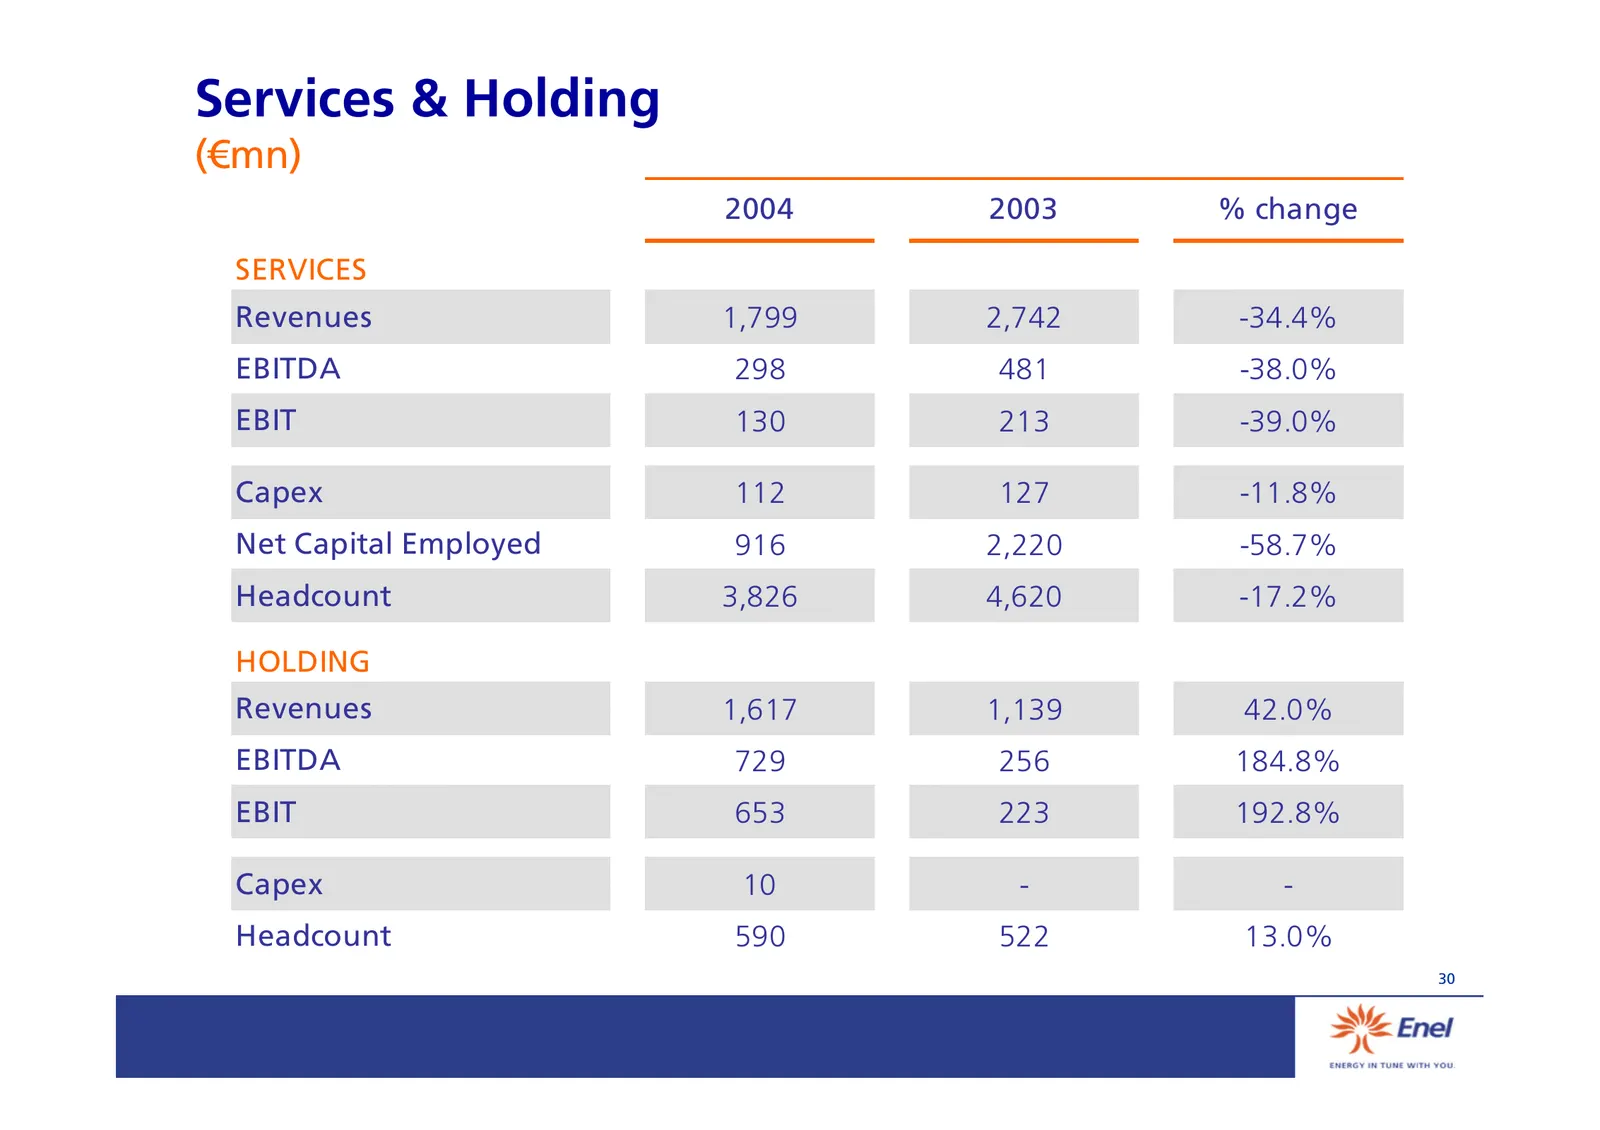
Slide 31: Services & Holding
Services & Holding (€mn) 2004 2003 % change SERVICES Revenues 1,799 2,742 -34.4% EBITDA 298 481 -38.0% EBIT 130 213 -39.0% Capex 112 127 -11.8% Net Capital Employed 916 2,220 -58.7% Headcount 3,826 4,620 -17.2% HOLDING Revenues 1,617 1,139 42.0% EBITDA 729 256 184.8% EBIT 653 223 192.8% Capex 10 - -
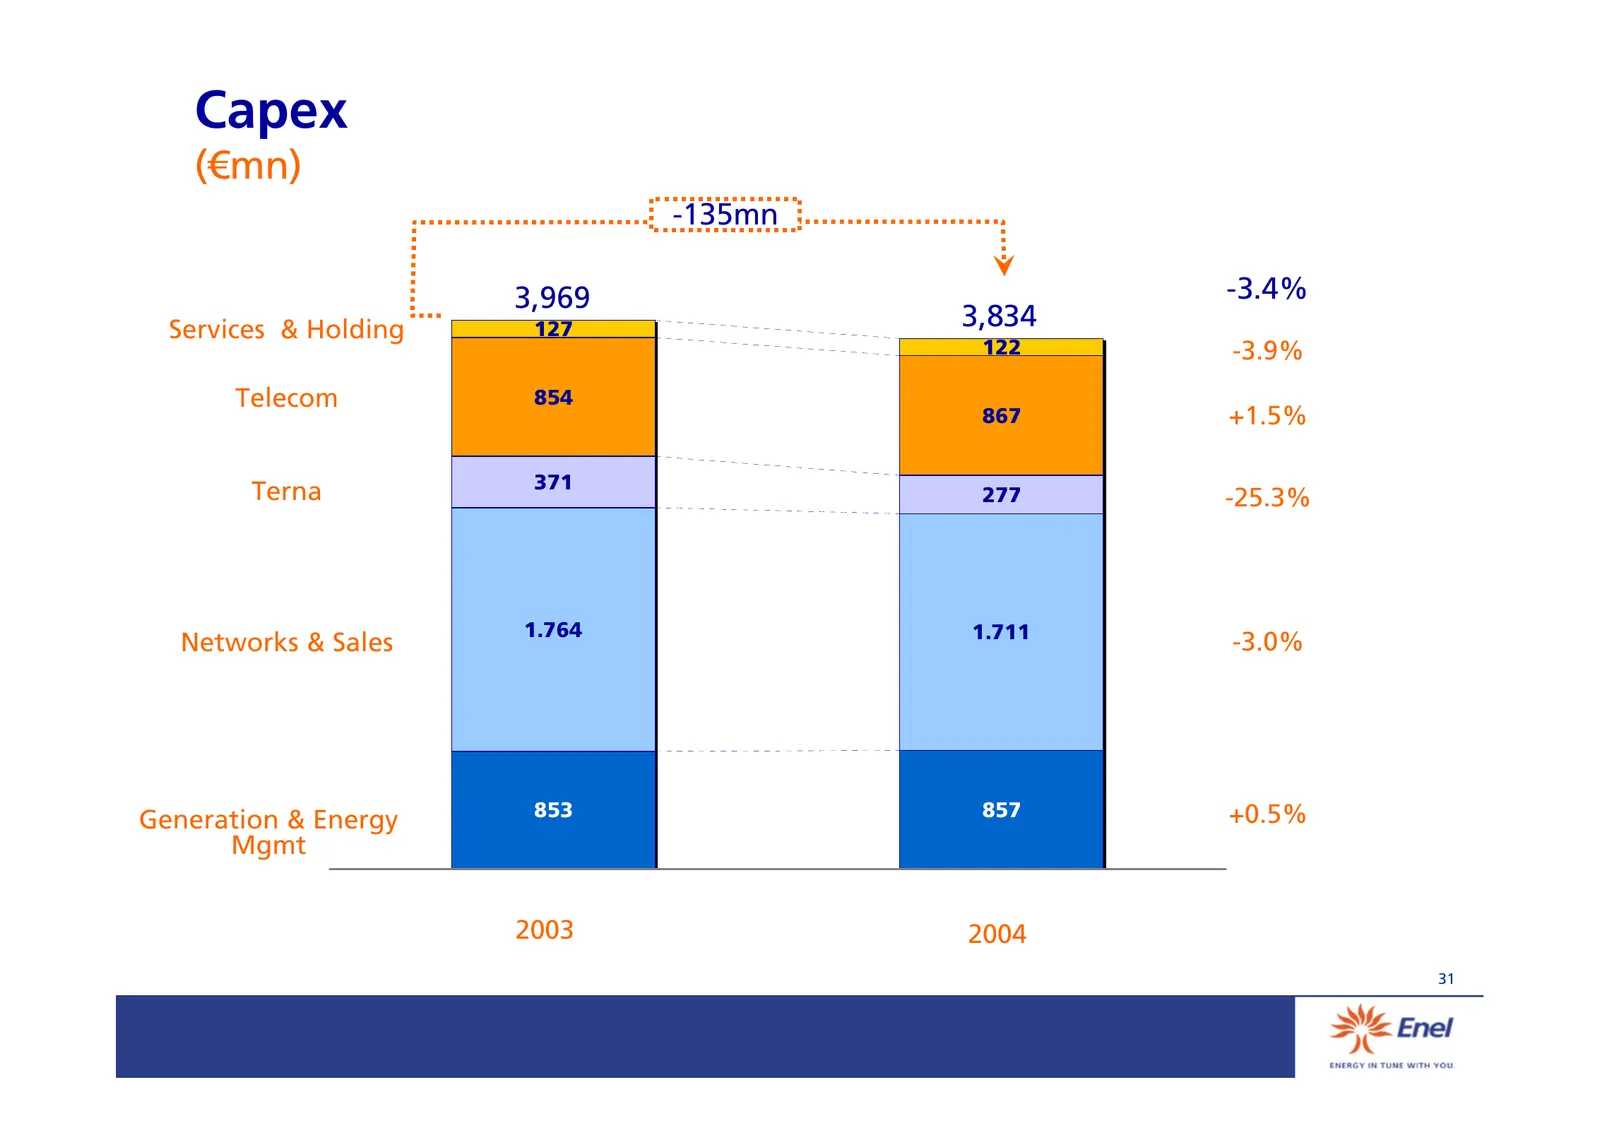
Slide 32: Capex
Capex (€mn) -135mn 3,969 -3.4% Services & Holding 127 3,834 122 -3.9% Telecom 854 867 +1.5% 371 Terna 277 -25.3% 1.764 1.711 Networks & Sales -3.0% 853 857 +0.5% Generation & Energy Mgmt 2003 2004 31
Slide 33: Financial Annexes 1Q05 Results
Financial Annexes 1Q05 Results(1) (1) 1Q05 results and 2004 comparative figures are IFRS-IAS compliant
Slide 34: IFRS Application
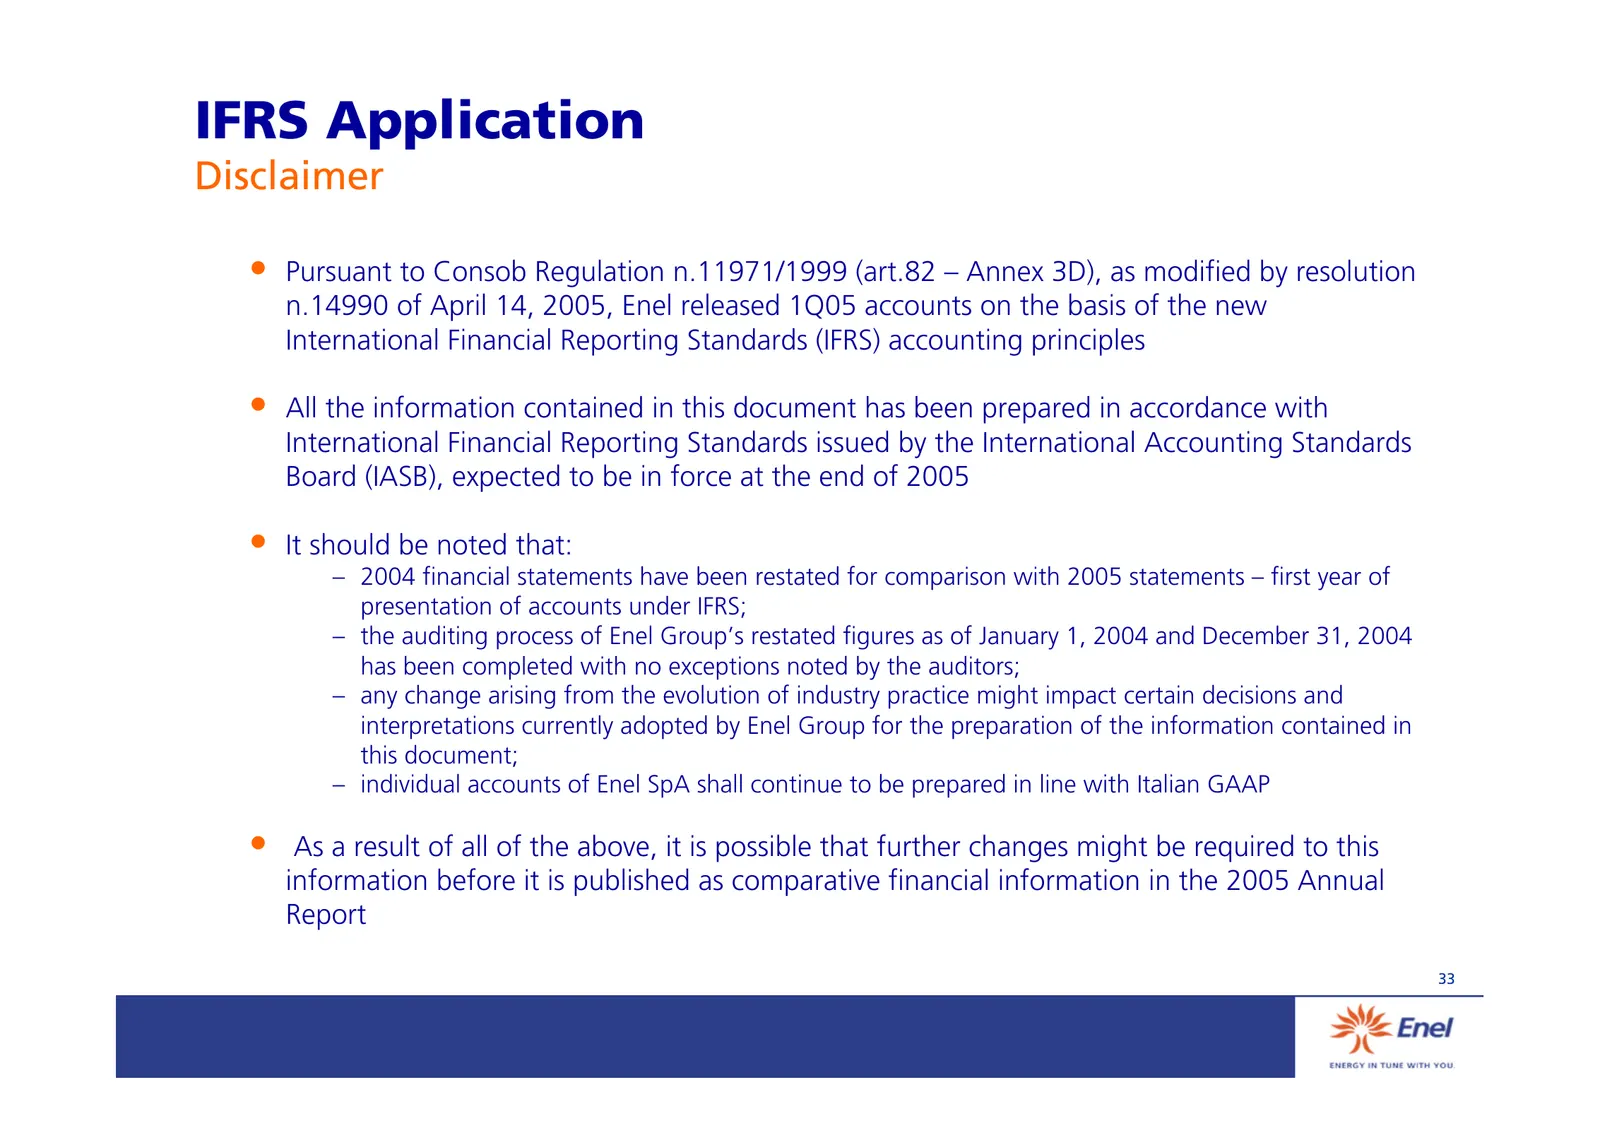
IFRS Application Disclaimer • Pursuant to Consob Regulation n.11971/1999 (art.82 – Annex 3D), as modified by resolution n.14990 of April 14, 2005, Enel released 1Q05 accounts on the basis of the new International Financial Reporting Standards (IFRS) accounting principles • All the information contai
Slide 35: IFRS Application: exceptions allowed under FTA
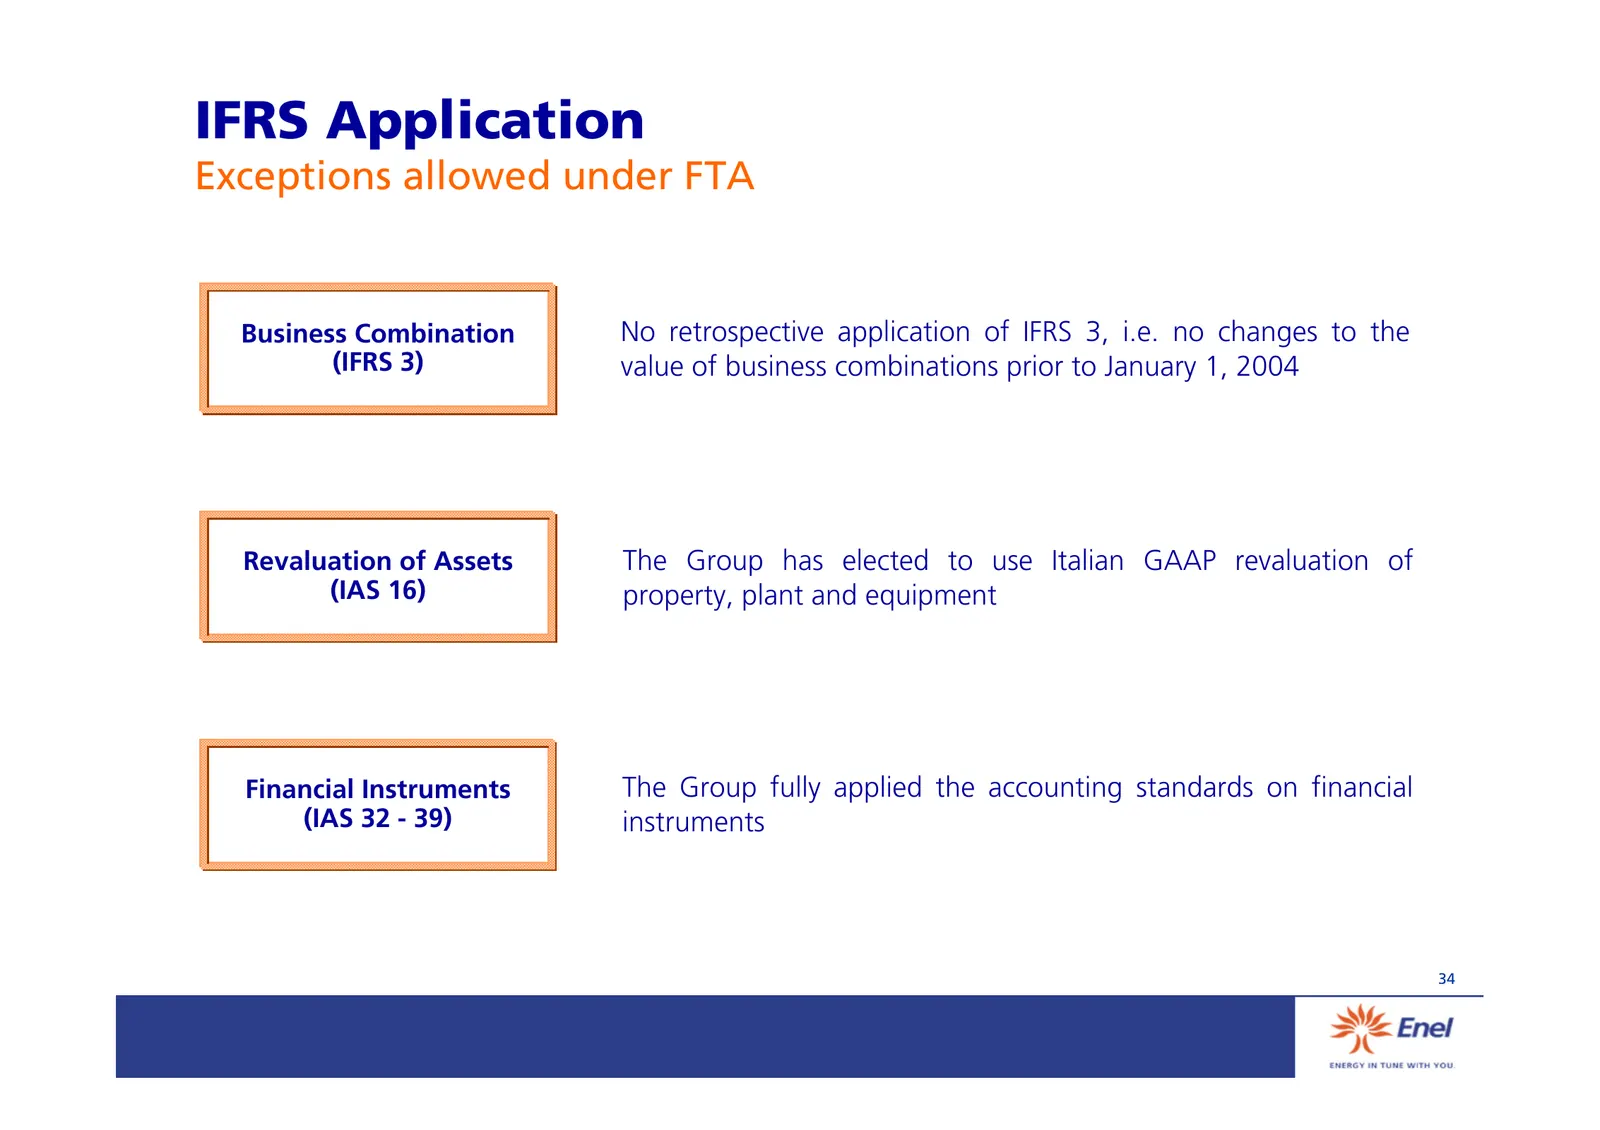
IFRS Application Exceptions allowed under FTA Business Combination No retrospective application of IFRS 3, i.e. no changes to the (IFRS 3) value of business combinations prior to January 1, 2004 Revaluation of Assets The Group has elected to use Italian GAAP revaluation of (IAS 16) property, plant a
Slide 36: IFRS Application: 2004 balance sheet main changes
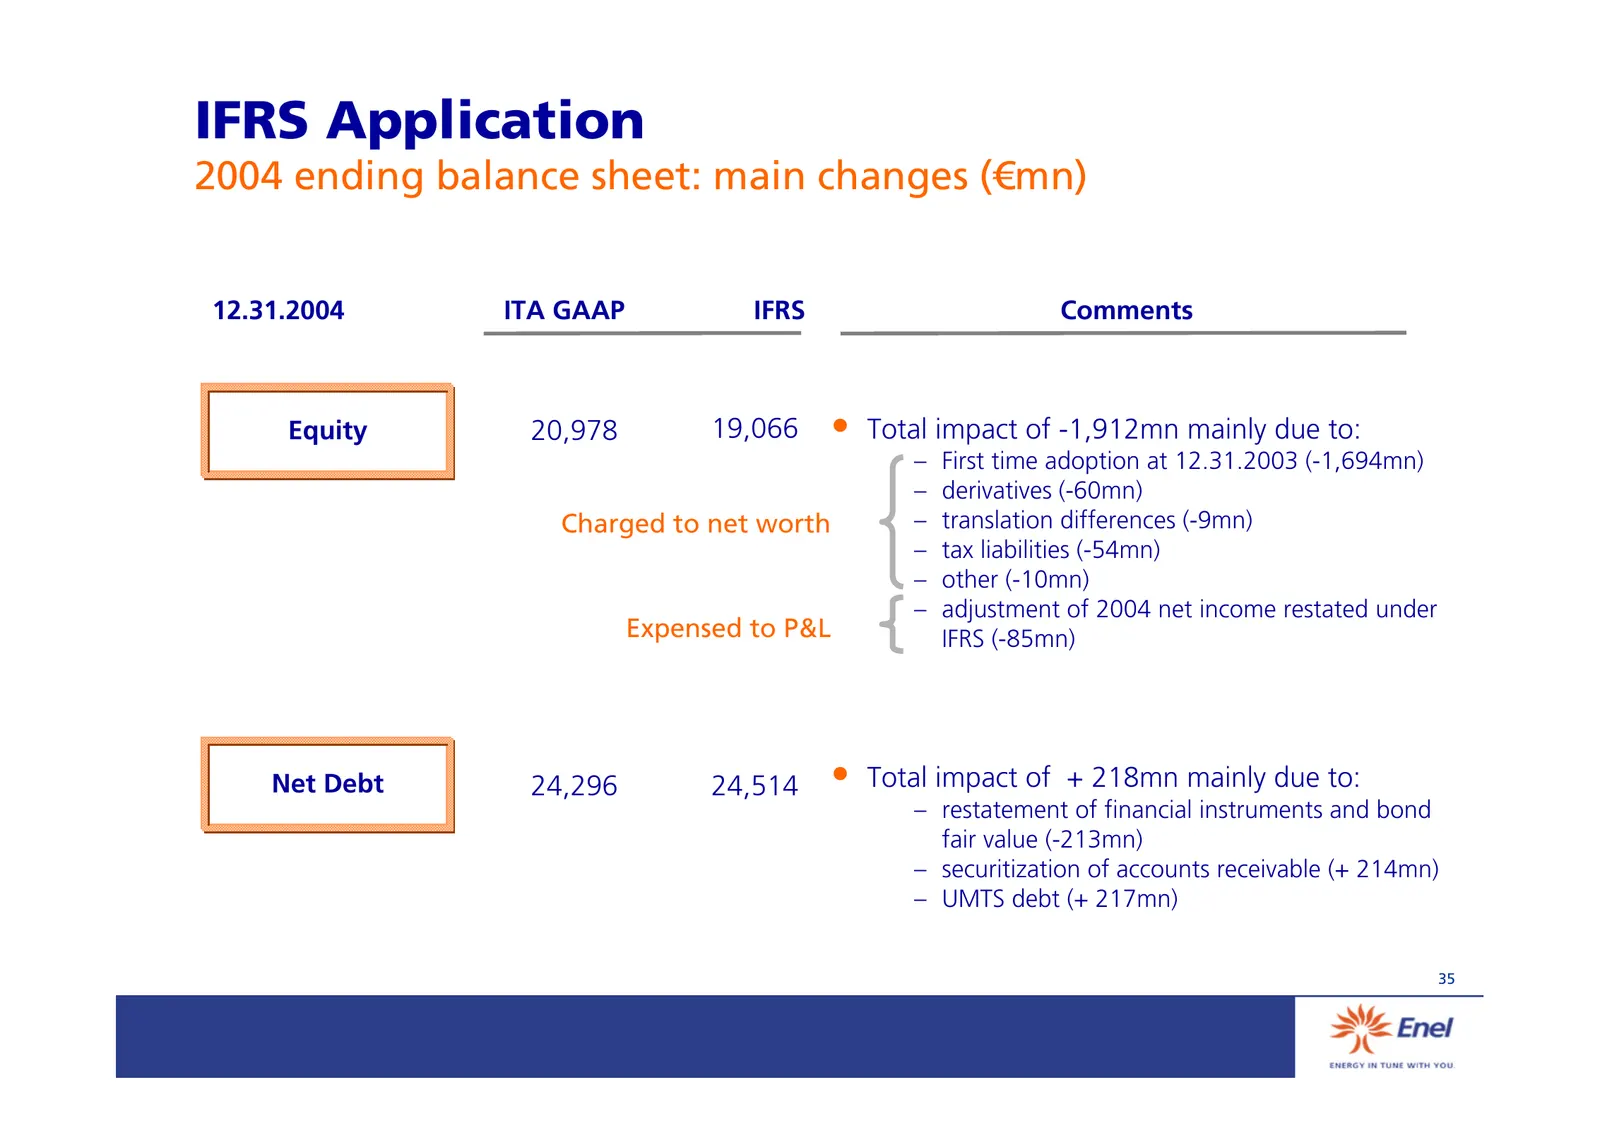
IFRS Application 2004 ending balance sheet: main changes (€mn) 12.31.2004 ITA GAAP IFRS Comments Equity 20,978 19,066 • Total impact of -1,912mn mainly due to: – First time adoption at 12.31.2003 (-1,694mn) – derivatives (-60mn) Charged to net worth – translation differences (-9mn) – tax liabilities
Slide 37: IFRS Application: 2004 ending balance sheet
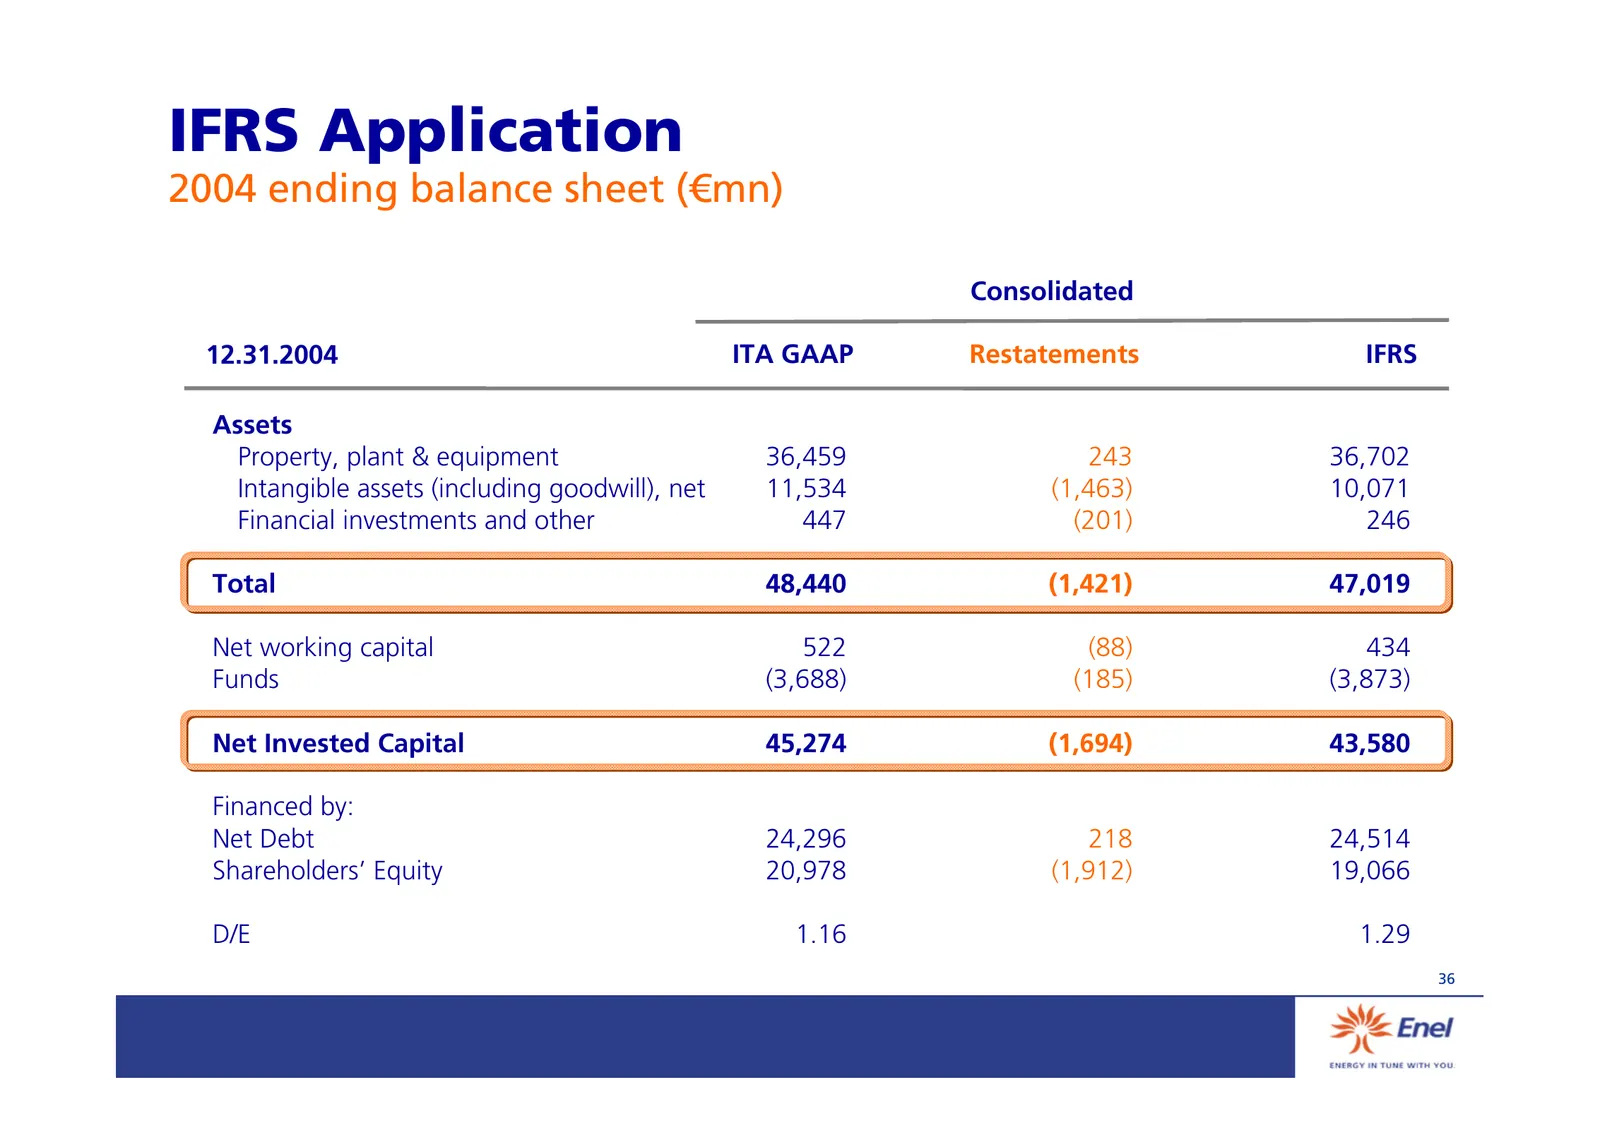
IFRS Application 2004 ending balance sheet (€mn) Consolidated 12.31.2004 ITA GAAP Restatements IFRS Assets Property, plant & equipment 36,459 243 36,702 Intangible assets (including goodwill), net 11,534 (1,463) 10,071 Financial investments and other 447 (201) 246 Total 48,440 (1,421) 47,019 Net wor
Slide 38: IFRS Application: 2004 profit and loss
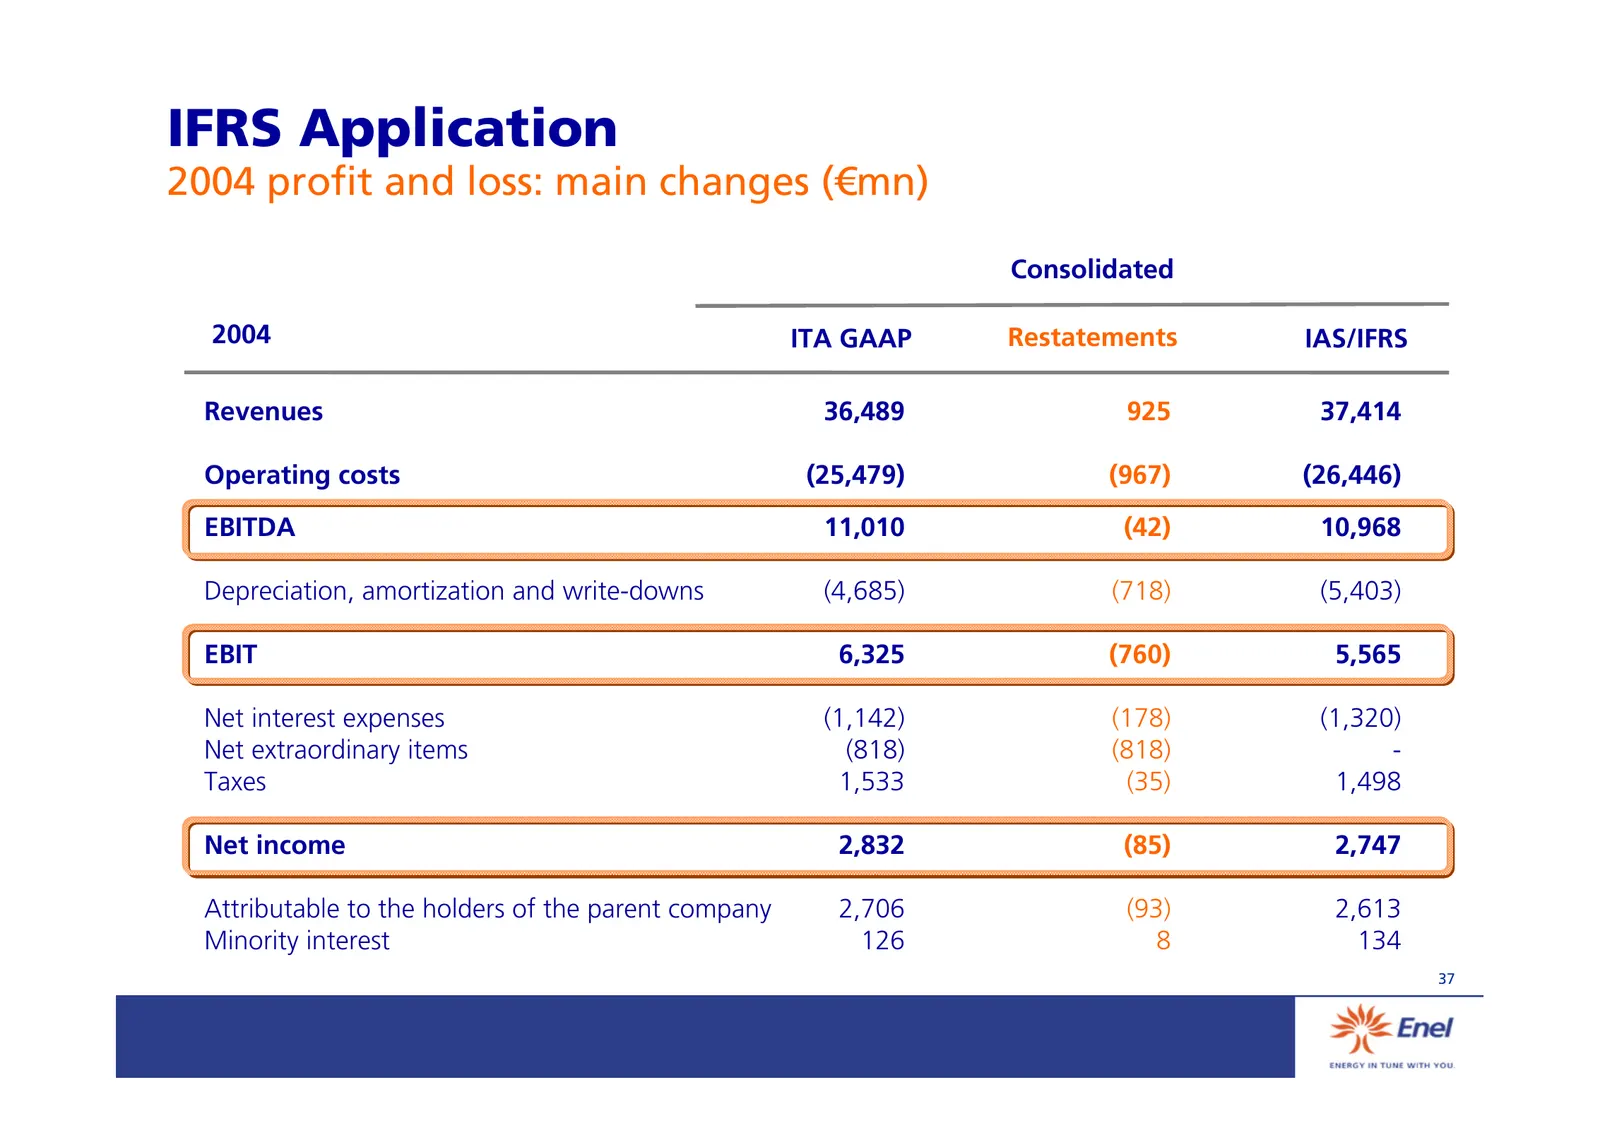
IFRS Application 2004 profit and loss: main changes (€mn) Consolidated 2004 ITA GAAP Restatements IAS/IFRS Revenues 36,489 925 37,414 Operating costs (25,479) (967) (26,446) EBITDA 11,010 (42) 10,968 Depreciation, amortization and write-downs (4,685) (718) (5,403) EBIT 6,325 (760) 5,565 Net interest
Slide 39: EBITDA by division
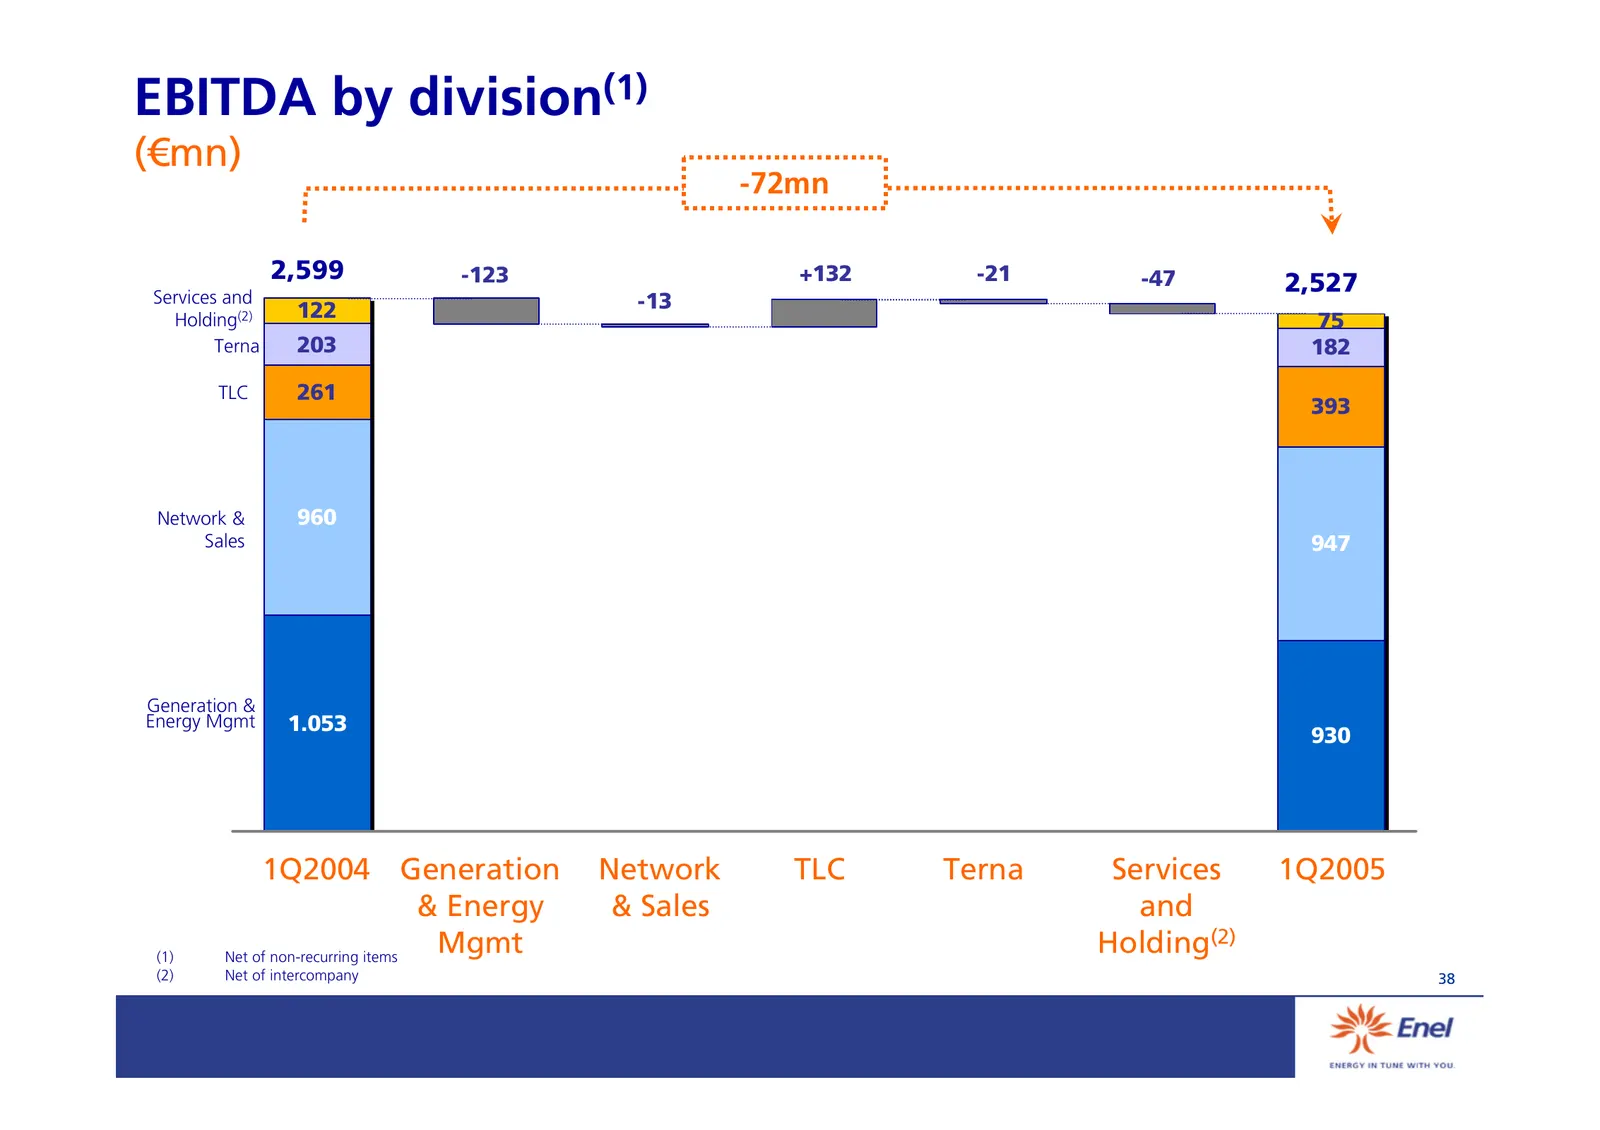
EBITDA by division(1) (€mn) -72mn 2,599 -123 +132 -21 -47 2,527 Services and -13 Holding(2) 122 75 Terna 203 182 TLC 261 393 Network & 960 Sales 947 Generation & Energy Mgmt 1.053 930 1Q2004 Generation Network TLC Terna Services 1Q2005 & Energy & Sales and (1) Net of non-recurring items Mgmt Holding
Slide 40: Net Debt Evolution
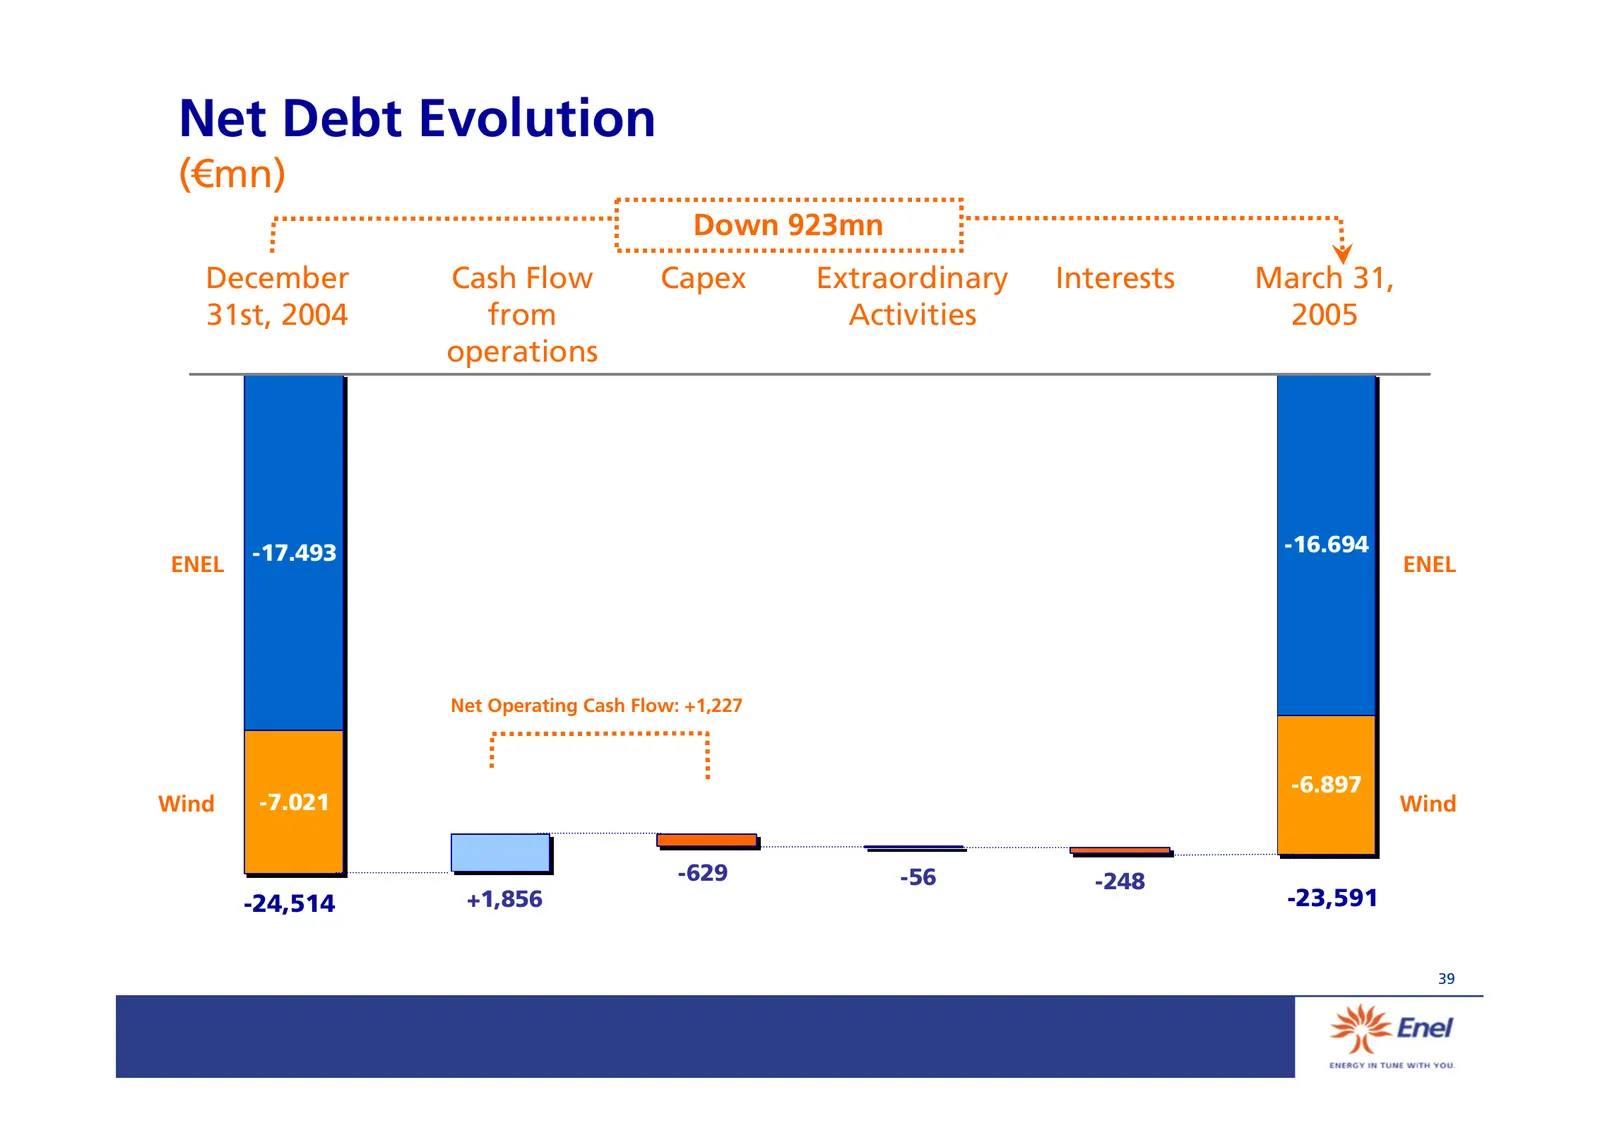
Net Debt Evolution (€mn) Down 923mn December Cash Flow Capex Extraordinary Interests March 31, 31st, 2004 from Activities 2005 operations -17.493 -16.694 ENEL ENEL Net Operating Cash Flow: +1,227 -6.897 Wind -7.021 Wind -629 -56 -248 -24,514 +1,856 -23,591 39
Slide 41: Income statement
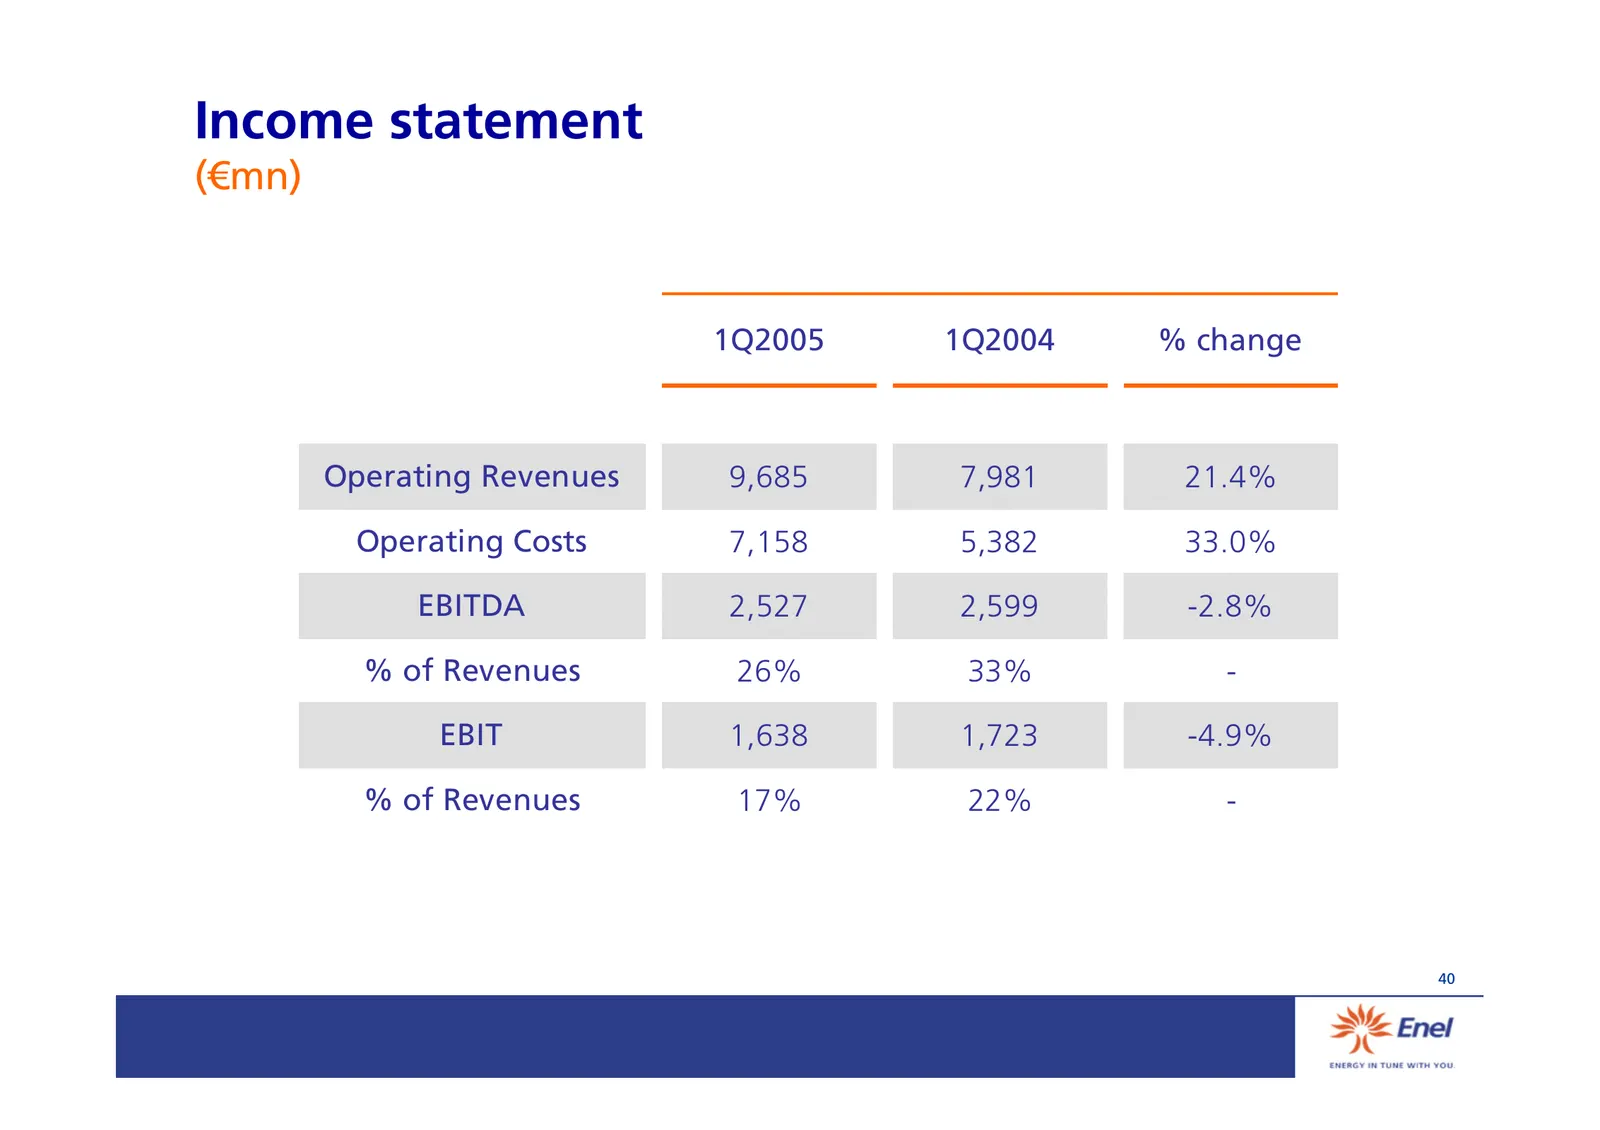
Income statement (€mn) 1Q2005 1Q2004 % change Operating Revenues 9,685 7,981 21.4% Operating Costs 7,158 5,382 33.0% EBITDA 2,527 2,599 -2.8% % of Revenues 26% 33% - EBIT 1,638 1,723 -4.9% % of Revenues 17% 22% - 40
Slide 42: From EBIT to EPS
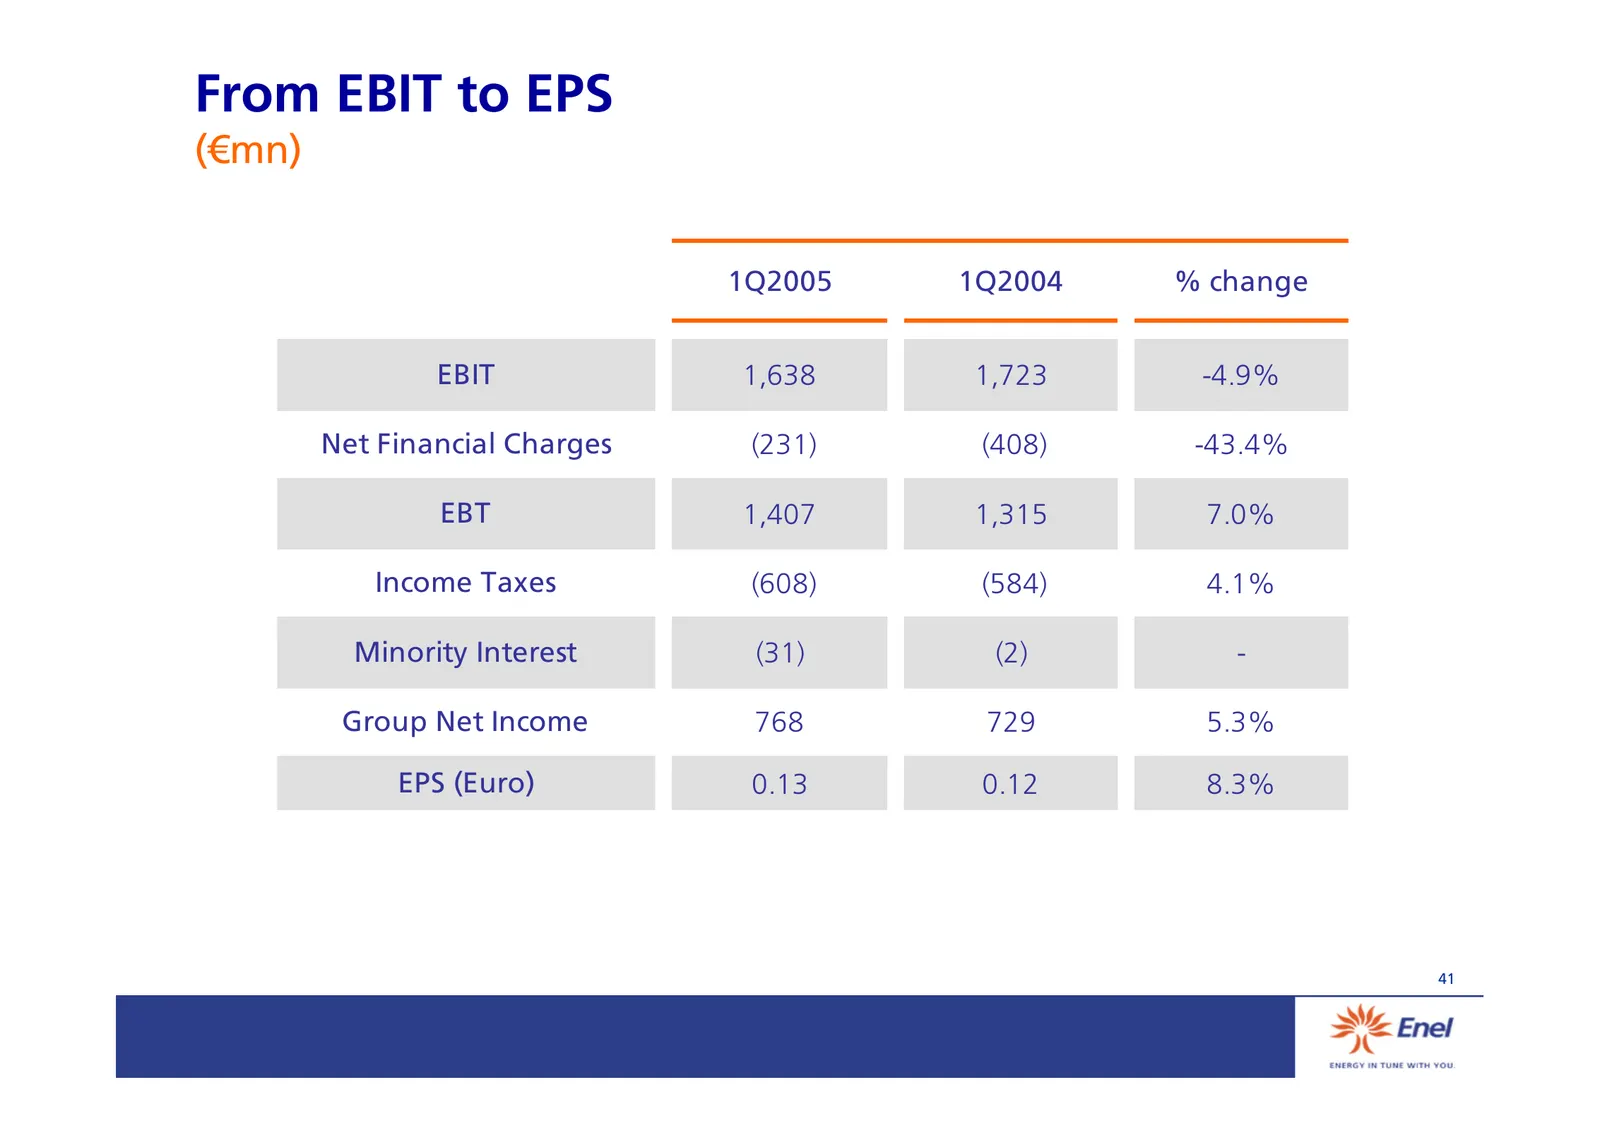
From EBIT to EPS (€mn) 1Q2005 1Q2004 % change EBIT 1,638 1,723 -4.9% Net Financial Charges (231) (408) -43.4% EBT 1,407 1,315 7.0% Income Taxes (608) (584) 4.1% Minority Interest (31) (2) - Group Net Income 768 729 5.3% EPS (Euro) 0.13 0.12 8.3% 41
Slide 43: Balance sheet
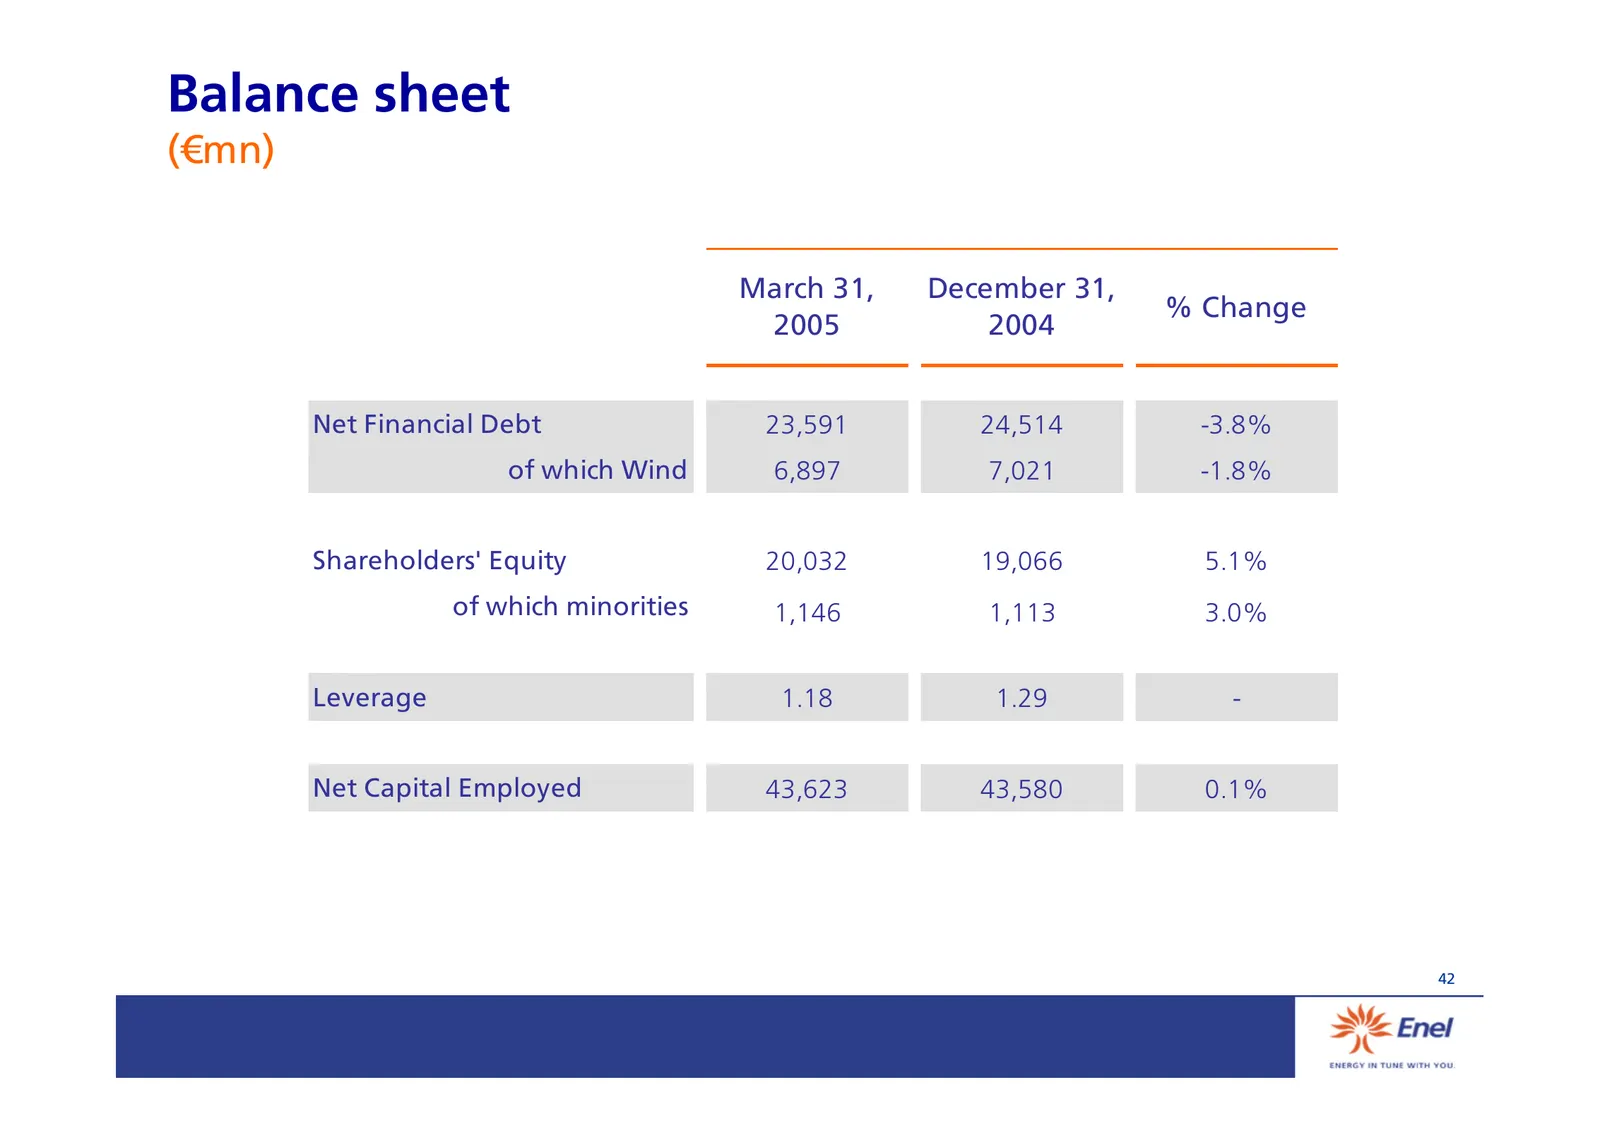
Balance sheet (€mn) March 31, December 31, % Change 2005 2004 Net Financial Debt 23,591 24,514 -3.8% of which Wind 6,897 7,021 -1.8% Shareholders' Equity 20,032 19,066 5.1% of which minorities 1,146 1,113 3.0% Leverage 1.18 1.29 - Net Capital Employed 43,623 43,580 0.1% 42
Slide 44: EBIT by business area
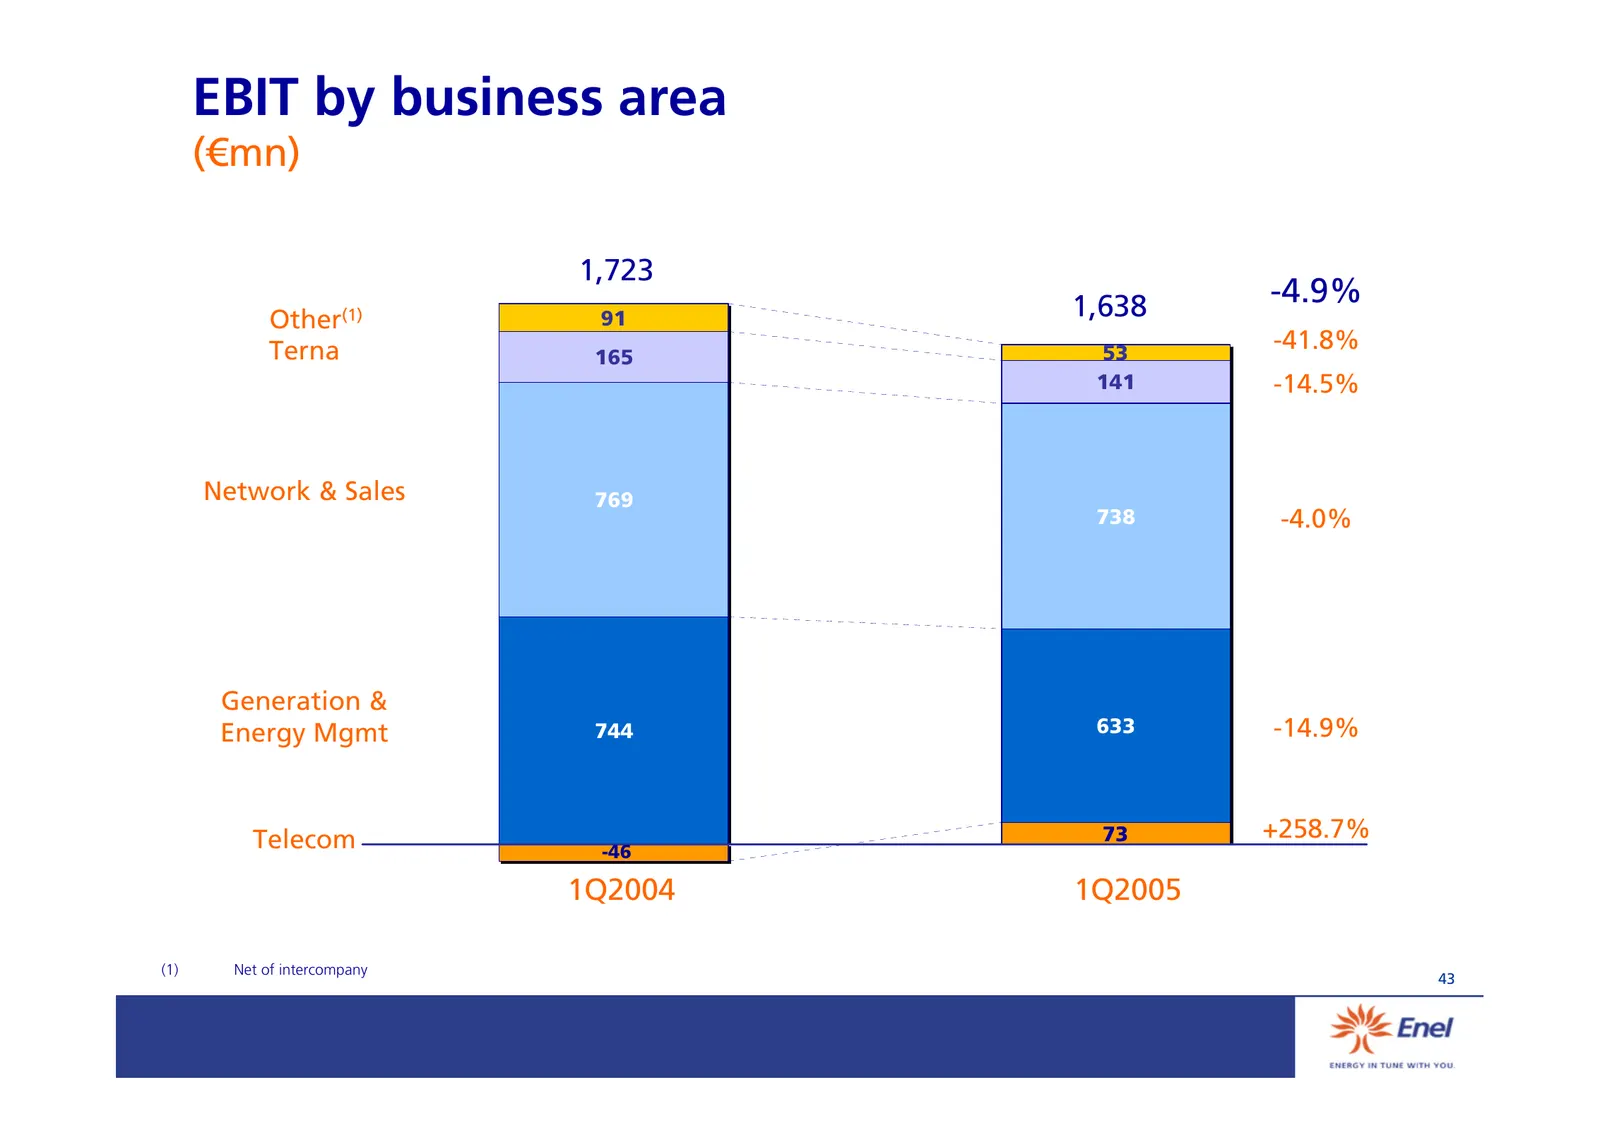
EBIT by business area (€mn) 1,723 1,638 -4.9% Other(1) 91 Terna 53 -41.8% 165 141 -14.5% Network & Sales 769 738 -4.0% Generation & Energy Mgmt 744 633 -14.9% Telecom 73 +258.7% -46 1Q2004 1Q2005 (1) Net of intercompany 43
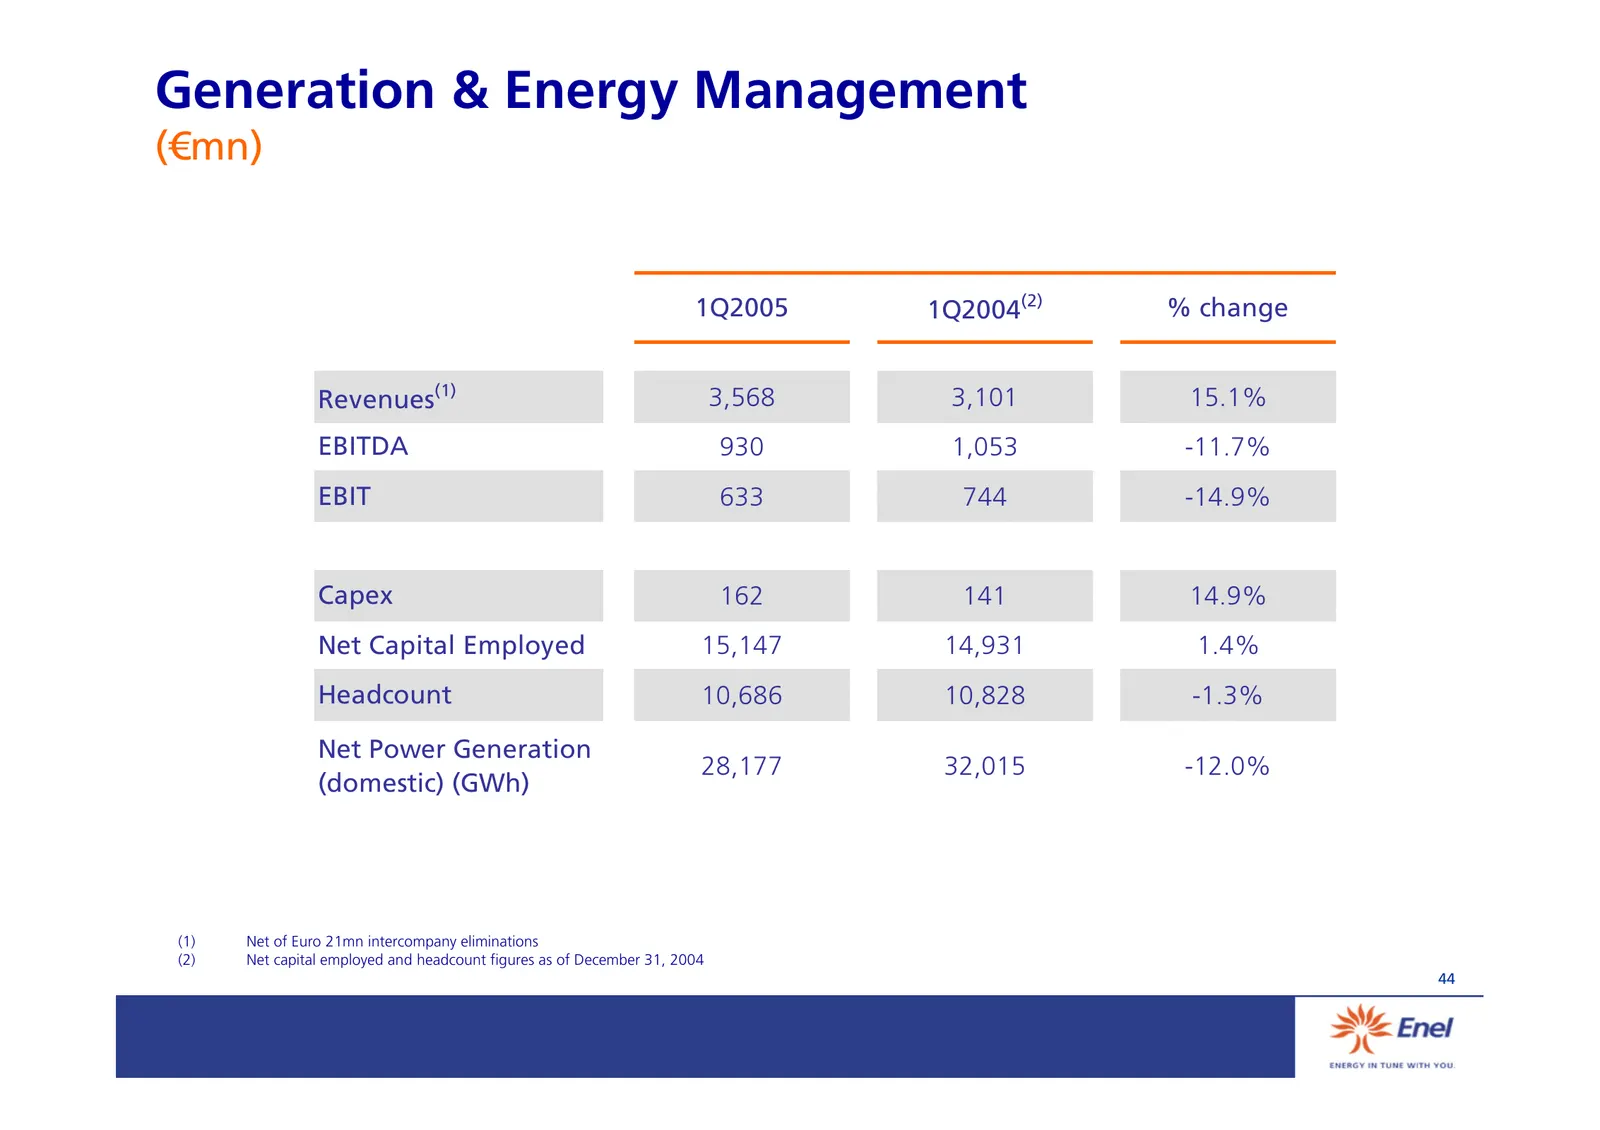
Slide 45: Generation & Energy Management
Generation & Energy Management (€mn) 1Q2005 1Q2004(2) % change Revenues(1) 3,568 3,101 15.1% EBITDA 930 1,053 -11.7% EBIT 633 744 -14.9% Capex 162 141 14.9% Net Capital Employed 15,147 14,931 1.4% Headcount 10,686 10,828 -1.3% Net Power Generation 28,177 32,015 -12.0% (domestic) (GWh) (1) Net of Eur
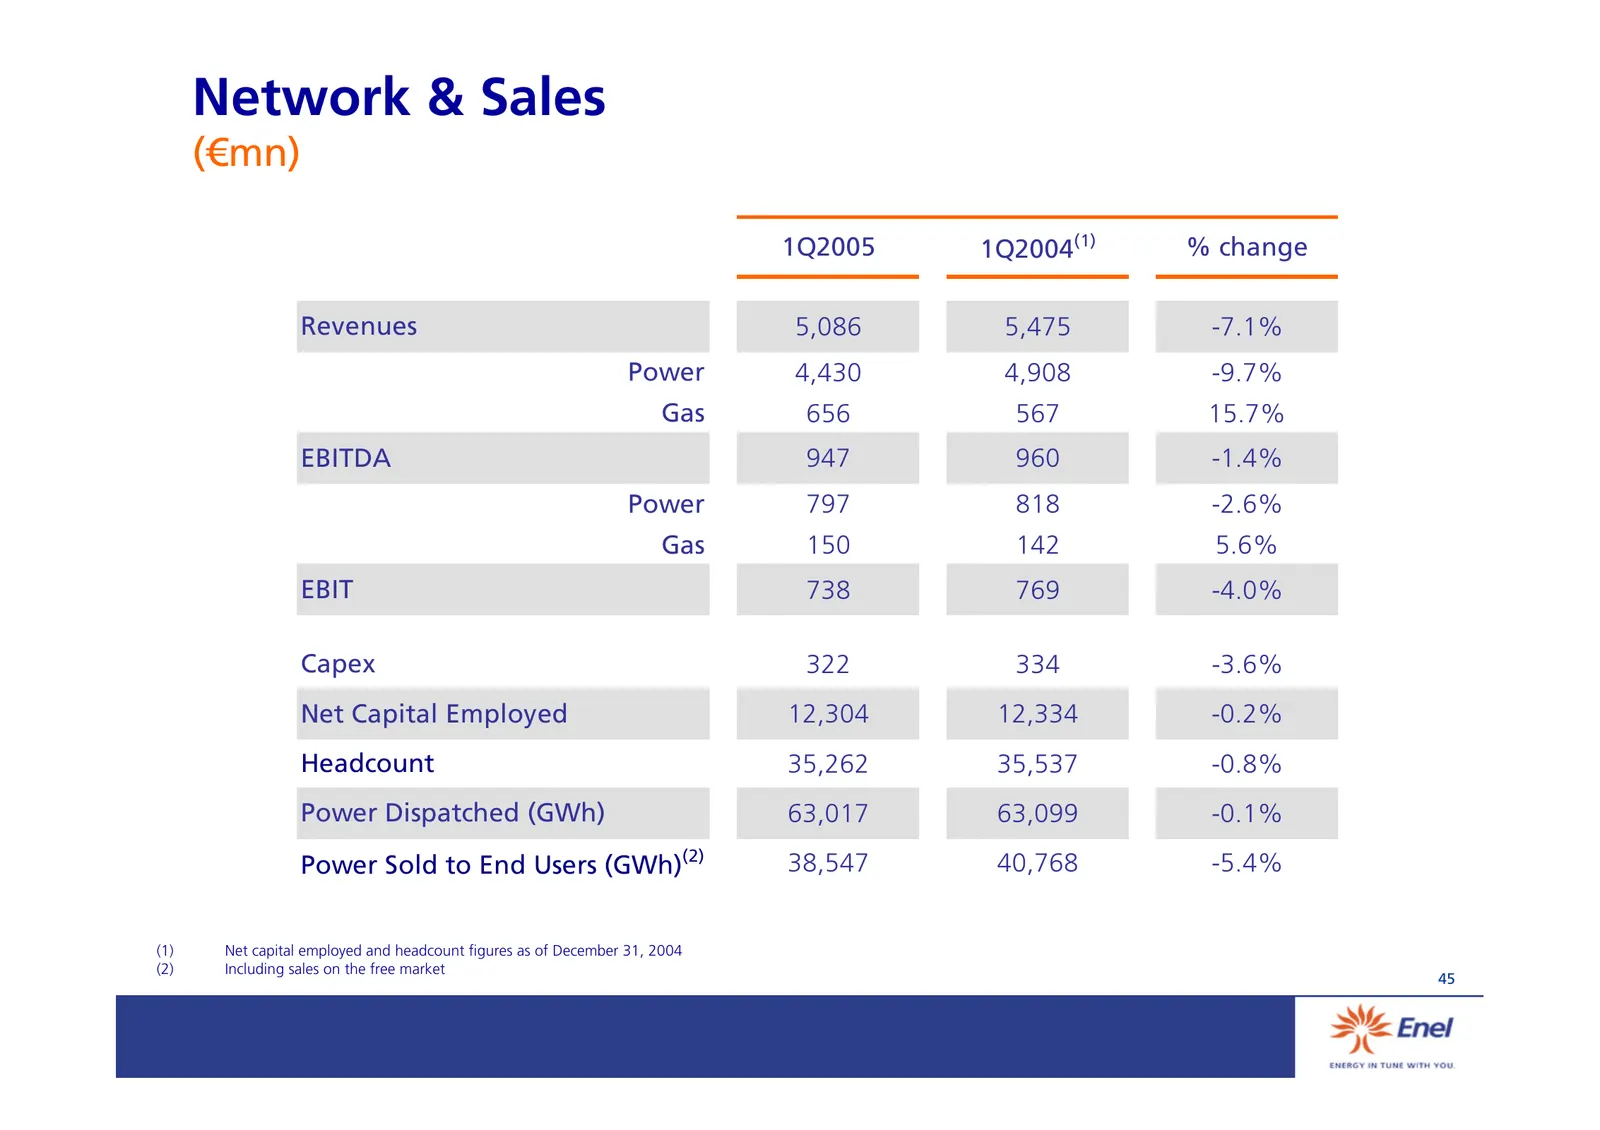
Slide 46: Network & Sales
Network & Sales (€mn) 1Q2005 1Q2004(1) % change Revenues 5,086 5,475 -7.1% Power 4,430 4,908 -9.7% Gas 656 567 15.7% EBITDA 947 960 -1.4% Power 797 818 -2.6% Gas 150 142 5.6% EBIT 738 769 -4.0% Capex 322 334 -3.6% Net Capital Employed 12,304 12,334 -0.2% Headcount 35,262 35,537 -0.8% Power Dispatche
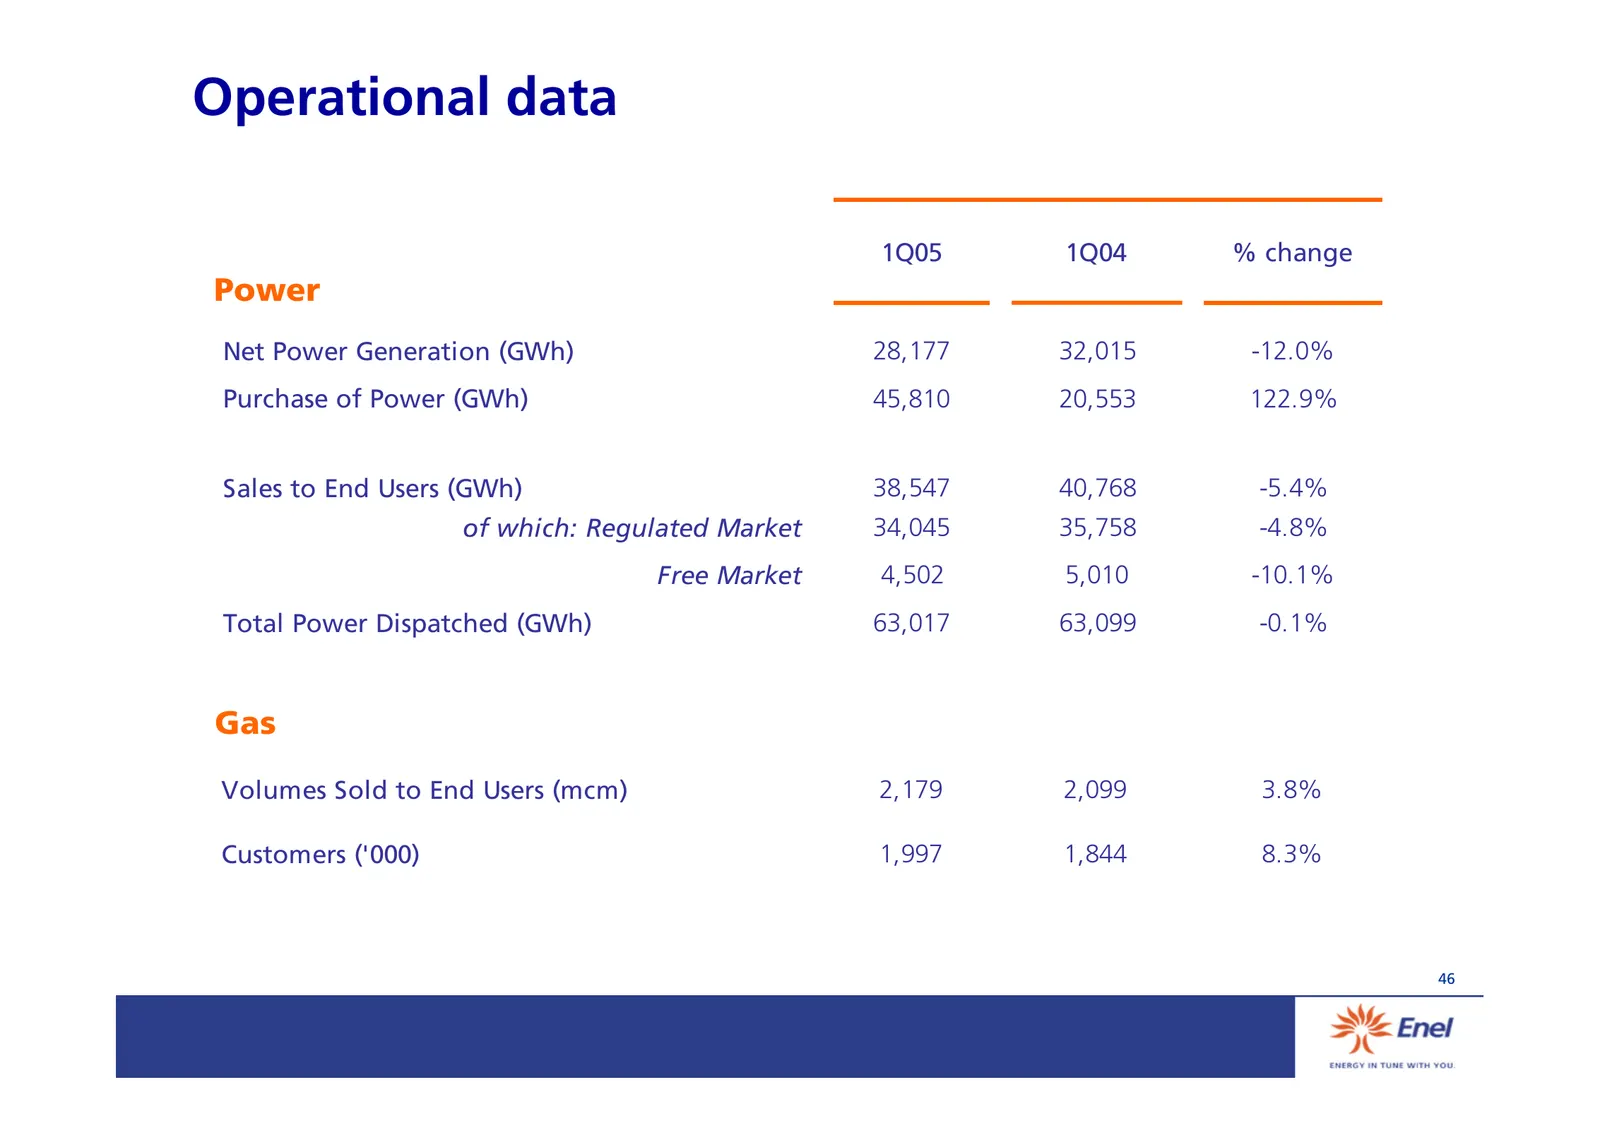
Slide 47: Operational data
Operational data 1Q05 1Q04 % change Power Net Power Generation (GWh) 28,177 32,015 -12.0% Purchase of Power (GWh) 45,810 20,553 122.9% Sales to End Users (GWh) 38,547 40,768 -5.4% of which: Regulated Market 34,045 35,758 -4.8% Free Market 4,502 5,010 -10.1% Total Power Dispatched (GWh) 63,017 63,099
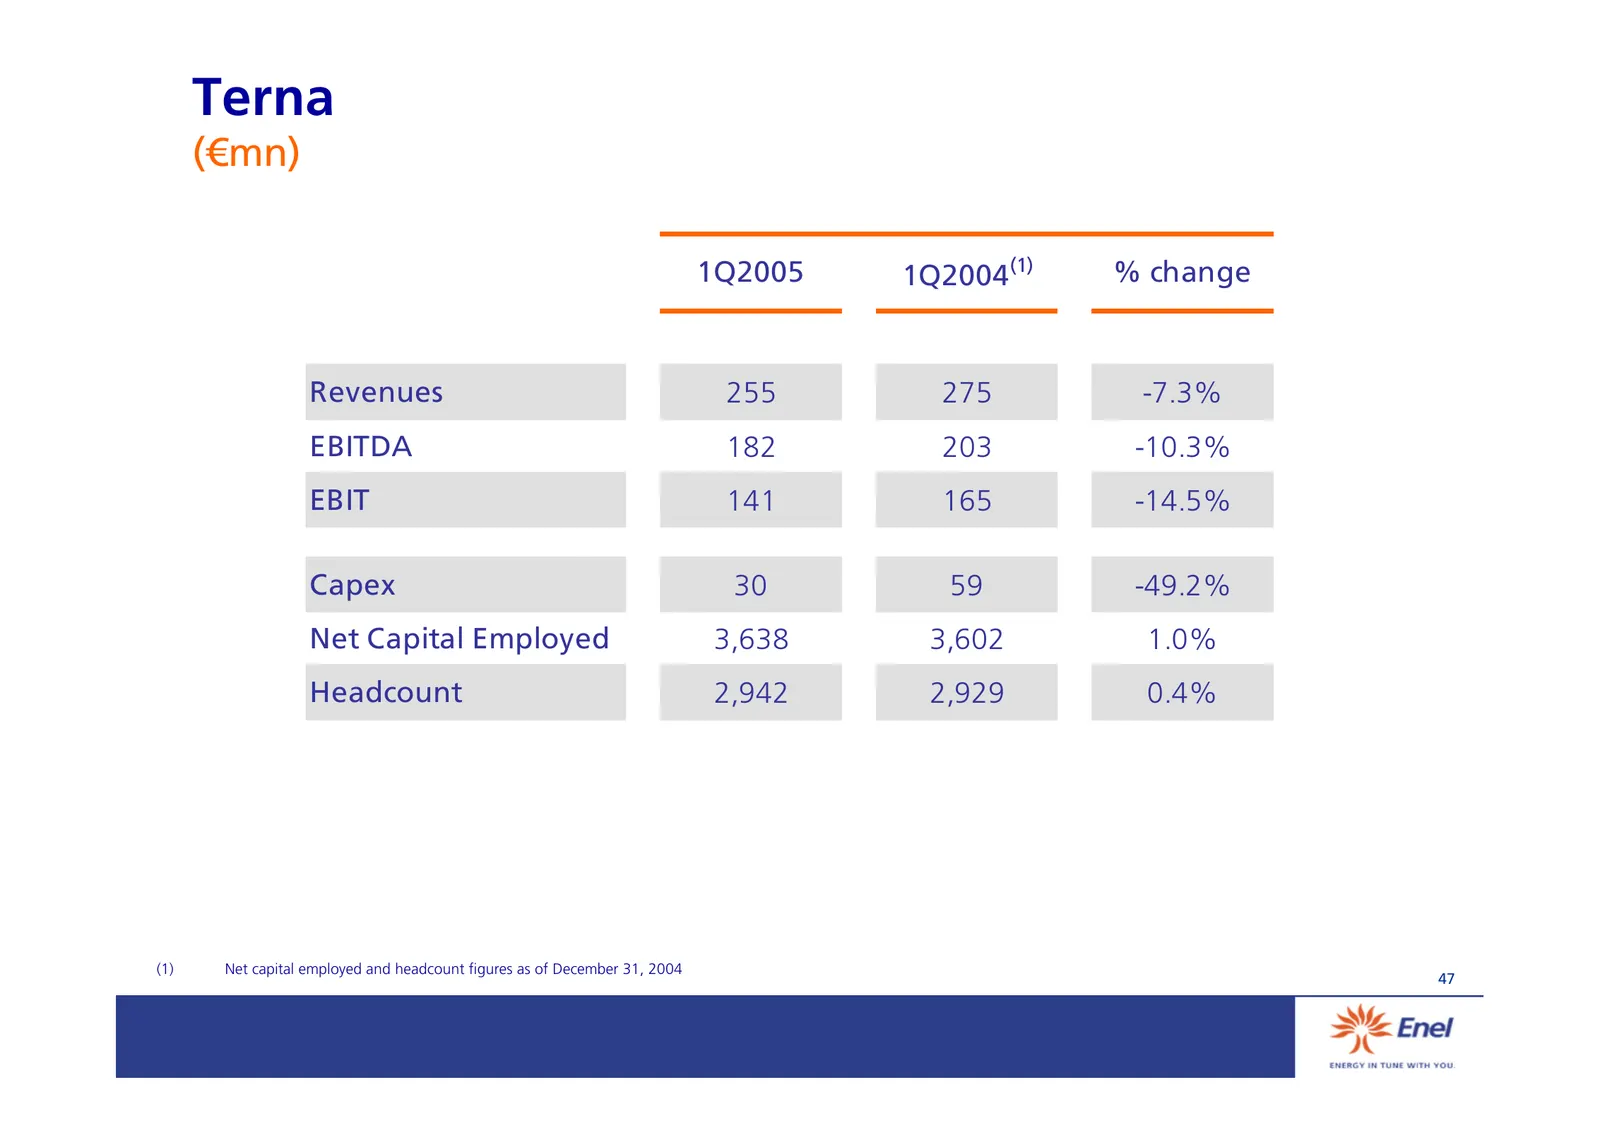
Slide 48: Terna
Terna (€mn) 1Q2005 1Q2004(1) % change Revenues 255 275 -7.3% EBITDA 182 203 -10.3% EBIT 141 165 -14.5% Capex 30 59 -49.2% Net Capital Employed 3,638 3,602 1.0% Headcount 2,942 2,929 0.4% (1) Net capital employed and headcount figures as of December 31, 2004 47
Slide 49: Wind
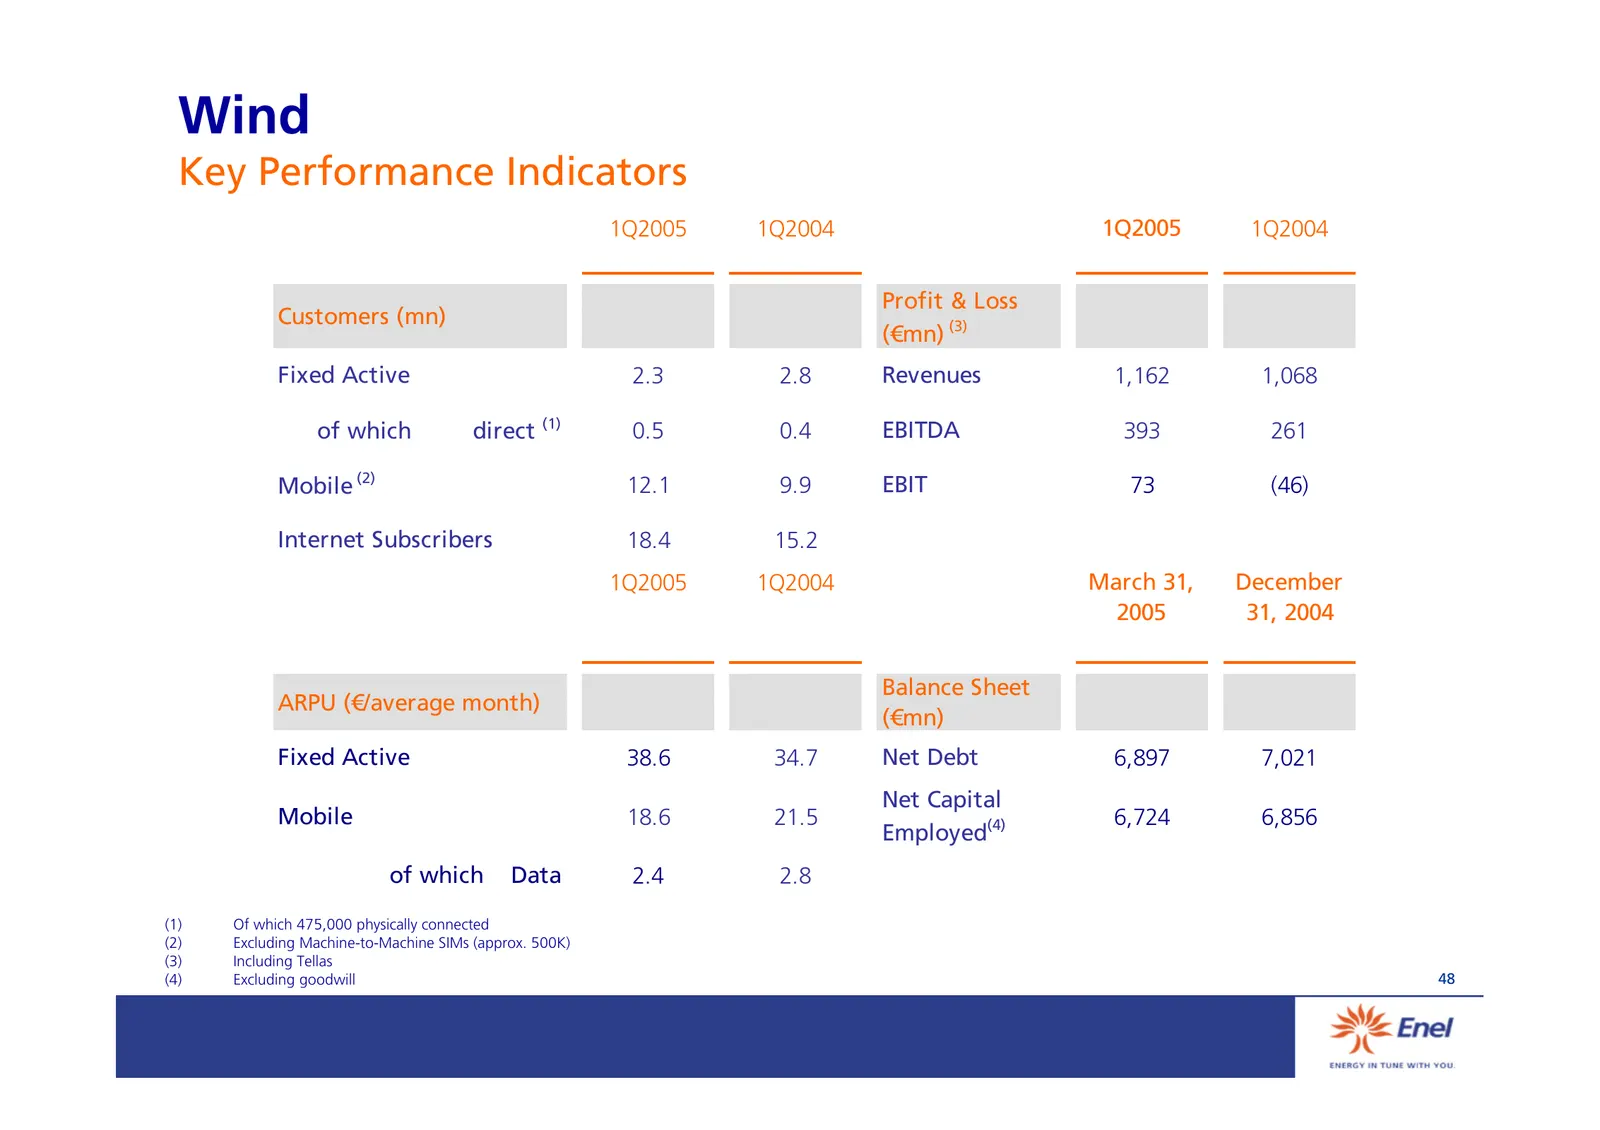
Wind Key Performance Indicators 1Q2005 1Q2004 1Q2005 1Q2004 Profit & Loss Customers (mn) (€mn) (3) Fixed Active 2.3 2.8 Revenues 1,162 1,068 of which direct (1) 0.5 0.4 EBITDA 393 261 Mobile (2) 12.1 9.9 EBIT 73 (46) Internet Subscribers 18.4 15.2 1Q2005 1Q2004 March 31, December 2005 31, 2004 Balan
Slide 50: Debt structure
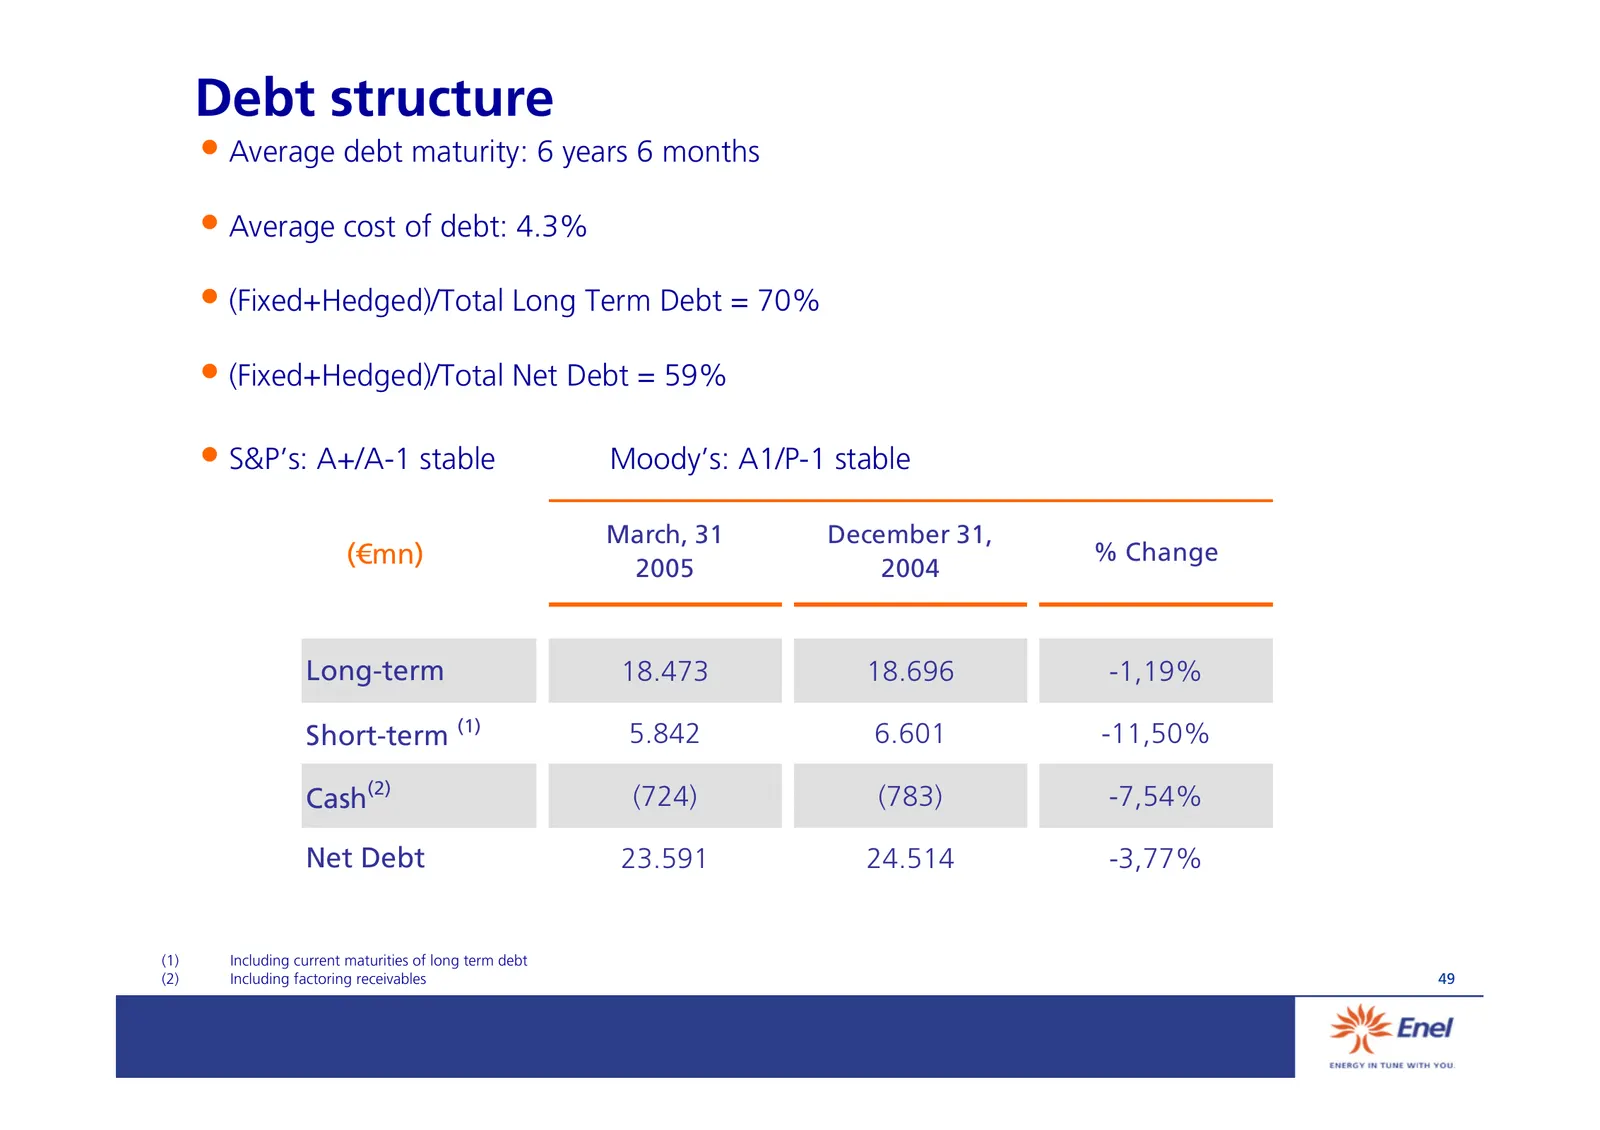
Debt structure • Average debt maturity: 6 years 6 months • Average cost of debt: 4.3% • (Fixed+Hedged)/Total Long Term Debt = 70% • (Fixed+Hedged)/Total Net Debt = 59% • S&P’s: A+/A-1 stable Moody’s: A1/P-1 stable March, 31 December 31, (€mn) % Change 2005 2004 Long-term 18.473 18.696 -1,19% Short-t
Slide 51: Services & Holding
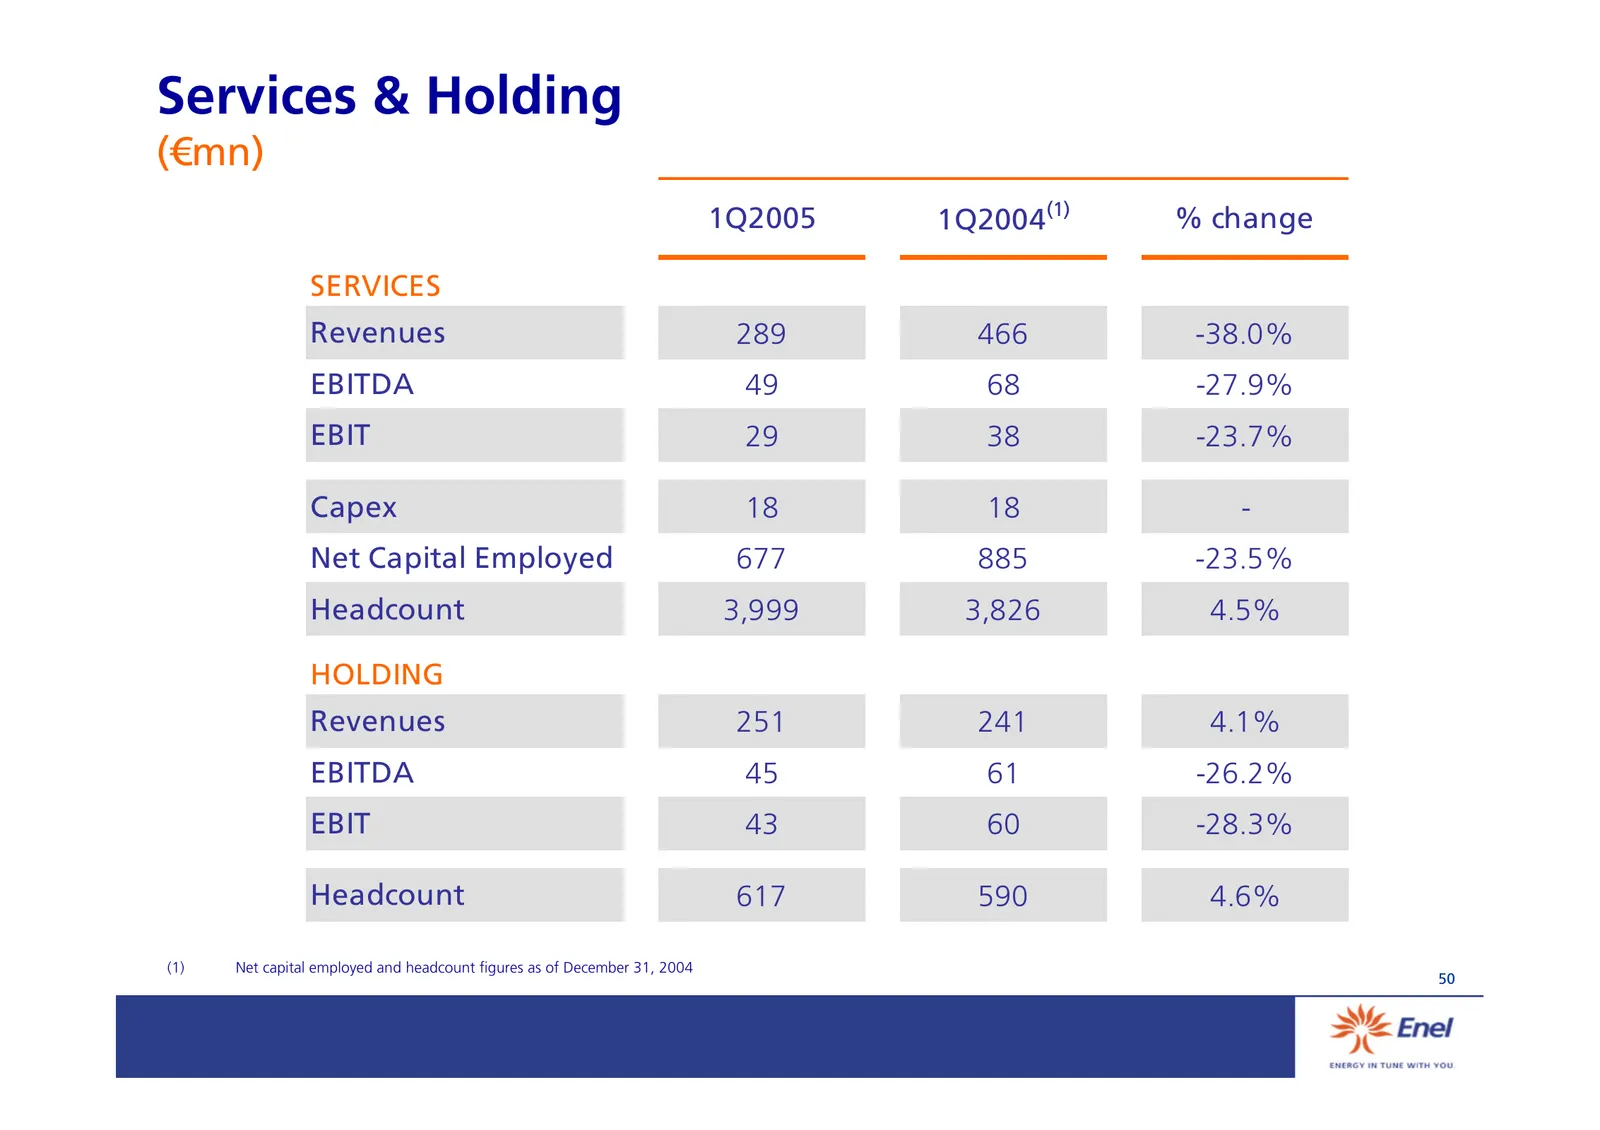
Services & Holding (€mn) 1Q2005 1Q2004(1) % change SERVICES Revenues 289 466 -38.0% EBITDA 49 68 -27.9% EBIT 29 38 -23.7% Capex 18 18 - Net Capital Employed 677 885 -23.5% Headcount 3,999 3,826 4.5% HOLDING Revenues 251 241 4.1% EBITDA 45 61 -26.2% EBIT 43 60 -28.3% Headcount 617 590 4.6% (1) Net ca
Slide 52: Capex
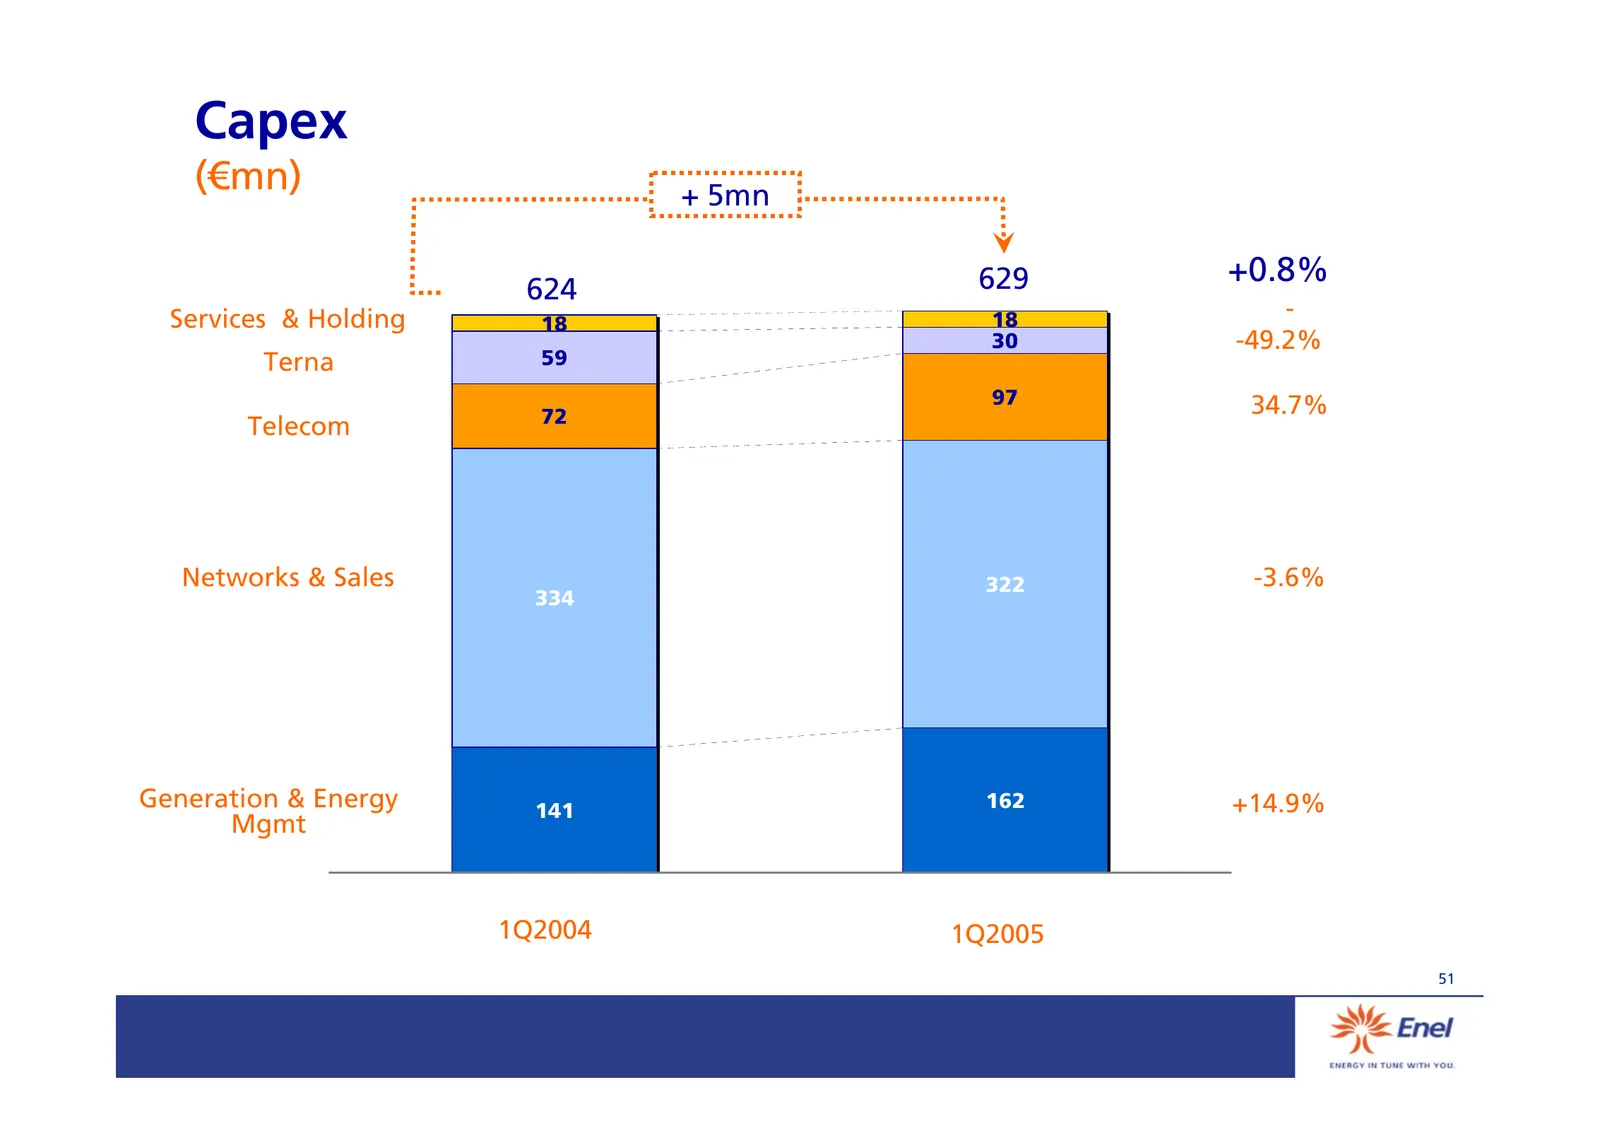
Capex (€mn) + 5mn 629 +0.8% 624 Services & Holding 18 - 18 30 -49.2% Terna 59 97 34.7% 72 Telecom Networks & Sales 322 -3.6% 334 Generation & Energy 141 162 +14.9% Mgmt 1Q2004 1Q2005 51
Slide 53: Strategic Annexes: Market & Regulation
Strategic Annexes Market & Regulation
Slide 54: 2005-2009 plan key assumptions
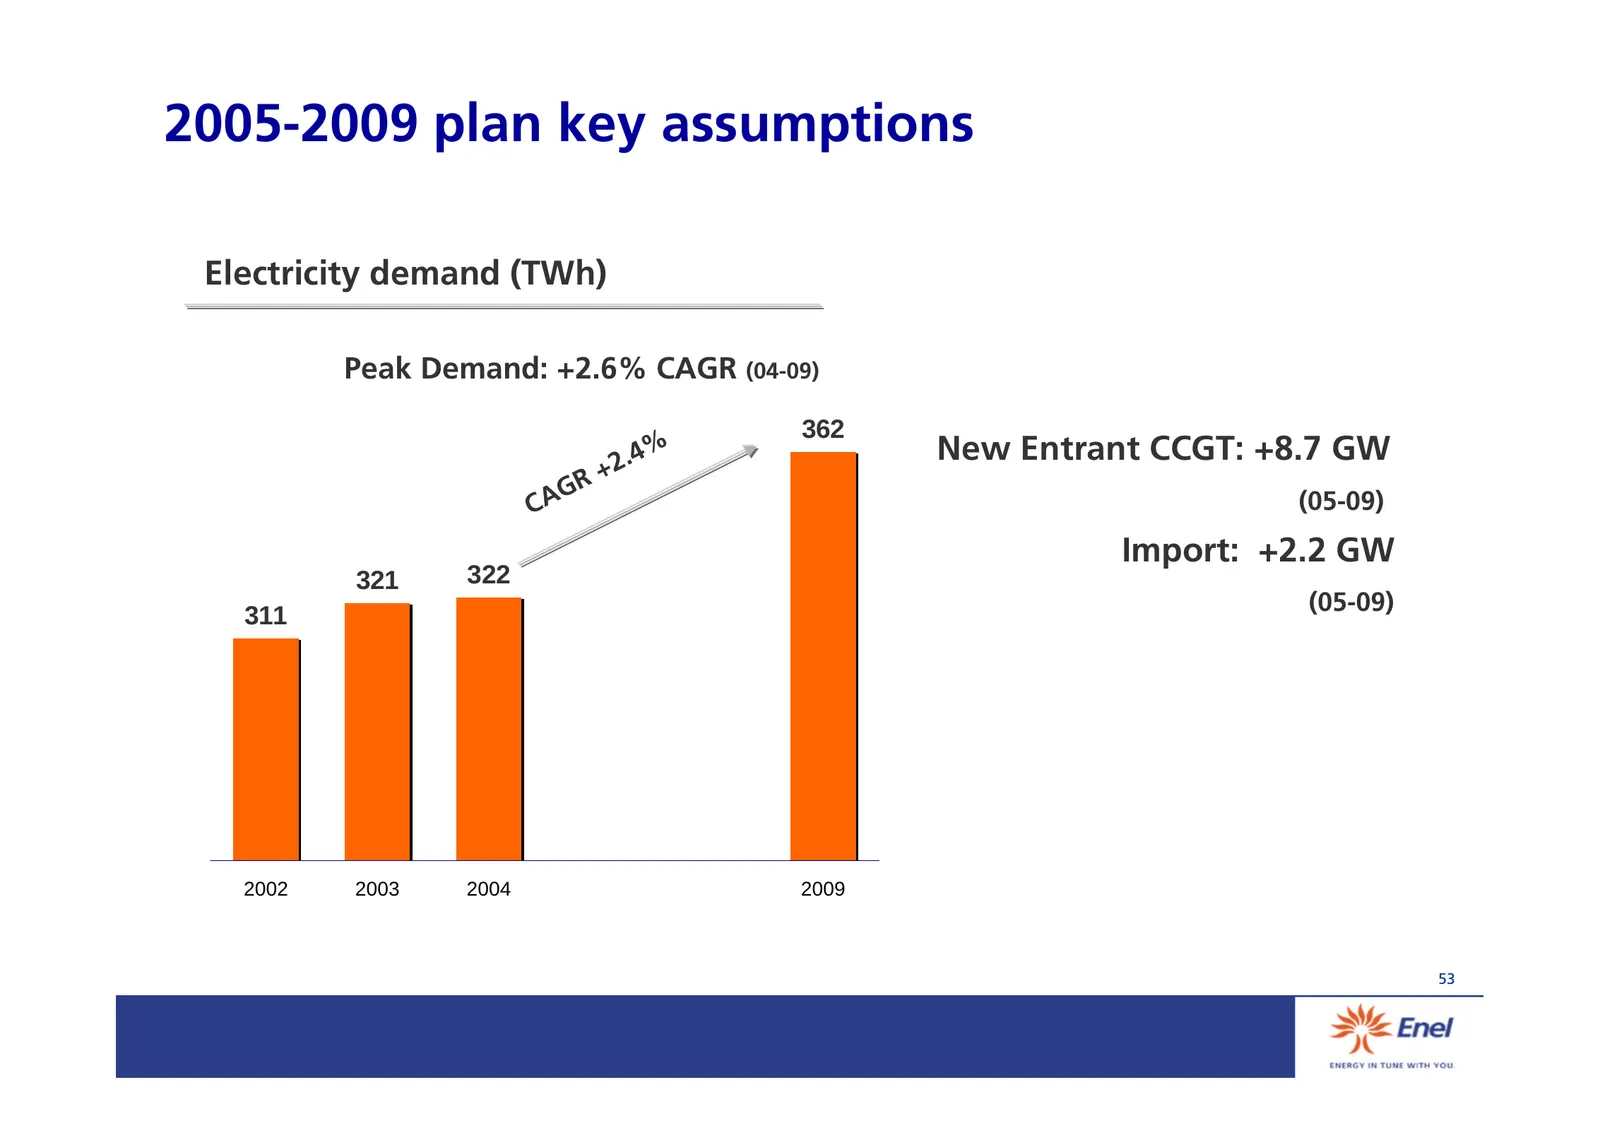
2005-2009 plan key assumptions Electricity demand (TWh) Peak Demand: +2.6% CAGR (04-09) 362 2.4 % New Entrant CCGT: +8.7 GW + AGR (05-09) C Import: +2.2 GW 321 322 (05-09) 311 2002 2003 2004 2009 53
Slide 55: 2005-2009 fuel price scenario
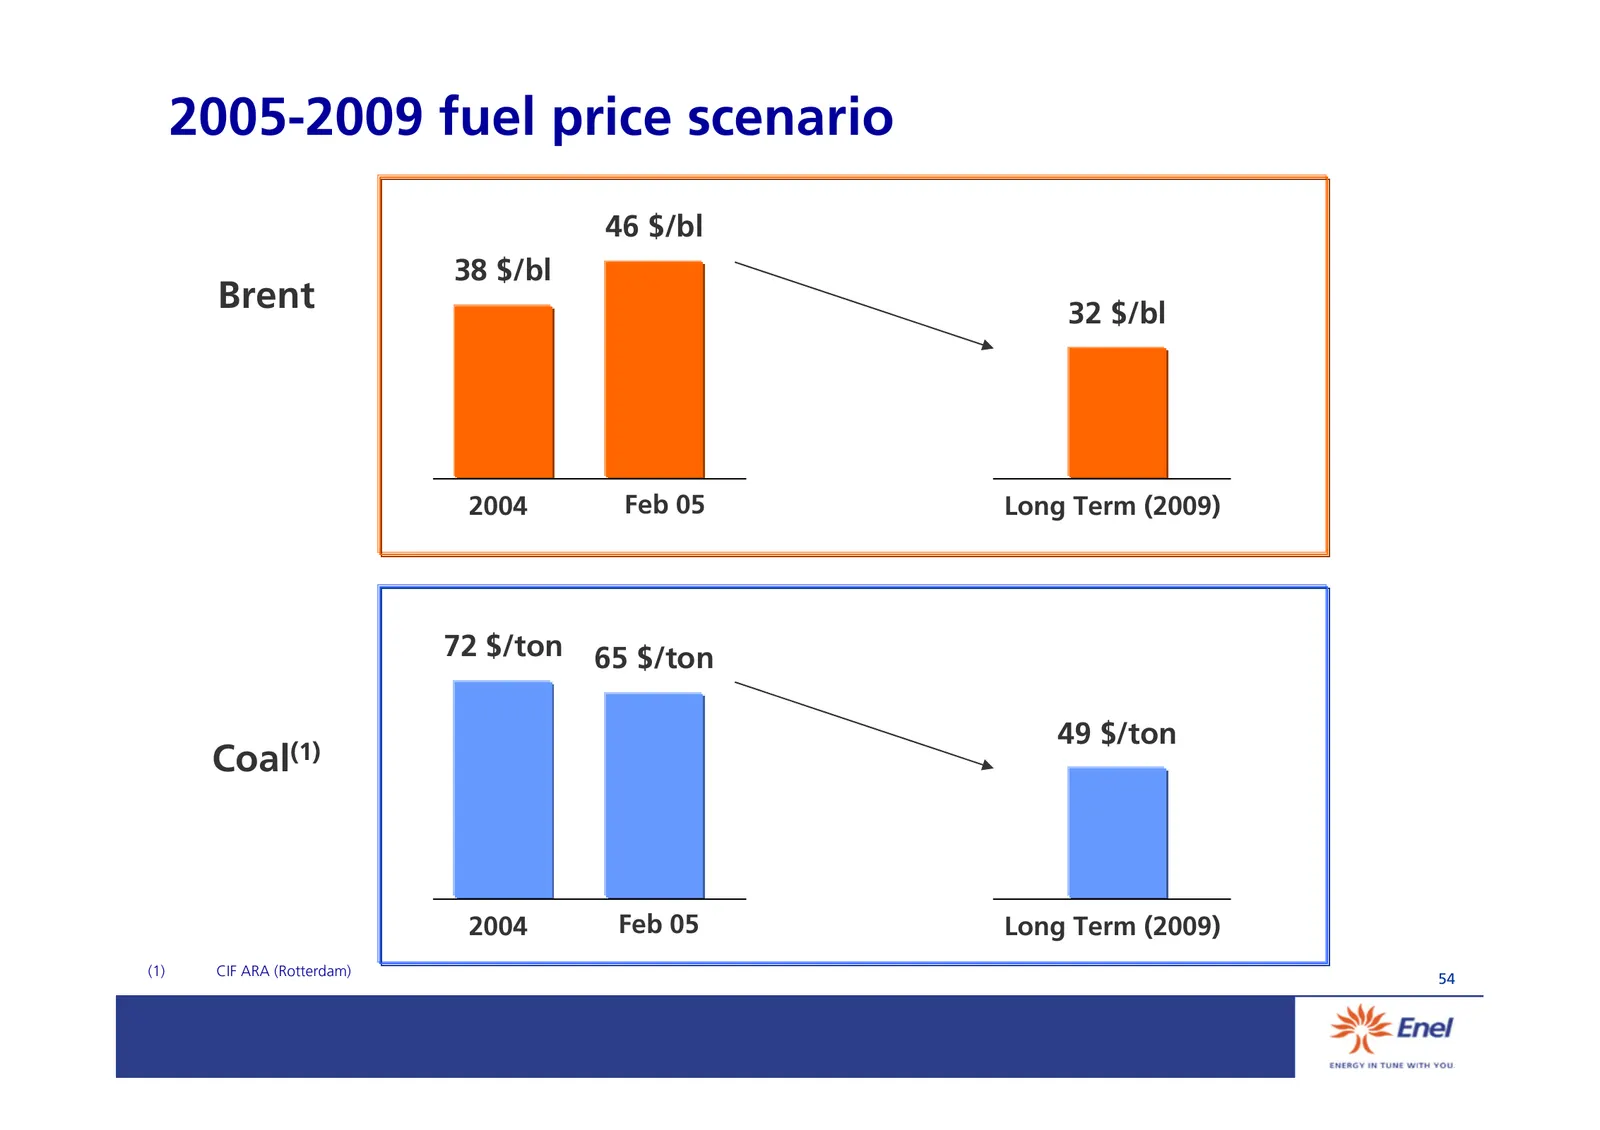
2005-2009 fuel price scenario 46 $/bl 38 $/bl Brent 32 $/bl 2004 Feb 05 Long Term (2009) 72 $/ton 65 $/ton 49 $/ton Coal(1) 2004 Feb 05 Long Term (2009) (1) CIF ARA (Rotterdam) 54
Slide 56: ETS: National Allocation Plan
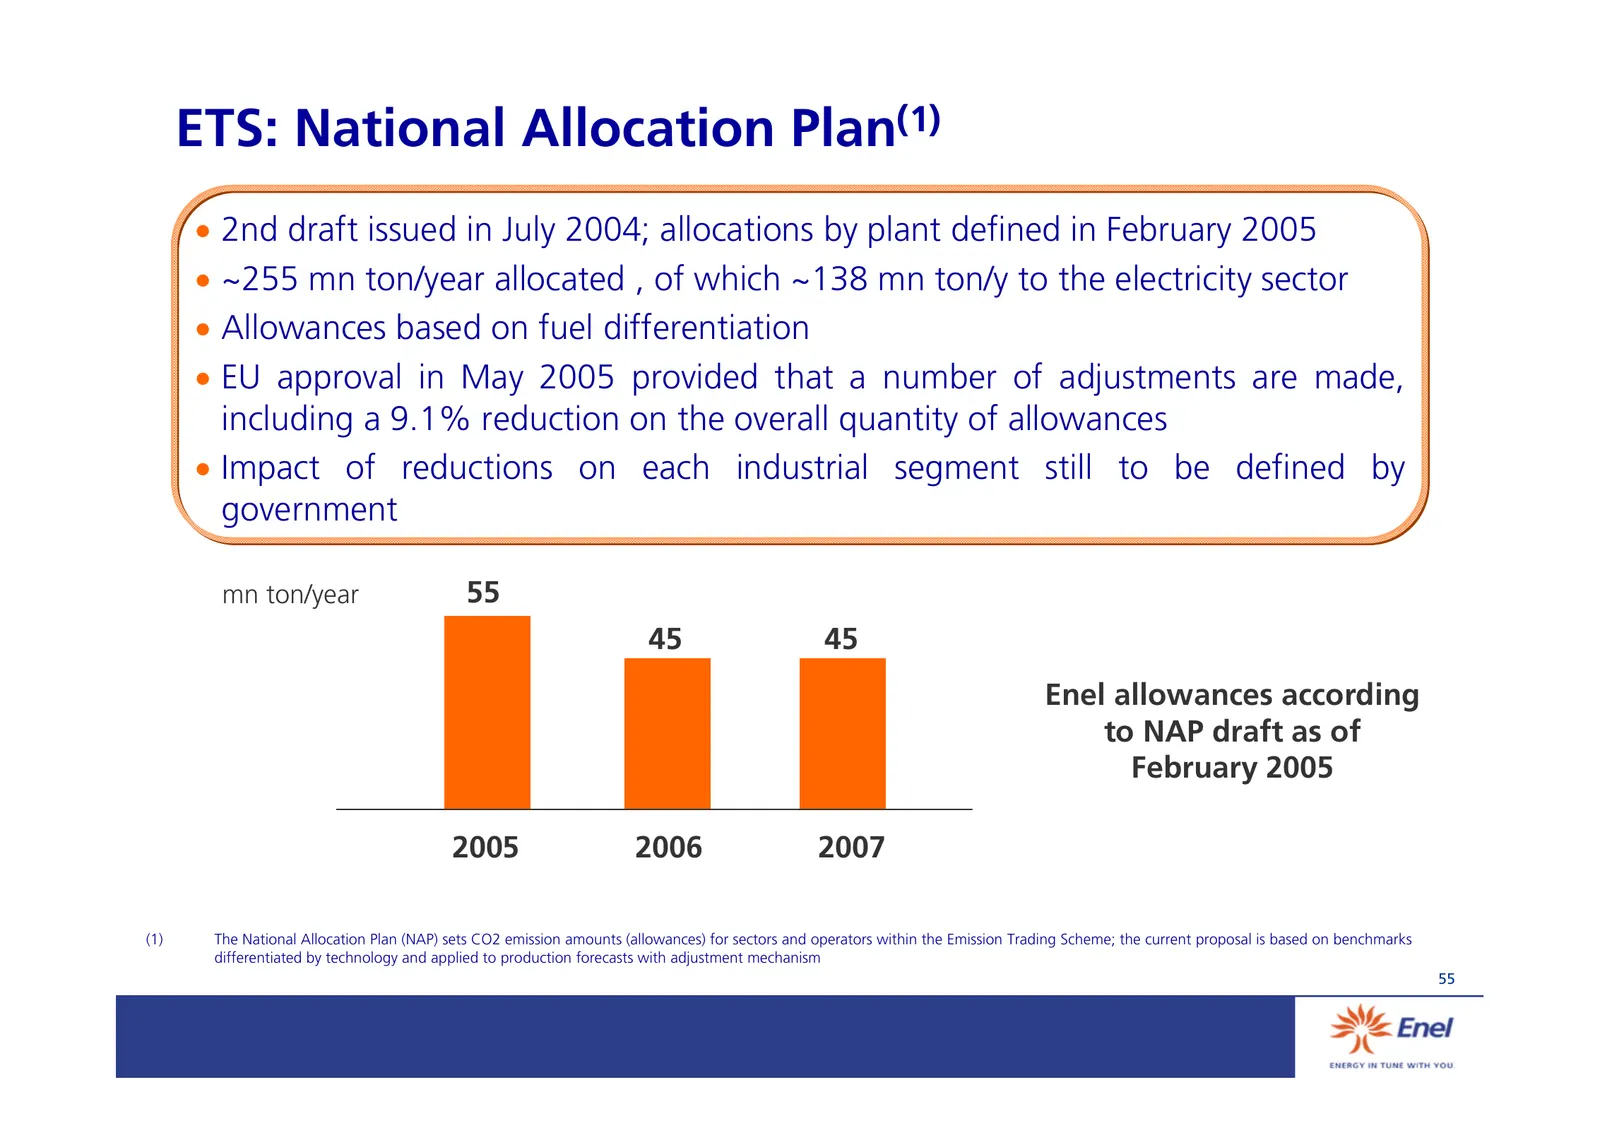
ETS: National Allocation Plan(1) • 2nd draft issued in July 2004; allocations by plant defined in February 2005 • ~255 mn ton/year allocated , of which ~138 mn ton/y to the electricity sector • Allowances based on fuel differentiation • EU approval in May 2005 provided that a number of adjustments a
Slide 57: Strategic Annexes: Targets
Strategic Annexes Targets 56
Slide 58: Generation and Energy Management
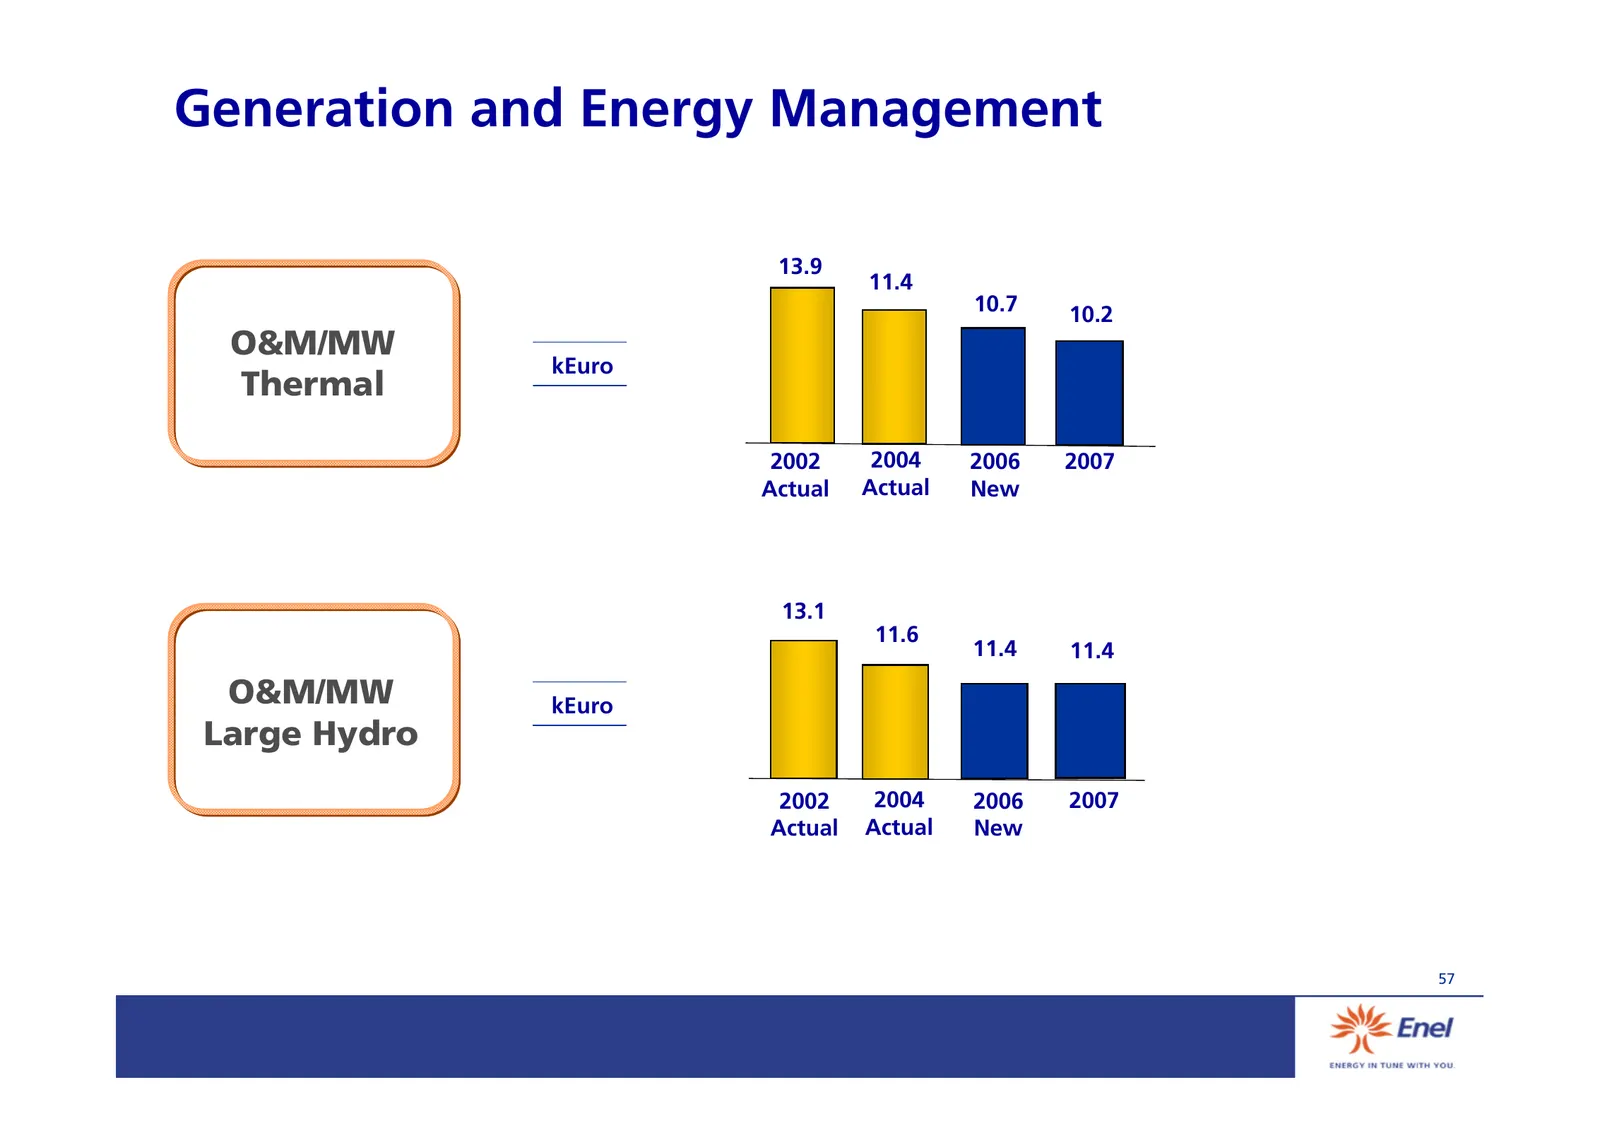
Generation and Energy Management 13.9 11.4 10.7 10.2 O&M/MW kEuro Thermal 2002 2004 2006 2007 Actual Actual New 13.1 11.6 11.4 11.4 O&M/MW kEuro Large Hydro 2002 2004 2006 2007 Actual Actual New 57
Slide 59: Distribution and Sales
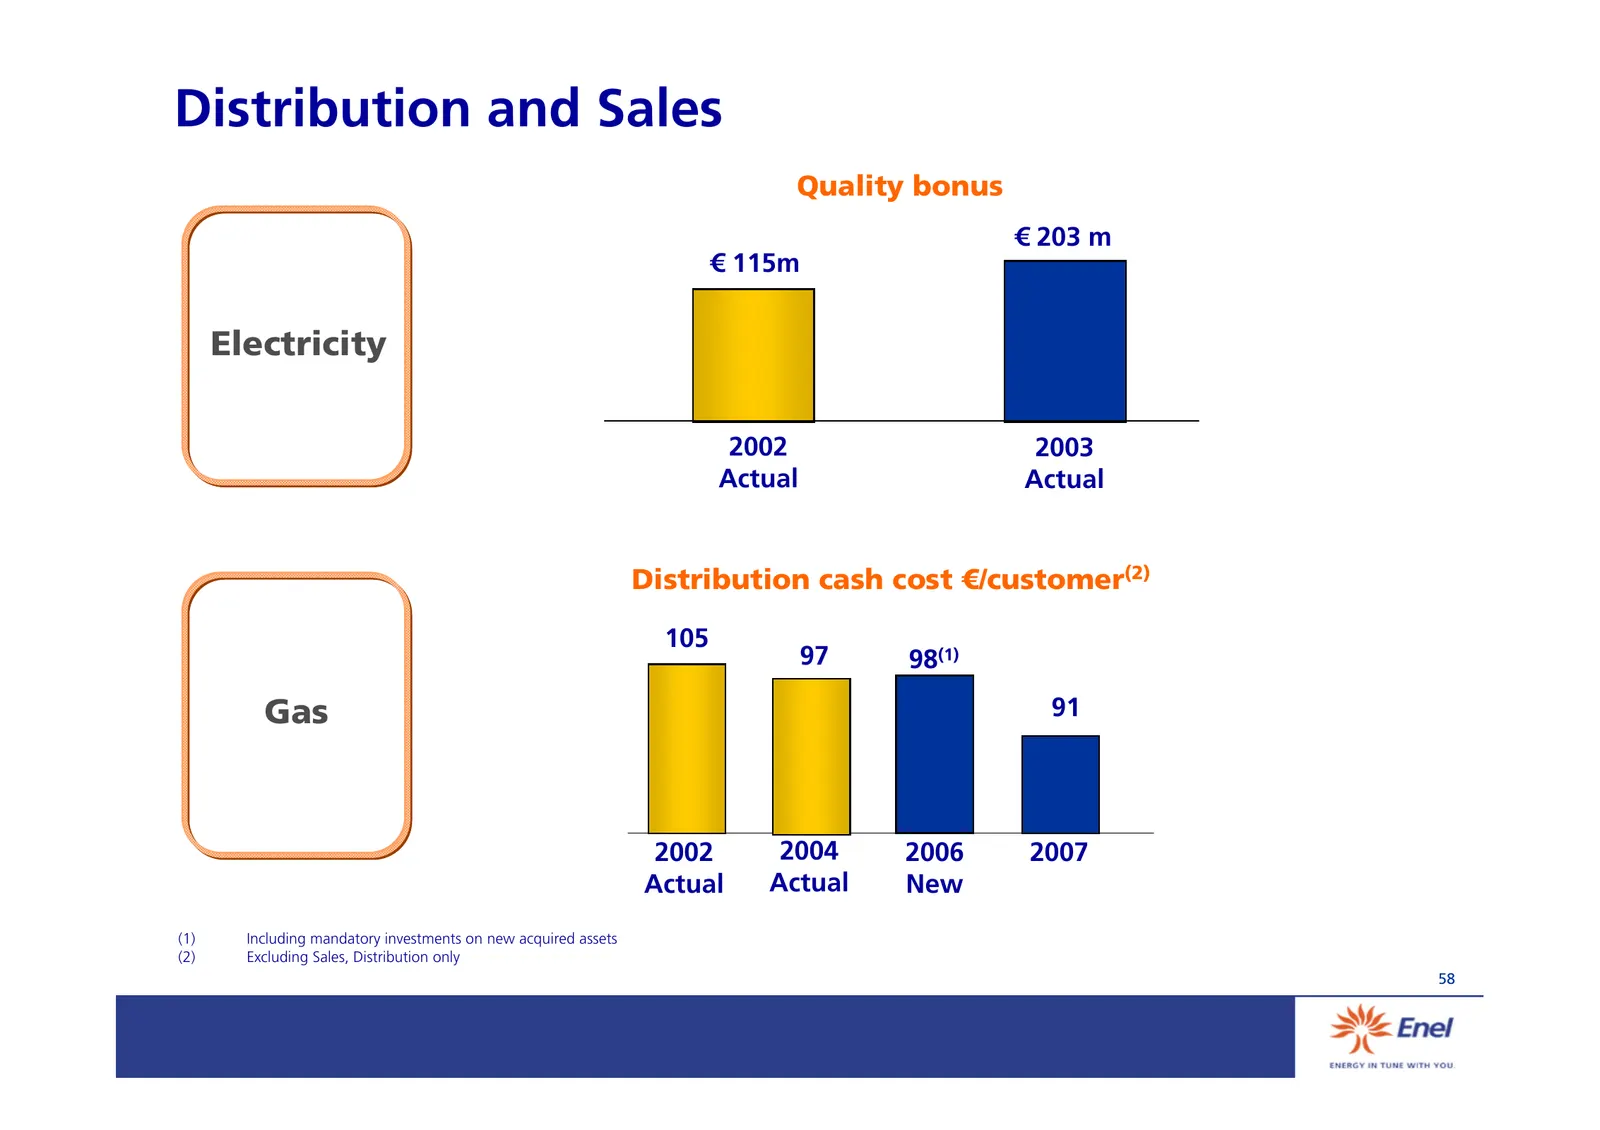
Distribution and Sales Quality bonus € 203 m € 115m Electricity 2002 2003 Actual Actual Distribution cash cost €/customer(2) 105 97 98(1) Gas 91 2002 2004 2006 2007 Actual Actual New (1) Including mandatory investments on new acquired assets (2) Excluding Sales, Distribution only 58
Slide 60: Wind performance 2002-04
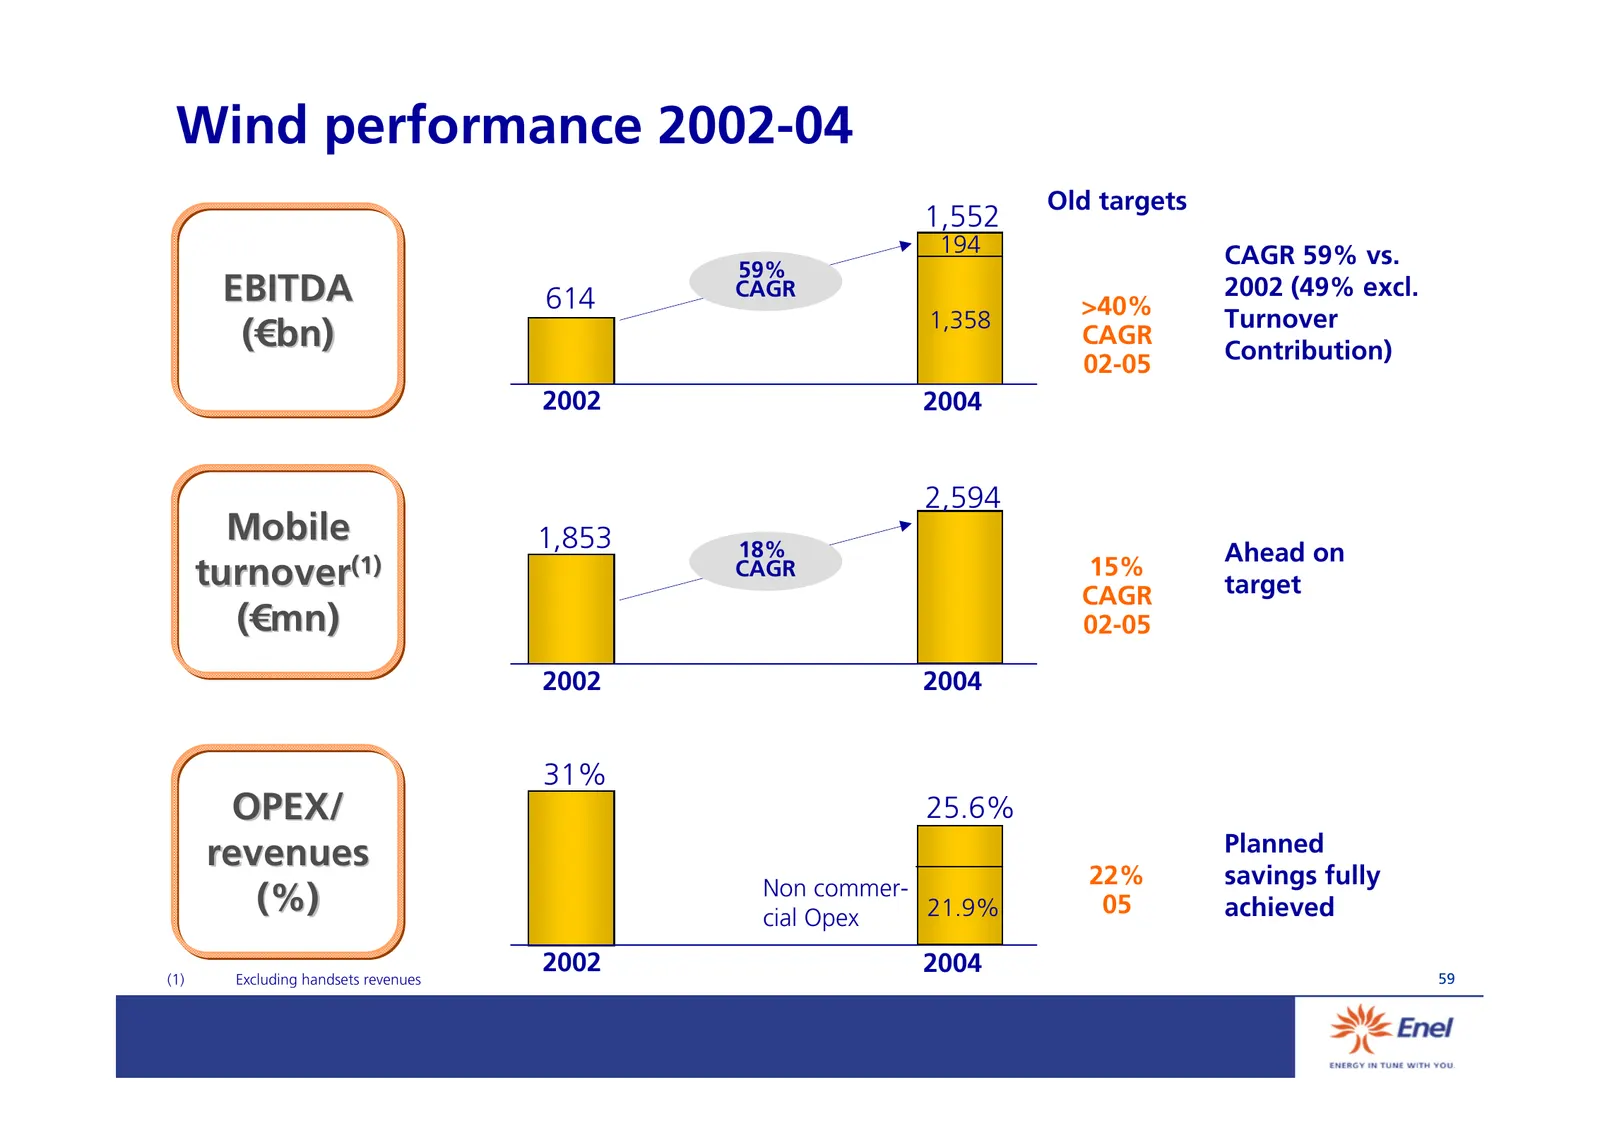
Wind performance 2002-04 Old targets 1,552 194 CAGR 59% vs. 59% EBITDA 614 CAGR >40% 2002 (49% excl. 1,358 Turnover (€bn) CAGR Contribution) 02-05 2002 2004 2,594 Mobile 1,853 18% Ahead on turnover(1) CAGR 15% target CAGR (€mn) 02-05 2002 2004 31% OPEX/ 25.6% revenues Planned Non commer- 22% savings
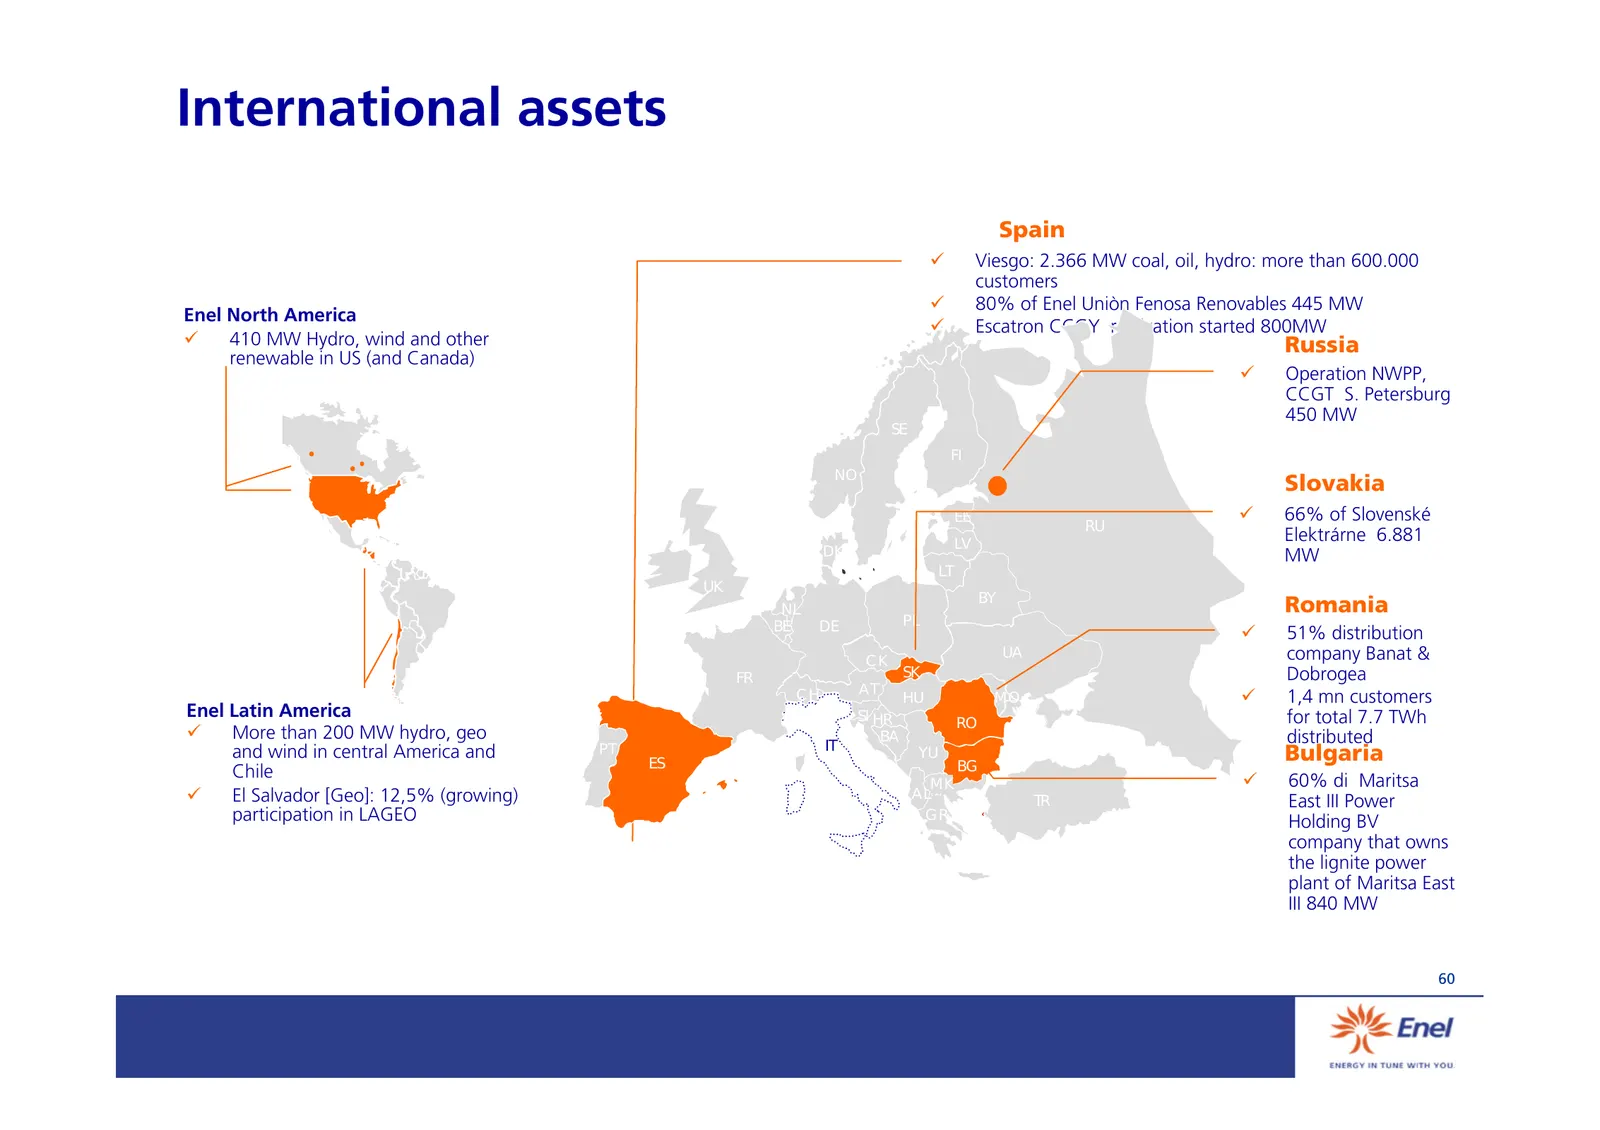
Slide 61: International assets
International assets Spain 9 Viesgo: 2.366 MW coal, oil, hydro: more than 600.000 customers 9 80% of Enel Uniòn Fenosa Renovables 445 MW Enel North America 9 Escatron CCGY realization started 800MW 9 410 MW Hydro, wind and other Russia renewable in US (and Canada) 9 Operation NWPP, CCGT S. Petersbur
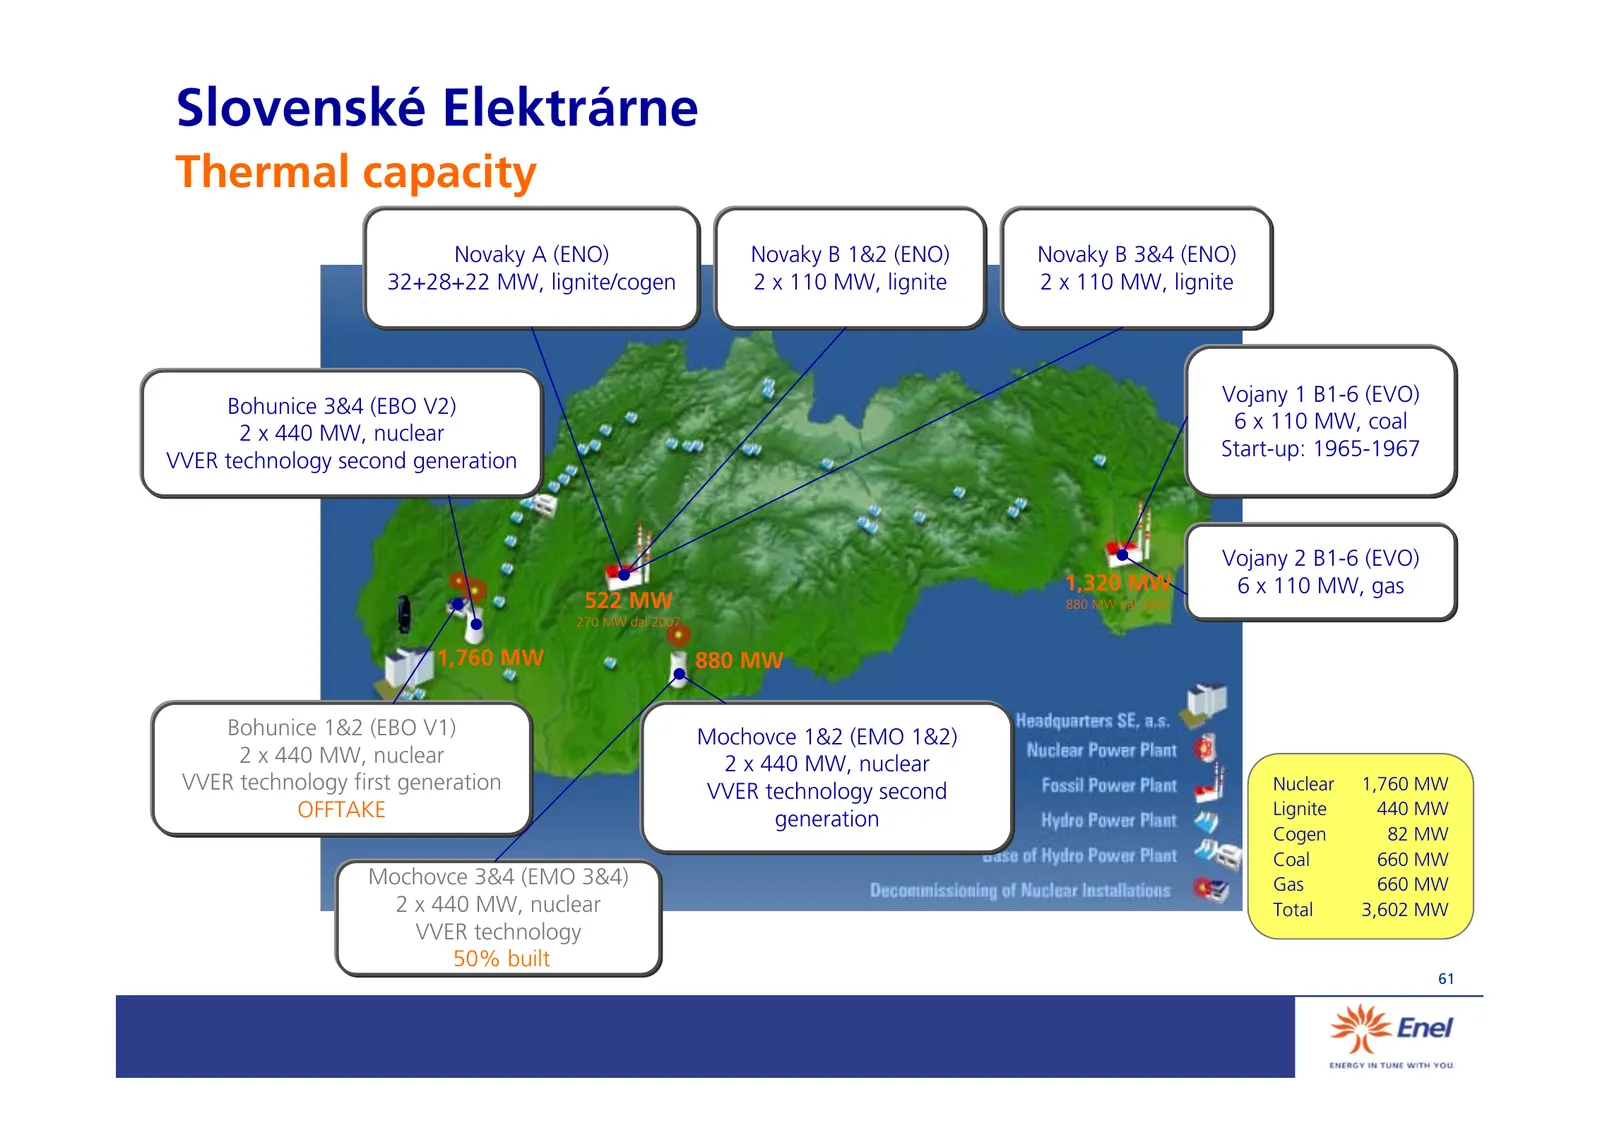
Slide 62: Slovenské Elektrárne: thermal capacity
Slovenské Elektrárne Thermal capacity Novaky A (ENO) Novaky B 1&2 (ENO) Novaky B 3&4 (ENO) 32+28+22 MW, lignite/cogen 2 x 110 MW, lignite 2 x 110 MW, lignite Vojany 1 B1-6 (EVO) Bohunice 3&4 (EBO V2) 6 x 110 MW, coal 2 x 440 MW, nuclear Start-up: 1965-1967 VVER technology second generation Vojany 2
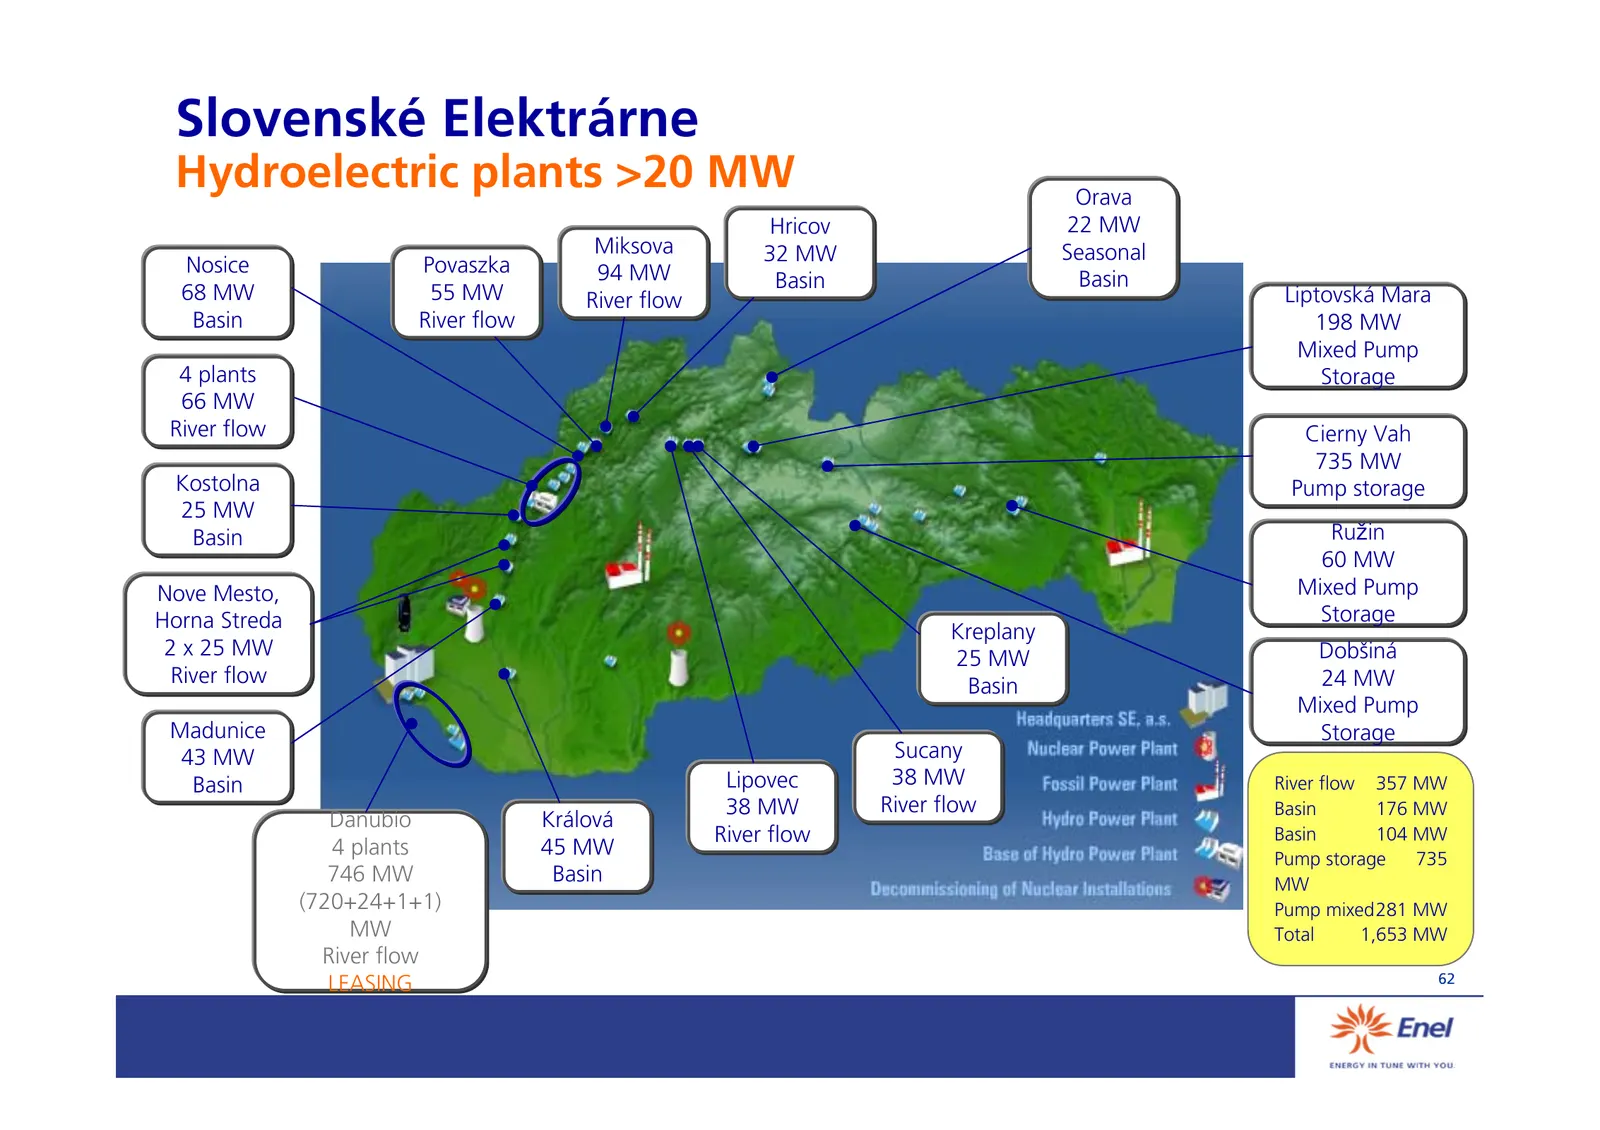
Slide 63: Slovenské Elektrárne: hydroelectric plants
Slovenské Elektrárne Hydroelectric plants >20 MW Orava Hricov 22 MW Miksova 32 MW Seasonal Nosice Povaszka 94 MW Basin Basin 68 MW 55 MW River flow Liptovská Mara Basin River flow 198 MW Mixed Pump 4 plants Storage 66 MW River flow Cierny Vah 735 MW Kostolna Pump storage 25 MW Basin Ružin 60 MW Nove
Source: Internet Archive copy of enel.com
More decks from Enel SpA
 Q1 2026 Earnings Presentation38 slides · May 7, 2026
 FY2025 Earnings Presentation30 slides · Mar 19, 2026
 Investor Day (February 2026)41 slides · Feb 23, 2026
 Investor Presentation (November 2025)139 slides · November 2025
 Presentazione Servizi inlingua ENEL10 slides · Sep 3, 2025
 Investor Presentation (September 2025)146 slides · September 2025