Alliance Holdings GP L.P — MLP Investor Conference 2008
37 slides from Alliance Holdings GP L.P's conference presentation, May 21, 2008

Slide 1: MLP Investor Conference May 21, 2008
Alliance Resource Partners, L.P. Alliance Holdings GP, L.P. MLP Investor Conference May 21, 2008 Exhibit 99.2 Alliance Resource Partners, L.P. Alliance Holdings GP, L.P. MLP Investor Conference May 21, 2008

Slide 2: Forward-Looking Statements
This presentation contains forward-looking statements and information that are based on the beliefs of Alliance Resource Partners, L.P. and Alliance Holdings GP, L.P. (the “Partnerships”) and those of their respective general partners (the “General Partners”), as well as assumptions made by and info

Slide 3: Outlook for coal
Outlook for coal Outlook for coal
Slide 4: Coal has been and is Most Likely to Remain the Cornerstone for America's Energy Future
Coal is a vital source of secure, affordable domestic energy The U.S. has a 200+ year supply of coal Coal comprises approximately 95% of U.S. energy reserves Approximately 50% of U.S. electric power generation is coal fired Oil, natural gas and uranium prices are at or near record levels On an as-de
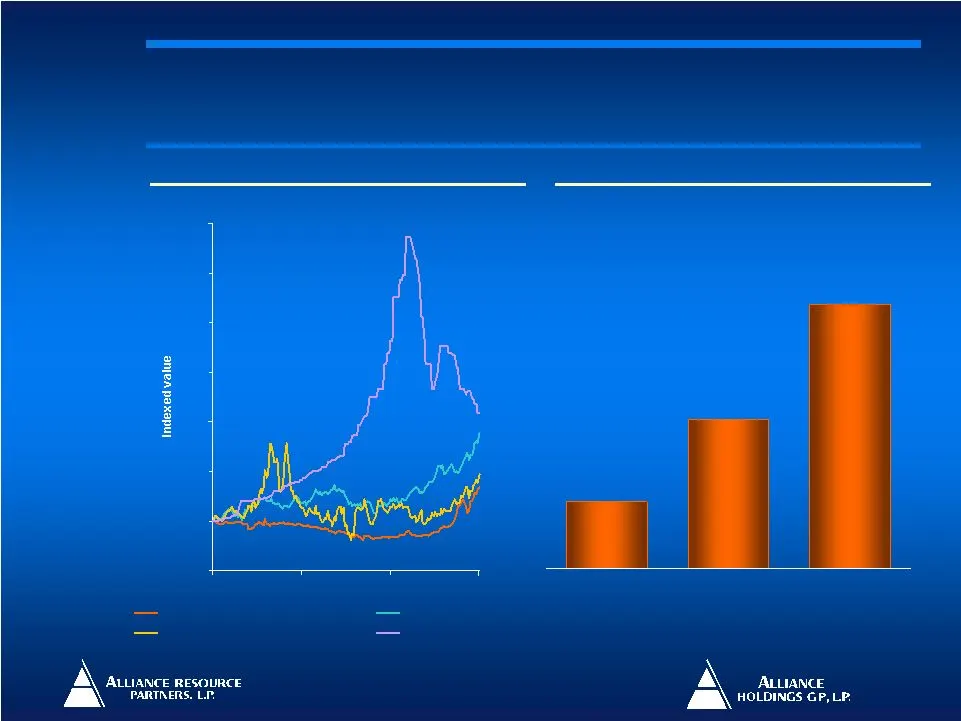
Slide 5: Coal has been the most Stable and Cost Effective Source of Energy
0 100 200 300 400 500 600 700 Jan-2005 Feb-2006 Mar-2007 May-2008 $5.10 $11.29 $20.11 Coal Natural Gas Petroleum Central Appalachian Coal - NYMEX Crude Oil, Light - NYMEX Natural Gas-Henry Hub MB-Uranium 5 Source: Bloomberg, Energy Information Administration and FactSet Weekly prices from January 1,
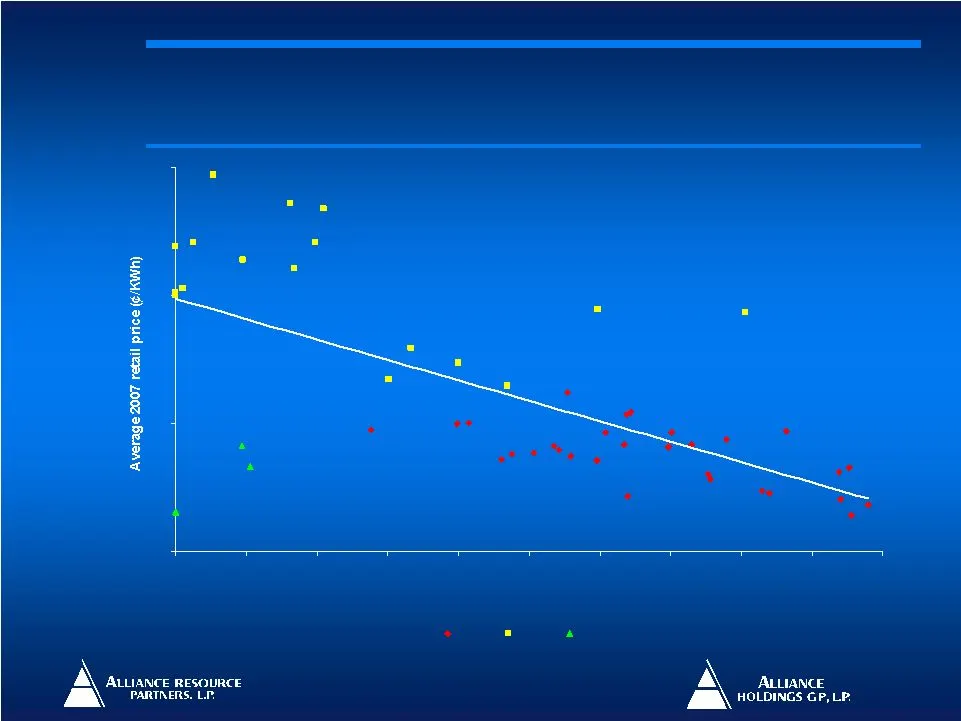
Slide 6: Low-cost Electricity comes from Coal
6 Source: Energy Information Administration, November 2007 4 8 12 16 0% 10% 20% 30% 40% 50% 60% 70% 80% 90% 100% Percent of generation from coal < 9.0 ¢ > 9.0 ¢ Hydro WY WV KY NE UT MO IA KS ND IN SD AR MN SC VA OK TN AL MT GA NM CO NC OH LA MS AZ WI MI PA IL NV TX FL DE MD DC VT CA AK NJ RI ME NH M
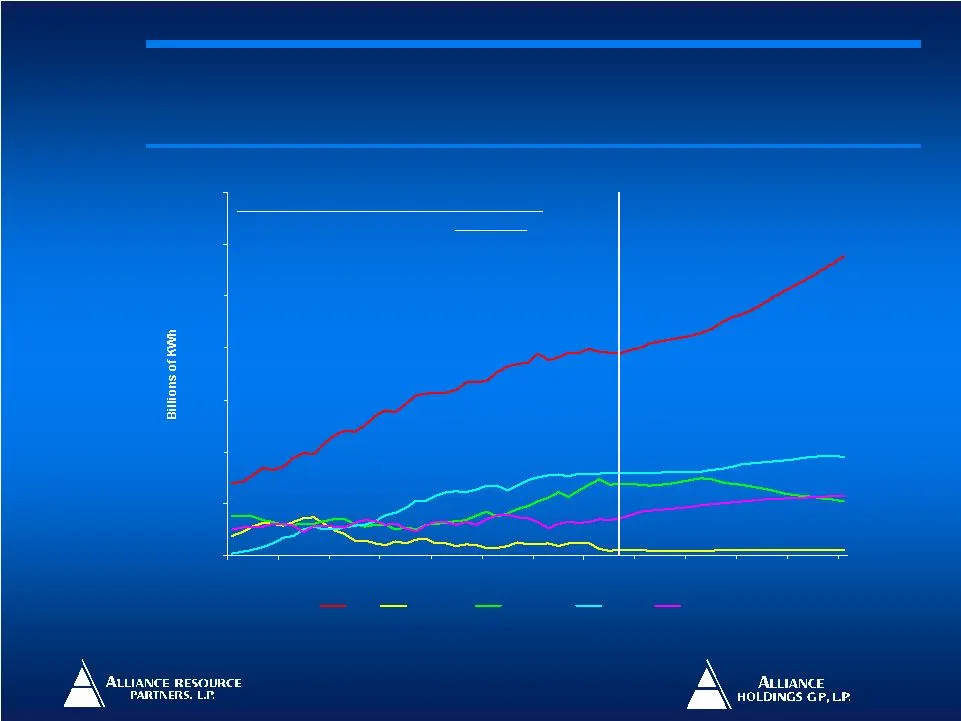
Slide 7: U.S. Coal Use Expected to Accelerate over next Several Decades
0 500 1,000 1,500 2,000 2,500 3,000 3,500 1970 1975 1980 1985 1990 1995 2000 2005 2010 2015 2020 2025 2030 Coal Petroleum Natural gas Nuclear Renewables 7 1 Renewables include hydroelectric, solar and wind. Source: Energy Information Administration, Annual Energy Review 2007 and Annual Energy Outloo
Slide 8: World's Fastest Growing Fuel
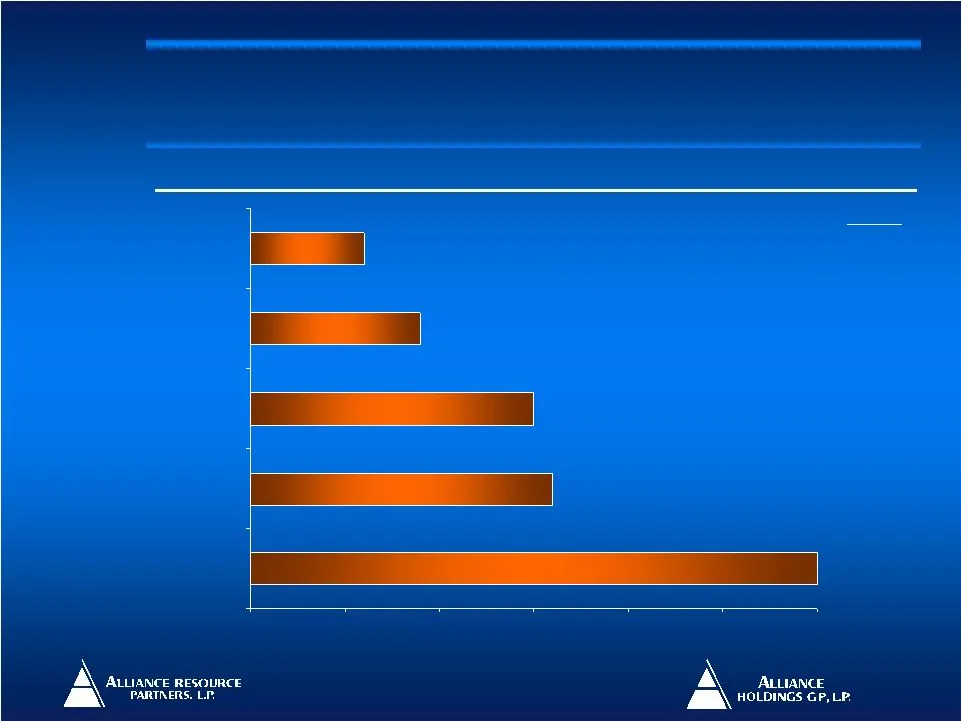
30% 16% 15% 9% 6% 0 5 10 15 20 25 30 Coal Natural Gas Hydro Oil Nuclear CAGR 1.1% 1.7% 2.9% 3.1% 5.3% Source: BP Statistical Review of World Energy, June 2007. Figures represent change from 2001 to 2006. 8 World’s Fastest Growing Fuel World’s Fastest Growing Fuel Five-year change in global energy co
Slide 9: Developing Nations will Increase Energy Use and put Pressure on Global Supply
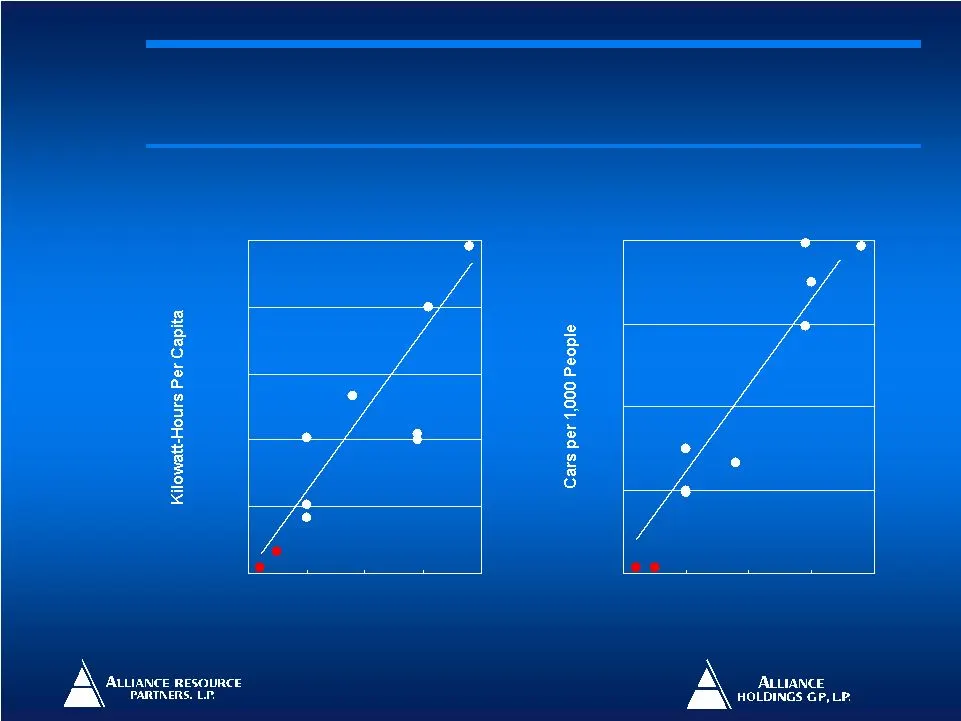
Electricity Usage Per Capita 0 3,000 6,000 9,000 12,000 15,000 $0 $10,000 $20,000 $30,000 $40,000 GDP Per Capita (in $U.S.) U.S. Russia Australia U.K. Italy Mexico Malaysia S. Korea Source: United Nations Human Development Report 2007, 2006 World Development Indicators (World Bank) Passenger Vehicle
Slide 10: Global Coal Demand Driven by Developing Countries
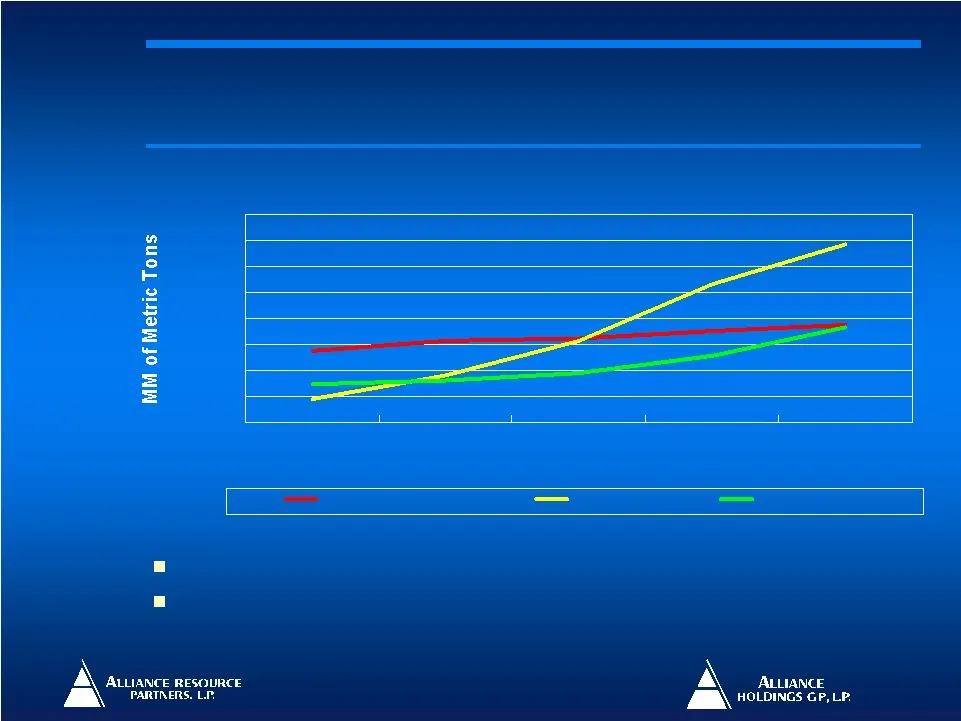
World Coal Demand 0 500 1,000 1,500 2,000 2,500 3,000 3,500 4,000 1980 2000 2005 2015 2030 OECD Countries China Rest of Non-OECD Economic growth expected to drive primary energy consumption up 60% by 2030 World coal demand expected to increase 73% from 2005 - 2030 Source: IEA World Energy Outlook 20
Slide 11: Coal Prices Reaching All-Time Highs
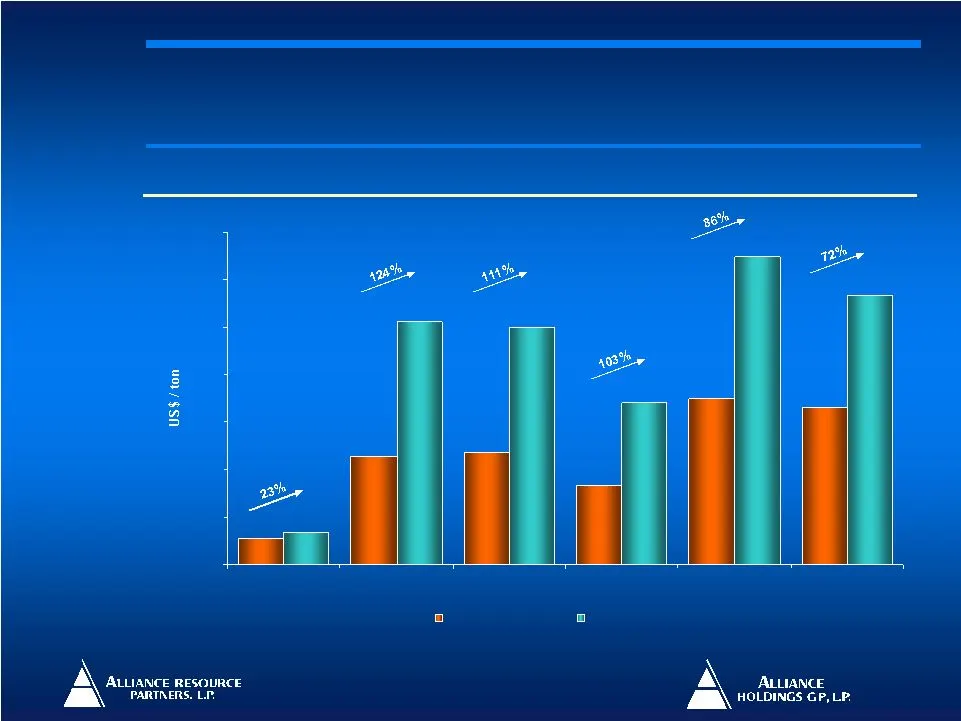
$10.95 $45.75 $47.50 $33.50 $70.00 $66.00 $13.50 $102.50 $100.00 $68.00 $130.00 $113.50 $0 $20 $40 $60 $80 $100 $120 $140 PRB CAPP NAPP ILB Australia (Newcastle) South Africa (Richards Bay) October 2007 May 2008 Source:Bloomberg and industry research Note: Australia (Newcastle) and South Africa (Ric

Slide 12: International Coal Supply and Demand Dynamics
Confluence of issues have constrained international coal supply Chinese market shifts to net importer of coal Australian port congestion and infrastructure deficiencies are compounded by severe weather South Africa’s aging power grid force mines to halt operations Decrease in Russian exports to Euro
Slide 13: Action is Required NOW to avoid an Electricity Shortage
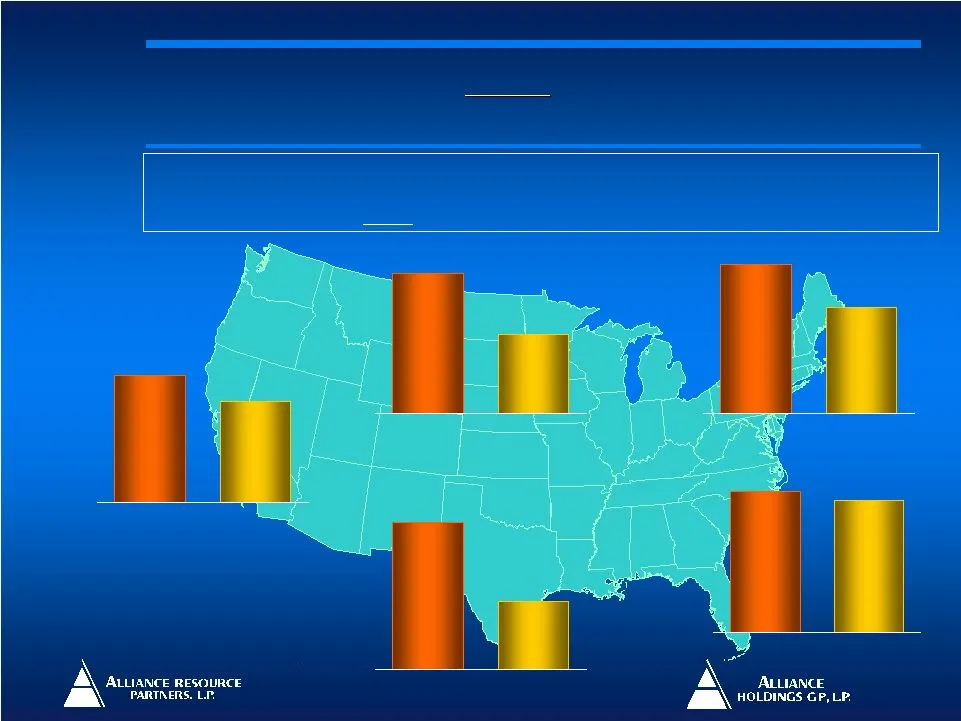
Between 2009 and 2011, capacity reserve margins will drop below levels needed to ensure electricity reliability. Decisions need to be made today to ensure reliable electricity generation for Americas’ future. The BEST answer to this problem continues to be coal-fired generation. Source: NERC 2007 Lo
Slide 14: Current Coal-Fired Capacity Additions
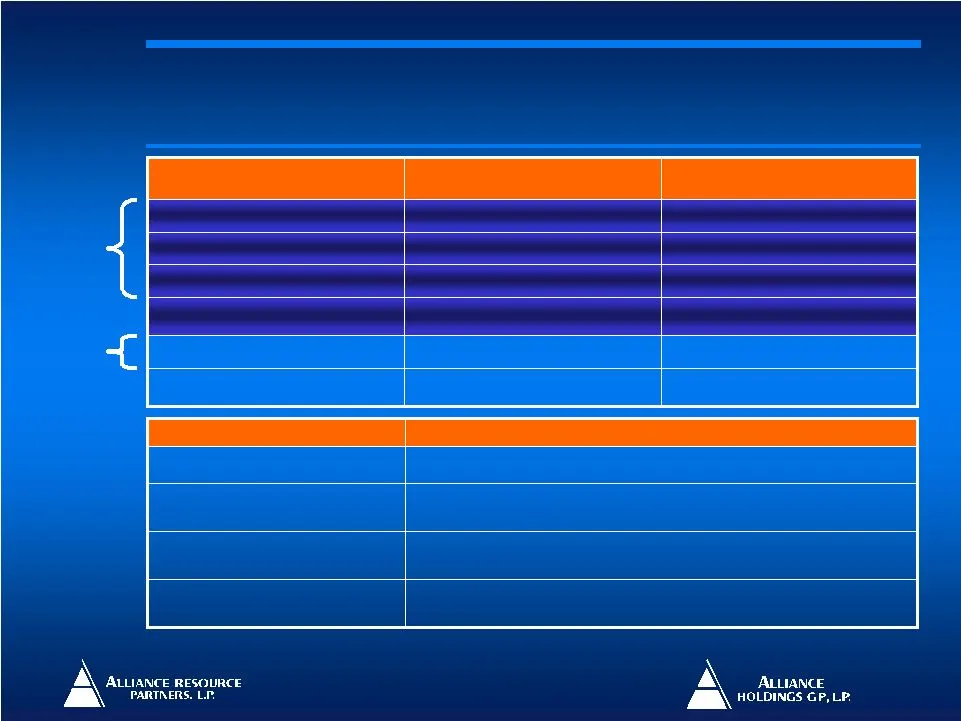
65,560 114 TOTAL 42,394 67 Announced (Early Stages) 23,166 47 Sub Total 6,422 13 Permitted 1,859 6 Near Construction 14,885 28 Under Construction Capacity (MW) Number of Plants General Status Project is under construction Under Construction Description Status Listing Early stages of development to f

Slide 15: New Coal-Fired Power Plant Development
Following several years of delay, new coal-fired generation is increasingly required for maintaining minimum regional electricity capacity margins Forecasts of North American natural gas supply to the U.S. are flat to declining by 2030; added gas-fired generation needs will rely on imported liquefie
Slide 16: Coal Usage is Increasingly Clean
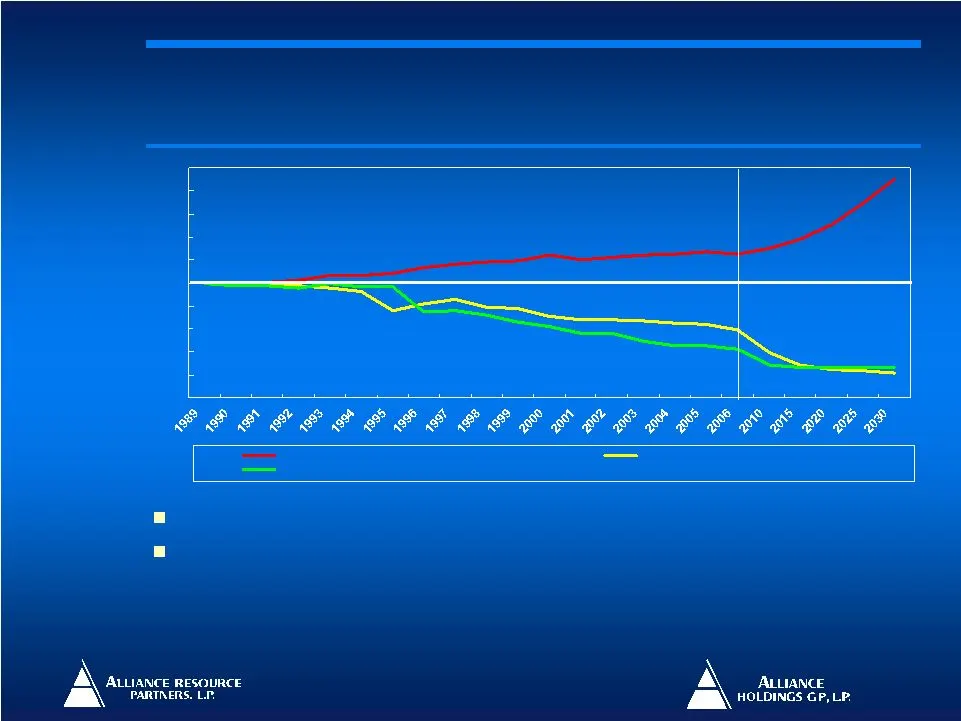
-100% -80% -60% -40% -20% 0% 20% 40% 60% 80% 100% Electricity Generation from Coal Sulfur Dioxide Emissions (SO2) Nitrogen Oxide Emissions (NOx) Existing regulations have and are expected to further reduce emissions Utilization of coal gasification technologies creates opportunities to reduce carbon

Slide 17: Outlook for Alliance
Outlook for Alliance Outlook for Alliance
Slide 18: Alliance Snapshot
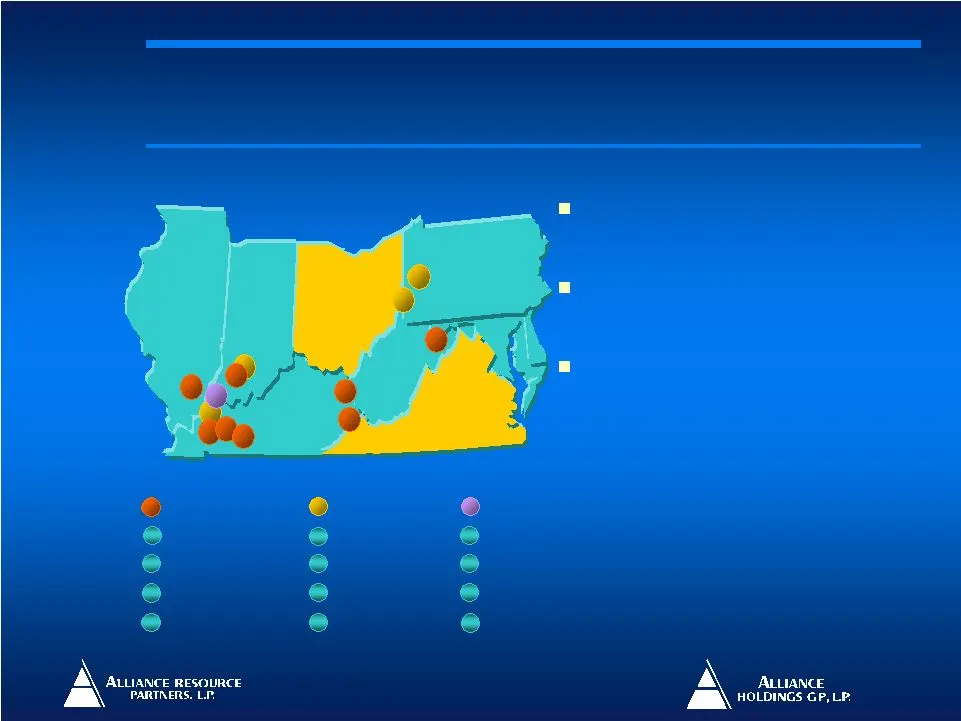
Alliance operates eight underground mining complexes in all major eastern coal producing regions Diversified reserve position in the Illinois Basin, Central Appalachia and Northern Appalachia regions Four significant organic development projects identified in the growing Illinois Basin and Northern
Slide 19: Reserves – Operations Summary
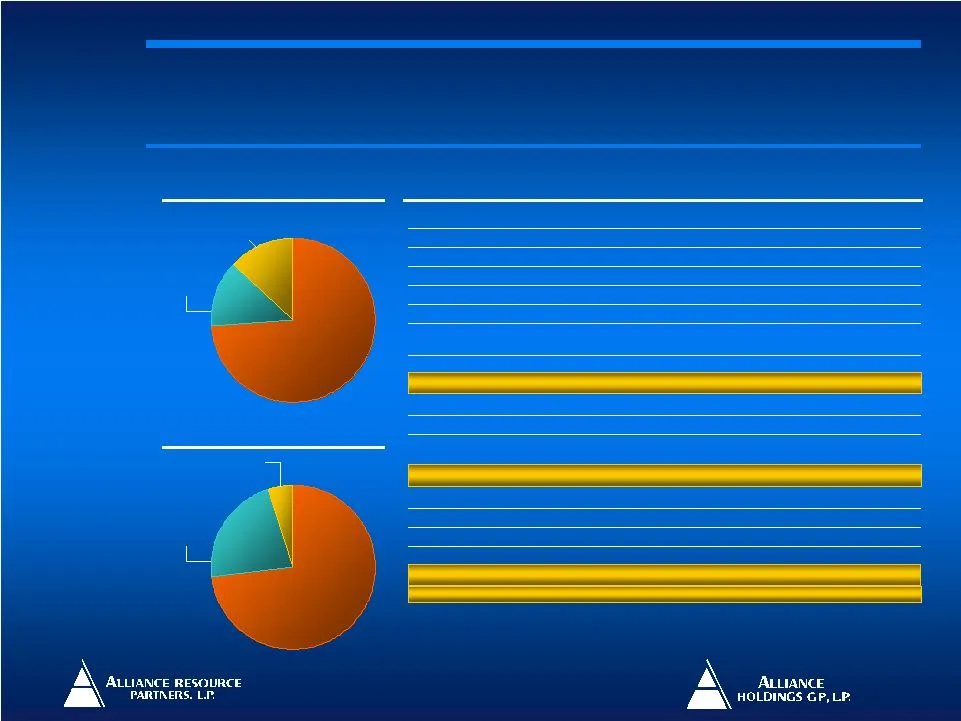
Central Appalachia 5% Northern Appalachia 22% Illinois Basin 73% Northern Appalachia 13% Central Appalachia 13% Illinois Basin 74% Allegheny Energy 56.7 – Penn Ridge – 70.5 – Tunnel Ridge Virginia Electric Power 29.5 3.2 Mettiki / Mettiki WV Progress; NRG; East KY Power 19.8 1.8 MC Mining Progress;
Slide 20: Alliance's Long Term Growth Strategy
Capitalize on the expected strong demand growth in scrubber quality coal Continue to be a disciplined producer - project developments tied to sales commitments Continuous focus on safety and operational optimization Pursue opportunistic bolt-on acquisitions 20 Alliance’s Long Term Growth Strategy Al
Slide 21: Organic growth projects
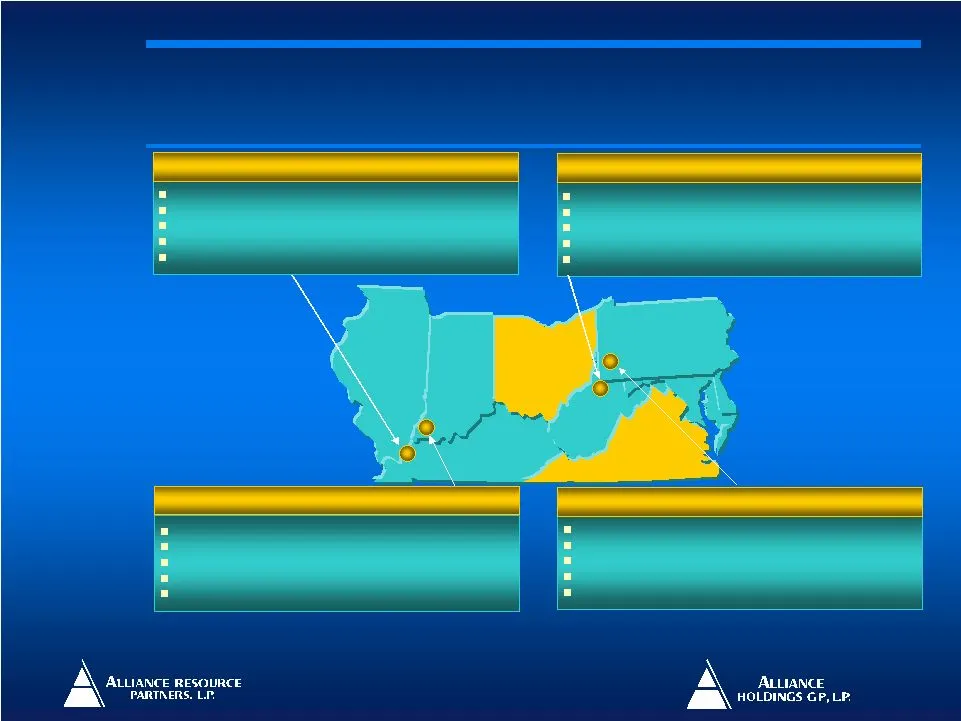
Permitting in progress Estimated capital cost ~ $210 – $235 million Estimated reserves ~ 70 million tons high sulfur coal Production capacity ~ 6 million tons/year Initial production in 2009 – 2011 Tunnel Ridge Initiating permitting process Estimated capital cost ~ $165 – $175 million Estimated rese
Slide 22: River View Facilities Overview
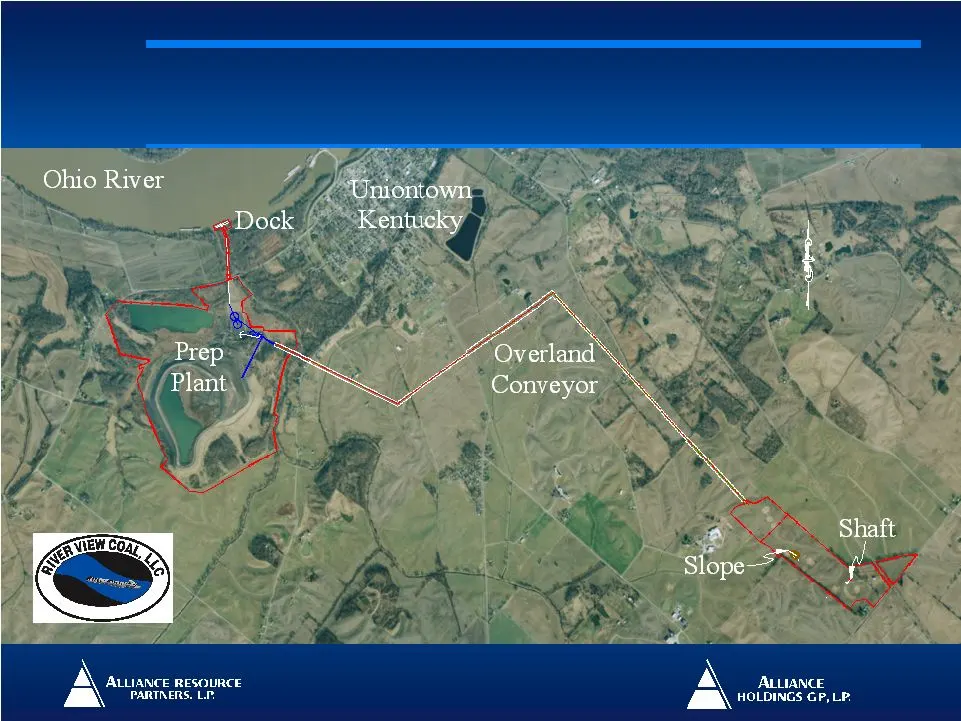
22 River View Facilities Overview River View Facilities Overview
Slide 23: Focus on Safety
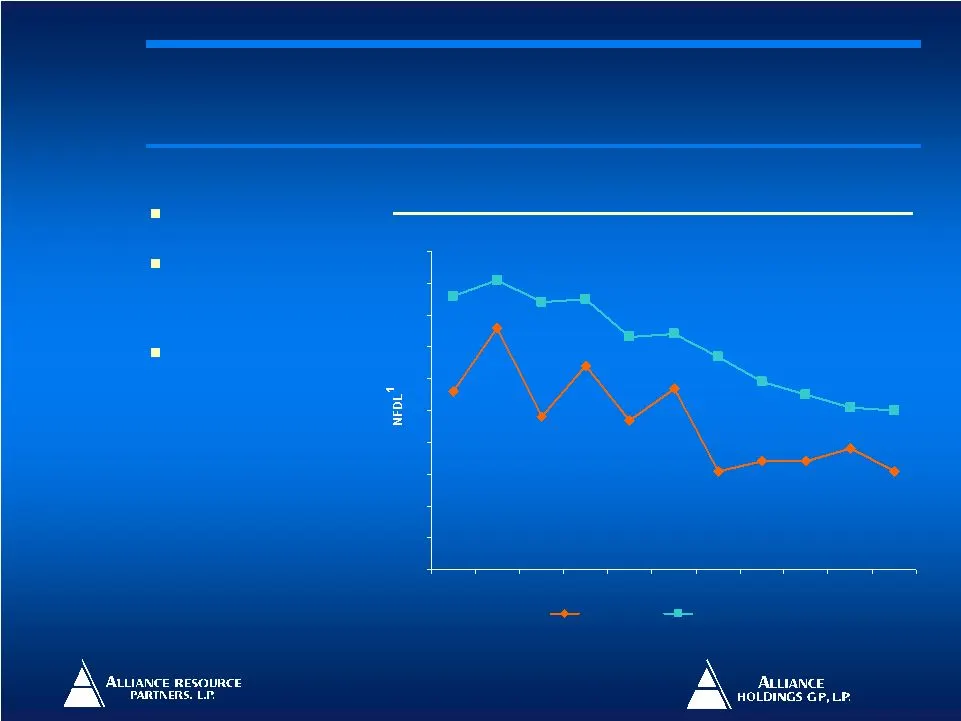
Safety is our #1 core value Alliance’s safety performance has been consistently better than its industry peer group Innovative use of technology to improve safety at all operations State-of-the-art Leaky Feeder mine communication systems Fiber optic based mine monitoring systems Proprietary Miner Tr
Slide 24: Well Positioned in Scrubber Markets
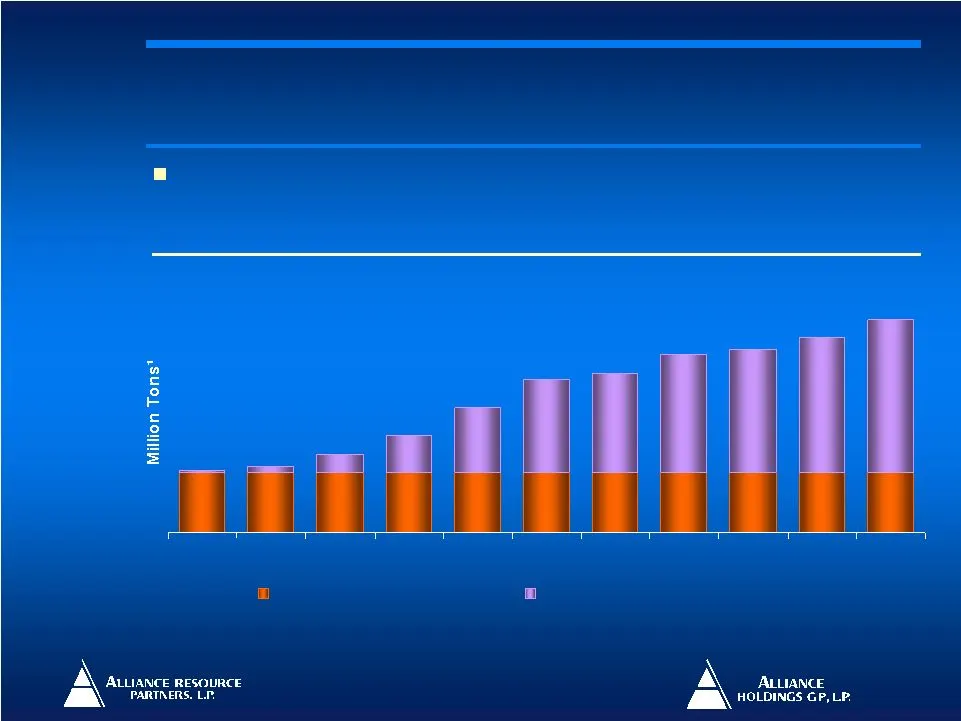
Future growth potential for scrubber market bodes well for Alliance’s high sulfur operations Source: The McIlvaine Company 1 Assumption used to convert gigawatts of capacity to million tons of coal: 9,600 Btu/Kwhr plant heat rate, 75% plant capacity factor, 12,500 Btu coal. 122 122 122 122 122 122 1
Slide 25: Well Positioned in Scrubber Markets
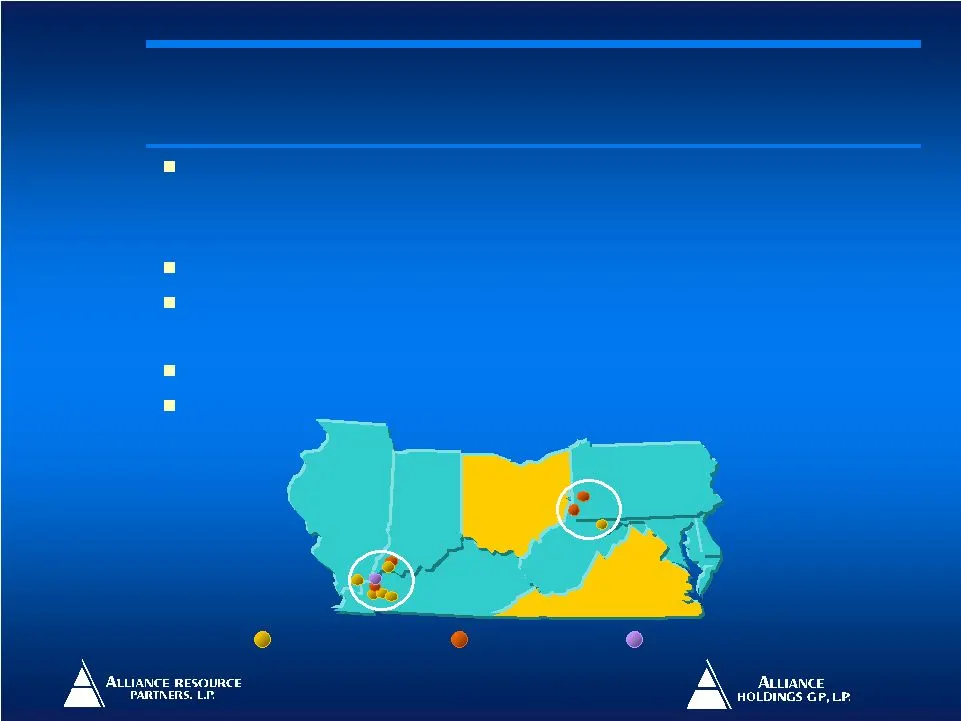
Indiana Ohio Maryland Virginia West Virginia Kentucky Approximately 678 million tons, or 95% of reserves, are “Scrubber” Quality Coal Illinois Basin: Second largest producer in the basin Currently accounts for ~74% of total Alliance coal production Northern Appalachian: Strong reserve base of ~157 m

Slide 26: Financial Summary and Historical Results
Financial Summary and Financial Summary and Historical Results Historical Results
Slide 27: Consistent Track Record of Growth at Alliance
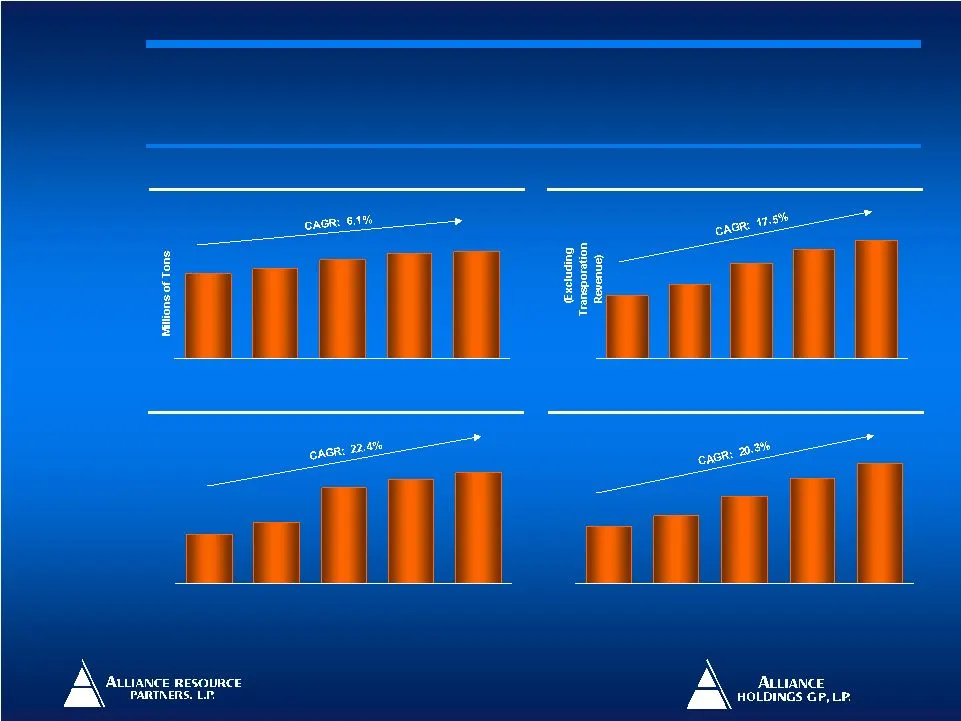
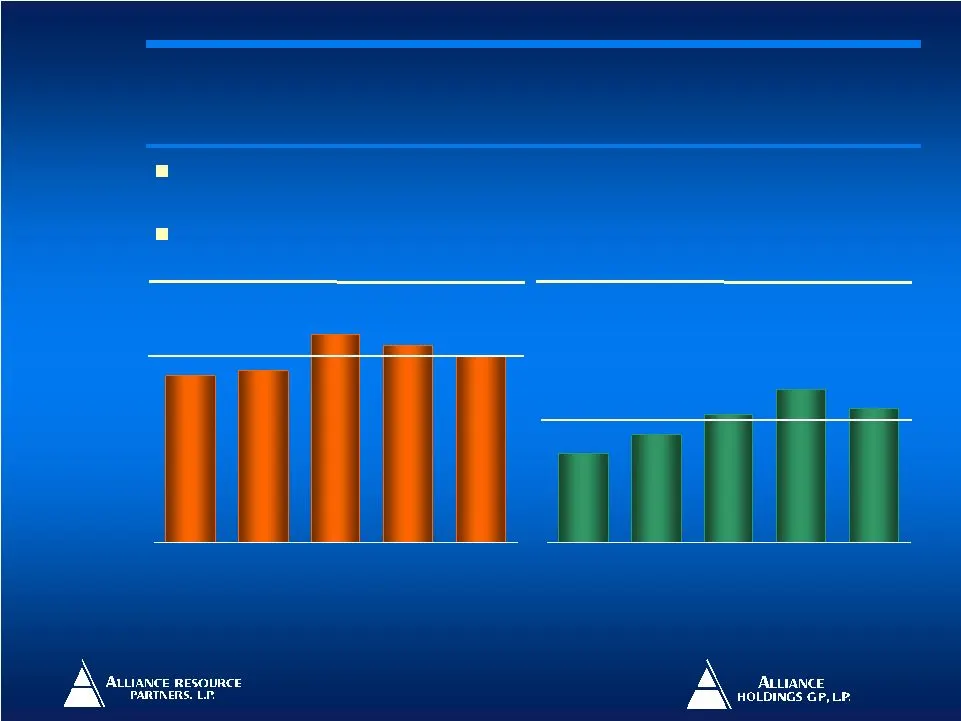
Note: EBITDA is a non-GAAP measure defined as income before net interest expense, income taxes and depreciation, depletion and amortization. Source: Company filings $1.05 $1.24 $1.58 $1.92 $2.20 2003 2004 2005 2006 2007 $523.2 $623.5 $799.6 $920.0 $995.6 2003 2004 2005 2006 2007 $119.0 $147.9 $230.1
Slide 28: Efficient Operator
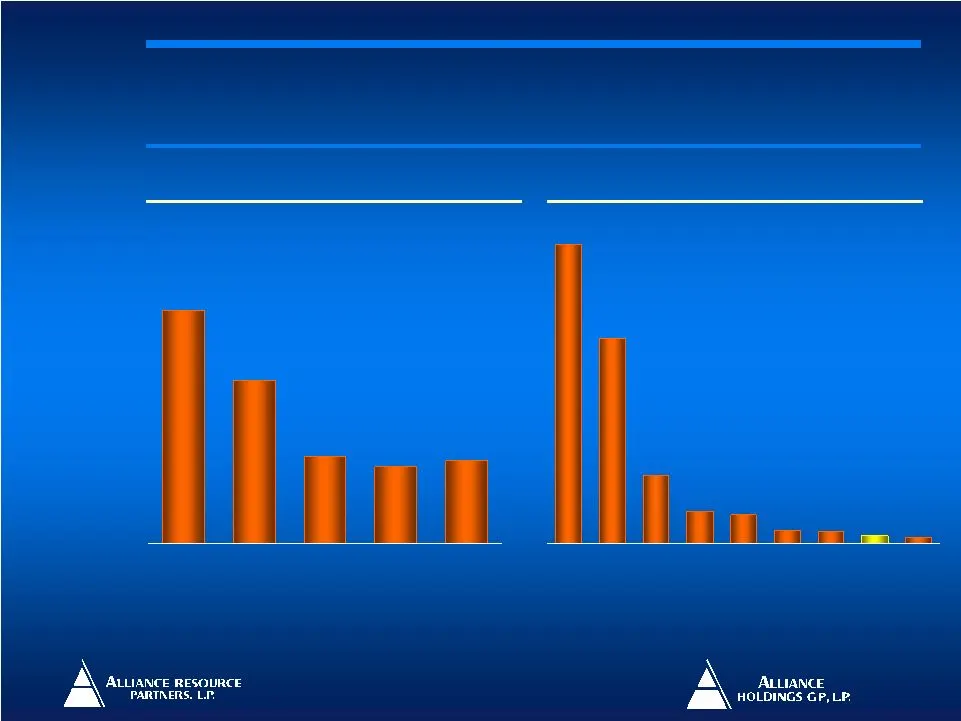
17.0% 19.4% 16.2% 13.7% 11.3% 2003 2004 2005 2006 2007 21.9% 22.6% 27.4% 25.9% 24.5% 2003 2004 2005 2006 2007 Alliance is a low-cost, efficient coal operator, delivering sector-leading EBITDA margins 6 Year Average: Alliance: 24.5% vs. Peers: 15.5% Source: Public filings Note: EBITDA margin represen
Slide 29: Strong Balance Sheet
$3,191 $2,190 $341 $304 $84 $67 $132 $733 $136 Peer A Peer B Peer C Peer E Peer F Alliance Peer H Peer D Peer G 29 2003 2004 2005 2006 2007 92.1% 64.3% 34.1% 30.1% 32.5% Source: Public filings Strong Balance Sheet Strong Balance Sheet Gross Legacy Liabilities ($mm) Gross Legacy Liabilities ($mm) Net

Slide 30: Investing in Alliance
Investing in Alliance Investing in Alliance
Slide 31: Two Ways to Invest in Alliance Partnerships
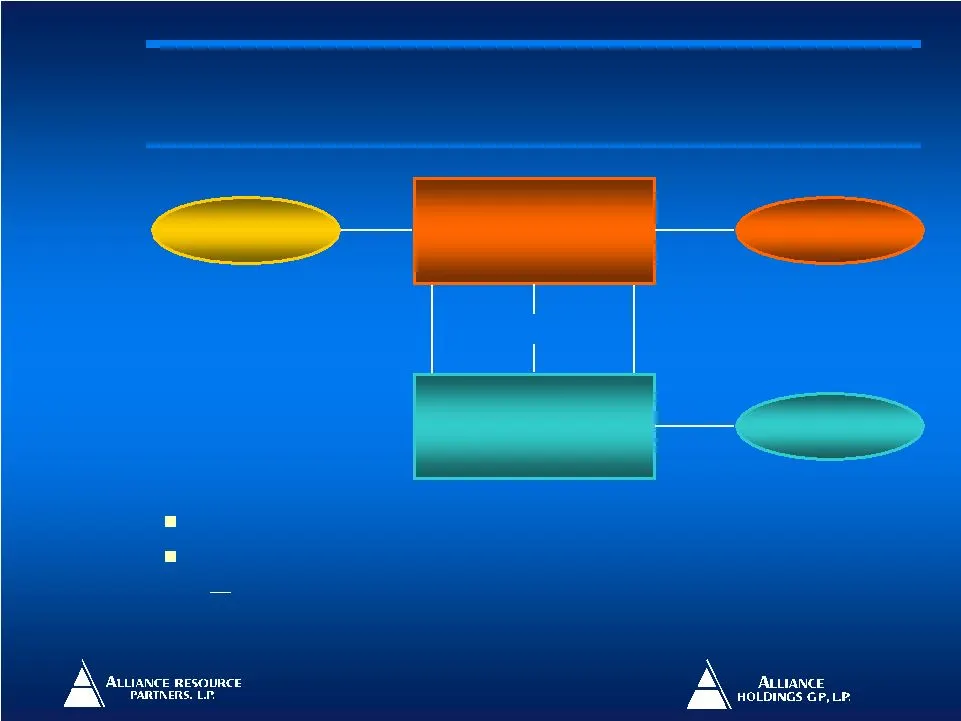
56.9% L.P. Interest 42.1% L.P. Interest 1.98% General Pa rtner Interest ² Alliance Holdings GP, L.P. (NASDAQ: AHGP) 59.9 million units outstanding Alliance Resource Partners, L.P. (NASDAQ: ARLP ) 36.6 million units outstanding Public Unitholders Management / Others ¹ 80.0% L.P. Interest Public Unith
Slide 32: Alliance Partnership Profiles
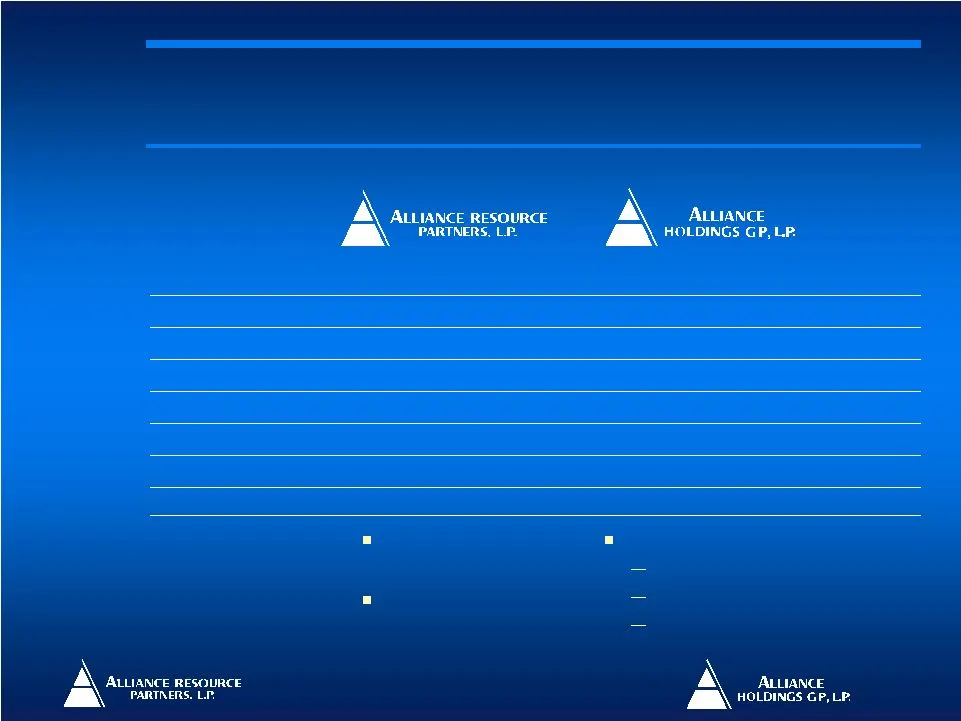
8.8% 33.4% $1,828mm $1,668mm 5.1% $2.34 $45.60 $26.73 (5/15/08): $1,600mm 0.0% $1,600mm $1.15 0.0% 4.3% Ownership Interests in Alliance Resource 1.98% G.P. Interest 100% of Incentive Distribution Rights 15.5 mm Alliance Resource common units 4th largest eastern coal producer operating 8 underground
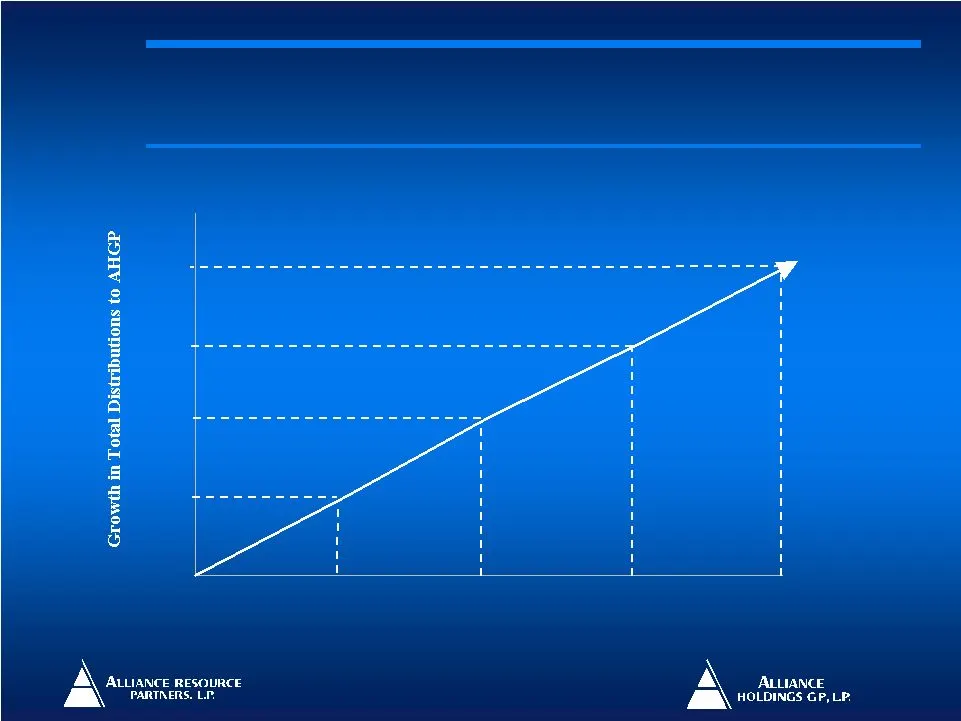
Slide 33: Alliance Holdings Leverage to Alliance Resource Distribution Growth
Note: Potential one year ARLP distribution growth over current annualized distribution level of $2.34 and assuming 36.6 million common units outstanding at ARLP as of 3/31/08. ARLP Distribution Growth 0% 10% 20% 30% 40% 0% 5% 10% 15% 20% 8.5% 25.4% 17.0% 34.0% Incentive distribution rights provide A
Slide 34: Alliance Investment Take Aways
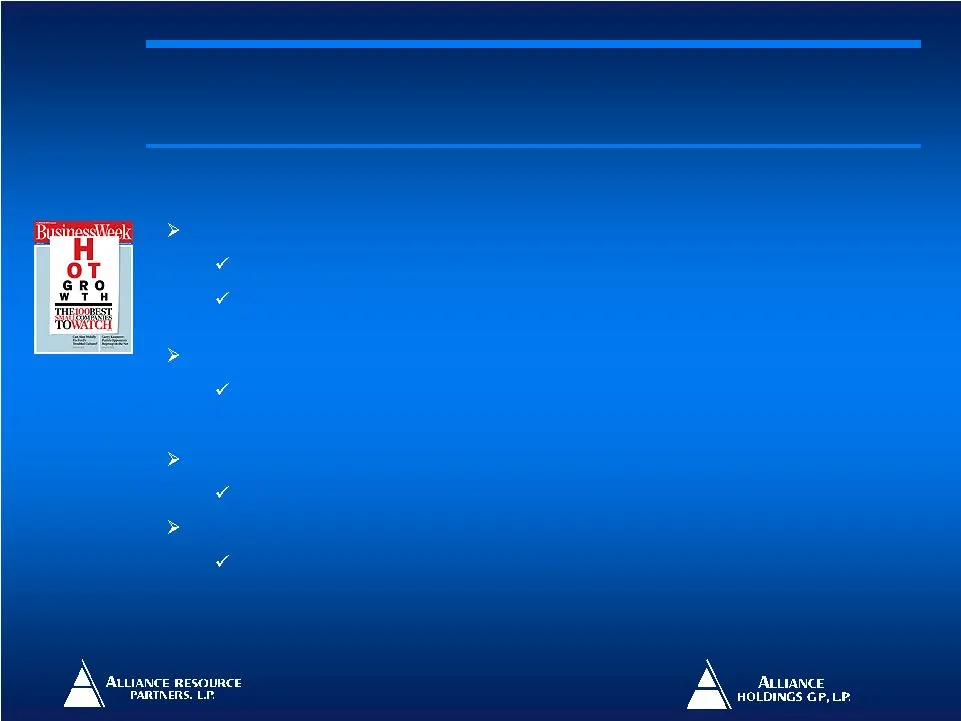
Proven track record of superior operating and financial results Clear strategy and visible inventory of growth prospects to exploit favorable long- term coal fundamentals ARLP has delivered a 504 % total return to unitholders since its IPO IDRs provide leverage to distribution growth potential of AR

Slide 35: Appendix
Appendix Appendix
Slide 36: EBITDA reconciliation
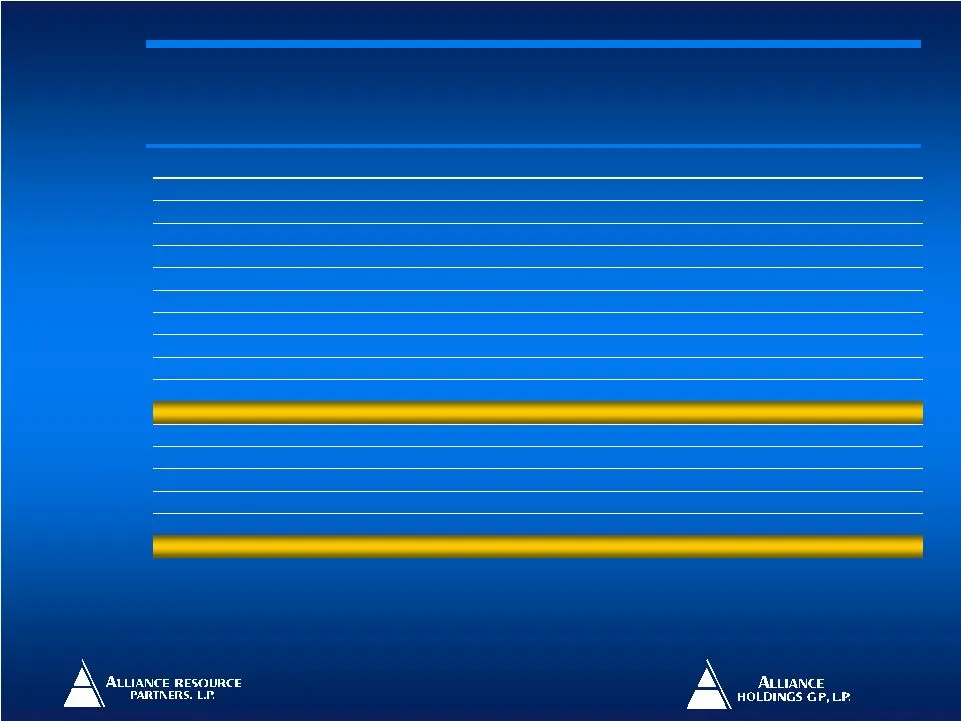
– 3,189 1,188 (1,477) 332 Net Gain (Loss) on Sale/Retirement of PP&E – 7,445 – – – Gain from insurance recoveries/settlements (4,100) (3,925) (4,112) (8,193) (20,320) Non-cash compensation expense 161 112 (2,443) (9,175) (66,489) 2,443 9,175 (5,317) (1,119) (319) (2,101) $250,923 – – (2,682) (11,816

Slide 37: MLP Investor Conference May 21, 2008
Alliance Resource Partners, L.P. Alliance Holdings GP, L.P. MLP Investor Conference May 21, 2008 Alliance Resource Partners, L.P. Alliance Holdings GP, L.P. MLP Investor Conference May 21, 2008
Source: SEC EDGAR · 8-K filed May 21, 2008
More decks from Alliance Holdings GP L.P
 MLP Investor Conference 201237 slides · May 23, 2012
 Merger or Acquisition (September 2011)7 slides · Sep 22, 2011
 Raymond James Coal Investor Conference (December 2008)17 slides · Dec 4, 2008
 RBC Capital Markets MLP Conference 200732 slides · Nov 15, 2007
 RBC Capital Markets Second Annual MLP Conference 200633 slides · Nov 17, 2006
 Argus Research Vision 2007 Conference33 slides · Nov 13, 2006