Andeavor — Tesoro Corp /New/ — Barclays Energy-Power Conference 2014
32 slides from Andeavor's conference presentation, Sep 4, 2014
Slide 1: Transformation through Distinctive Performance
Transformation through Distinctive Performance Barclays Energy‐Power Conference September 4, 2014 Exhibit 99.1
Slide 2: Forward Looking Statements
2 Forward Looking Statements • This Presentation includes forward‐looking statements within the meaning of the Private Securities Litigation Reform Act of 1995. These statements relate to, among other things: – The market outlook, including expectations regarding crude oil production growth, feedsto
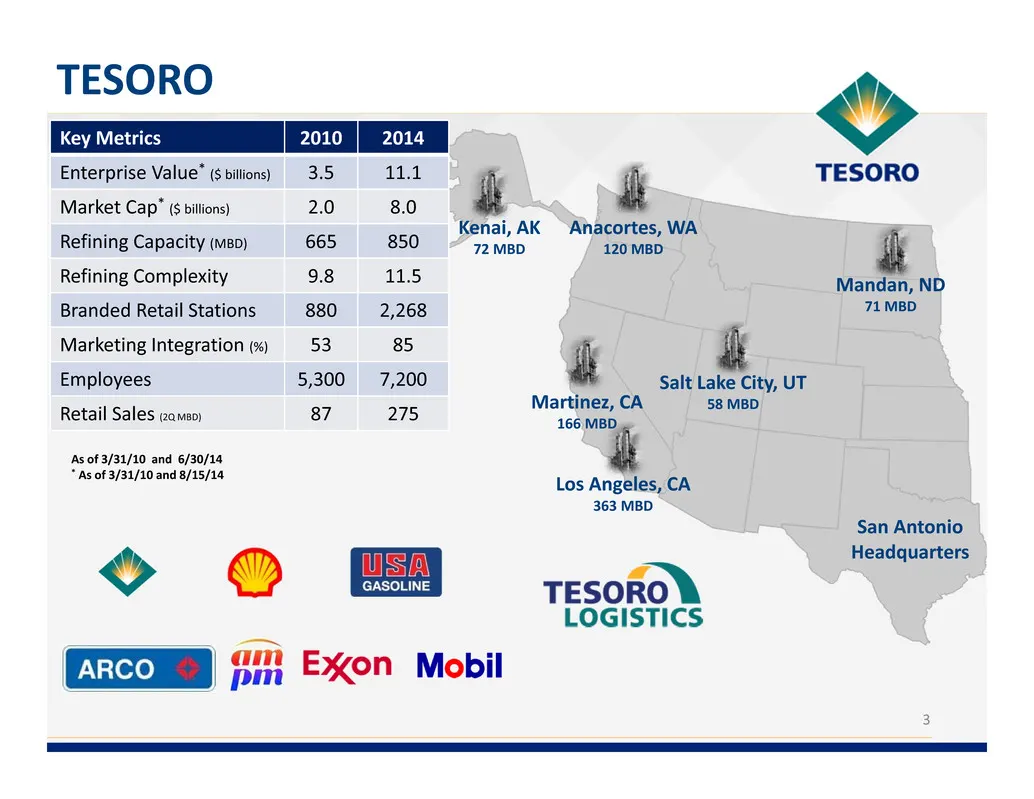
Slide 3: Tesoro Key Metrics and Refineries
3 TESORO Los Angeles, CA 363 MBD Key Metrics 2010 2014 Enterprise Value* ($ billions) 3.5 11.1 Market Cap* ($ billions) 2.0 8.0 Refining Capacity (MBD) 665 850 Refining Complexity 9.8 11.5 Branded Retail Stations 880 2,268 Marketing Integration (%) 53 85 Employees 5,300 7,200 Retail Sales (2Q MBD) 8
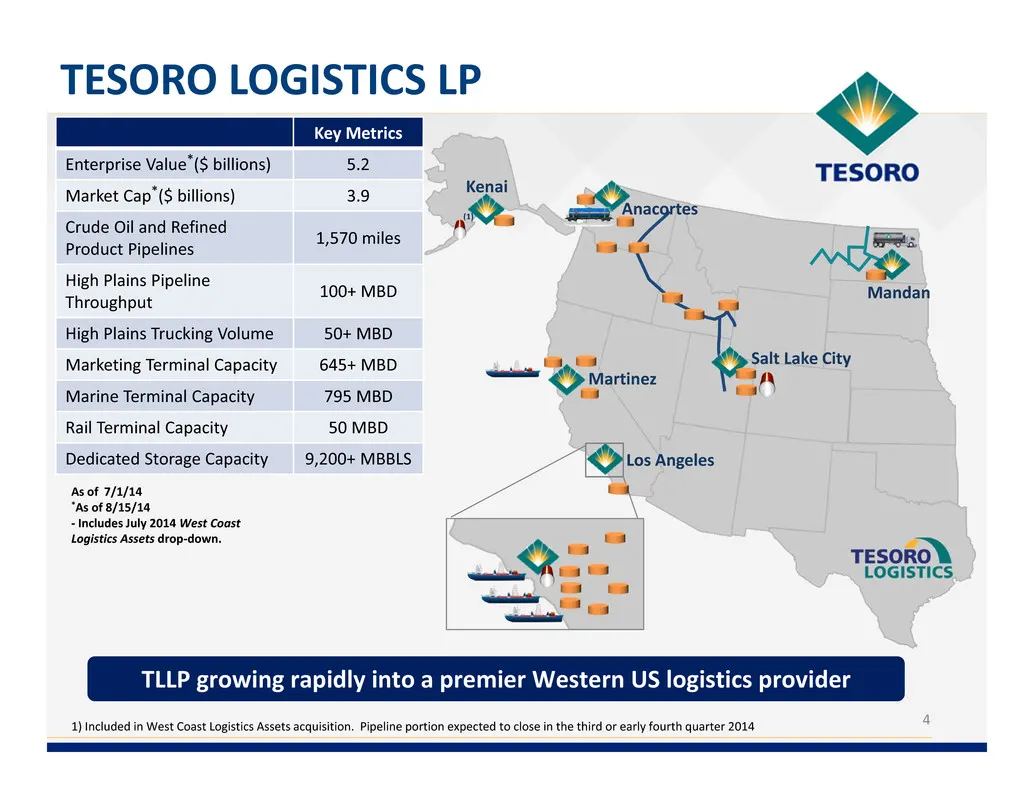
Slide 4: Tesoro Logistics LP Key Metrics
4 TESORO LOGISTICS LP Key Metrics Enterprise Value*($ billions) 5.2 Market Cap*($ billions) 3.9 Crude Oil and Refined Product Pipelines 1,570 miles High Plains Pipeline Throughput 100+ MBD High Plains Trucking Volume 50+ MBD Marketing Terminal Capacity 645+ MBD Marine Terminal Capacity 795 MBD Rail
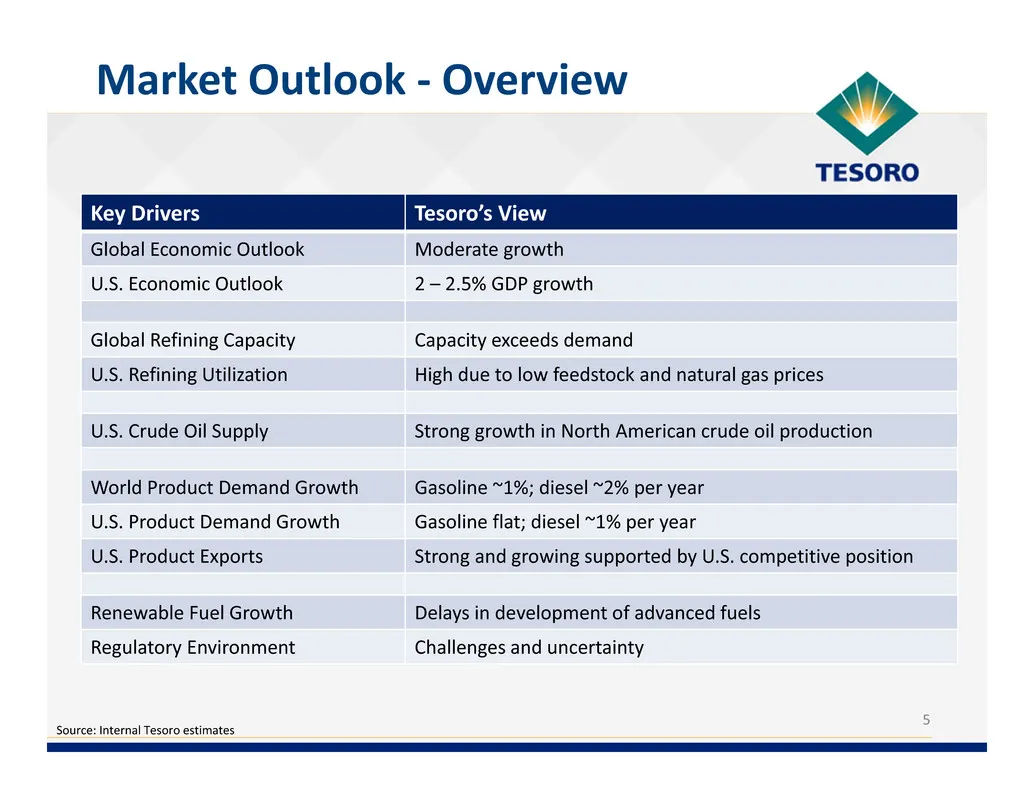
Slide 5: Market Outlook - Overview
5 Market Outlook ‐ Overview Key Drivers Tesoro’s View Global Economic Outlook Moderate growth U.S. Economic Outlook 2 – 2.5% GDP growth Global Refining Capacity Capacity exceeds demand U.S. Refining Utilization High due to low feedstock and natural gas prices U.S. Crude Oil Supply Strong growth in N
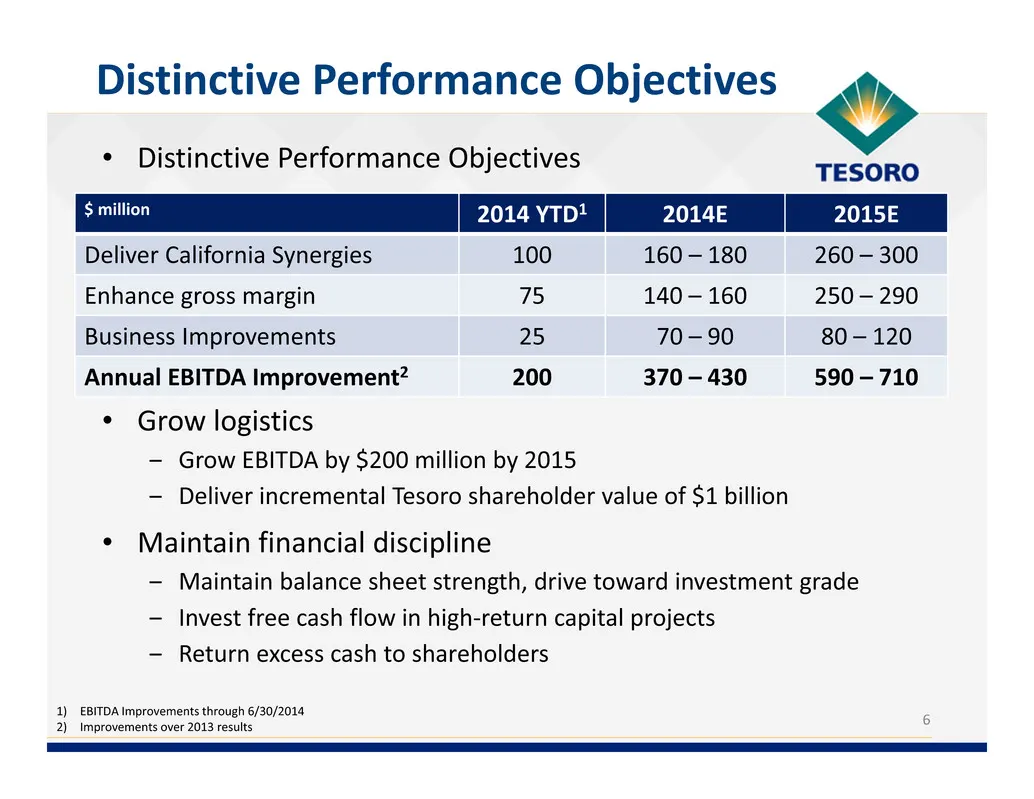
Slide 6: Distinctive Performance Objectives
• Distinctive Performance Objectives • Grow logistics ‒ Grow EBITDA by $200 million by 2015 ‒ Deliver incremental Tesoro shareholder value of $1 billion • Maintain financial discipline ‒ Maintain balance sheet strength, drive toward investment grade ‒ Invest free cash flow in high‐return capital pro
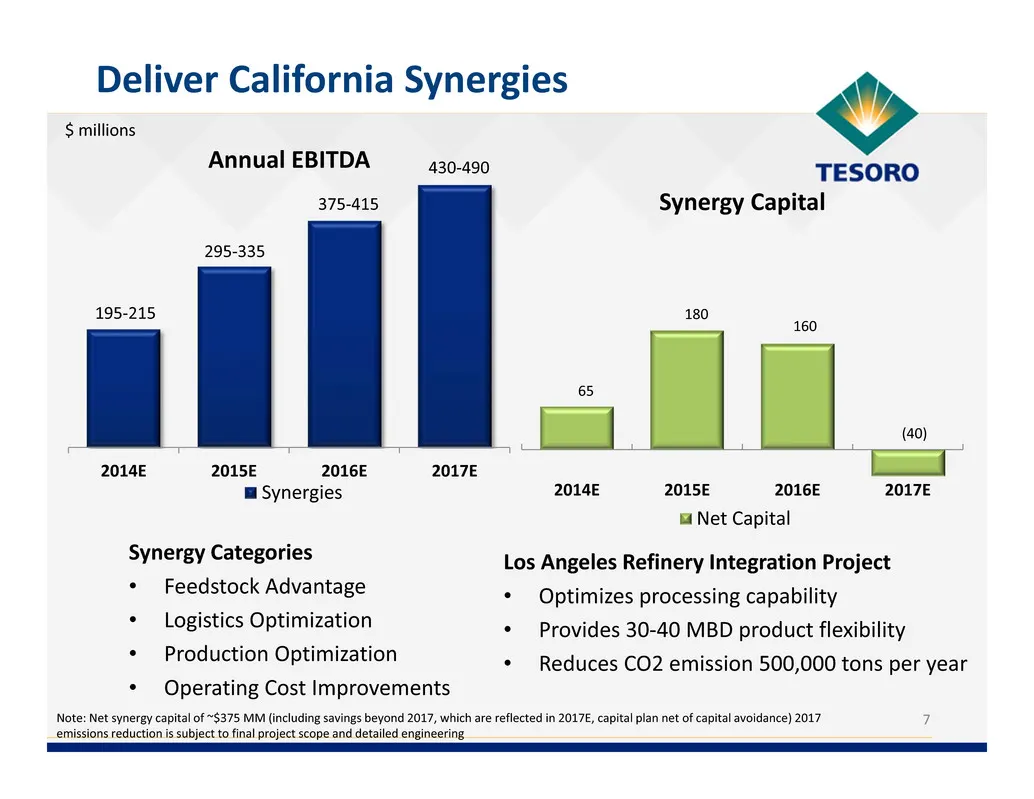
Slide 7: Deliver California Synergies
2014E 2015E 2016E 2017E Synergy Capital Net Capital 2014E 2015E 2016E 2017E Annual EBITDA Synergies Note: Net synergy capital of ~$375 MM (including savings beyond 2017, which are reflected in 2017E, capital plan net of capital avoidance) 2017 emissions reduction is subject to final project scope an
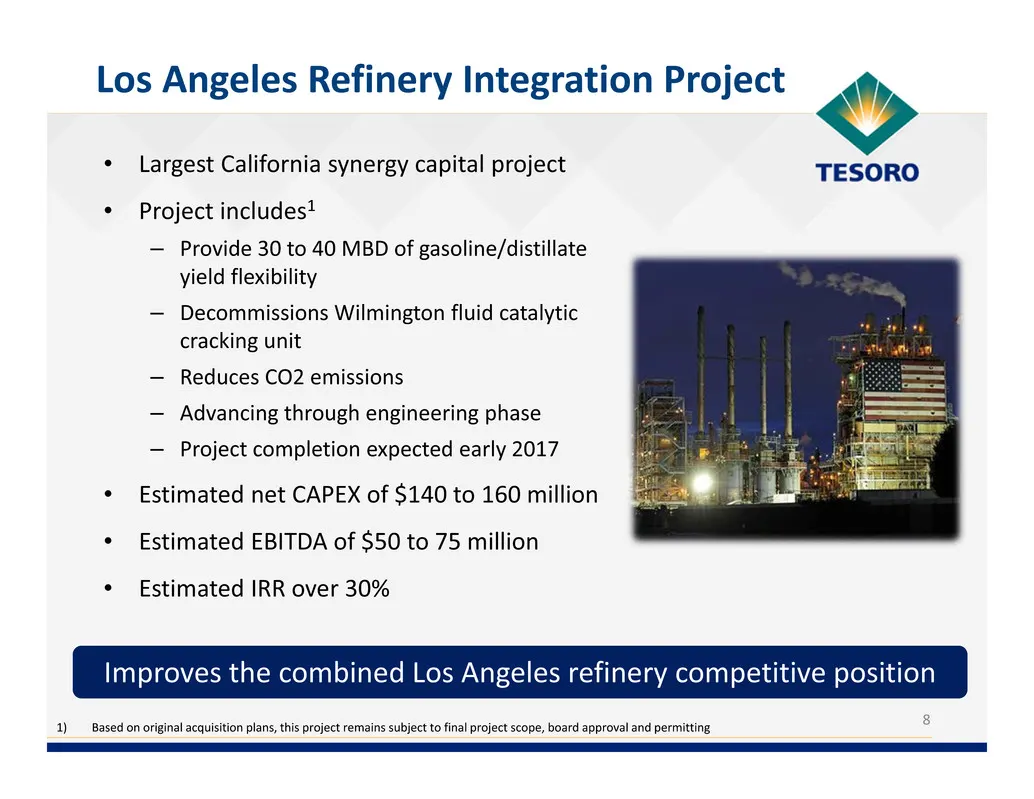
Slide 8: Los Angeles Refinery Integration Project
• Largest California synergy capital project • Project includes1 – Provide 30 to 40 MBD of gasoline/distillate yield flexibility – Decommissions Wilmington fluid catalytic cracking unit – Reduces CO2 emissions – Advancing through engineering phase – Project completion expected early 2017 • Estimated
Slide 9: Enhance Gross Margin
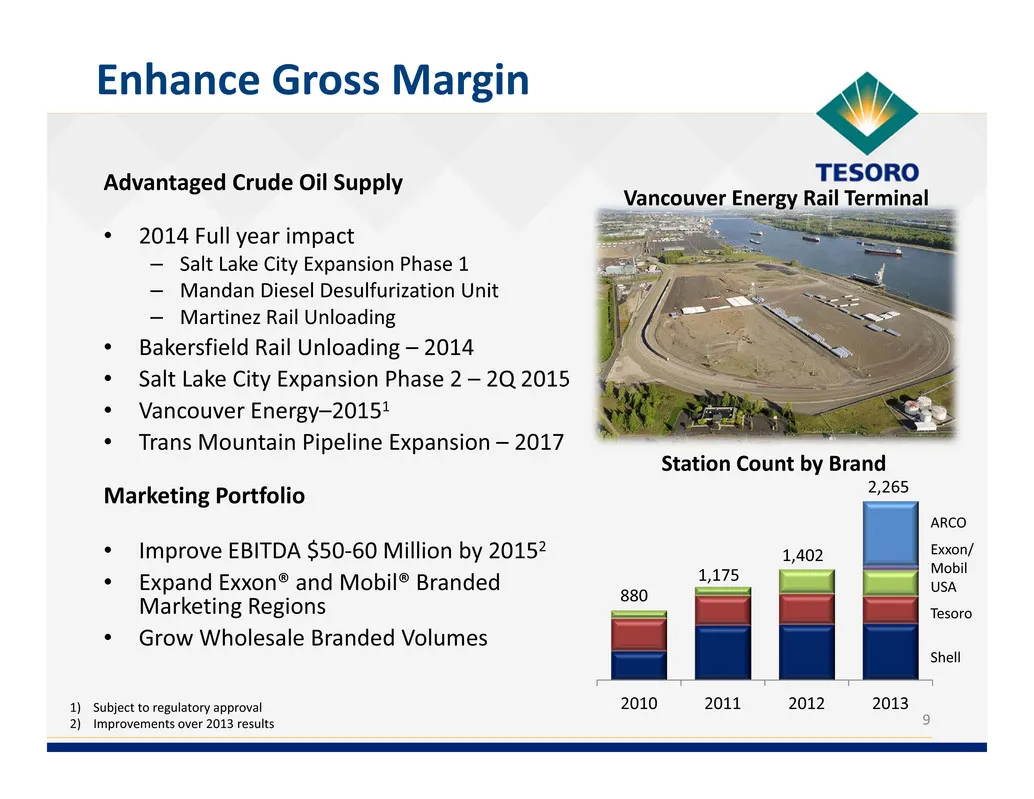
Advantaged Crude Oil Supply • 2014 Full year impact – Salt Lake City Expansion Phase 1 – Mandan Diesel Desulfurization Unit – Martinez Rail Unloading • Bakersfield Rail Unloading – 2014 • Salt Lake City Expansion Phase 2 – 2Q 2015 • Vancouver Energy–20151 • Trans Mountain Pipeline Expansion – 2017 M
Slide 10: Vancouver Energy
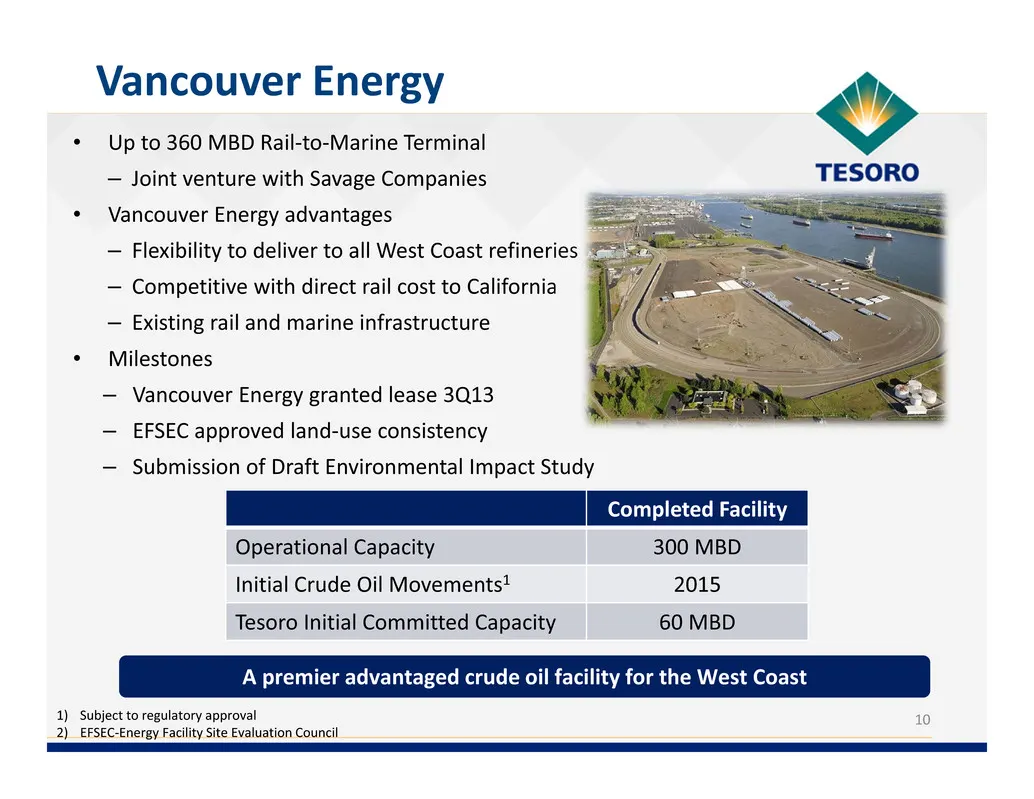
• Up to 360 MBD Rail‐to‐Marine Terminal – Joint venture with Savage Companies • Vancouver Energy advantages – Flexibility to deliver to all West Coast refineries – Competitive with direct rail cost to California – Existing rail and marine infrastructure • Milestones – Vancouver Energy granted lease
Slide 11: Rail Costs to Clear Bakken
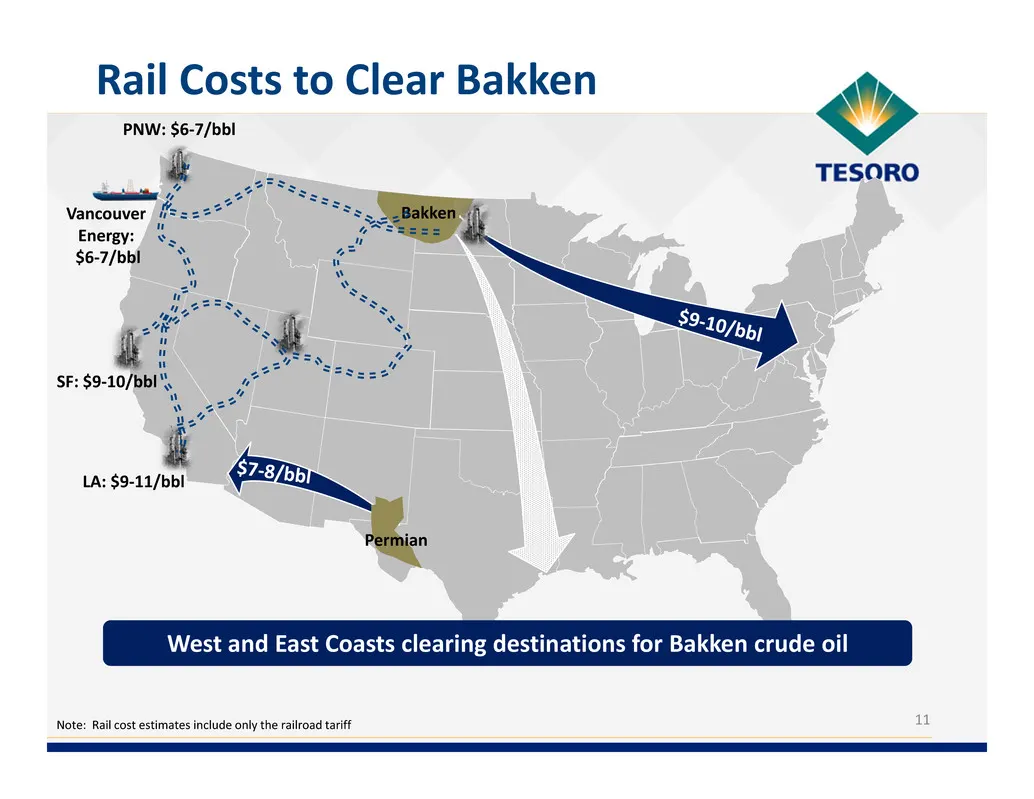
West and East Coasts clearing destinations for Bakken crude oil 11 Rail Costs to Clear Bakken Note: Rail cost estimates include only the railroad tariff Bakken Permian PNW: $6‐7/bbl Vancouver Energy: $6‐7/bbl SF: $9‐10/bbl LA: $9‐11/bbl
Slide 12: West Coast Mixed Xylenes
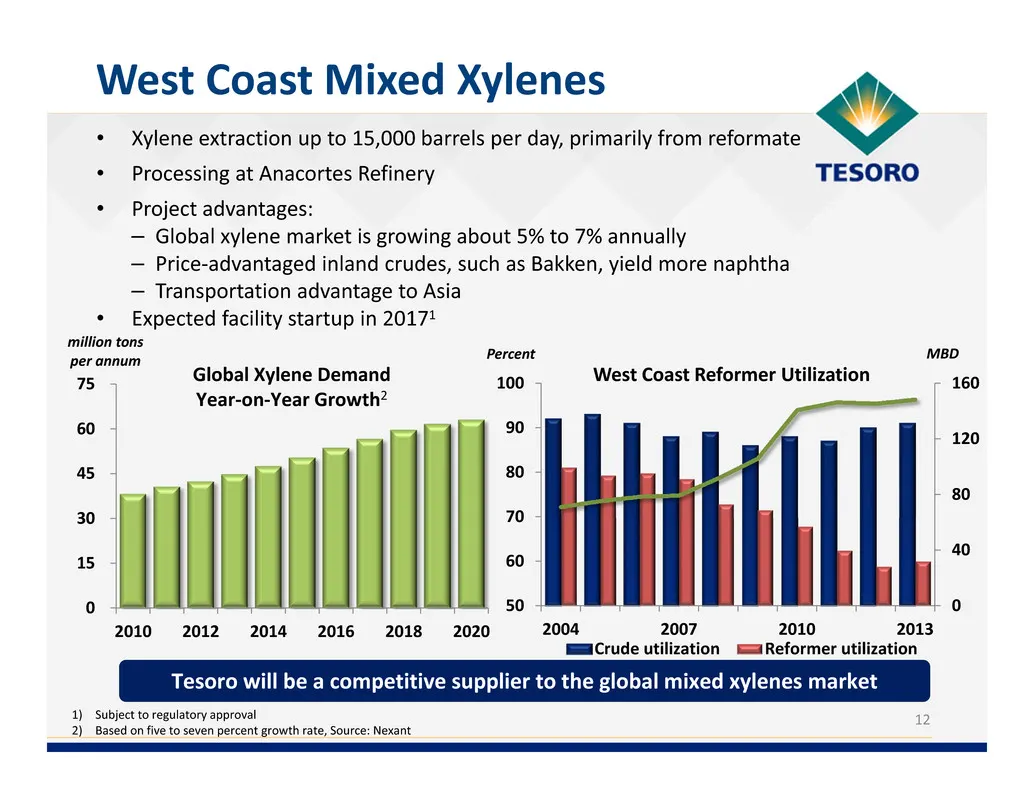
12 West Coast Mixed Xylenes • Xylene extraction up to 15,000 barrels per day, primarily from reformate • Processing at Anacortes Refinery • Project advantages: – Global xylene market is growing about 5% to 7% annually – Price‐advantaged inland crudes, such as Bakken, yield more naphtha – Transportat
Slide 13: Business Improvements
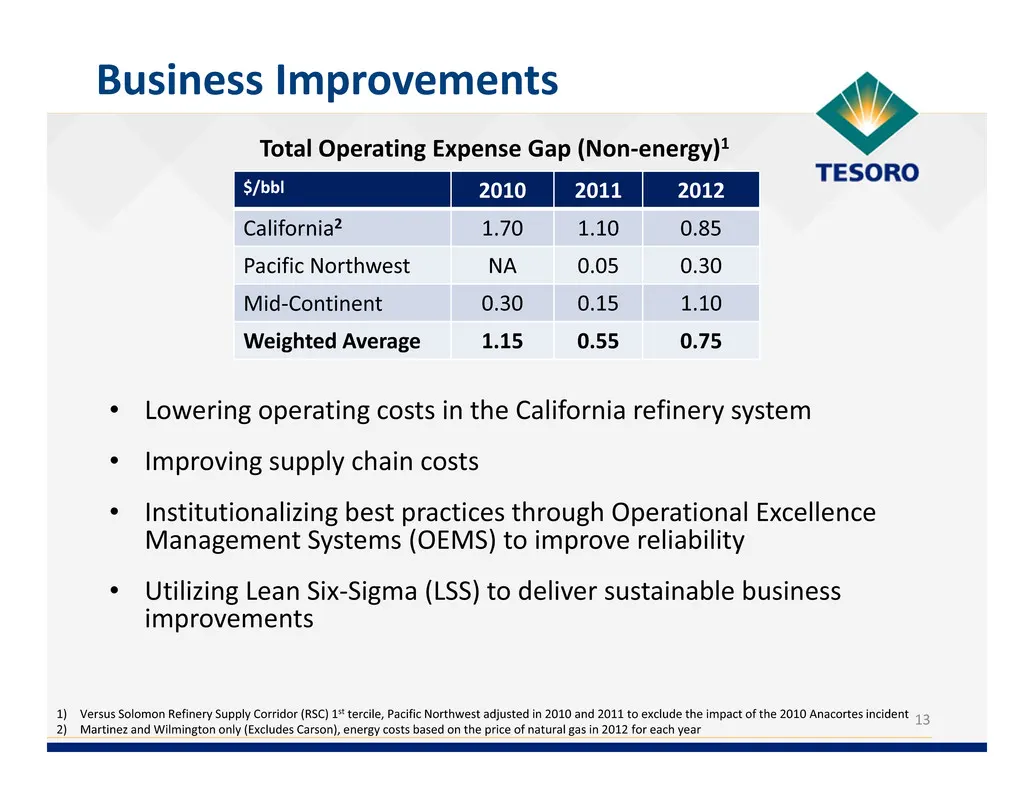
• Lowering operating costs in the California refinery system • Improving supply chain costs • Institutionalizing best practices through Operational Excellence Management Systems (OEMS) to improve reliability • Utilizing Lean Six‐Sigma (LSS) to deliver sustainable business improvements 13 Business Im
Slide 14: Grow Logistics
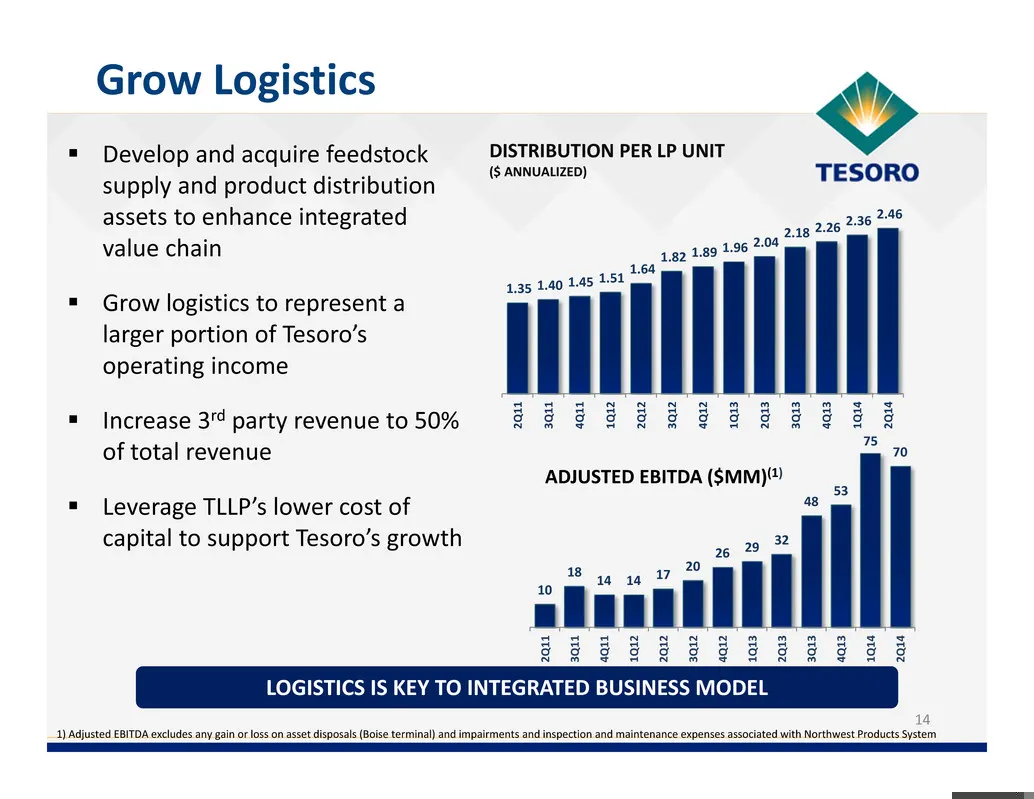
1.35 1.40 1.45 1.51 1.64 1.82 1.89 1.96 2.04 2.18 2.26 2.36 2.46 2 Q 1 1 3 Q 1 1 4 Q 1 1 1 Q 1 2 2 Q 1 2 3 Q 1 2 4 Q 1 2 1 Q 1 3 2 Q 1 3 3 Q 1 3 4 Q 1 3 1 Q 1 4 2 Q 1 4 14 Grow Logistics Develop and acquire feedstock supply and product distribution assets to enhance integrated value chain Grow l
Slide 15: TLLP Strategic Drivers
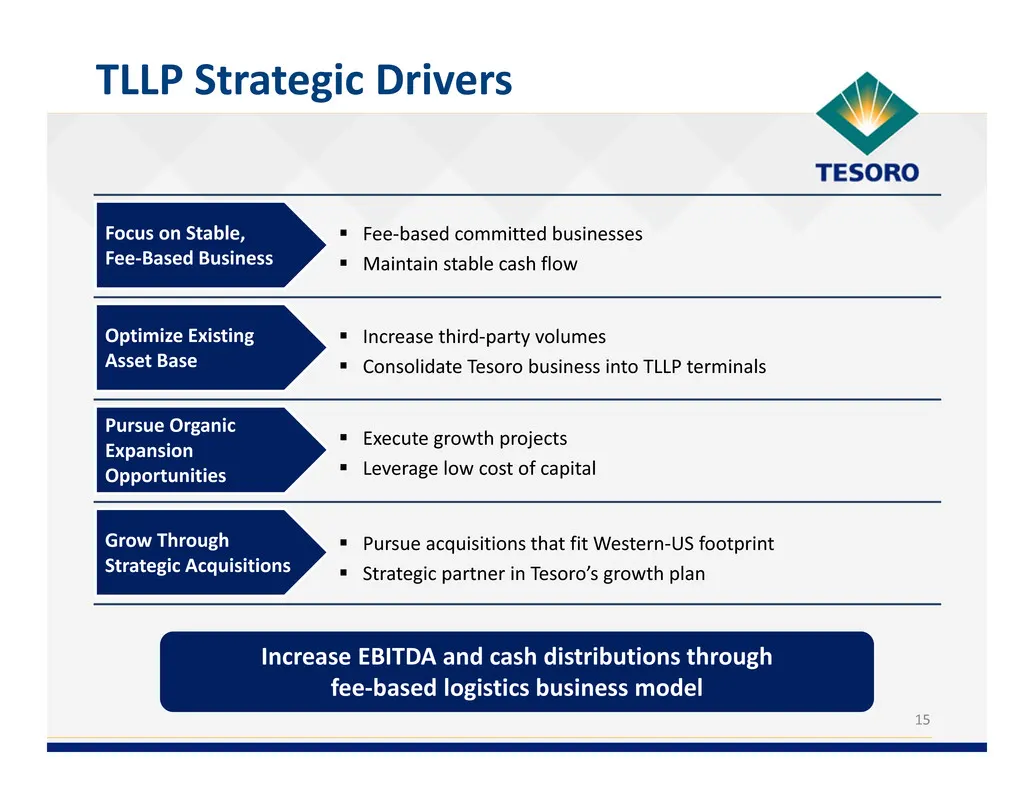
15 TLLP Strategic Drivers Increase EBITDA and cash distributions through fee‐based logistics business model Focus on Stable, Fee‐Based Business Fee‐based committed businesses Maintain stable cash flow Optimize Existing Asset Base Increase third‐party volumes Consolidate Tesoro business into
Slide 16: TLLP Value Proposition to Tesoro
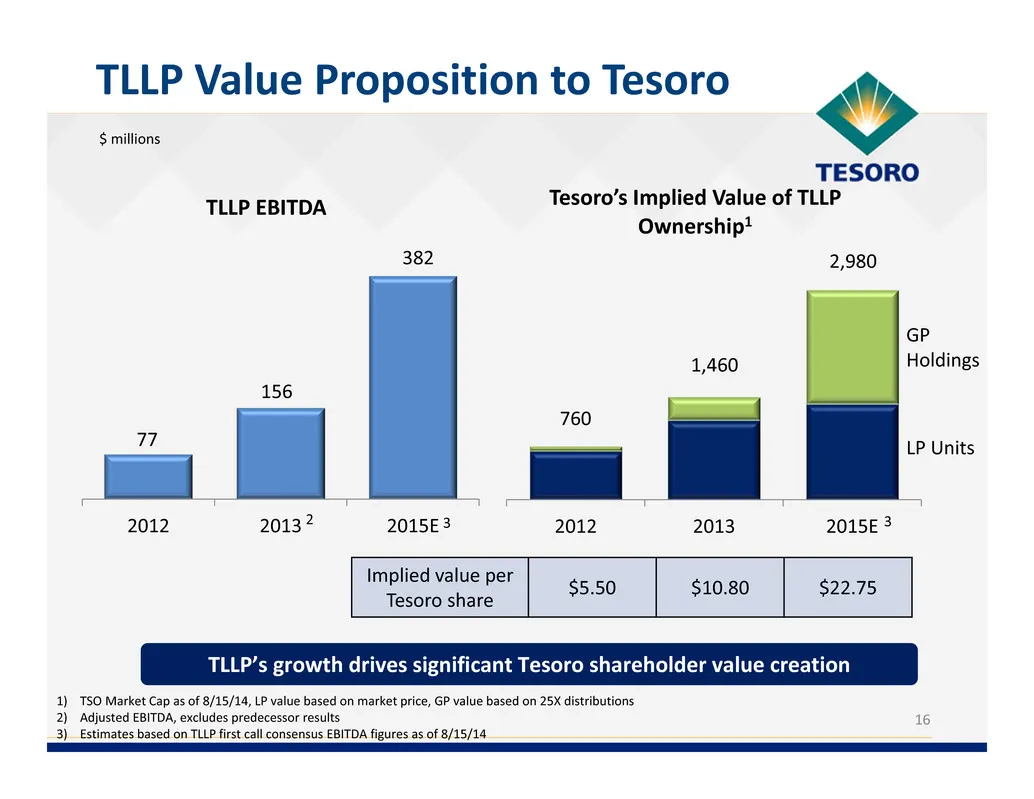
16 TLLP Value Proposition to Tesoro TLLP’s growth drives significant Tesoro shareholder value creation 77 156 382 2012 2013 2015E TLLP EBITDA 2012 2013 2015E Tesoro’s Implied Value of TLLP Ownership1 1) TSO Market Cap as of 8/15/14, LP value based on market price, GP value based on 25X distributions
Slide 17: Maintain Financial Discipline
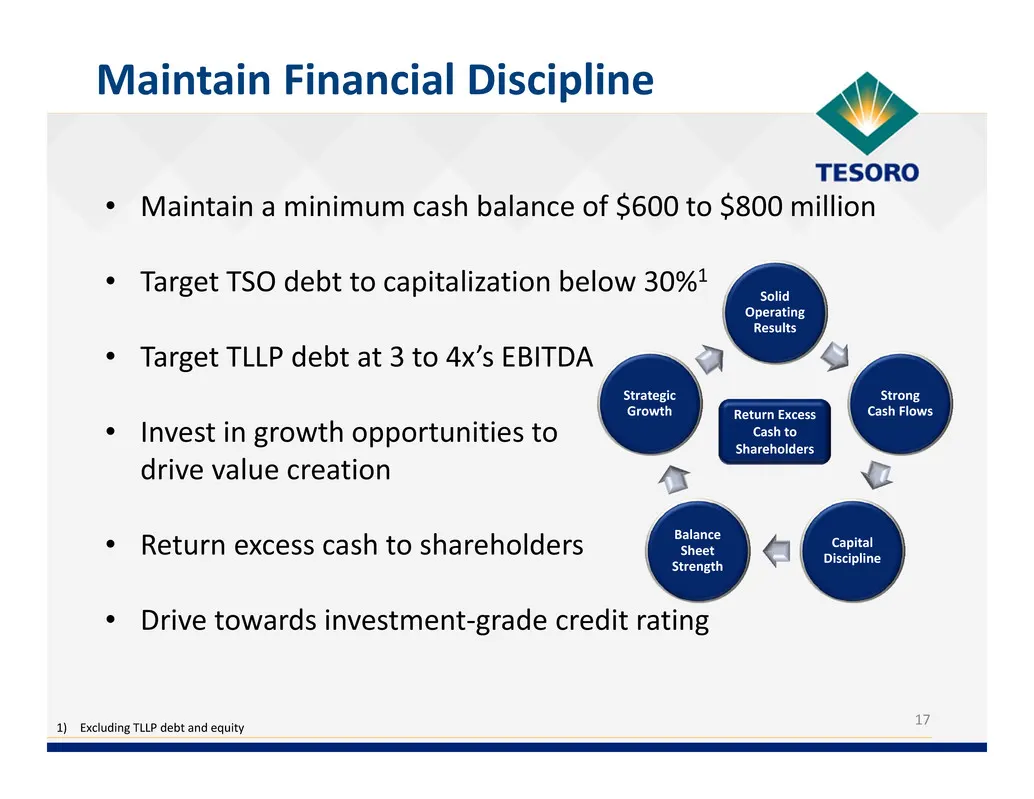
• Maintain a minimum cash balance of $600 to $800 million • Target TSO debt to capitalization below 30%1 • Target TLLP debt at 3 to 4x’s EBITDA • Invest in growth opportunities to drive value creation • Return excess cash to shareholders • Drive towards investment‐grade credit rating 17 Maintain Fin
Slide 18: Keys to Distinction on the West Coast
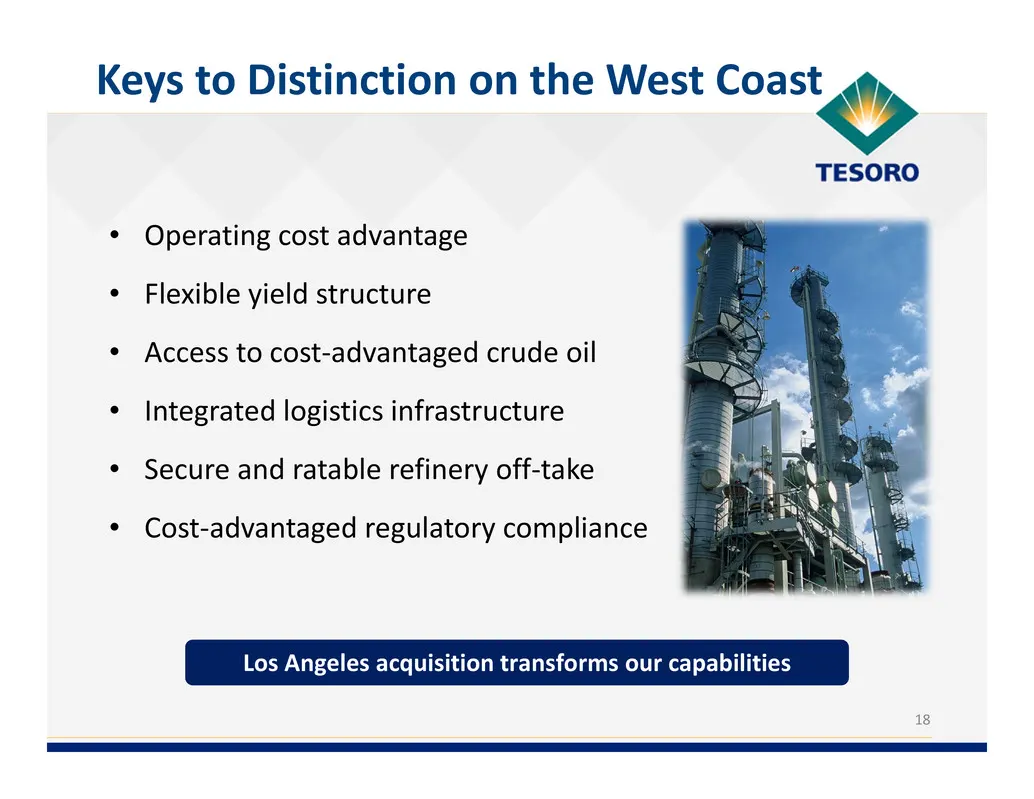
• Operating cost advantage • Flexible yield structure • Access to cost‐advantaged crude oil • Integrated logistics infrastructure • Secure and ratable refinery off‐take • Cost‐advantaged regulatory compliance 18 Keys to Distinction on the West Coast Los Angeles acquisition transforms our capabilitie
Slide 19: California Economy
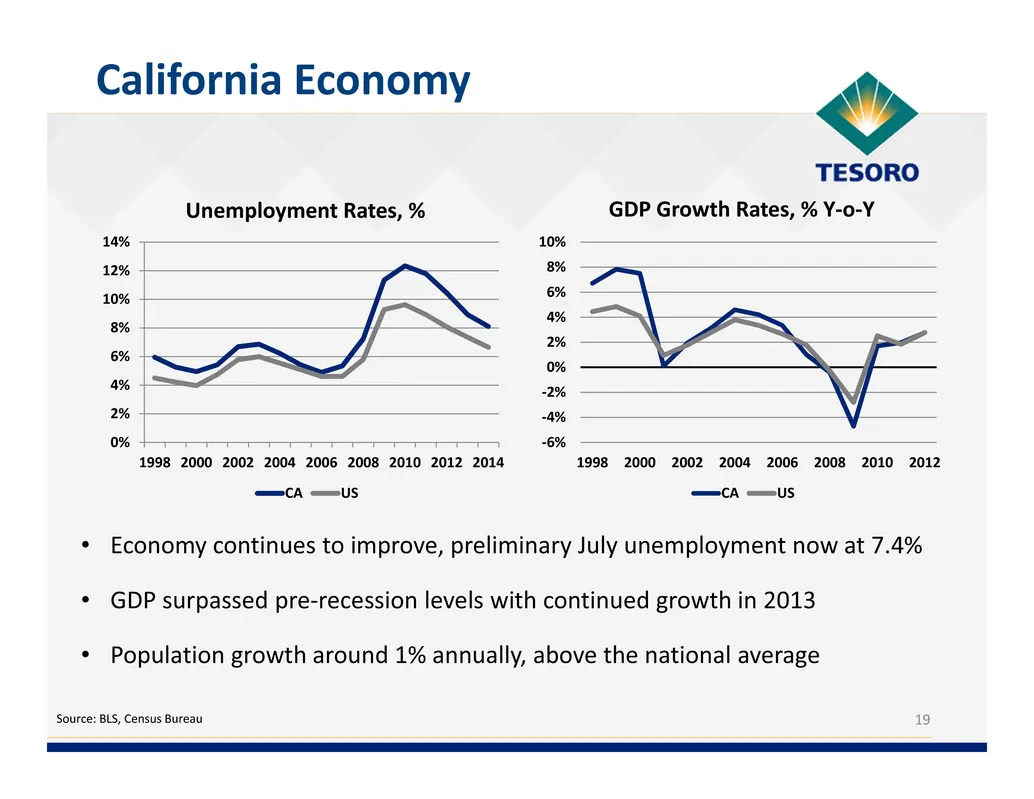
California Economy Source: BLS, Census Bureau 0% 2% 4% 6% 8% 10% 12% 14% 1998 2000 2002 2004 2006 2008 2010 2012 2014 Unemployment Rates, % CA US ‐6% ‐4% ‐2% 0% 2% 4% 6% 8% 10% 1998 2000 2002 2004 2006 2008 2010 2012 GDP Growth Rates, % Y‐o‐Y CA US • Economy continues to improve, preliminary July un
Slide 20: PADD V Demand
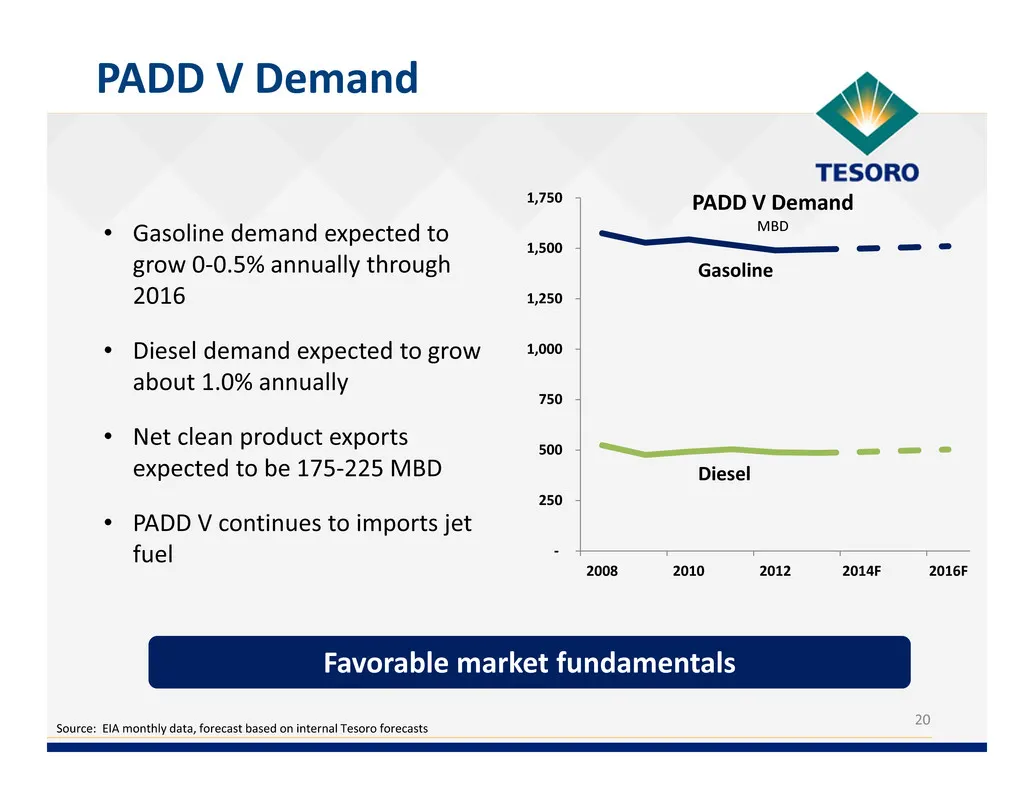
‐ 250 500 750 1,000 1,250 1,500 1,750 2008 2010 2012 2014F 2016F PADD V Demand MBD 20 PADD V Demand Favorable market fundamentals • Gasoline demand expected to grow 0‐0.5% annually through 2016 • Diesel demand expected to grow about 1.0% annually • Net clean product exports expected to be 175‐225 MB
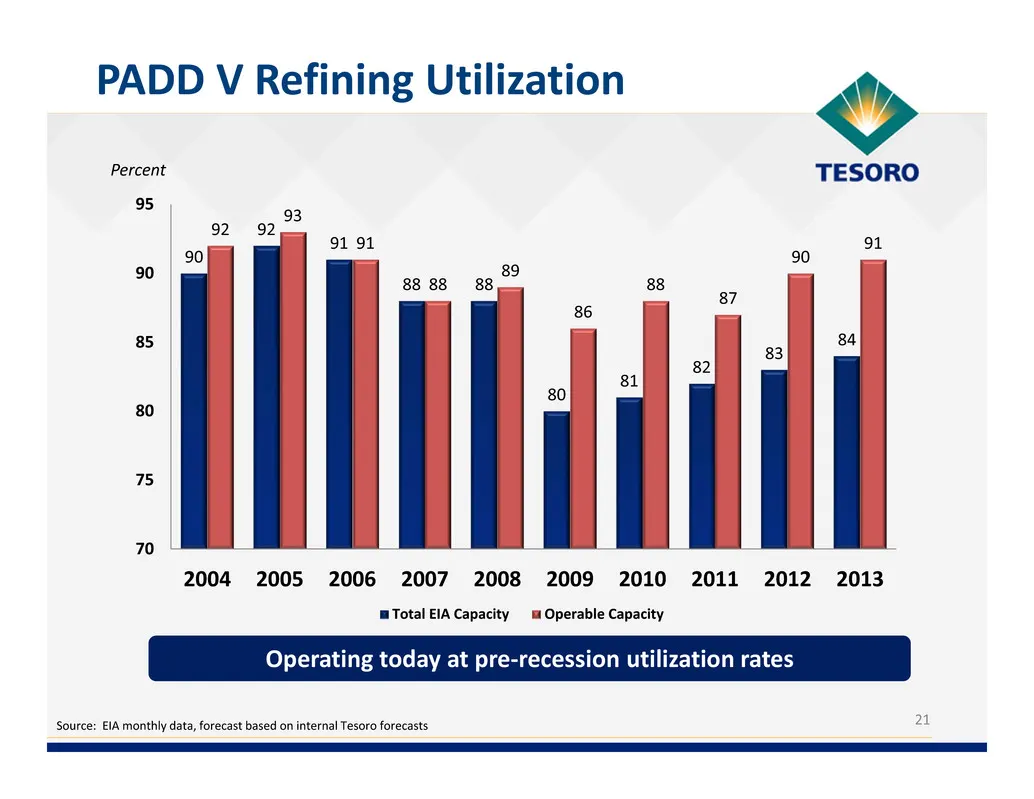
Slide 21: PADD V Refining Utilization
21 PADD V Refining Utilization Source: EIA monthly data, forecast based on internal Tesoro forecasts Operating today at pre‐recession utilization rates 90 92 91 88 88 80 81 82 83 84 92 93 91 88 89 86 88 87 90 91 70 75 80 85 90 95 2004 2005 2006 2007 2008 2009 2010 2011 2012 2013 Total EIA Capacity O
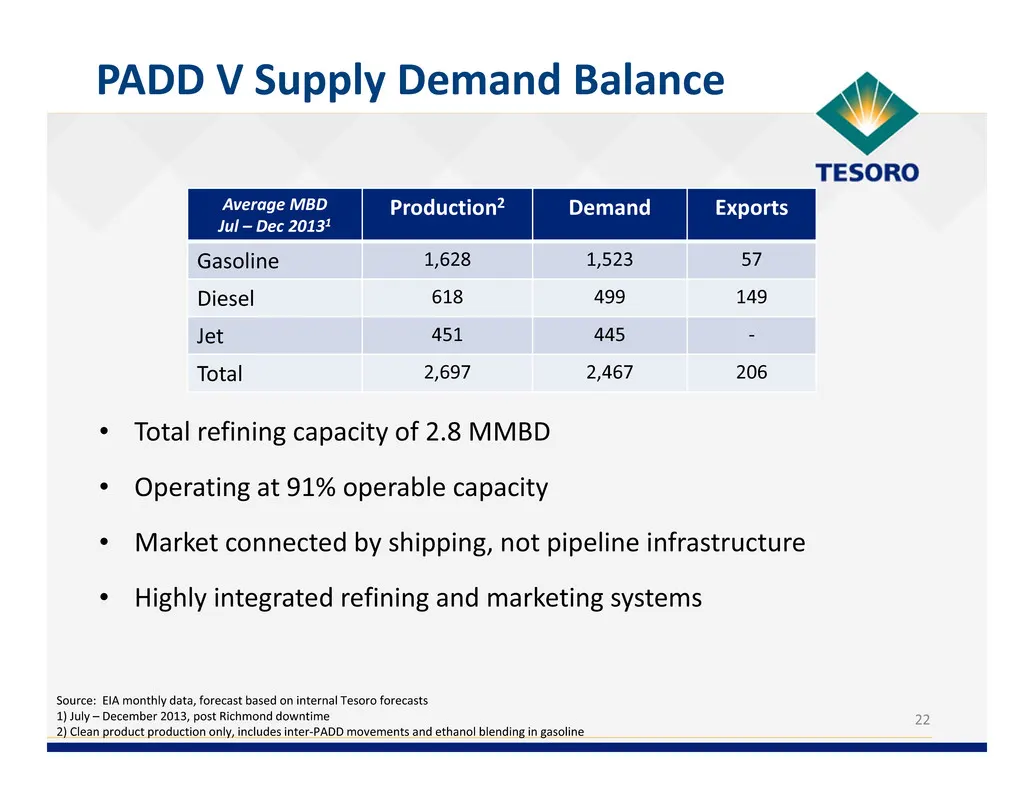
Slide 22: PADD V Supply Demand Balance
22 PADD V Supply Demand Balance Average MBD Jul – Dec 20131 Production2 Demand Exports Gasoline 1,628 1,523 57 Diesel 618 499 149 Jet 451 445 ‐ Total 2,697 2,467 206 • Total refining capacity of 2.8 MMBD • Operating at 91% operable capacity • Market connected by shipping, not pipeline infrastructure
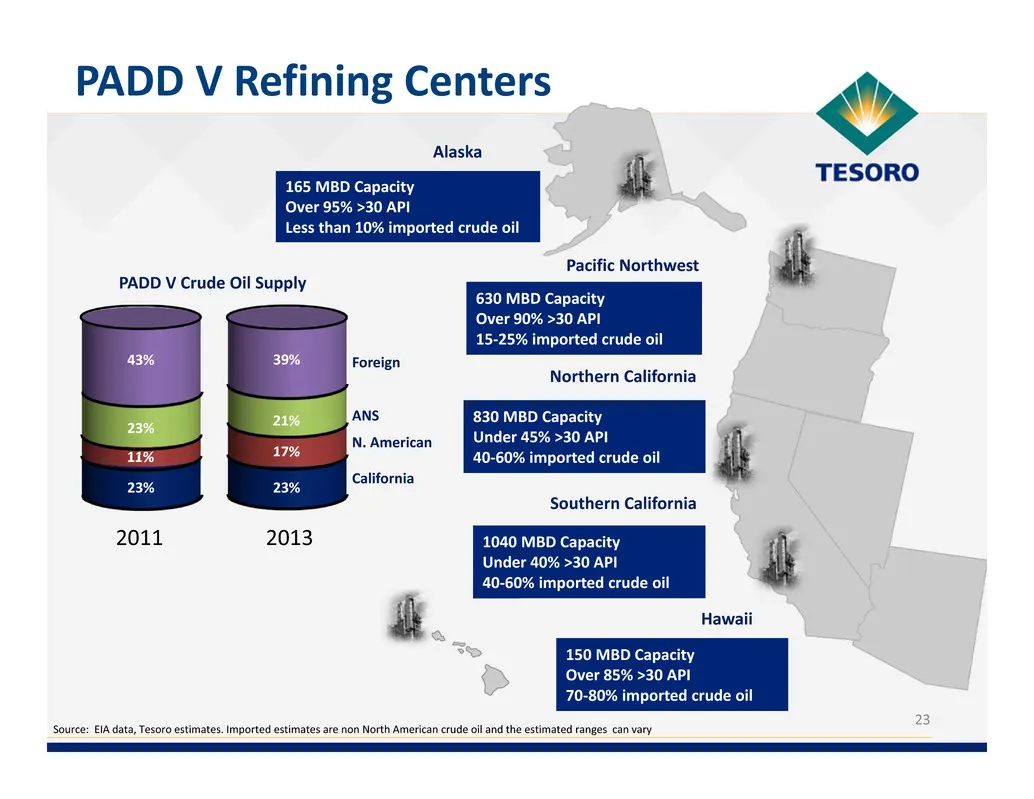
Slide 23: PADD V Refining Centers
23 PADD V Refining Centers Source: EIA data, Tesoro estimates. Imported estimates are non North American crude oil and the estimated ranges can vary Alaska Hawaii Pacific Northwest Northern California 630 MBD Capacity Over 90% >30 API 15‐25% imported crude oil 1040 MBD Capacity Under 40% >30 API 40‐
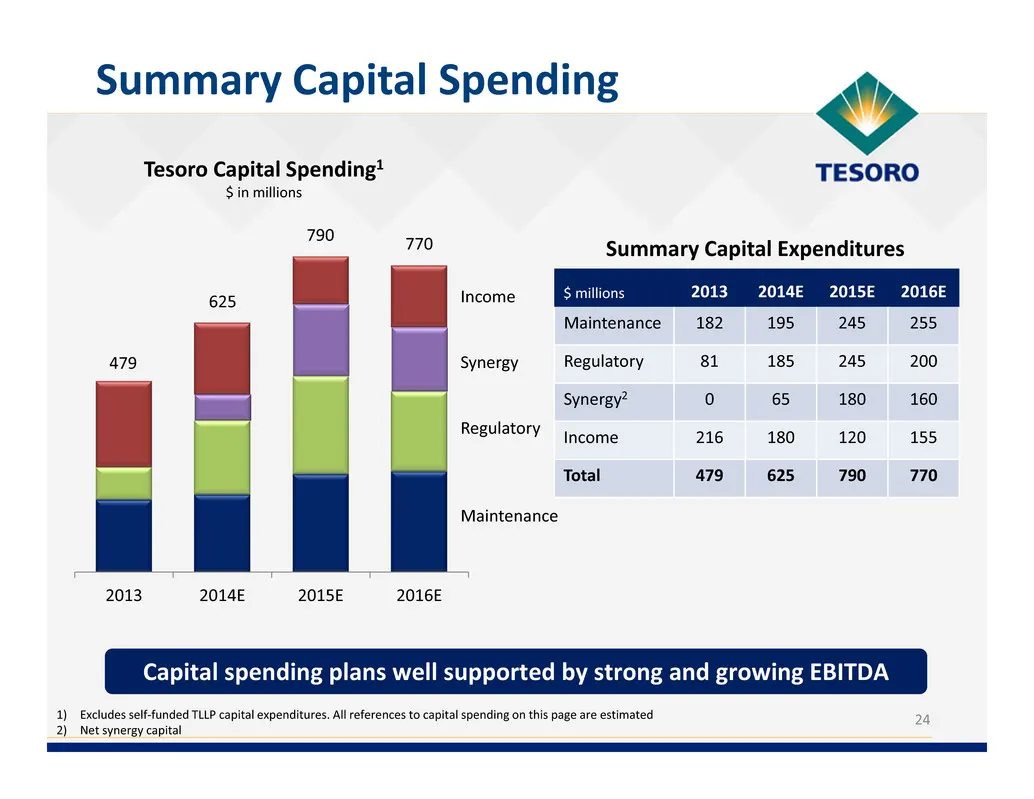
Slide 24: Summary Capital Spending
24 Summary Capital Spending 2013 2014E 2015E 2016E Tesoro Capital Spending1 $ in millions 1) Excludes self‐funded TLLP capital expenditures. All references to capital spending on this page are estimated 2) Net synergy capital $ millions 2013 2014E 2015E 2016E Maintenance 182 195 245 255 Regulatory 8
Slide 25: TLLP Capital Spending
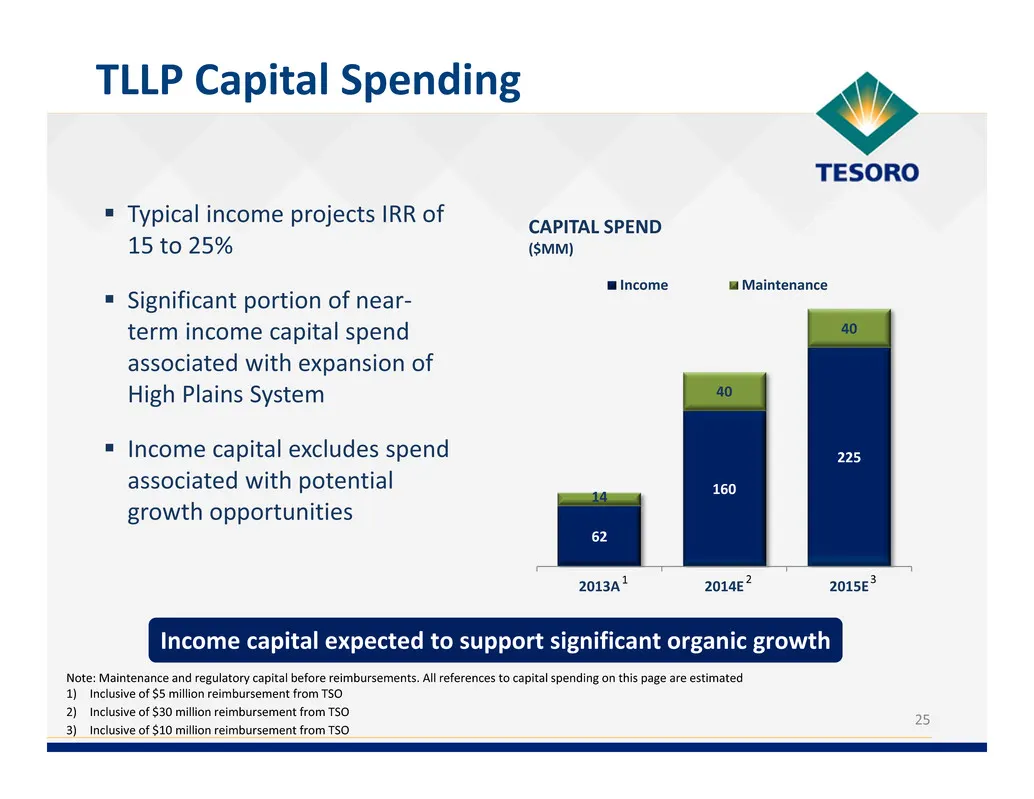
Typical income projects IRR of 15 to 25% Significant portion of near‐ term income capital spend associated with expansion of High Plains System Income capital excludes spend associated with potential growth opportunities 25 TLLP Capital Spending Note: Maintenance and regulatory capital before
Slide 26: Delivering Shareholder Value
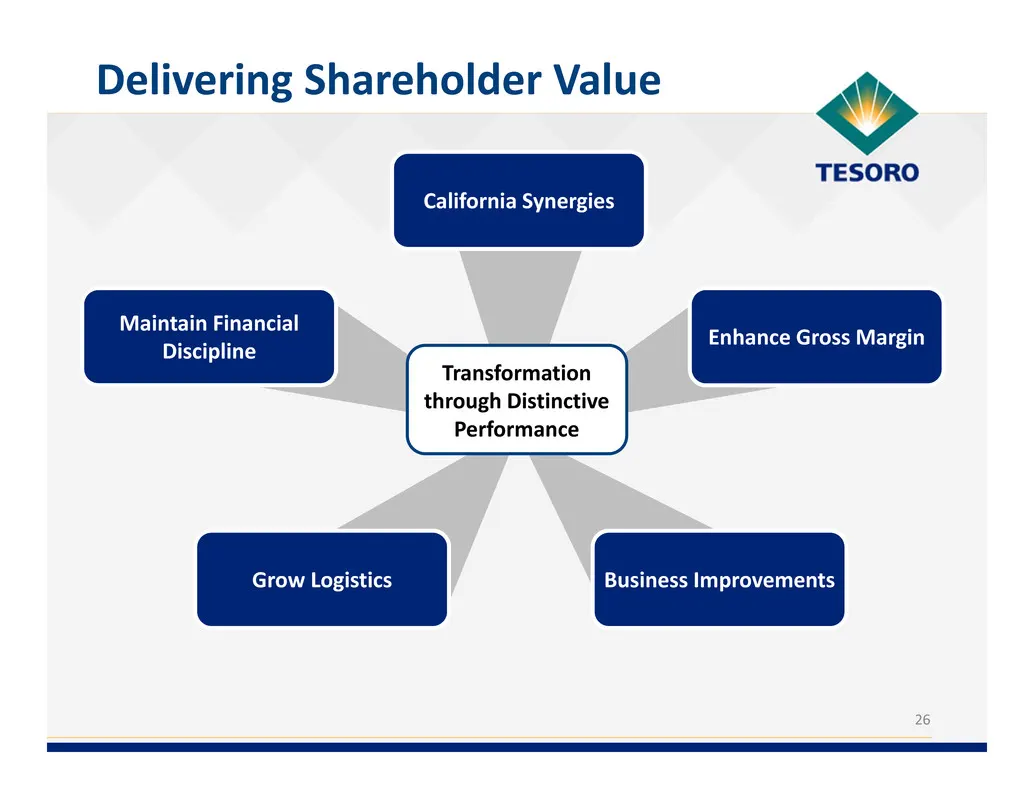
26 Delivering Shareholder Value Enhance Gross Margin California Synergies Maintain Financial Discipline Business ImprovementsGrow Logistics Transformation through Distinctive Performance
Slide 27: Composition of TSO Enterprise Value
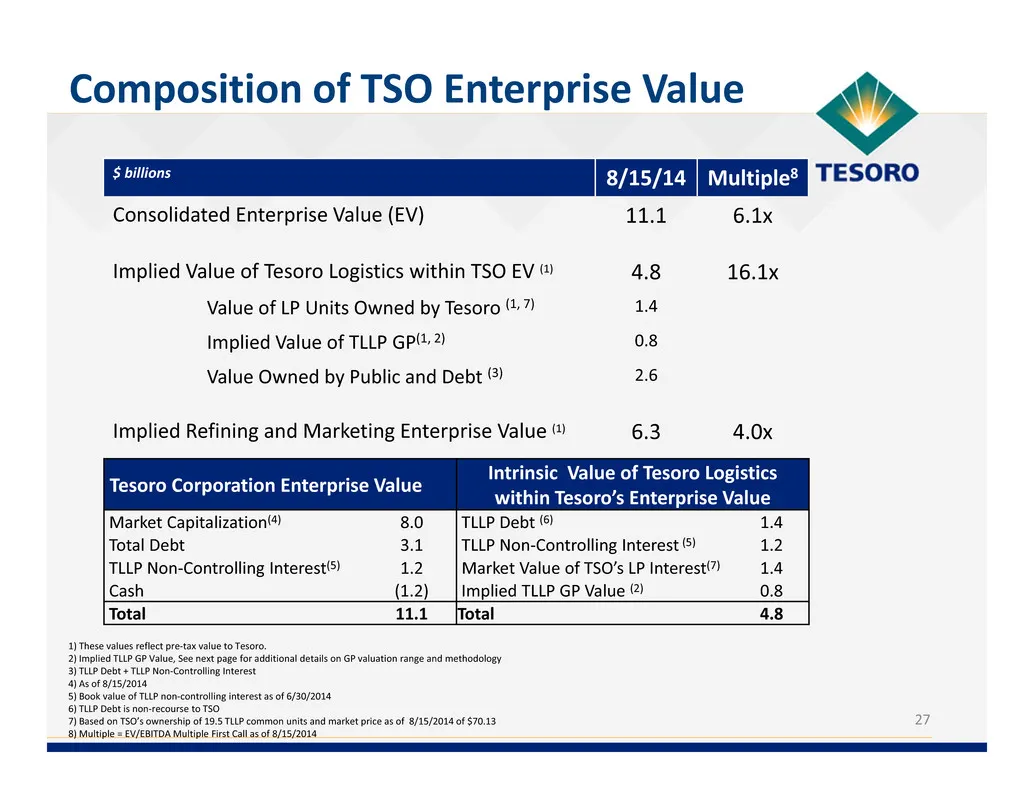
27 Composition of TSO Enterprise Value 1) These values reflect pre‐tax value to Tesoro. 2) Implied TLLP GP Value, See next page for additional details on GP valuation range and methodology 3) TLLP Debt + TLLP Non‐Controlling Interest 4) As of 8/15/2014 5) Book value of TLLP non‐controlling interest
Slide 28: Estimated Value of Tesoro Logistics GP to Tesoro
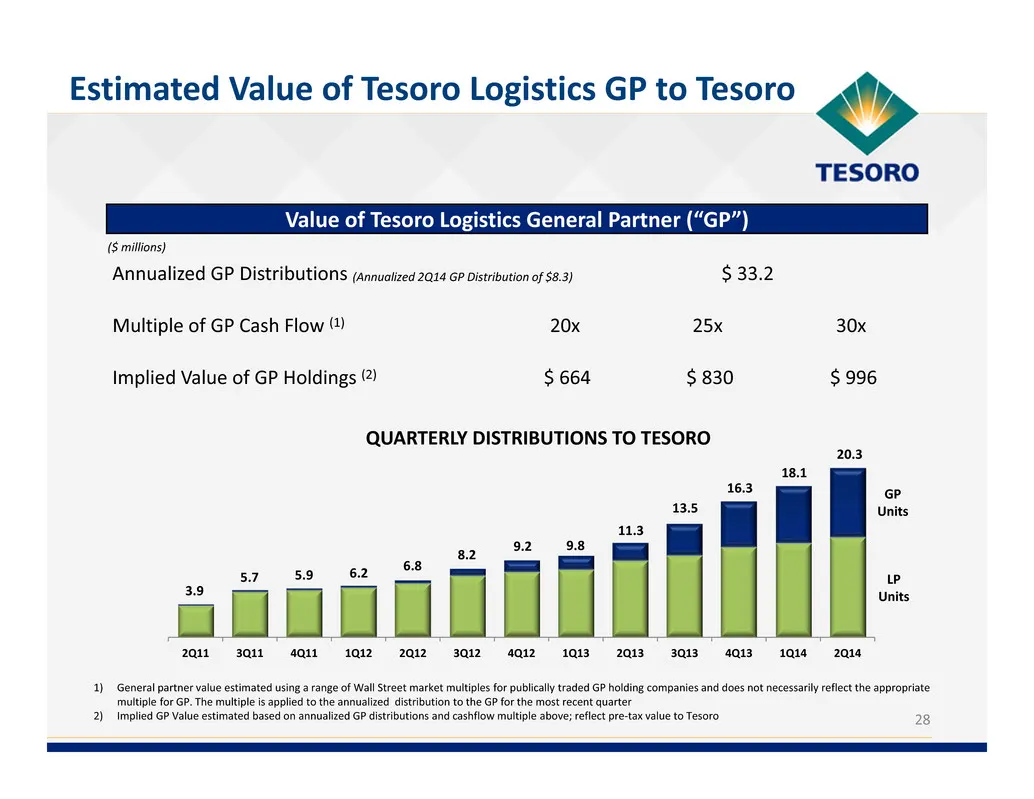
28 Estimated Value of Tesoro Logistics GP to Tesoro Value of Tesoro Logistics General Partner (“GP”) ($ millions) Annualized GP Distributions (Annualized 2Q14 GP Distribution of $8.3) $ 33.2 Multiple of GP Cash Flow (1) 20x 25x 30x Implied Value of GP Holdings (2) $ 664 $ 830 $ 996 1) General partne
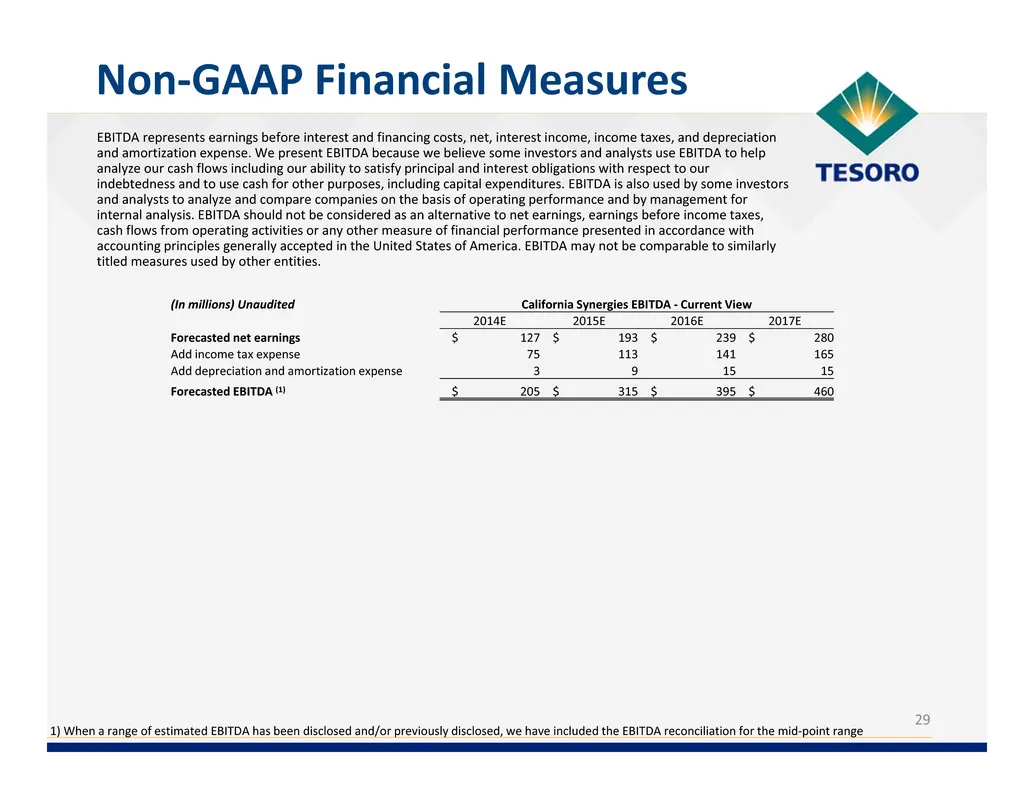
Slide 29: Non-GAAP Financial Measures
29 Non‐GAAP Financial Measures EBITDA represents earnings before interest and financing costs, net, interest income, income taxes, and depreciation and amortization expense. We present EBITDA because we believe some investors and analysts use EBITDA to help analyze our cash flows including our abili
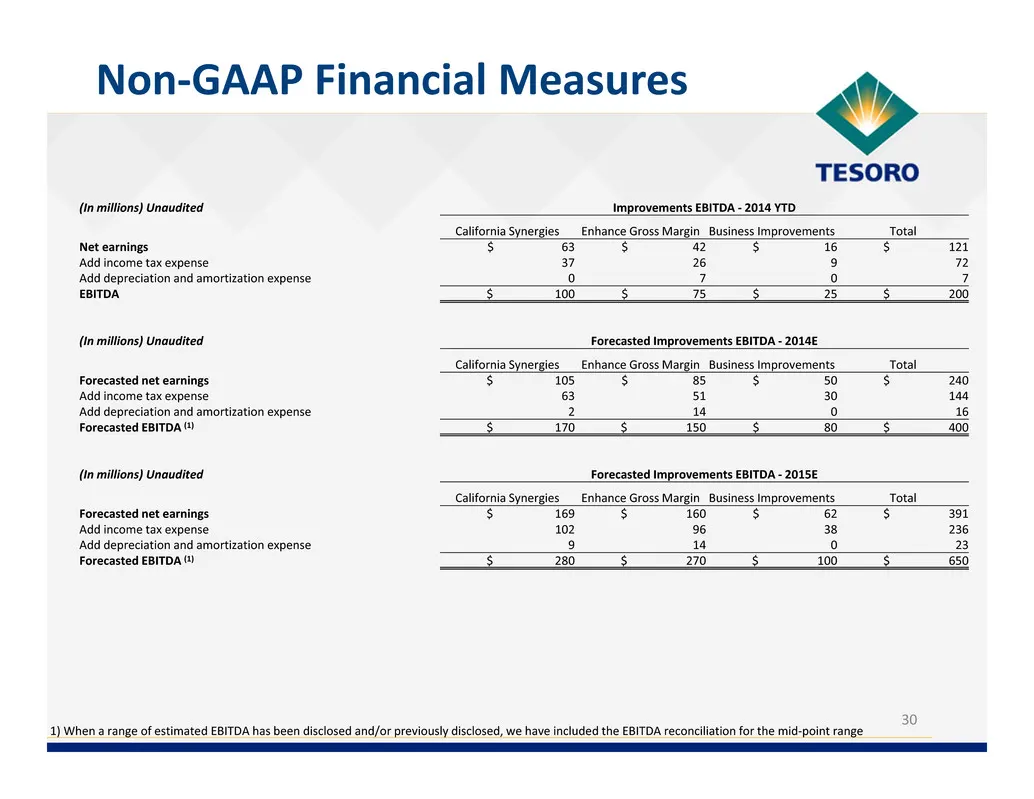
Slide 30: Non-GAAP Financial Measures
30 Non‐GAAP Financial Measures (In millions) Unaudited Improvements EBITDA ‐ 2014 YTD California Synergies Enhance Gross Margin Business Improvements Total Net earnings $ 63 $ 42 $ 16 $ 121 Add income tax expense 37 26 9 72 Add depreciation and amortization expense 0 7 0 7 EBITDA $ 100 $ 75 $ 25 $ 2
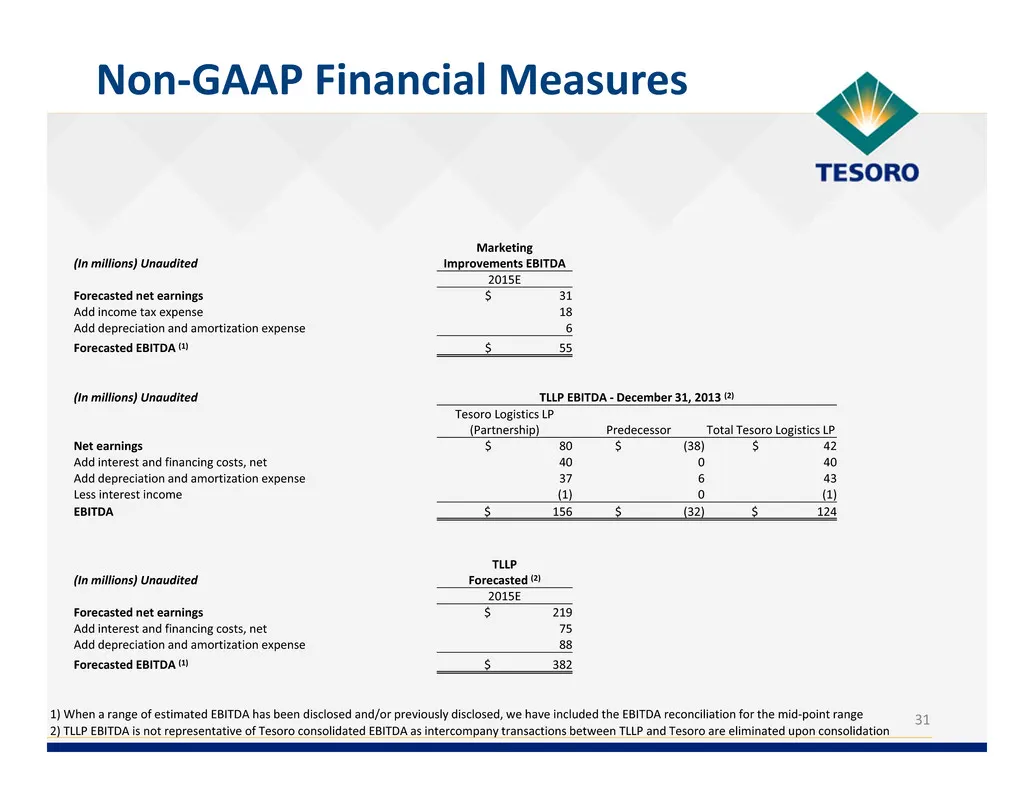
Slide 31: Non-GAAP Financial Measures
31 Non‐GAAP Financial Measures (In millions) Unaudited Marketing Improvements EBITDA 2015E Forecasted net earnings $ 31 Add income tax expense 18 Add depreciation and amortization expense 6 Forecasted EBITDA (1) $ 55 (In millions) Unaudited TLLP EBITDA ‐ December 31, 2013 (2) Tesoro Logistics LP (Pa
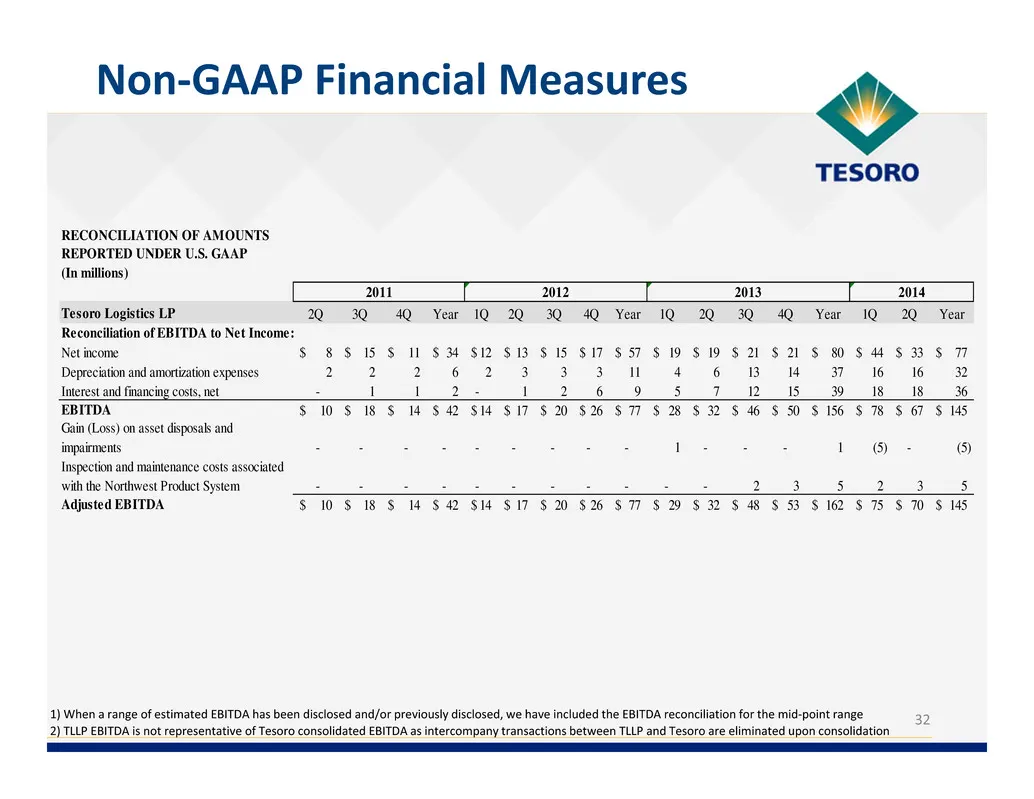
Slide 32: Non-GAAP Financial Measures
32 Non‐GAAP Financial Measures (In millions) Tesoro Logistics LP 2Q 3Q 4Q Year 1Q 2Q 3Q 4Q Year 1Q 2Q 3Q 4Q Year 1Q 2Q Year Reconciliation of EBITDA to Net Income: Net income 8$ 15$ 11$ 34$ 12$ 13$ 15$ 17$ 57$ 19$ 19$ 21$ 21$ 80$ 44$ 33$ 77$ Depreciation and amortization expenses 2 2 2 6 2 3 3 3 11
Source: SEC EDGAR · 8-K filed Sep 4, 2014
More decks from Andeavor
 Barclays CEO Energy-Power Conference 201896 slides · Sep 5, 2018
 Merger or Acquisition (June 2018)34 slides · Jun 6, 2018
 Merger or Acquisition (May 2018)10 slides · May 10, 2018
 Merger or Acquisition (April 2018)25 slides · Apr 30, 2018
 2018 Wolfe Research 4th Annual Refiners Conference37 slides · Jan 3, 2018
 Tesoro Corp /New/ — Investor Day (December 2015)84 slides · Dec 9, 2015