Old Mutual Ltd. · JSE:OMU
Old Mutual — H1 2015 Earnings Presentation
25 slides from Old Mutual's earnings presentation, Aug 6, 2015
Slide 1: Interim Results 2015
INTERIM RESULTS 2015 6 August 2015 INVESTMENT | SAVINGS | INSURANCE | BANKING
Slide 2: Disclaimer
DISCLAIMER This presentation may contain certain forward-looking statements with respect to certain of Old Mutual plc’s plans and its current goals and expectations relating to its future financial condition, performance and results. By their nature, all forward-looking statements involve risk and u
Slide 3: Agenda
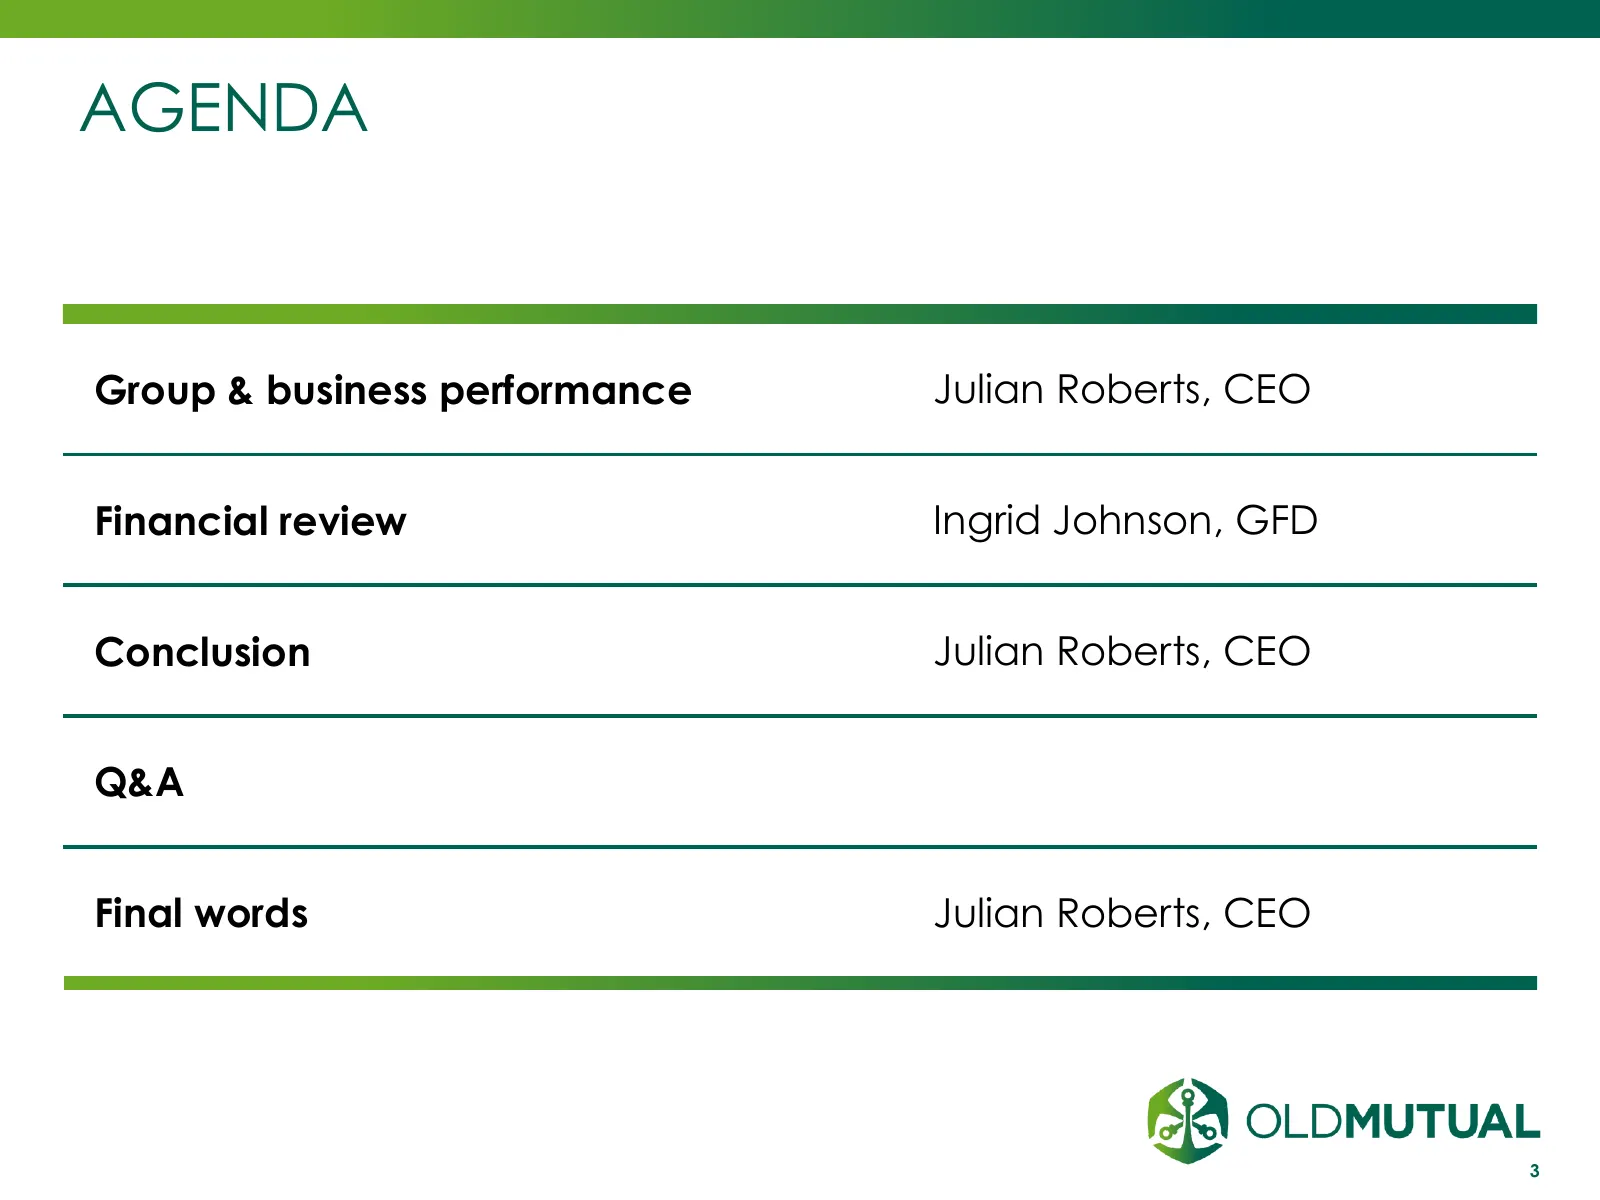
AGENDA Group & business performance Julian Roberts, CEO Financial review Ingrid Johnson, GFD Conclusion Julian Roberts, CEO Q&A Final words Julian Roberts, CEO 3
Slide 4: Good first half performance
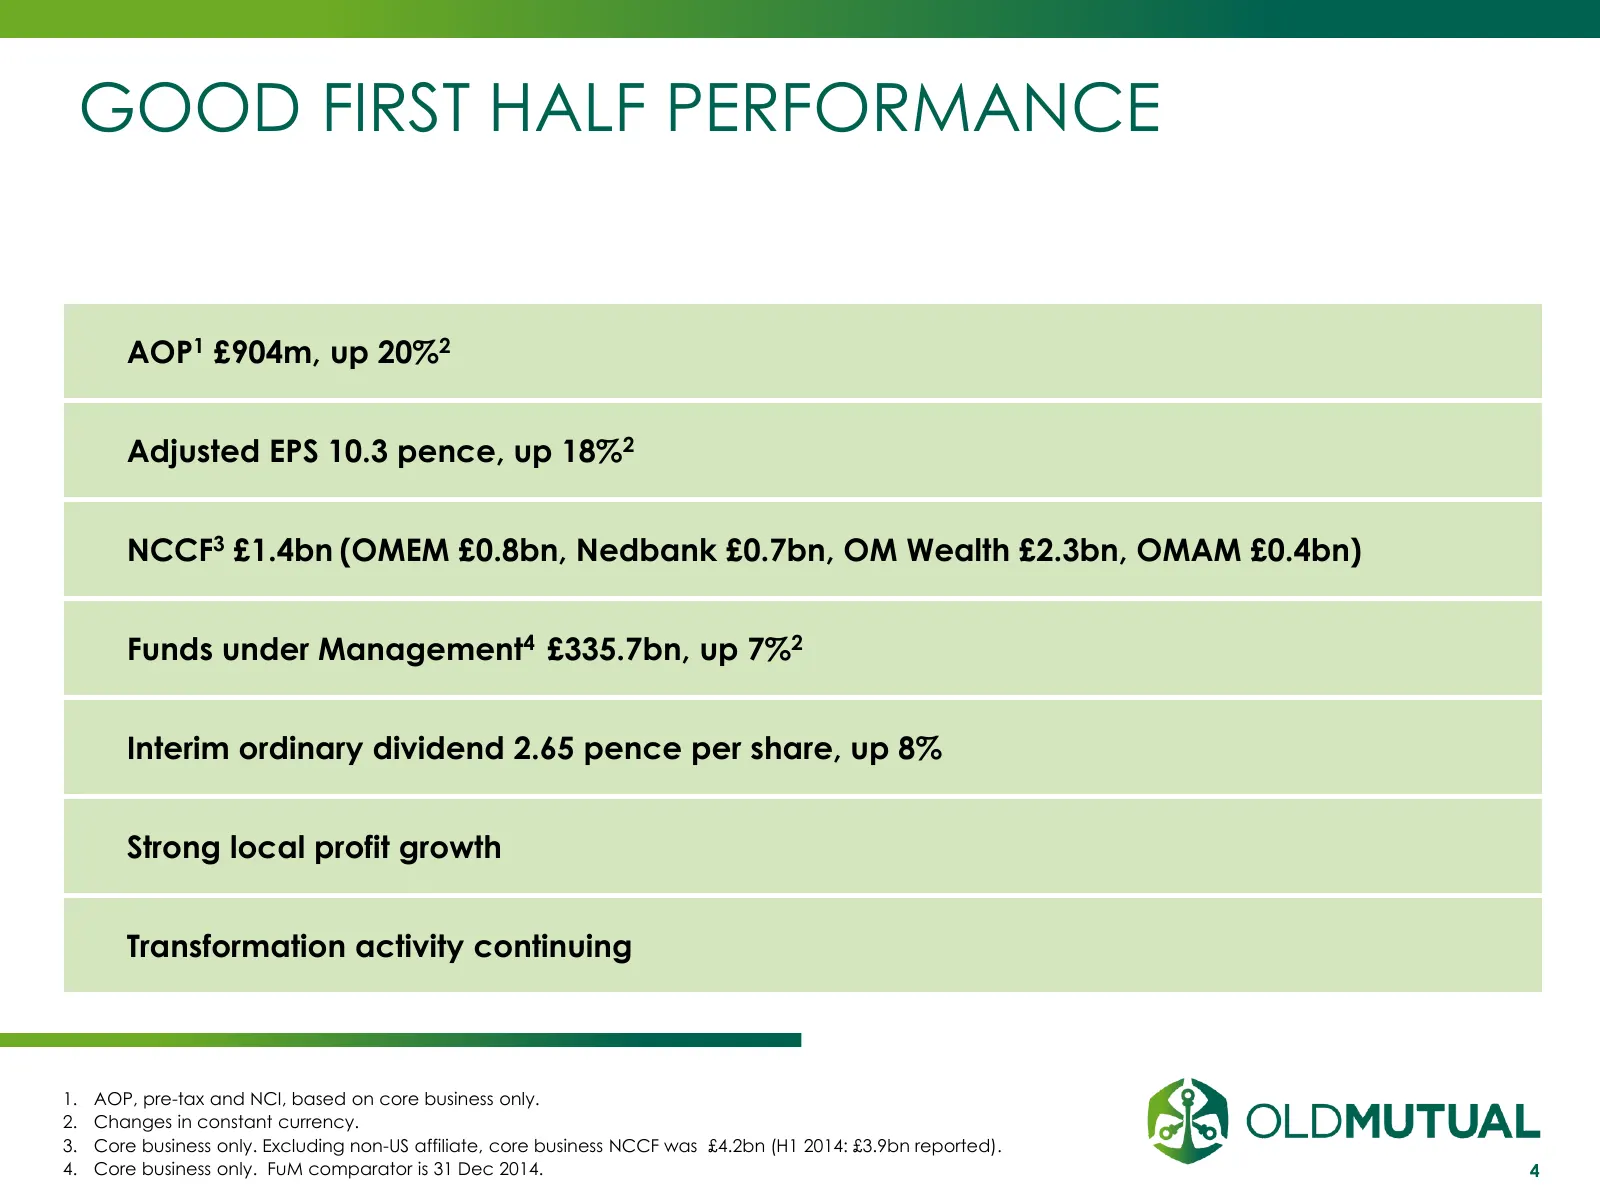
GOOD FIRST HALF PERFORMANCE AOP1 £904m, up 20%2 Adjusted EPS 10.3 pence, up 18%2 NCCF3 £1.4bn (OMEM £0.8bn, Nedbank £0.7bn, OM Wealth £2.3bn, OMAM £0.4bn) Funds under Management4 £335.7bn, up 7%2 Interim ordinary dividend 2.65 pence per share, up 8% Strong local profit growth Transformation activity
Slide 5: Old Mutual Emerging Markets
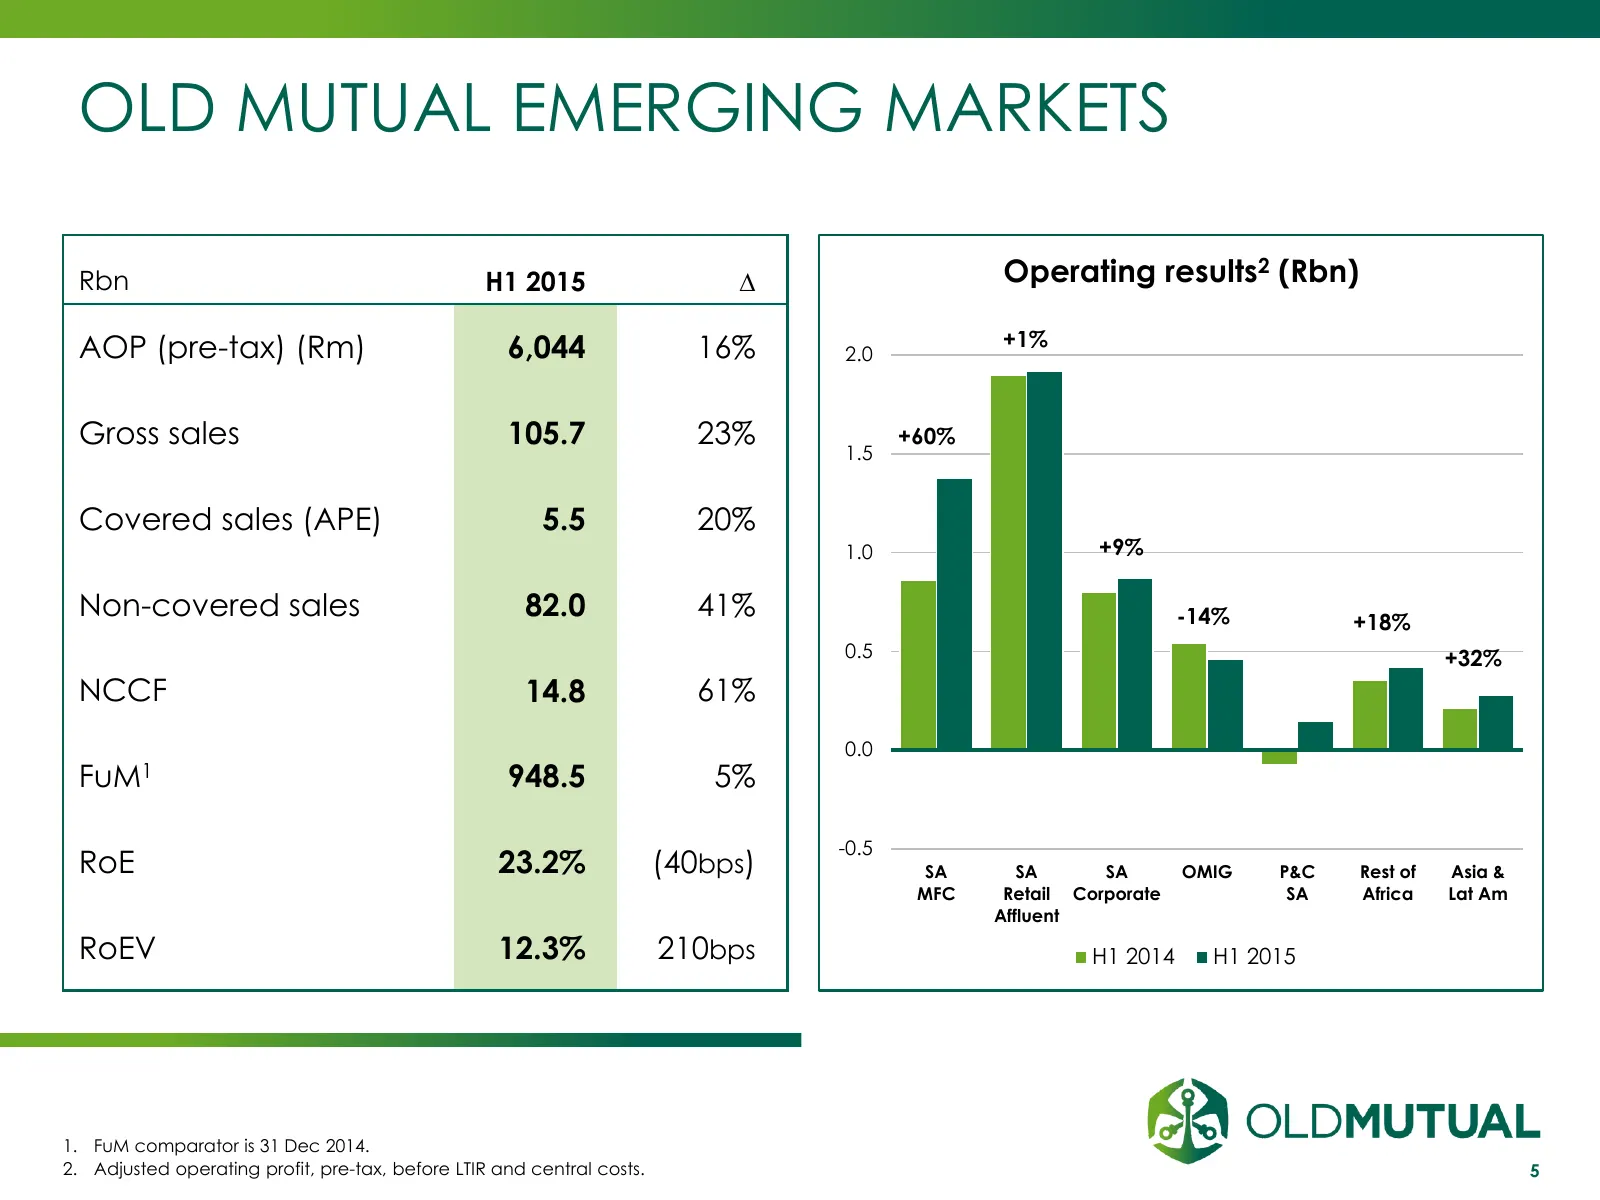
OLD MUTUAL EMERGING MARKETS Rbn H1 2015 ∆ Operating results2 (Rbn) AOP (pre-tax) (Rm) 6,044 16% +1% 2.0 Gross sales 105.7 23% +60% 1.5 Covered sales (APE) 5.5 20% 1.0 +9% Non-covered sales 82.0 41% -14% +18% 0.5 +32% NCCF 14.8 61% 0.0 FuM1 948.5 5% -0.5 RoE 23.2% (40bps) SA SA SA OMIG P&C Rest of As
Slide 6: Nedbank
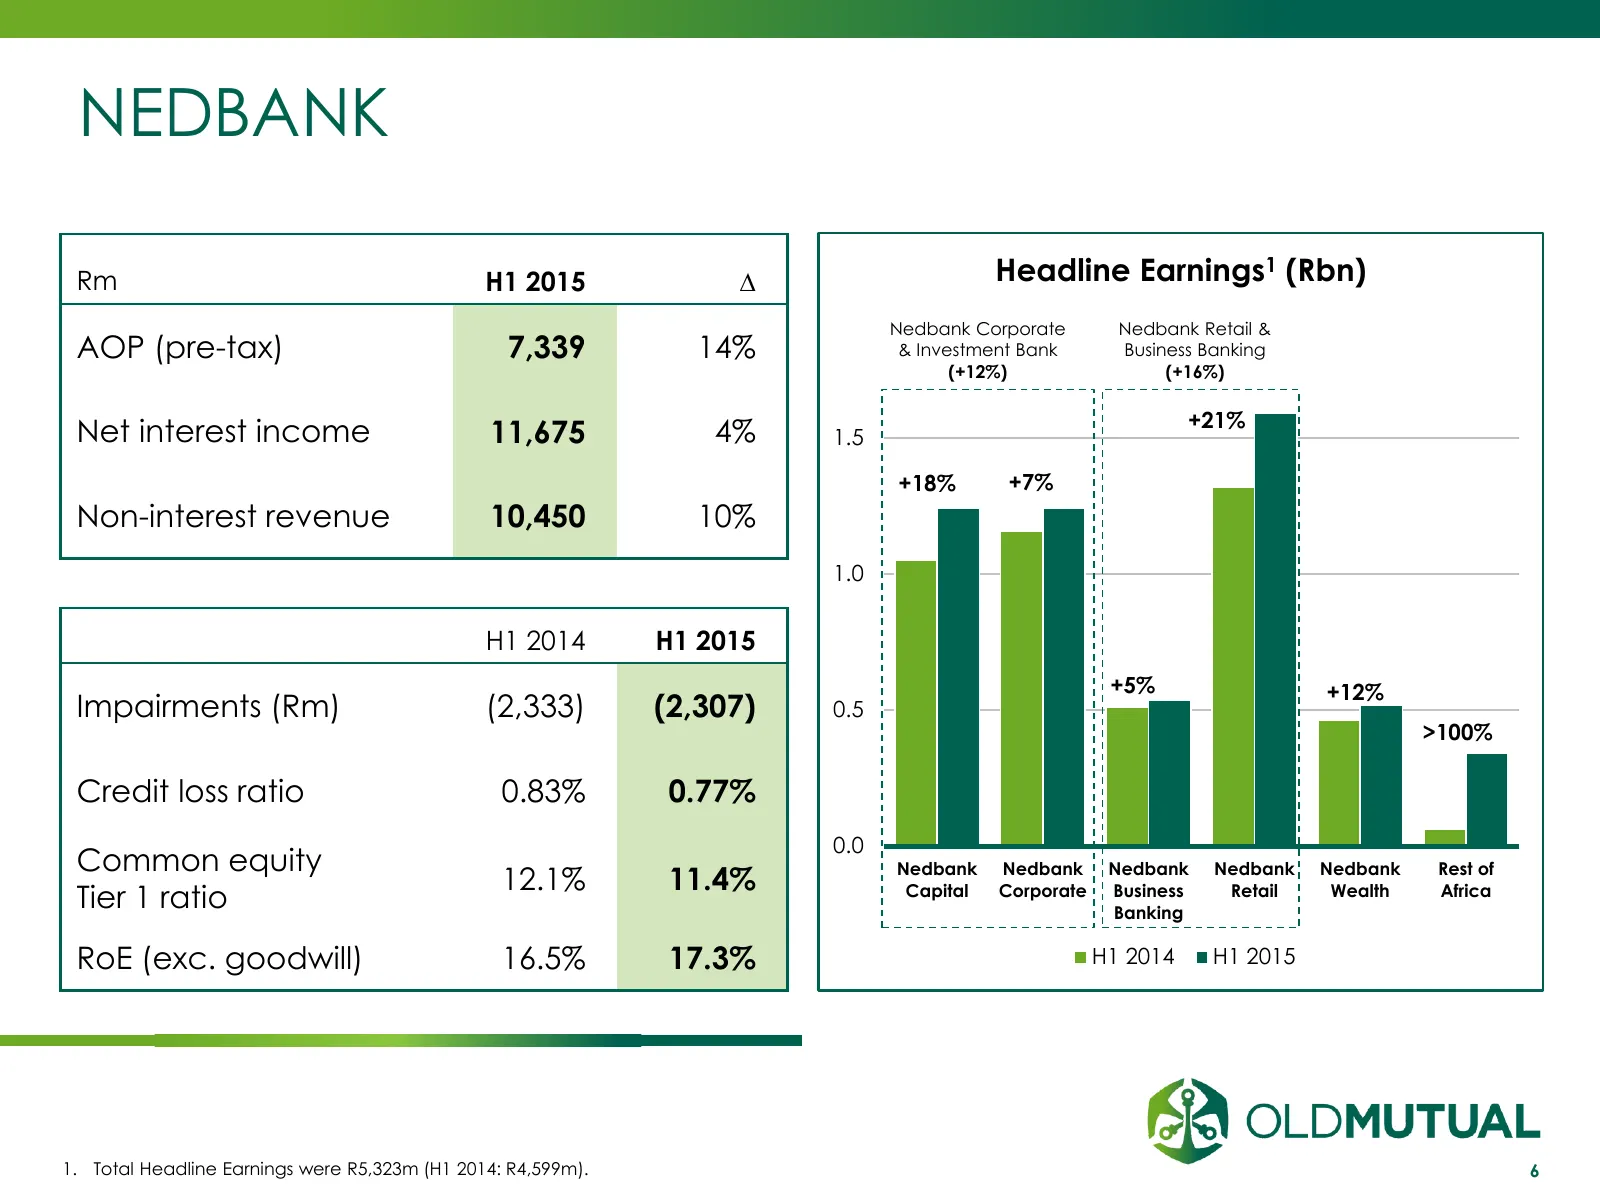
NEDBANK Rm H1 2015 ∆ Headline Earnings1 (Rbn) Nedbank Corporate Nedbank Retail & AOP (pre-tax) 7,339 14% & Investment Bank Business Banking (+12%) (+16%) +21% Net interest income 11,675 4% 1.5 +18% +7% Non-interest revenue 10,450 10% 1.0 H1 2014 H1 2015 +5% +12% Impairments (Rm) (2,333) (2,307) 0.5
Slide 7: Old Mutual Wealth
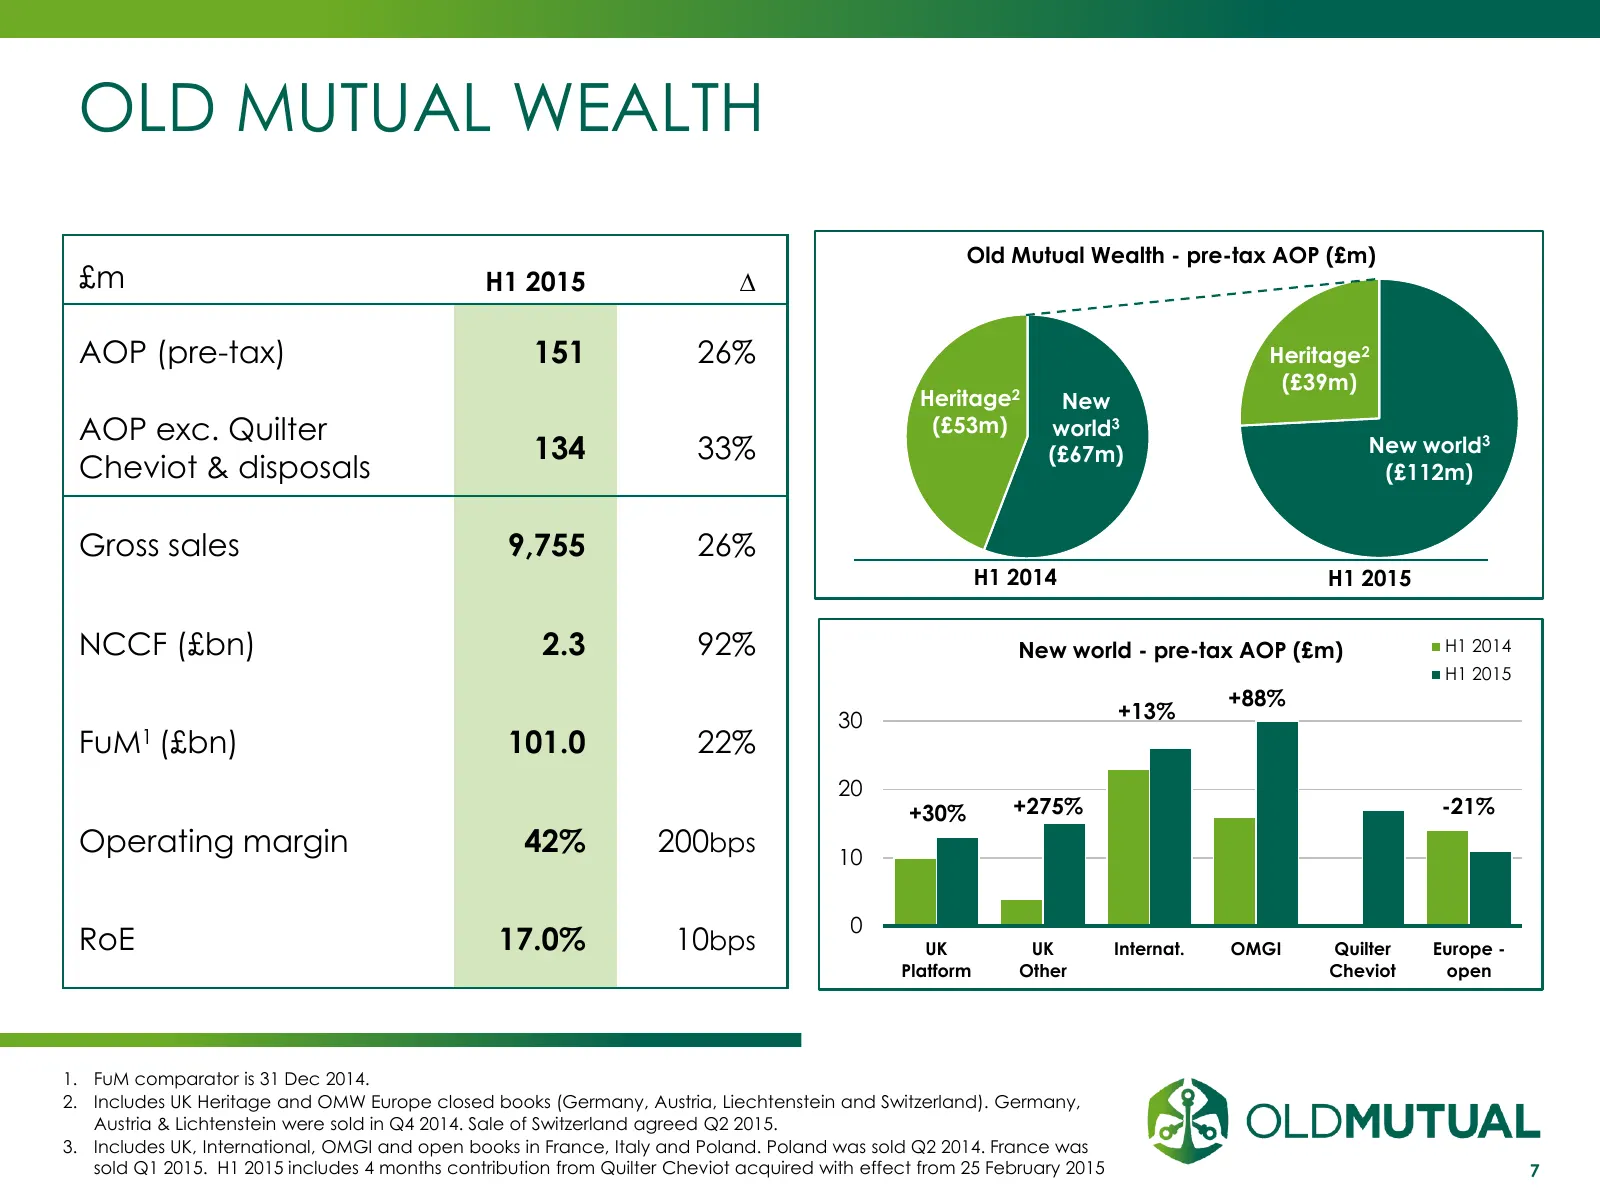
OLD MUTUAL WEALTH Old Mutual Wealth - pre-tax AOP (£m) £m H1 2015 ∆ AOP (pre-tax) 151 26% Heritage2 (£39m) Heritage2 New AOP exc. Quilter (£53m) world3 134 33% (£67m) New world3 Cheviot & disposals (£112m) Gross sales 9,755 26% H1 2014 H1 2015 NCCF (£bn) 2.3 92% New world - pre-tax AOP (£m) H1 2014
Slide 8: Building the leading retail investment business in the UK: acquisition update
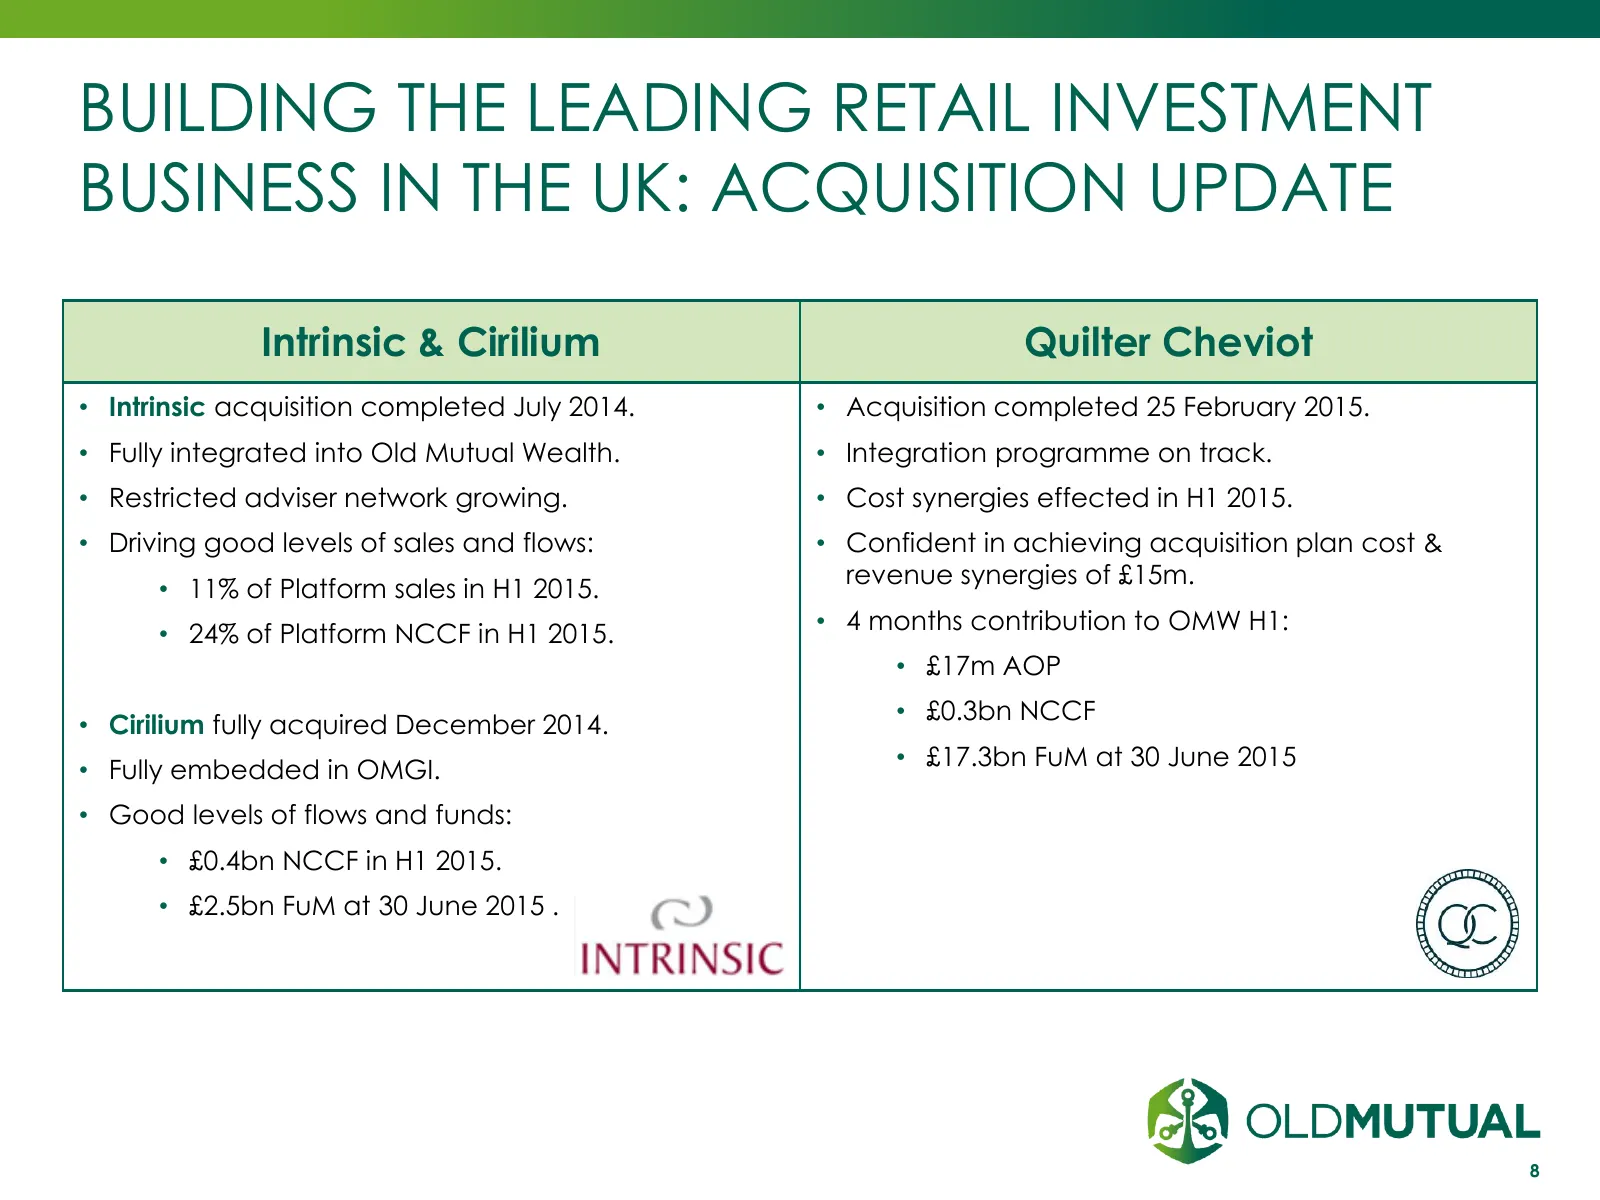
BUILDING THE LEADING RETAIL INVESTMENT BUSINESS IN THE UK: ACQUISITION UPDATE Intrinsic & Cirilium Quilter Cheviot • Intrinsic acquisition completed July 2014. • Acquisition completed 25 February 2015. • Fully integrated into Old Mutual Wealth. • Integration programme on track. • Restricted adviser
Slide 9: Building the leading retail investment business in the UK: technology update
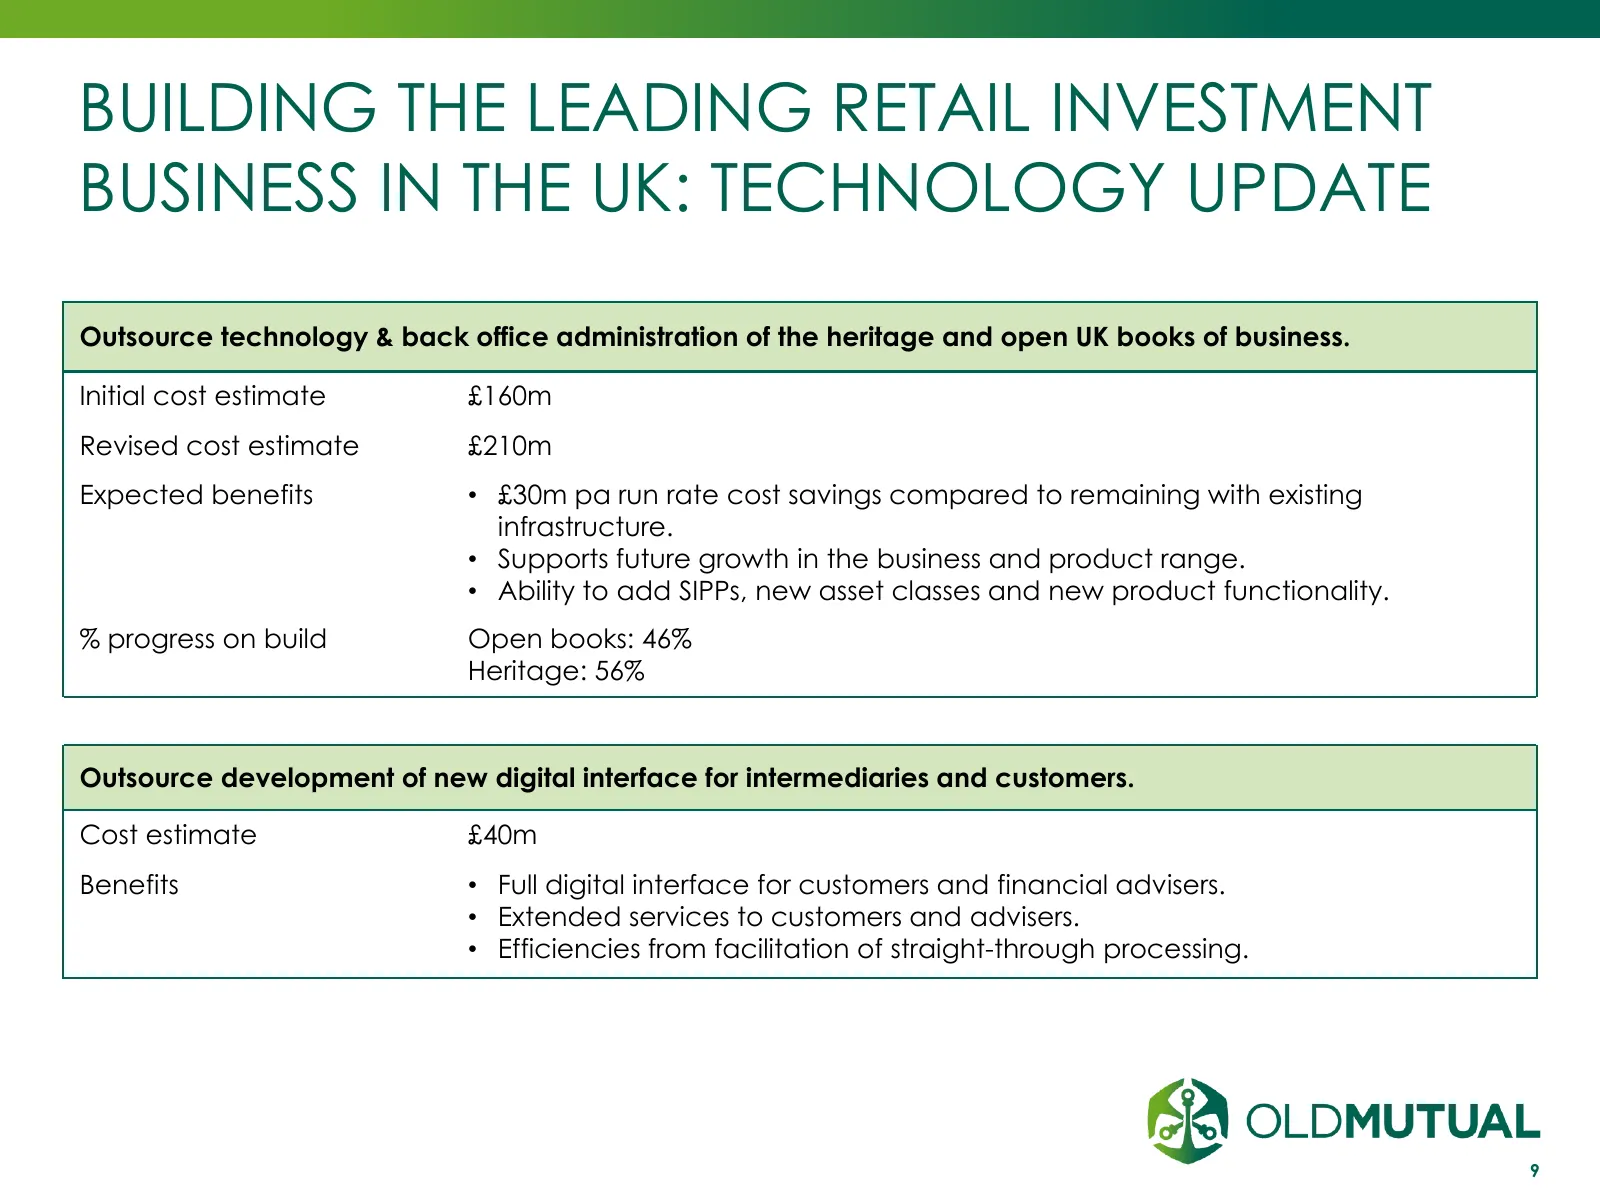
BUILDING THE LEADING RETAIL INVESTMENT BUSINESS IN THE UK: TECHNOLOGY UPDATE Outsource technology & back office administration of the heritage and open UK books of business. Initial cost estimate £160m Revised cost estimate £210m Expected benefits • £30m pa run rate cost savings compared to remainin
Slide 10: OM Asset Management
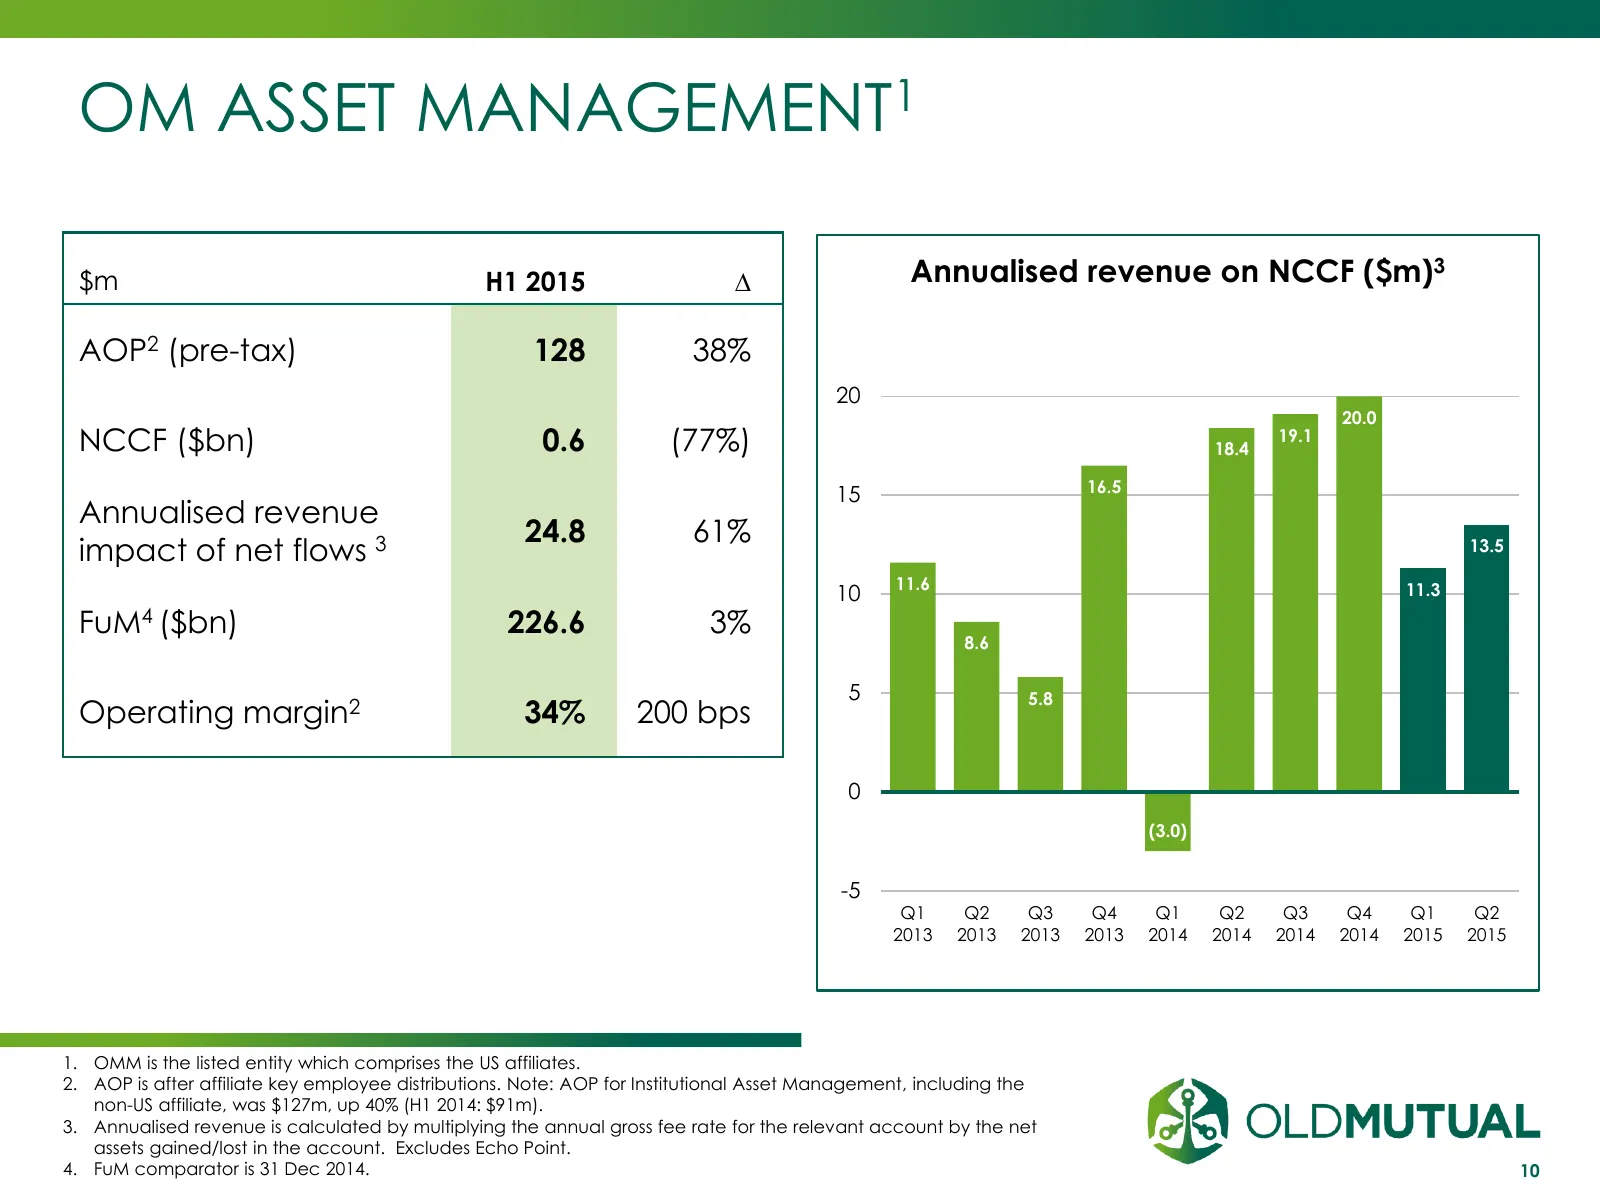
OM ASSET MANAGEMENT1 $m H1 2015 ∆ Annualised revenue on NCCF ($m)3 AOP2 (pre-tax) 128 38% 20 20.0 NCCF ($bn) 0.6 (77%) 18.4 19.1 16.5 15 Annualised revenue 24.8 61% impact of net flows 3 13.5 11.6 11.3 10 FuM4 ($bn) 226.6 3% 8.6 5 5.8 Operating margin2 34% 200 bps 0 (3.0) -5 Q1 Q2 Q3 Q4 Q1 Q2 Q3 Q4
Slide 11: Continuing to deliver our strategy
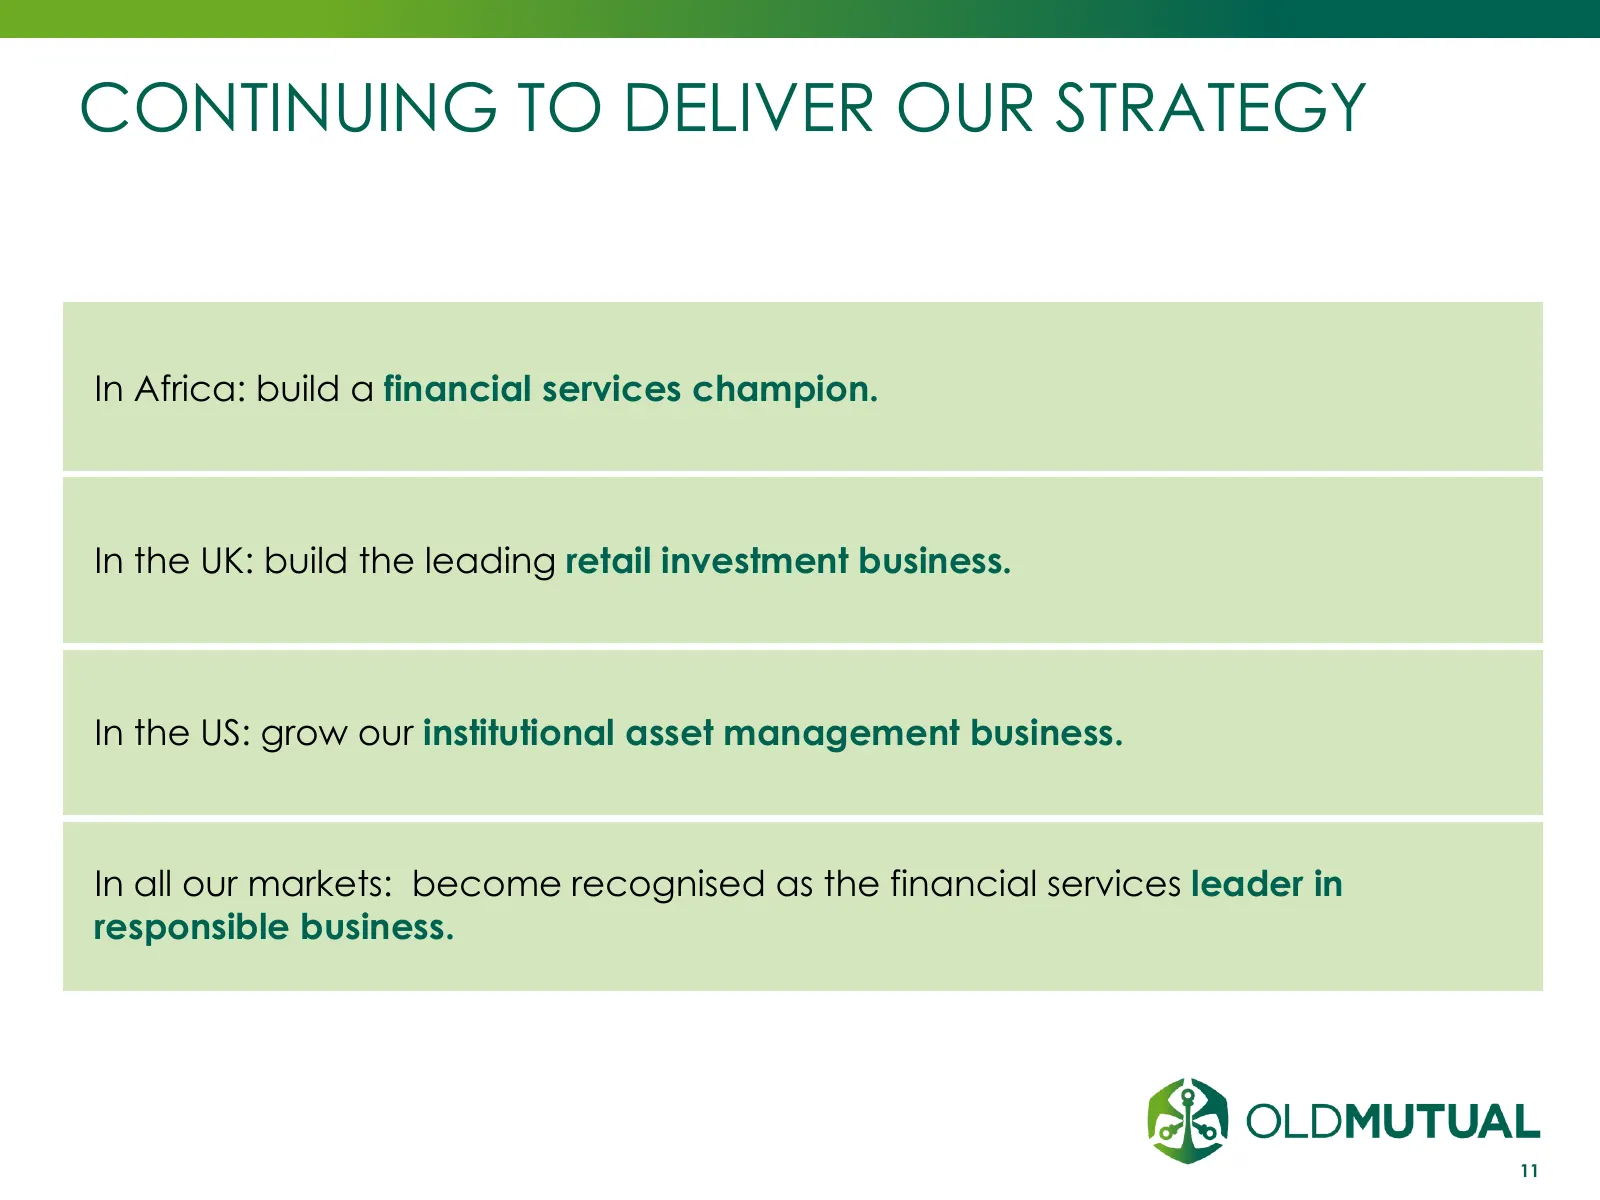
CONTINUING TO DELIVER OUR STRATEGY In Africa: build a financial services champion. In the UK: build the leading retail investment business. In the US: grow our institutional asset management business. In all our markets: become recognised as the financial services leader in responsible business. 11
Slide 12: Financial Review
FINANCIAL REVIEW 6 August 2015 INVESTMENT | SAVINGS | INSURANCE | BANKING
Slide 13: Agenda
AGENDA Macro background Operating profit analysis Cash Debt & capital Financial summary 13
Slide 14: Equity markets, currency & GDP
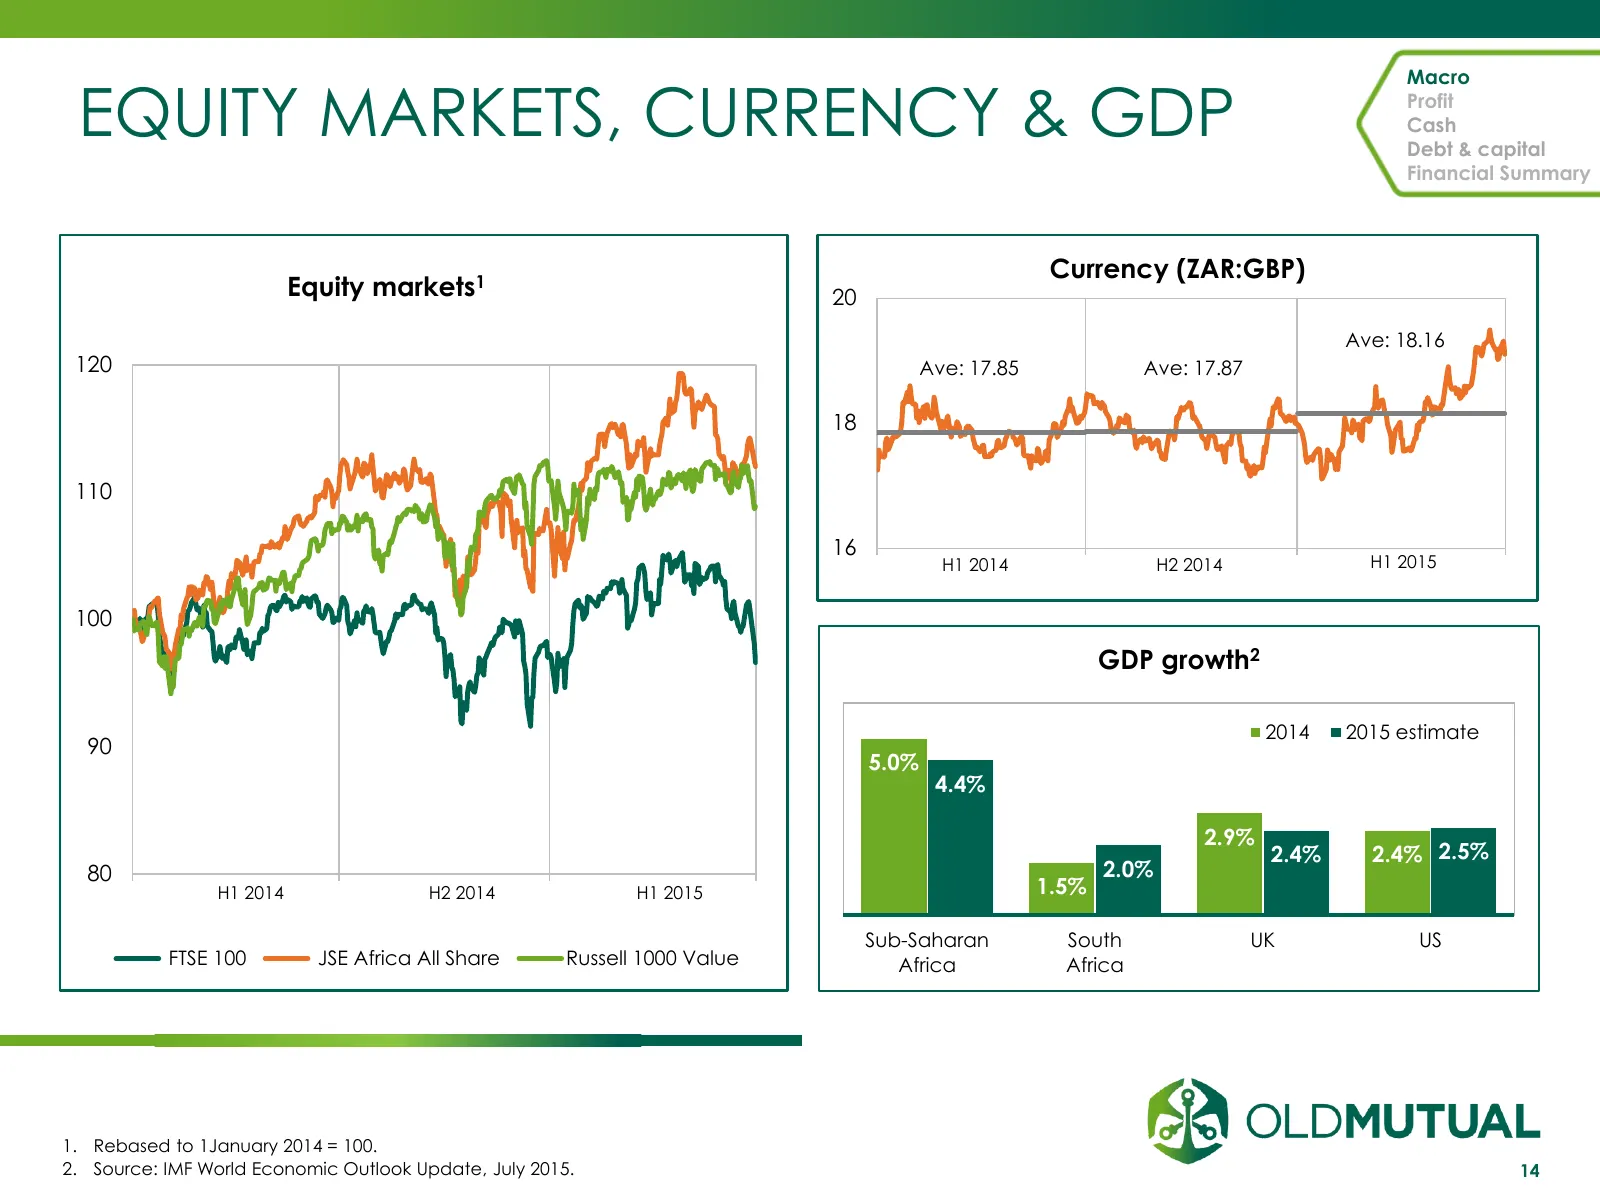
Macro EQUITY MARKETS, CURRENCY & GDP Profit Cash Debt & capital Financial Summary Currency (ZAR:GBP) Equity markets1 20 Ave: 18.16 120 Ave: 17.85 Ave: 17.87 18 110 16 H1 2014 H2 2014 H1 2015 100 GDP growth2 2014 2015 estimate 90 5.0% 4.4% 2.9% 2.4% 2.4% 2.5% 80 2.0% H1 2014 H2 2014 H1 2015 1.5% Sub-
Slide 15: Operating profit analysis
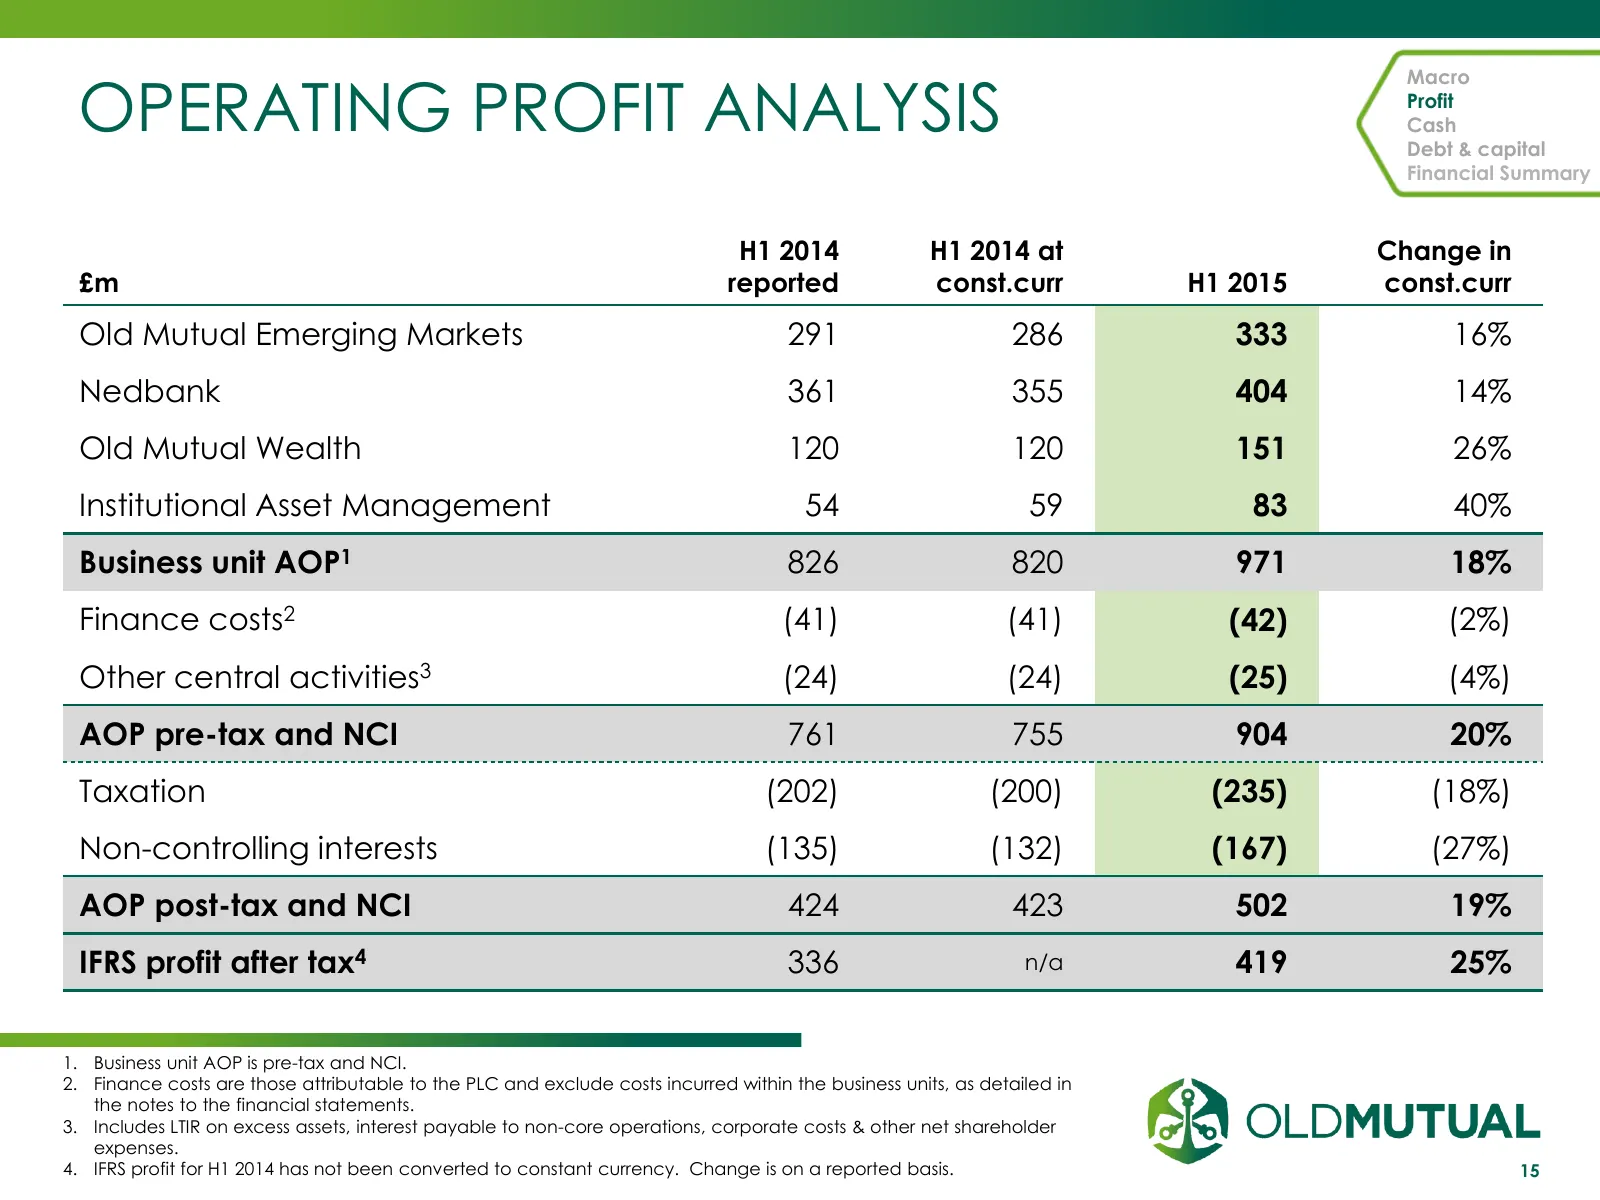
OPERATING PROFIT ANALYSIS Macro Profit Cash Debt & capital Financial Summary H1 2014 H1 2014 at Change in £m reported const.curr H1 2015 const.curr Old Mutual Emerging Markets 291 286 333 16% Nedbank 361 355 404 14% Old Mutual Wealth 120 120 151 26% Institutional Asset Management 54 59 83 40% Busine
Slide 16: Conversion of business unit AOP to PLC cash
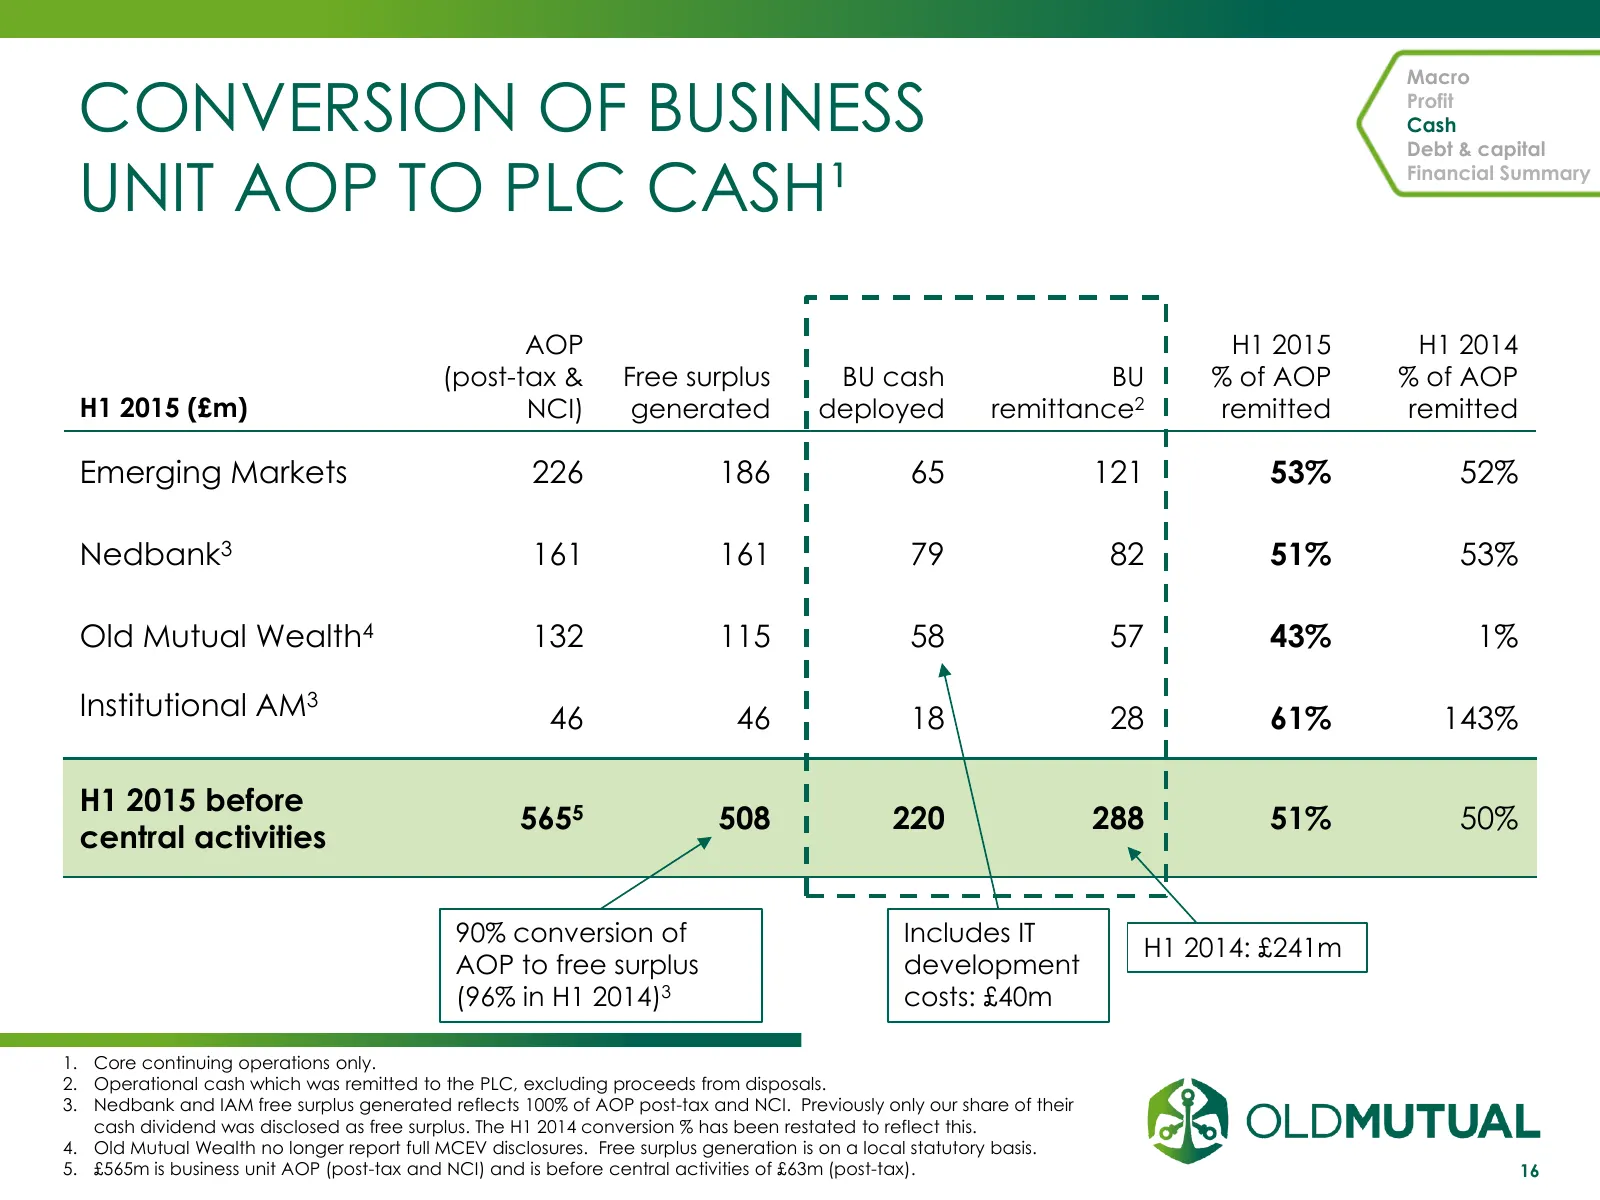
CONVERSION OF BUSINESS Macro Profit Cash Debt & capital UNIT AOP TO PLC CASH¹ Financial Summary AOP H1 2015 H1 2014 (post-tax & Free surplus BU cash BU % of AOP % of AOP H1 2015 (£m) NCI) generated deployed remittance2 remitted remitted Emerging Markets 226 186 65 121 53% 52% Nedbank3 161 161 79 82
Slide 17: Sources and uses of PLC cash
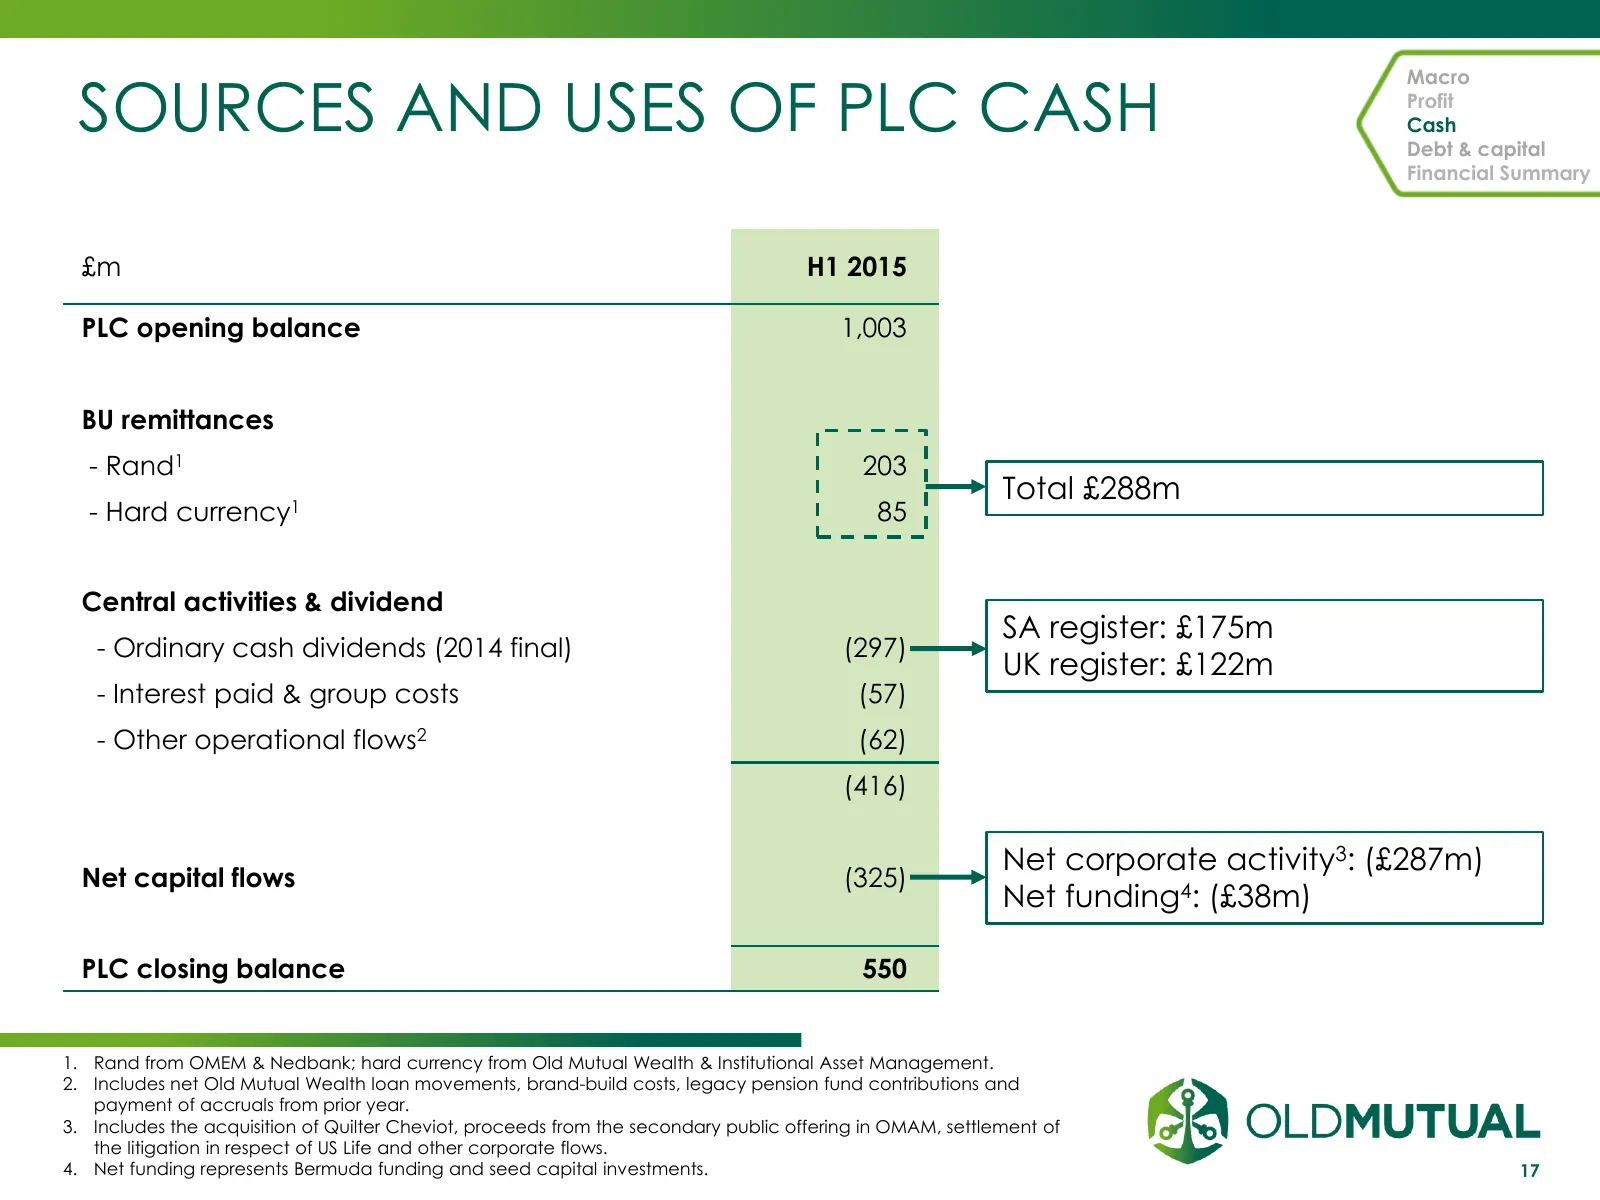
SOURCES AND USES OF PLC CASH Macro Profit Cash Debt & capital Financial Summary £m H1 2015 PLC opening balance 1,003 BU remittances - Rand1 203 Total £288m - Hard currency1 85 Central activities & dividend SA register: £175m - Ordinary cash dividends (2014 final) (297) UK register: £122m - Interest
Slide 18: Liquidity & debt
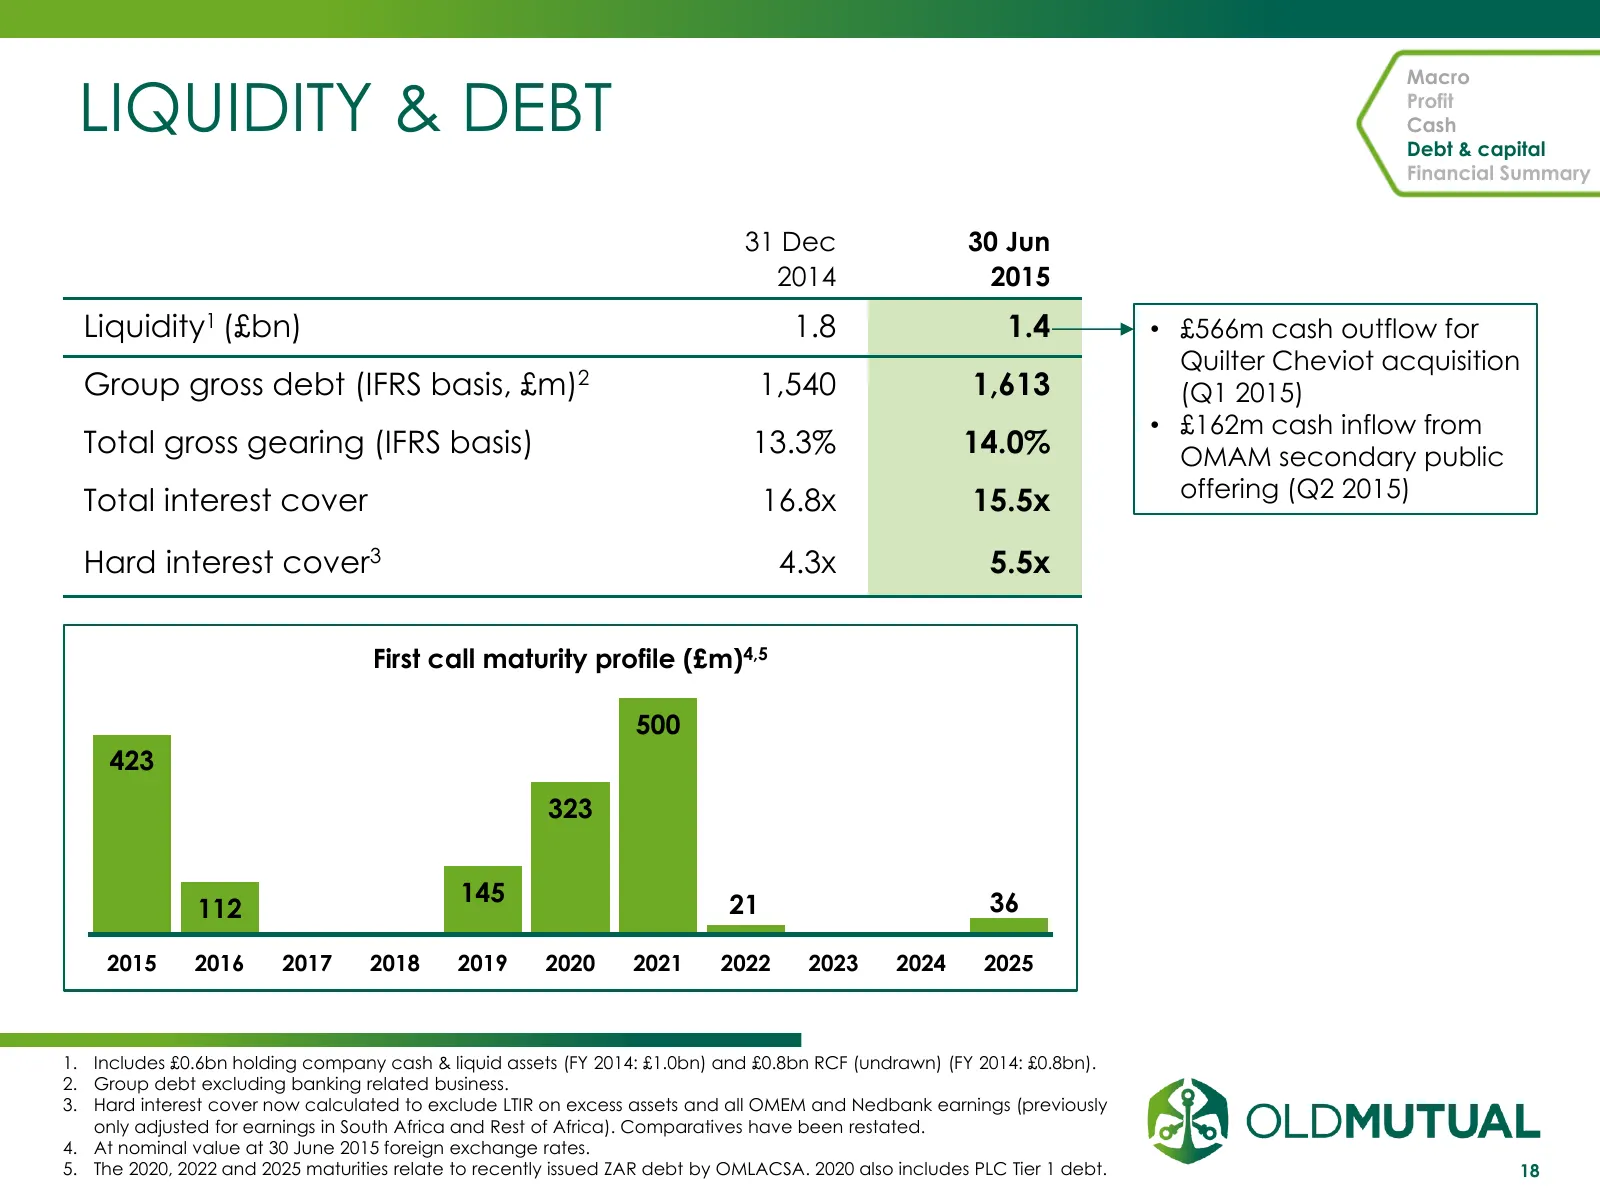
LIQUIDITY & DEBT Macro Profit Cash Debt & capital Financial Summary 31 Dec 30 Jun 2014 2015 Liquidity1 (£bn) 1.8 1.4 • £566m cash outflow for Quilter Cheviot acquisition Group gross debt (IFRS basis, £m)2 1,540 1,613 (Q1 2015) • £162m cash inflow from Total gross gearing (IFRS basis) 13.3% 14.0% OMA
Slide 19: Group capital
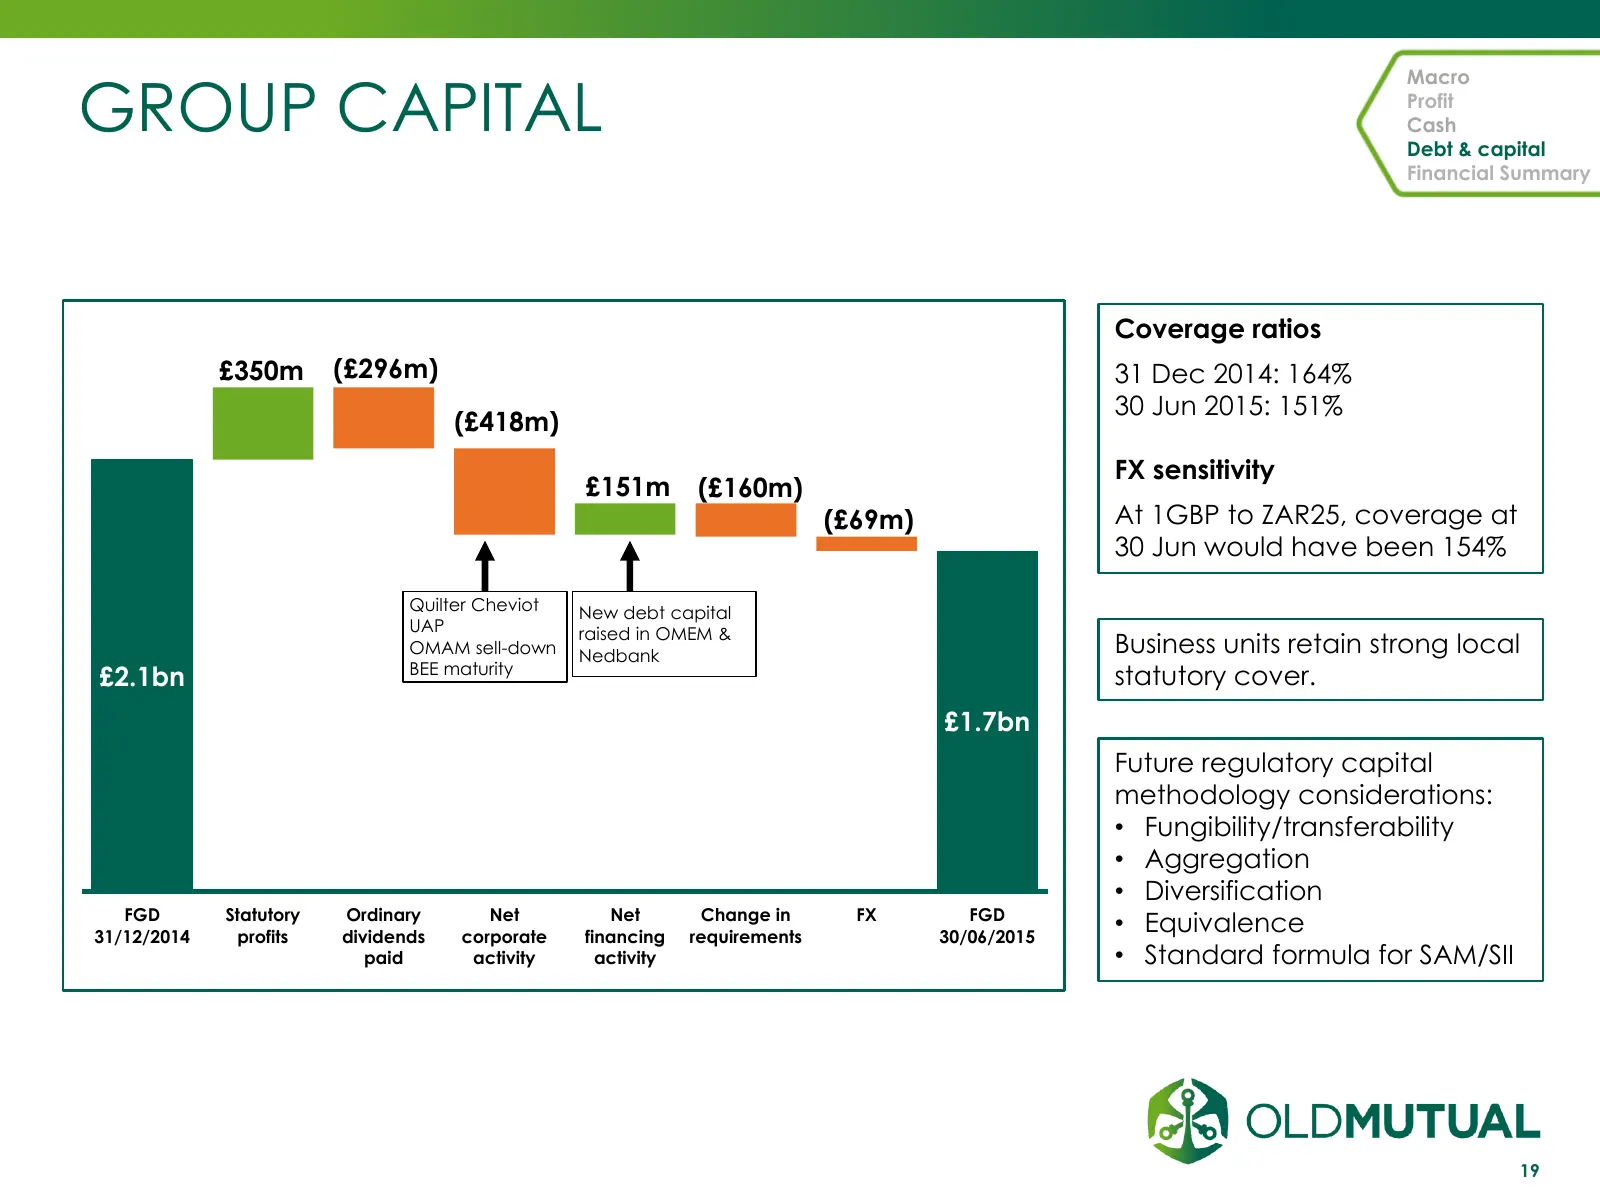
GROUP CAPITAL Macro Profit Cash Debt & capital Financial Summary Coverage ratios £350m (£296m) 31 Dec 2014: 164% 30 Jun 2015: 151% (£418m) FX sensitivity £151m (£160m) (£69m) At 1GBP to ZAR25, coverage at 30 Jun would have been 154% Quilter Cheviot New debt capital UAP raised in OMEM & OMAM sell-dow
Slide 20: Financial summary: H1 2015
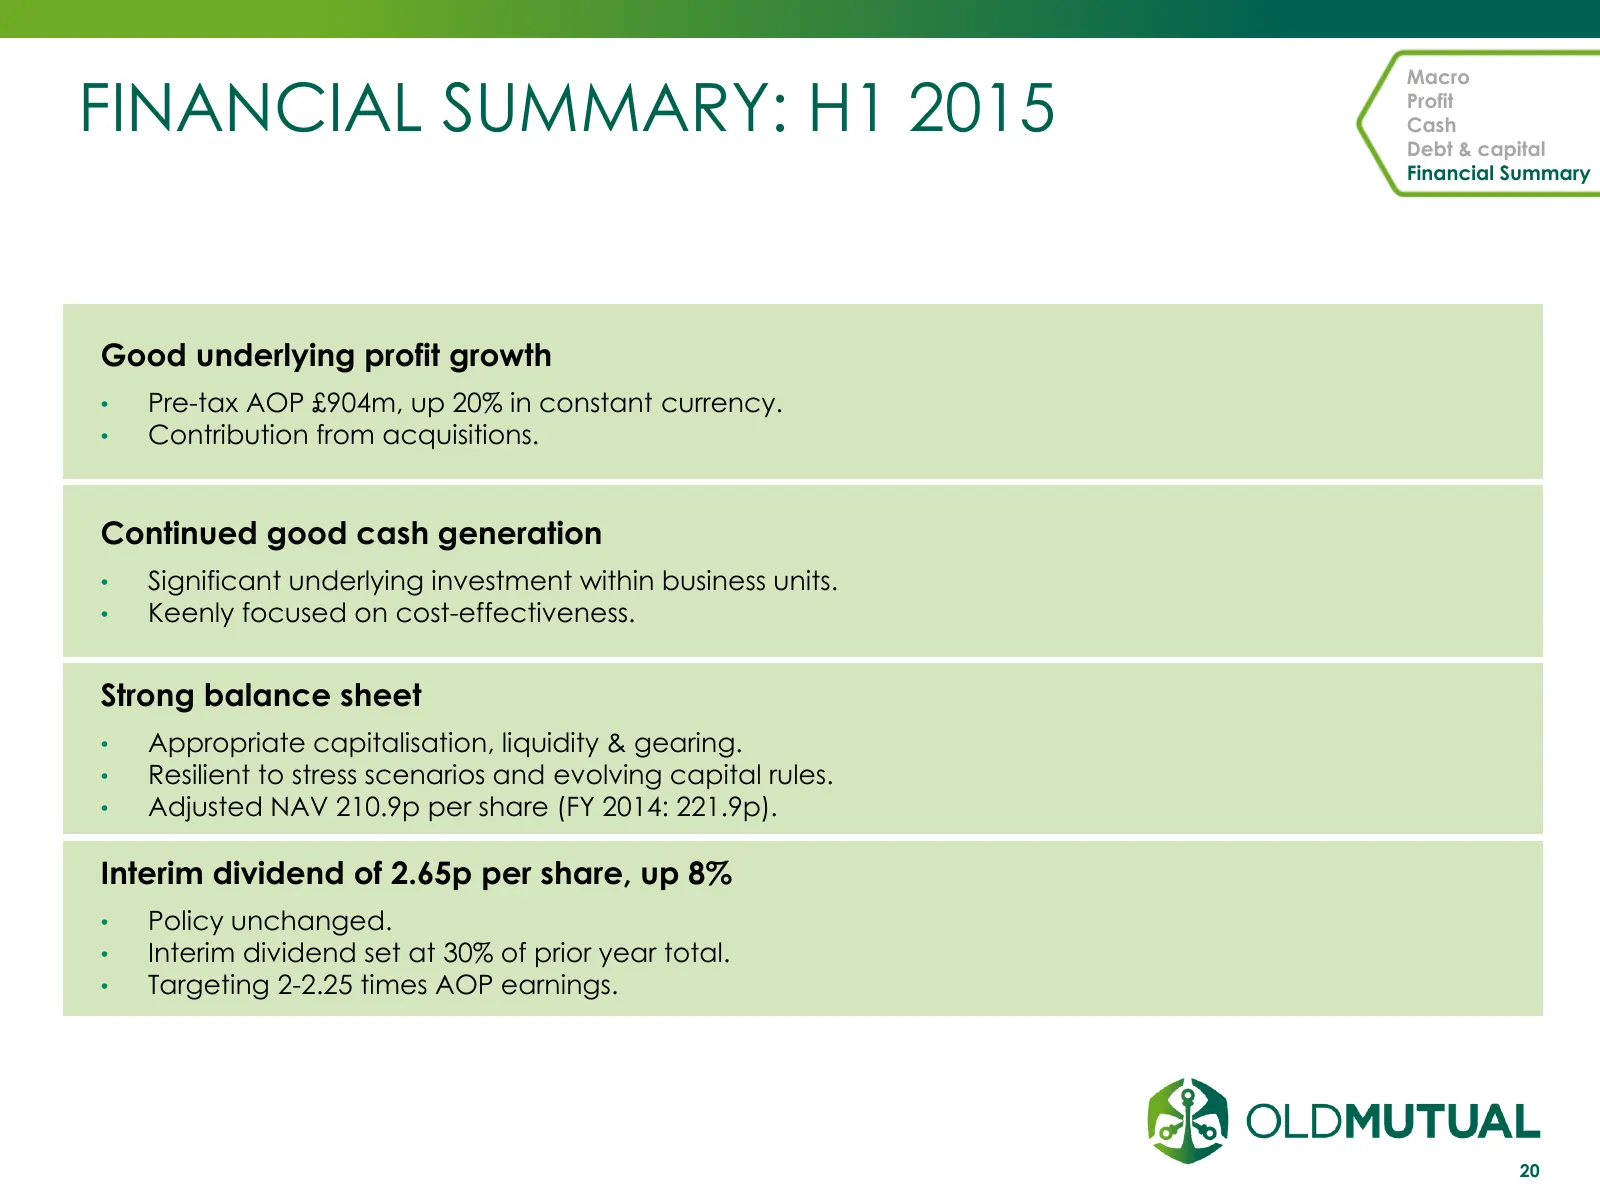
FINANCIAL SUMMARY: H1 2015 Macro Profit Cash Debt & capital Financial Summary Good underlying profit growth • Pre-tax AOP £904m, up 20% in constant currency. • Contribution from acquisitions. Continued good cash generation • Significant underlying investment within business units. • Keenly focused o
Slide 21: Conclusion
CONCLUSION 6 August 2015 INVESTMENT | SAVINGS | INSURANCE | BANKING
Slide 22: Delivering value from the transformation of Old Mutual
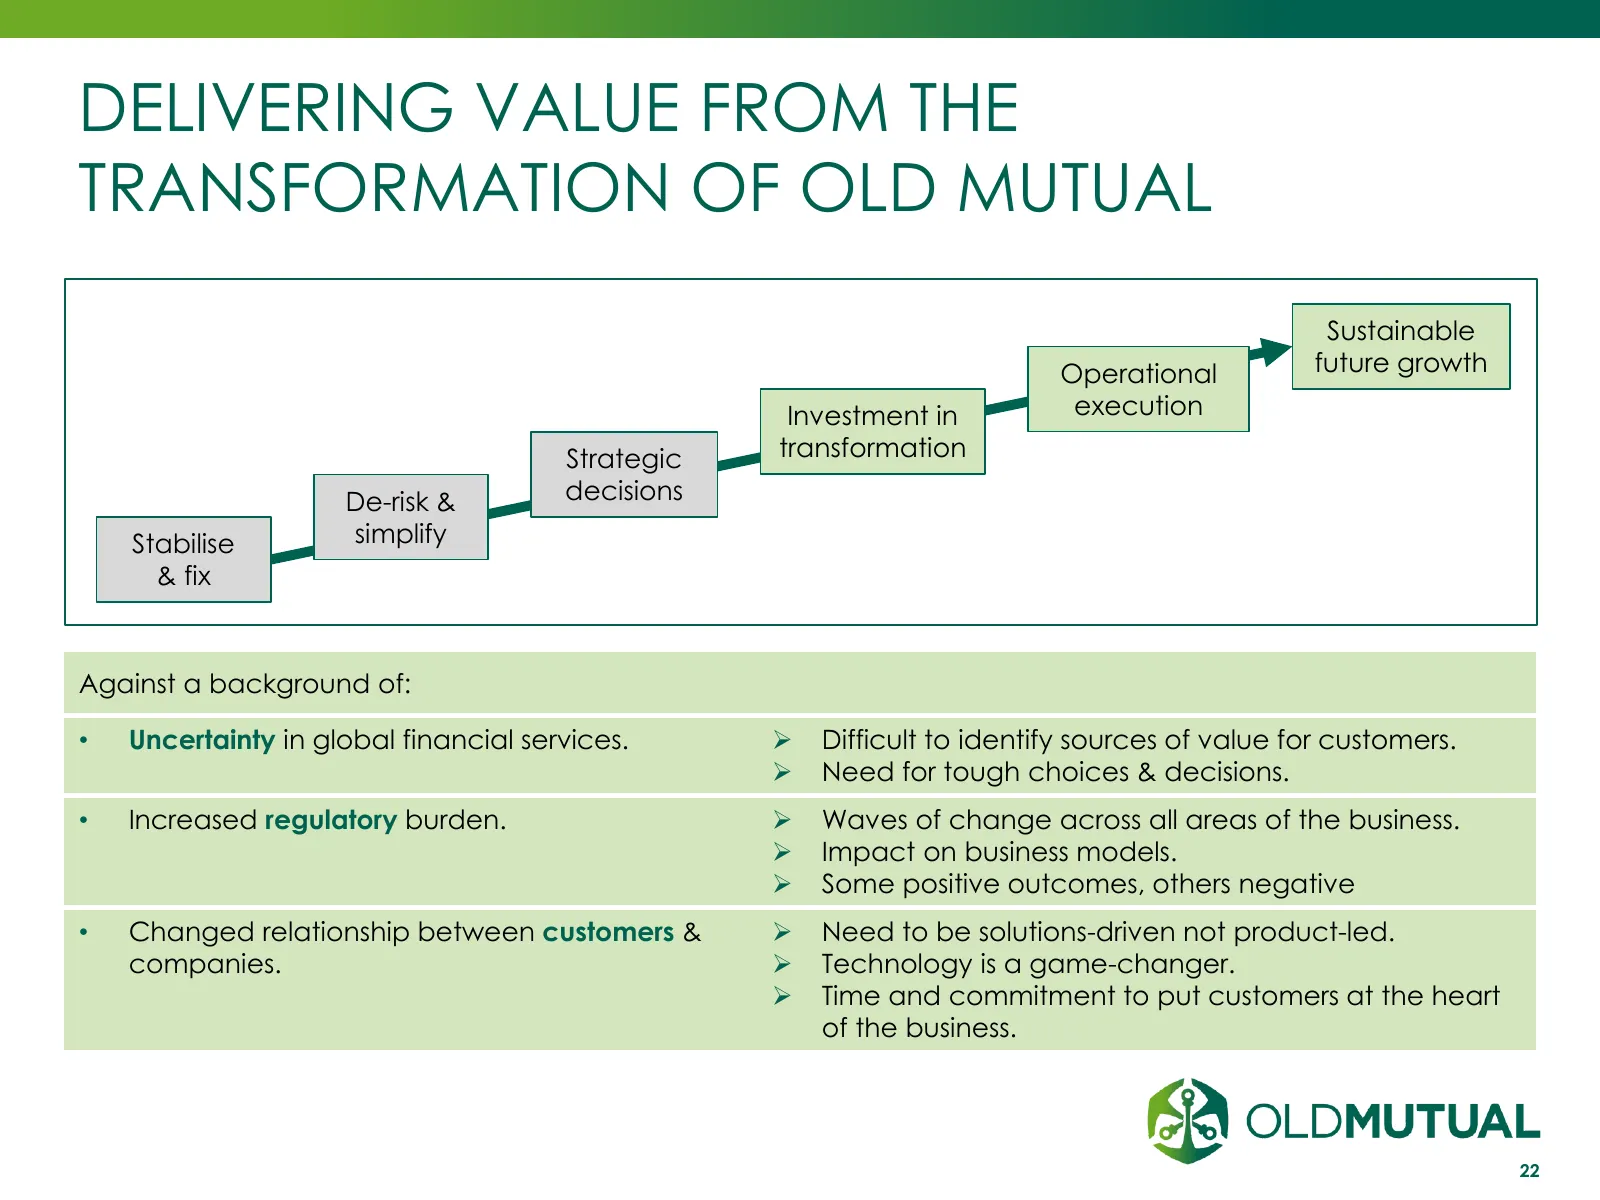
DELIVERING VALUE FROM THE TRANSFORMATION OF OLD MUTUAL Sustainable Operational future growth Investment in execution Strategic transformation De-risk & decisions Stabilise simplify & fix Against a background of: • Uncertainty in global financial services. Difficult to identify sources of value for
Slide 23: Old Mutual: well positioned for the future
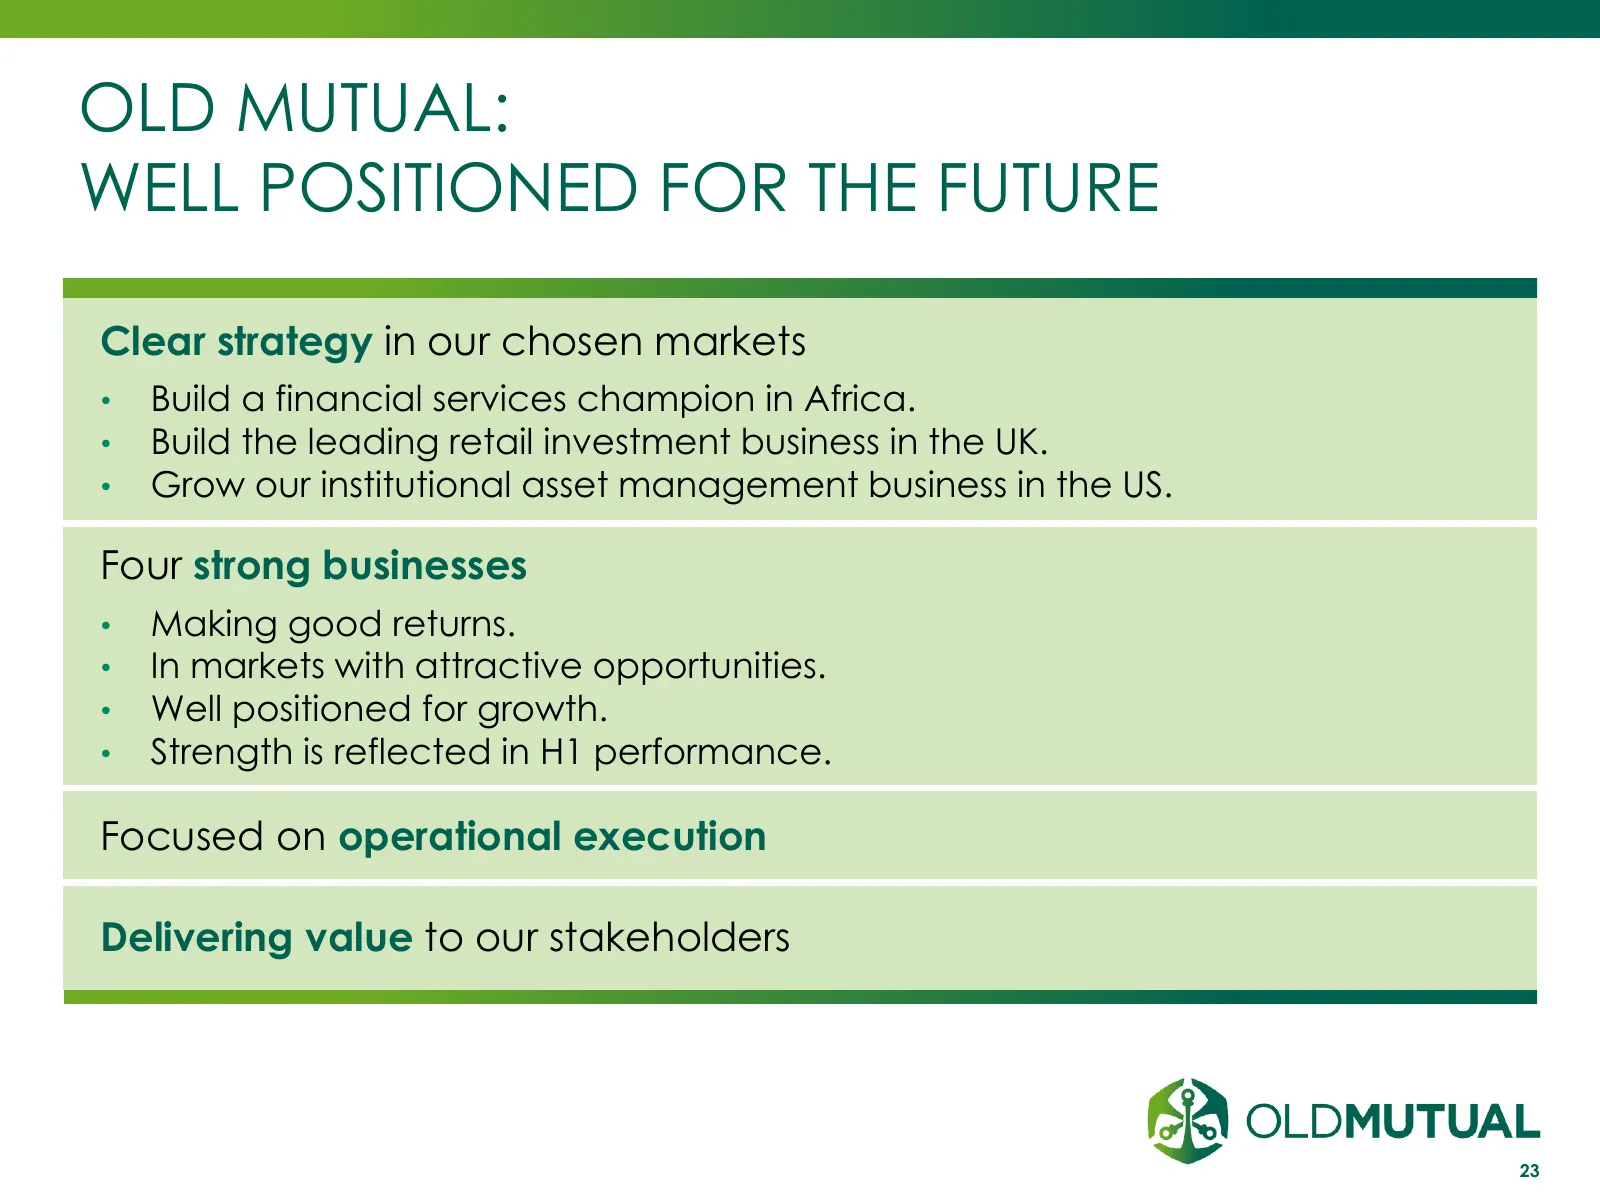
OLD MUTUAL: WELL POSITIONED FOR THE FUTURE Clear strategy in our chosen markets • Build a financial services champion in Africa. • Build the leading retail investment business in the UK. • Grow our institutional asset management business in the US. Four strong businesses • Making good returns. • In
Slide 24: Q&A
Q&A 6 August 2015 INVESTMENT | SAVINGS | INSURANCE | BANKING
Slide 25: Interim Results 2015
INTERIM RESULTS 2015 6 August 2015 INVESTMENT | SAVINGS | INSURANCE | BANKING
Source: Internet Archive copy of oldmutual.com
More decks from Old Mutual Ltd.
 FY2025 Earnings Presentation46 slides · Oct 12, 2026
 Q2 2026 Earnings Presentation48 slides · Sep 8, 2026
 H1 2025 Earnings Presentation45 slides · Sep 10, 2025
 FY2024 Earnings Presentation40 slides · Mar 18, 2025
 FY2023 Earnings Presentation39 slides · Mar 27, 2024
 H1 2024 Earnings Presentation33 slides · 2024