Quadient SA · EURONEXT:QDT
Quadient SA — FY2021 Earnings Presentation
49 slides from Quadient SA's earnings presentation, Mar 28, 2022
Slide 1: Full-Year 2021 Results
Full-Year 2021 Results 28 March 2022
Slide 2: Disclaimer
Disclaimer FORWARD-LOOKING STATEMENT This presentation contains forward-looking statements (made pursuant to (i) the safe harbour provisions of the Private Securities Litigation Reform Act of 1995 and (ii) the principles of the French Autorité des Marchés Financiers' guide to periodical disclosures
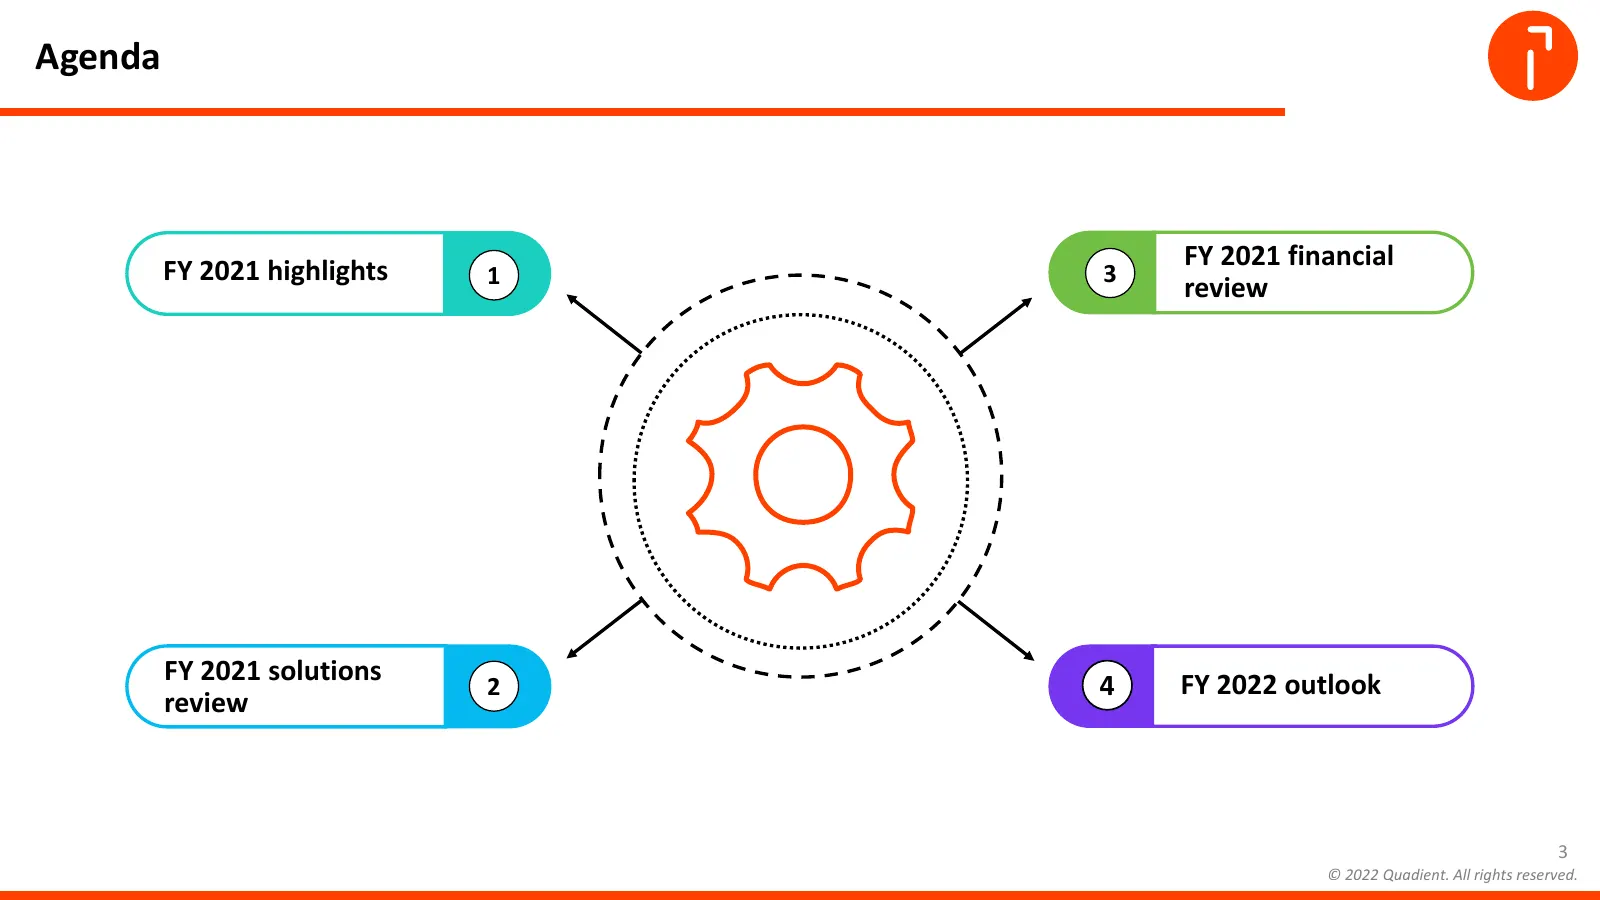
Slide 3: Agenda
Agenda FY 2021 financial FY 2021 highlights 1 3 review FY 2021 solutions FY 2022 outlook 2 4 review 3 © 2022 Quadient. All rights reserved.

Slide 4: FY 2021 Highlights
4 FY 2021 HIGHLIGHTS Geoffrey GODET CEO © Quadient 4 © 2022 Quadient. All rights reserved.
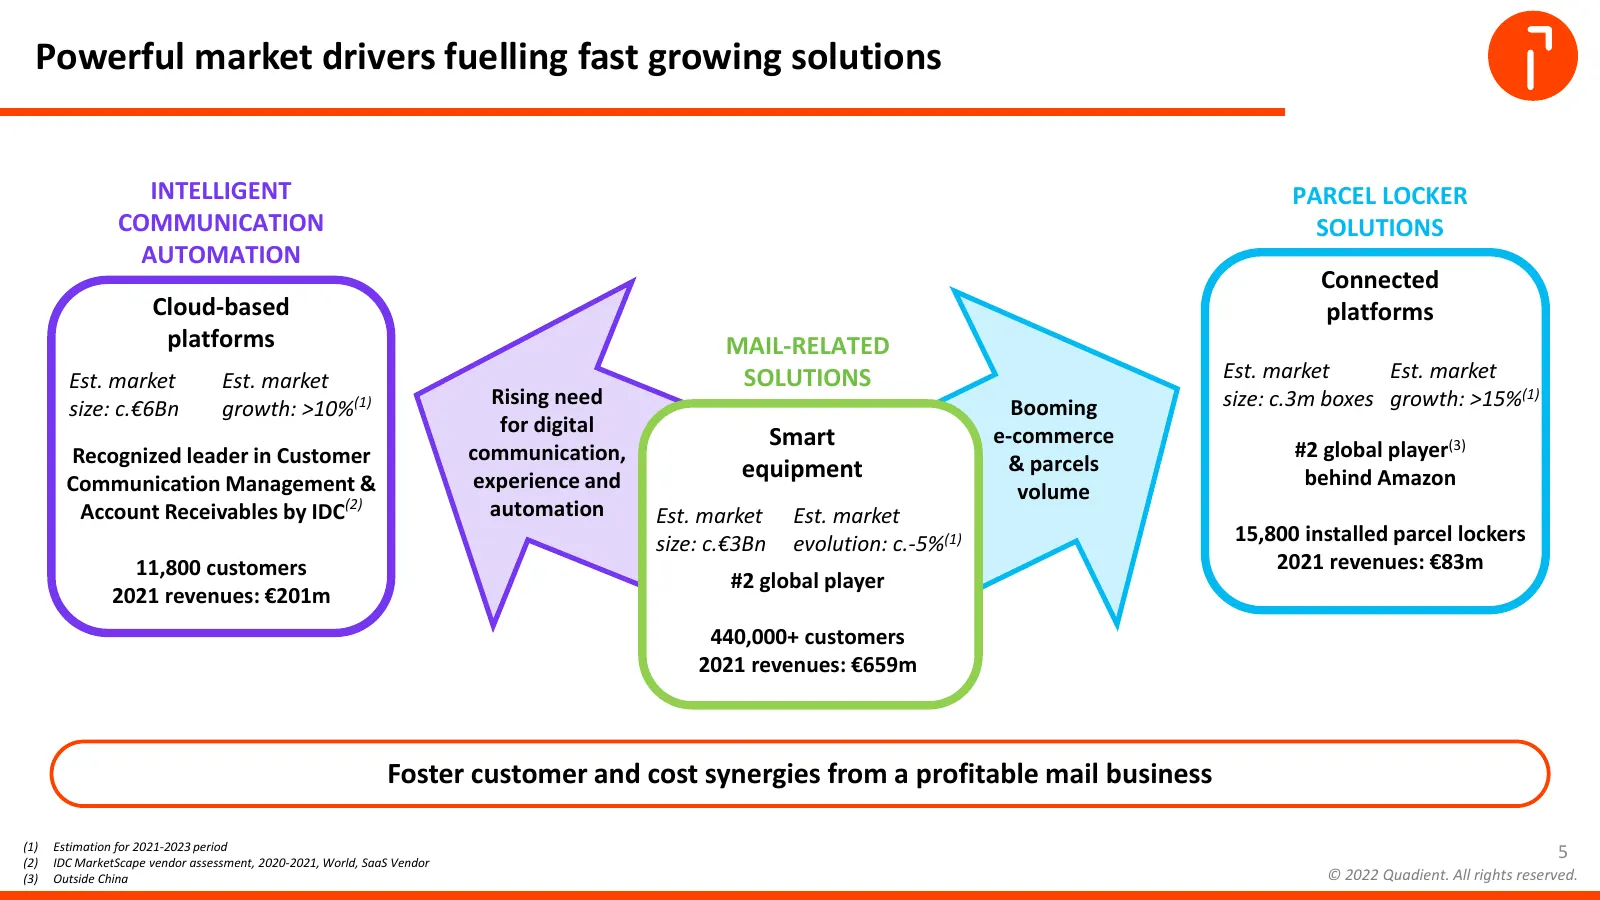
Slide 5: Powerful market drivers fuelling fast growing solutions
Powerful market drivers fuelling fast growing solutions INTELLIGENT PARCEL LOCKER COMMUNICATION SOLUTIONS AUTOMATION Connected Cloud-based platforms platforms MAIL-RELATED Est. market Est. market SOLUTIONS Est. market Est. market Rising need Booming size: c.3m boxes growth: >15%(1) size: c.€6Bn grow
Slide 6: Snapshot of Quadient in FY 2021
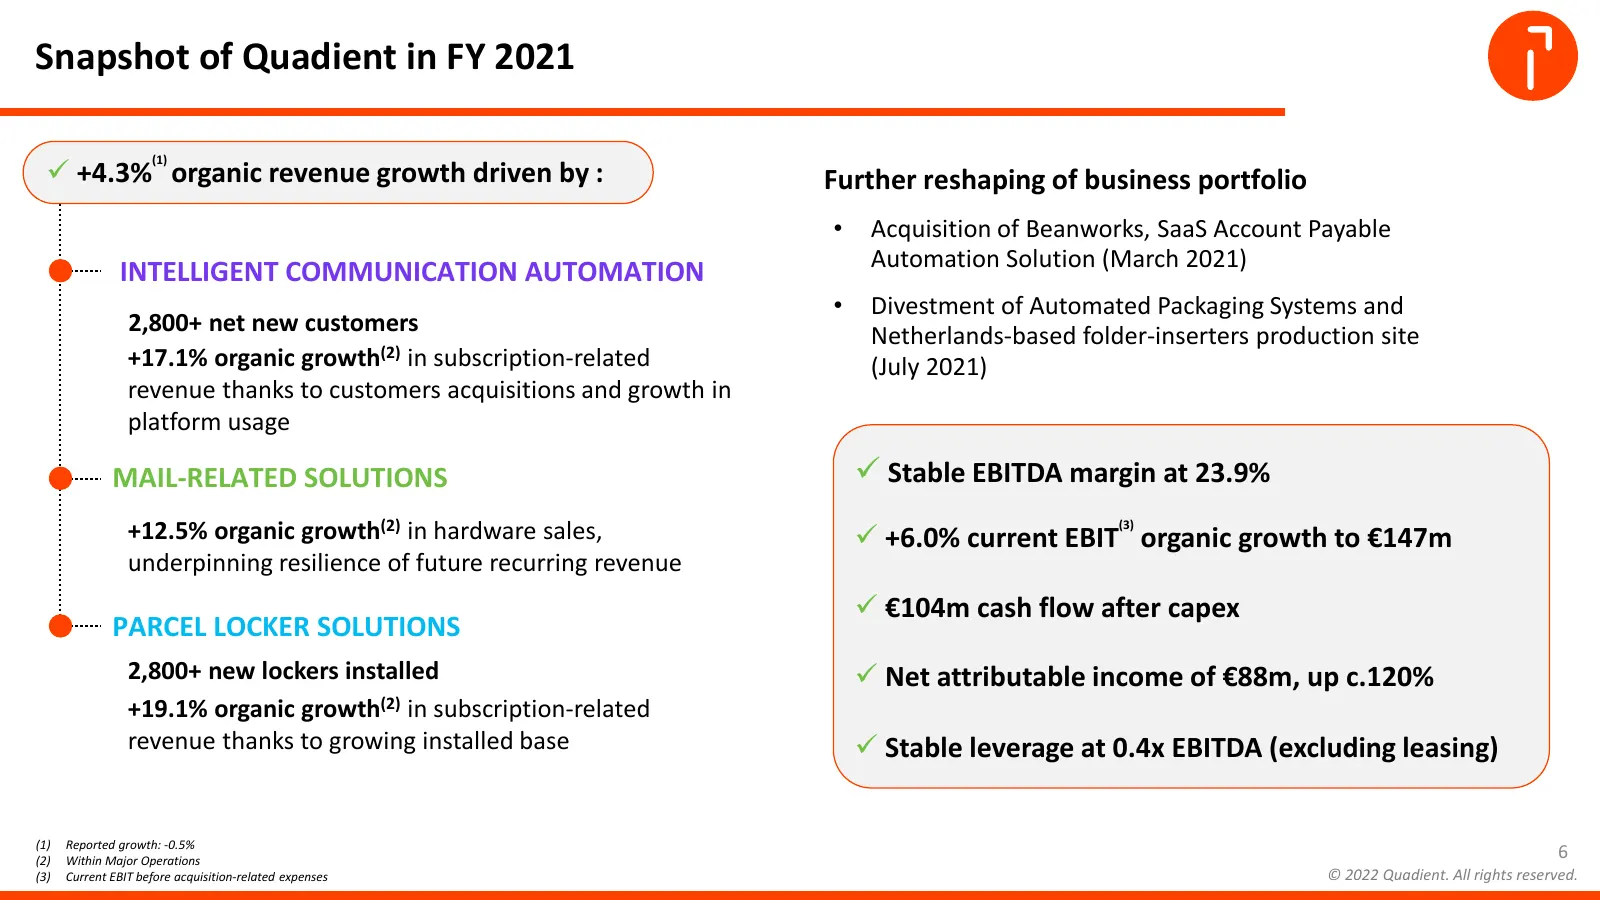
Snapshot of Quadient in FY 2021 (1) +4.3% organic revenue growth driven by : Further reshaping of business portfolio • Acquisition of Beanworks, SaaS Account Payable Automation Solution (March 2021) INTELLIGENT COMMUNICATION AUTOMATION • Divestment of Automated Packaging Systems and 2,800+ net new
Slide 7: Proposed dividend increase of 10%, at €0.55 per share
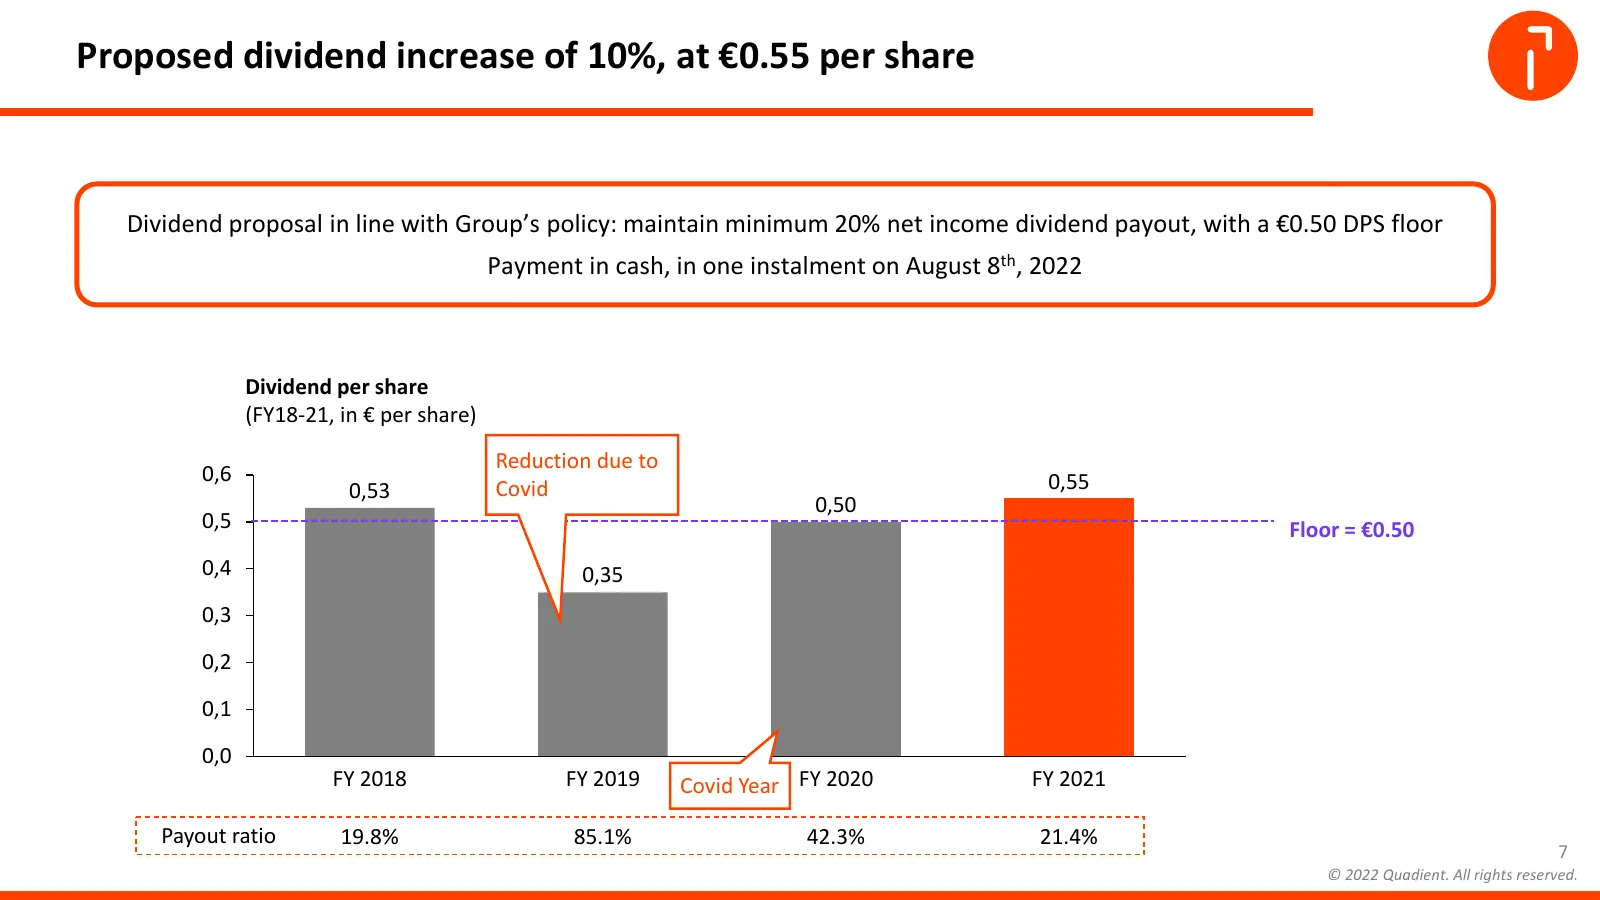
Proposed dividend increase of 10%, at €0.55 per share Dividend proposal in line with Group’s policy: maintain minimum 20% net income dividend payout, with a €0.50 DPS floor Payment in cash, in one instalment on August 8th, 2022 Dividend per share (FY18-21, in € per share) Reduction due to 0,6 0,55 0
Slide 8: A comprehensive and well recognized CSR program
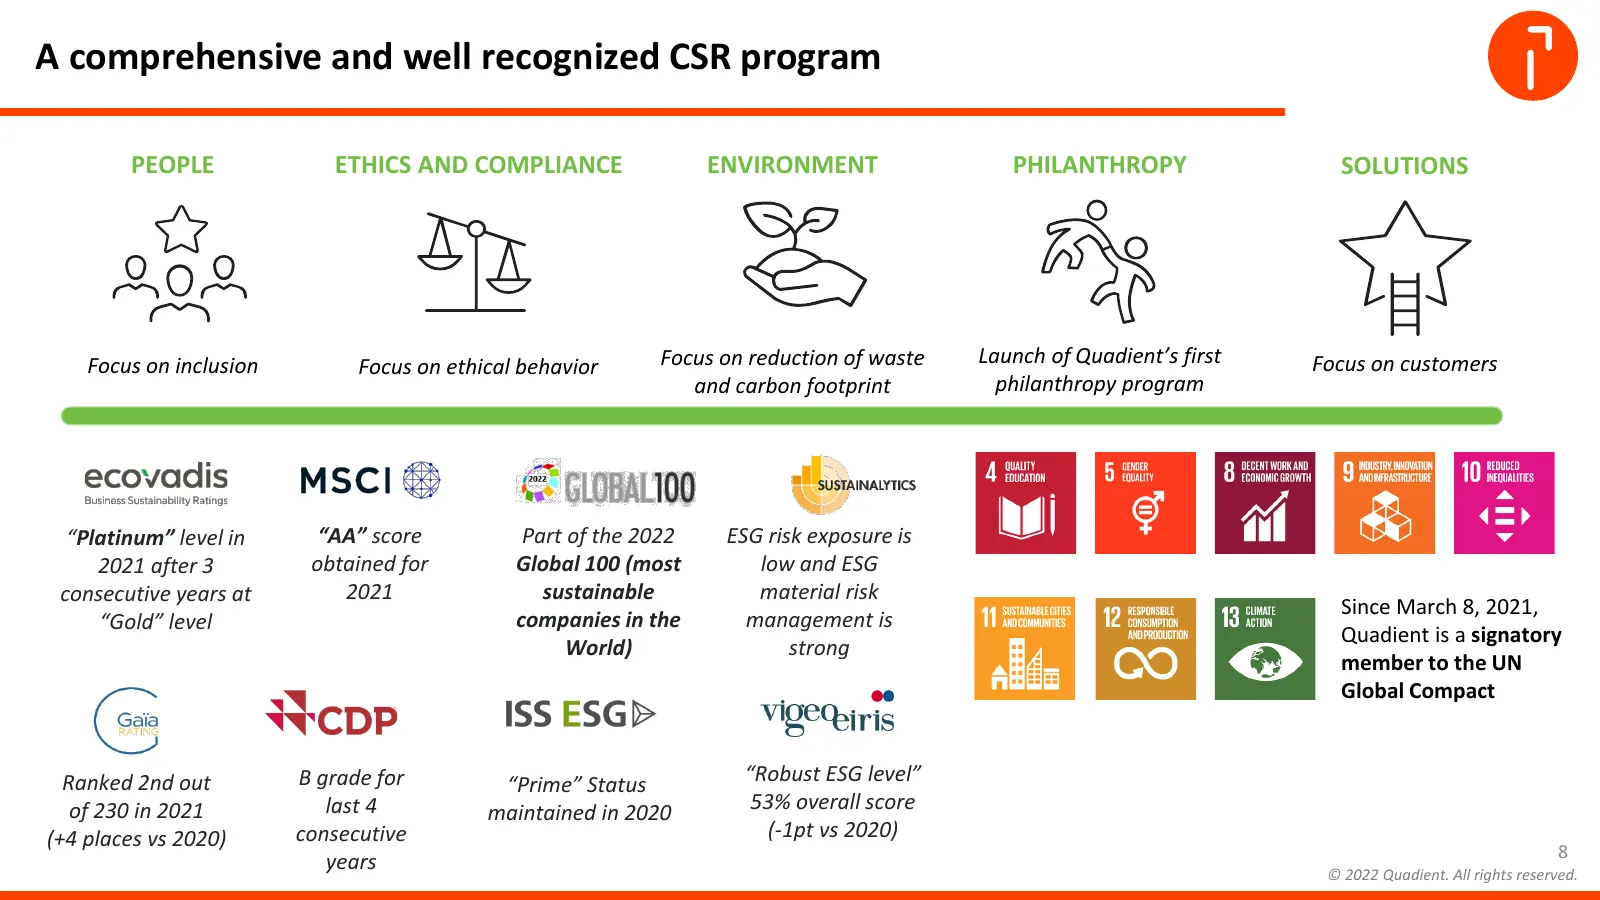
A comprehensive and well recognized CSR program PEOPLE ETHICS AND COMPLIANCE ENVIRONMENT PHILANTHROPY SOLUTIONS Focus on inclusion Focus on ethical behavior Focus on reduction of waste Launch of Quadient’s first Focus on customers and carbon footprint philanthropy program “Platinum” level in “AA” sc
Slide 9: FY 2021 Solutions Review
9 FY 2021 SOLUTIONS REVIEW Geoffrey GODET CEO Laurent DU PASSAGE CFO 9 © 2022 Quadient. All rights reserved.
Slide 10: Intelligent Communication Automation: business highlights
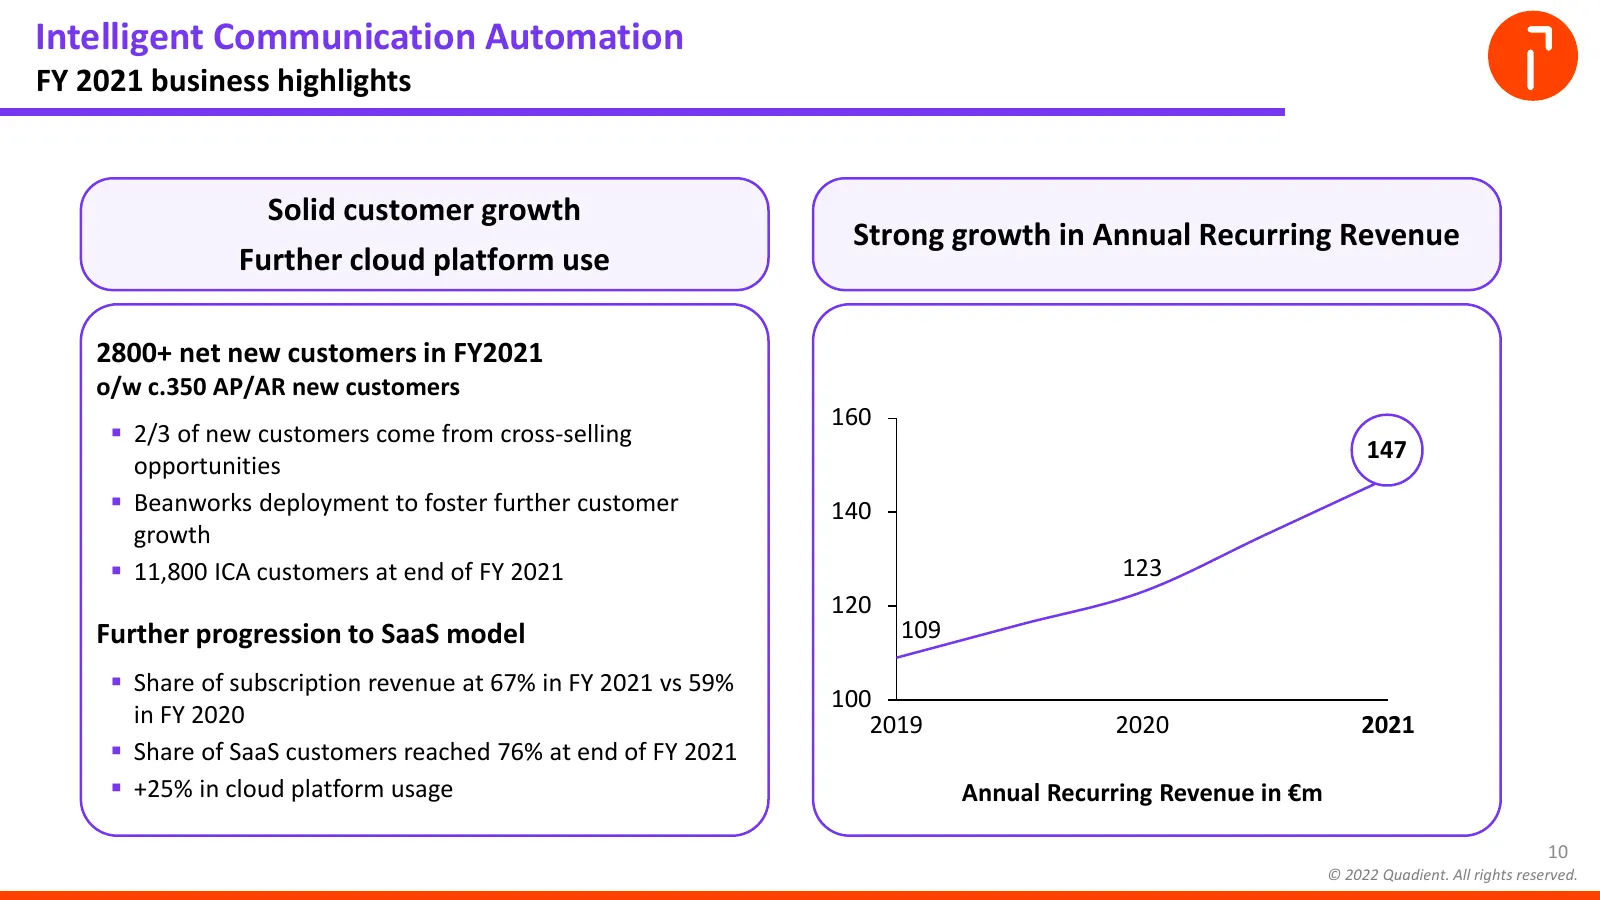
Intelligent Communication Automation FY 2021 business highlights Solid customer growth Strong growth in Annual Recurring Revenue Further cloud platform use 2800+ net new customers in FY2021 o/w c.350 AP/AR new customers 160 2/3 of new customers come from cross-selling 147 opportunities Beanworks
Slide 11: Intelligent Communication Automation: financial review
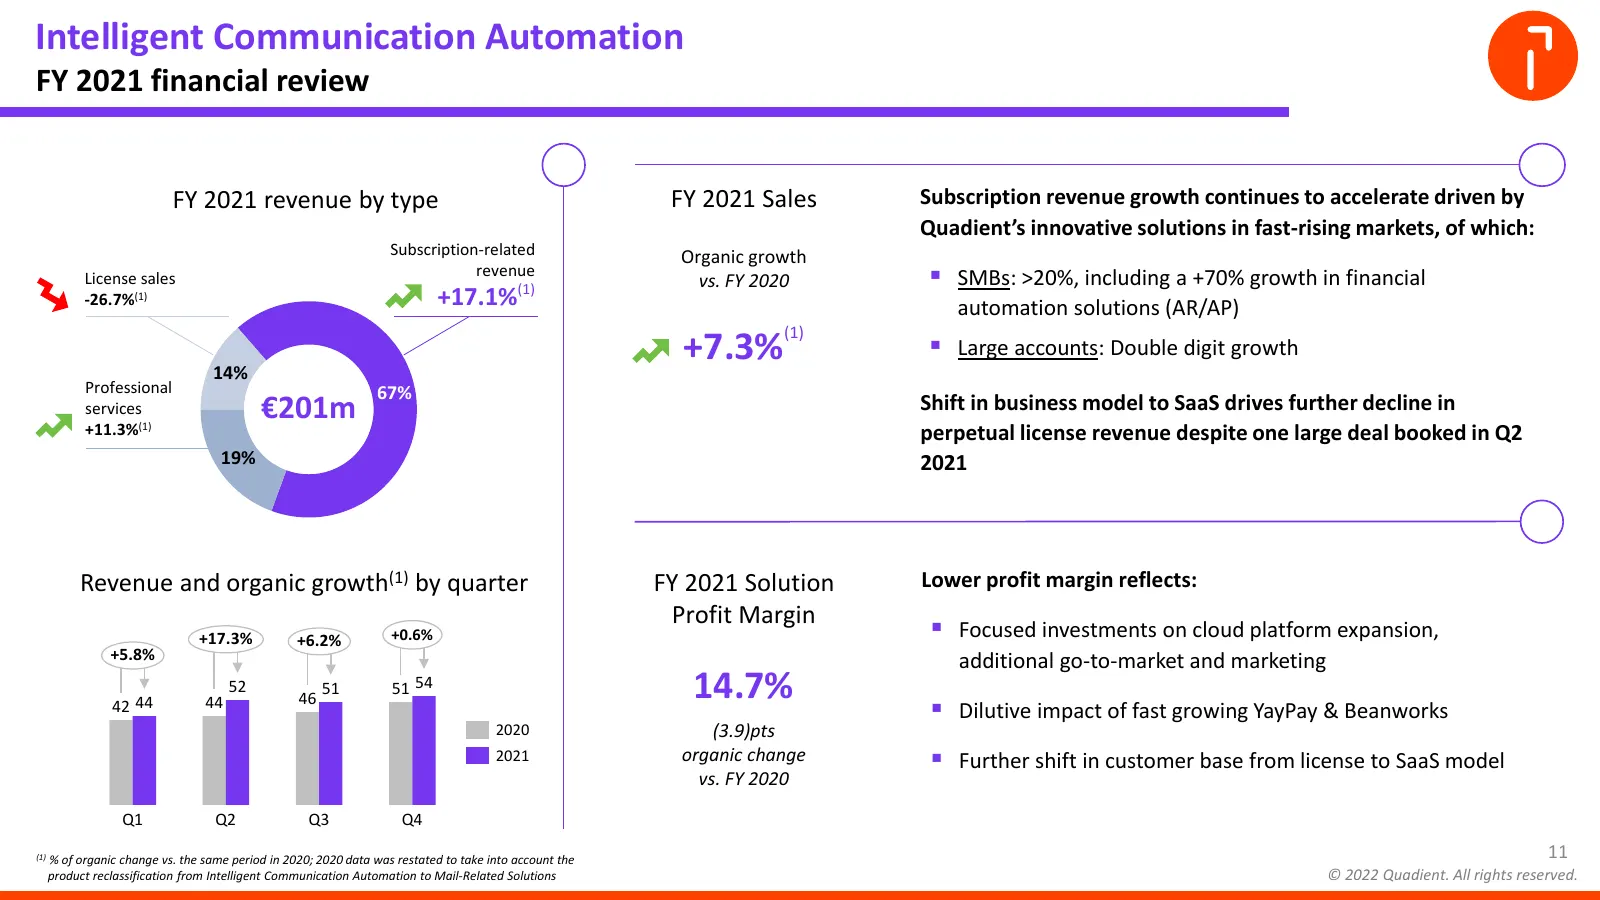
Intelligent Communication Automation FY 2021 financial review FY 2021 revenue by type FY 2021 Sales Subscription revenue growth continues to accelerate driven by Quadient’s innovative solutions in fast-rising markets, of which: Subscription-related Organic growth revenue License sales vs. FY 2020
Slide 12: Mail-Related Solutions: business highlights
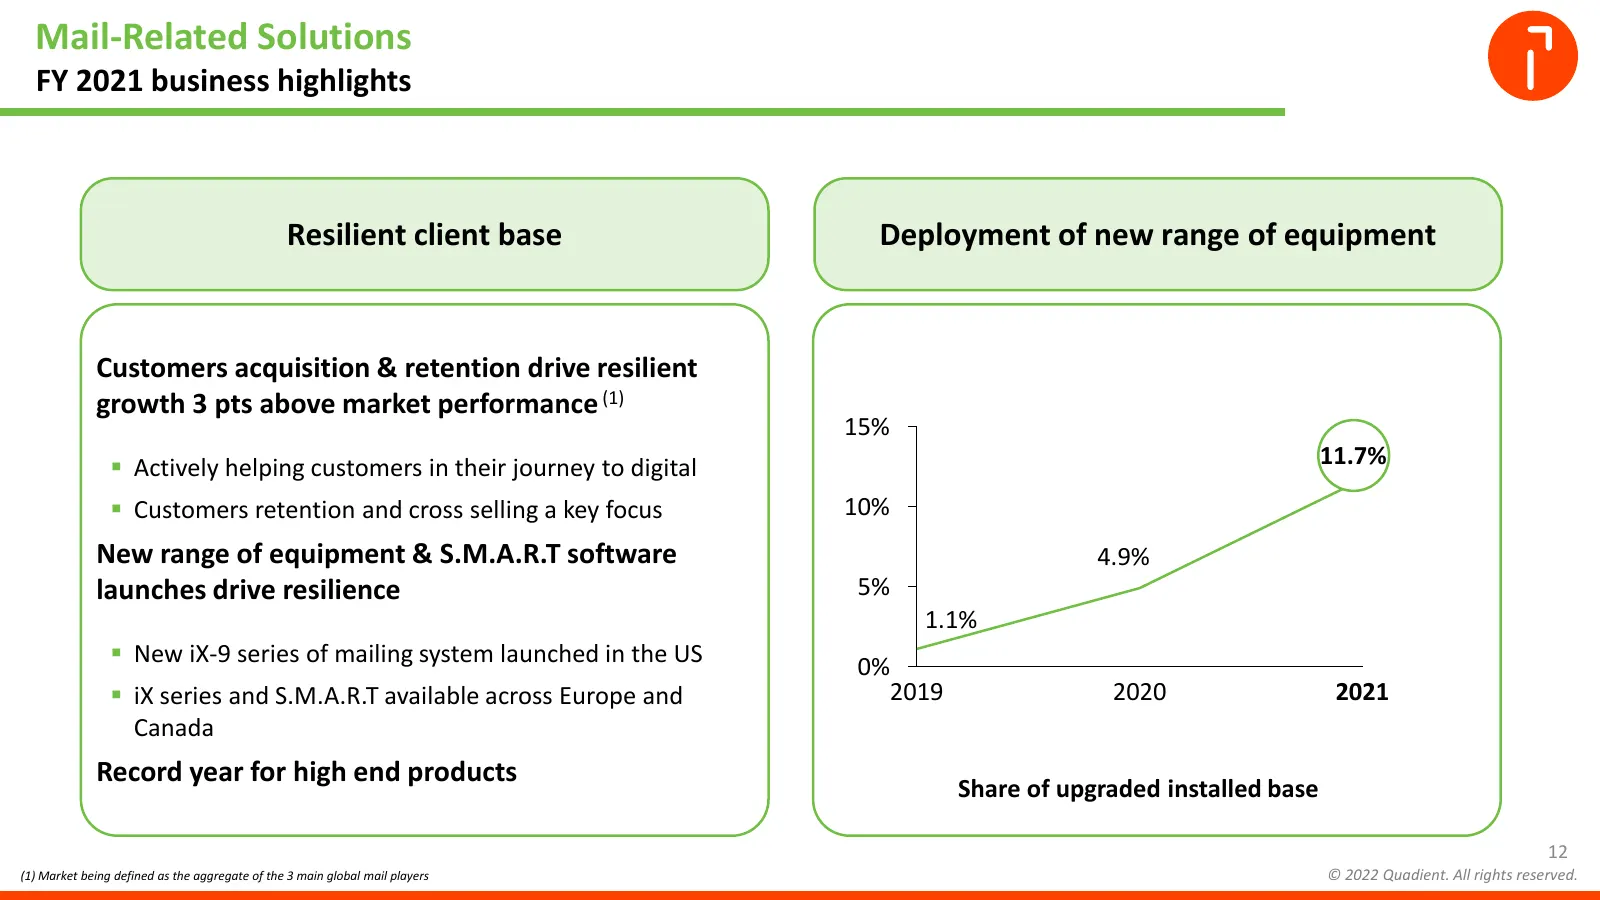
Mail-Related Solutions FY 2021 business highlights Resilient client base Deployment of new range of equipment Customers acquisition & retention drive resilient growth 3 pts above market performance (1) 15% Actively helping customers in their journey to digital 11.7% Customers retention and cross
Slide 13: Mail-Related Solutions: financial review
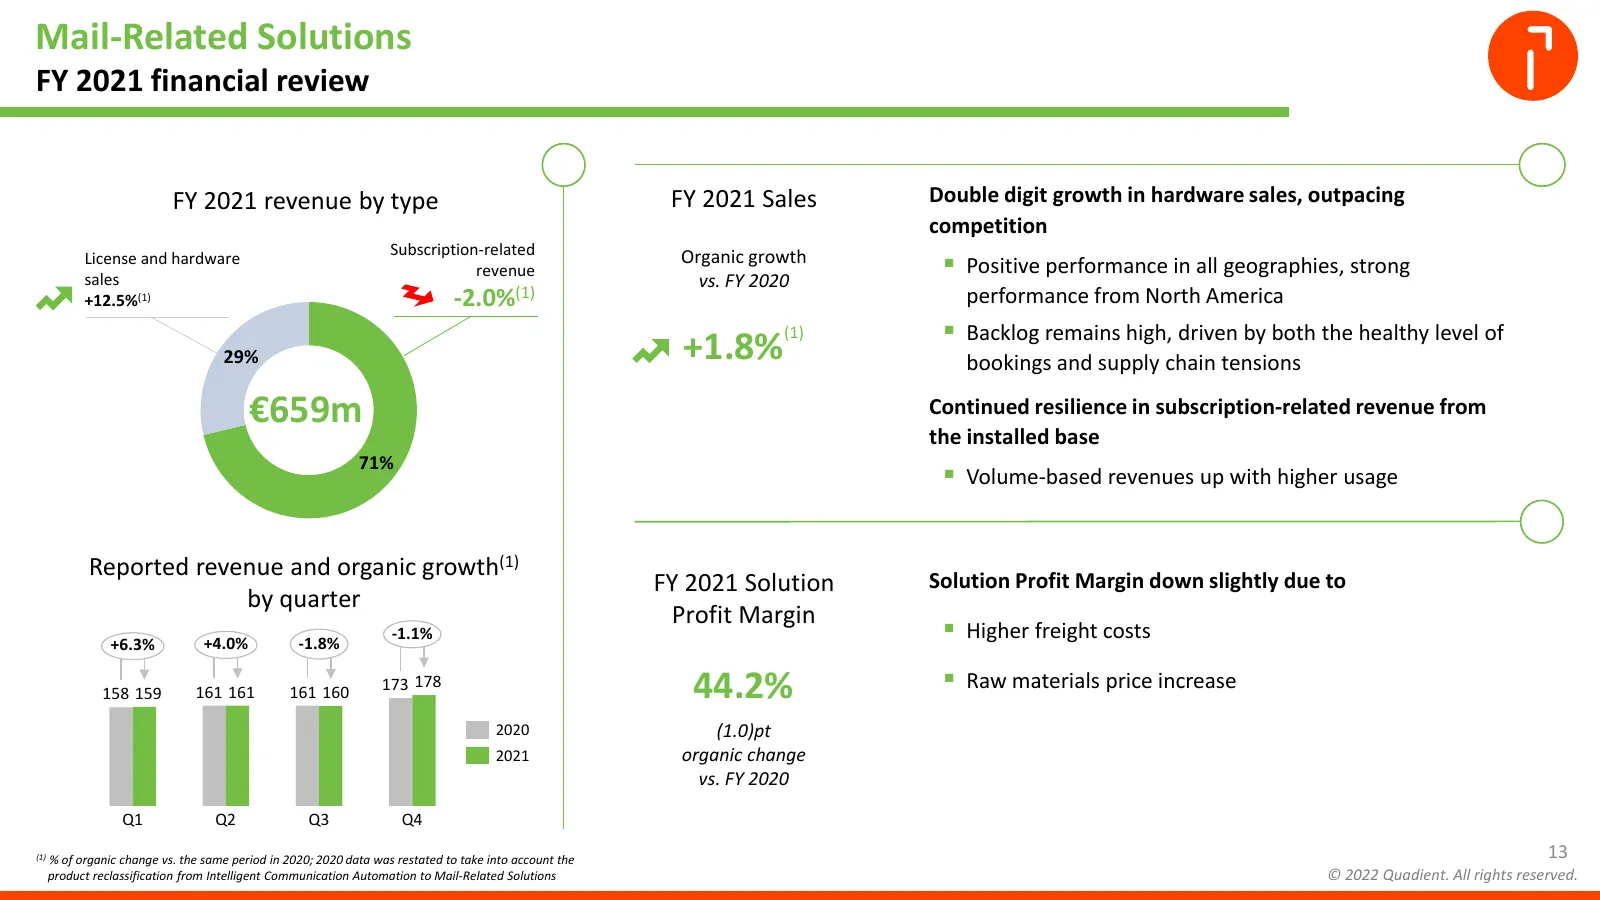
Mail-Related Solutions FY 2021 financial review FY 2021 revenue by type FY 2021 Sales Double digit growth in hardware sales, outpacing competition Subscription-related Organic growth License and hardware Positive performance in all geographies, strong revenue sales vs. FY 2020 +12.5%(1) -2.0%(1) p
Slide 14: Parcel Locker Solutions: business highlights
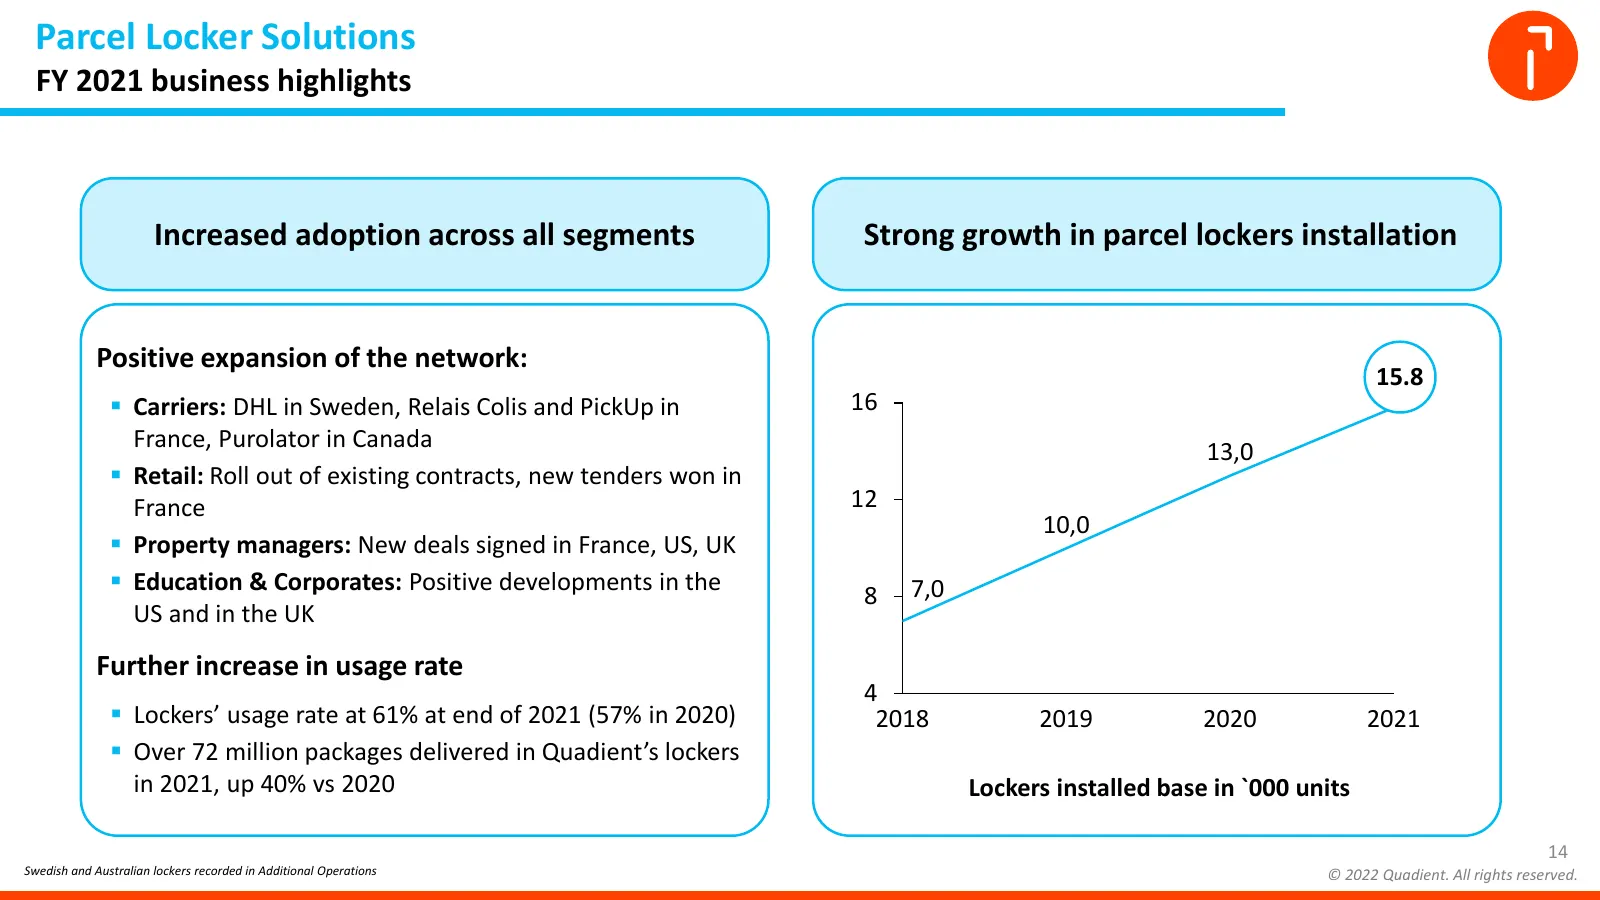
Parcel Locker Solutions FY 2021 business highlights Increased adoption across all segments Strong growth in parcel lockers installation Positive expansion of the network: 15.8 15,8 Carriers: DHL in Sweden, Relais Colis and PickUp in 16 France, Purolator in Canada 13,0 Retail: Roll out of existin
Slide 15: Parcel Locker Solutions: financial review
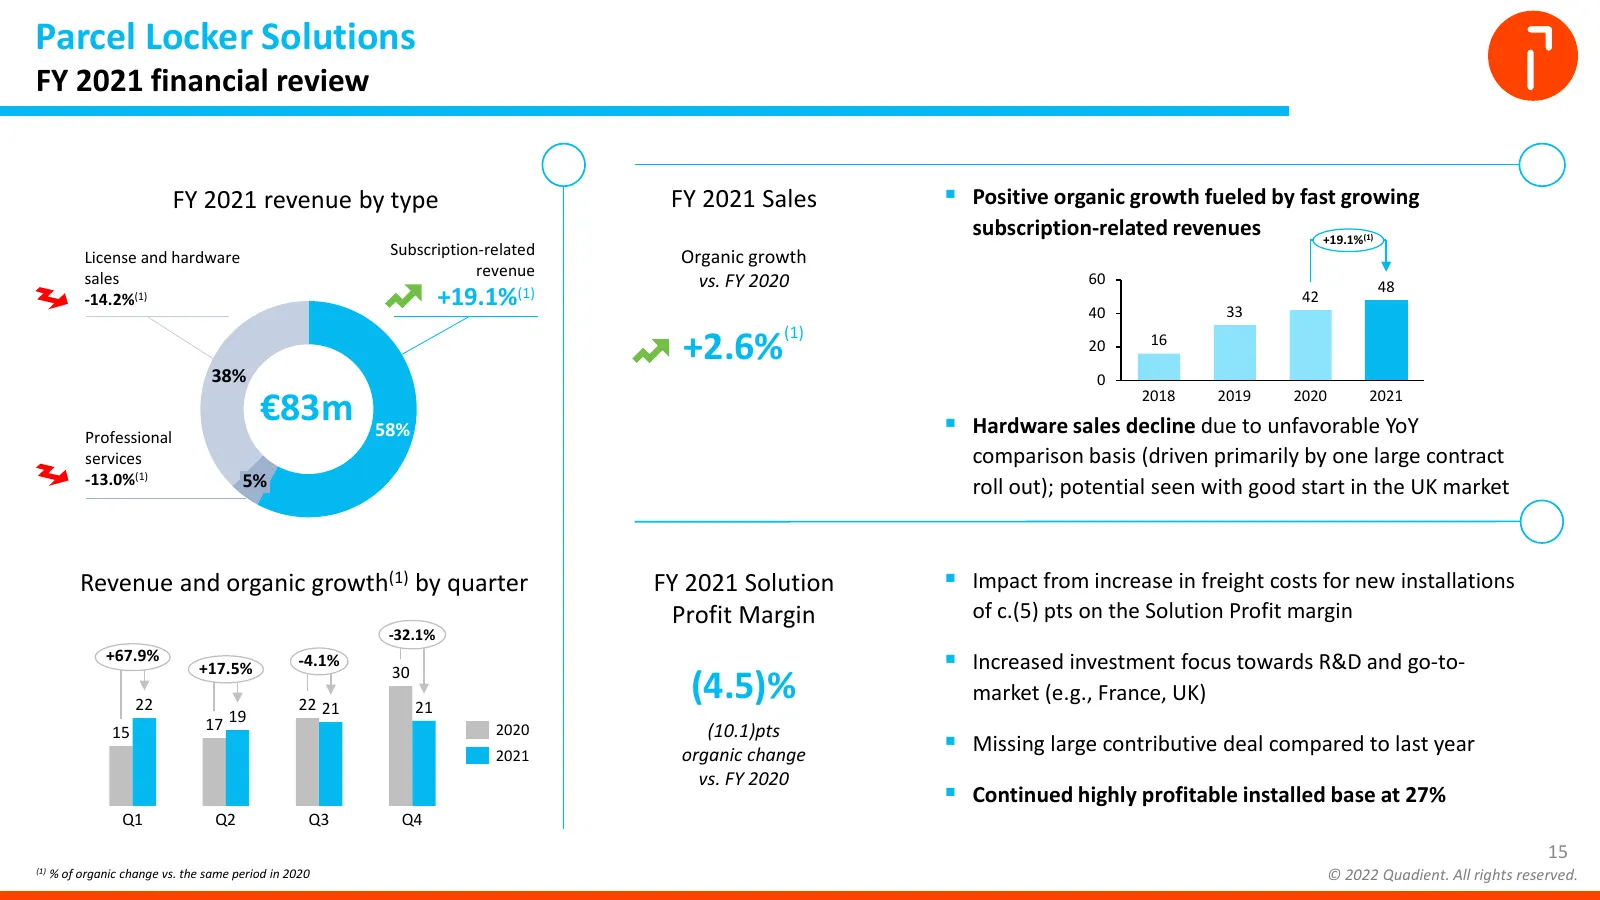
Parcel Locker Solutions FY 2021 financial review FY 2021 revenue by type FY 2021 Sales Positive organic growth fueled by fast growing subscription-related revenues +19.1%(1) License and hardware Subscription-related Organic growth sales revenue vs. FY 2020 60 48 -14.2%(1) +19.1%(1) 40 33 42 +2.6%
Slide 16: FY 2021 Financial Review
16 FY 2021 FINANCIAL REVIEW Laurent DU PASSAGE CFO © Quadient 16 © 2022 Quadient. All rights reserved.
Slide 17: Exceeded initial guidance
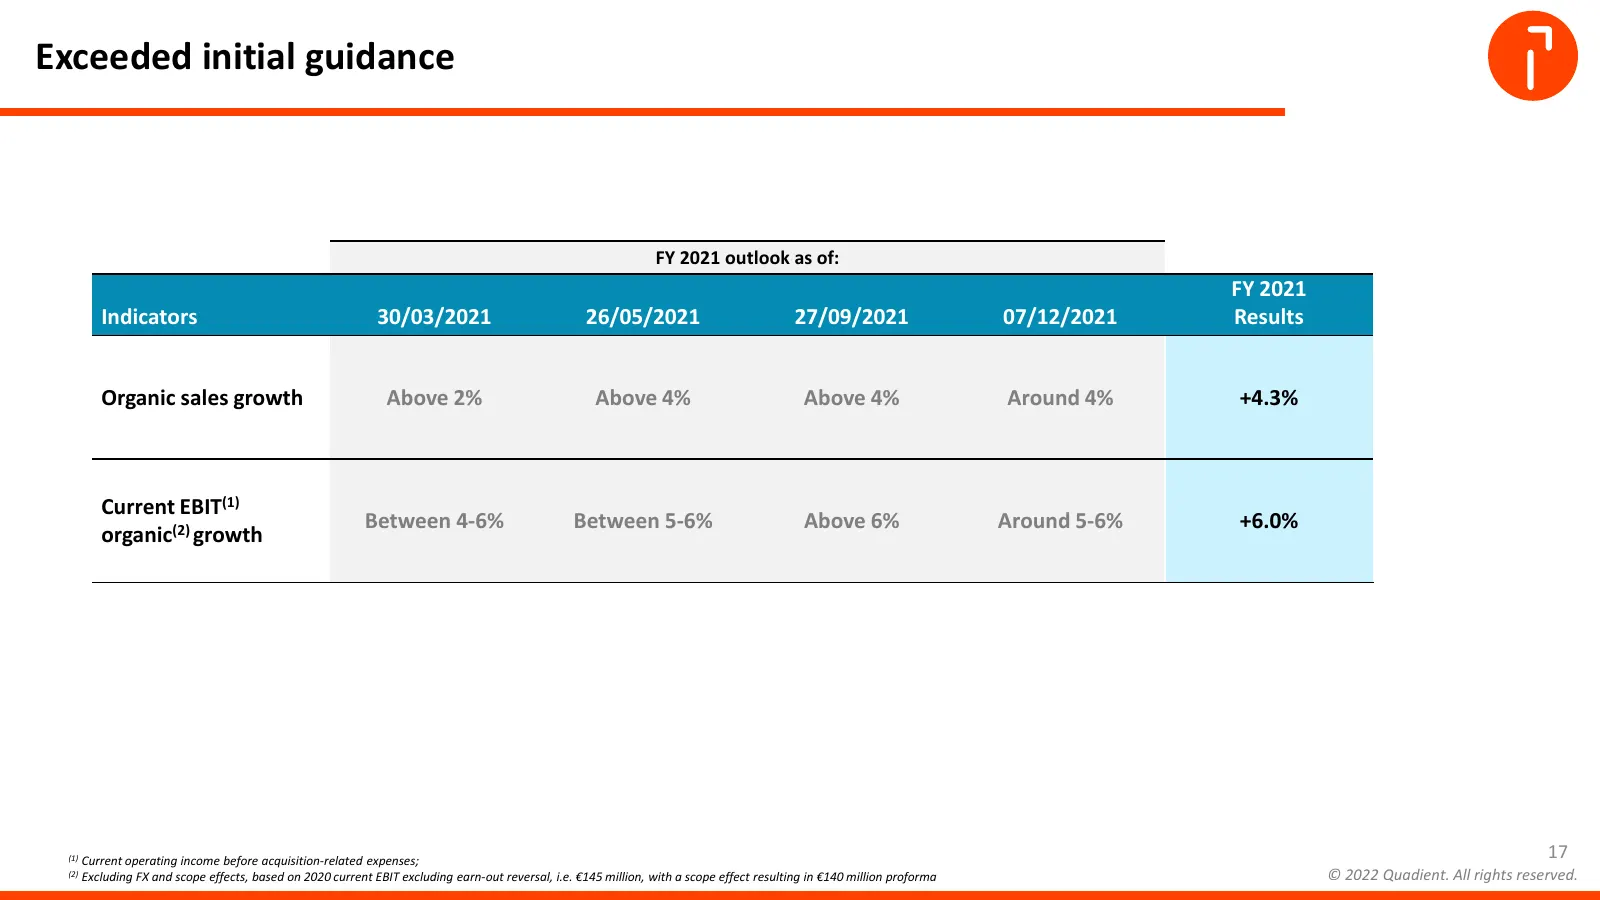
Exceeded initial guidance FY 2021 outlook as of: FY 2021 Indicators 30/03/2021 26/05/2021 27/09/2021 07/12/2021 Results Organic sales growth Above 2% Above 4% Above 4% Around 4% +4.3% Current EBIT(1) Between 4-6% Between 5-6% Above 6% Around 5-6% +6.0% organic(2) growth (1) Current operating income
Slide 18: Solid organic growth driven by all solutions
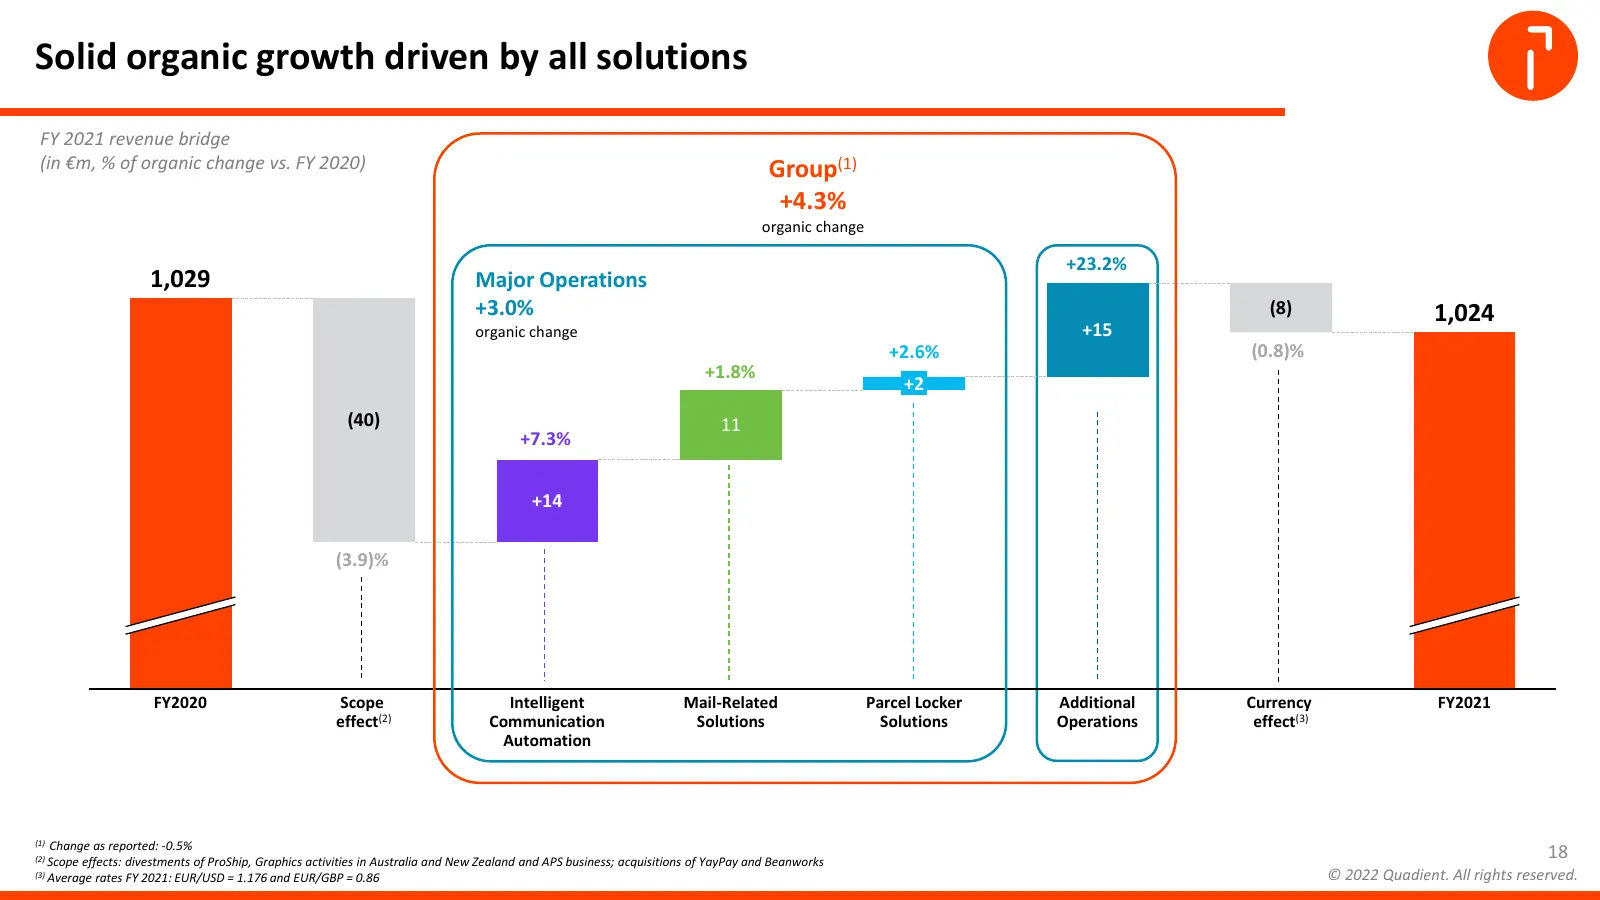
Solid organic growth driven by all solutions FY 2021 revenue bridge (in €m, % of organic change vs. FY 2020) Group(1) +4.3% organic change +23.2% 1,029 Major Operations +3.0% (8) 1,024 organic change +15 +2.6% (0.8)% +1.8% +2 (40) 11 +7.3% +14 (3.9)% FY2020 Scope Intelligent Mail-Related Parcel Lock
Slide 19: Solid current EBIT growth despite ongoing investments
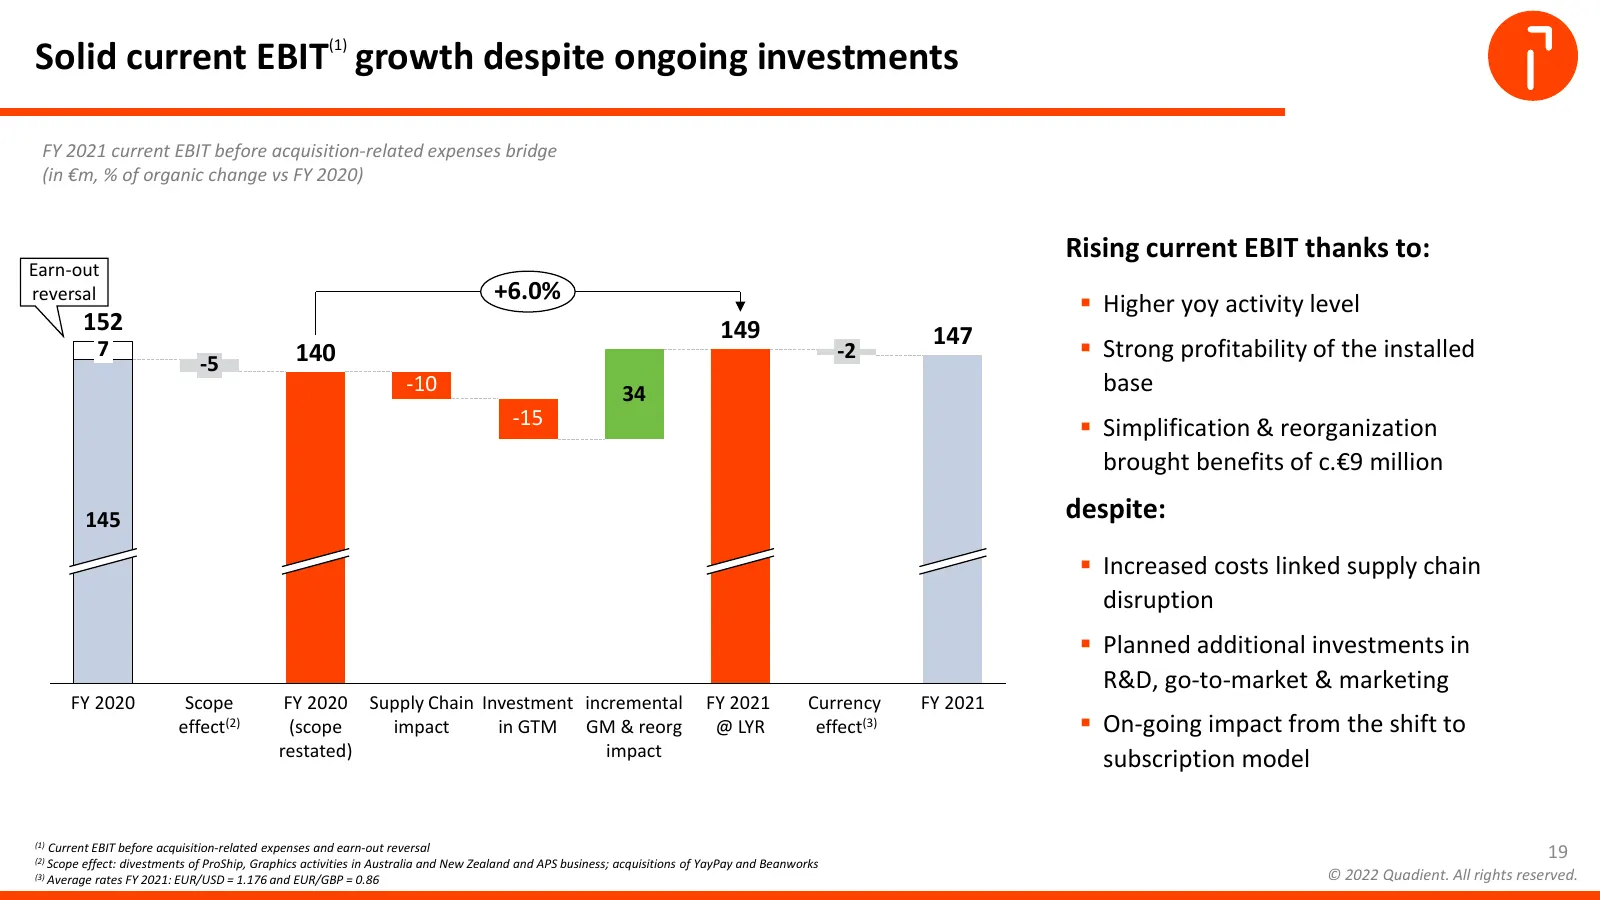
Solid current EBIT(1) growth despite ongoing investments FY 2021 current EBIT before acquisition-related expenses bridge (in €m, % of organic change vs FY 2020) Rising current EBIT thanks to: Earn-out reversal +6.0% Higher yoy activity level 152 149 7 147 Strong profitability of the installed -5
Slide 20: Major Operations
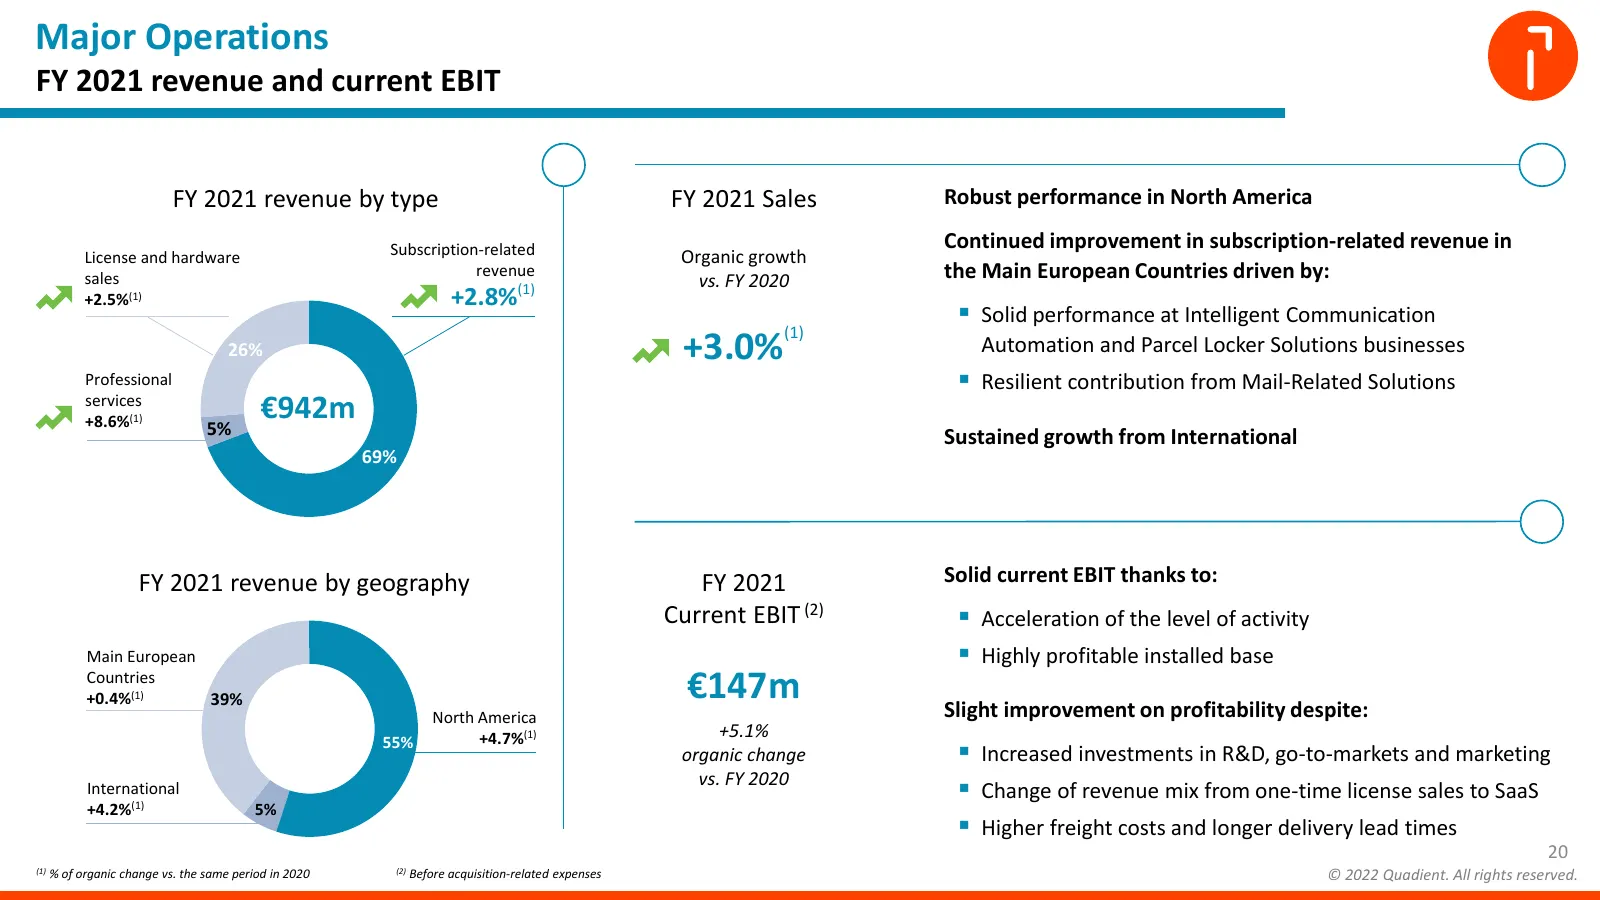
Major Operations FY 2021 revenue and current EBIT FY 2021 revenue by type FY 2021 Sales Robust performance in North America Subscription-related Continued improvement in subscription-related revenue in License and hardware Organic growth sales revenue vs. FY 2020 the Main European Countries driven b
Slide 21: FY 2021 results summary
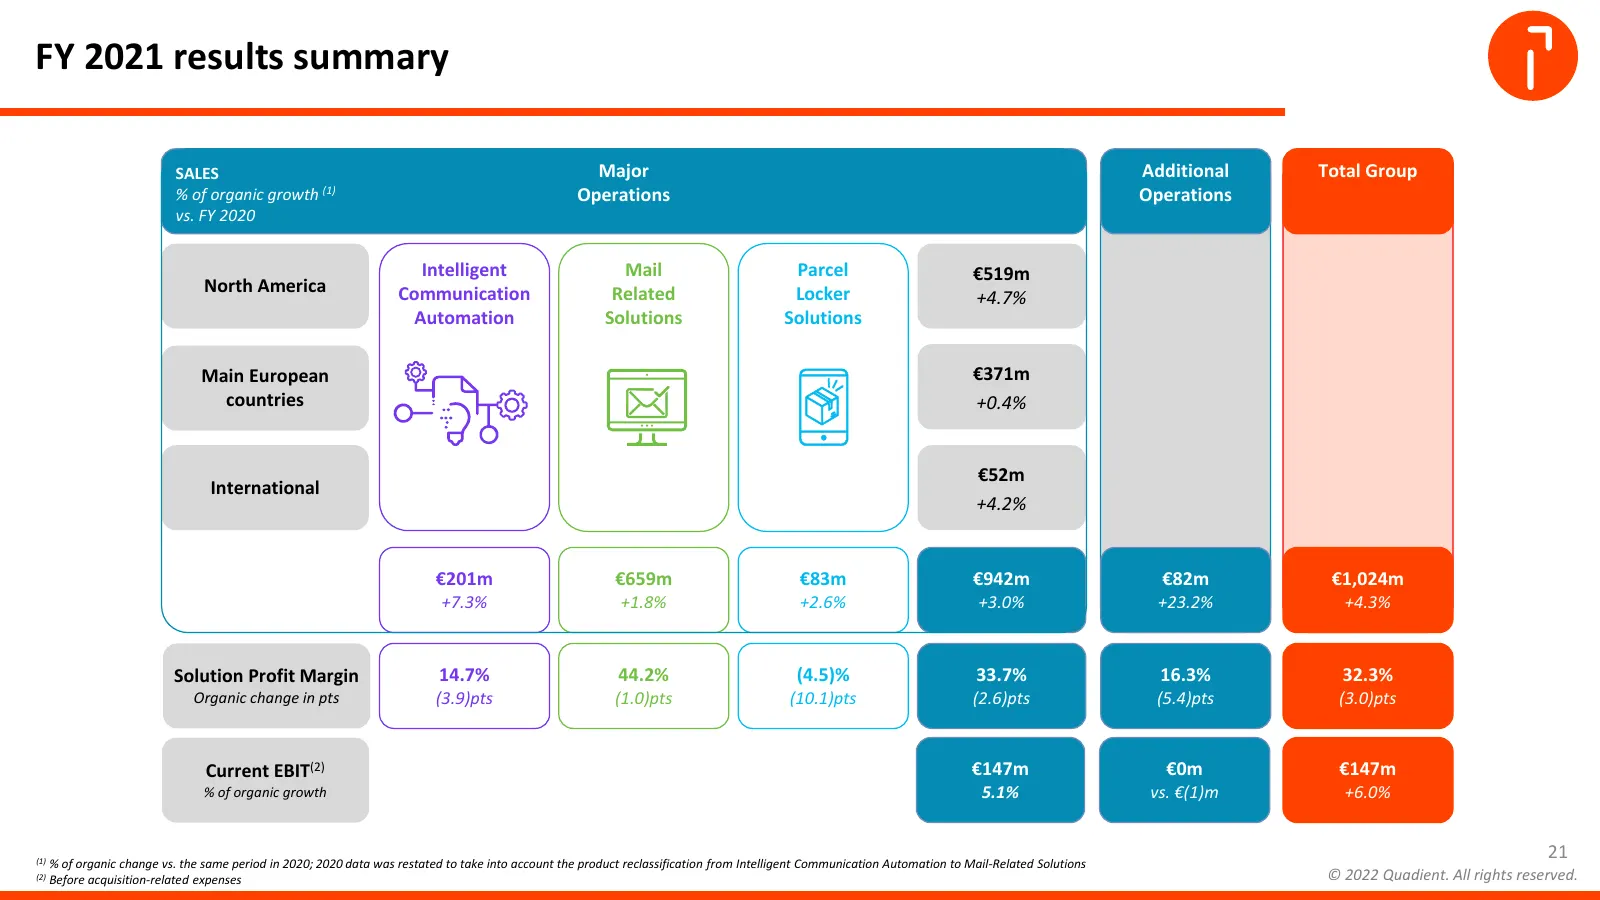
FY 2021 results summary SALES Major Additional Total Group % of organic growth (1) Operations Operations vs. FY 2020 Intelligent Mail Parcel €519m North America Communication Related Locker +4.7% Automation Solutions Solutions Main European €371m countries +0.4% €52m International +4.2% €201m €659m
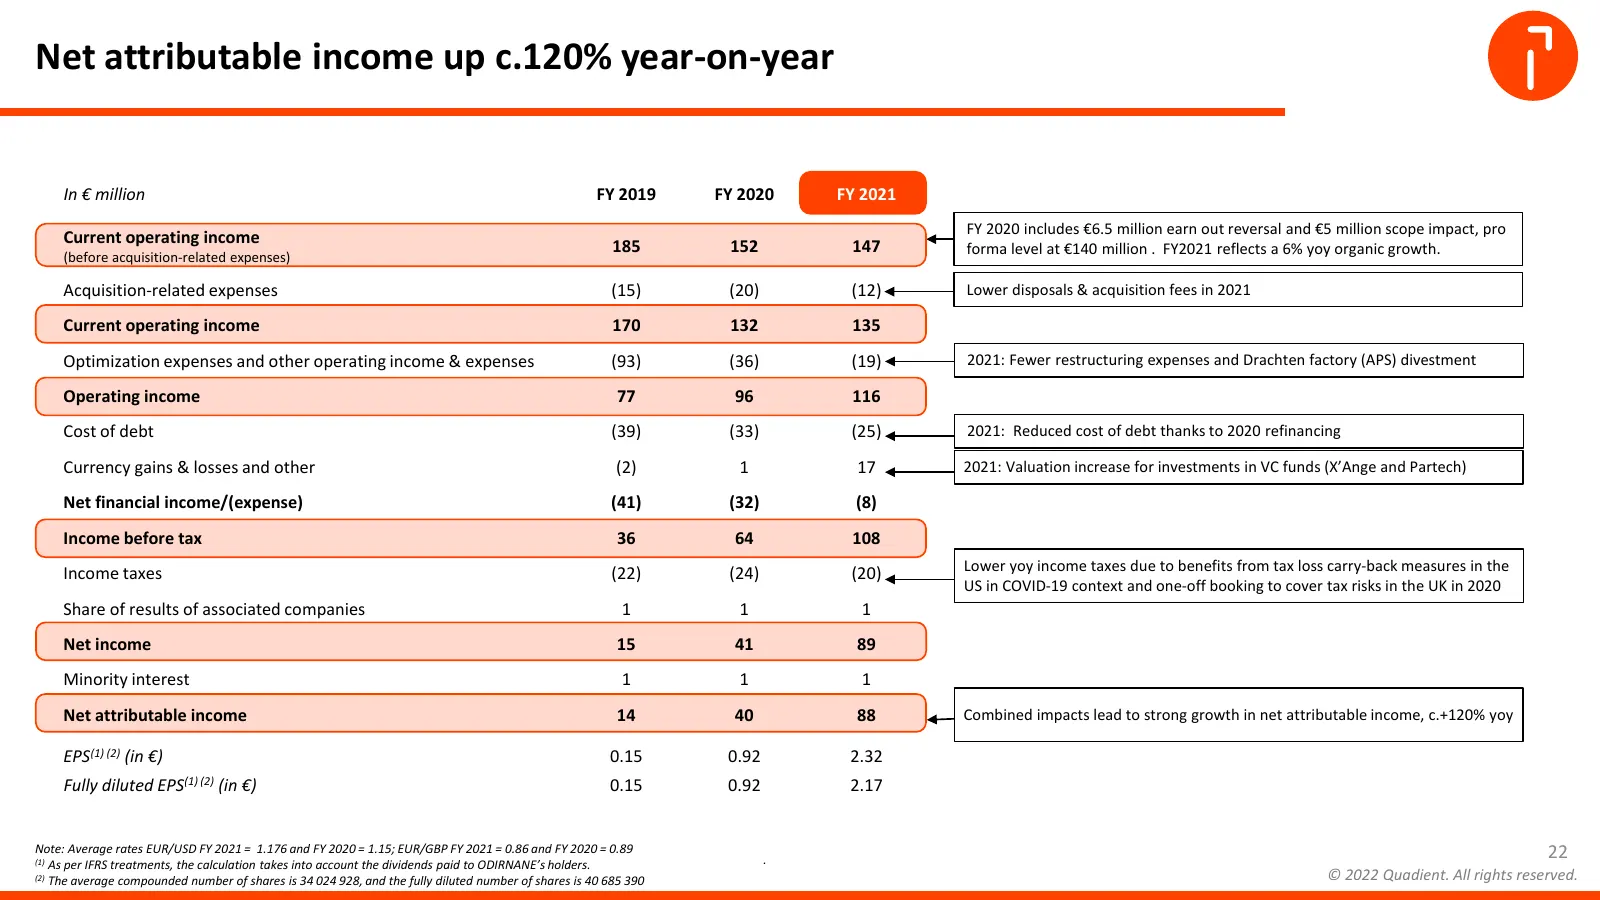
Slide 22: Net attributable income up c.120% year-on-year
Net attributable income up c.120% year-on-year In € million FY 2019 FY 2020 FY 2021 FY 2020 includes €6.5 million earn out reversal and €5 million scope impact, pro Current operating income 185 152 147 (before acquisition-related expenses) forma level at €140 million . FY2021 reflects a 6% yoy organ
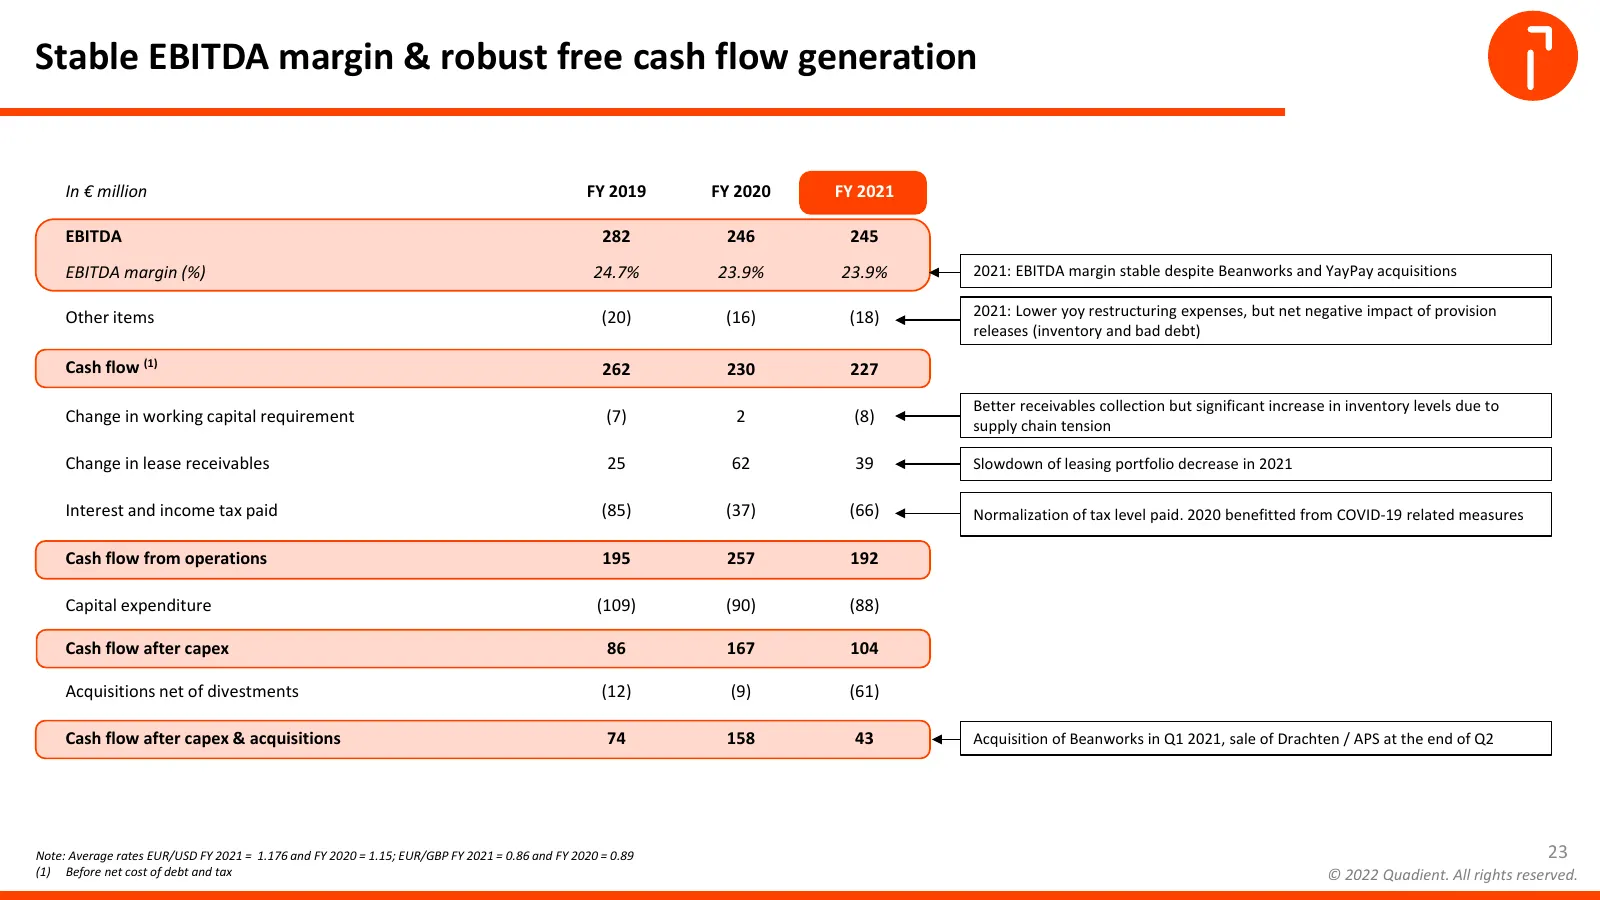
Slide 23: Stable EBITDA margin & robust free cash flow generation
Stable EBITDA margin & robust free cash flow generation In € million FY 2019 FY 2020 FY 2021 EBITDA 282 246 245 EBITDA margin (%) 24.7% 23.9% 23.9% 2021: EBITDA margin stable despite Beanworks and YayPay acquisitions Other items (20) (16) (18) 2021: Lower yoy restructuring expenses, but net negative
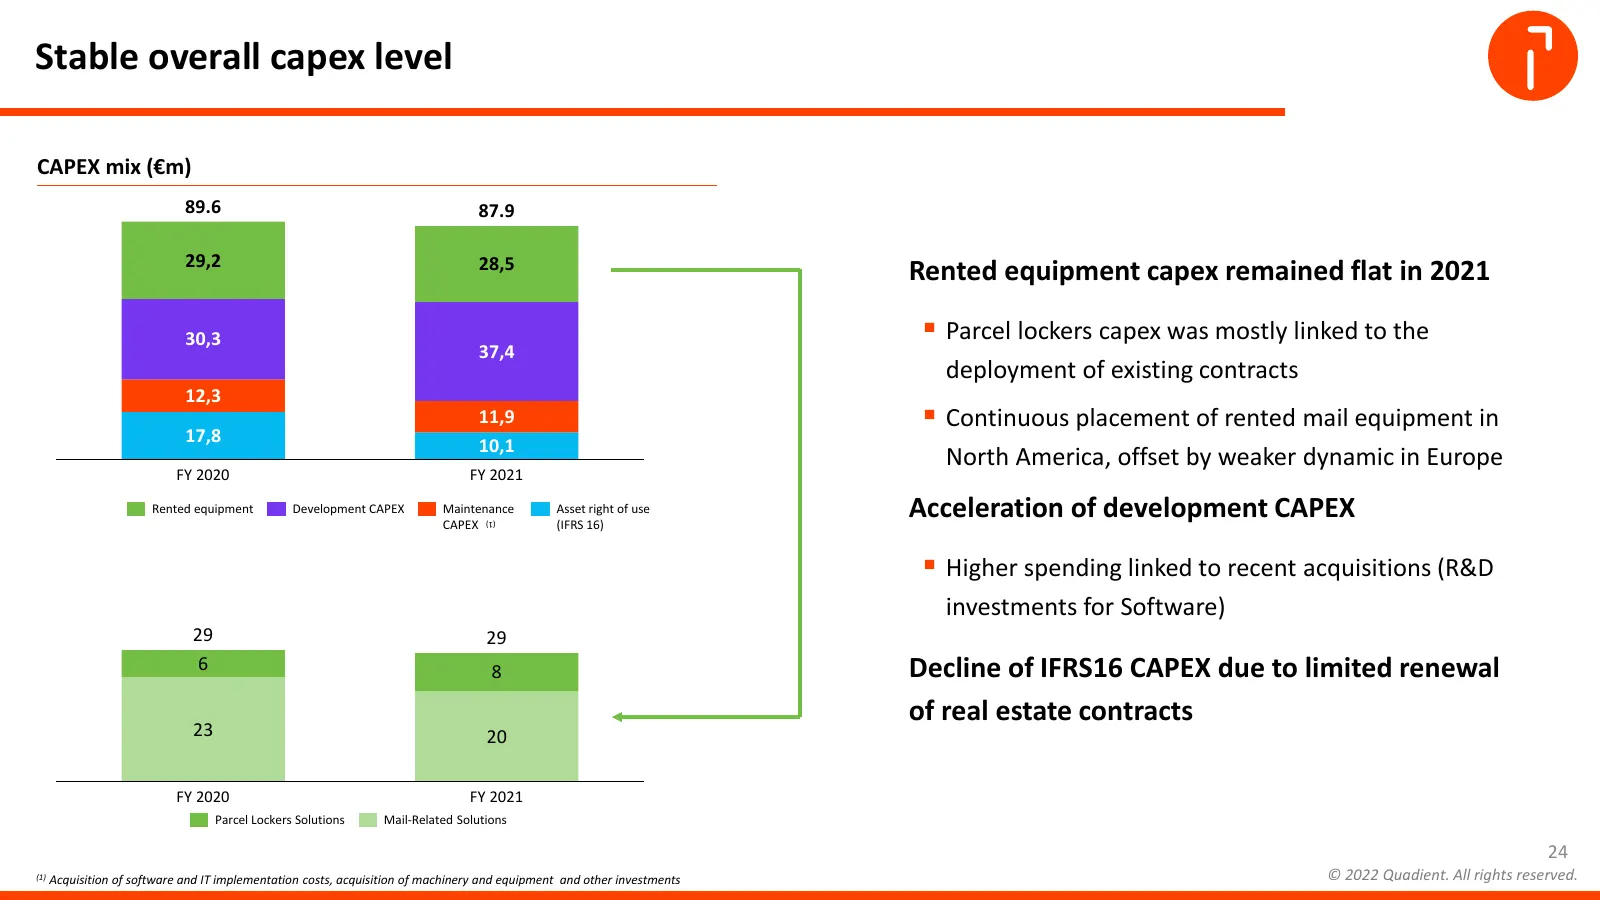
Slide 24: Stable overall capex level
Stable overall capex level CAPEX mix (€m) 89.6 87.9 29,2 28,5 Rented equipment capex remained flat in 2021 30,3 Parcel lockers capex was mostly linked to the 37,4 deployment of existing contracts 12,3 17,8 11,9 Continuous placement of rented mail equipment in 10,1 North America, offset by weaker
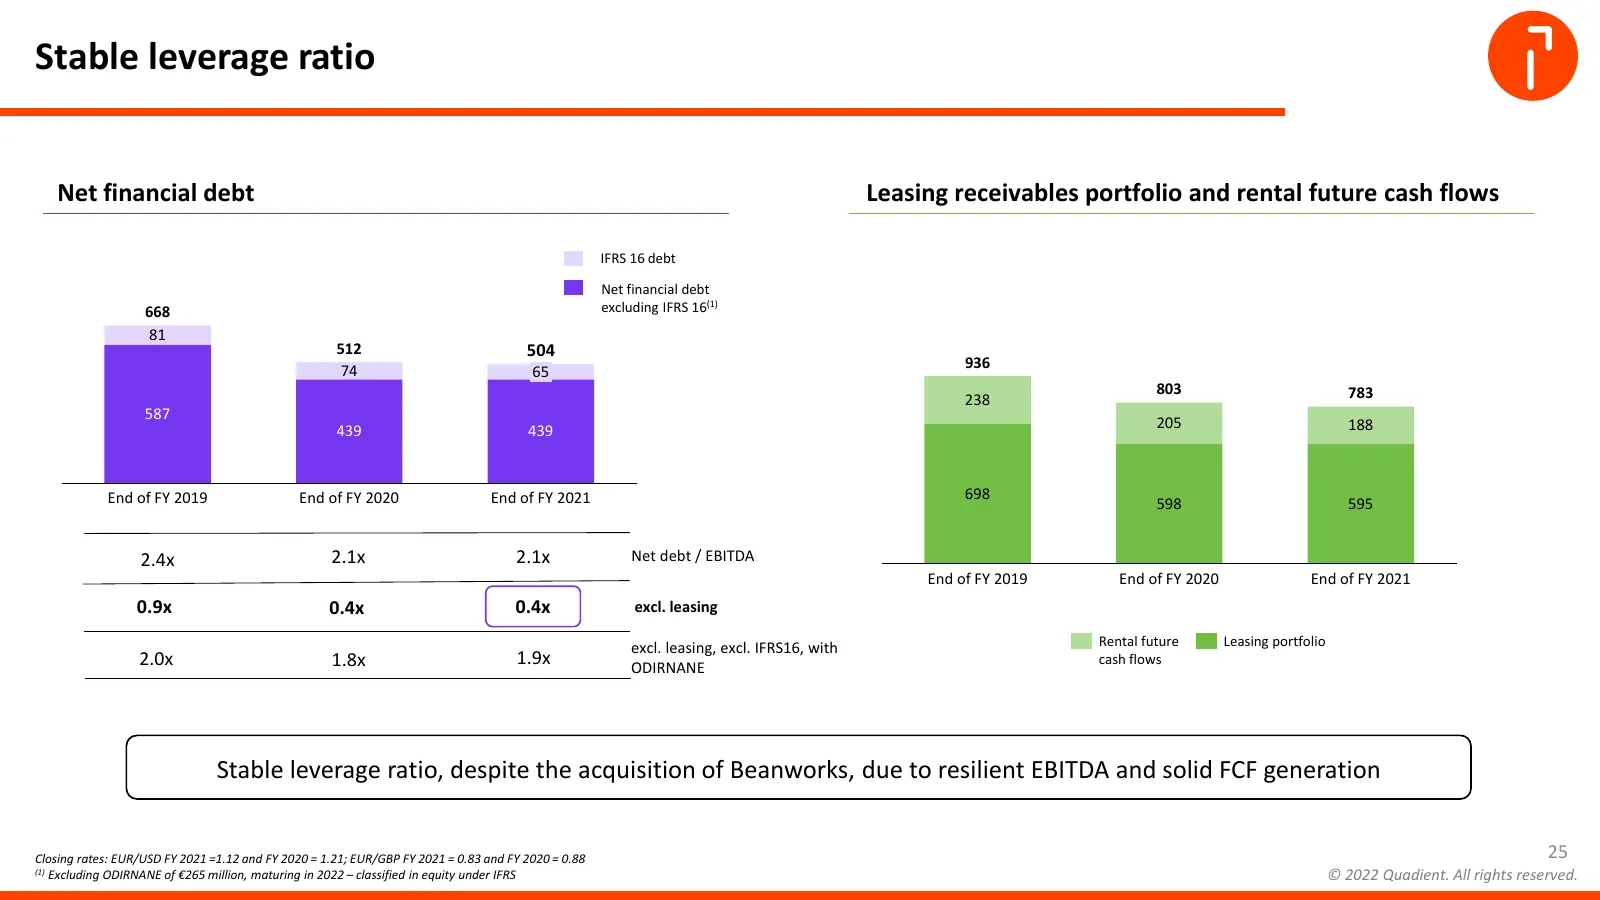
Slide 25: Stable leverage ratio
Stable leverage ratio Net financial debt Leasing receivables portfolio and rental future cash flows IFRS 16 debt Net financial debt 668 excluding IFRS 16(1) 81 512 504 936 74 65 803 783 238 587 439 439 205 188 End of FY 2019 End of FY 2020 End of FY 2021 698 598 595 2.4x 2.1x 2.1x Net debt / EBITDA
Slide 26: Strong liquidity position covering all short-term debt maturities
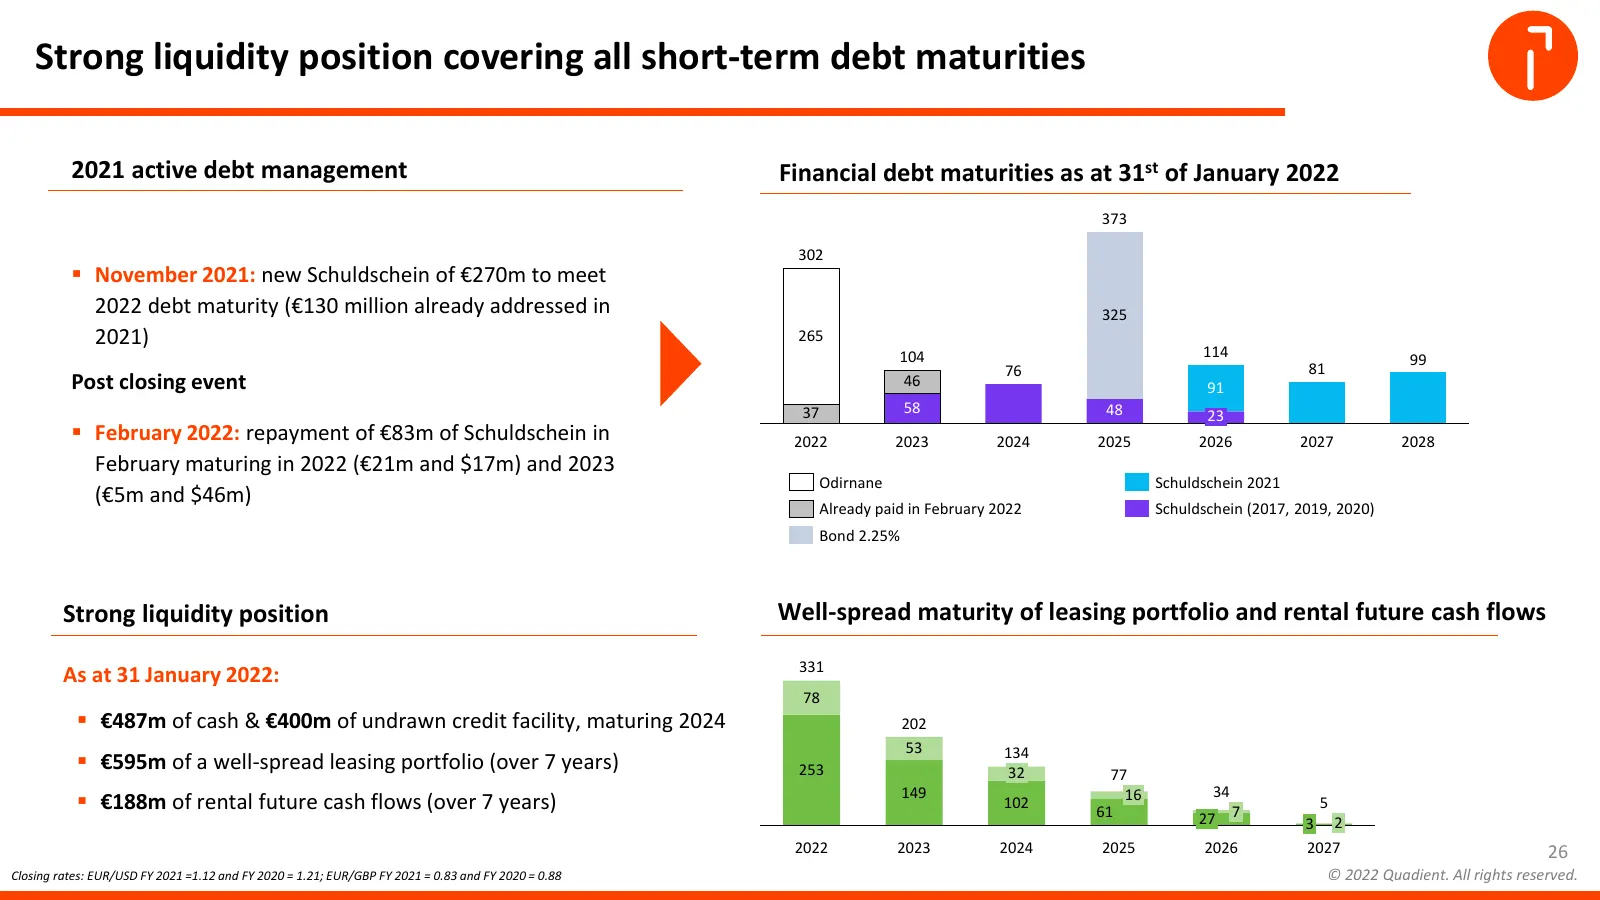
Strong liquidity position covering all short-term debt maturities 2021 active debt management Financial debt maturities as at 31st of January 2022 373 302 November 2021: new Schuldschein of €270m to meet 2022 debt maturity (€130 million already addressed in 325 2021) 265 104 114 99 76 81 Post clos

Slide 27: FY 2022 Outlook
27 FY 2022 OUTLOOK Geoffrey GODET CEO © Quadient 27 © 2022 Quadient. All rights reserved.
Slide 28: Drive Sustainable Value
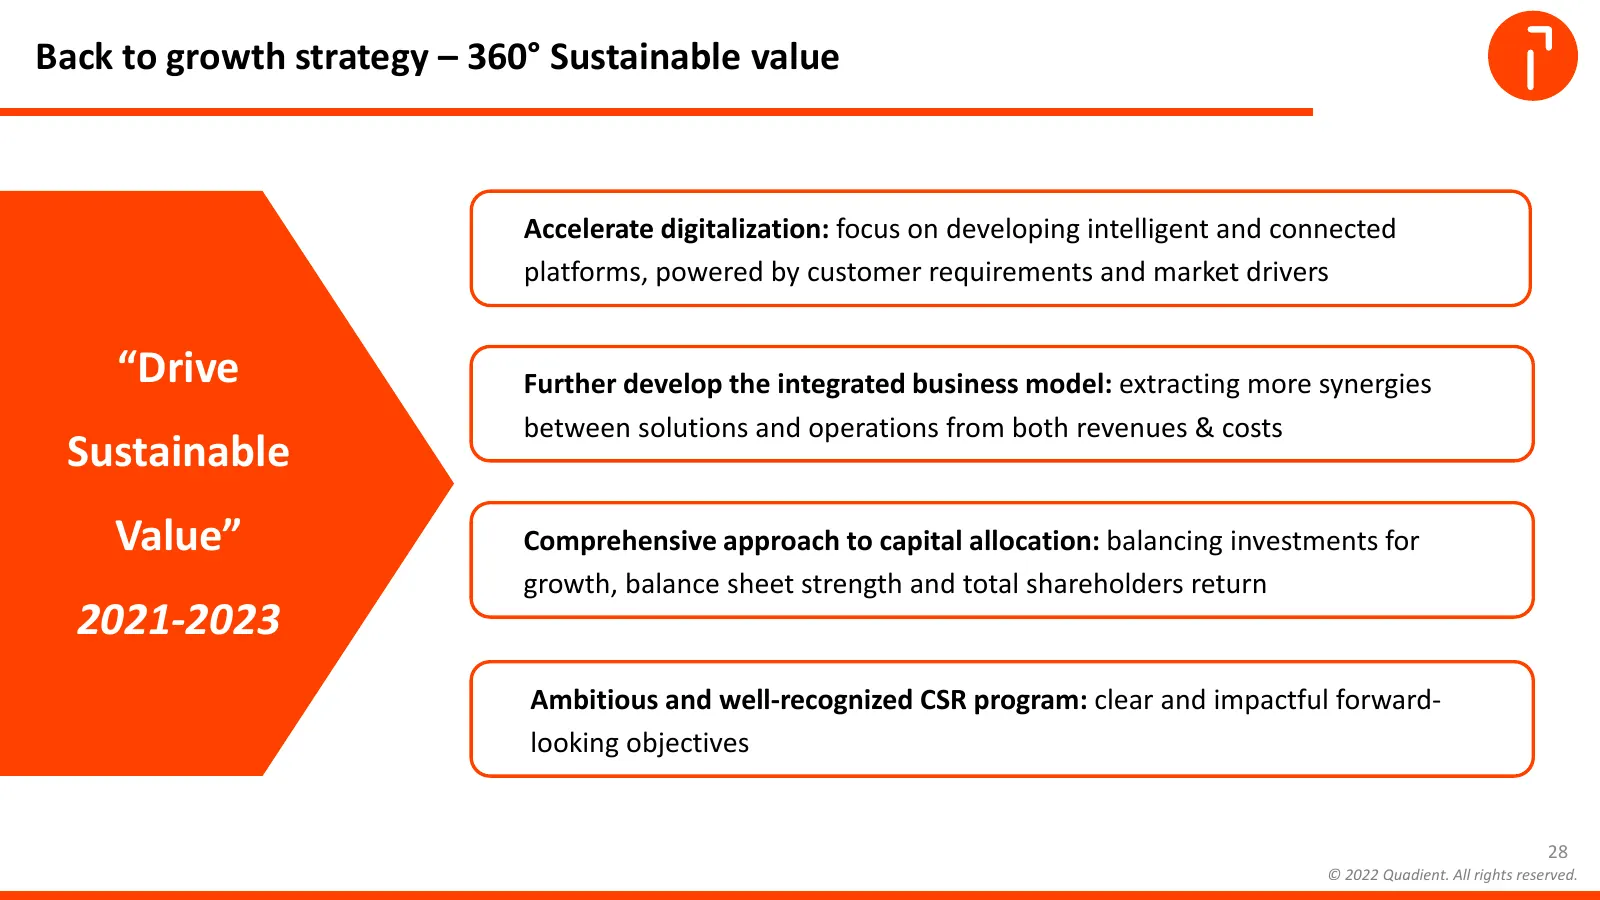
Back to growth strategy – 360° Sustainable value Accelerate digitalization: focus on developing intelligent and connected platforms, powered by customer requirements and market drivers “Drive Further develop the integrated business model: extracting more synergies between solutions and operations fr
Slide 29: Clear path of executing Quadient's vision
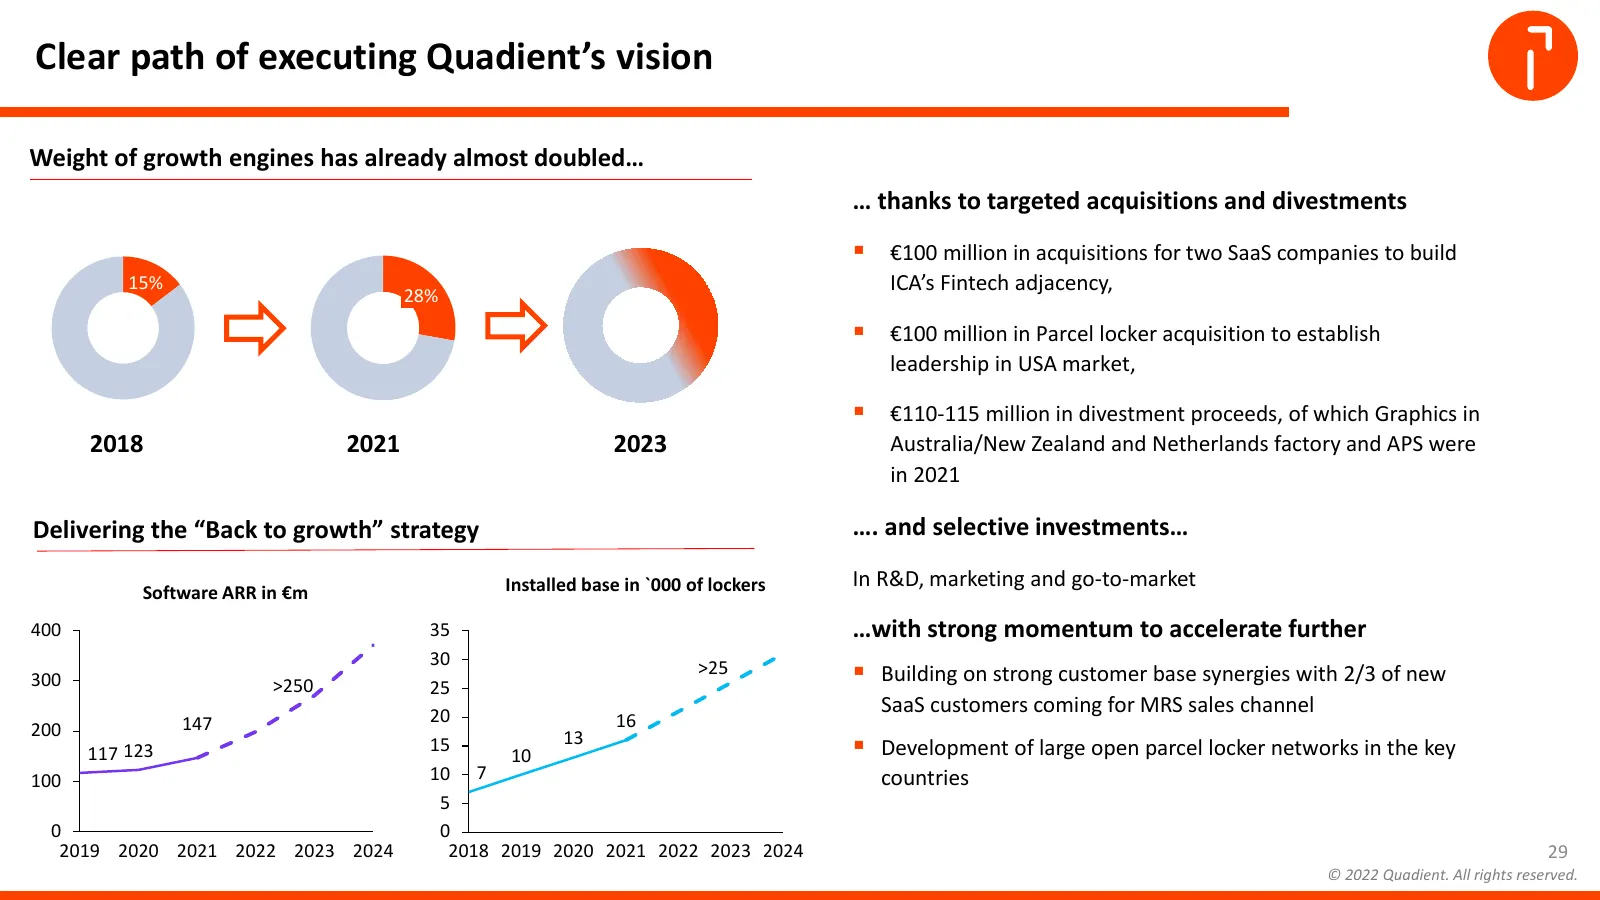
Clear path of executing Quadient’s vision Weight of growth engines has already almost doubled… … thanks to targeted acquisitions and divestments €100 million in acquisitions for two SaaS companies to build 15% ICA’s Fintech adjacency, 28% €100 million in Parcel locker acquisition to establish le
Slide 30: Current EBIT already past inflexion point
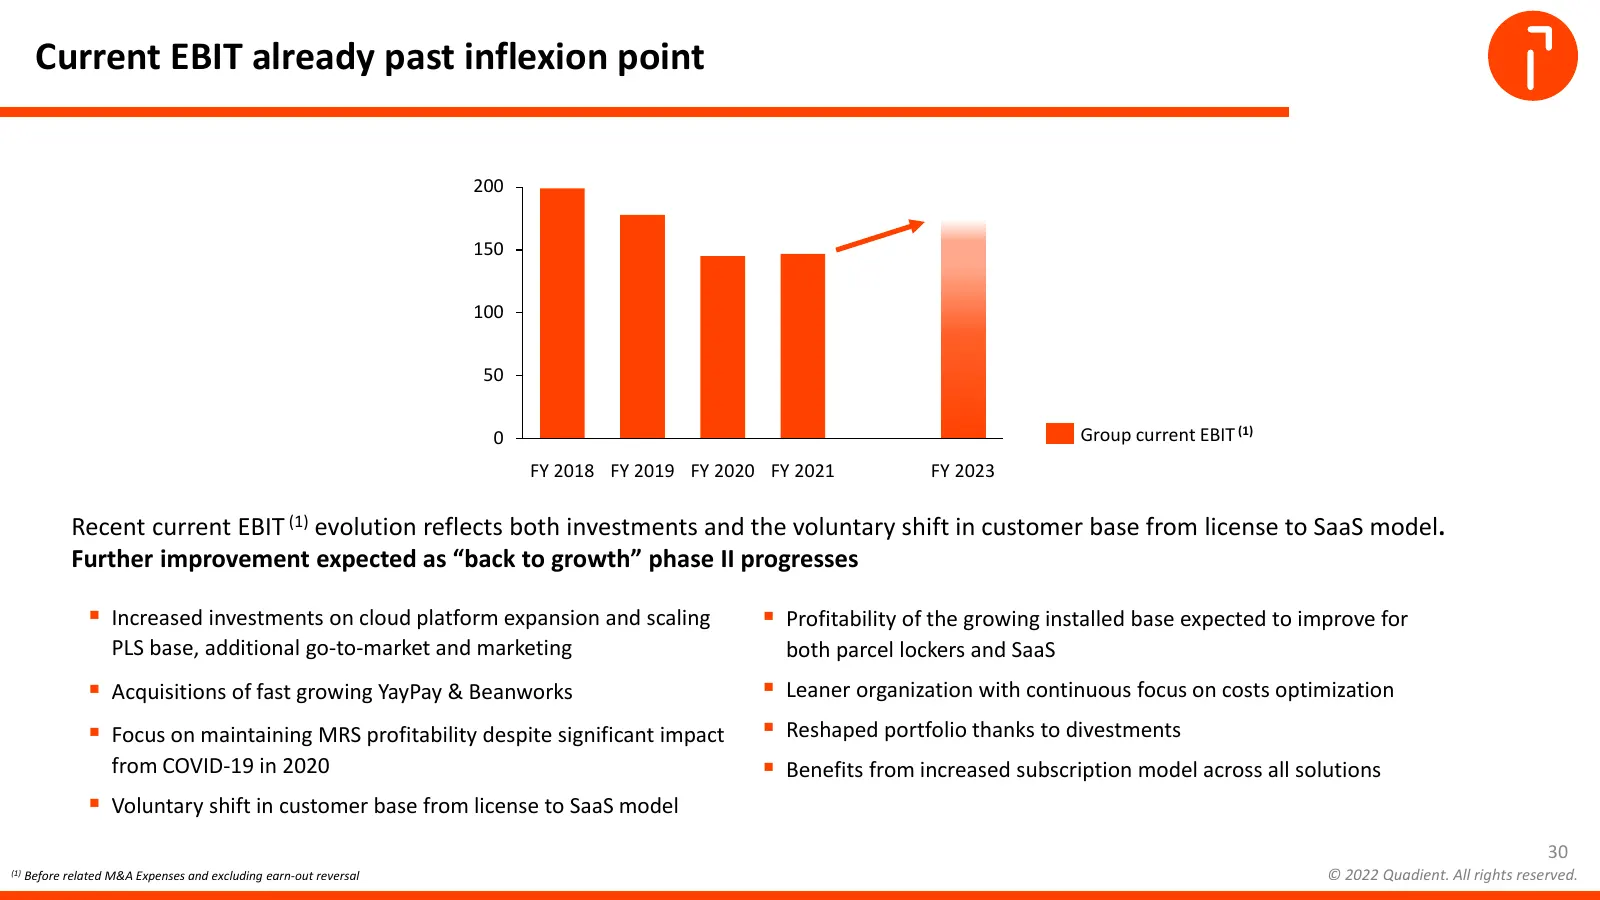
Current EBIT already past inflexion point 200 150 100 50 0 Group current EBIT (1) FY 2018 FY 2019 FY 2020 FY 2021 FY 2023 Recent current EBIT (1) evolution reflects both investments and the voluntary shift in customer base from license to SaaS model. Further improvement expected as “back to growth”
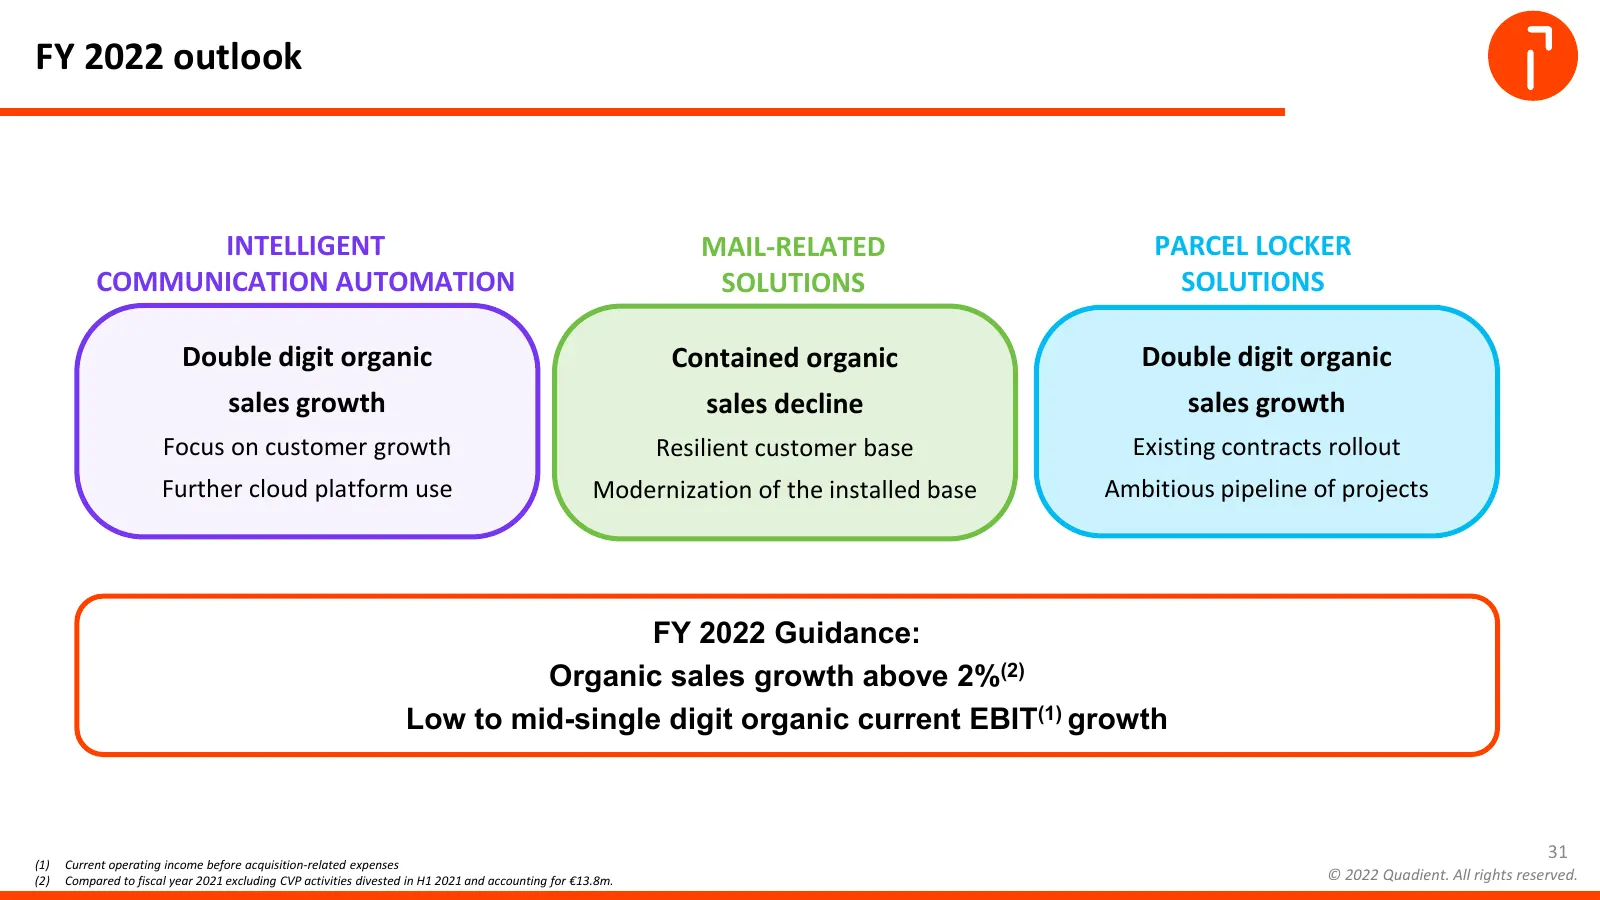
Slide 31: FY 2022 outlook
FY 2022 outlook INTELLIGENT MAIL-RELATED PARCEL LOCKER COMMUNICATION AUTOMATION SOLUTIONS SOLUTIONS Double digit organic Contained organic Double digit organic sales growth sales decline sales growth Focus on customer growth Resilient customer base Existing contracts rollout Further cloud platform u
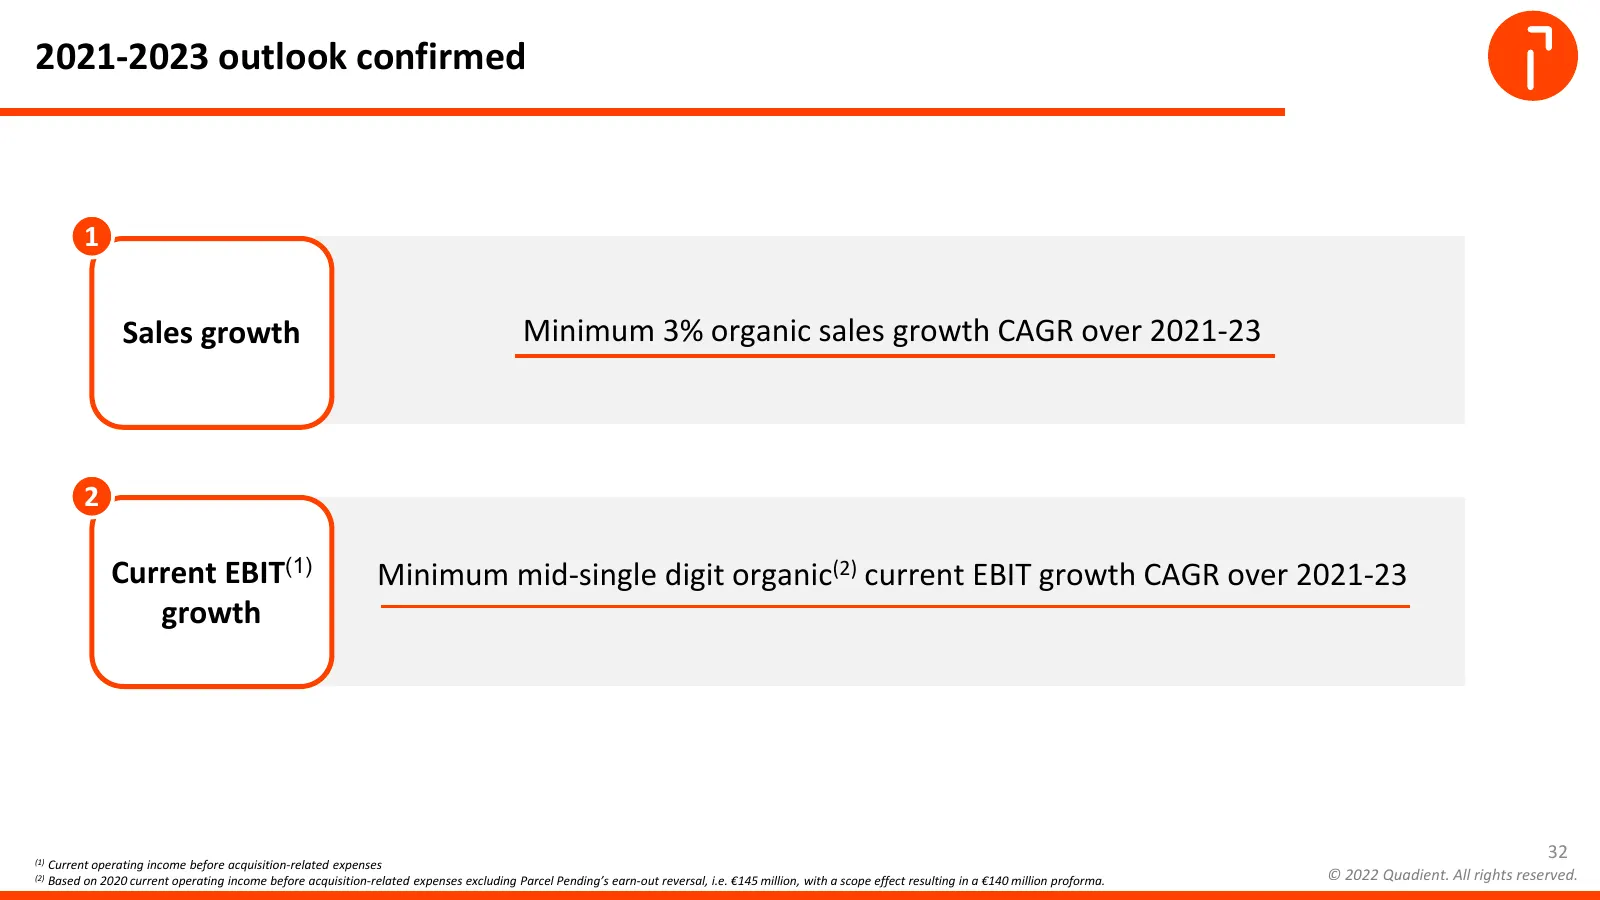
Slide 32: 2021-2023 outlook confirmed
2021-2023 outlook confirmed 1 Sales growth Minimum 3% organic sales growth CAGR over 2021-23 2 Current EBIT(1) Minimum mid-single digit organic(2) current EBIT growth CAGR over 2021-23 growth (1) Current operating income before acquisition-related expenses 32 (2) Based on 2020 current operating inco
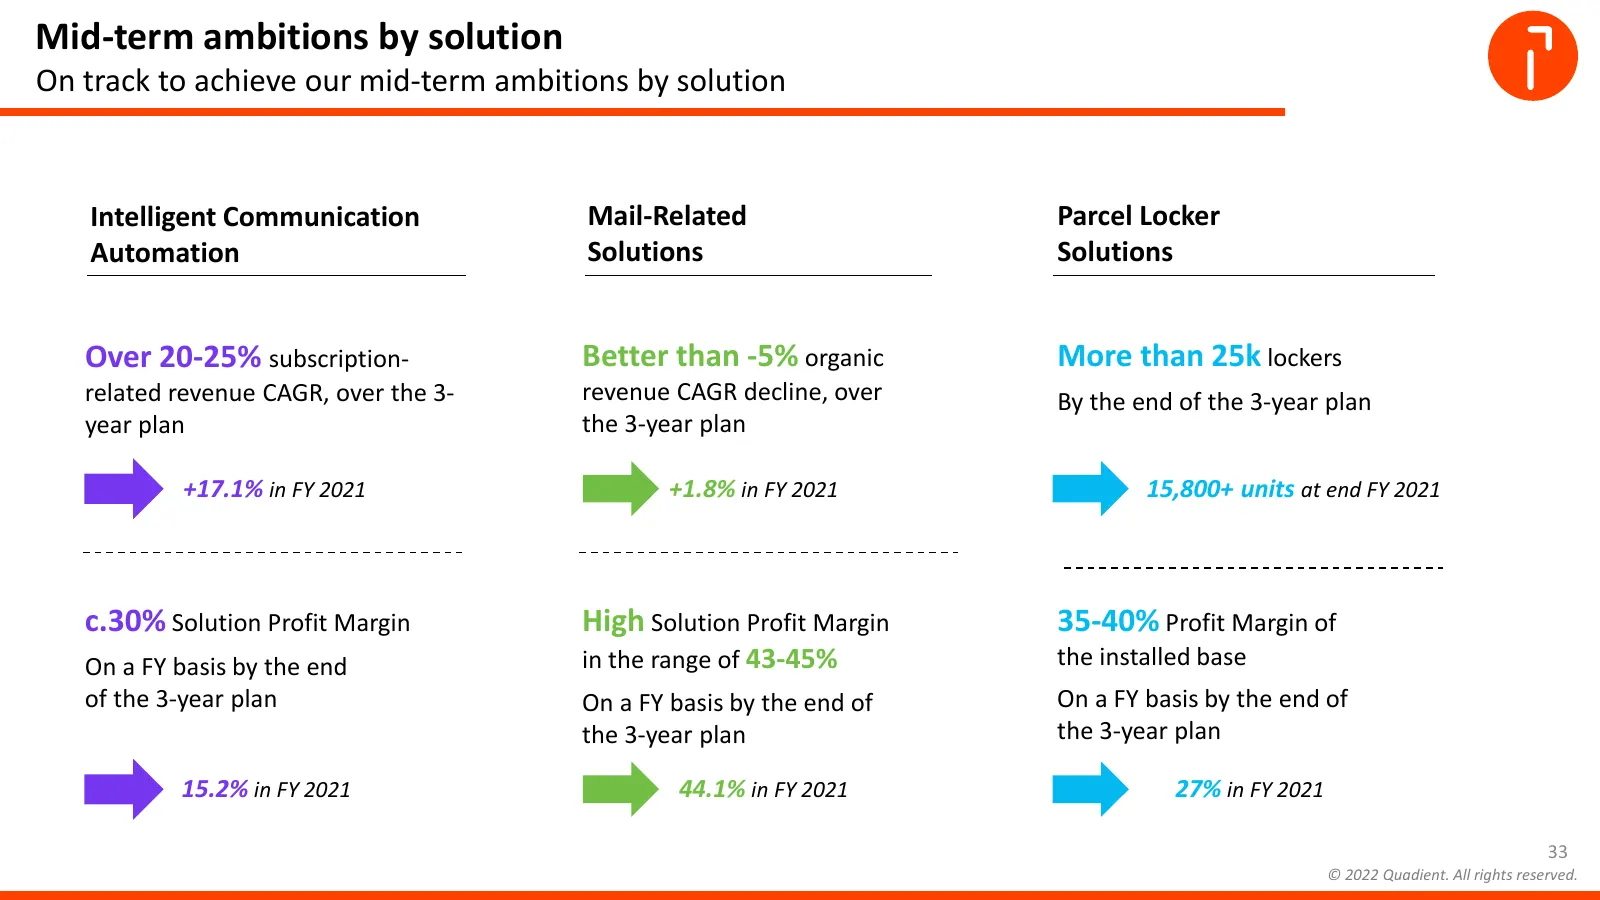
Slide 33: Mid-term ambitions by solution
Mid-term ambitions by solution On track to achieve our mid-term ambitions by solution Intelligent Communication Mail-Related Parcel Locker Automation Solutions Solutions Over 20-25% subscription- Better than -5% organic More than 25k lockers related revenue CAGR, over the 3- revenue CAGR decline, ov

Slide 34: Q&A
Q&A

Slide 35: Investor Relations
INVESTOR RELATIONS financial-communication@quadient.com https://invest.quadient.com/ NEXT EVENT • 7 June 2022: Q1 2022 sales

Slide 36: Appendices
36 APPENDICES © Quadient 36 © 2022 Quadient. All rights reserved.
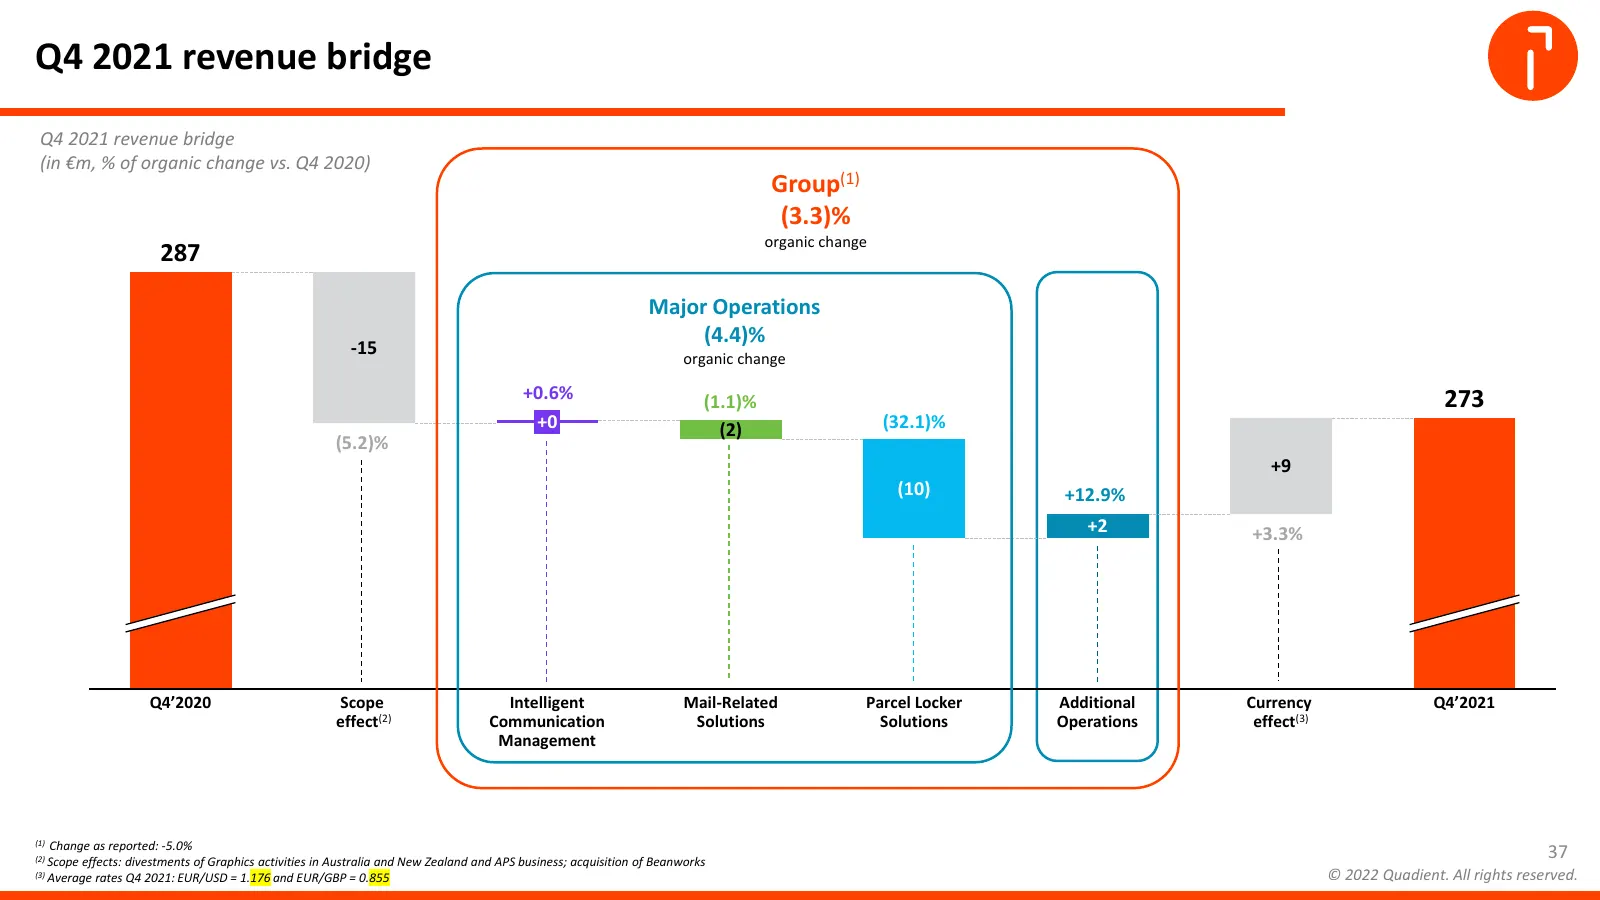
Slide 37: Q4 2021 revenue bridge
Q4 2021 revenue bridge Q4 2021 revenue bridge (in €m, % of organic change vs. Q4 2020) Group(1) (3.3)% organic change 287 Major Operations -15 (4.4)% organic change +0.6% (1.1)% 273 +0 (2) (32.1)% (5.2)% +9 (10) +12.9% +2 +3.3% Q4’2020 Scope Intelligent Mail-Related Parcel Locker Additional Currency
Slide 38: Q4 2021 revenue summary
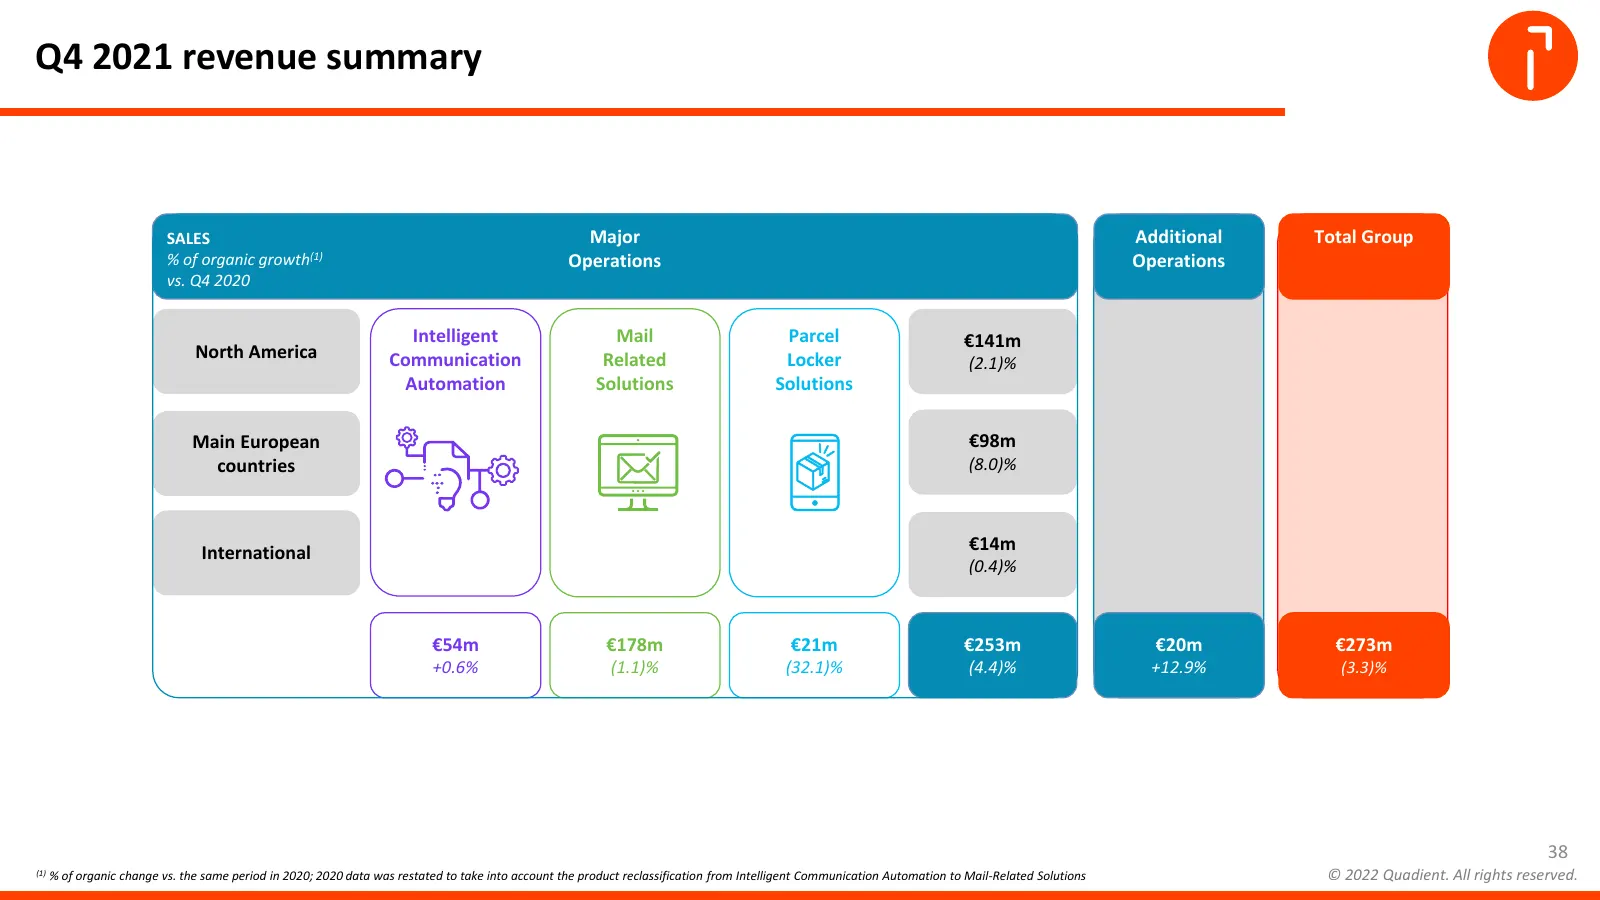
Q4 2021 revenue summary SALES Major Additional Total Group % of organic growth(1) Operations Operations vs. Q4 2020 Intelligent Mail Parcel €141m North America Communication Related Locker (2.1)% Automation Solutions Solutions Main European €98m countries (8.0)% International €14m (0.4)% €54m €178m
Slide 39: P&L
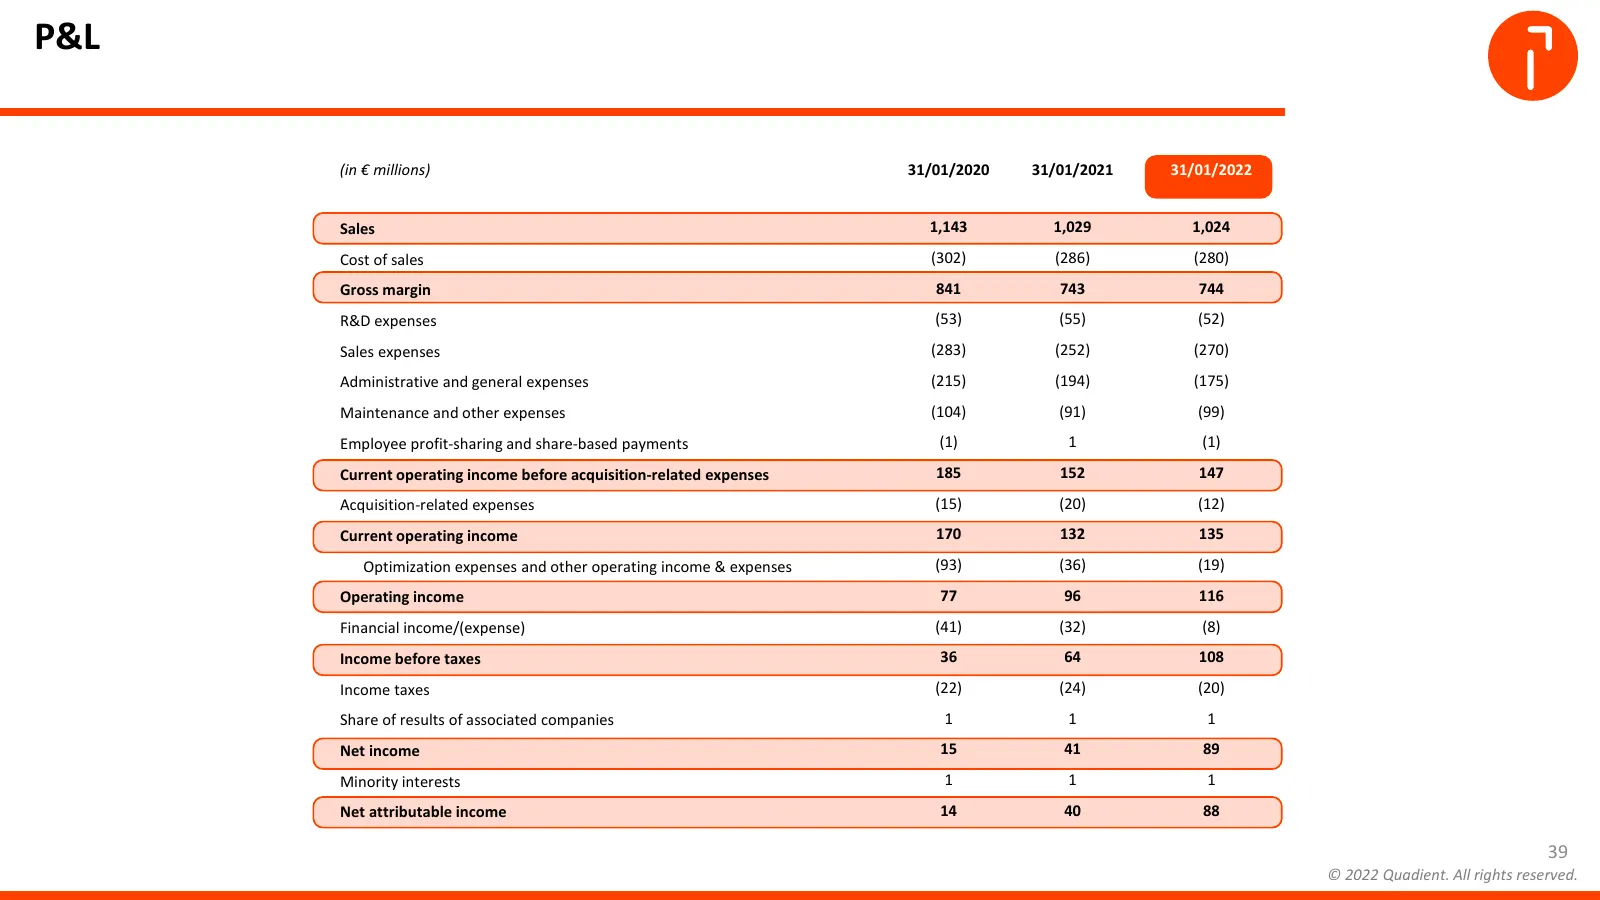
P&L (in € millions) 31/01/2020 31/01/2021 31/01/2022 Sales 1,143 1,029 1,024 Cost of sales (302) (286) (280) Gross margin 841 743 744 R&D expenses (53) (55) (52) Sales expenses (283) (252) (270) Administrative and general expenses (215) (194) (175) Maintenance and other expenses (104) (91) (99) Empl
Slide 40: Consolidated balance sheet (1/2)
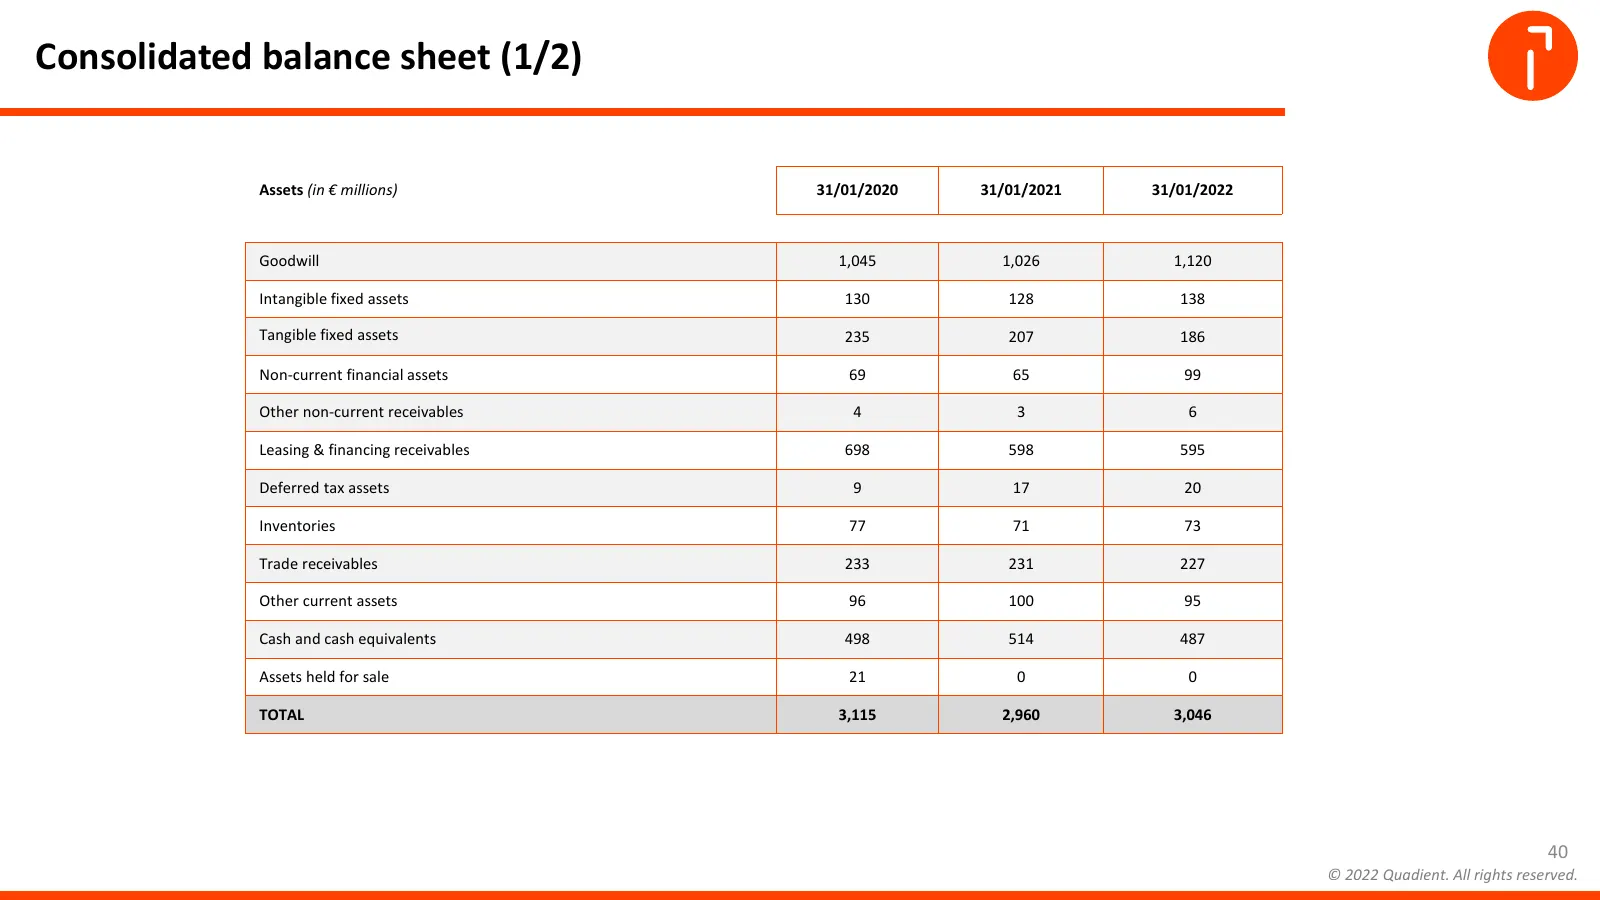
Consolidated balance sheet (1/2) Assets (in € millions) 31/01/2020 31/01/2021 31/01/2022 Goodwill 1,045 1,026 1,120 Intangible fixed assets 130 128 138 Tangible fixed assets 235 207 186 Non-current financial assets 69 65 99 Other non-current receivables 4 3 6 Leasing & financing receivables 698 598
Slide 41: Consolidated balance sheet (2/2)
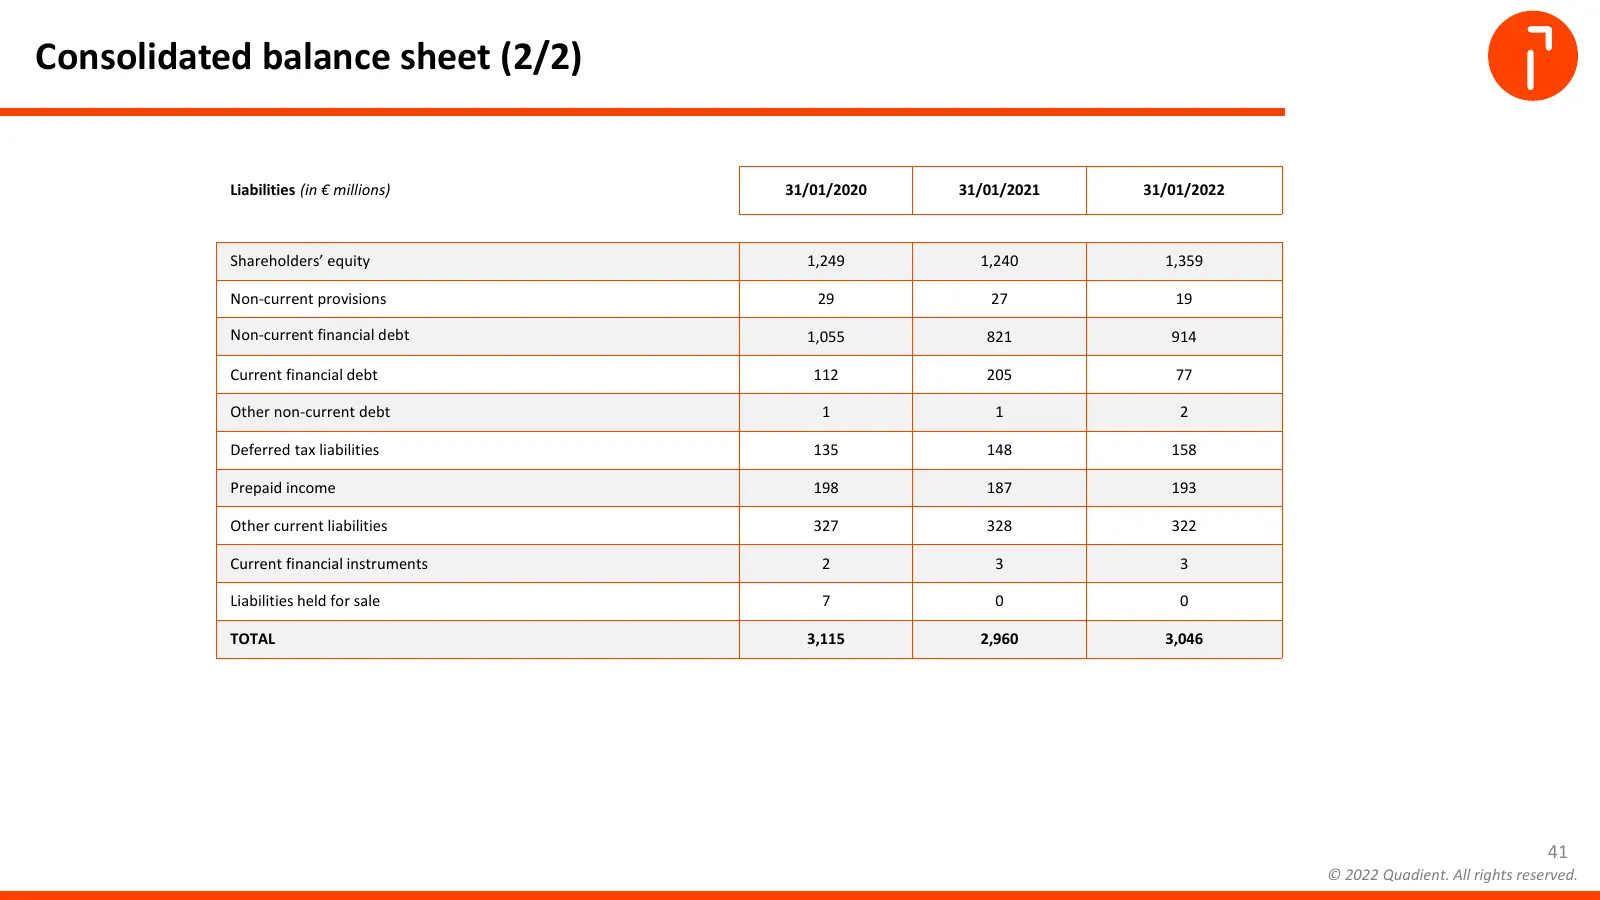
Consolidated balance sheet (2/2) Liabilities (in € millions) 31/01/2020 31/01/2021 31/01/2022 Shareholders’ equity 1,249 1,240 1,359 Non-current provisions 29 27 19 Non-current financial debt 1,055 821 914 Current financial debt 112 205 77 Other non-current debt 1 1 2 Deferred tax liabilities 135 14
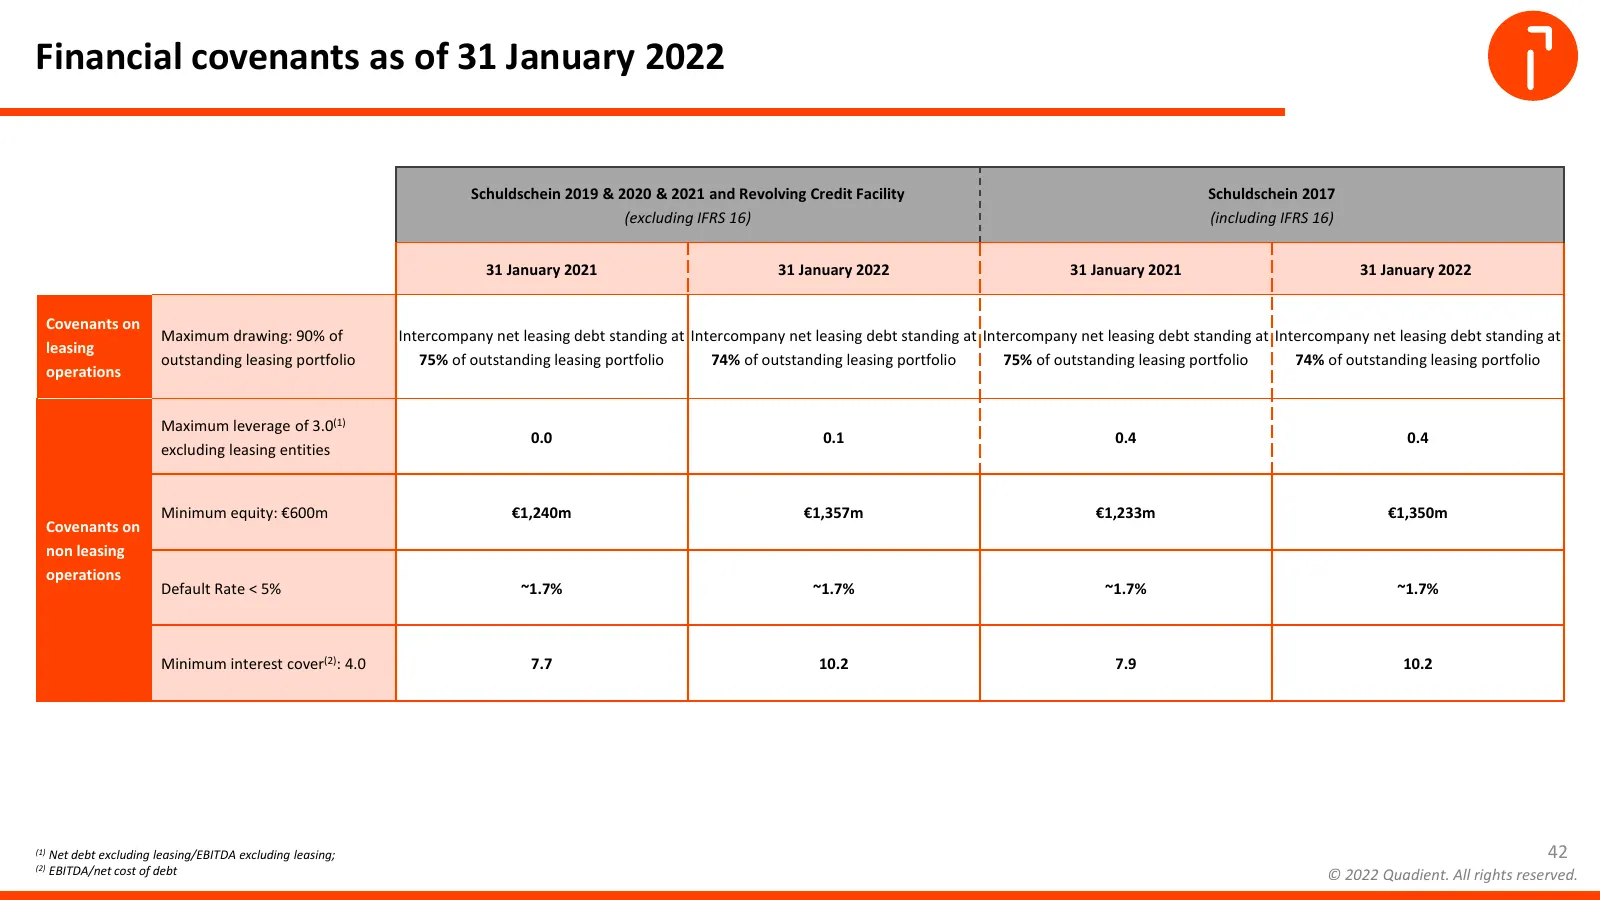
Slide 42: Financial covenants as of 31 January 2022
Financial covenants as of 31 January 2022 Schuldschein 2019 & 2020 & 2021 and Revolving Credit Facility Schuldschein 2017 (excluding IFRS 16) (including IFRS 16) 31 January 2021 31 January 2022 31 January 2021 31 January 2022 Covenants on Maximum drawing: 90% of Intercompany net leasing debt standin
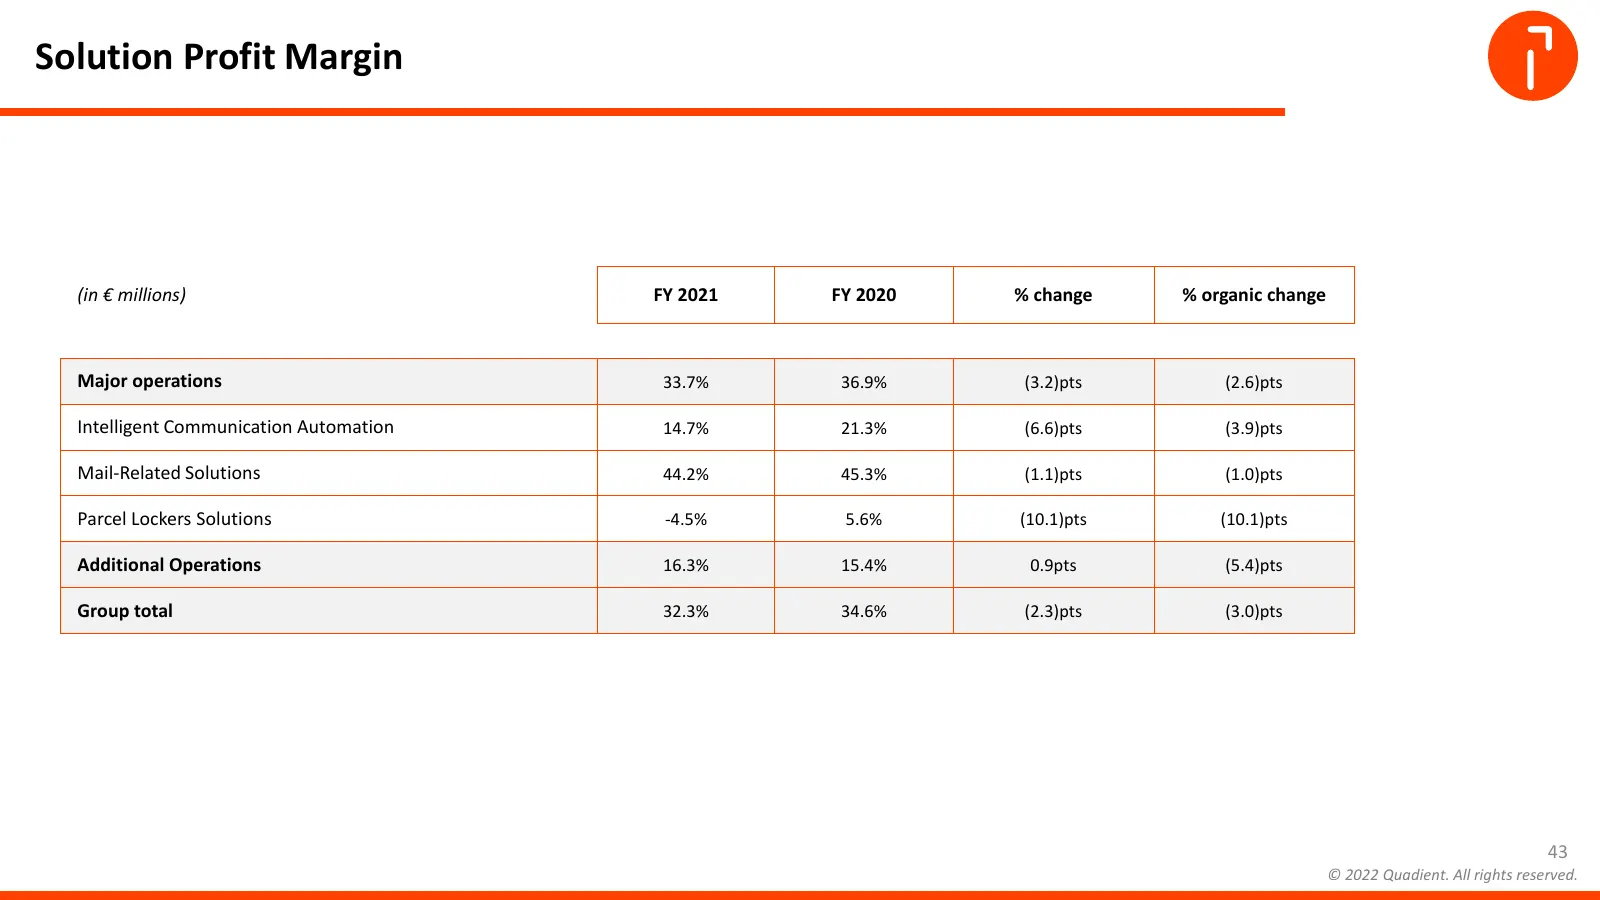
Slide 43: Solution Profit Margin
Solution Profit Margin (in € millions) FY 2021 FY 2020 % change % organic change Major operations 33.7% 36.9% (3.2)pts (2.6)pts Intelligent Communication Automation 14.7% 21.3% (6.6)pts (3.9)pts Mail-Related Solutions 44.2% 45.3% (1.1)pts (1.0)pts Parcel Lockers Solutions -4.5% 5.6% (10.1)pts (10.1)
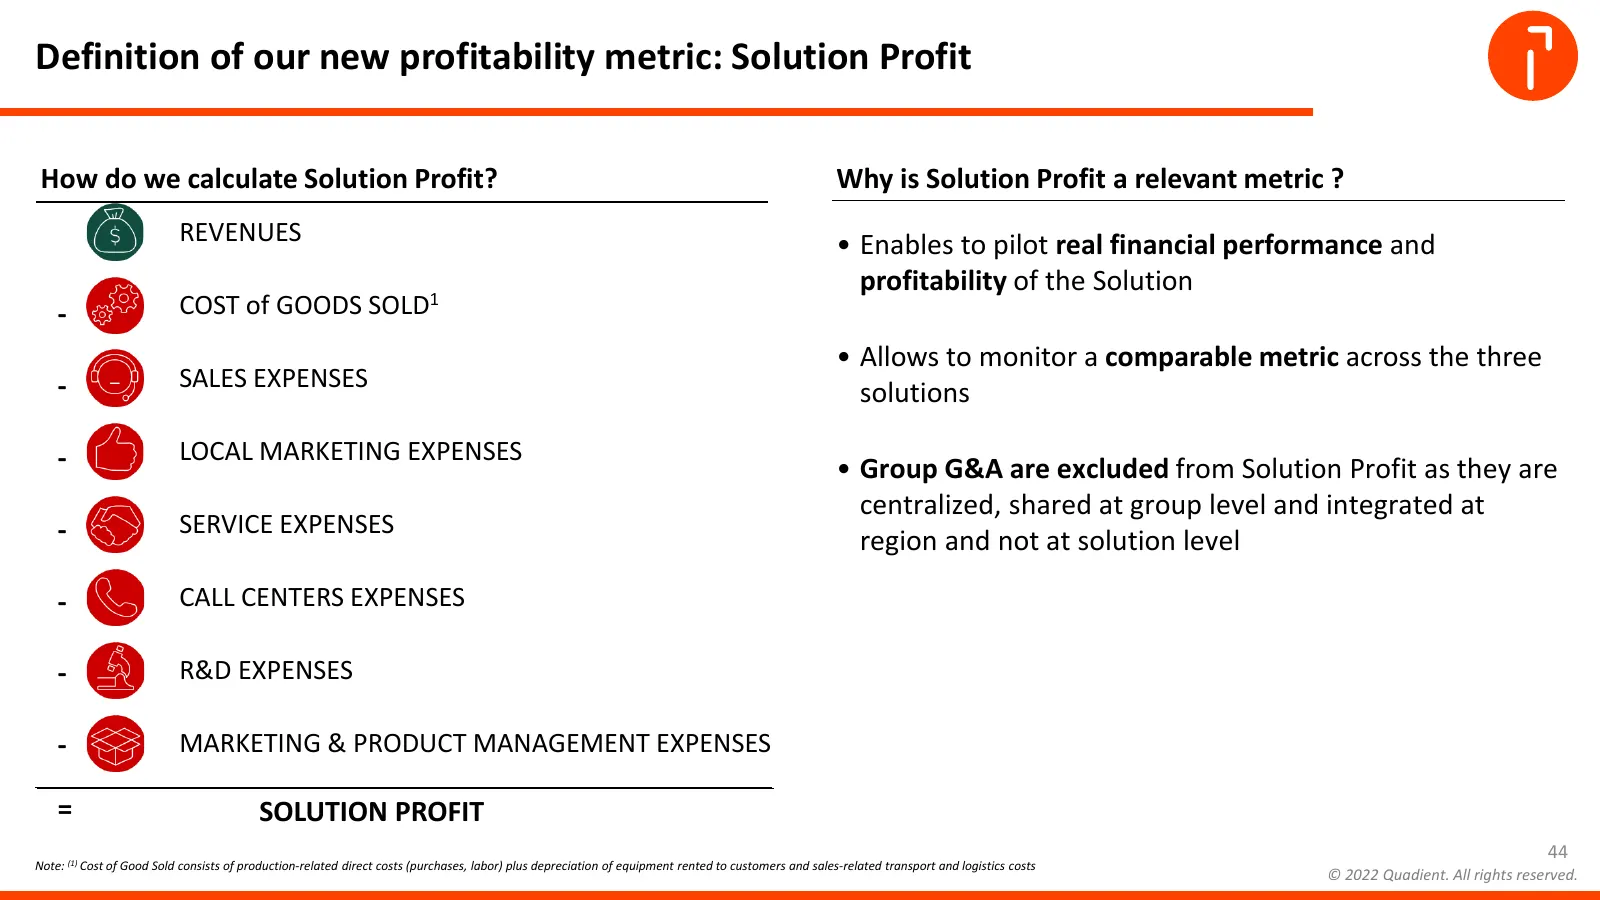
Slide 44: Definition of our new profitability metric: Solution Profit
Definition of our new profitability metric: Solution Profit How do we calculate Solution Profit? Why is Solution Profit a relevant metric ? REVENUES • Enables to pilot real financial performance and profitability of the Solution - COST of GOODS SOLD1 • Allows to monitor a comparable metric across th
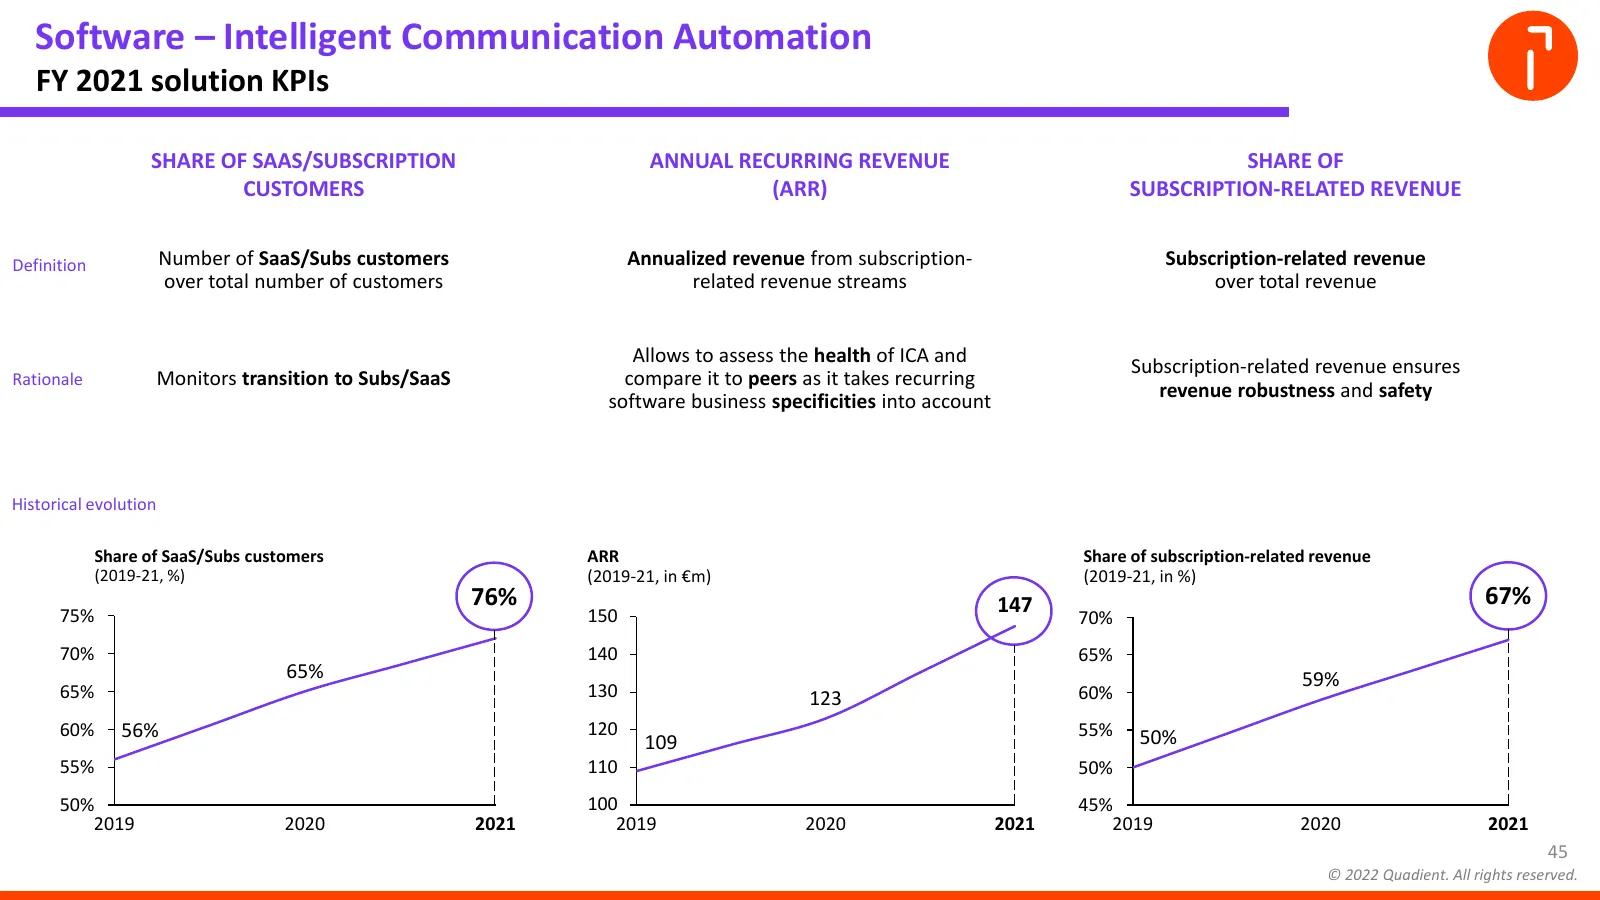
Slide 45: Software – Intelligent Communication Automation: solution KPIs
Software – Intelligent Communication Automation FY 2021 solution KPIs SHARE OF SAAS/SUBSCRIPTION ANNUAL RECURRING REVENUE SHARE OF CUSTOMERS (ARR) SUBSCRIPTION-RELATED REVENUE Definition Number of SaaS/Subs customers Annualized revenue from subscription- Subscription-related revenue over total numbe
Slide 46: Smart Hardware – Mail-Related Solutions: solution KPIs
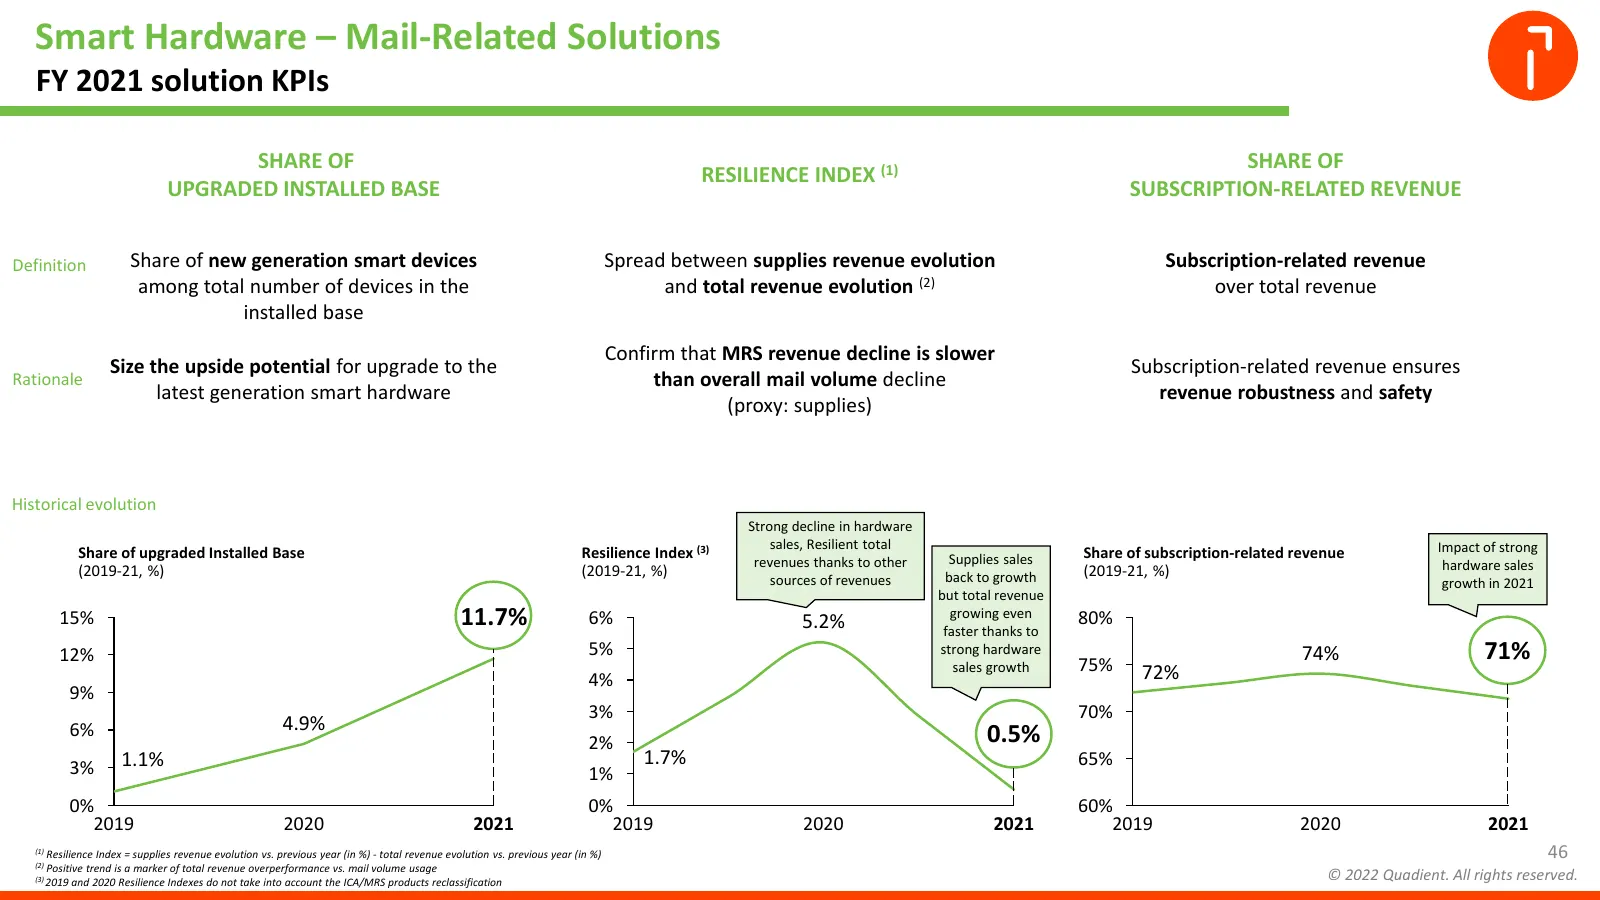
Smart Hardware – Mail-Related Solutions FY 2021 solution KPIs SHARE OF SHARE OF RESILIENCE INDEX (1) UPGRADED INSTALLED BASE SUBSCRIPTION-RELATED REVENUE Definition Share of new generation smart devices Spread between supplies revenue evolution Subscription-related revenue among total number of devi
Slide 47: Smart Hardware – Parcel Locker Solutions: solution KPIs
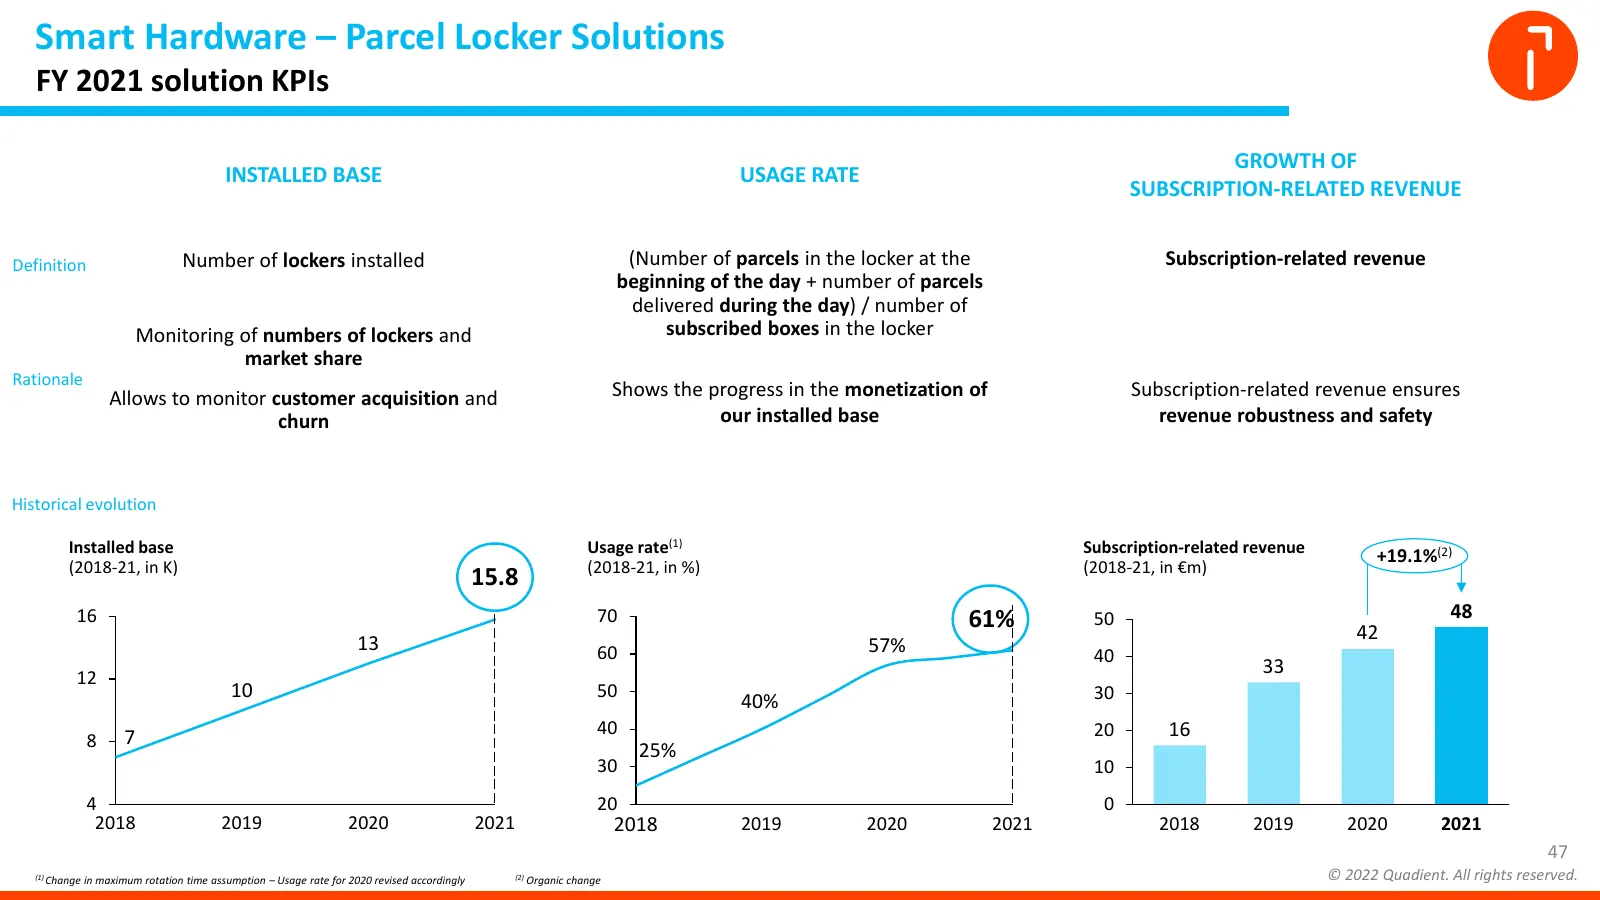
Smart Hardware – Parcel Locker Solutions FY 2021 solution KPIs GROWTH OF INSTALLED BASE USAGE RATE SUBSCRIPTION-RELATED REVENUE Definition Number of lockers installed (Number of parcels in the locker at the Subscription-related revenue beginning of the day + number of parcels delivered during the da
Slide 48: CSR aligned with UN sustainable development goals
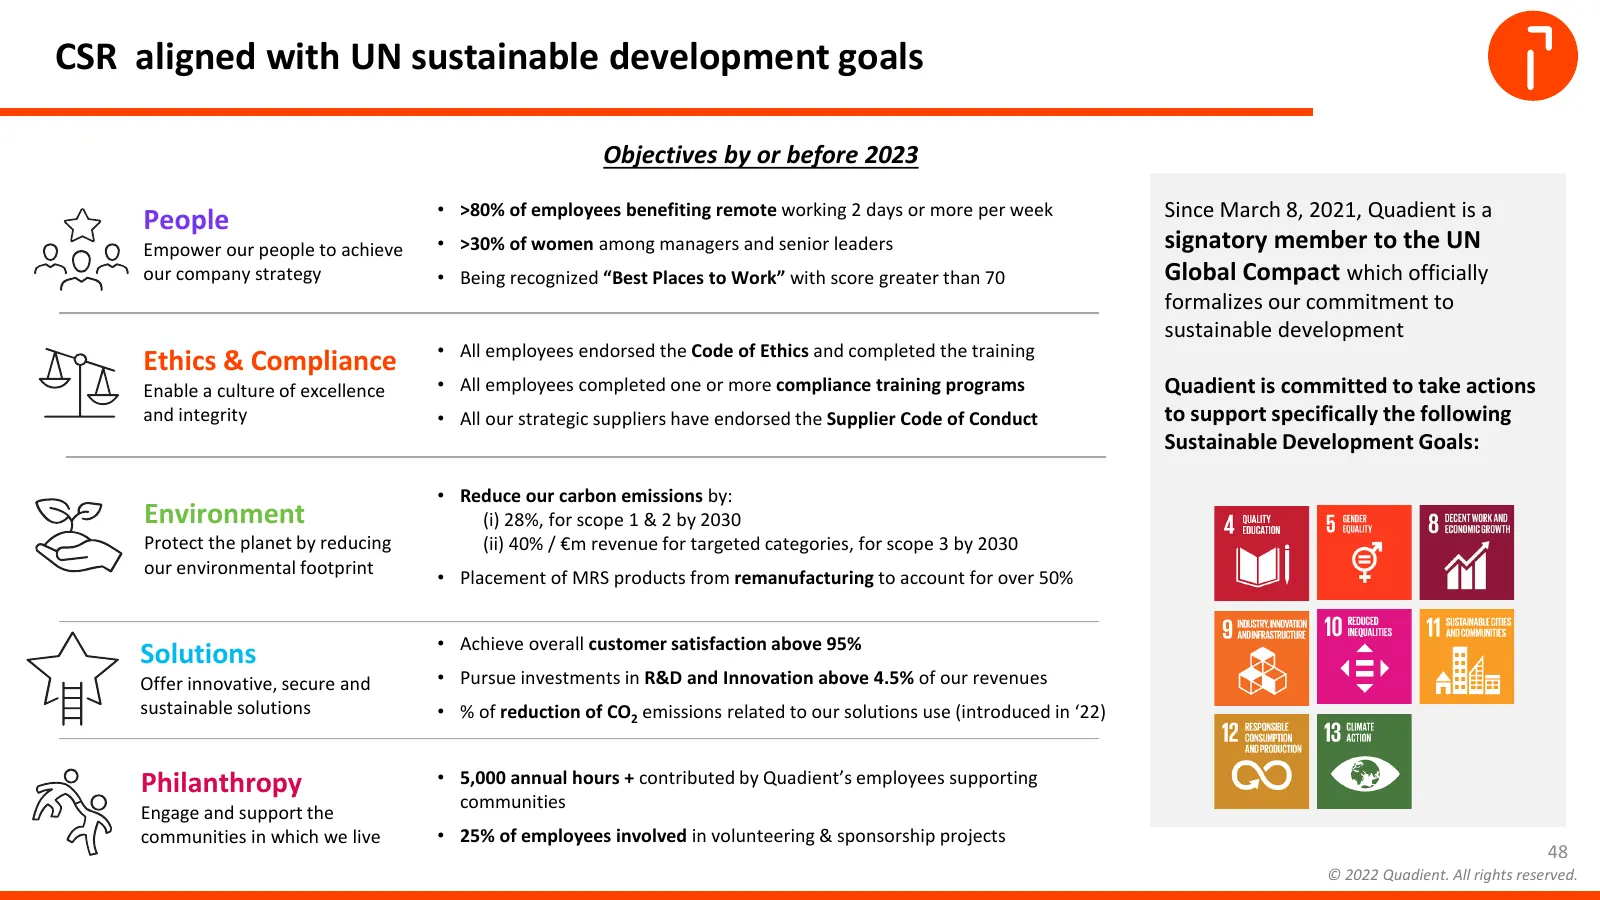
CSR aligned with UN sustainable development goals Objectives by or before 2023 • >80% of employees benefiting remote working 2 days or more per week Since March 8, 2021, Quadient is a People Empower our people to achieve • >30% of women among managers and senior leaders signatory member to the UN ou
Slide 49: Quadient's Back-to-Growth strategy, delivering phase II
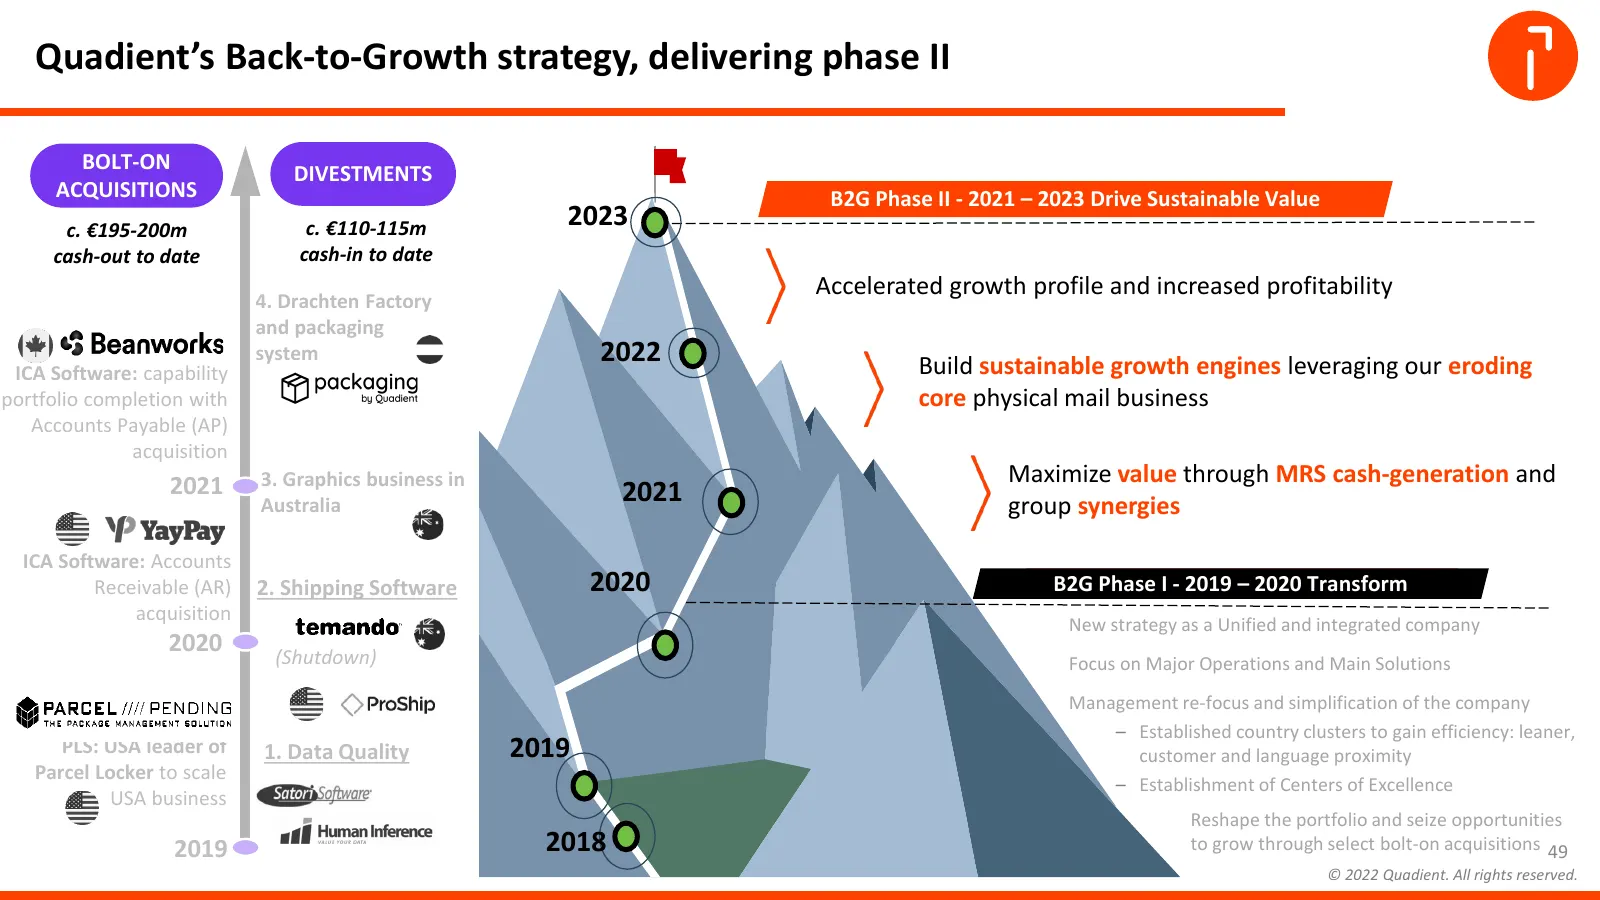
Quadient’s Back-to-Growth strategy, delivering phase II BOLT-ON DIVESTMENTS ACQUISITIONS B2G Phase II - 2021 – 2023 Drive Sustainable Value c. €195-200m c. €110-115m 2023 cash-out to date cash-in to date Accelerated growth profile and increased profitability 4. Drachten Factory and packaging system
Source: Internet Archive copy of resources.quadient.com
More decks from Quadient SA
 H1 2026 Earnings Presentation43 slides · Sep 23, 2026
 Shareholder Meeting (June 2026)41 slides · Jun 18, 2026
 FY2025 Earnings Presentation52 slides · Mar 25, 2026
 Q3 2025 Earnings Presentation31 slides · Dec 2, 2025
 H1 2025 Earnings Presentation40 slides · Sep 24, 2025
 Shareholder Meeting (June 2025)35 slides · Jun 13, 2025