LAMDA Development S.A. · ATHEX:LAMDA
LAMDA Development — 9M 2021 Earnings Presentation
32 slides from LAMDA Development's earnings presentation, Dec 8, 2021
Slide 1: 9M 2021 Results Presentation
9M 2021 RESULTS PRESENTATION ee 8 DECEMBER 2021 Nn — ZELLINIKON
Slide 2: Contents
Contents = A|aw|n Results Highlights The Ellinikon Shopping Malls Group - 9M 2021 Results Appendix 11 22
Slide 3: 1. Results Highlights
1. RESULTS HIGHLIGHTS
Slide 4: Results Highlights - Group
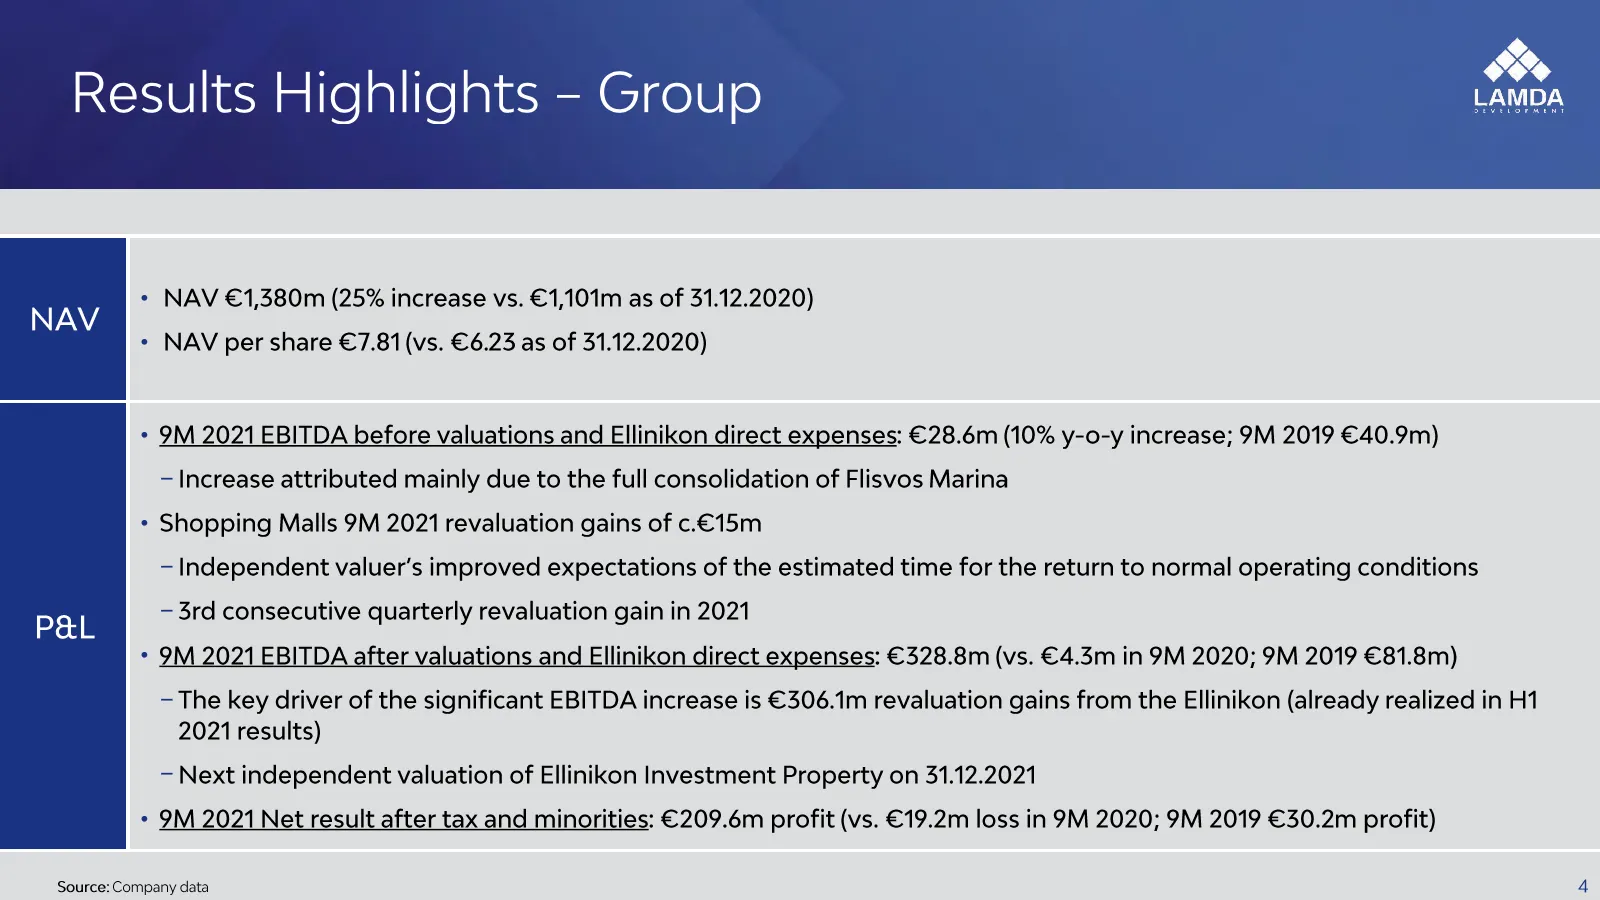
Results Highlights - Group - NAV €1,380m (25% increase vs. €1,101m as of 31.12.2020) NAV + NAV per share €7.81 (vs. €6.23 as of 31.12.2020) + 9M 2021 EBITDA before valuations and Ellinikon direct expenses: €28.6m (10% y-o-y increase; 9M 2019 €40.9m) — Increase attributed mainly due to the full conso
Slide 5: Results Highlights - Shopping Malls
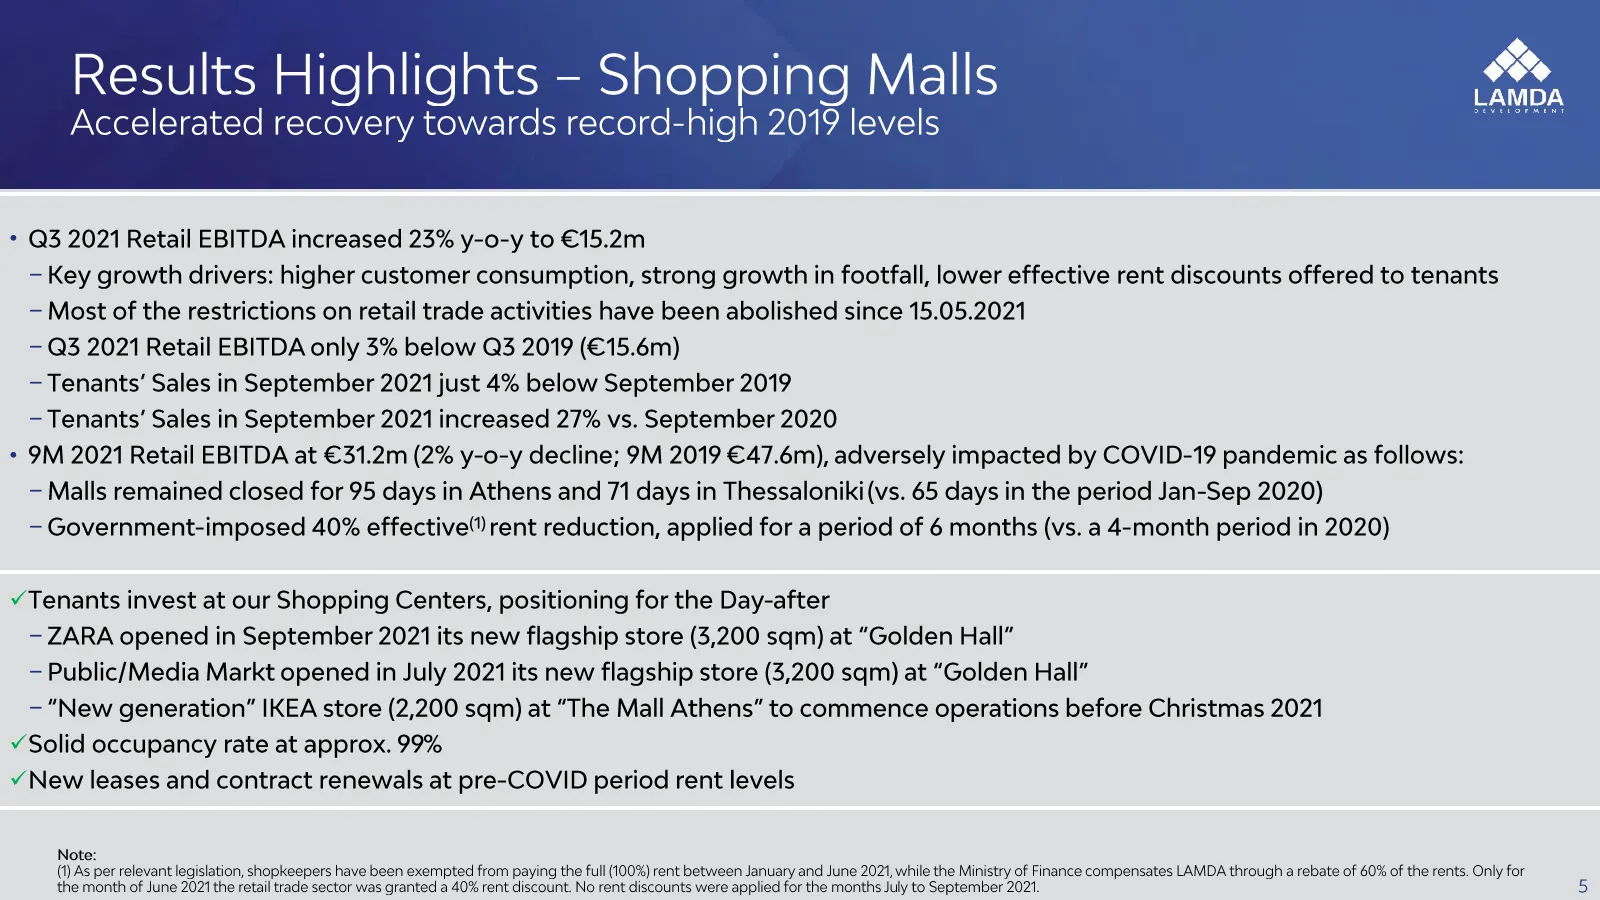
Results Highlights - Shopping Malls Accelerated recovery towards record-high 2019 levels * Q3 2021 Retail EBITDA increased 23% y-o-y to €15.2m —Key growth drivers: higher customer consumption, strong growth in footfall, lower effective rent discounts offered to tenants - Most of the restrictions on
Slide 6: The Ellinikon - Key Recent Developments
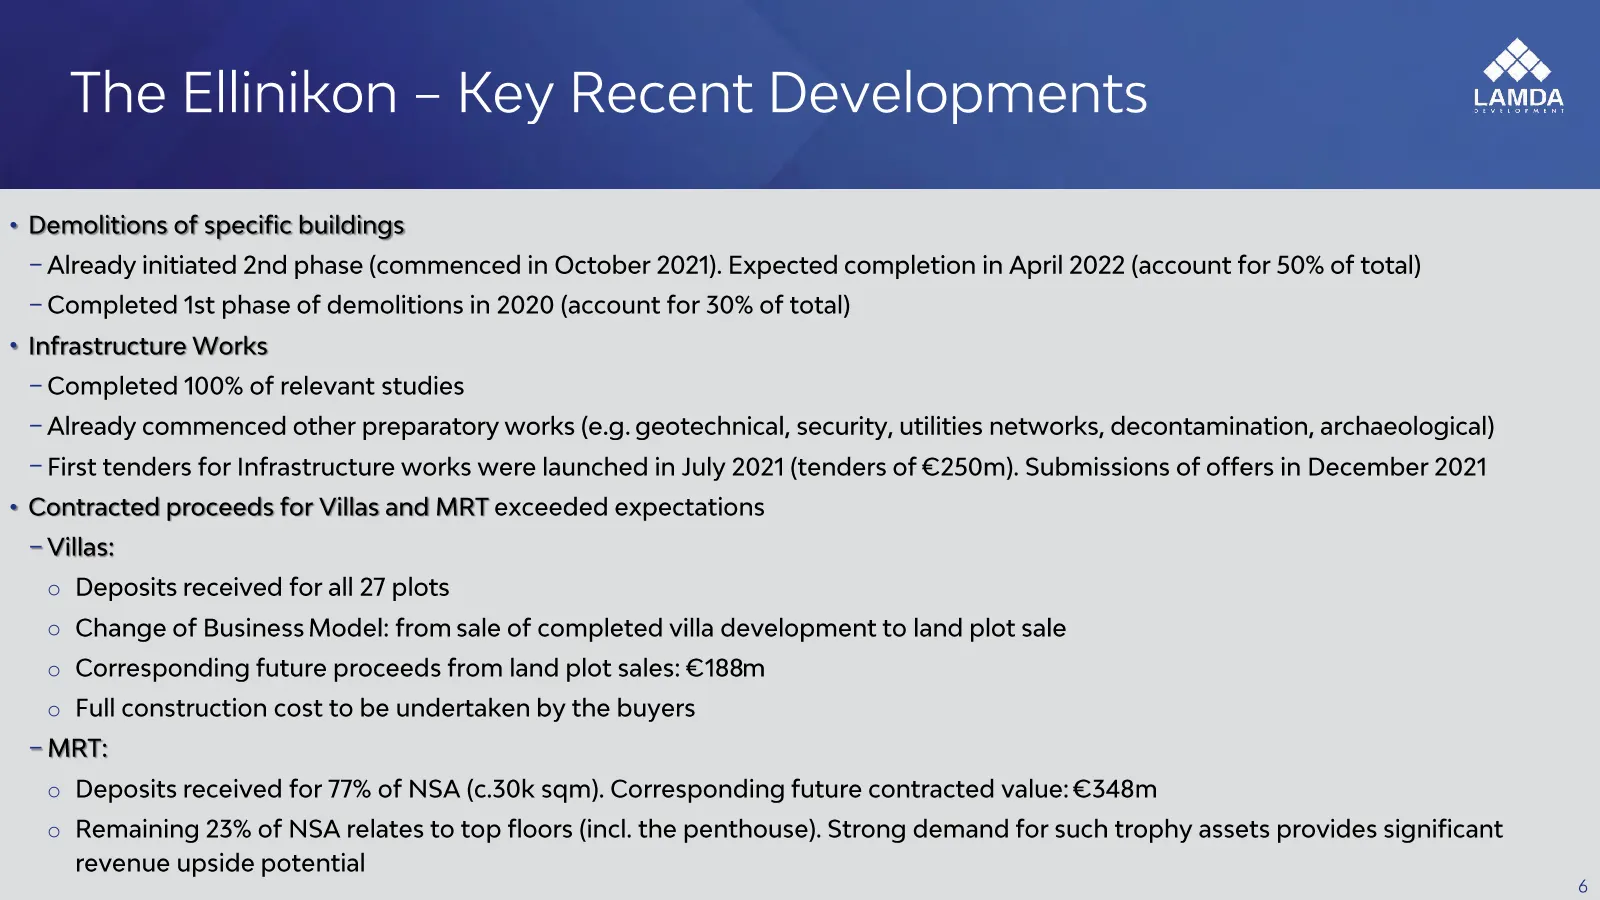
The Ellinikon - Key Recent Developments + Demolitions of specific buildings — Already initiated 2nd phase (commenced in October 2021). Expected completion in April 2022 (account for 50% of total) — Completed 1st phase of demolitions in 2020 (account for 30% of total) + Infrastructure Works —Complete

Slide 7: 2. The Ellinikon
2. THE ELLINIKON
Slide 8: The Ellinikon - Operating Expenses
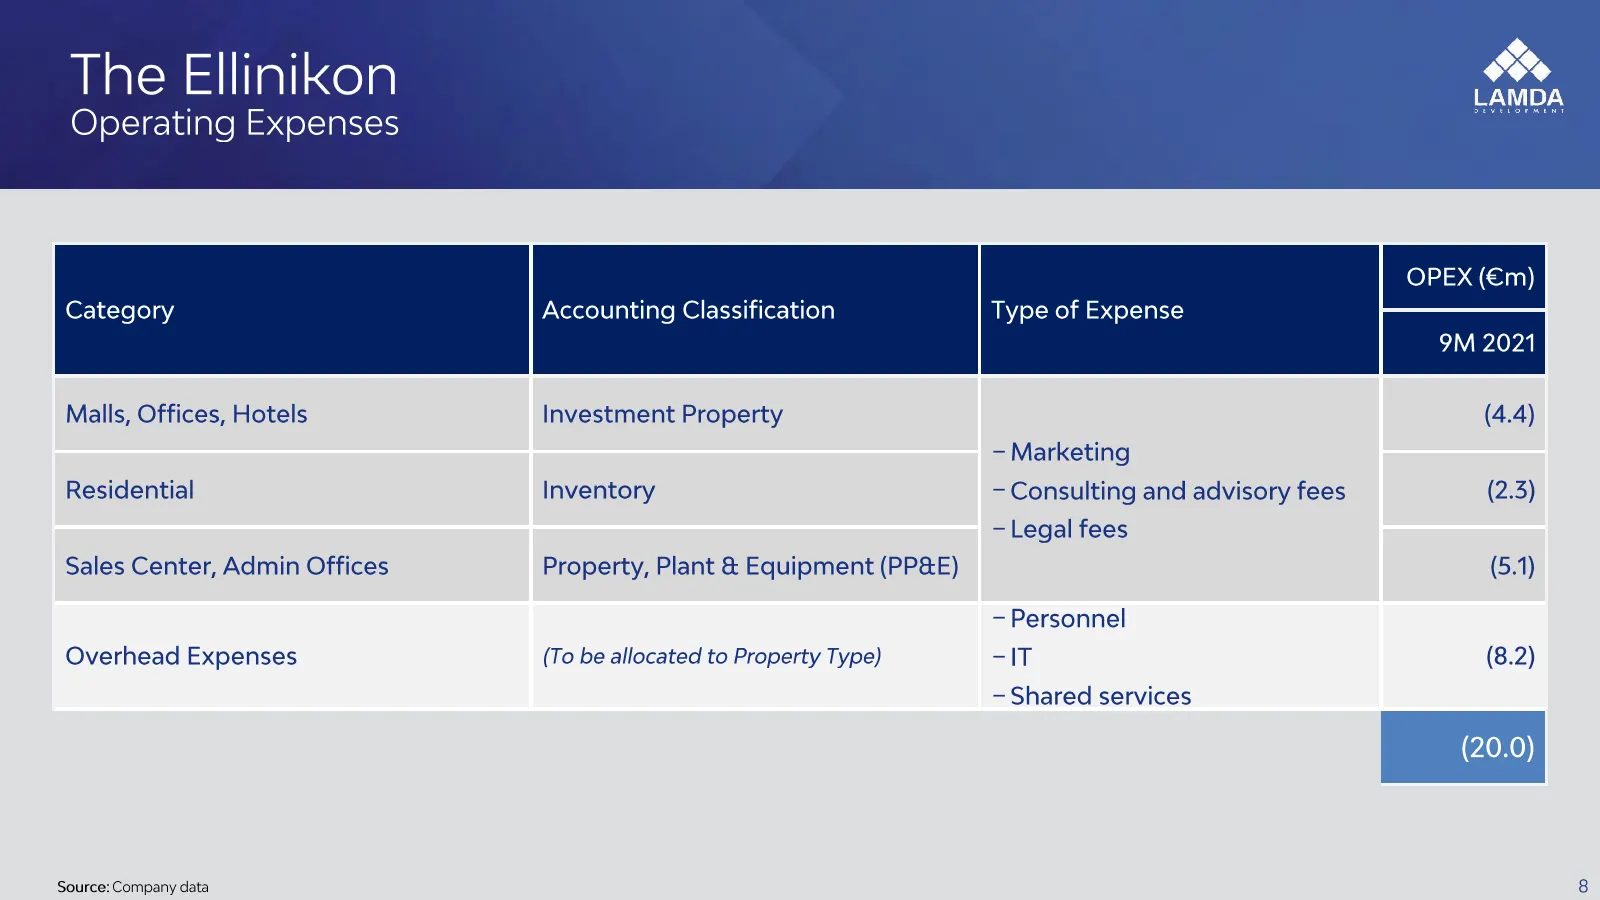
The Ellinikon Operating Expenses Category Malls, Offices, Hotels Residential Sales Center, Admin Offices Overhead Expenses Source: Company data Accounting Classification Type of Expense Investment Property - Marketing Inventory - Consulting and advisory fees - Legal fees Property, Plant & Equipment
Slide 9: The Ellinikon - CAPEX incurred
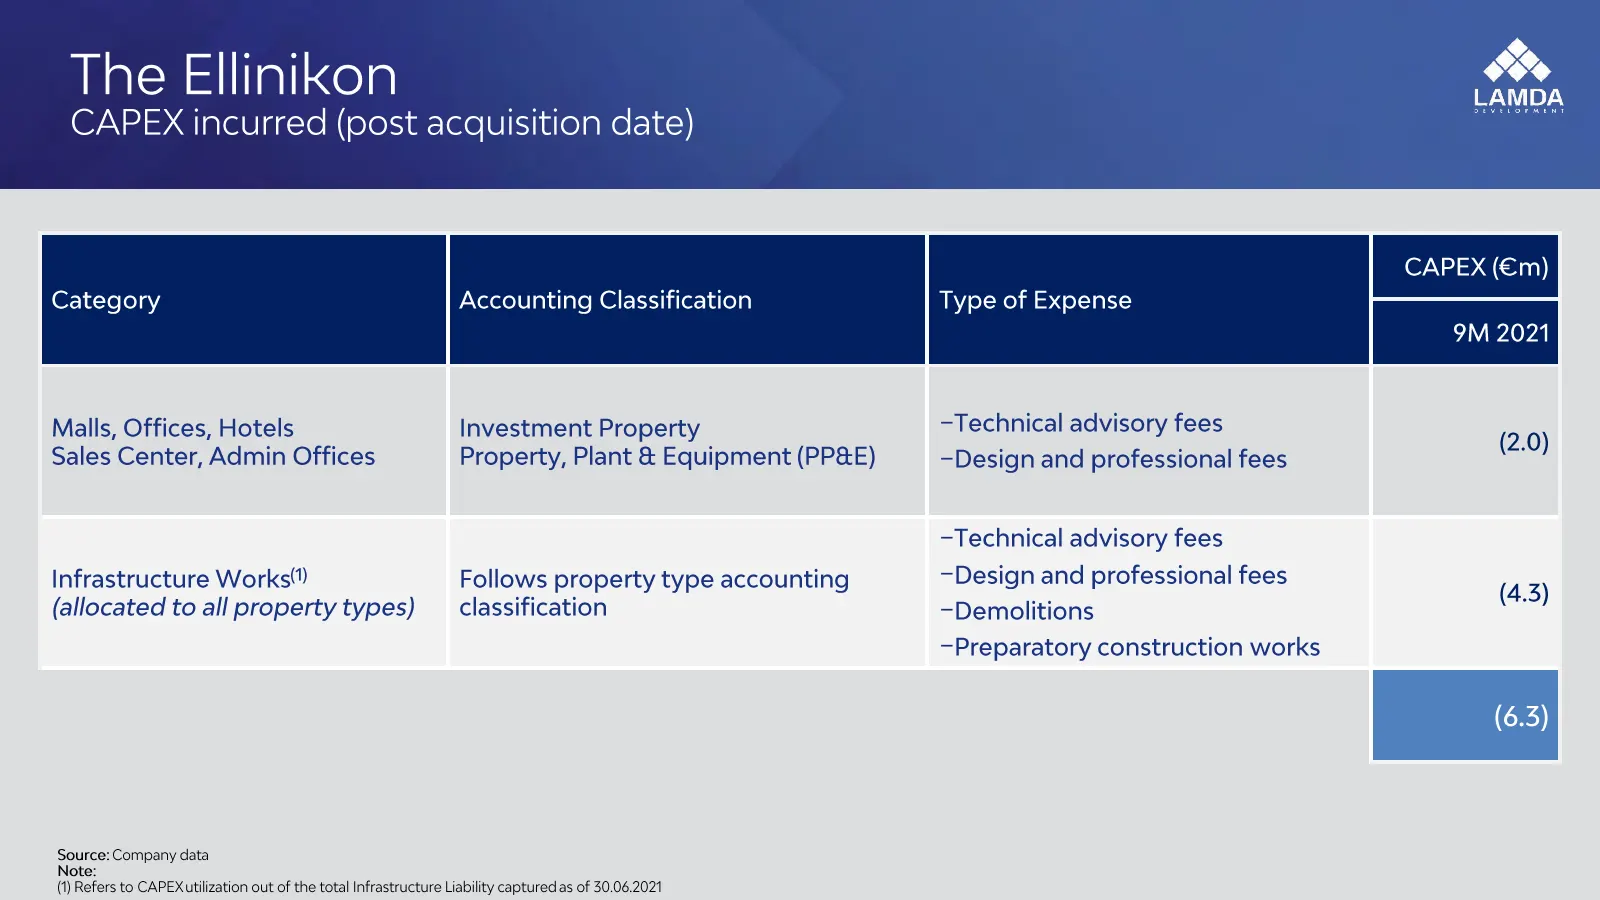
The Ellinikon CAPEX incurred (post acquisition date) Category Accounting Classification Type of Expense Malls, Offices, Hotels Investment Property Technical advisory fees (2.0) Sales Center, Admin Offices Property, Plant & Equipment (PP&E) —Design and professional fees . -Technical advisory fees Inf
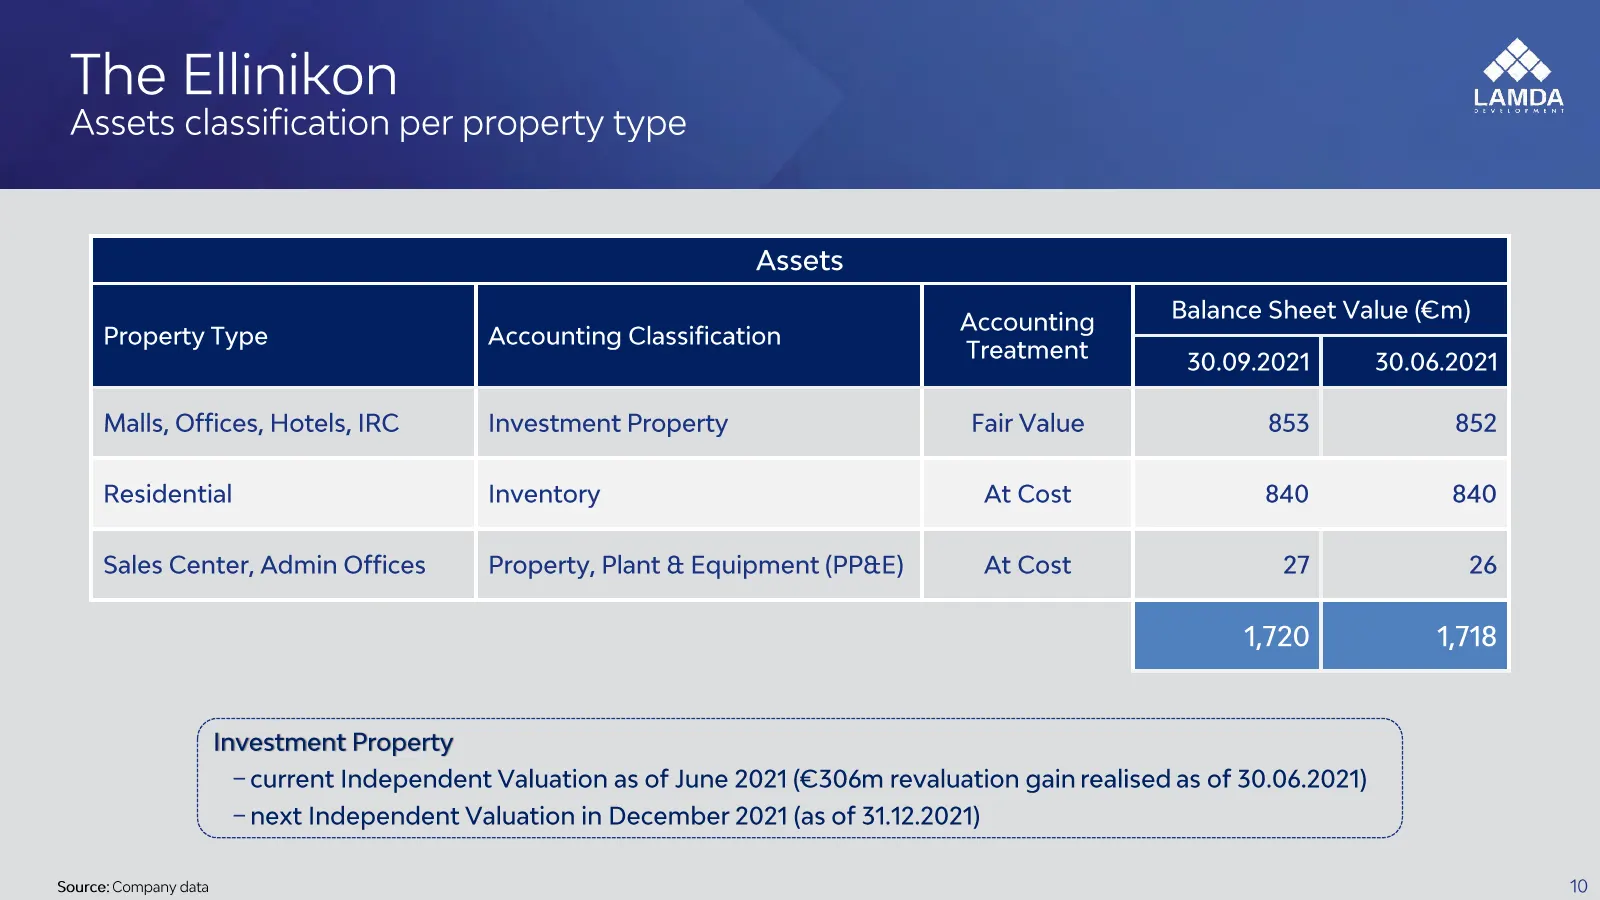
Slide 10: The Ellinikon - Assets classification per property type
The Ellinikon Assets classification per property type Accounting lance Sheet Value (€m) Property Type Accounting Classification TRCEHNEN 30.09.2021] 30.06.2021 853 Malls, Offices, Hotels, IRC Investment Property Fair Value 852 Residential Inventory At Cost 840 840 Sales Center, Admin Offices Propert

Slide 11: 3. Shopping Malls
3. SHOPPING MALLS
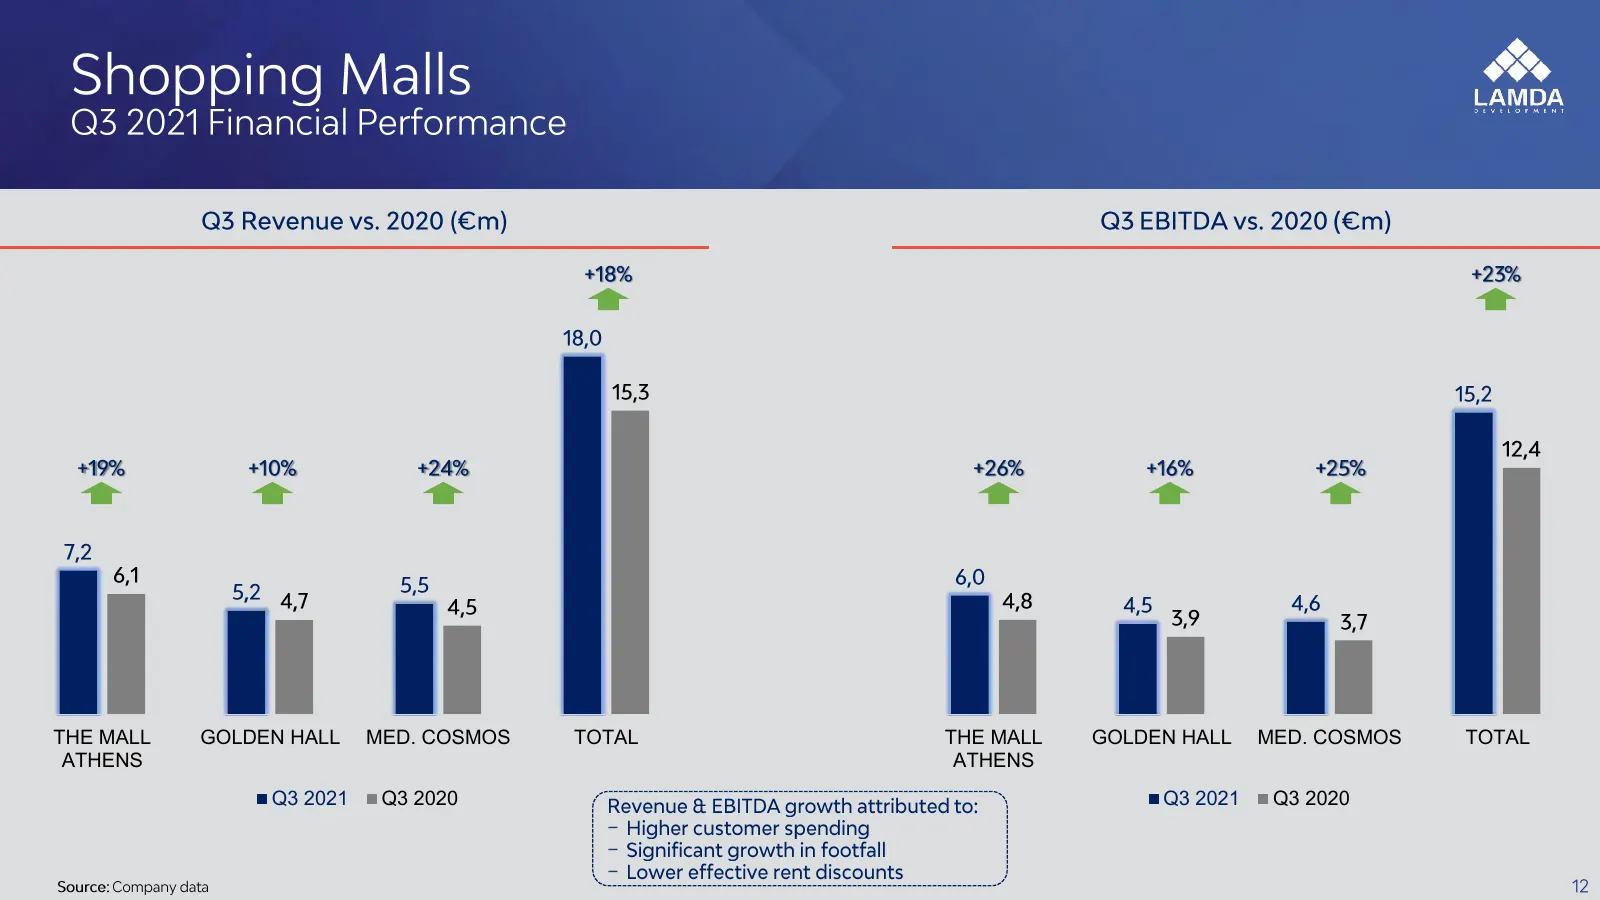
Slide 12: The Mall Athens, Golden Hall, Med. Cosmos
THE MALL GOLDEN HALL MED. COSMOS TOTAL THE MALL GOLDEN HALL MED. COSMOS TOTAL ATHENS ATHENS Q3 2021 Q3 2020 Q3 2021 Q3 2020 – – –
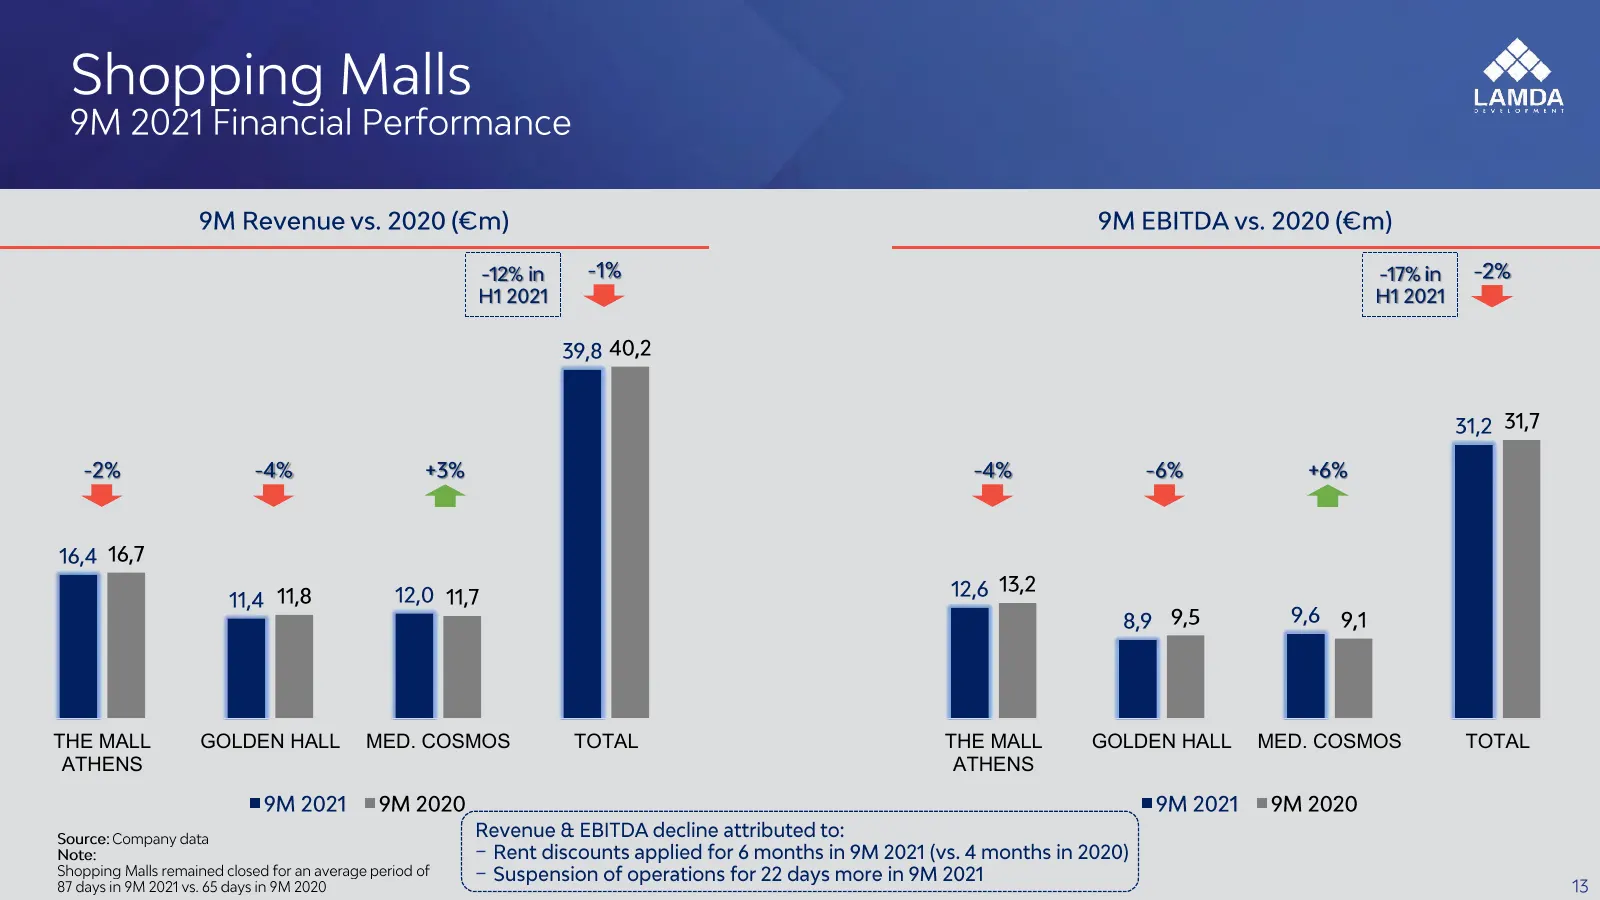
Slide 13: The Mall Athens, Golden Hall, Med. Cosmos
THE MALL GOLDEN HALL MED. COSMOS TOTAL THE MALL GOLDEN HALL MED. COSMOS TOTAL ATHENS ATHENS – –
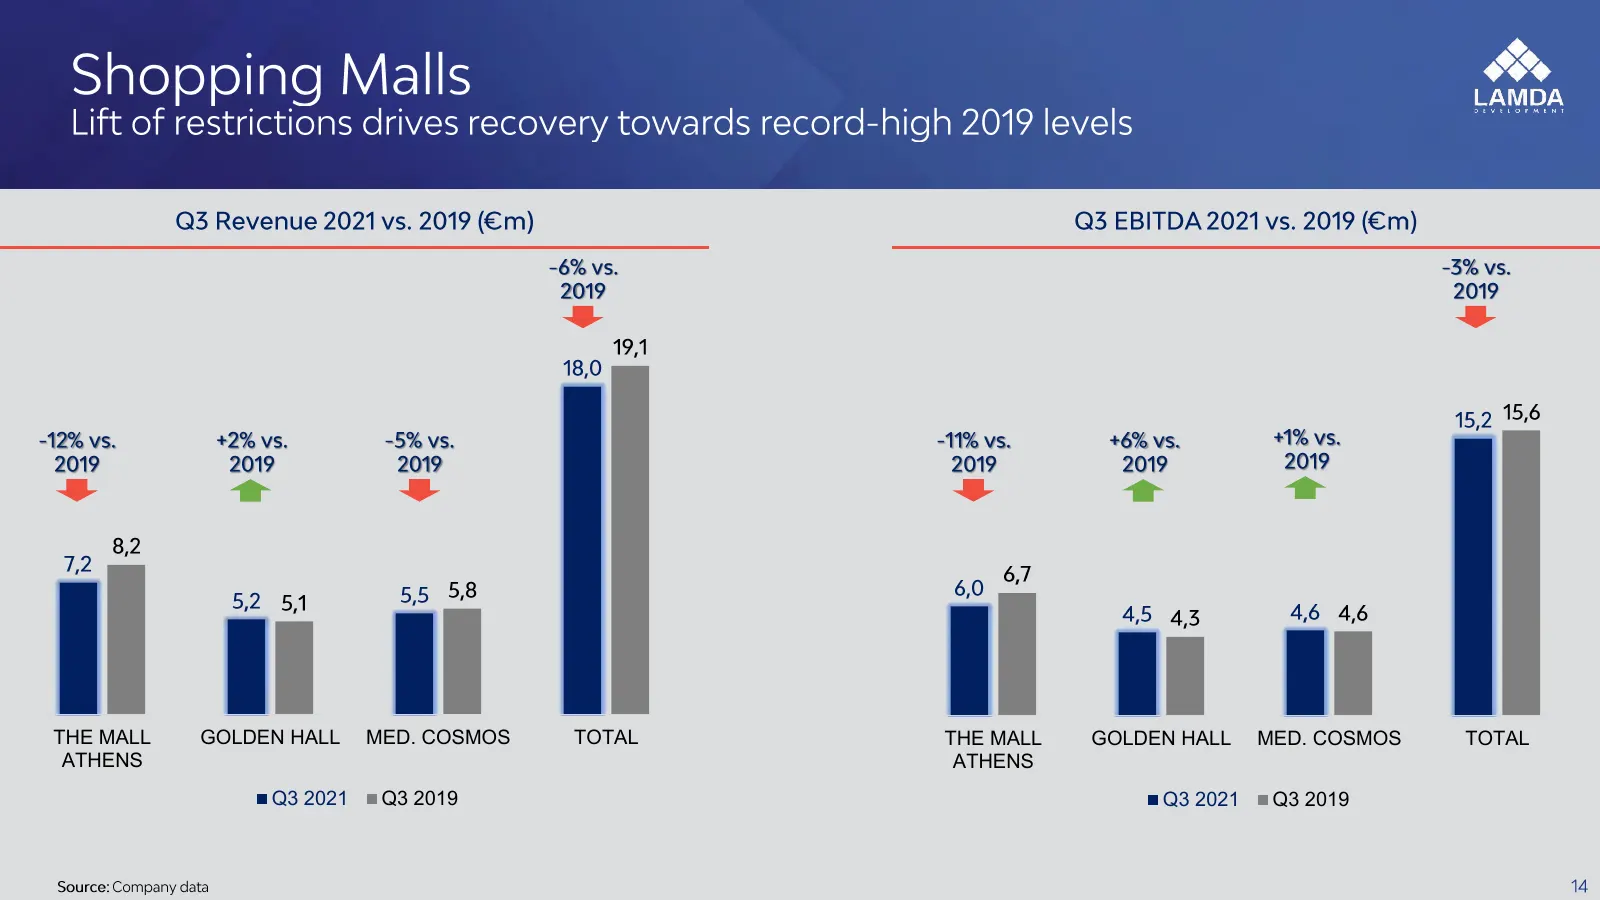
Slide 14: The Mall Athens, Golden Hall, Med. Cosmos
THE MALL GOLDEN HALL MED. COSMOS TOTAL THE MALL GOLDEN HALL MED. COSMOS TOTAL ATHENS ATHENS Q3 2021 Q3 2019 Q3 2021 Q3 2019
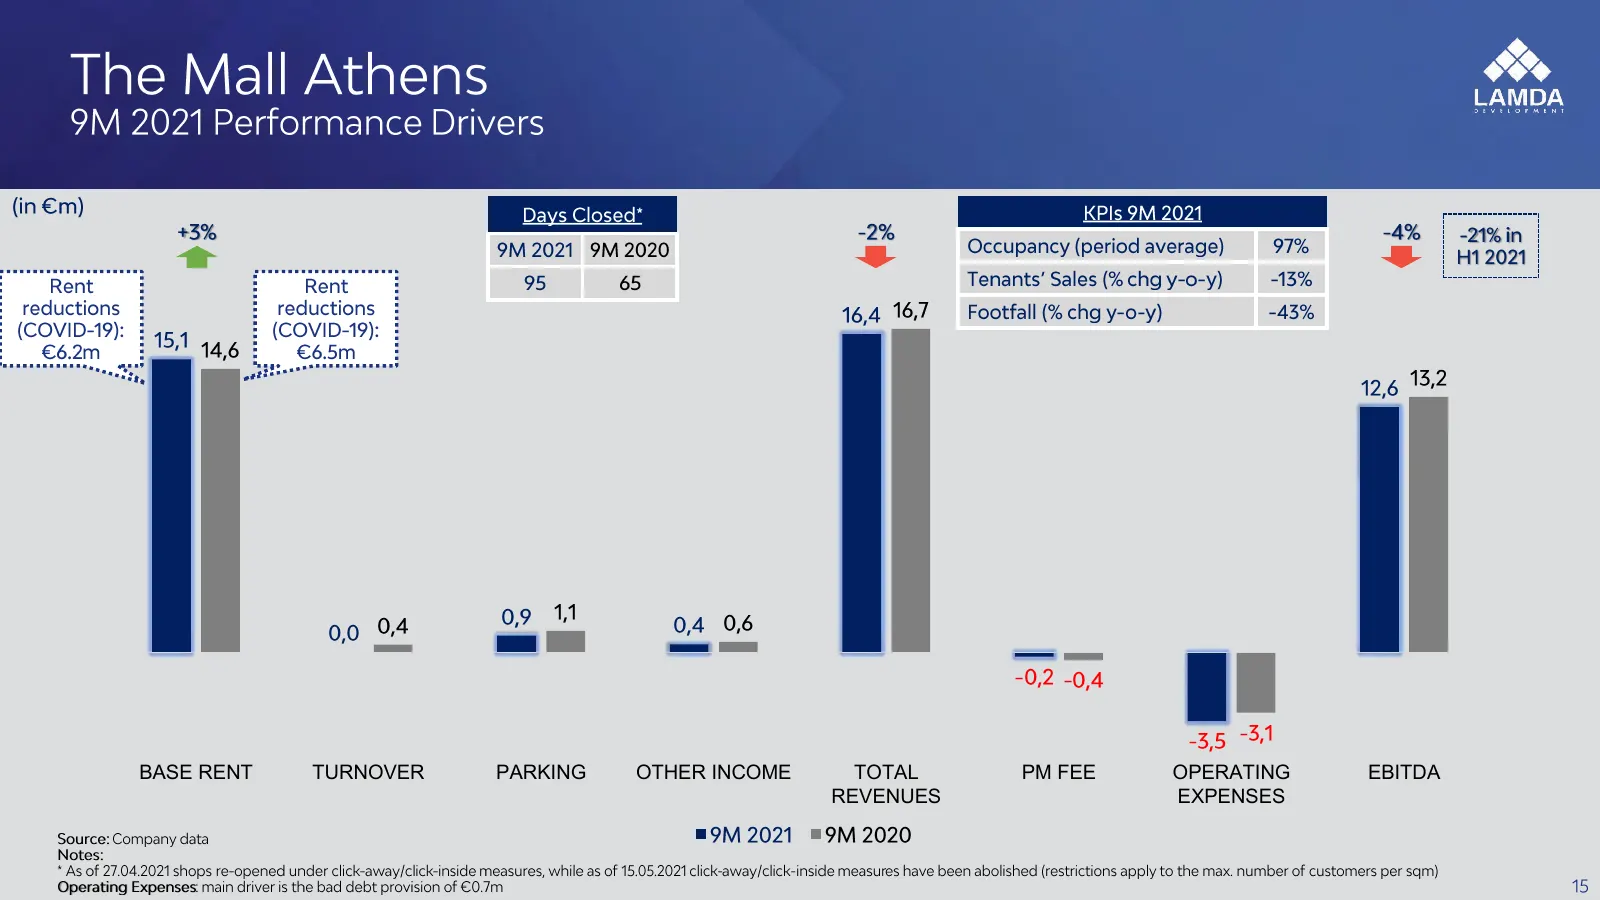
Slide 15: The Mall Athens revenues and EBITDA
BASE RENT TURNOVER PARKING OTHER INCOME TOTAL PM FEE OPERATING EBITDA REVENUES EXPENSES
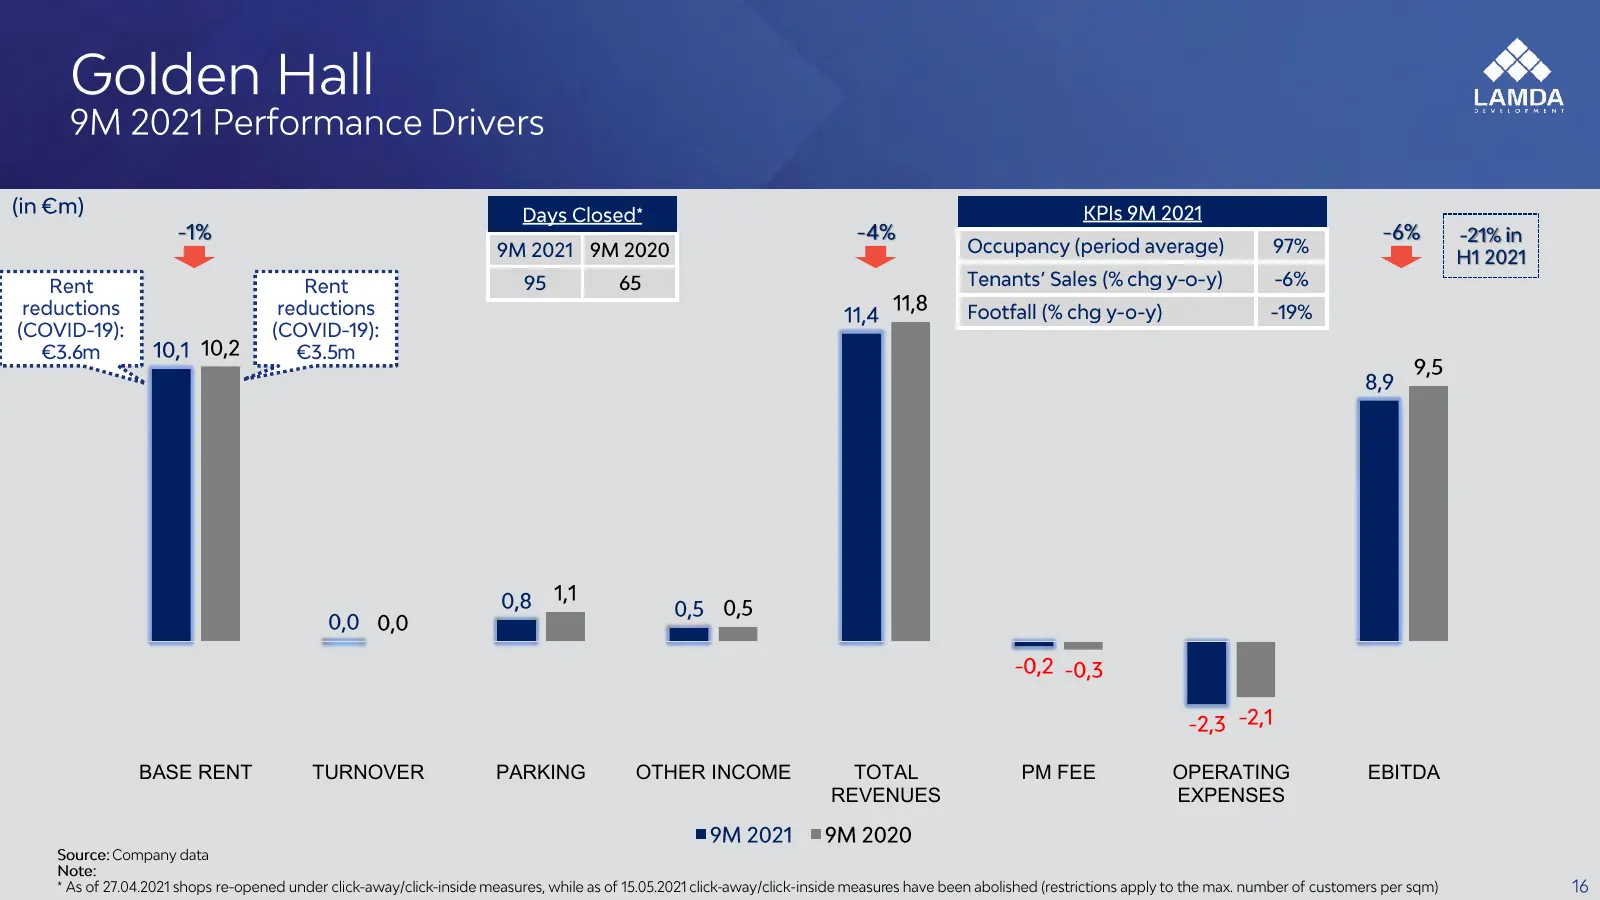
Slide 16: Golden Hall revenues and EBITDA
BASE RENT TURNOVER PARKING OTHER INCOME TOTAL PM FEE OPERATING EBITDA REVENUES EXPENSES
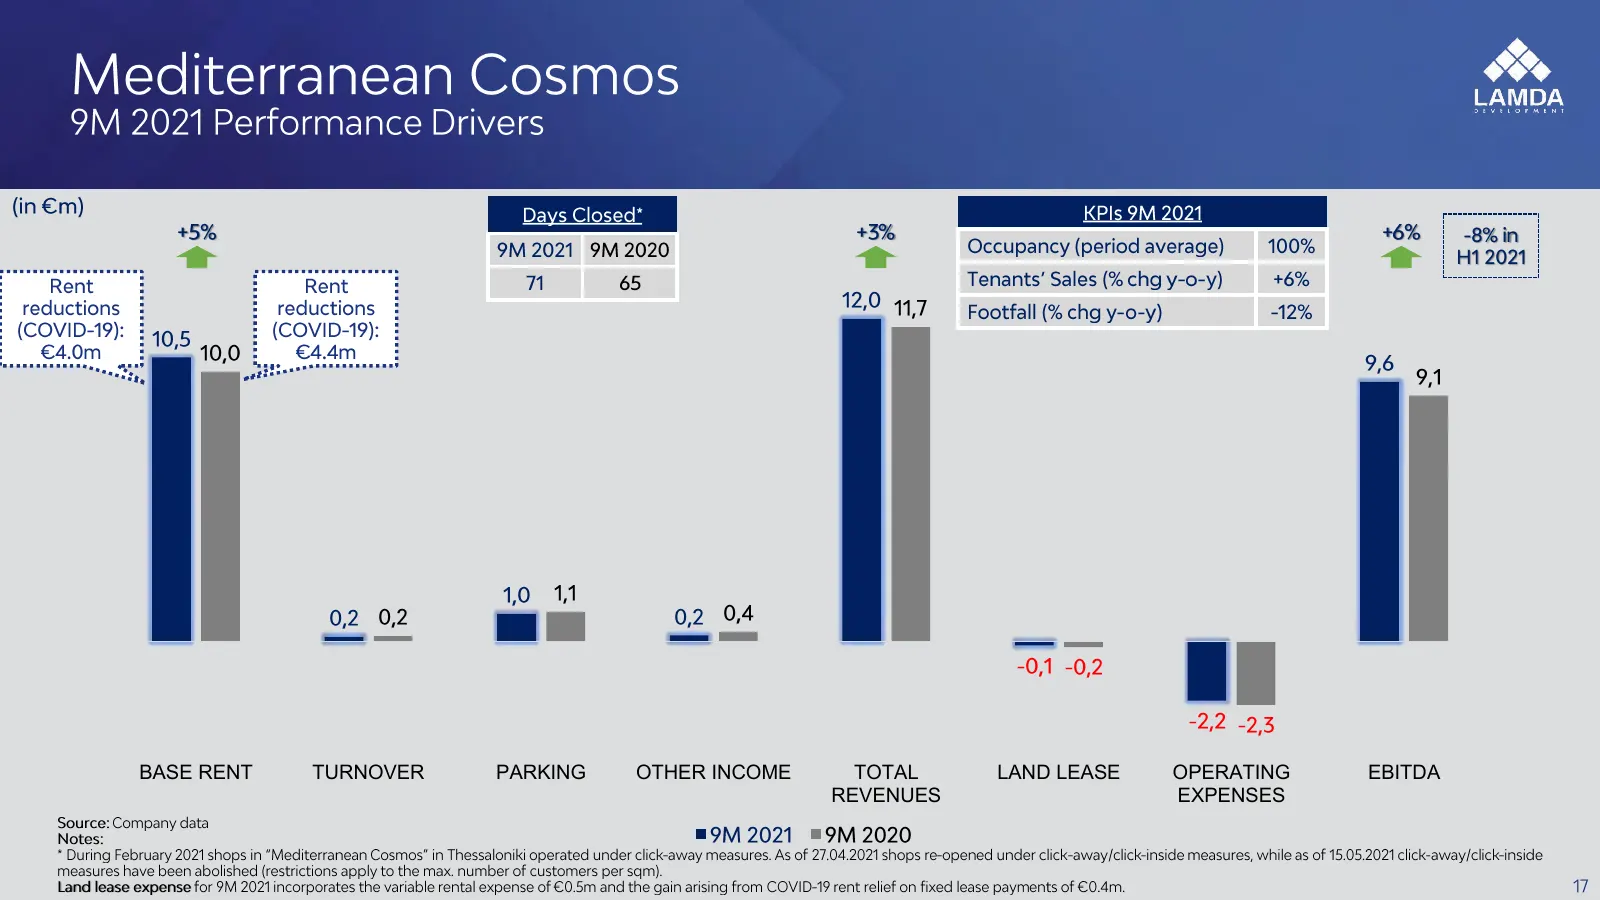
Slide 17: Med. Cosmos revenues and EBITDA
BASE RENT TURNOVER PARKING OTHER INCOME TOTAL LAND LEASE OPERATING EBITDA REVENUES EXPENSES
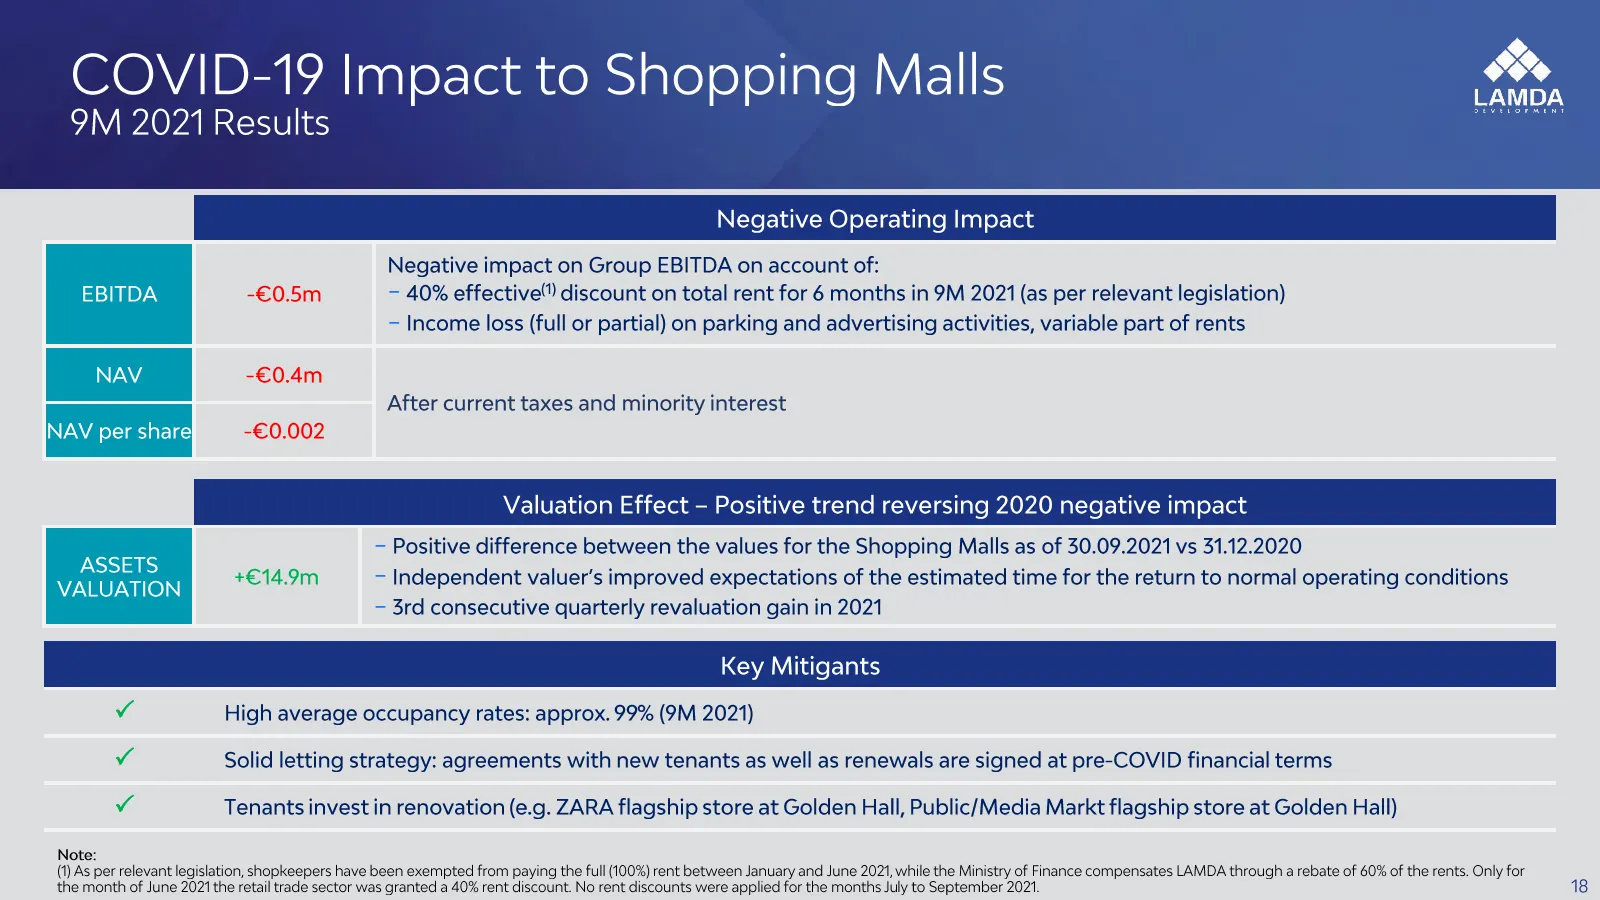
Slide 18: COVID-19 Impact to Shopping Malls
COVID-19 Impact to Shopping Malls 9M 2021 Results Negative Operating Impact Negative impact on Group EBITDA on account of: -€0.5m — 40% effective discount on total rent for 6 months in 9M 2021 (as per relevant legislation) — Income loss (full or partial) on parking and advertising activities, variab
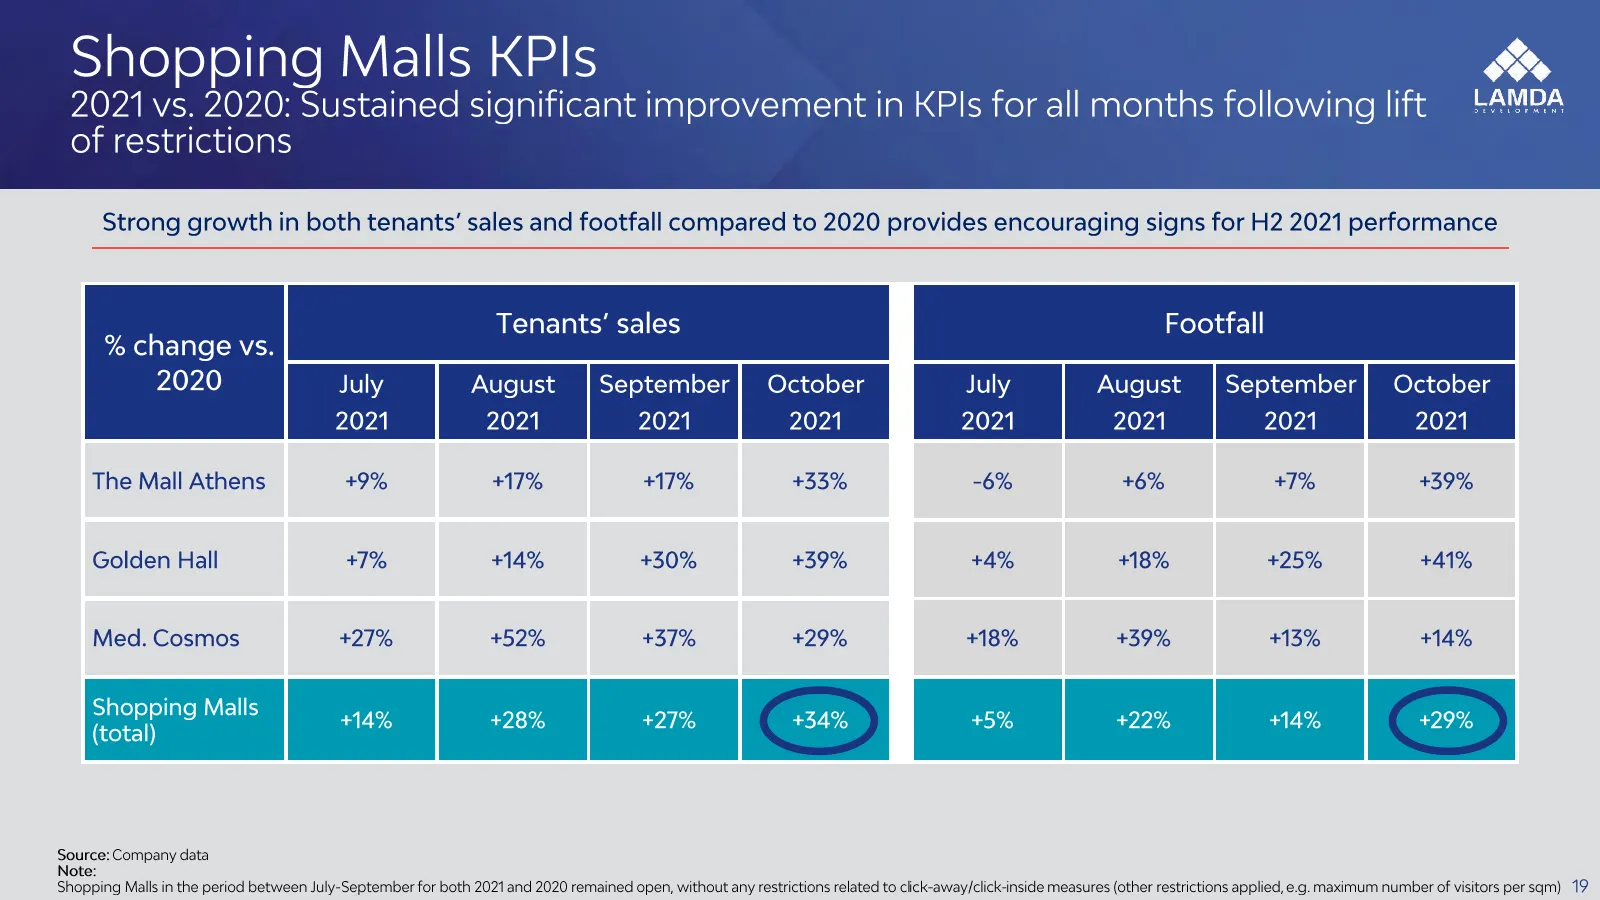
Slide 19: Shopping Malls KPIs (2021 vs. 2020)
Shopping Malls KPIs 2021 vs. 2020: Sustained significant improvement in KPIs for all months following lift of restrictions Strong growth in both tenants’ sales and footfall compared to 2020 provides encouraging signs for H2 2021 performance Tenants’ sales Footfall % change vs. 2020 July gust |Septem
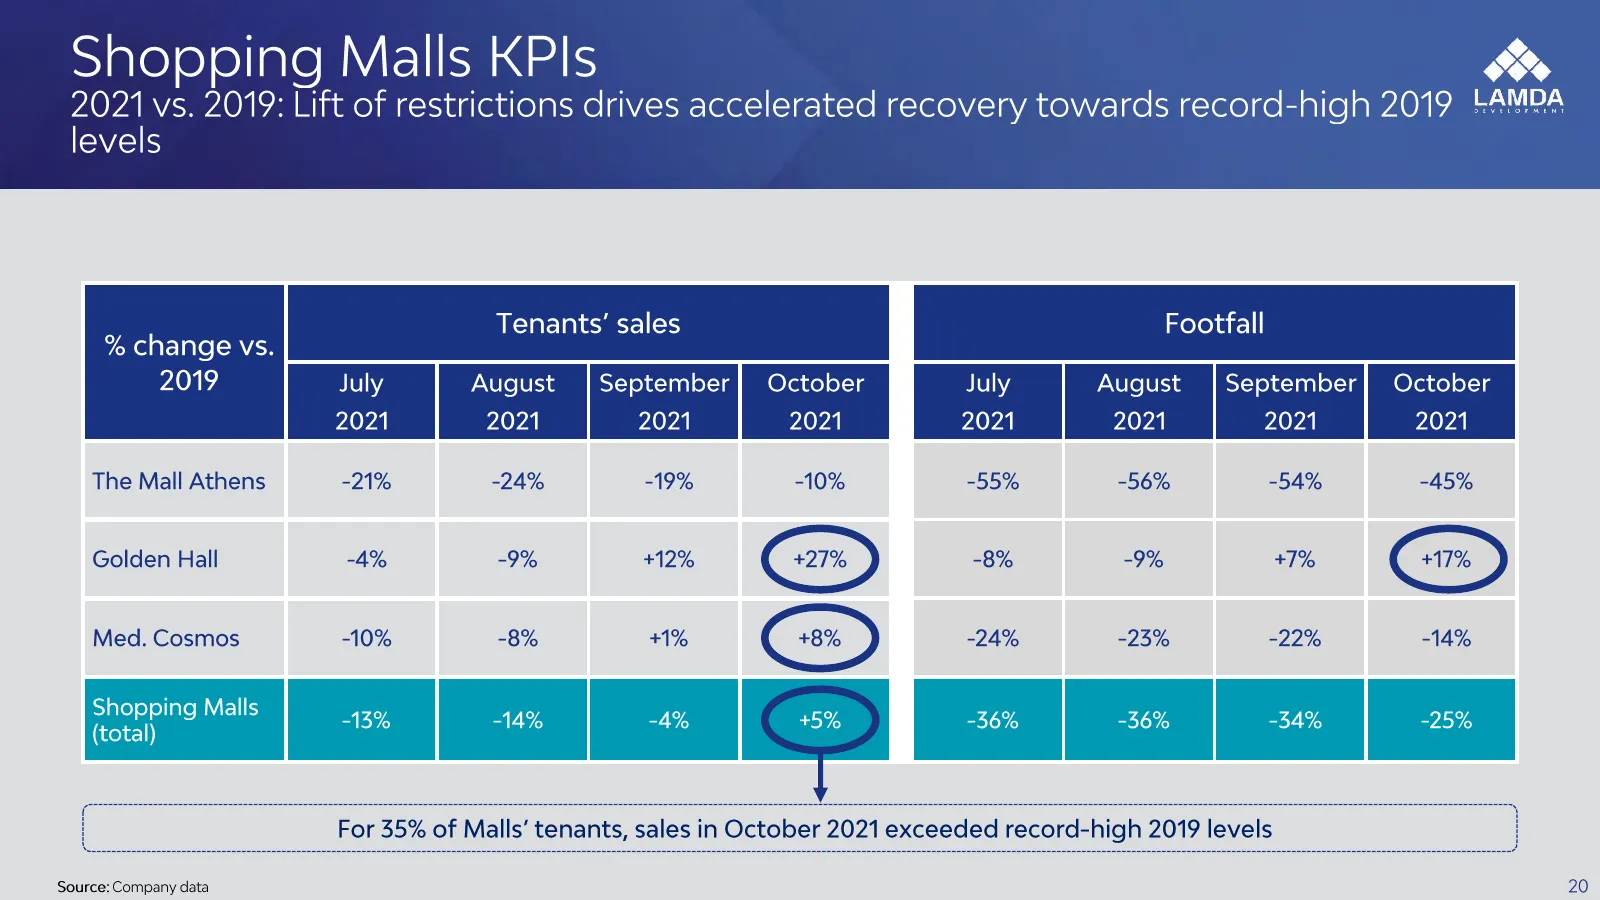
Slide 20: Shopping Malls KPIs (2021 vs. 2019)
Shopping Malls KPIs roo 2021 vs. 2019: Lift of restrictions drives accelerated recovery towards record-high 2019 LAM levels Tenants’ sales Footfall % change vs. 2019 July August | Septe: October July August | Septe r}| October 2021 2021 2021 2021 2021 2021 2021 2021 The Mall Athens -21% -24% -19% -1
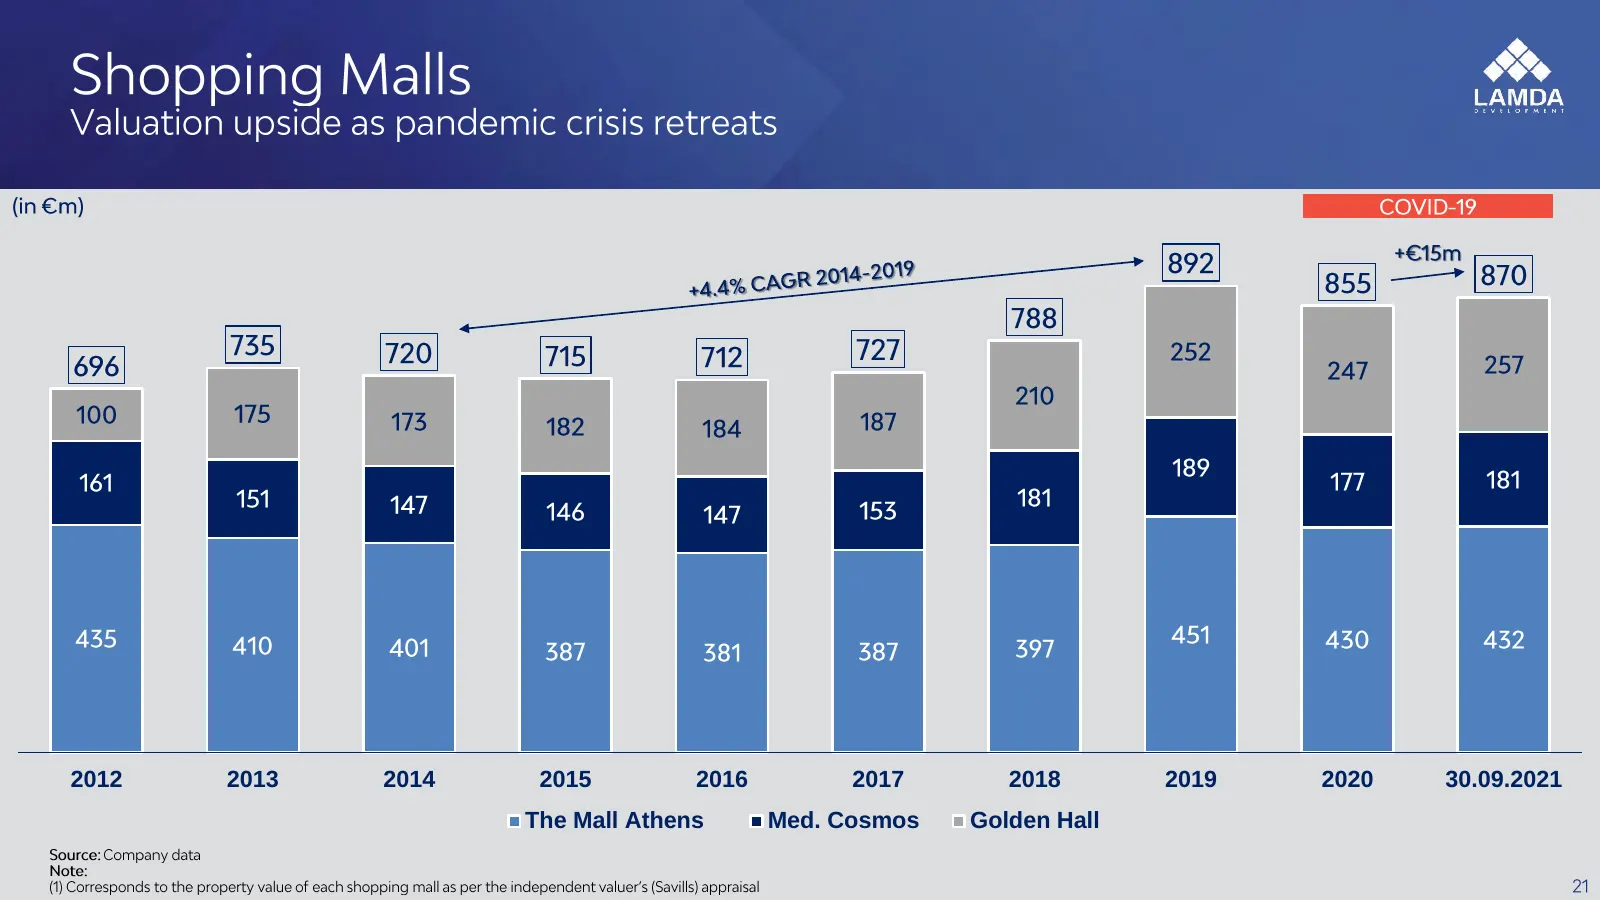
Slide 21: Shopping Malls valuation 2012-2021
2012 2013 2014 2015 2016 2017 2018 2019 2020 30.09.2021 The Mall Athens Med. Cosmos Golden Hall
Slide 22: 4. Group - 9M 2021 Results
4. GROUP - 9M 2021 RESULTS
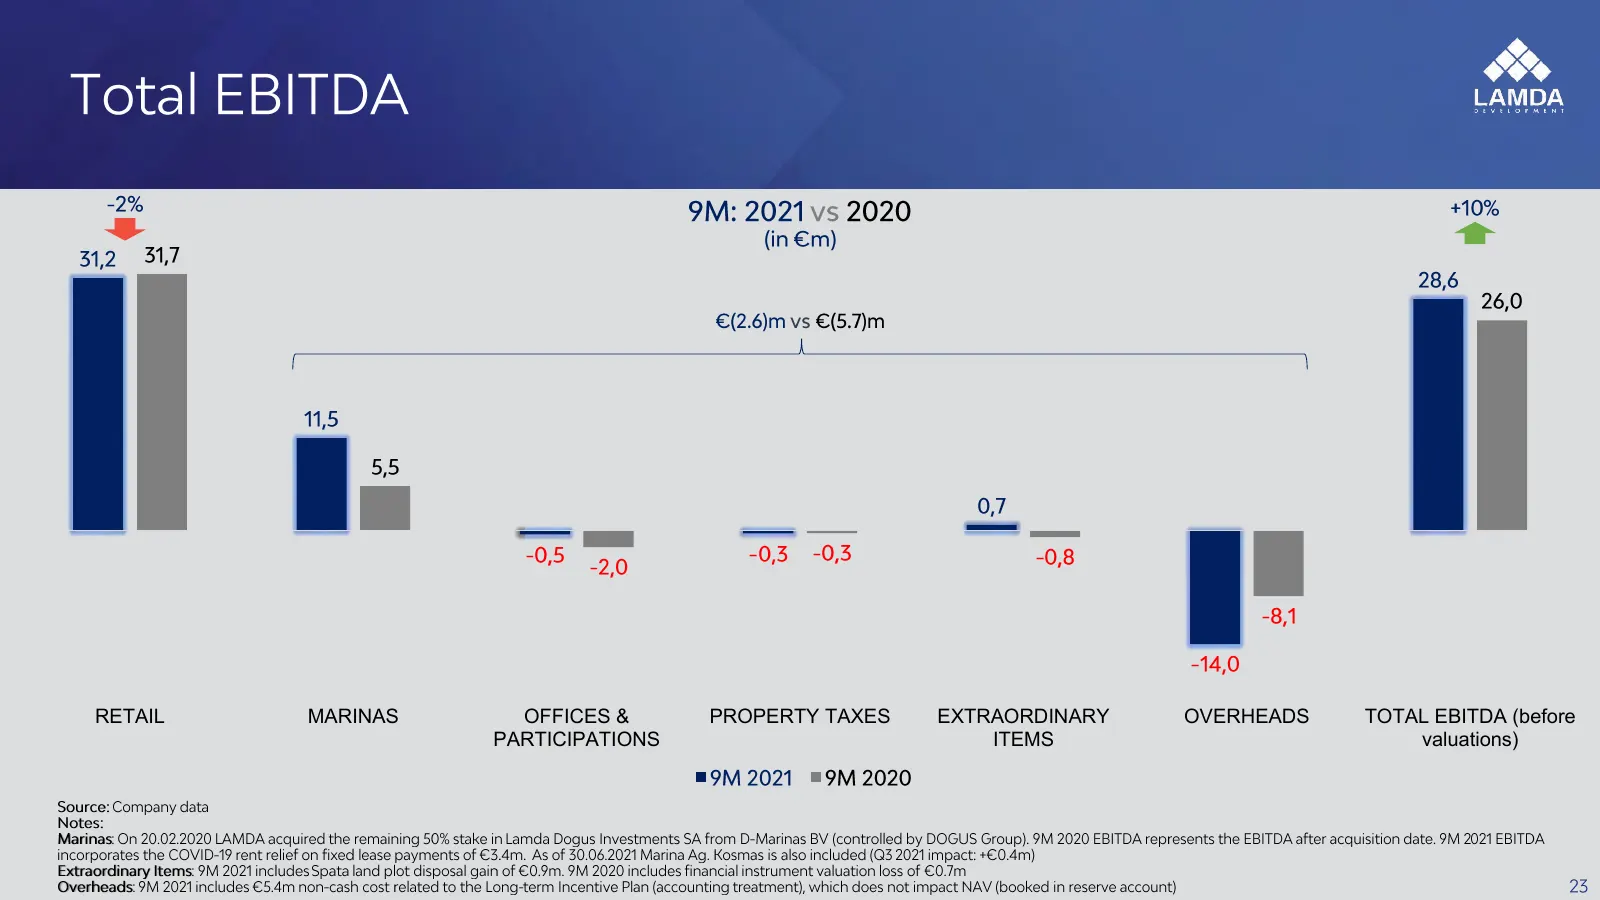
Slide 23: EBITDA before valuations by segment
RETAIL MARINAS OFFICES & PROPERTY TAXES EXTRAORDINARY OVERHEADS TOTAL EBITDA (before PARTICIPATIONS ITEMS valuations)
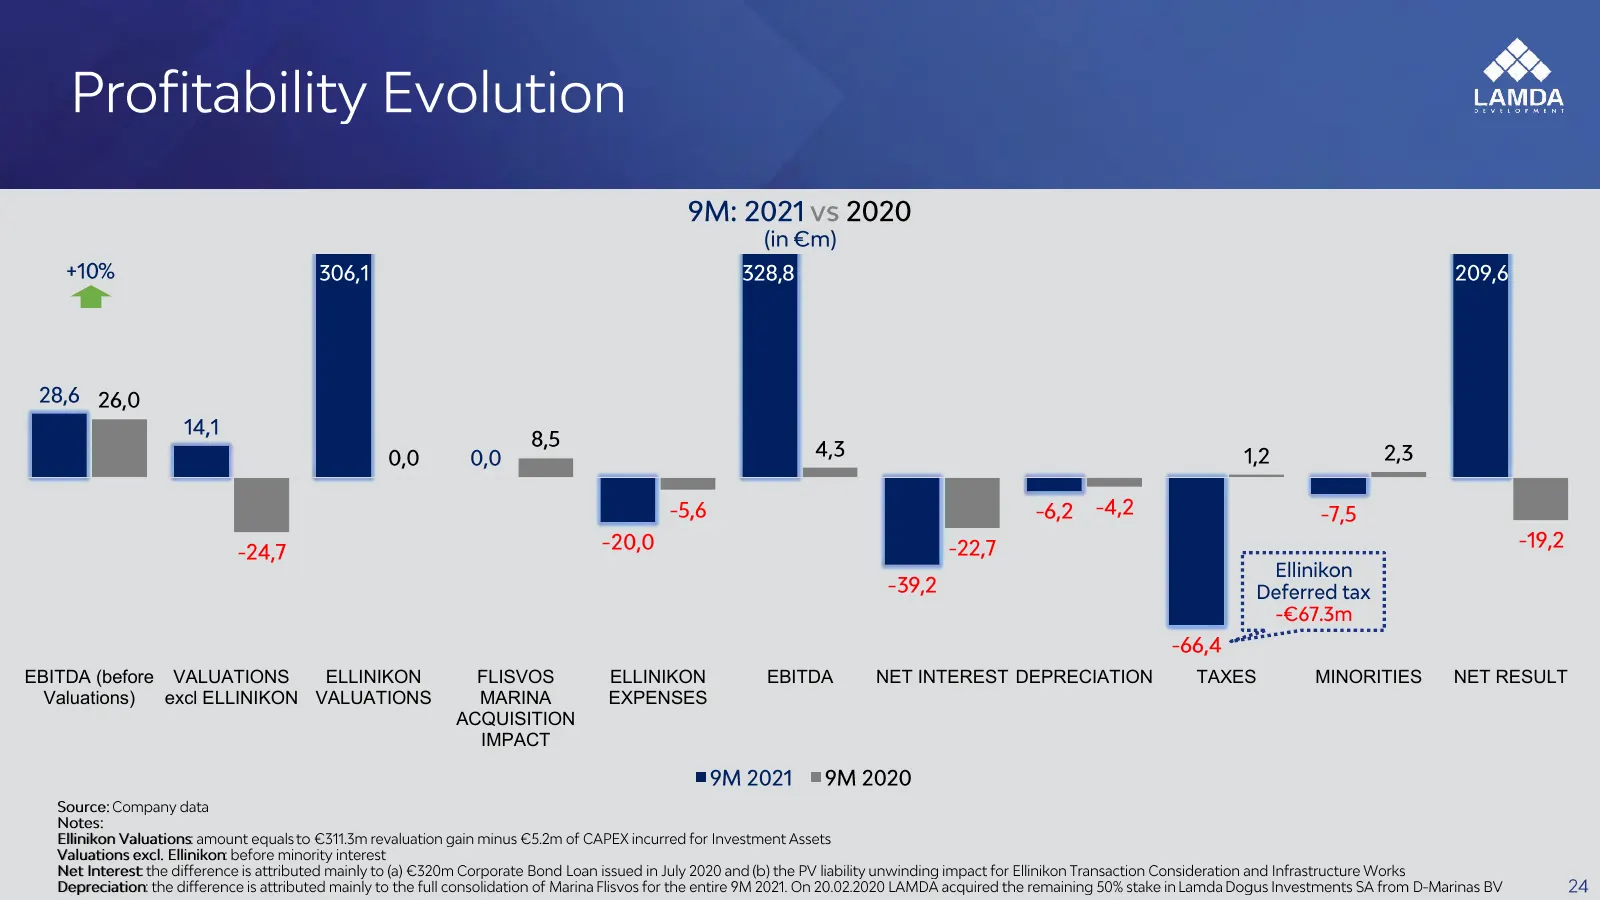
Slide 24: EBITDA to Net Result bridge
EBITDA (before VALUATIONS ELLINIKON FLISVOS ELLINIKON EBITDA NET INTEREST DEPRECIATION TAXES MINORITIES NET RESULT Valuations) excl ELLINIKON VALUATIONS MARINA EXPENSES ACQUISITION IMPACT
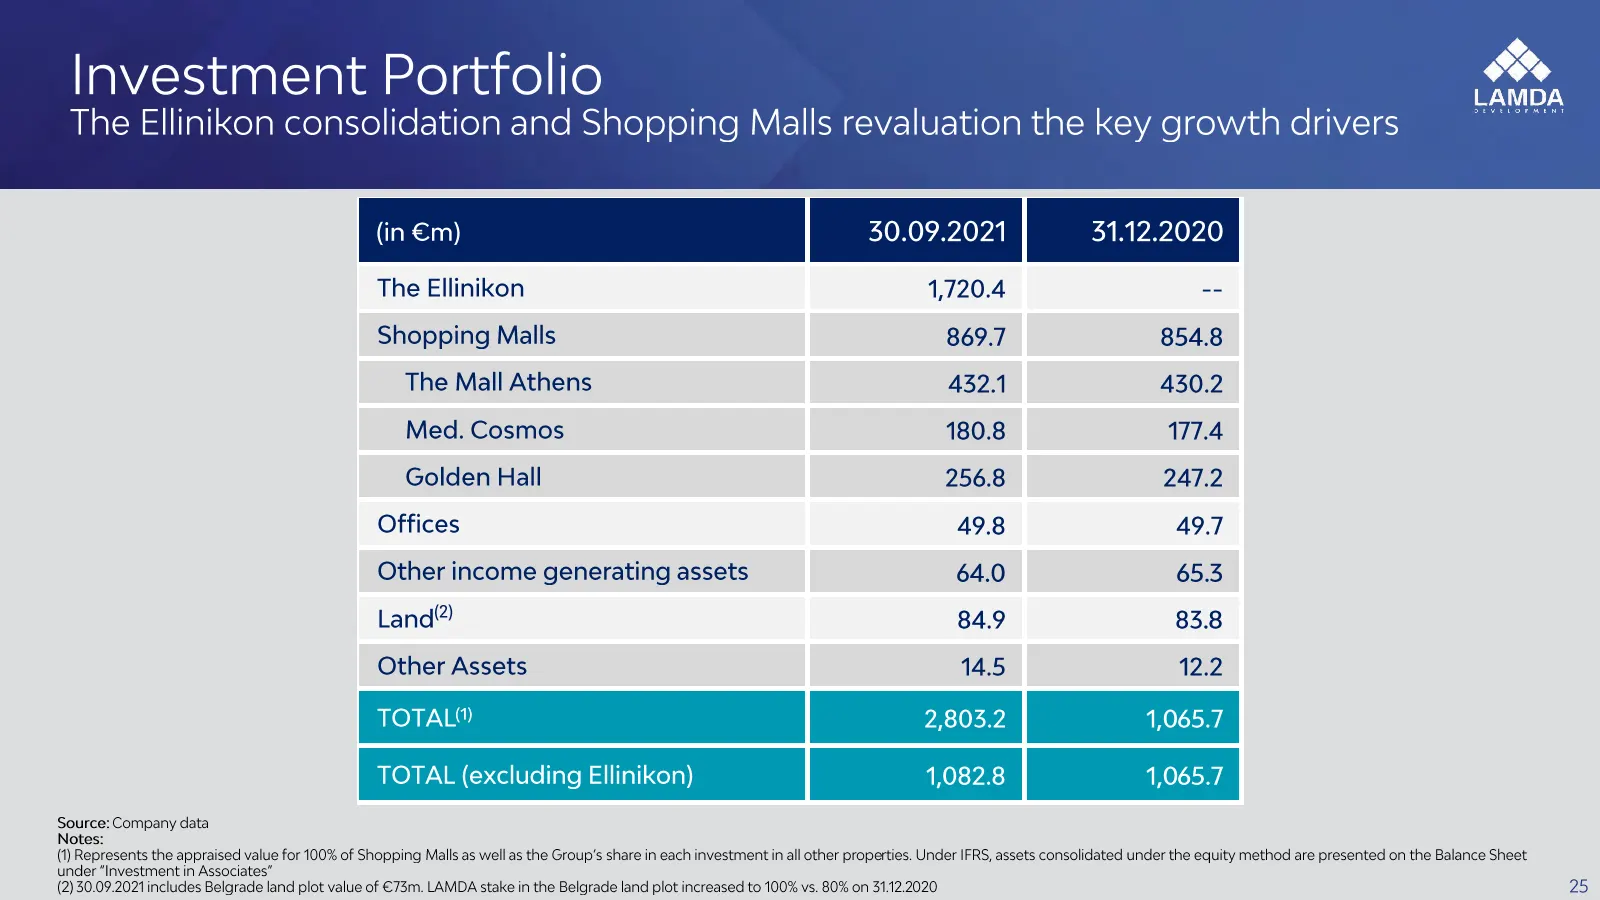
Slide 25: Investment Portfolio
Investment Portfolio The Ellinikon consolidation and Shopping Malls revaluation the key growth drivers The Ellinikon 1,720.4 = Shopping Malls 869.7 854.8 The Mall Athens 432.1 430.2 Med. Cosmos 180.8 171.4 Golden Hall 256.8 247.2 Offices 49.8 49.7 Other income generating assets 64.0 65.3 Land?) 84.9
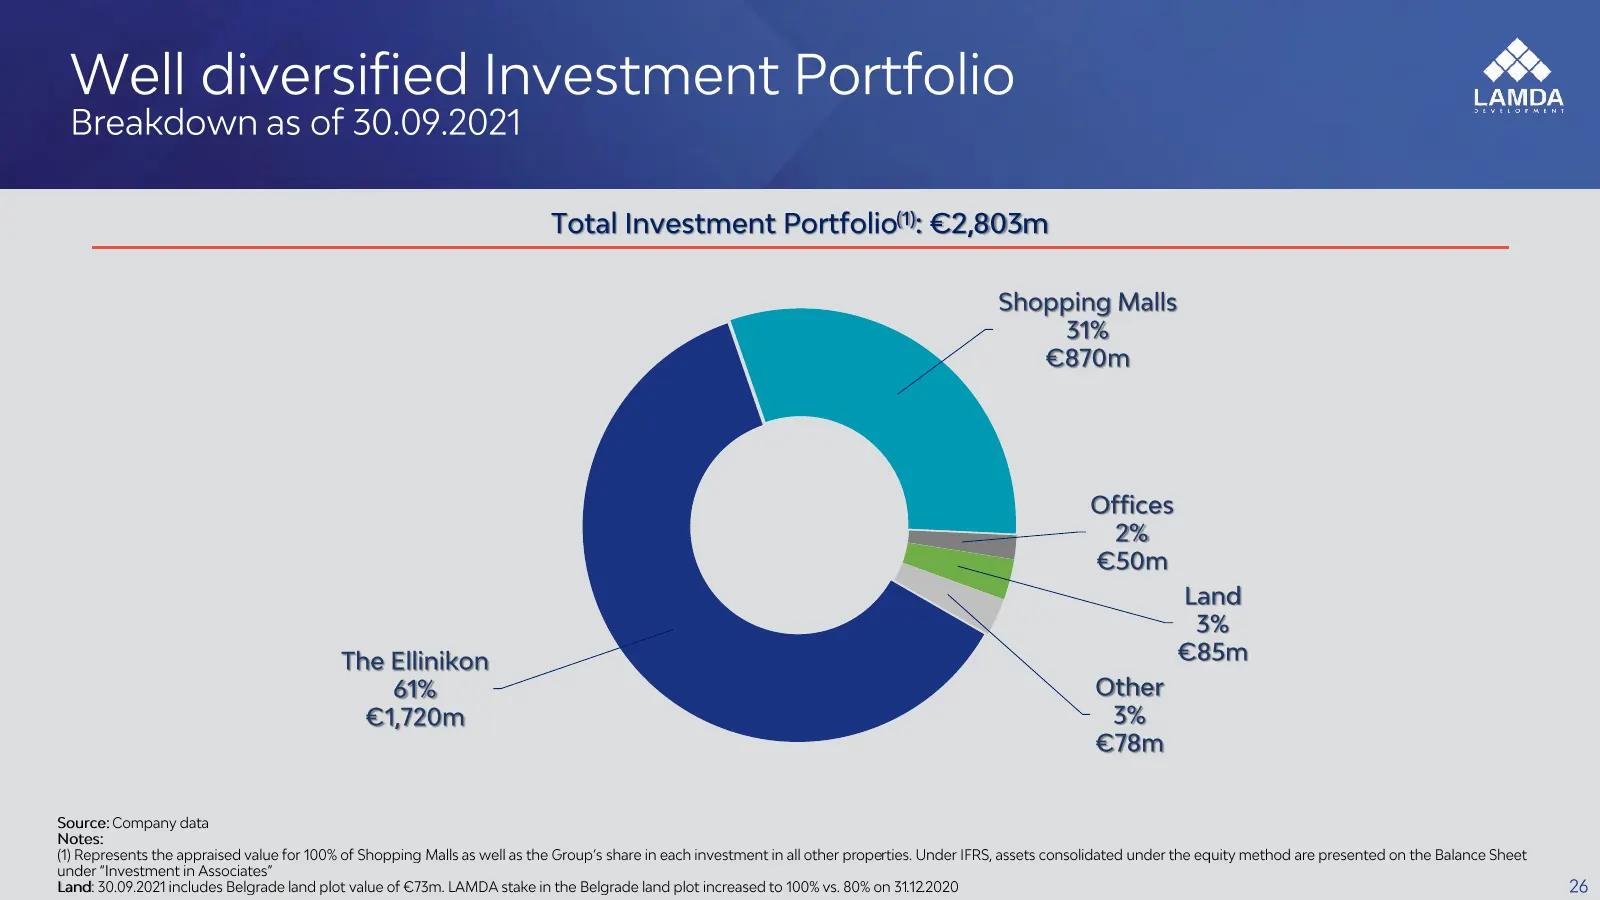
Slide 26: Well diversified Investment Portfolio
Well diversified Investment Portfolio Breakdown as of 30.09.2021 Total Investment Portfolio”: €2,803m Y Shopping Malls 31% €870m The Ellinikon €85m 61% Other €1,720m 3% €78m Source: Company data Notes: (1) Represents the appraised value for 100% of Shopping Malls as well as the Group's share in each
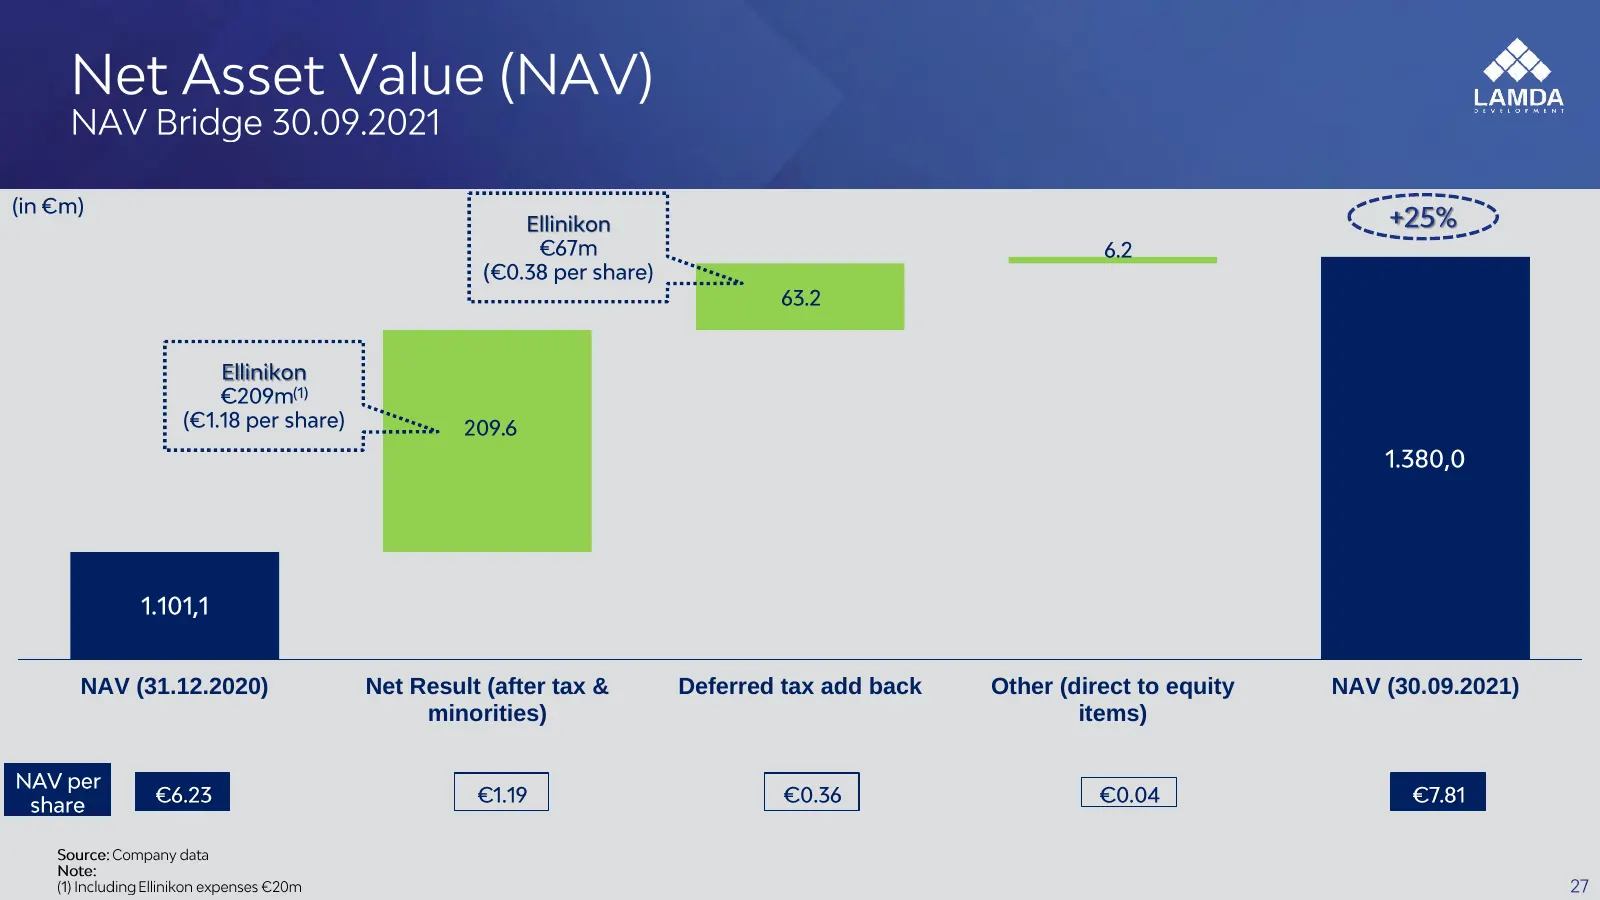
Slide 27: NAV bridge 31.12.2020 to 30.09.2021
NAV (31.12.2020) Net Result (after tax & Deferred tax add back Other (direct to equity NAV (30.09.2021) minorities) items)
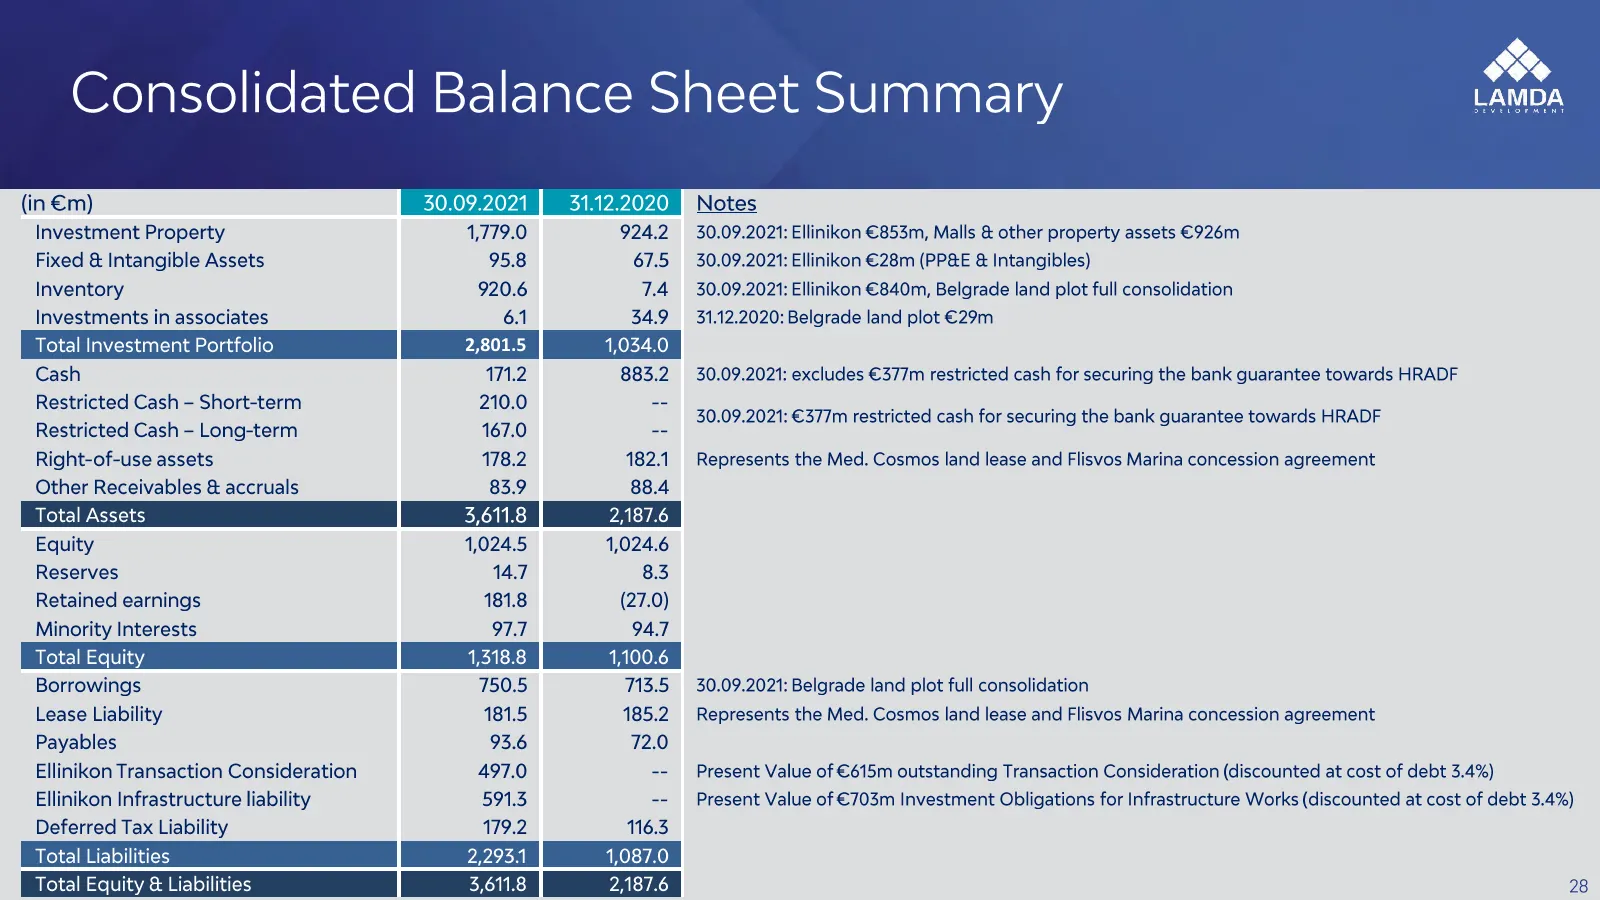
Slide 28: Consolidated Balance Sheet Summary
Consolidated Balance Sheet Summary (in €m) Notes Investment Property 1,779.0 924.2 30.09.2021: Ellinikon €853m, Malls & other property assets €926m. Fixed & Intangible Assets 95.8 67.5 30.09.2021: Ellinikon €28m (PP&E & Intangibles) Inventory 70 ‘ 7.4 30.09.2021: Ellinikon €840m, Belgrade land plot
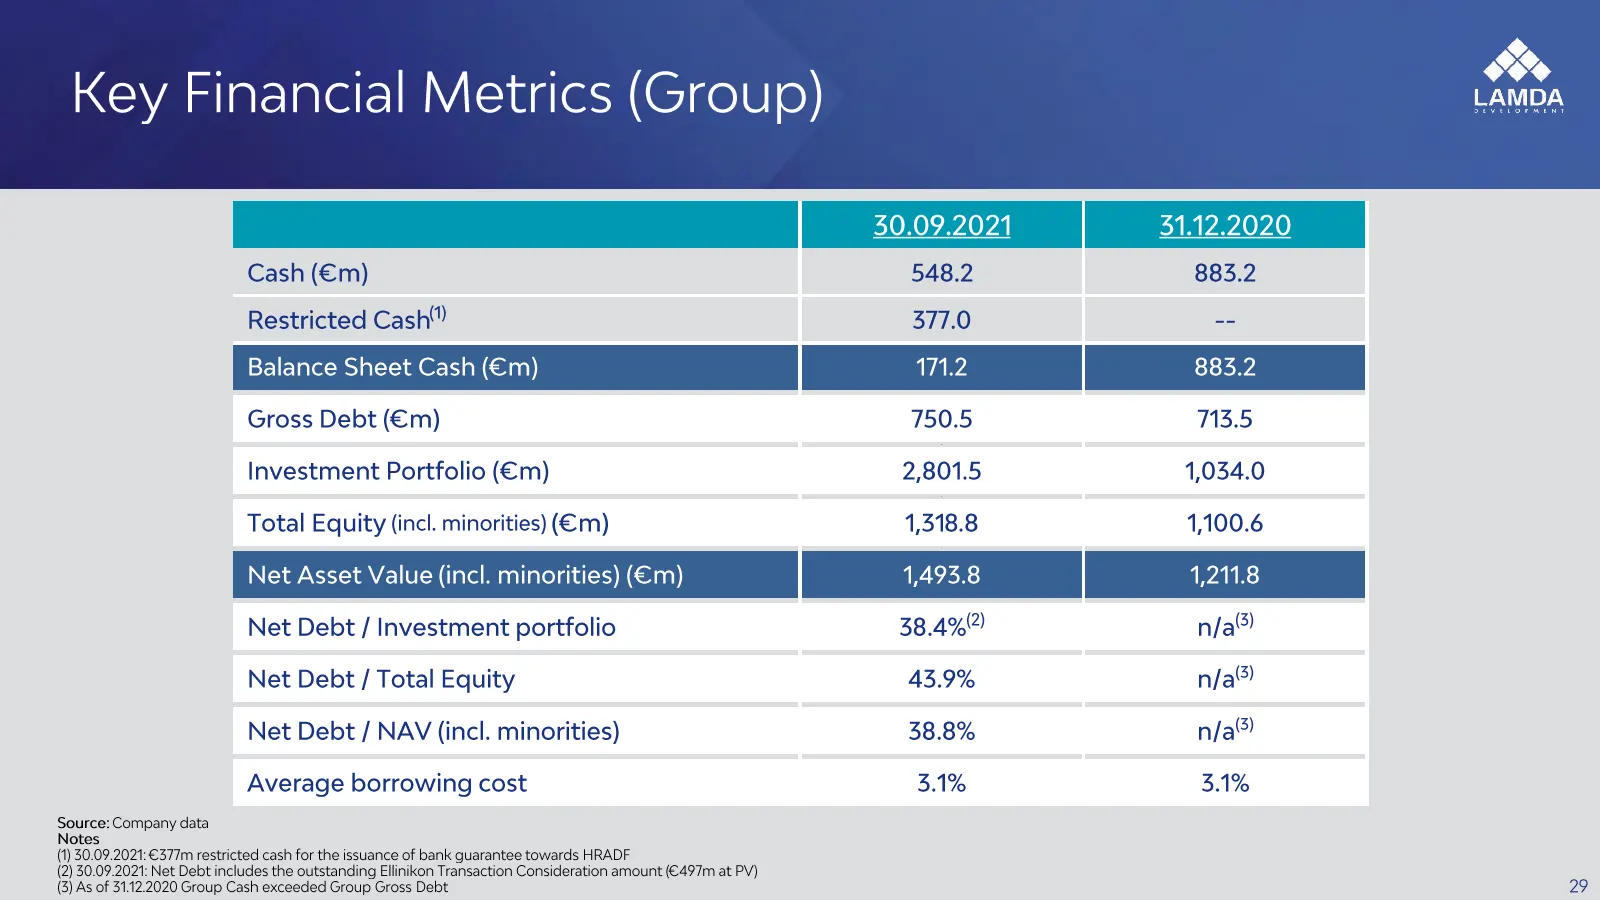
Slide 29: Key Financial Metrics (Group)
Key Financial Metrics (Group) Cash (€m) 548.2 883.2 Restricted Cash” 377.0 -- Gross Debt (€m) 750.5 713.5 Investment Portfolio (Em) 2,801.5 1,034.0 Total Equity (incl. minorities) (Em) 1,318.8 1,100.6 Net Debt / Investment portfolio 38.4%) n/a Net Debt / Total Equity 43.9% nf/a® Net Debt / NAV (incl
Slide 30: Appendix
APPENDIX
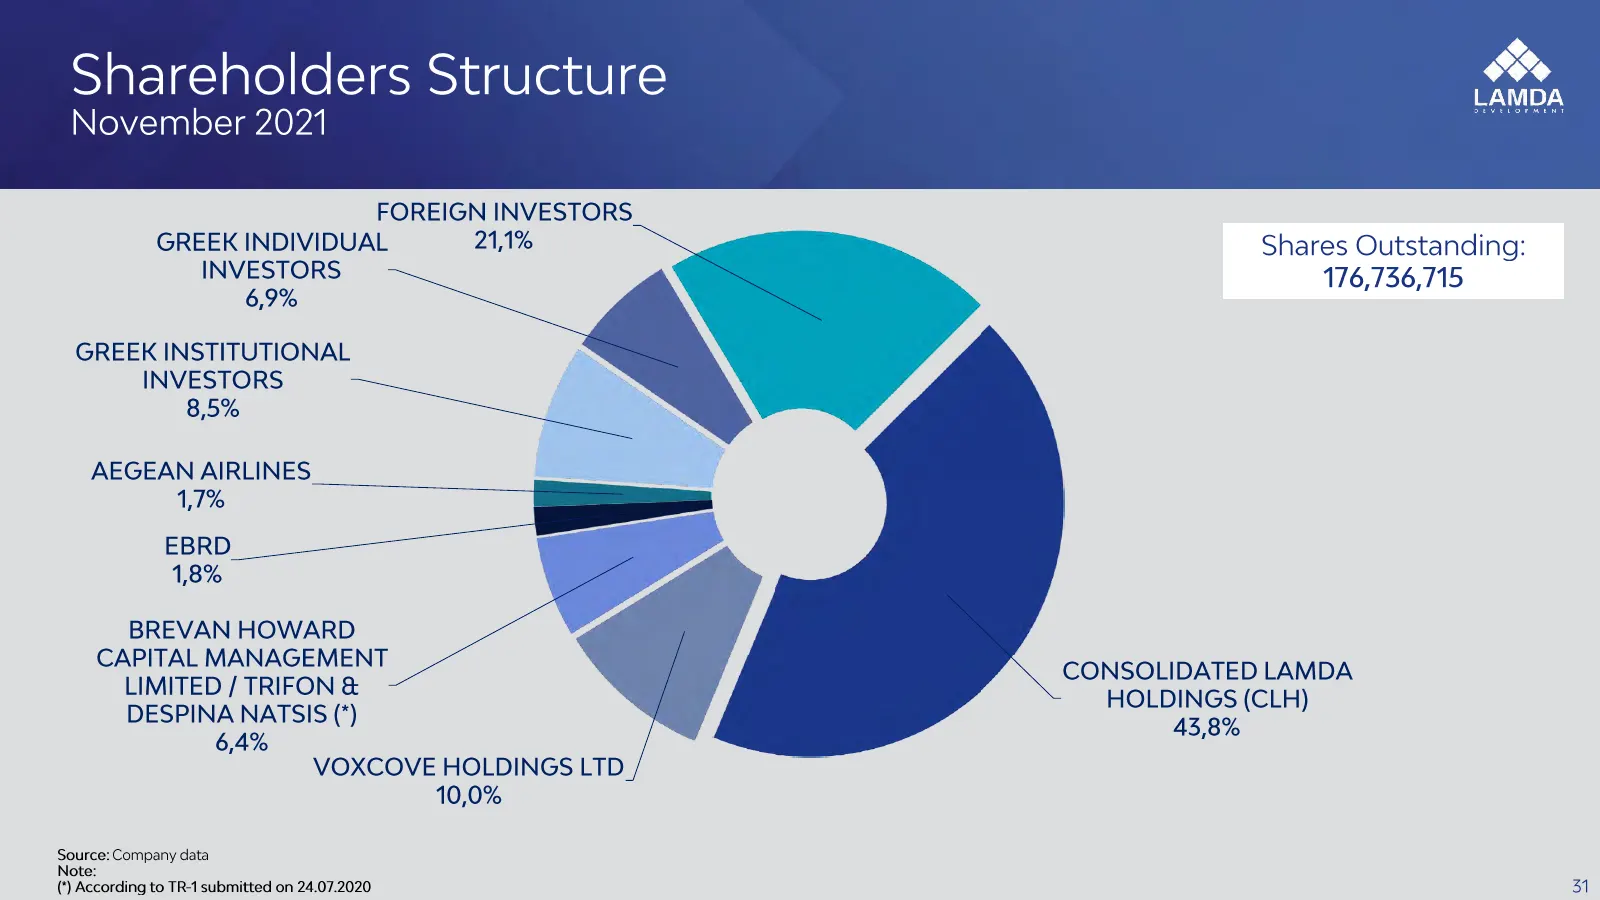
Slide 31: Shareholders Structure
Shareholders Structure November 2021 FOREIGN INVESTORS. GREEK INDIVIDUAL 21,1% INVESTORS 6,9% Shares Outstanding: 176,736,715 GREEK INSTITUTIONAL INVESTORS 85% ————— AEGEAN AIRLINES 1.1% EBRD 1,8% BREVAN HOWARD CAPITAL MANAGEMENT LIMITED / TRIFON & DESPINA NATSIS (*) 6,4% CONSOLIDATED LAMDA HOLDINGS
Slide 32: Disclaimer
Disclaimer This presentation has been prepared by LAMDA Development SA. (the “Company’). The information contained in this presentation has not been independently verified and no representation or warranty, express or implied, is made as to, and no reliance should be placed on, the fairness, accurac
Source: Internet Archive copy of lamdadev.com
More decks from LAMDA Development S.A.
 H1 2026 Earnings Presentation37 slides · Sep 17, 2026
 Q1 2026 Earnings Presentation37 slides · Jul 8, 2026
 Shareholder Meeting (June 2026)50 slides · Jun 23, 2026
 Investor Presentation (May 2026)41 slides · May 2026
 FY2025 Earnings Presentation38 slides · Mar 5, 2026
 Investor Presentation (January 2026)46 slides · January 2026