Strategic Hotels and Resorts Inc
Strategic Hotels and Resorts — Investor Presentation (March 2012)
33 slides from Strategic Hotels and Resorts's investor presentation, Mar 7, 2012
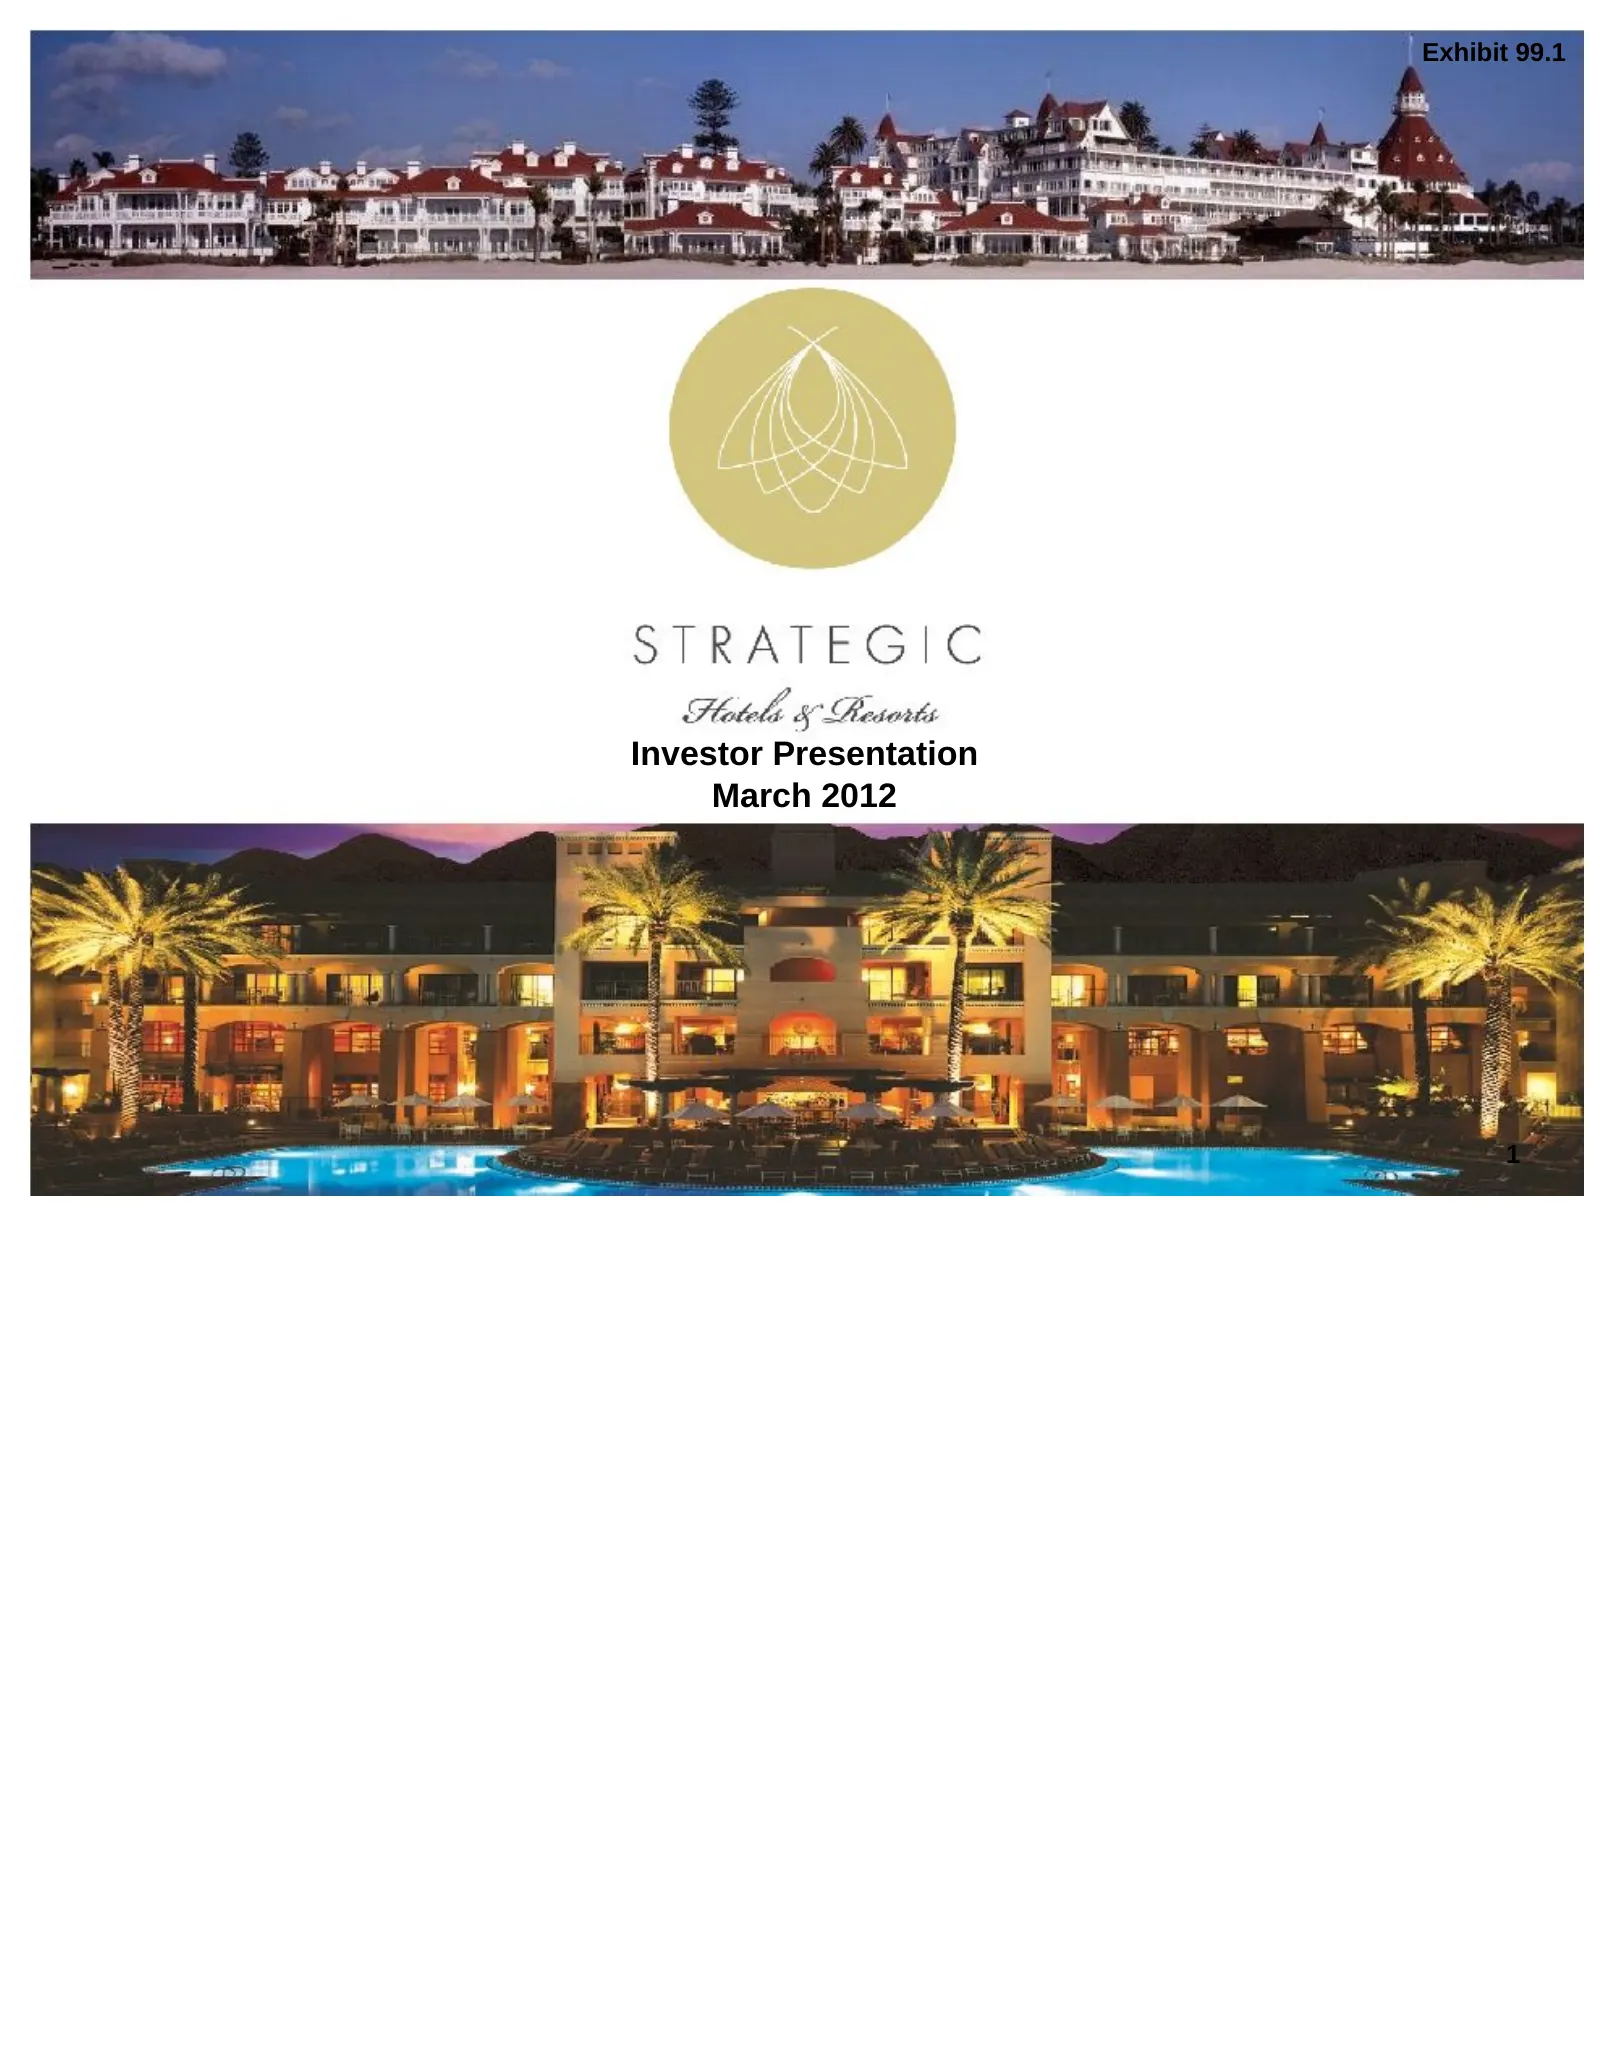
Slide 1: Investor Presentation March 2012
Exhibit 99.1 Investor Presentation March 2012 1
Slide 2: Agenda
Agenda I. BEE’s Unique Value Proposition II. Company Overview III. Industry Update IV. Operating Trends V. Financial Overview 2
Slide 3: BEE's Unique Value Proposition
BEE’s Unique Value Proposition The only pure play high-end lodging REIT High-end outperforms the industry in a recovery Industry leading asset management expertise Assets are in pristine condition Embedded organic growth through revenue growth and ROI opportunities Replacement cost, excluding land,
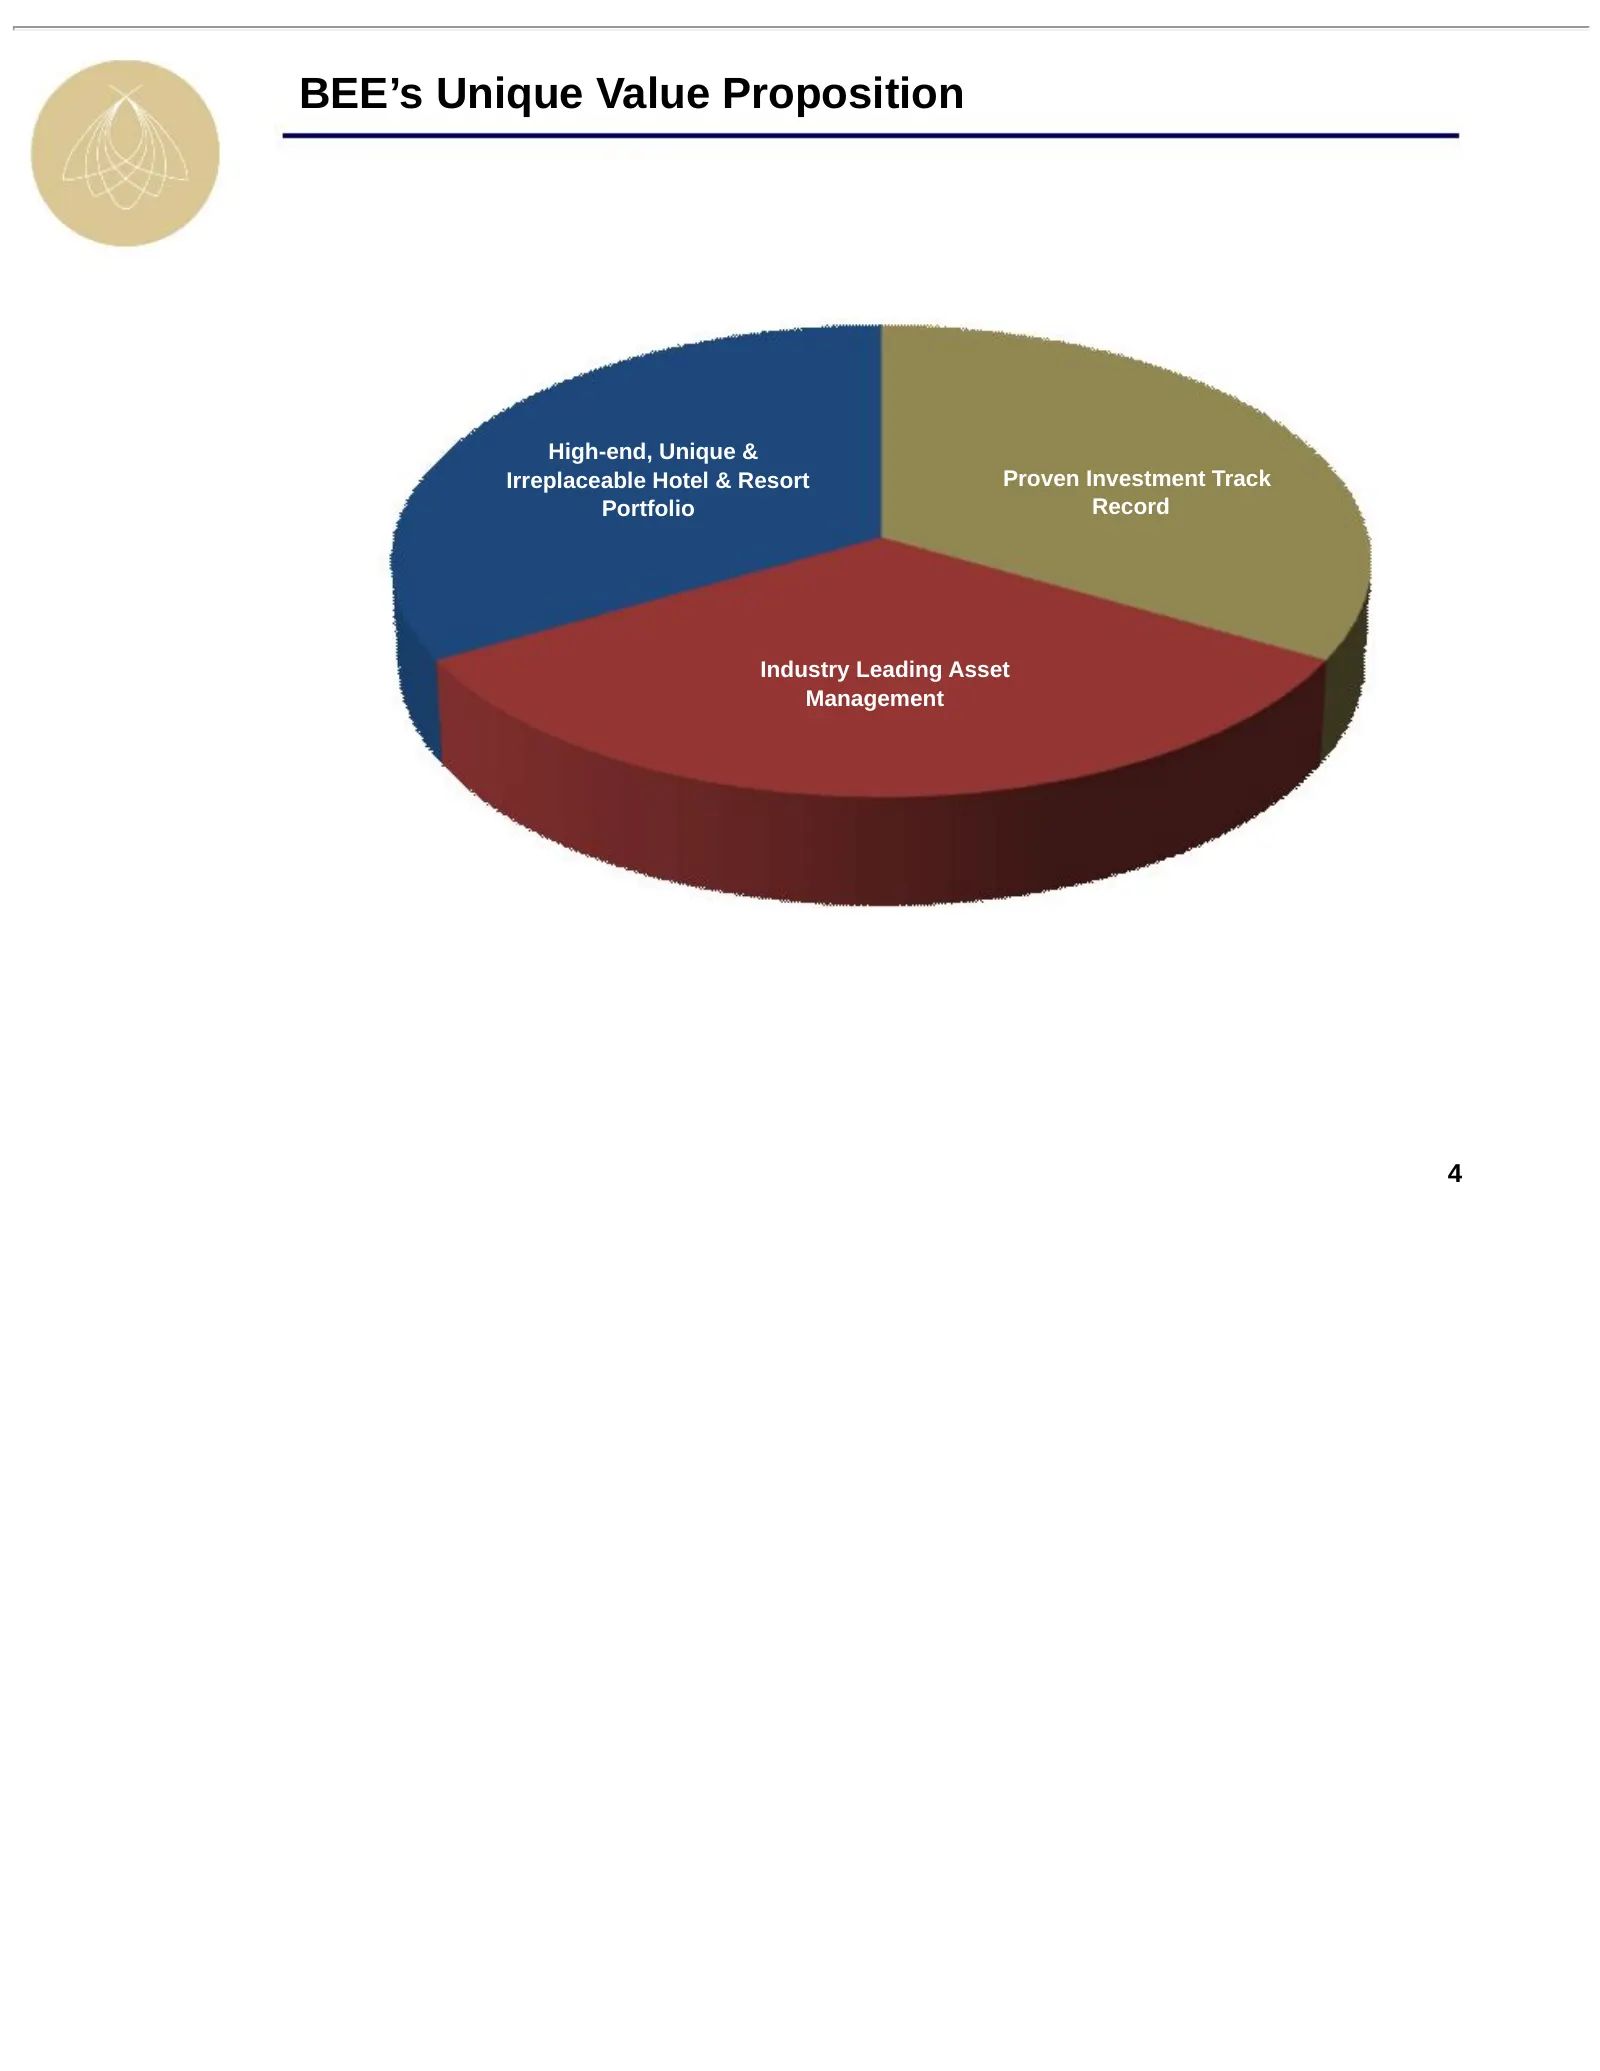
Slide 4: BEE's Unique Value Proposition
BEE’s Unique Value Proposition High-end, Unique & Irreplaceable Hotel & Resort Proven Investment Track Portfolio Record Industry Leading Asset Management 4
Slide 5: BEE's Unique Value Proposition: Hotel & Resort Portfolio
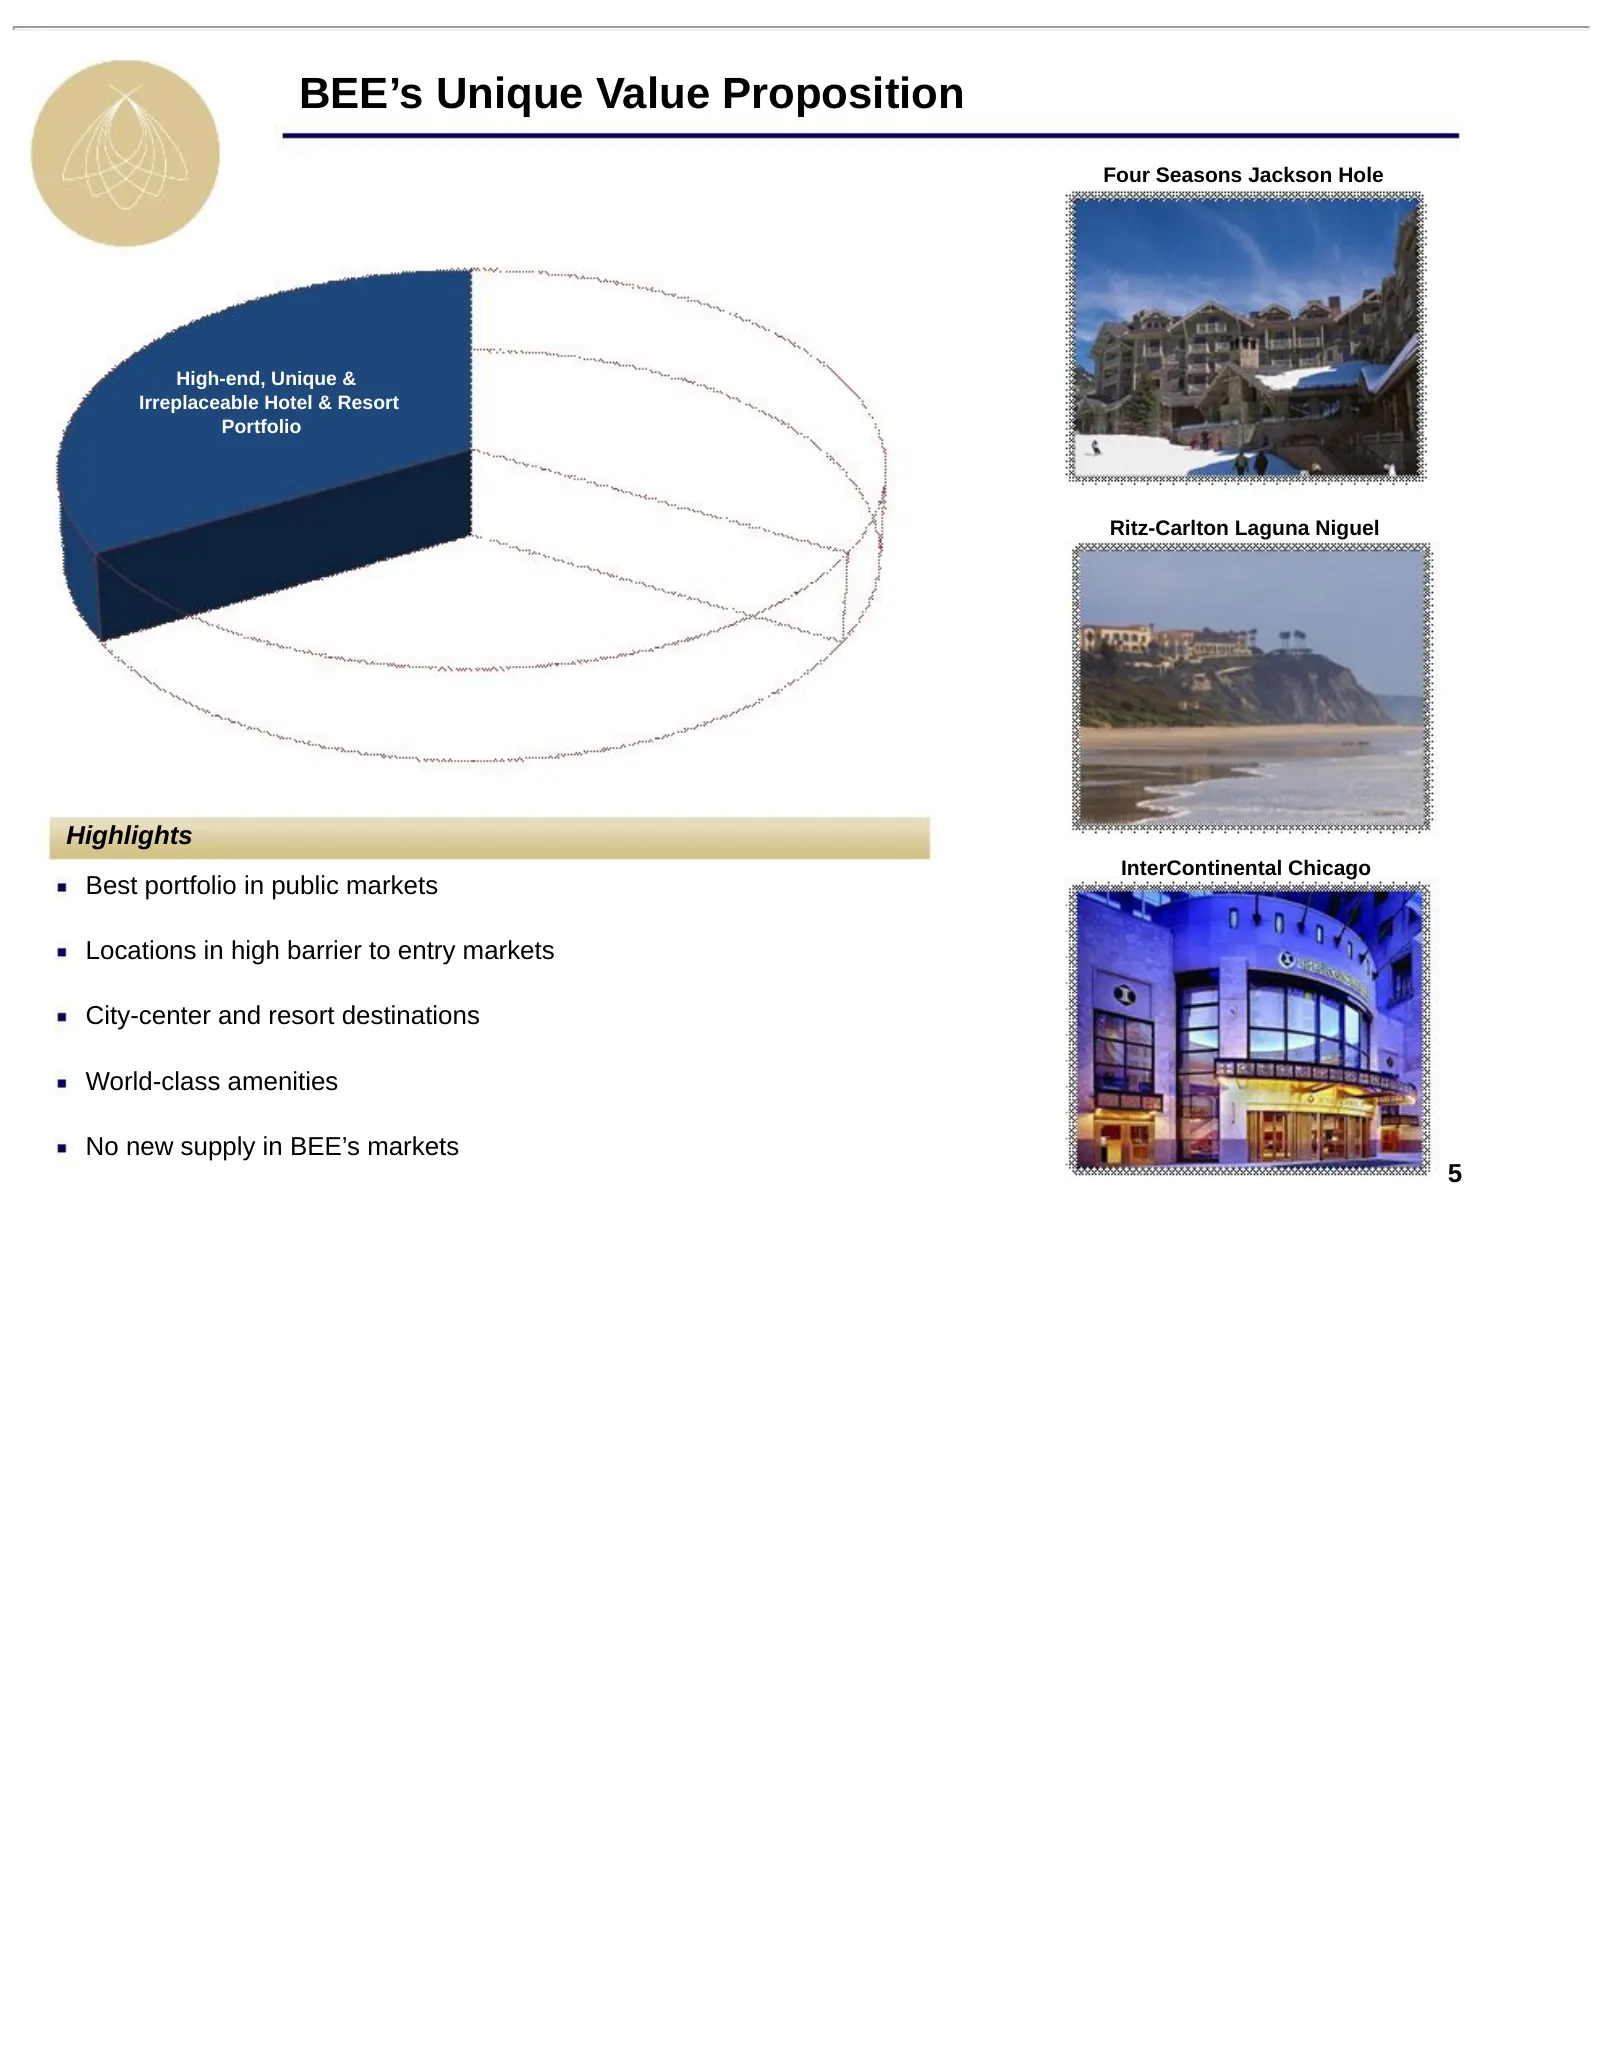
BEE’s Unique Value Proposition Four Seasons Jackson Hole High-end, Unique & Irreplaceable Hotel & Resort Portfolio Ritz-Carlton Laguna Niguel Highlights InterContinental Chicago Best portfolio in public markets Locations in high barrier to entry markets City-center and resort destinations World-clas
Slide 6: BEE's Unique Value Proposition: Proven Investment Track Record
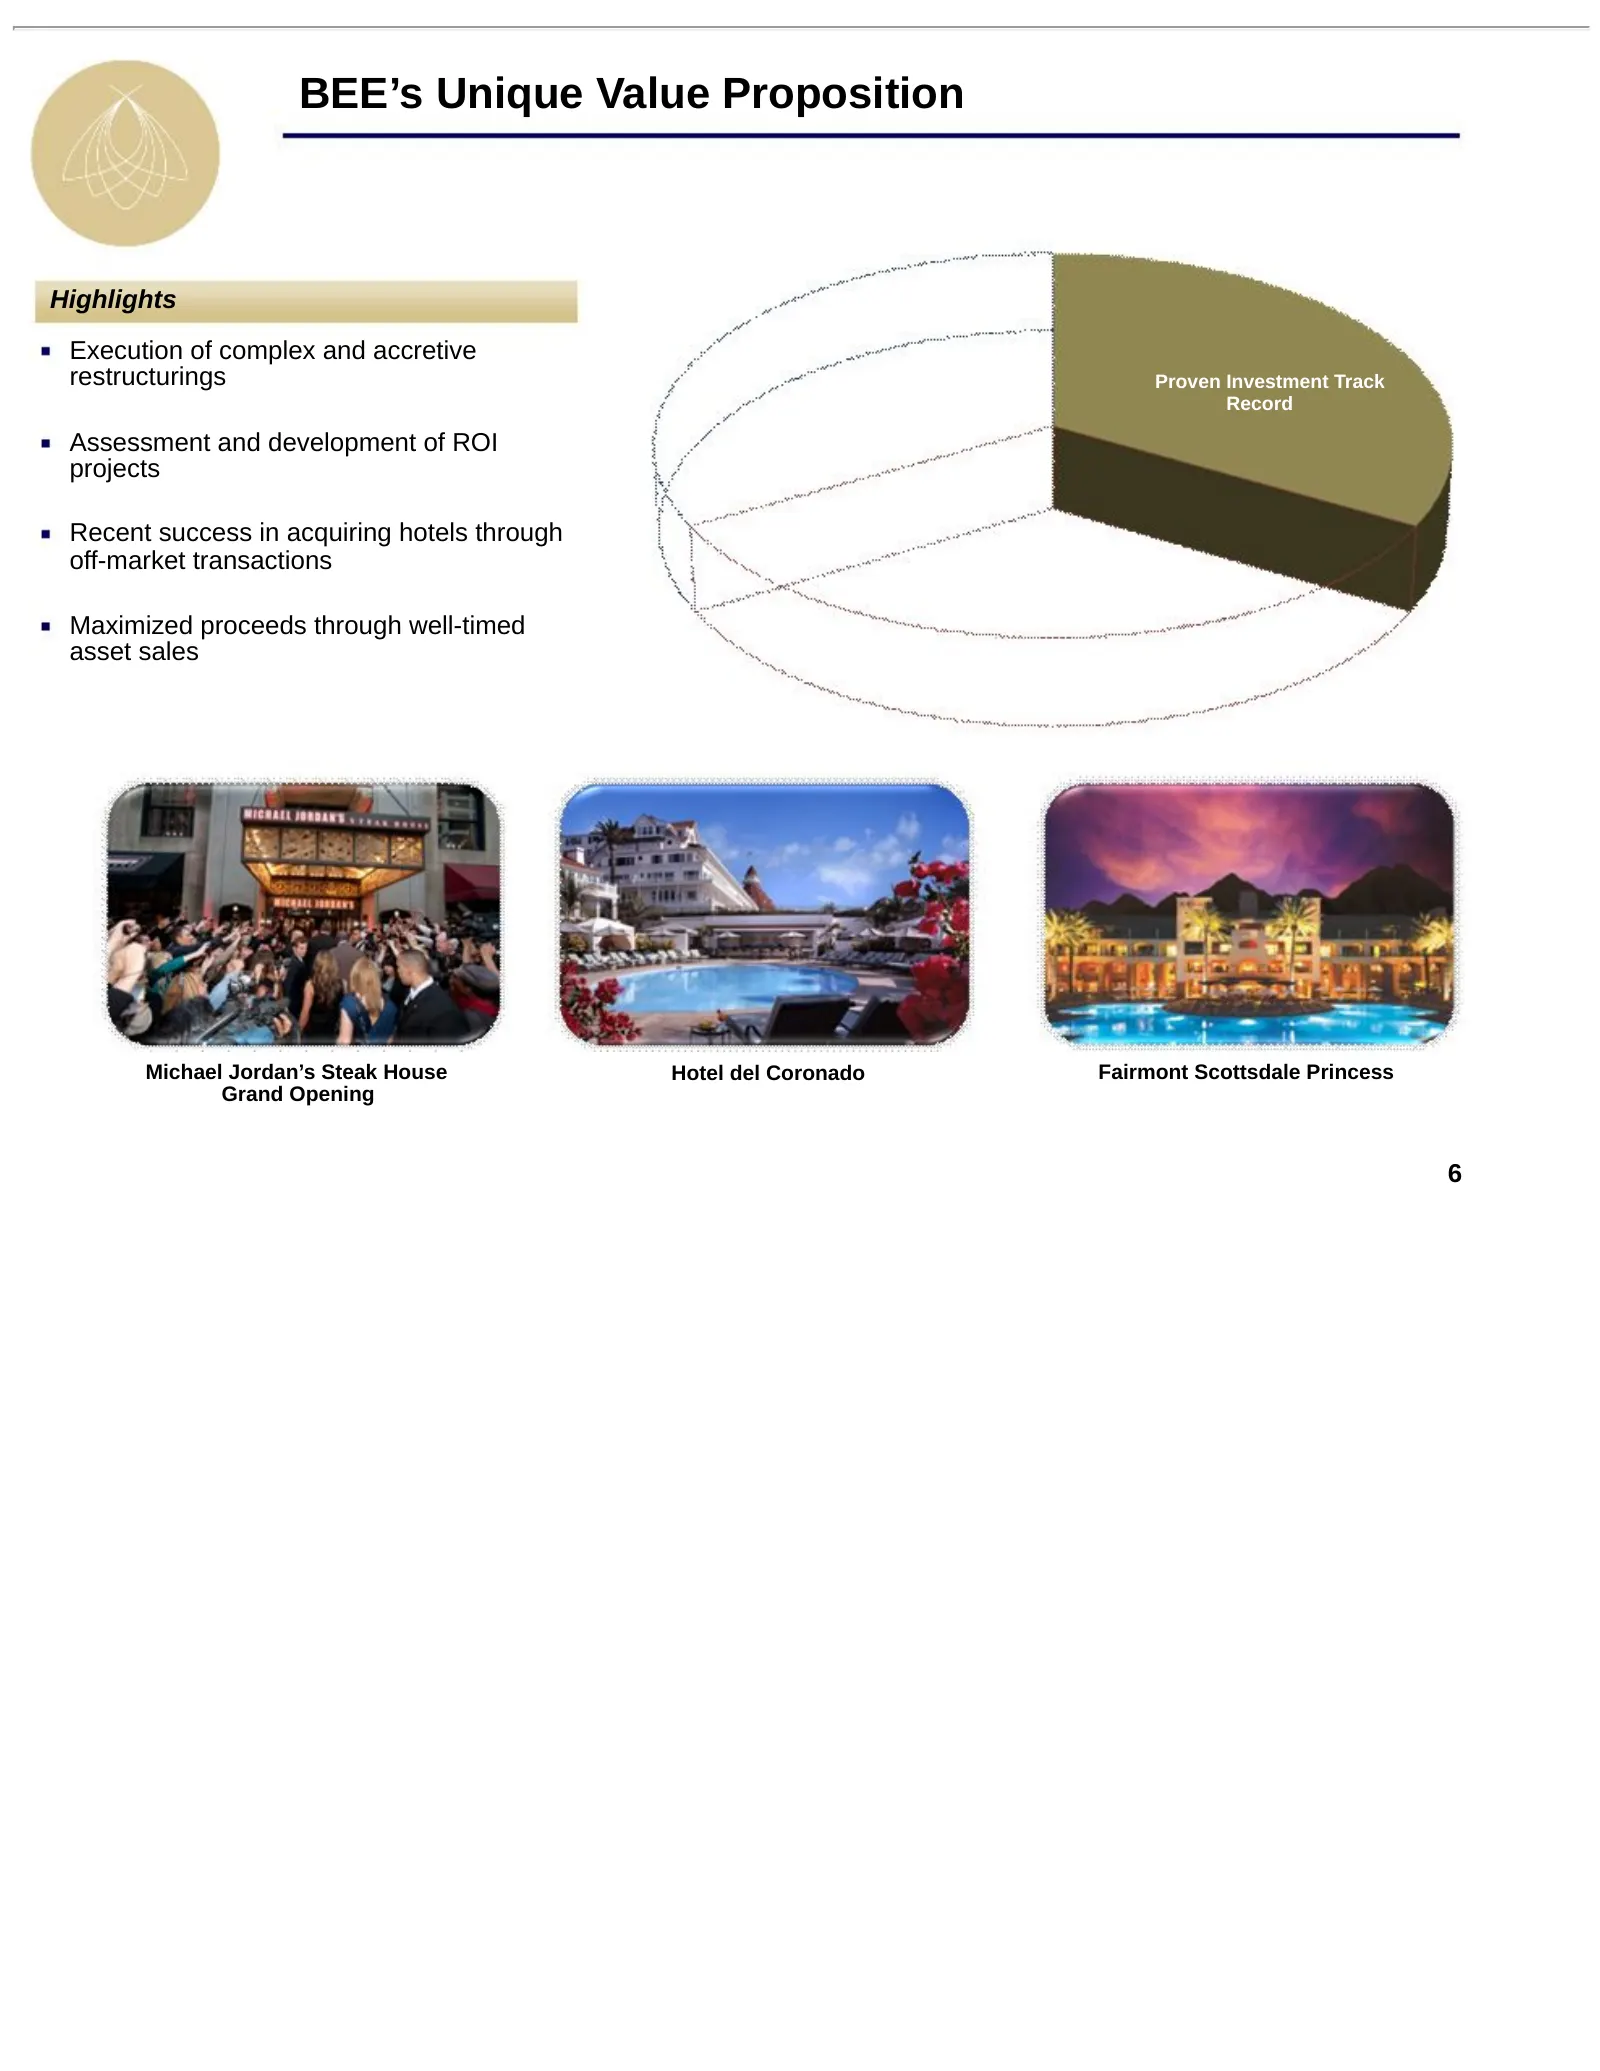
BEE’s Unique Value Proposition Highlights Execution of complex and accretive restructurings Proven Investment Track Record Assessment and development of ROI projects Recent success in acquiring hotels through off-market transactions Maximized proceeds through well-timed asset sales Michael Jordan’s
Slide 7: BEE's Unique Value Proposition: Industry Leading Asset Management
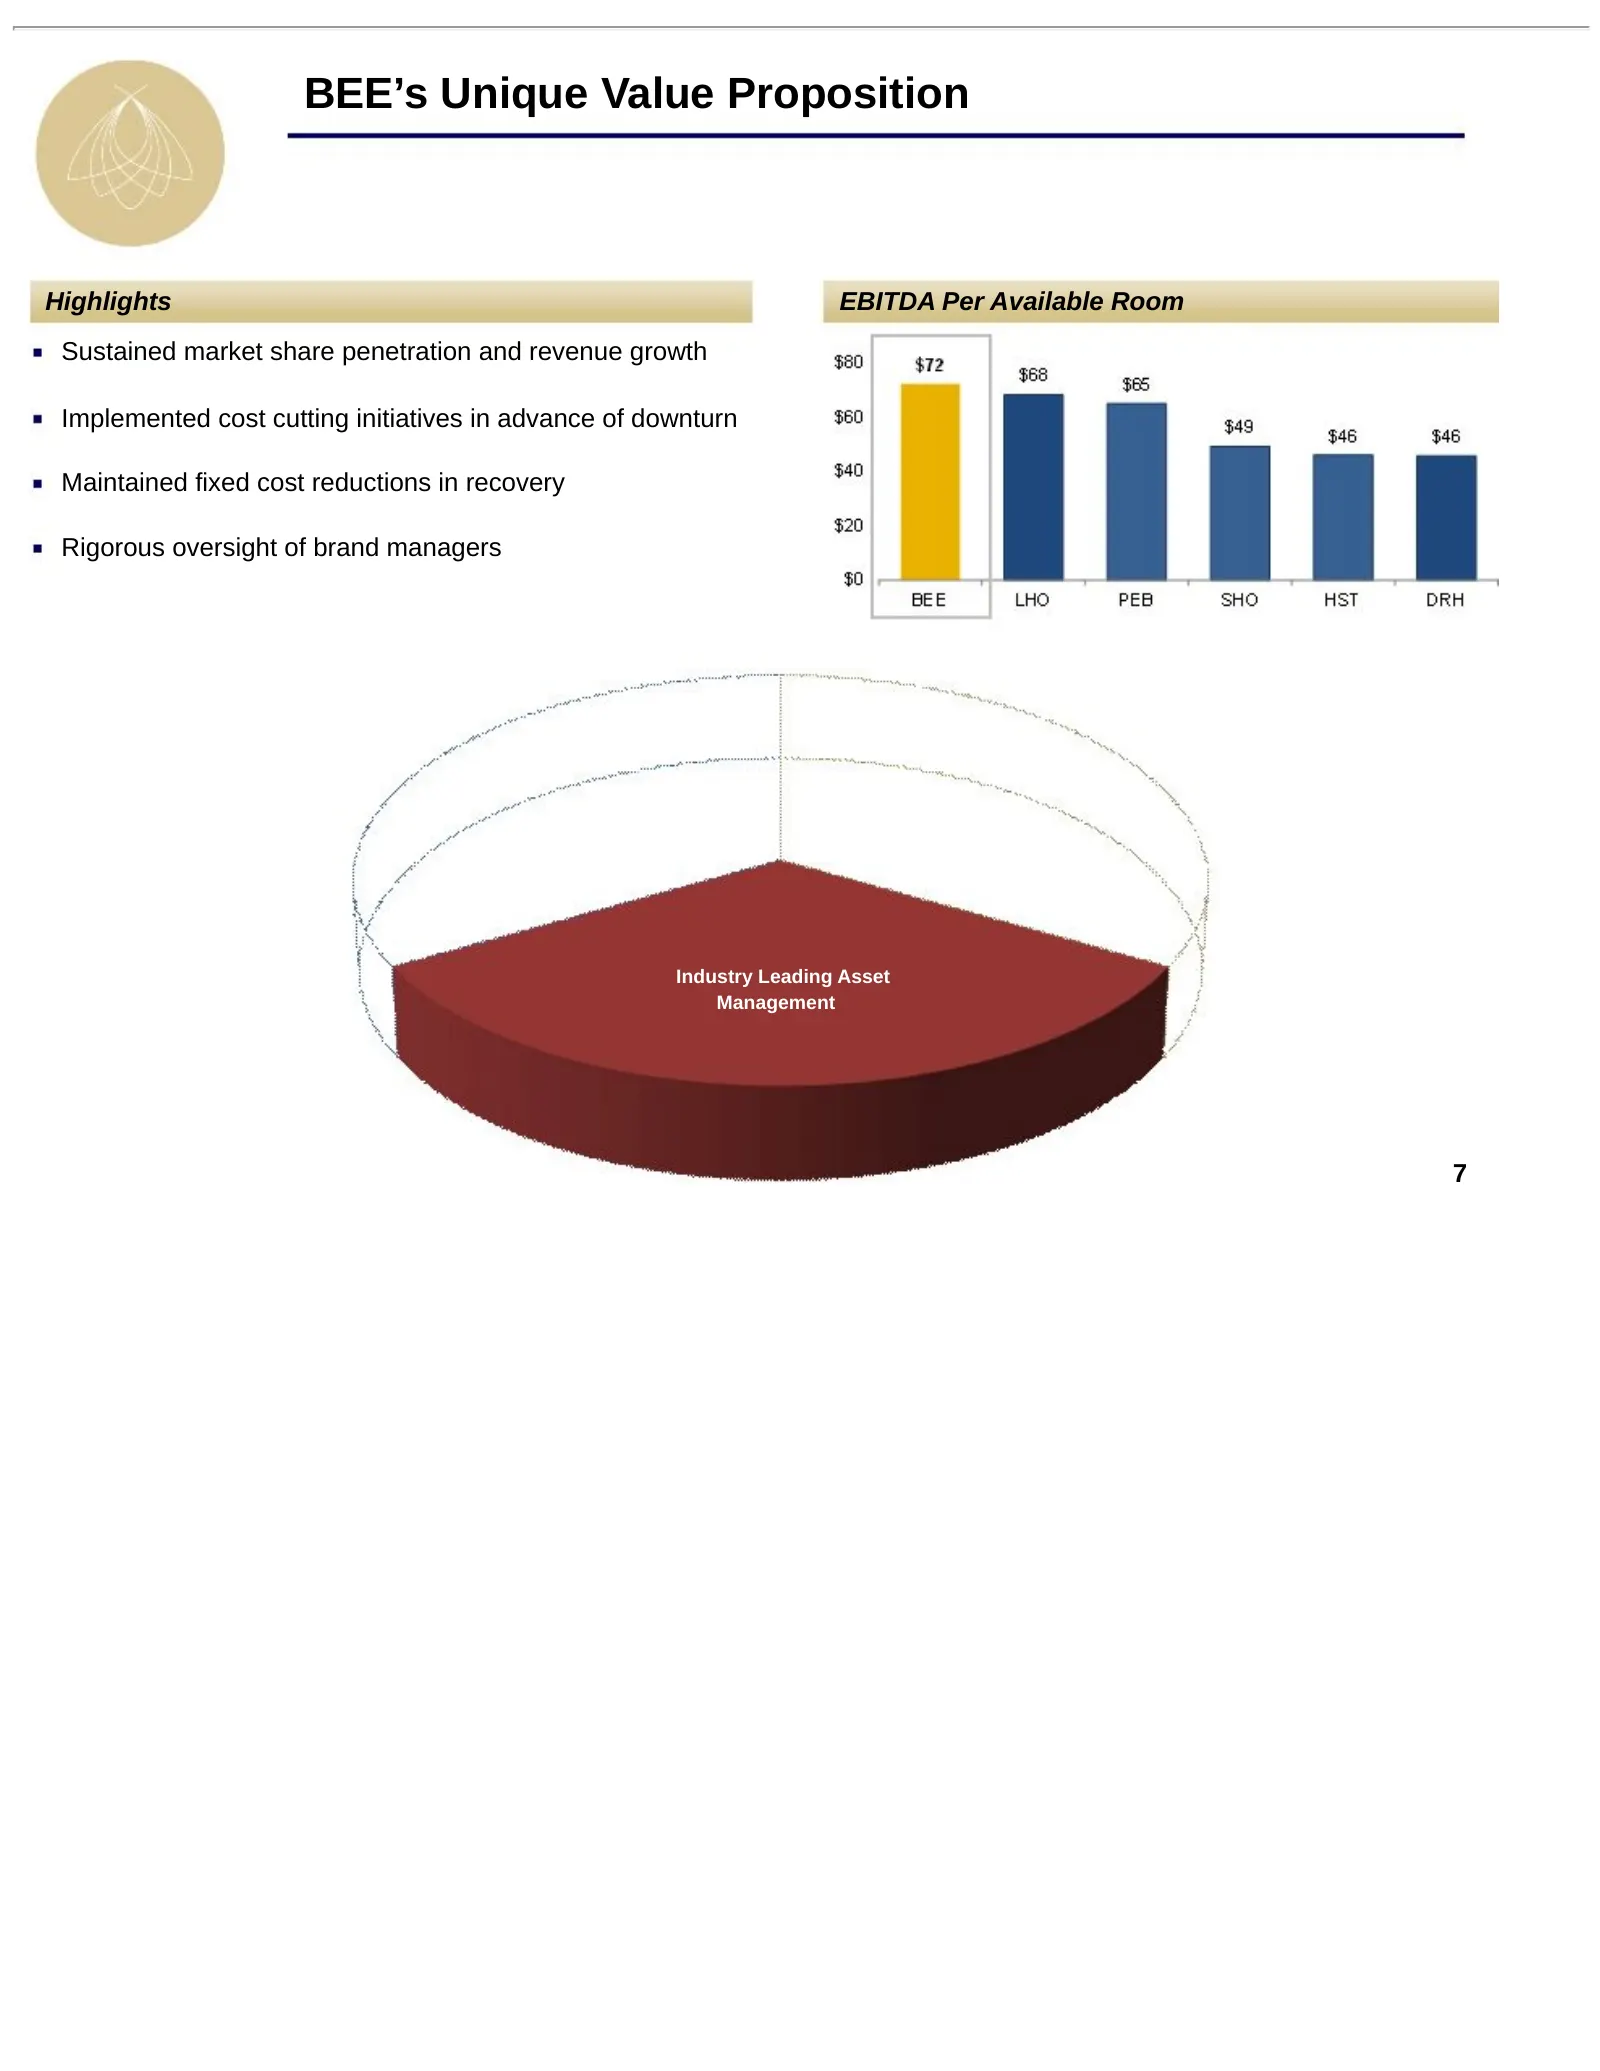
BEE’s Unique Value Proposition Highlights EBITDA Per Available Room Sustained market share penetration and revenue growth Implemented cost cutting initiatives in advance of downturn Maintained fixed cost reductions in recovery Rigorous oversight of brand managers Industry Leading Asset Management 7

Slide 8: Agenda
Agenda I. BEE’s Unique Value Proposition II. Company Overview 8
Slide 9: Top-Tier Market Exposure
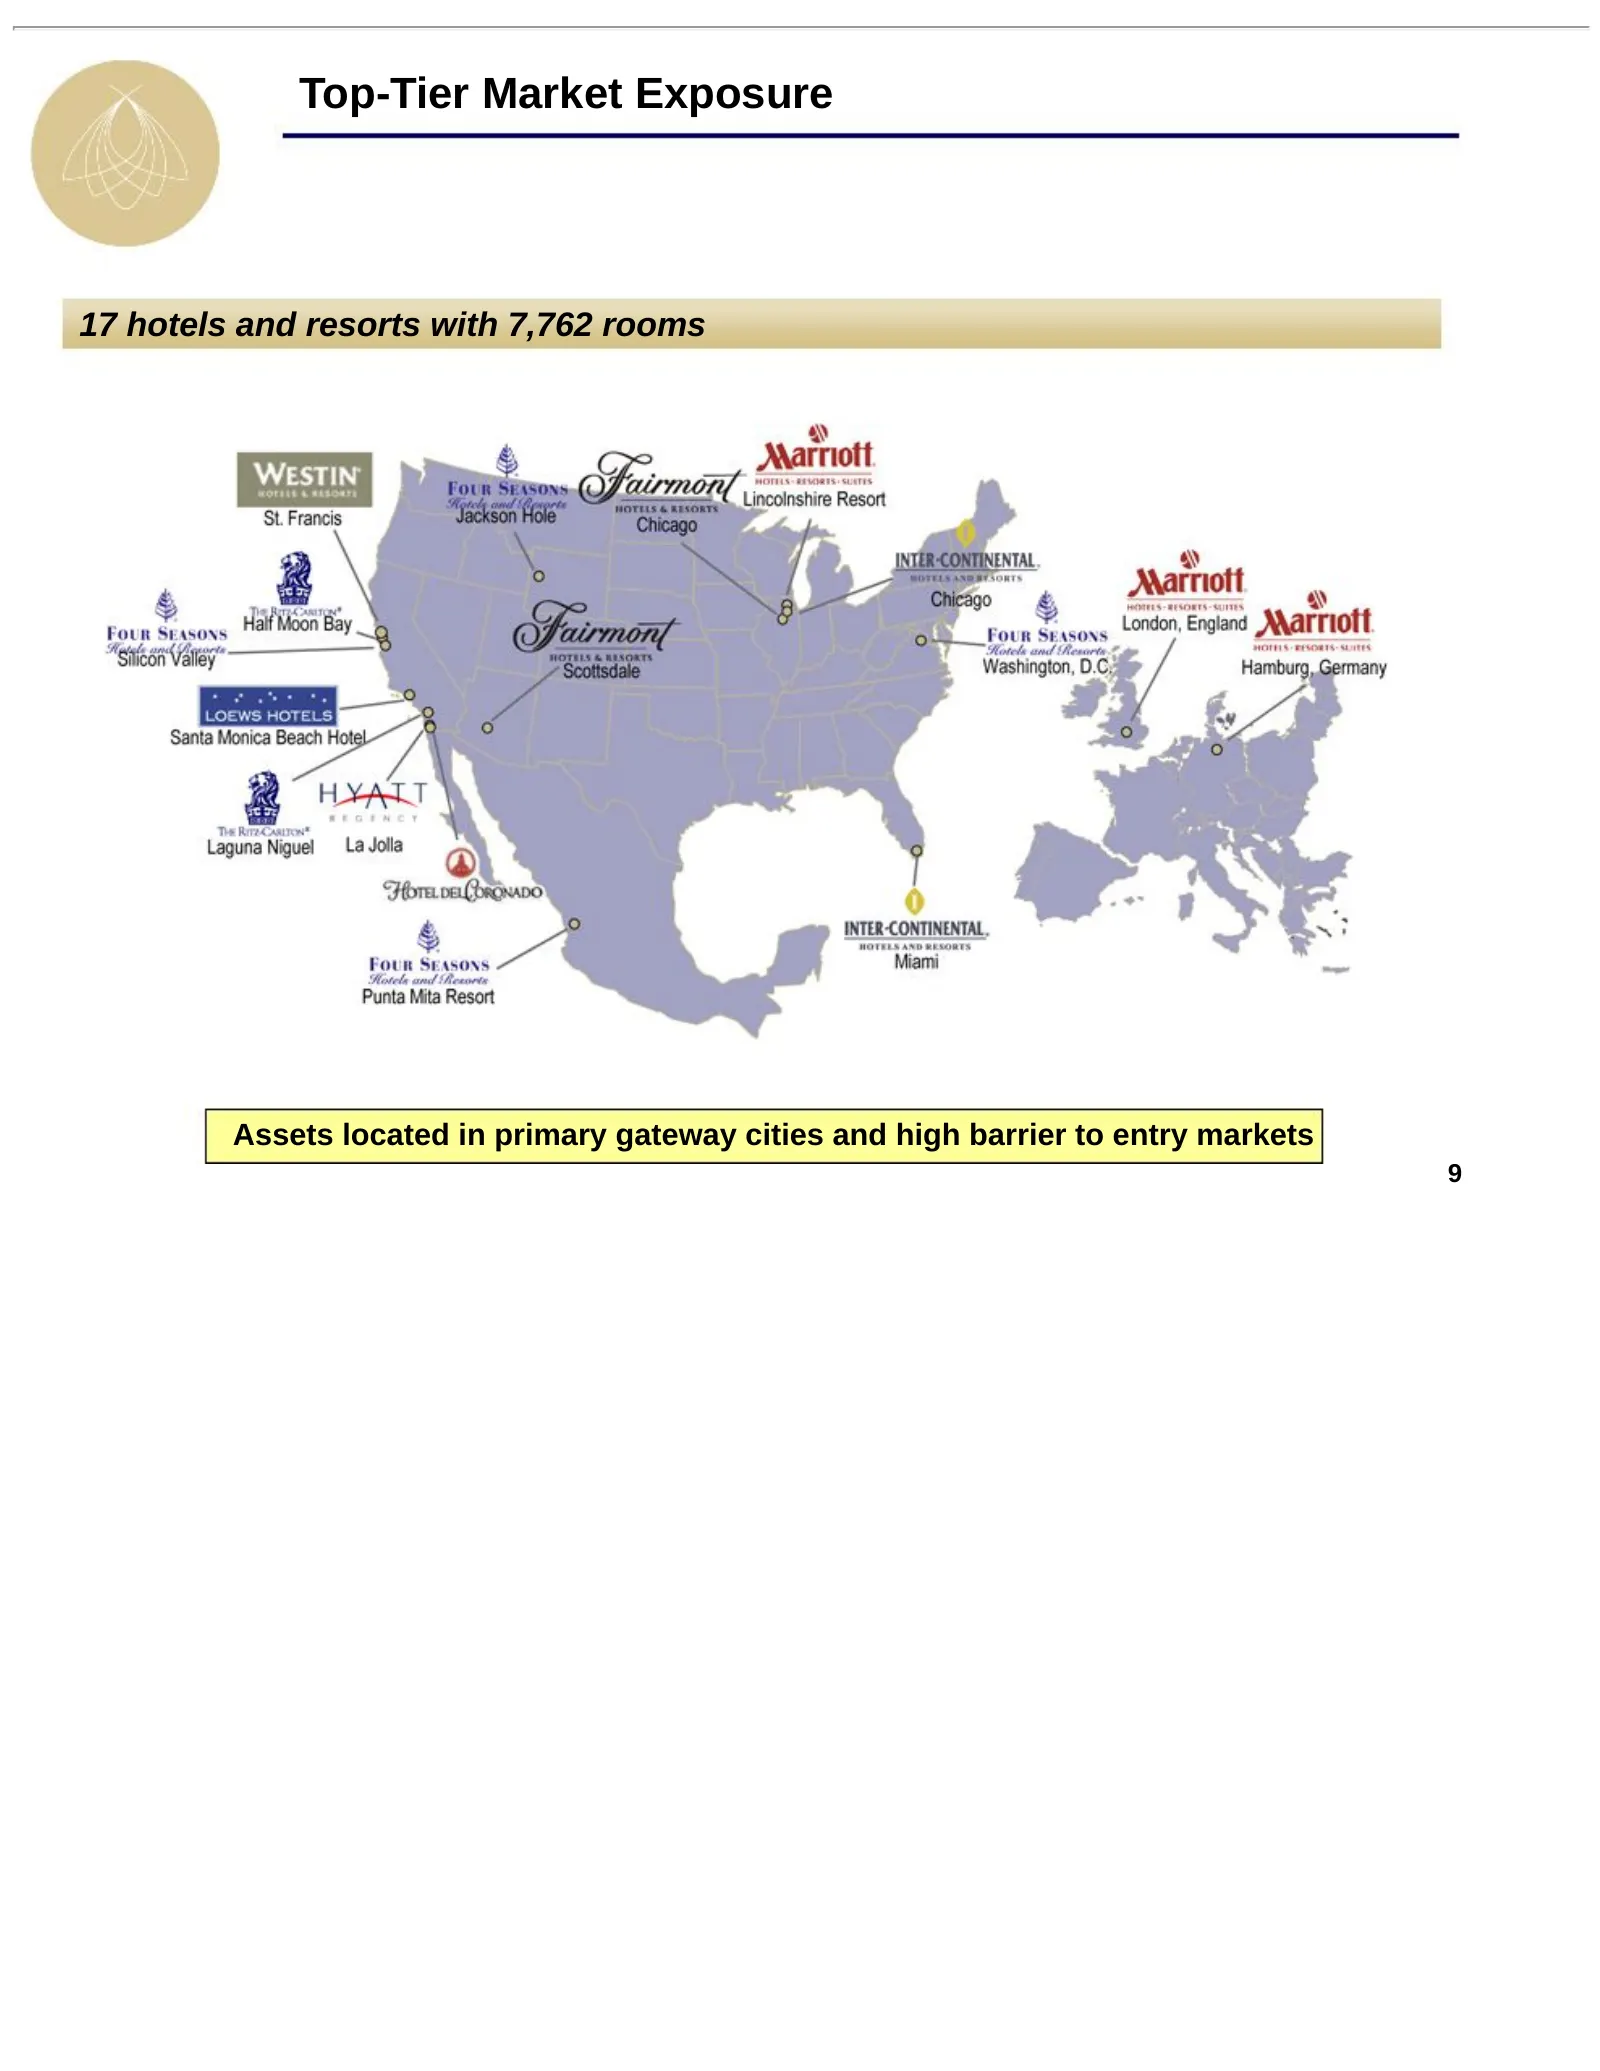
Top-Tier Market Exposure 17 hotels and resorts with 7,762 rooms Assets located in primary gateway cities and high barrier to entry markets 9
Slide 10: Portfolio Well-Positioned To Enhance Cash Flow Growth
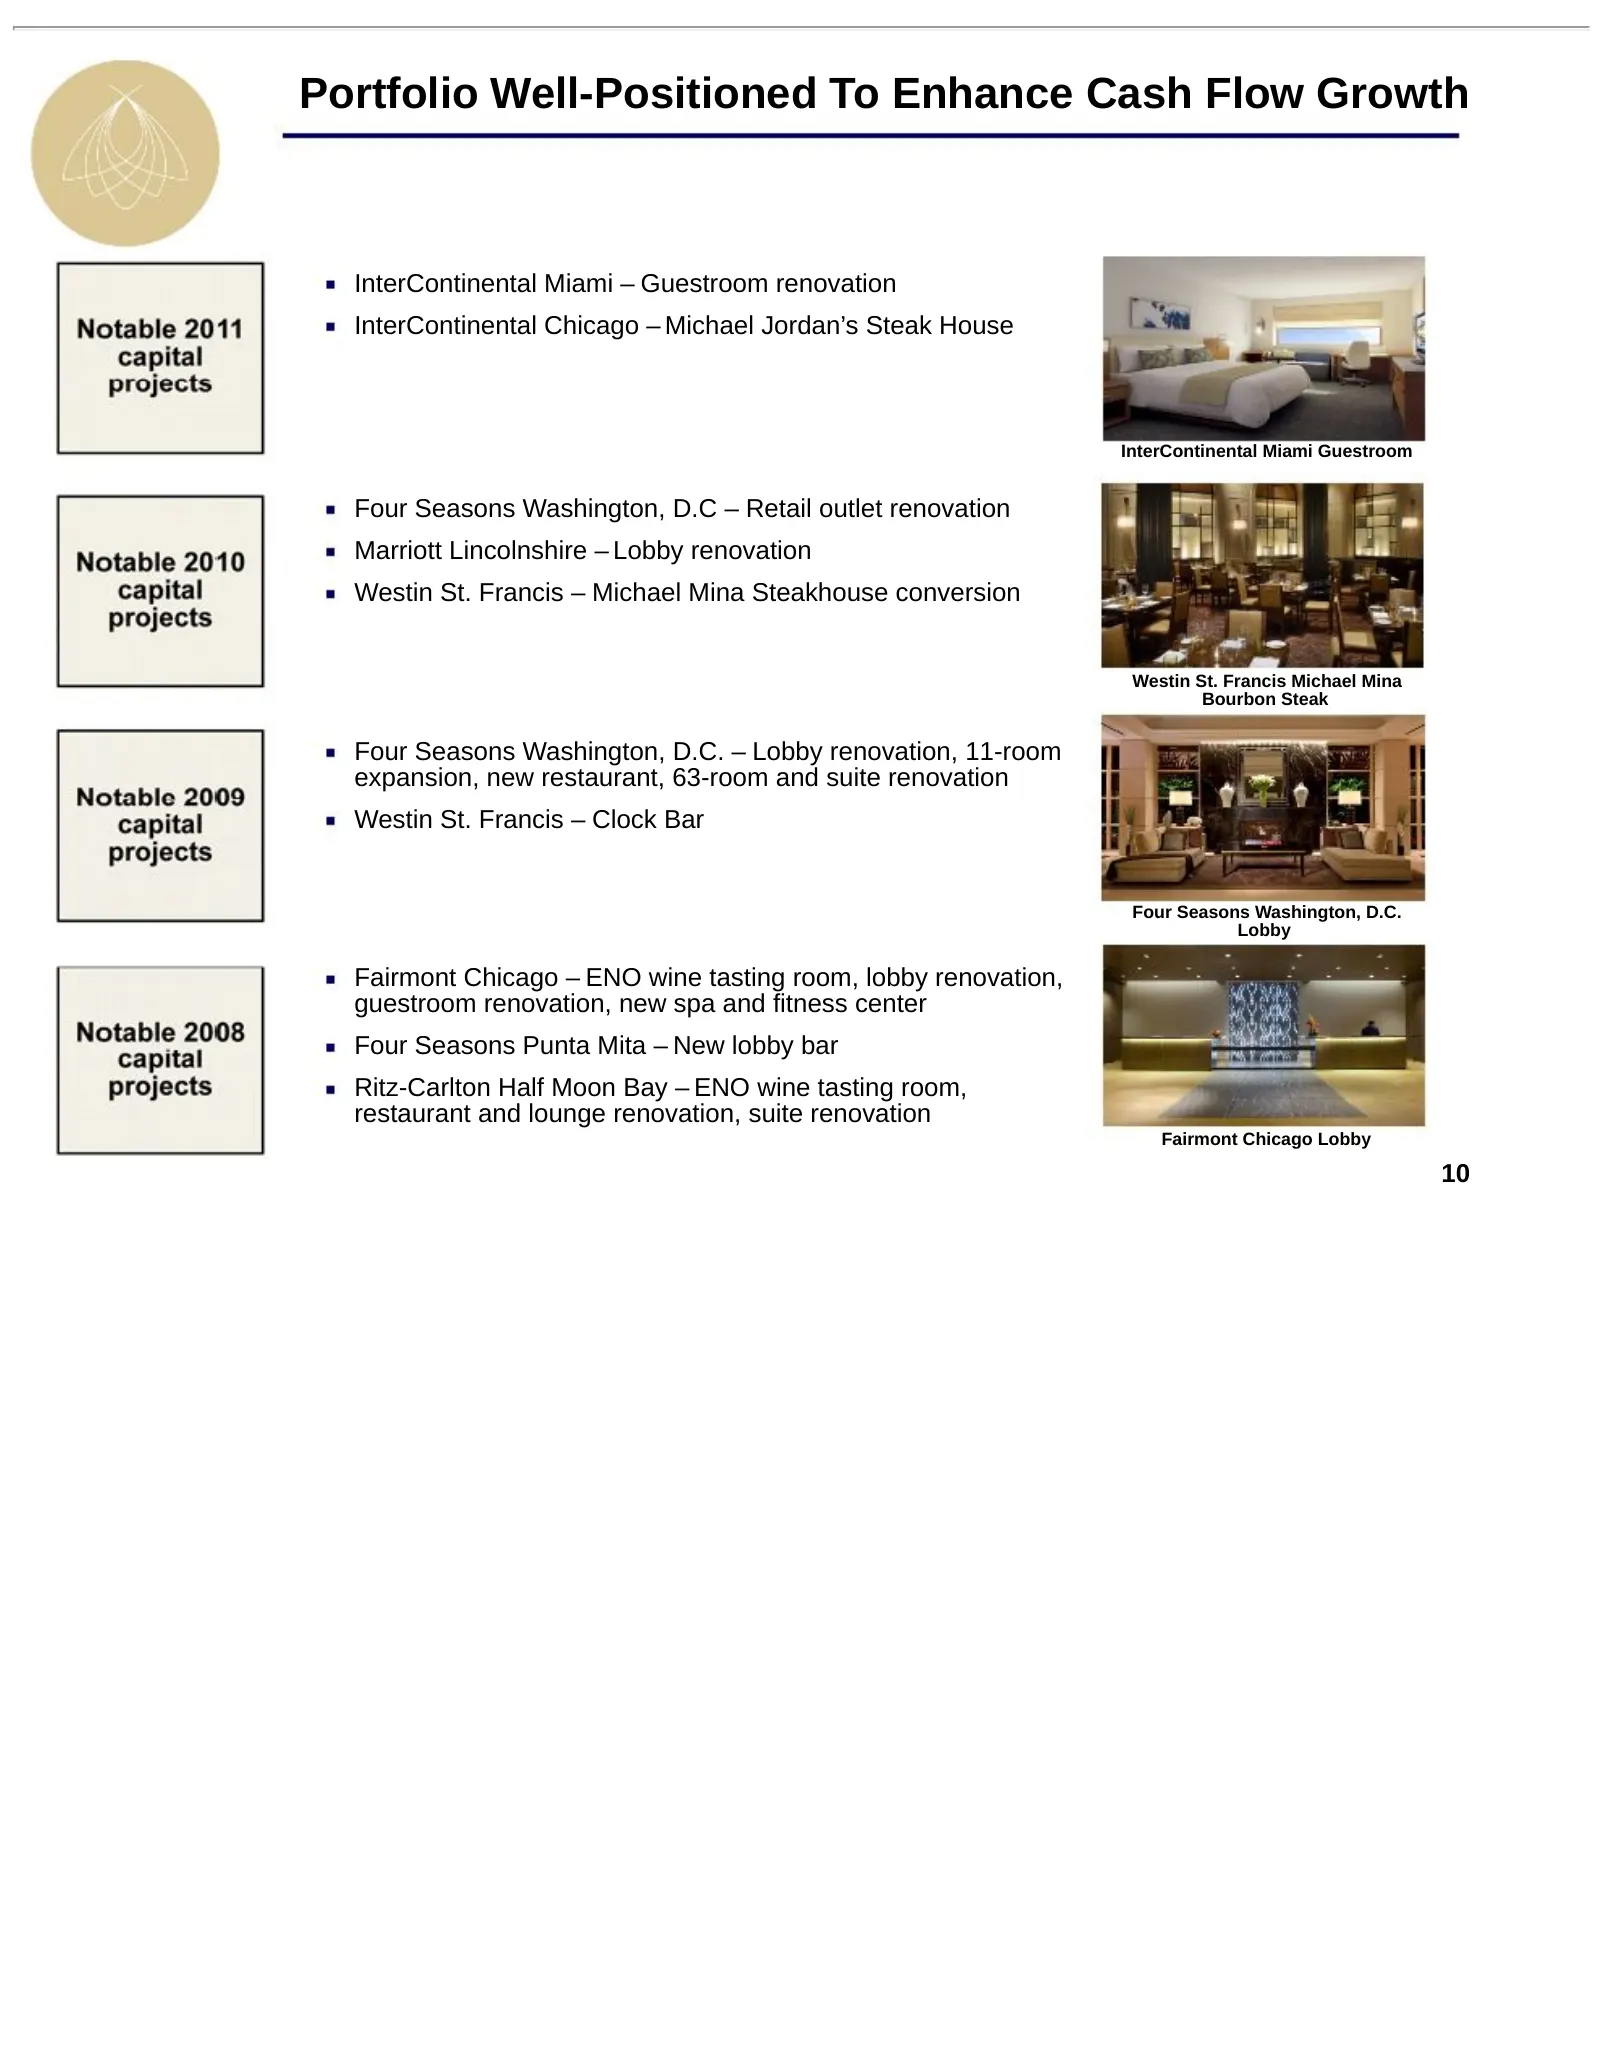
Portfolio Well-Positioned To Enhance Cash Flow Growth InterContinental Miami – Guestroom renovation InterContinental Chicago – Michael Jordan’s Steak House InterContinental Miami Guestroom Four Seasons Washington, D.C – Retail outlet renovation Marriott Lincolnshire – Lobby renovation Westin St. Fra
Slide 11: Potential Capital Projects in the Pipeline
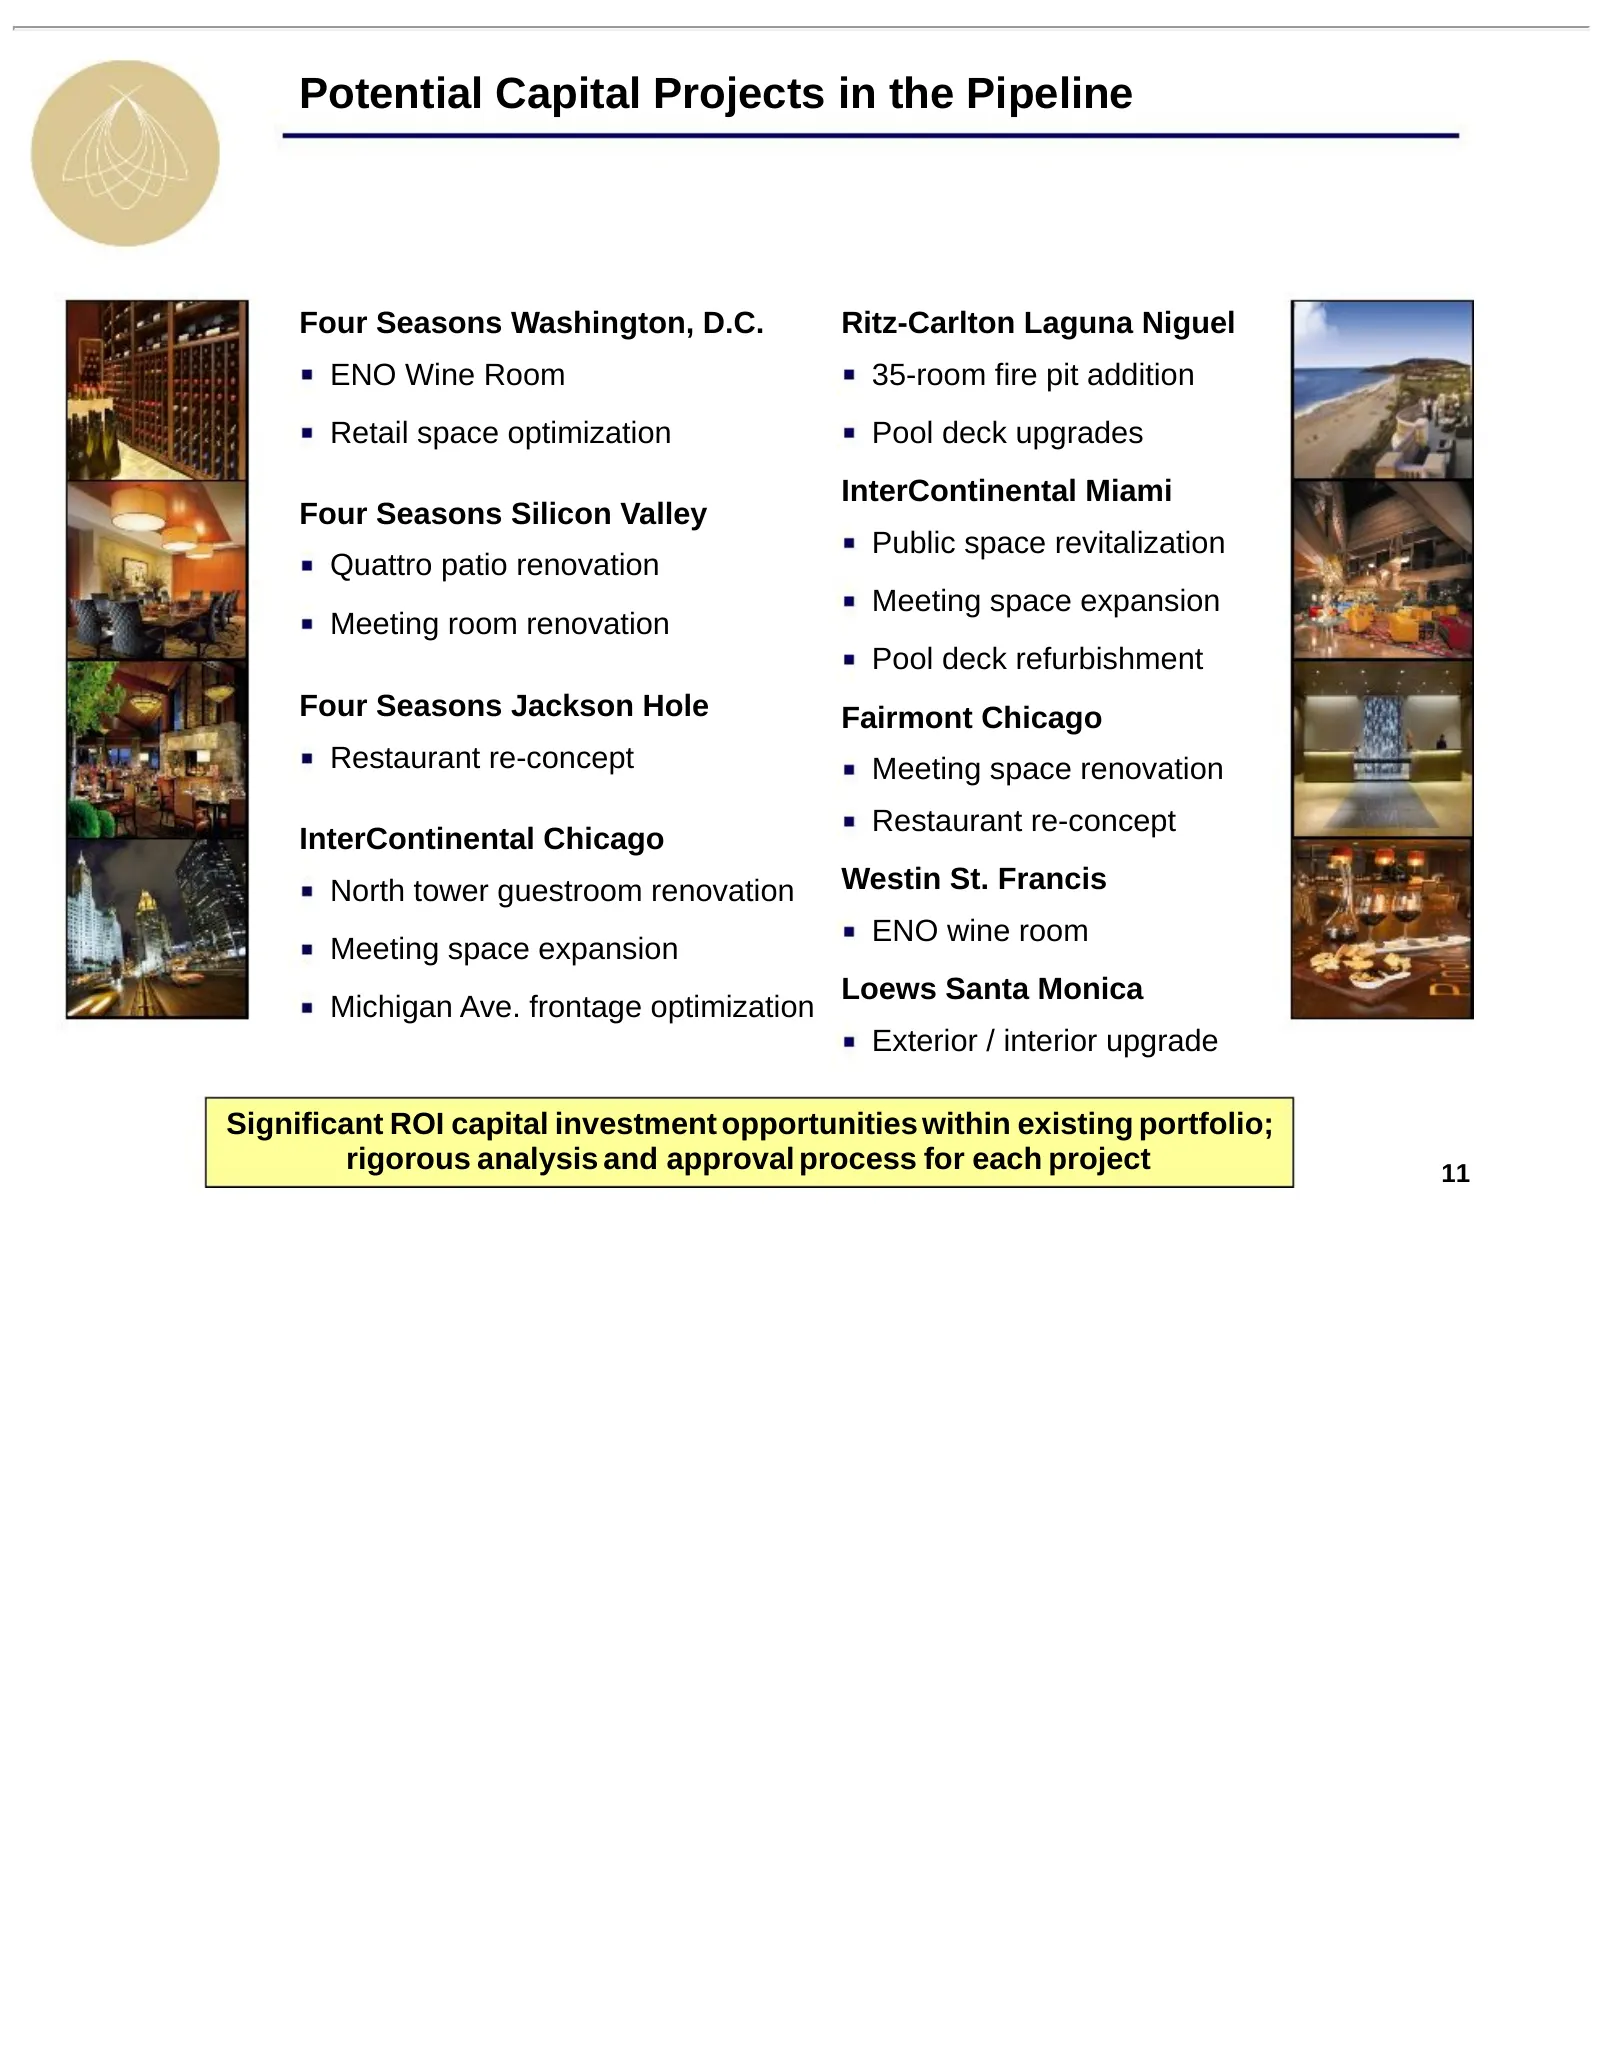
Potential Capital Projects in the Pipeline Four Seasons Washington, D.C. Ritz-Carlton Laguna Niguel ENO Wine Room 35-room fire pit addition Retail space optimization Pool deck upgrades InterContinental Miami Four Seasons Silicon Valley Public space revitalization Quattro patio renovation Meeting spa

Slide 12: Agenda
Agenda I. BEE’s Unique Value Proposition II. Company Overview III. Industry Update 12
Slide 13: Lodging Outlook
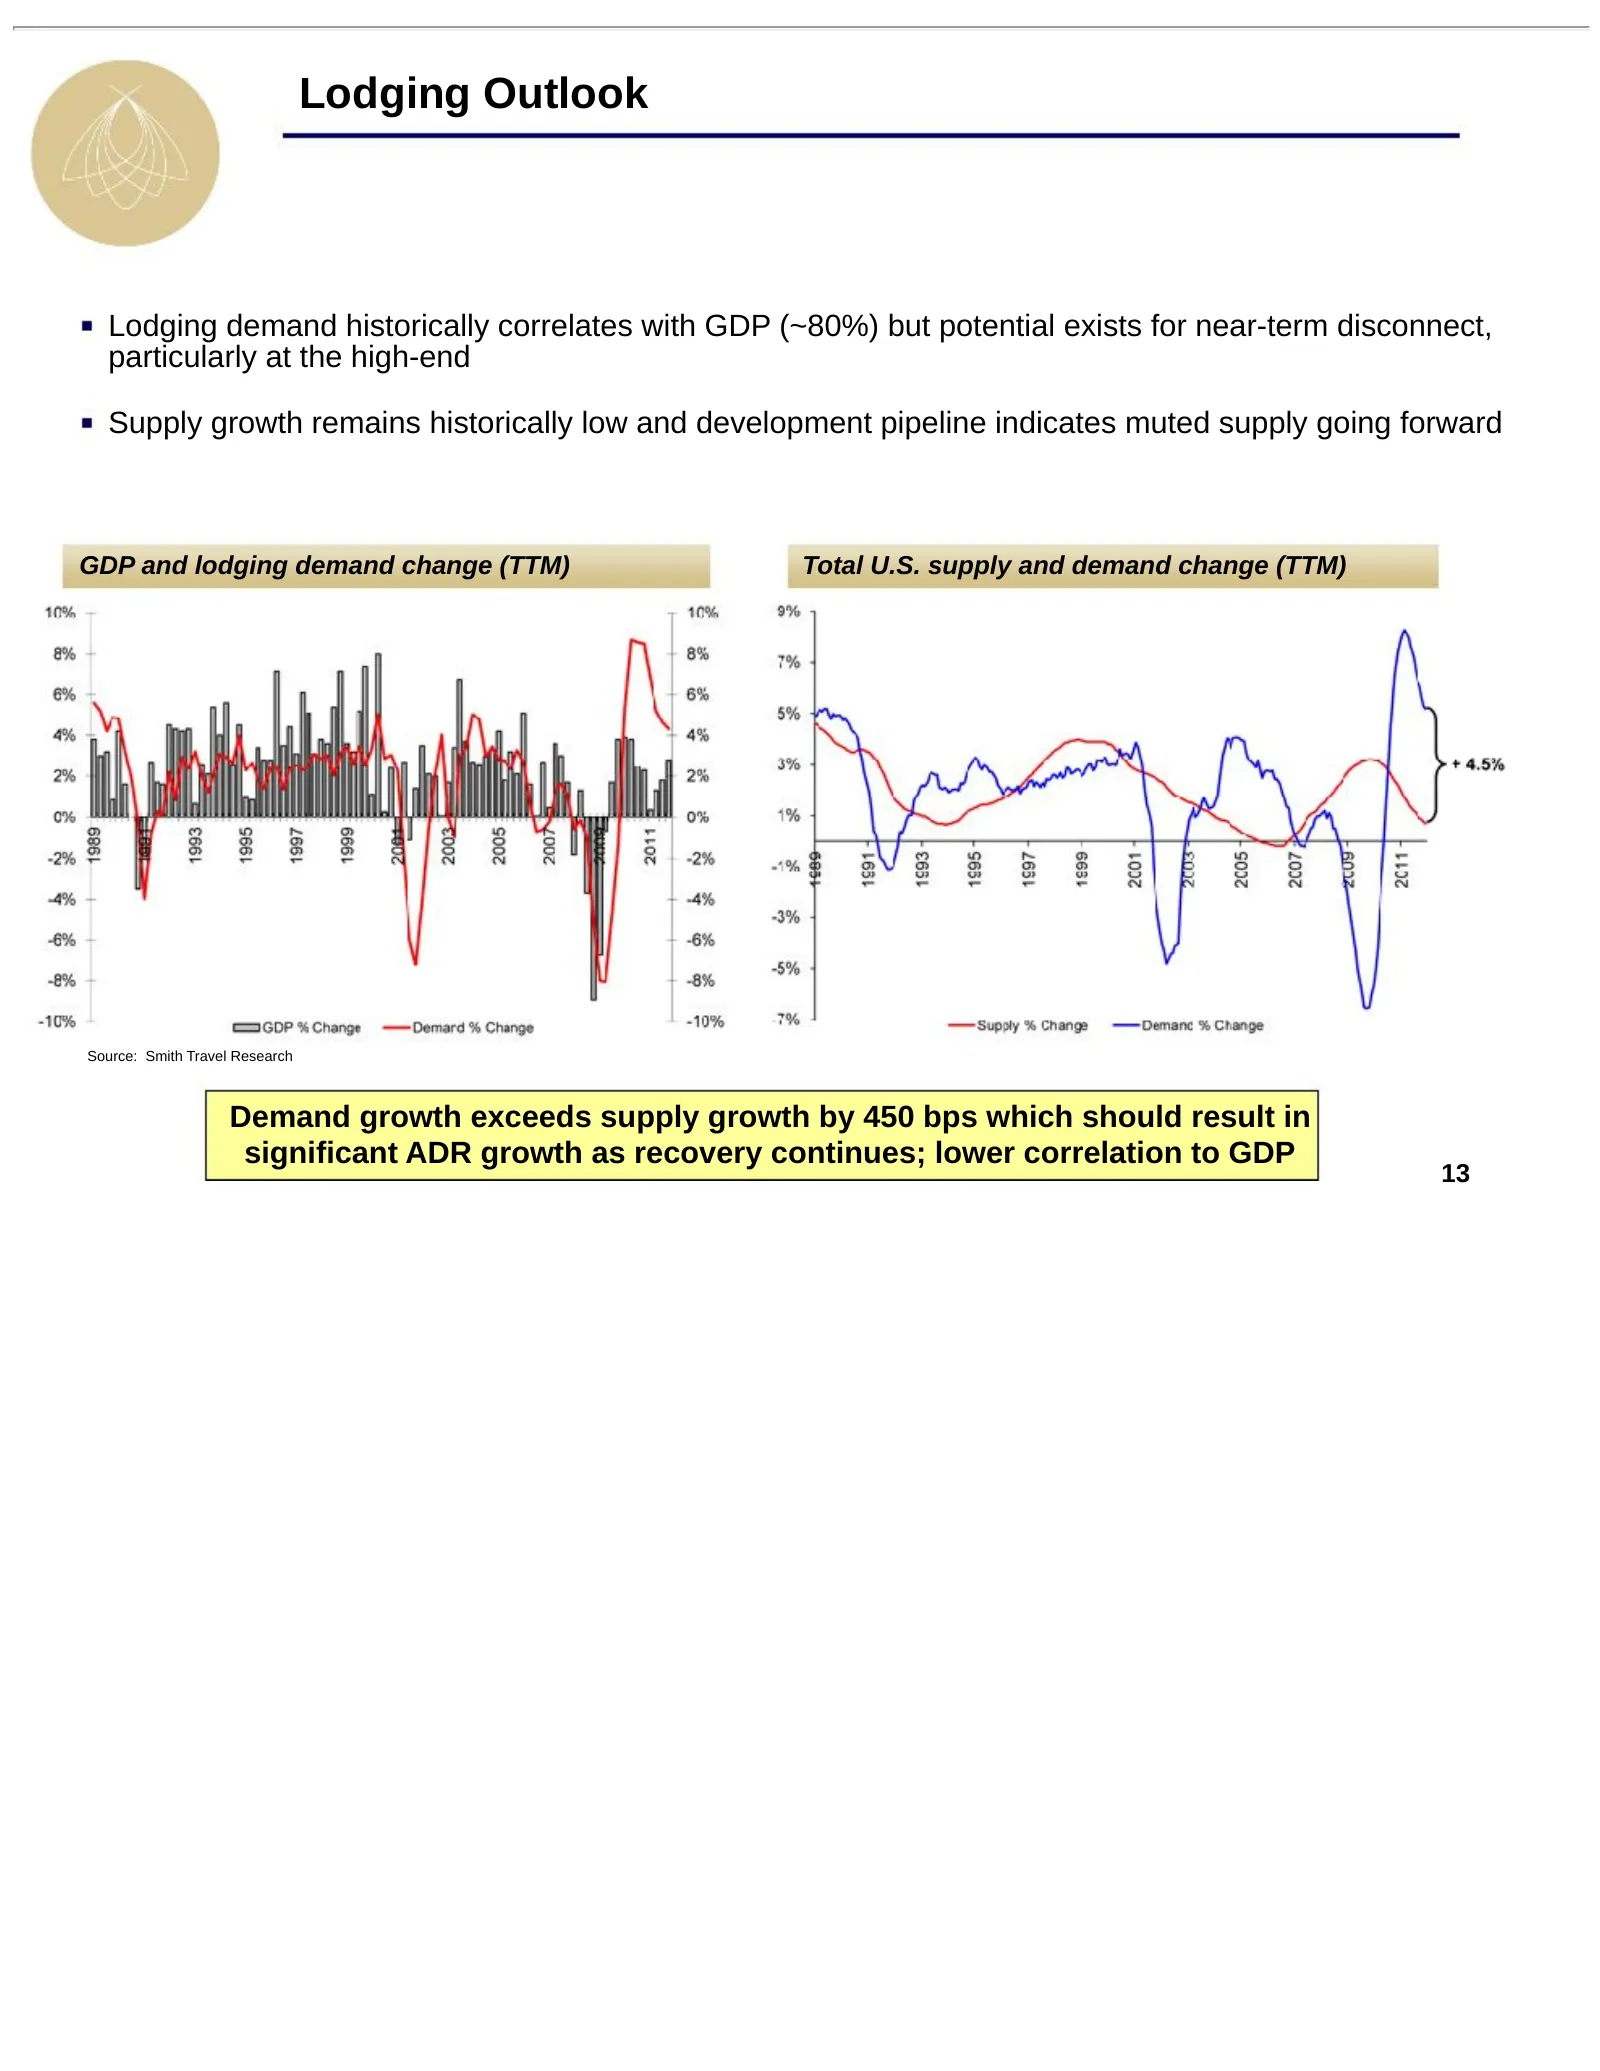
Lodging Outlook Lodging demand historically correlates with GDP (~80%) but potential exists for near-term disconnect, particularly at the high-end Supply growth remains historically low and development pipeline indicates muted supply going forward GDP and lodging demand change (TTM) Total U.S. suppl
Slide 14: Favorable Supply Outlook
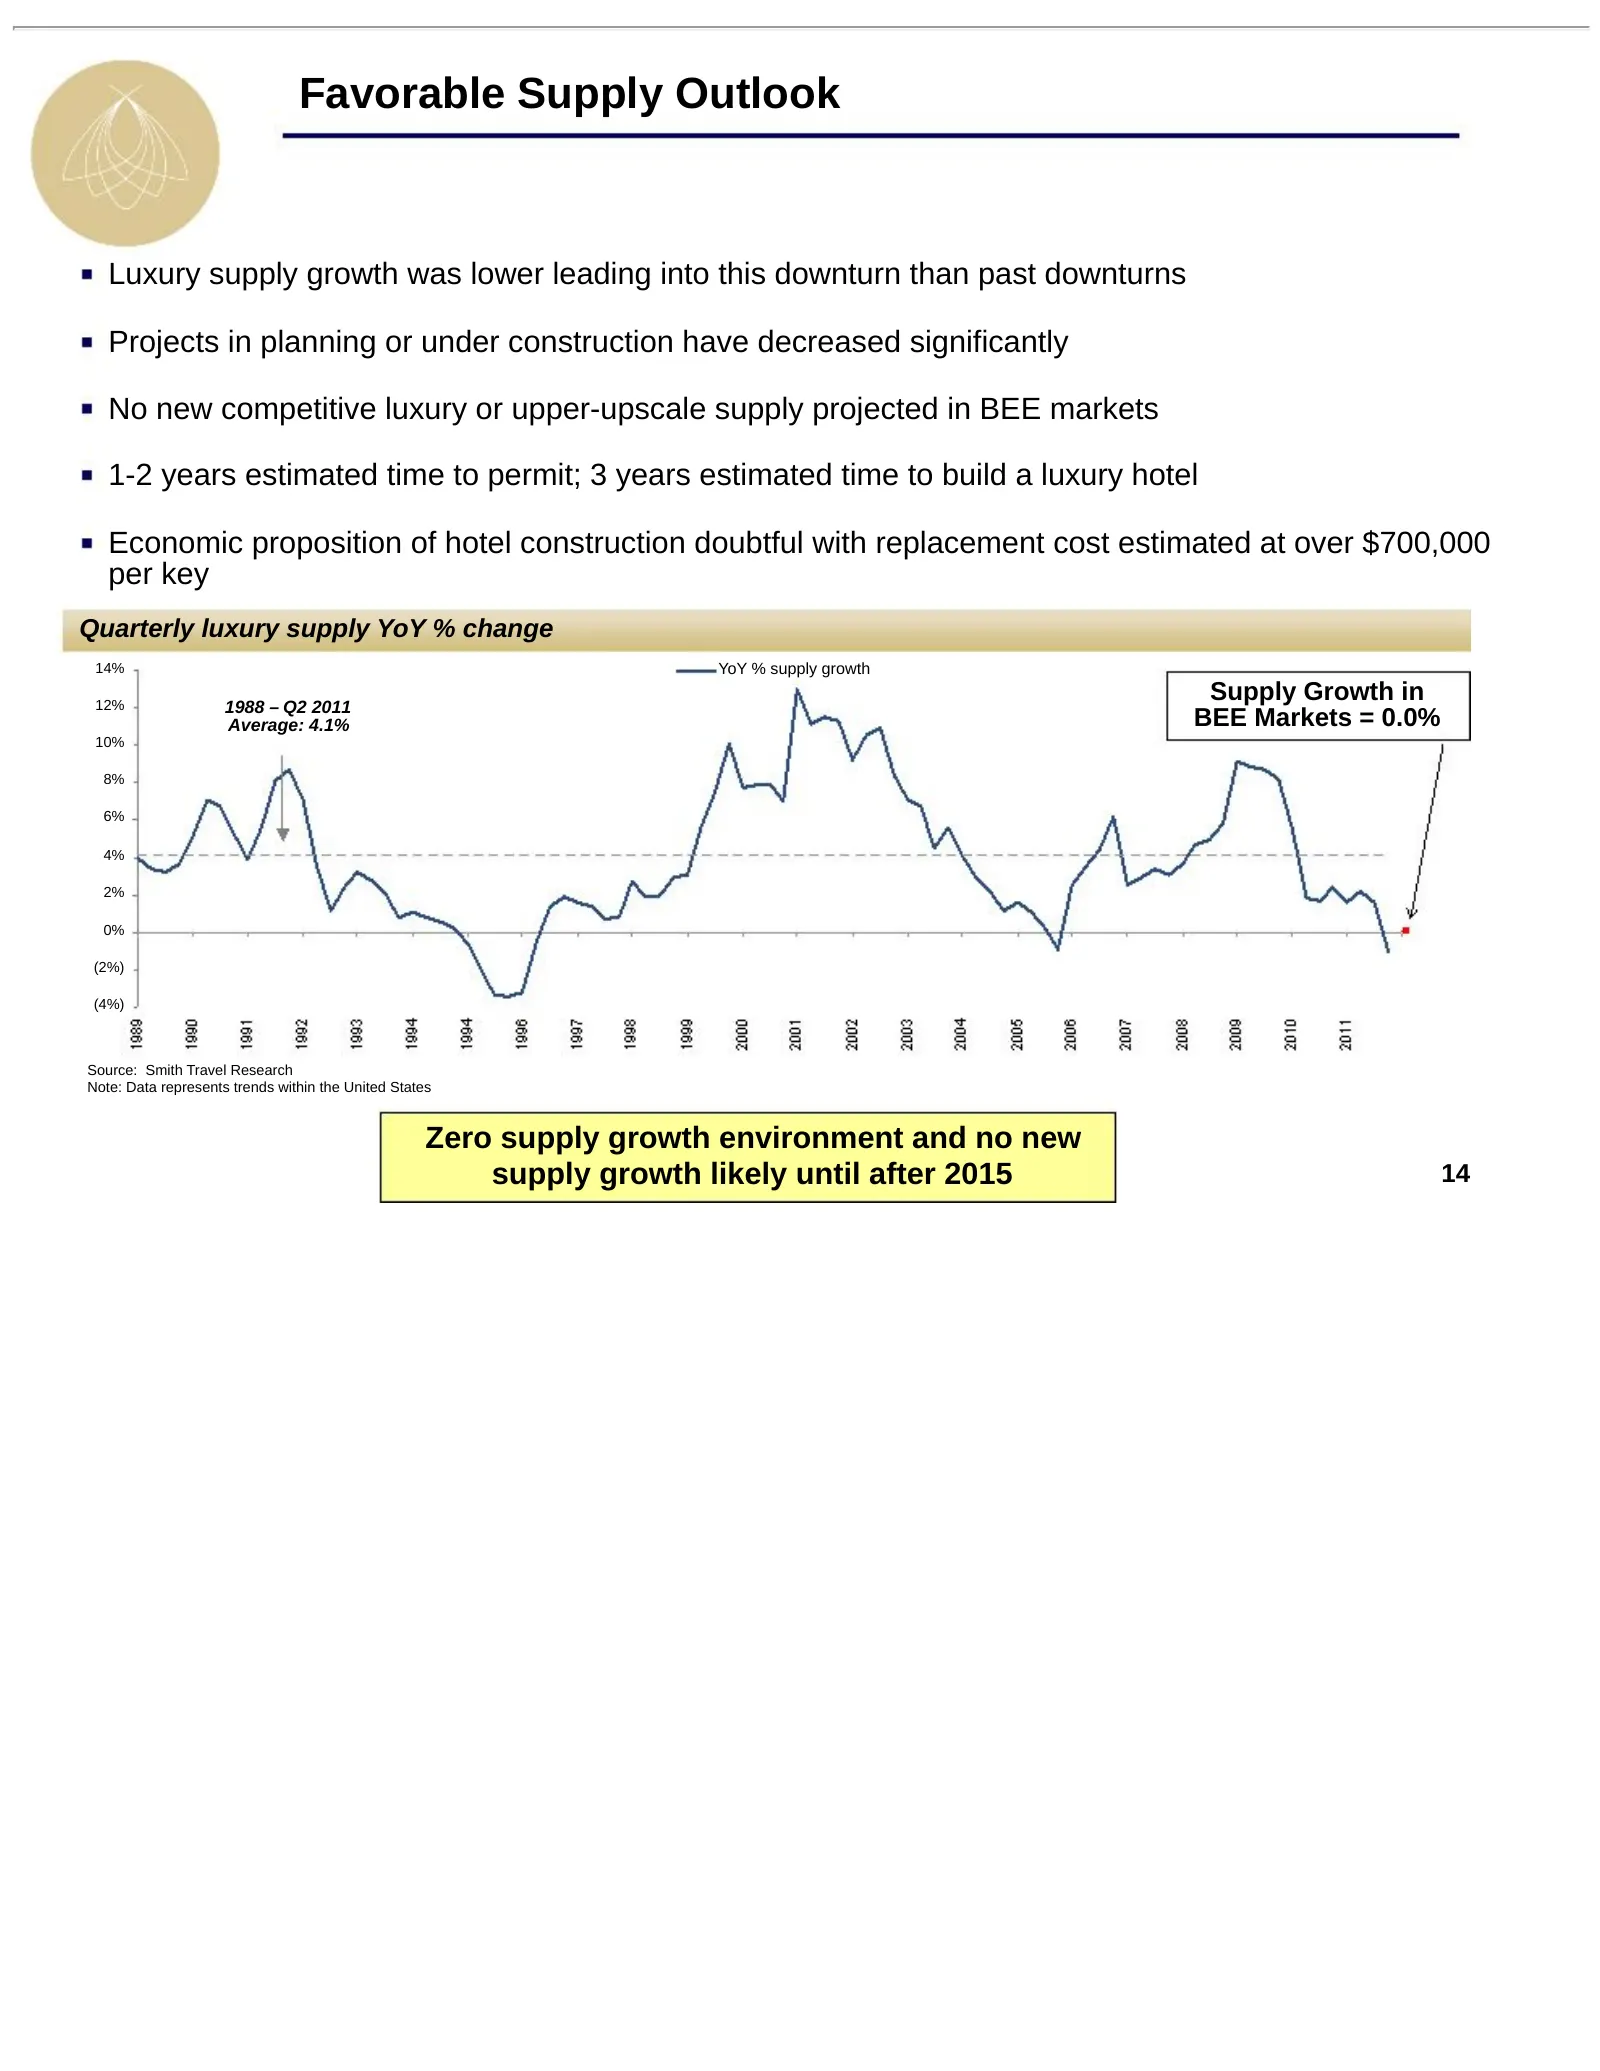
Favorable Supply Outlook Luxury supply growth was lower leading into this downturn than past downturns Projects in planning or under construction have decreased significantly No new competitive luxury or upper-upscale supply projected in BEE markets 1-2 years estimated time to permit; 3 years estima
Slide 15: Luxury Hotels Outperform in a Recovery
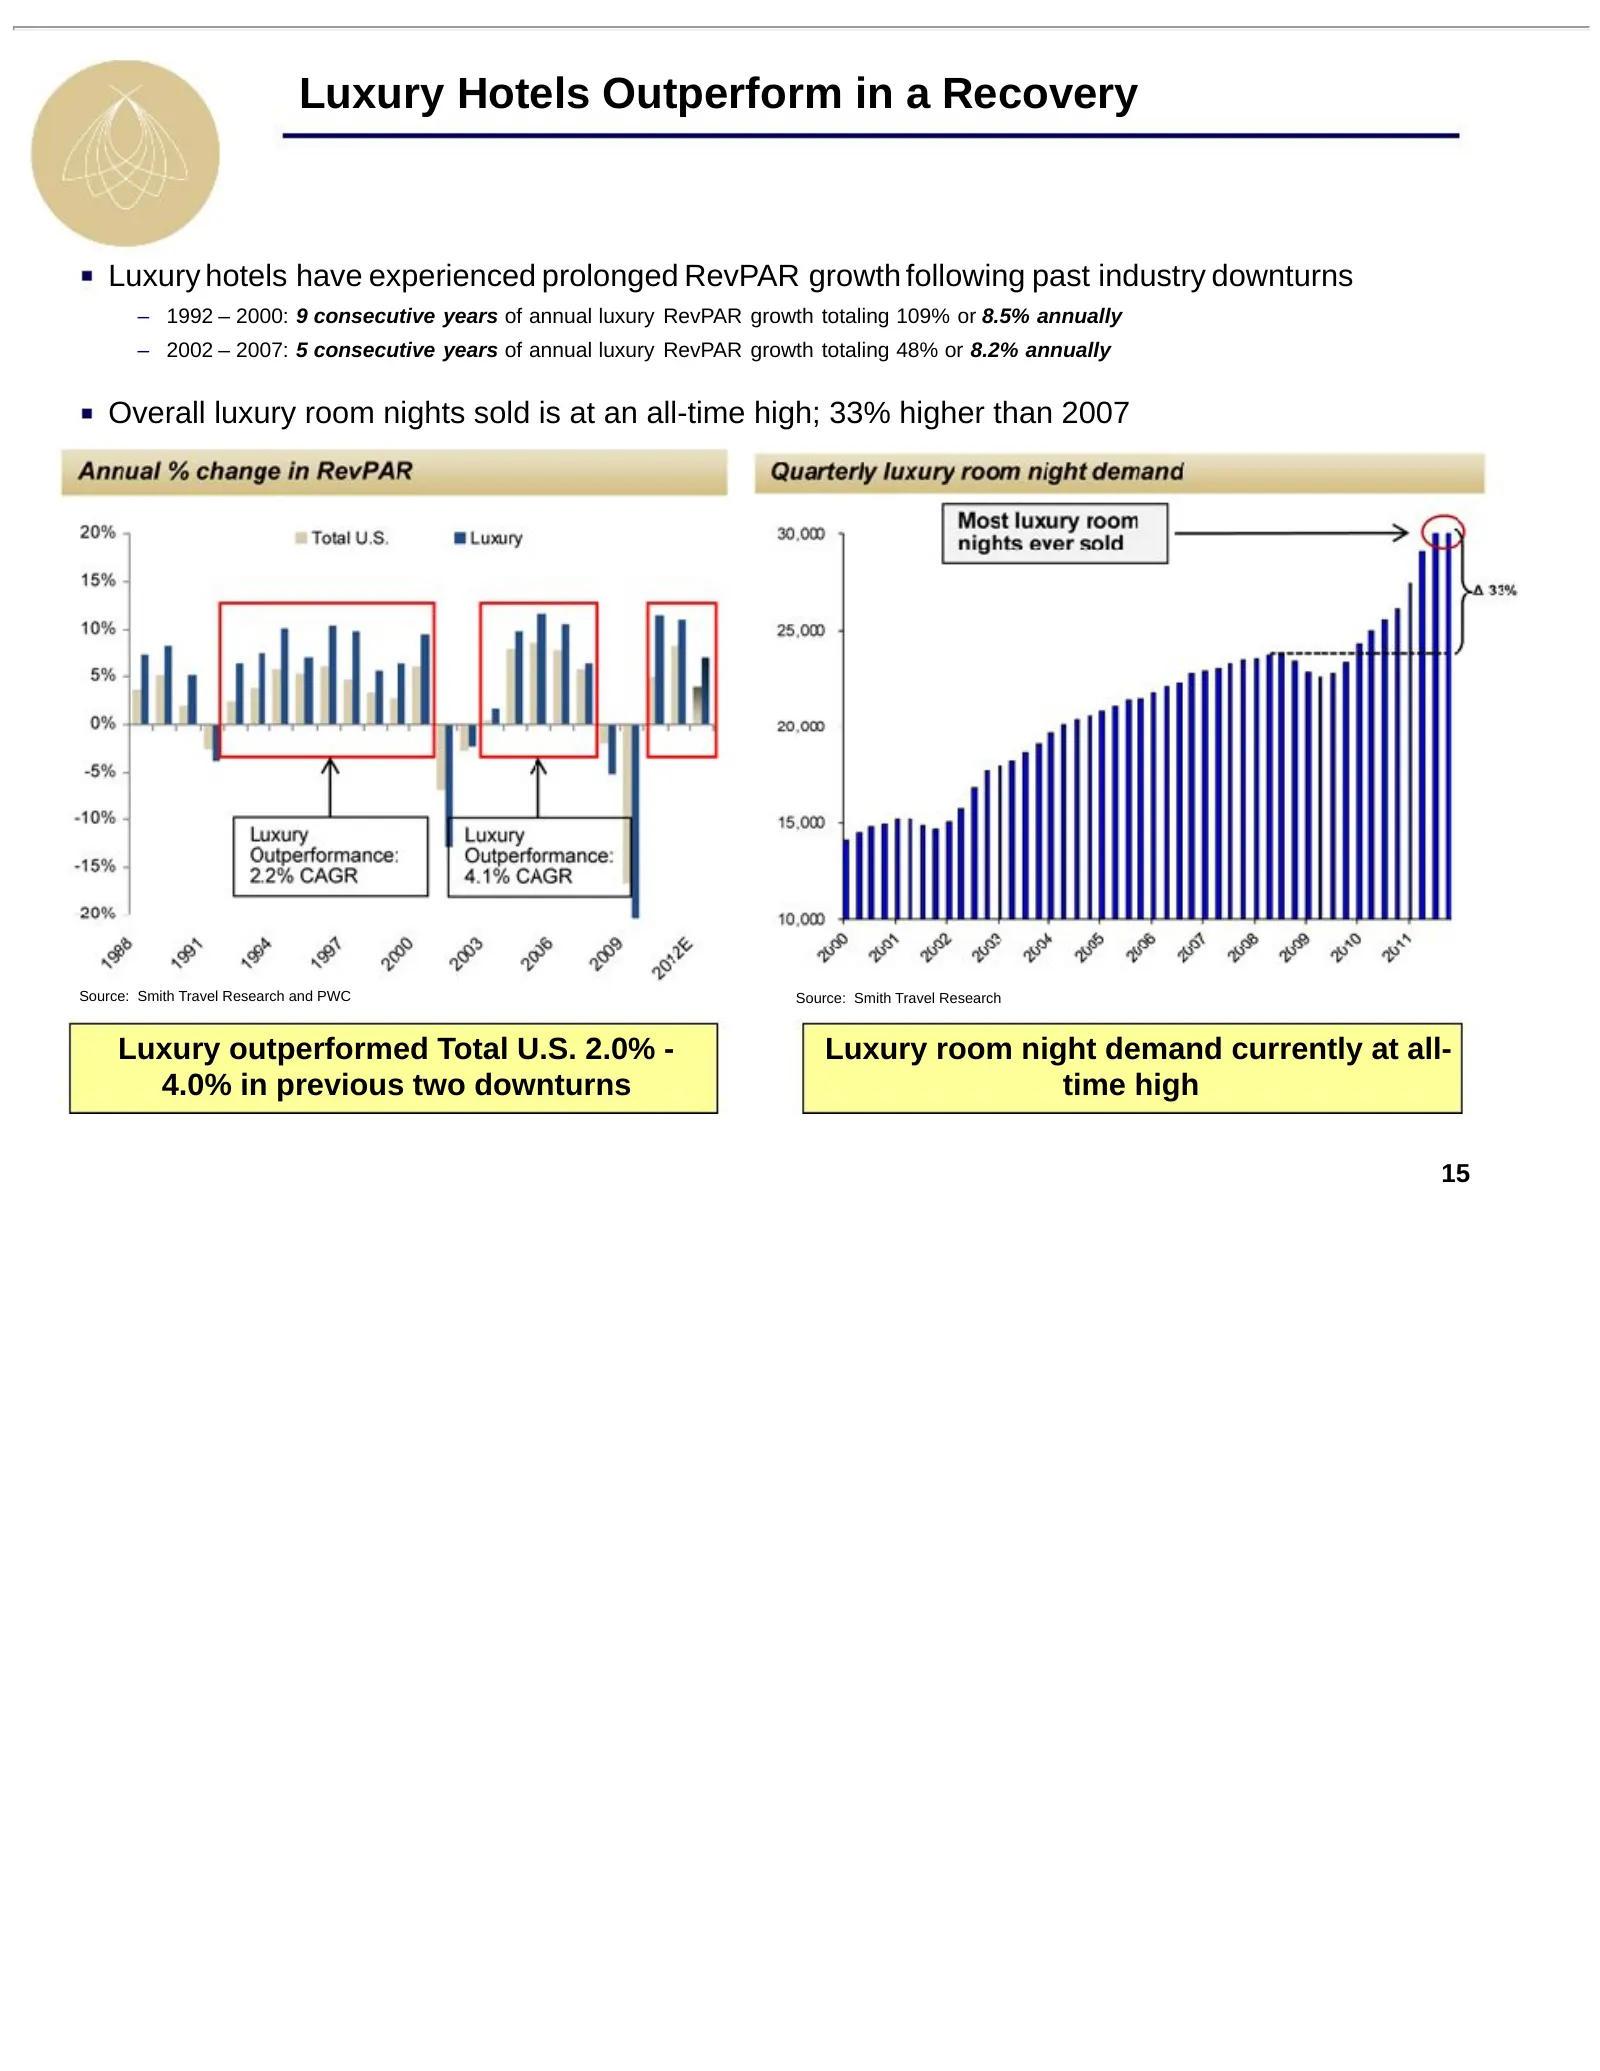
Luxury Hotels Outperform in a Recovery Luxury hotels have experienced prolonged RevPAR growth following past industry downturns – 1992 – 2000: 9 consecutive years of annual luxury RevPAR growth totaling 109% or 8.5% annually – 2002 – 2007: 5 consecutive years of annual luxury RevPAR growth totaling
Slide 16: BEE Positioning Compared to Peers
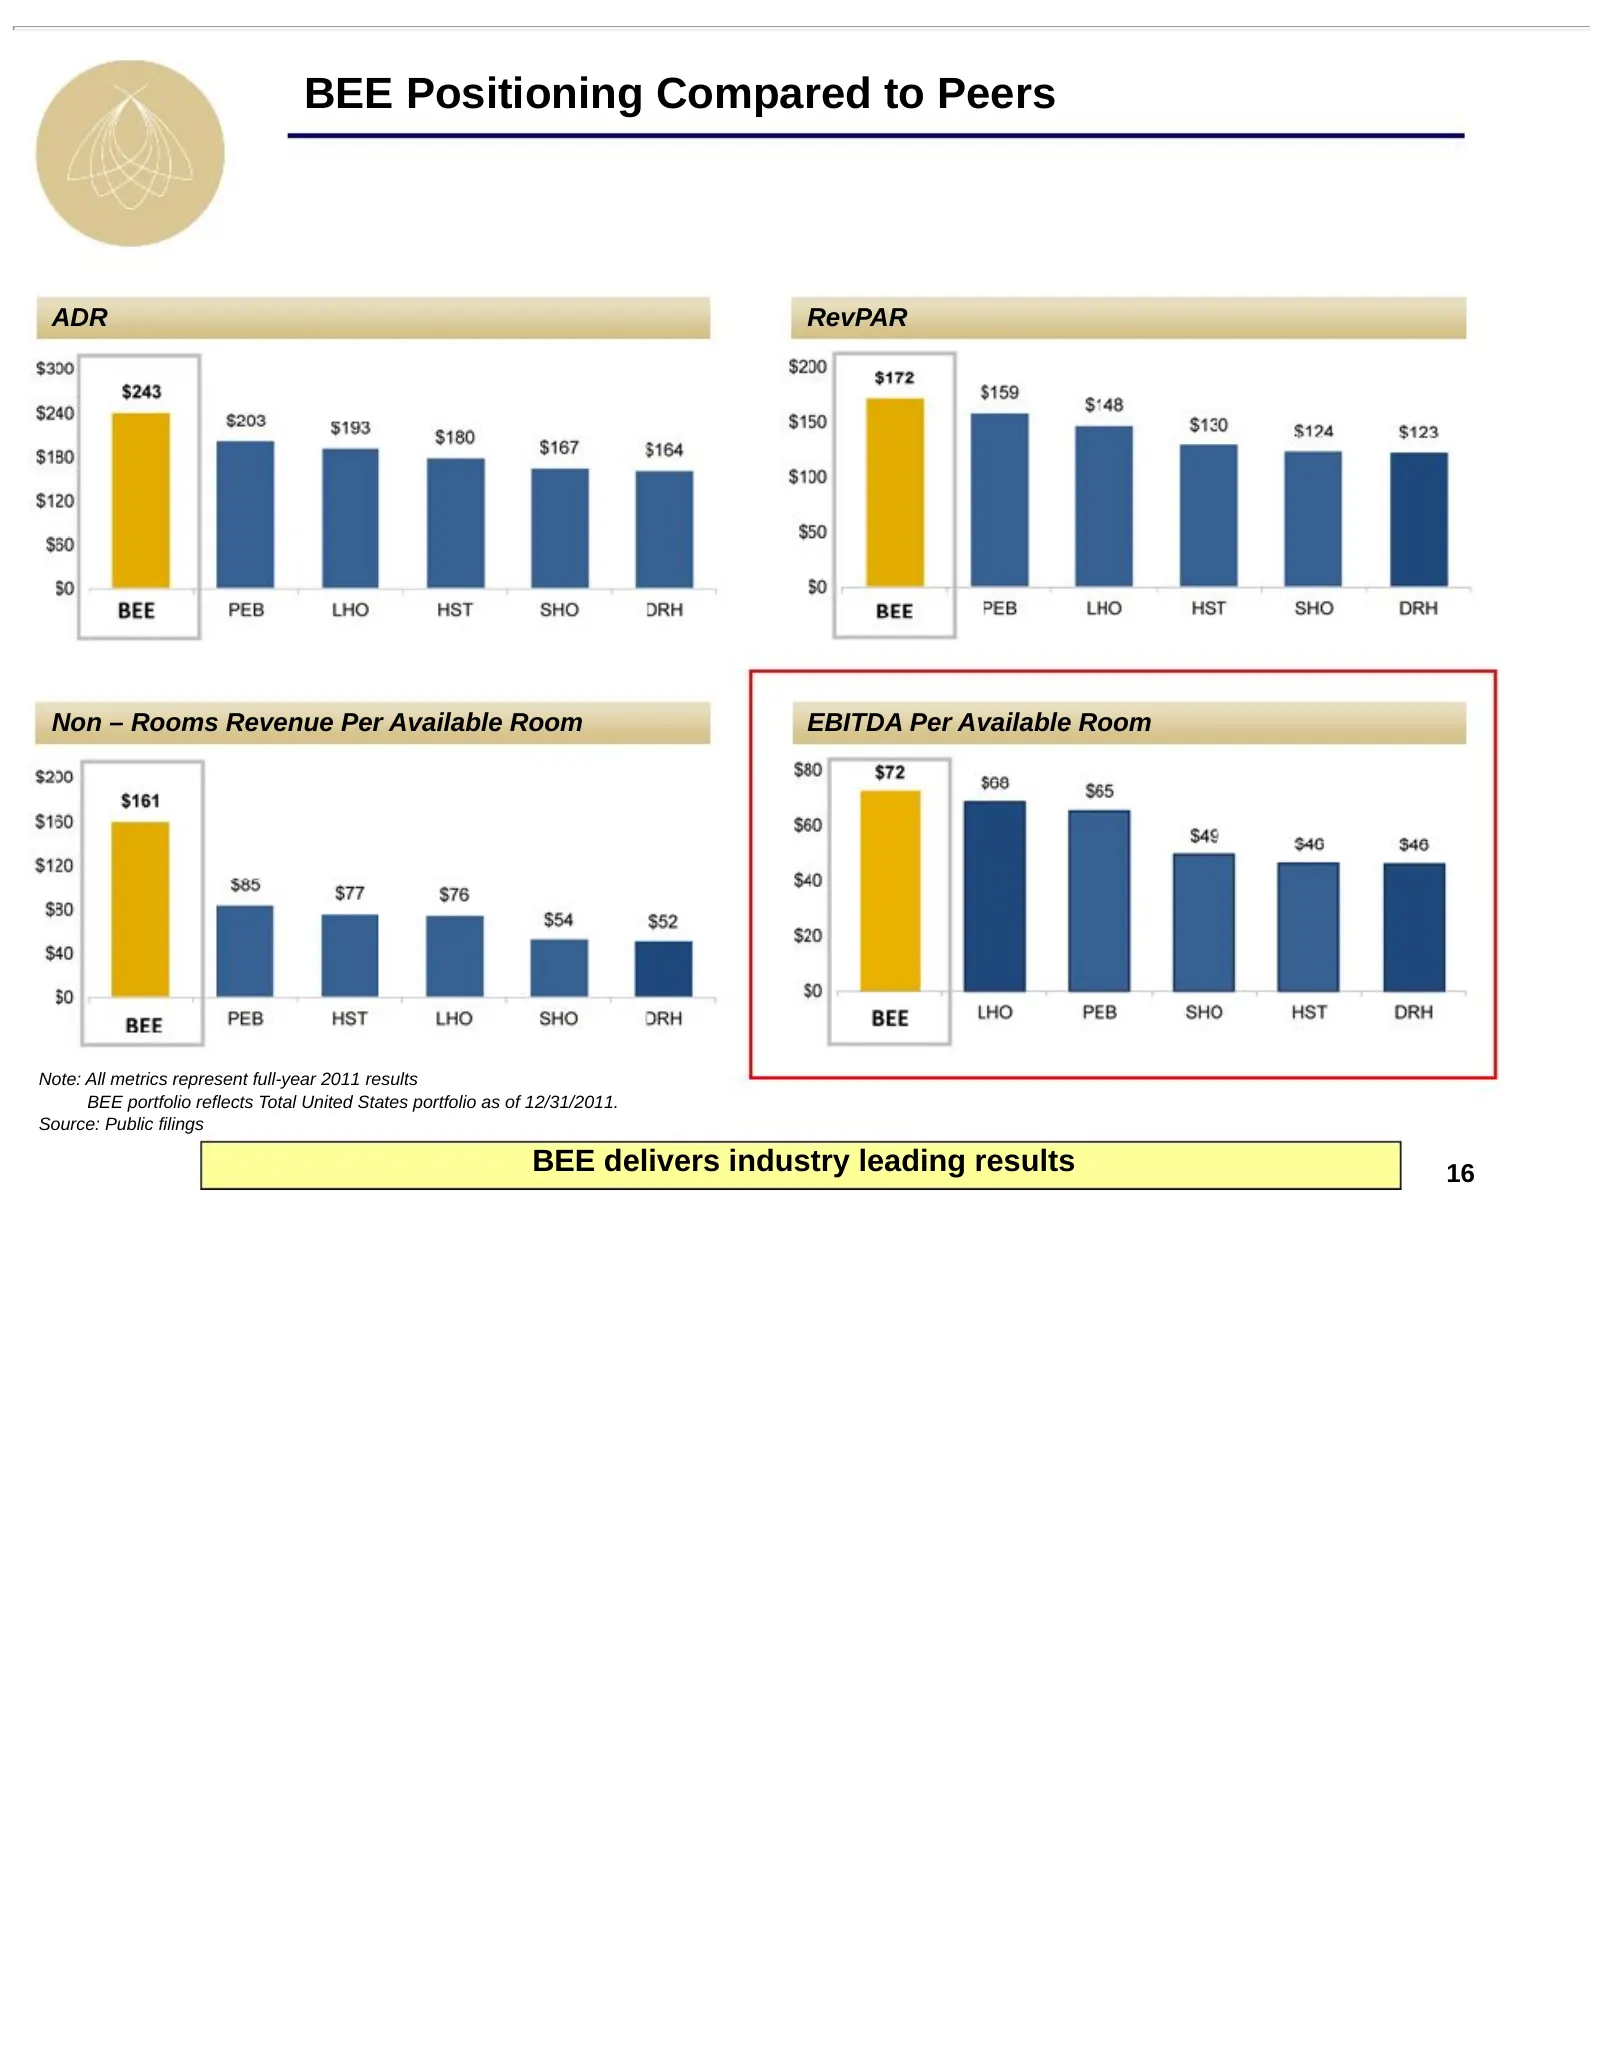
BEE Positioning Compared to Peers ADR RevPAR Non – Rooms Revenue Per Available Room EBITDA Per Available Room Note: All metrics represent full-year 2011 results BEE portfolio reflects Total United States portfolio as of 12/31/2011. Source: Public filings BEE delivers industry leading results 16
Slide 17: BEE Revenue Mix Compared to Peers
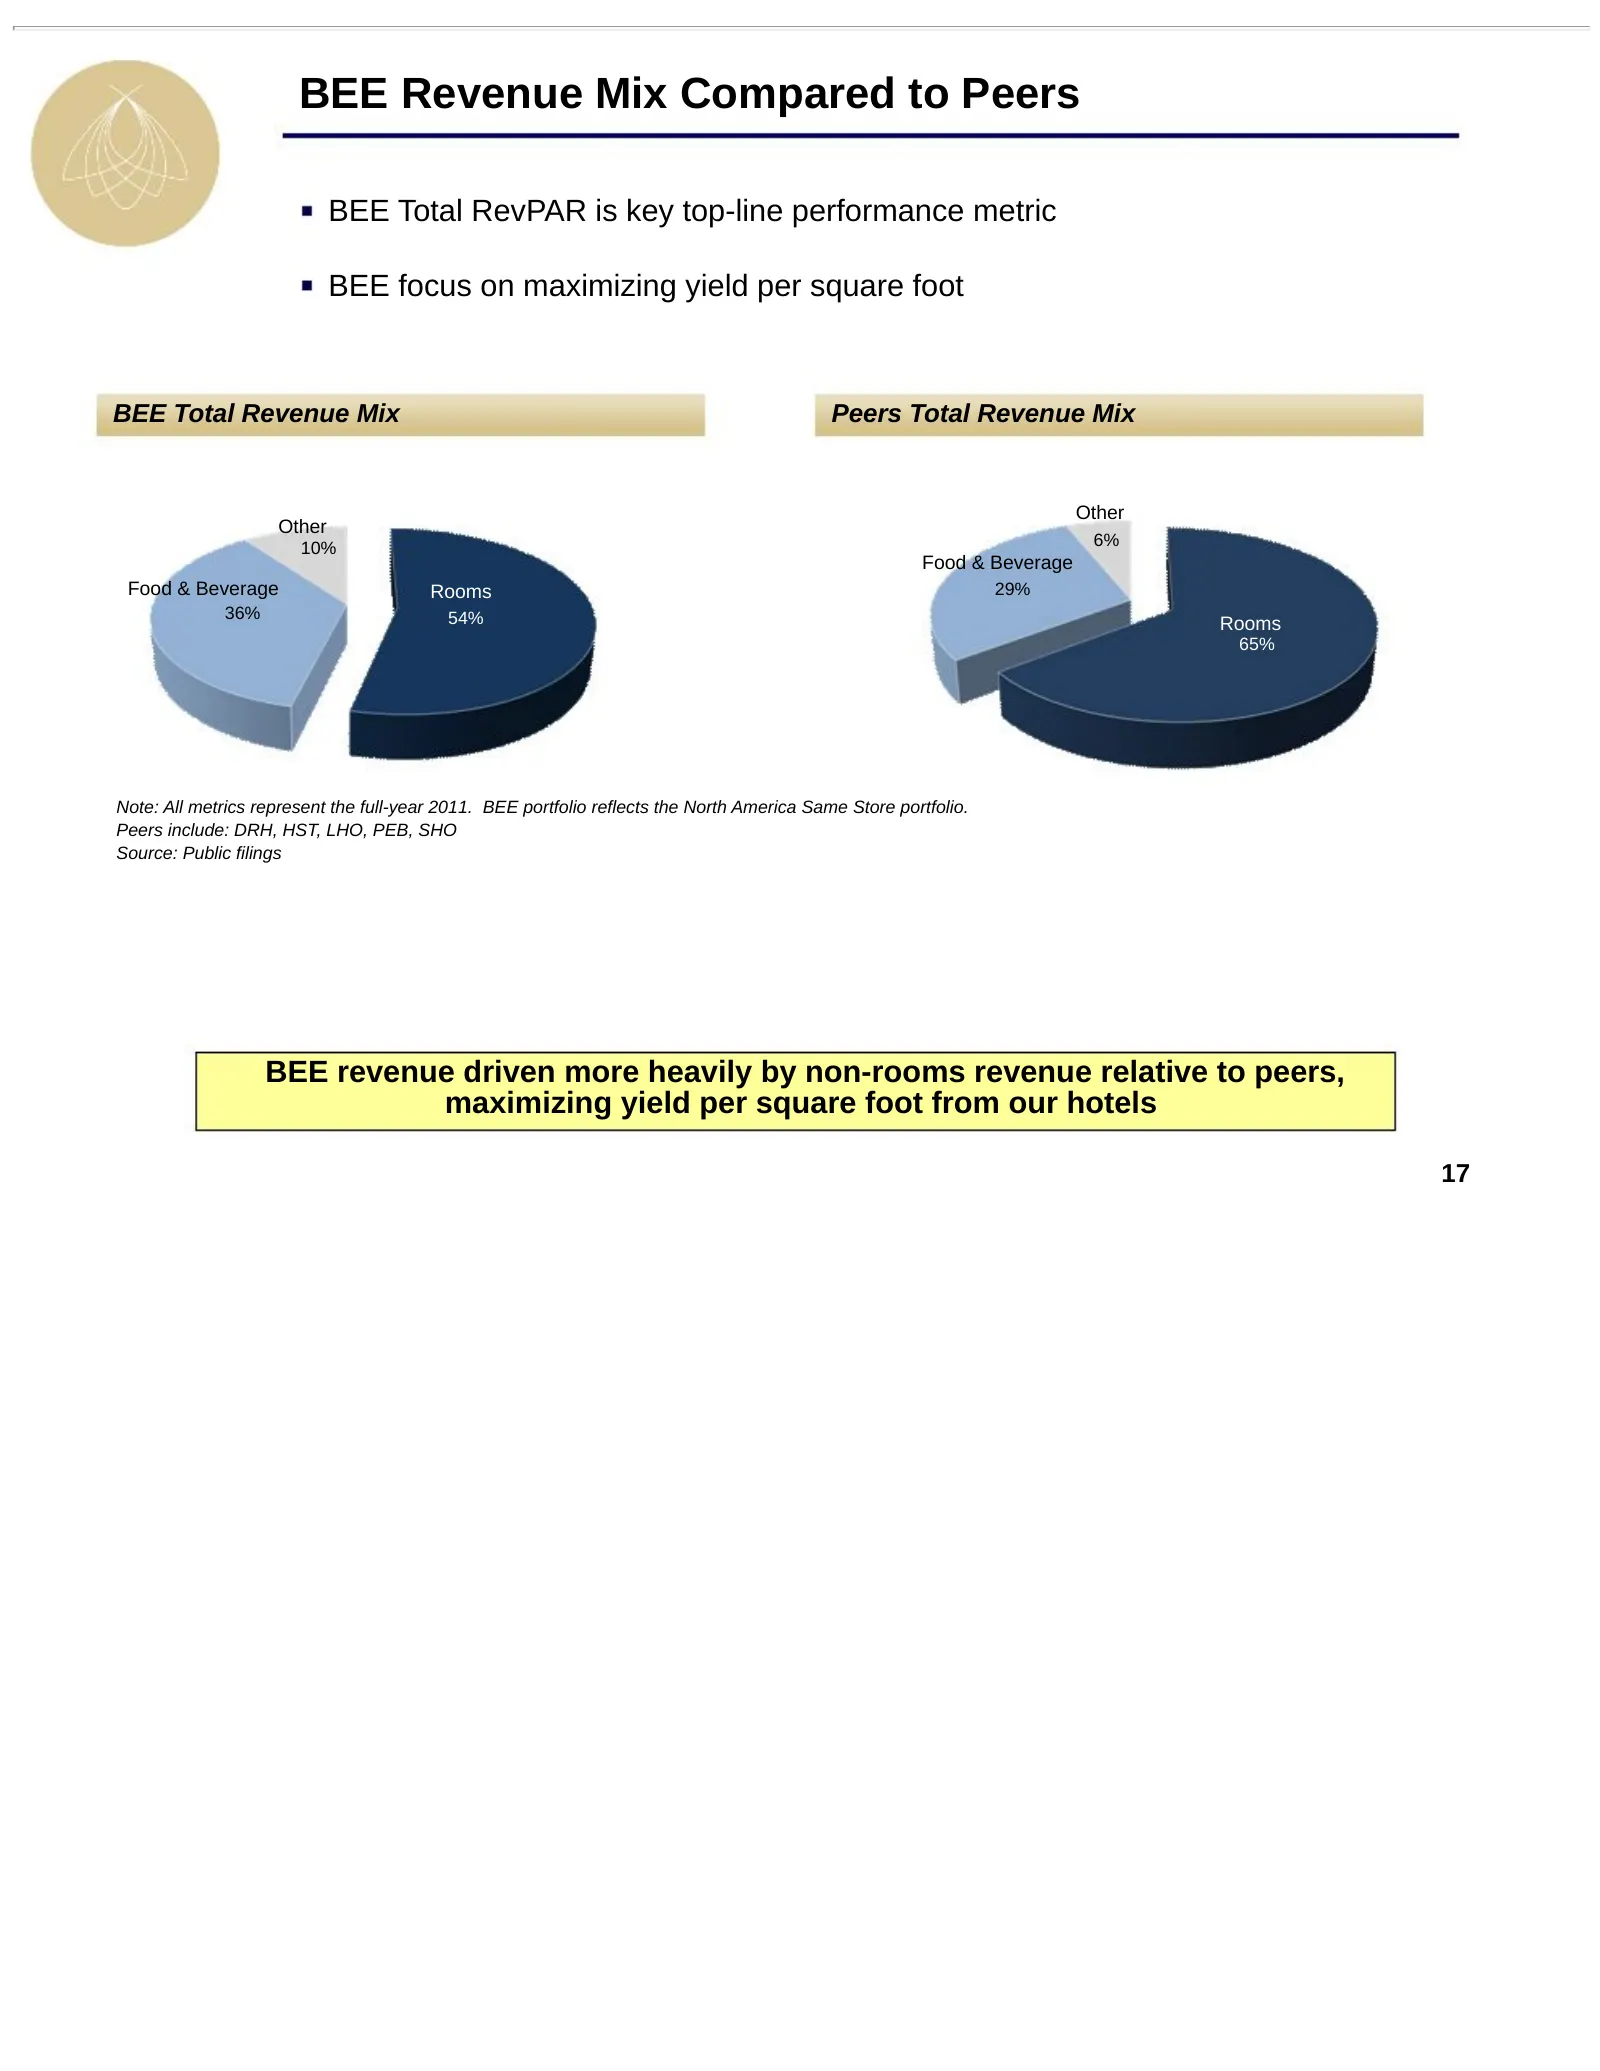
BEE Revenue Mix Compared to Peers BEE Total RevPAR is key top-line performance metric BEE focus on maximizing yield per square foot BEE Total Revenue Mix Peers Total Revenue Mix Other Other 10% 6% Food & Beverage Food & Beverage Rooms 29% 36% 54% Rooms 65% Note: All metrics represent the full-year 2
Slide 18: BEE Revenue Mix
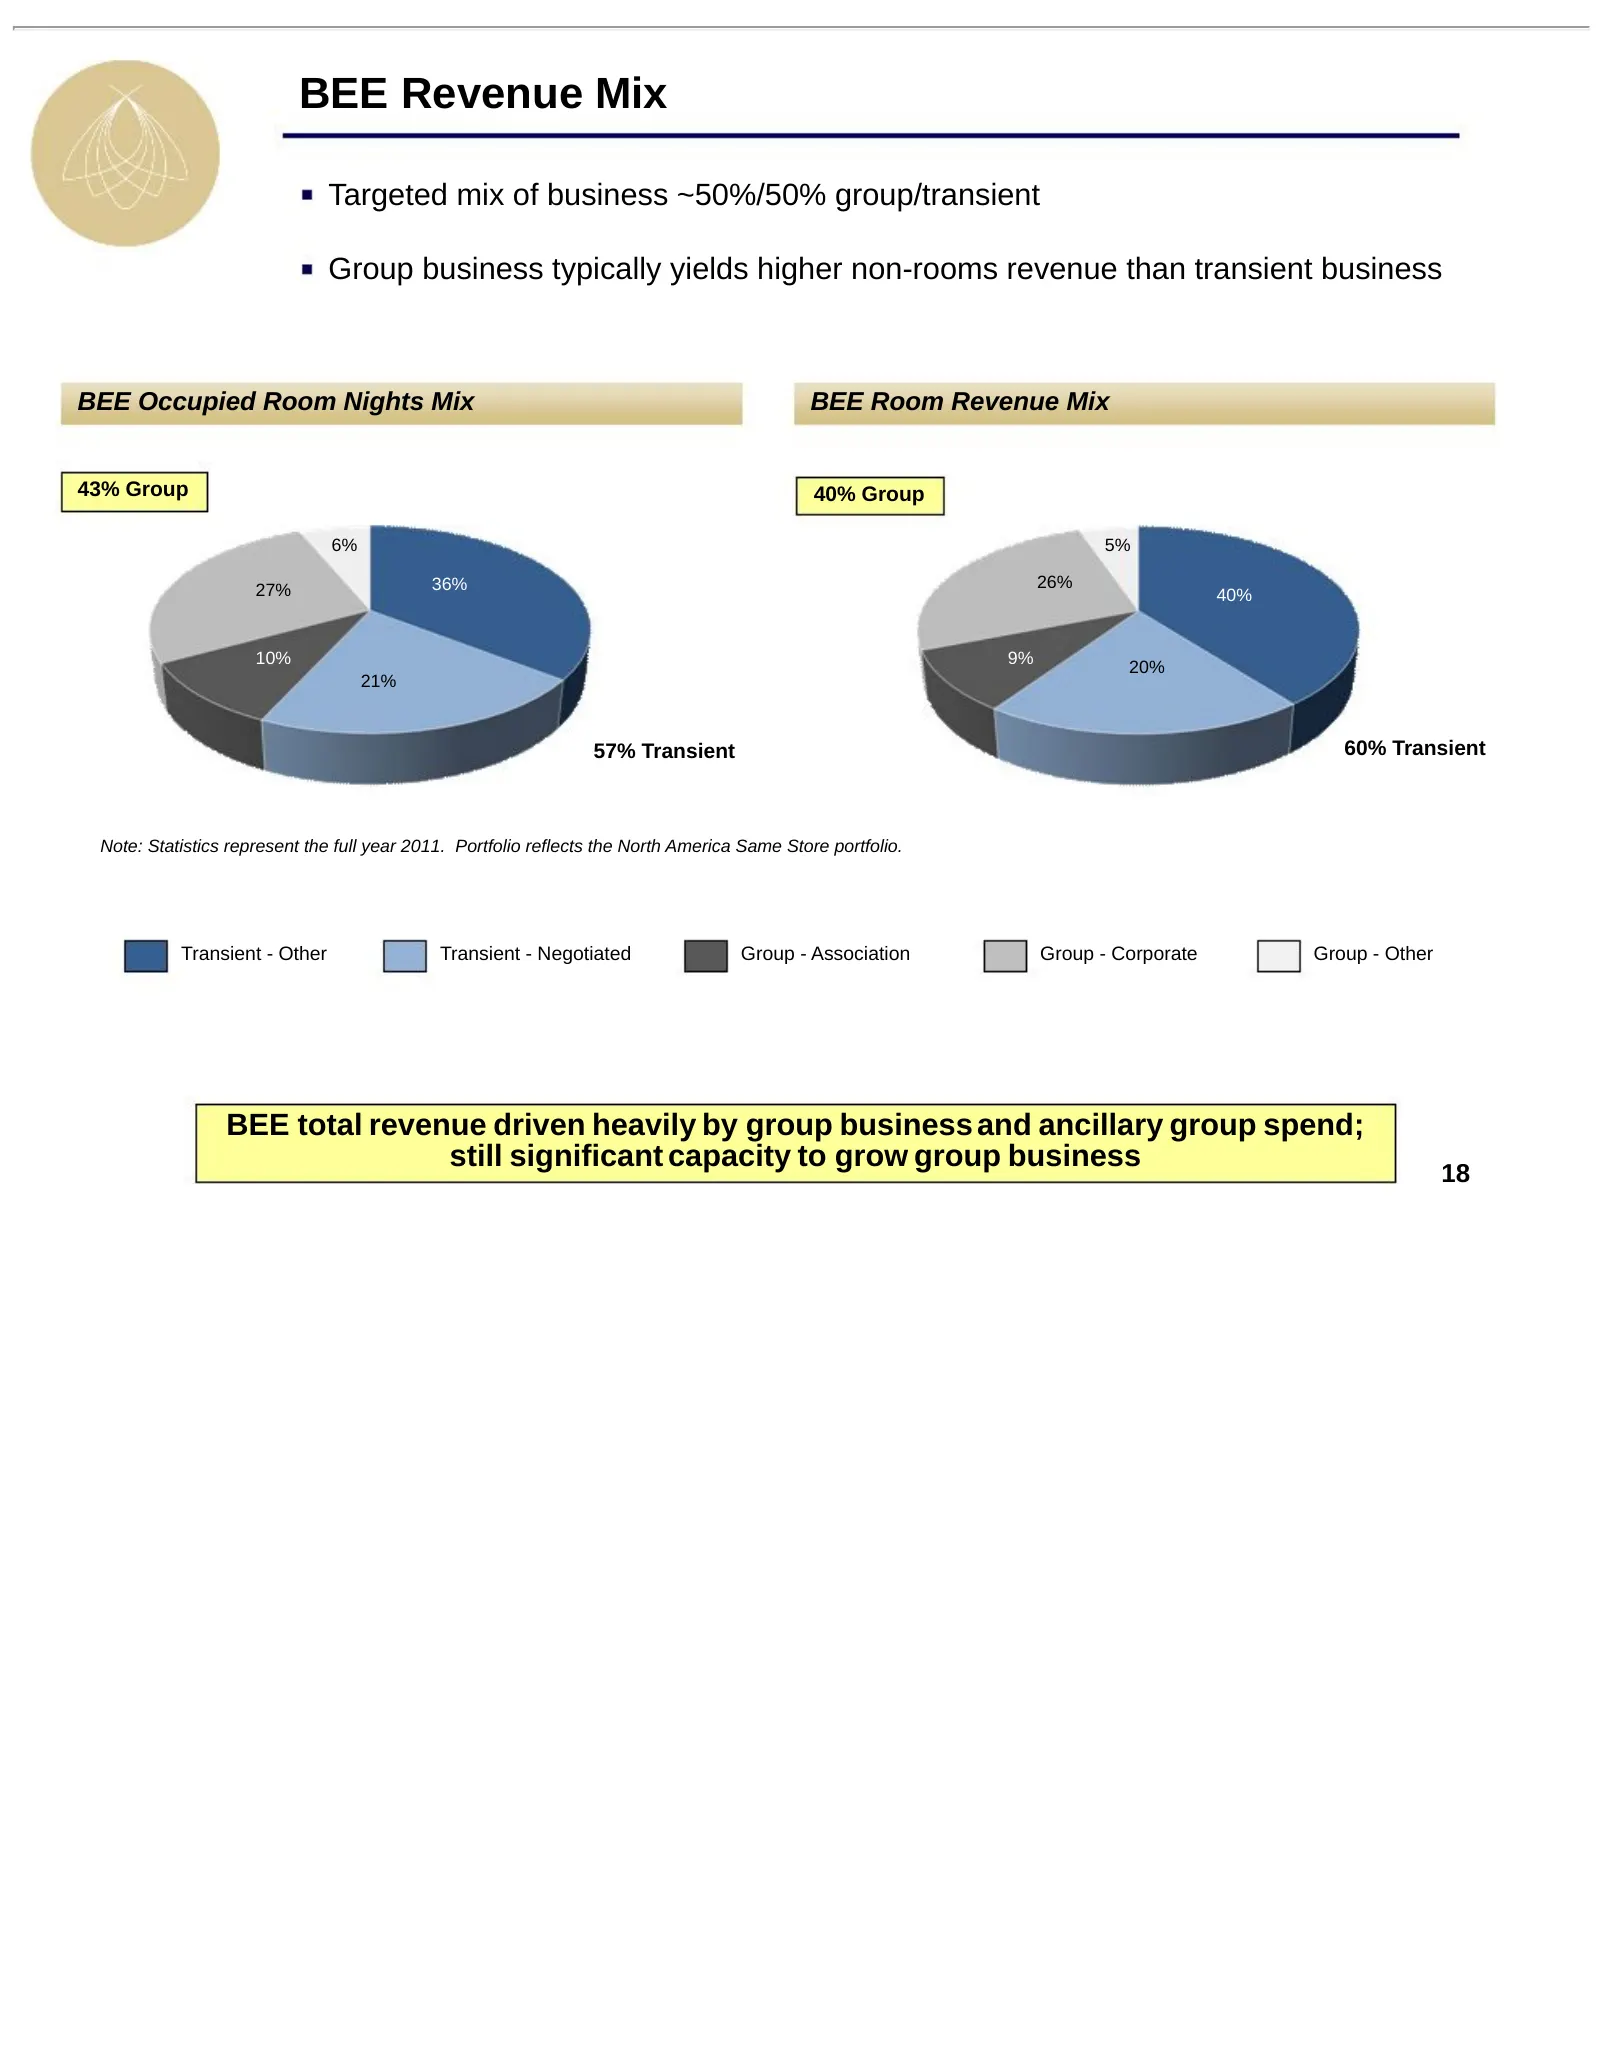
BEE Revenue Mix Targeted mix of business ~50%/50% group/transient Group business typically yields higher non-rooms revenue than transient business BEE Occupied Room Nights Mix BEE Room Revenue Mix 43% Group 40% Group 6% 5% 27% 36% 26% 40% 10% 9% 20% 21% 57% Transient 60% Transient Note: Statistics r
Slide 19: Industry Leading Operating Margins
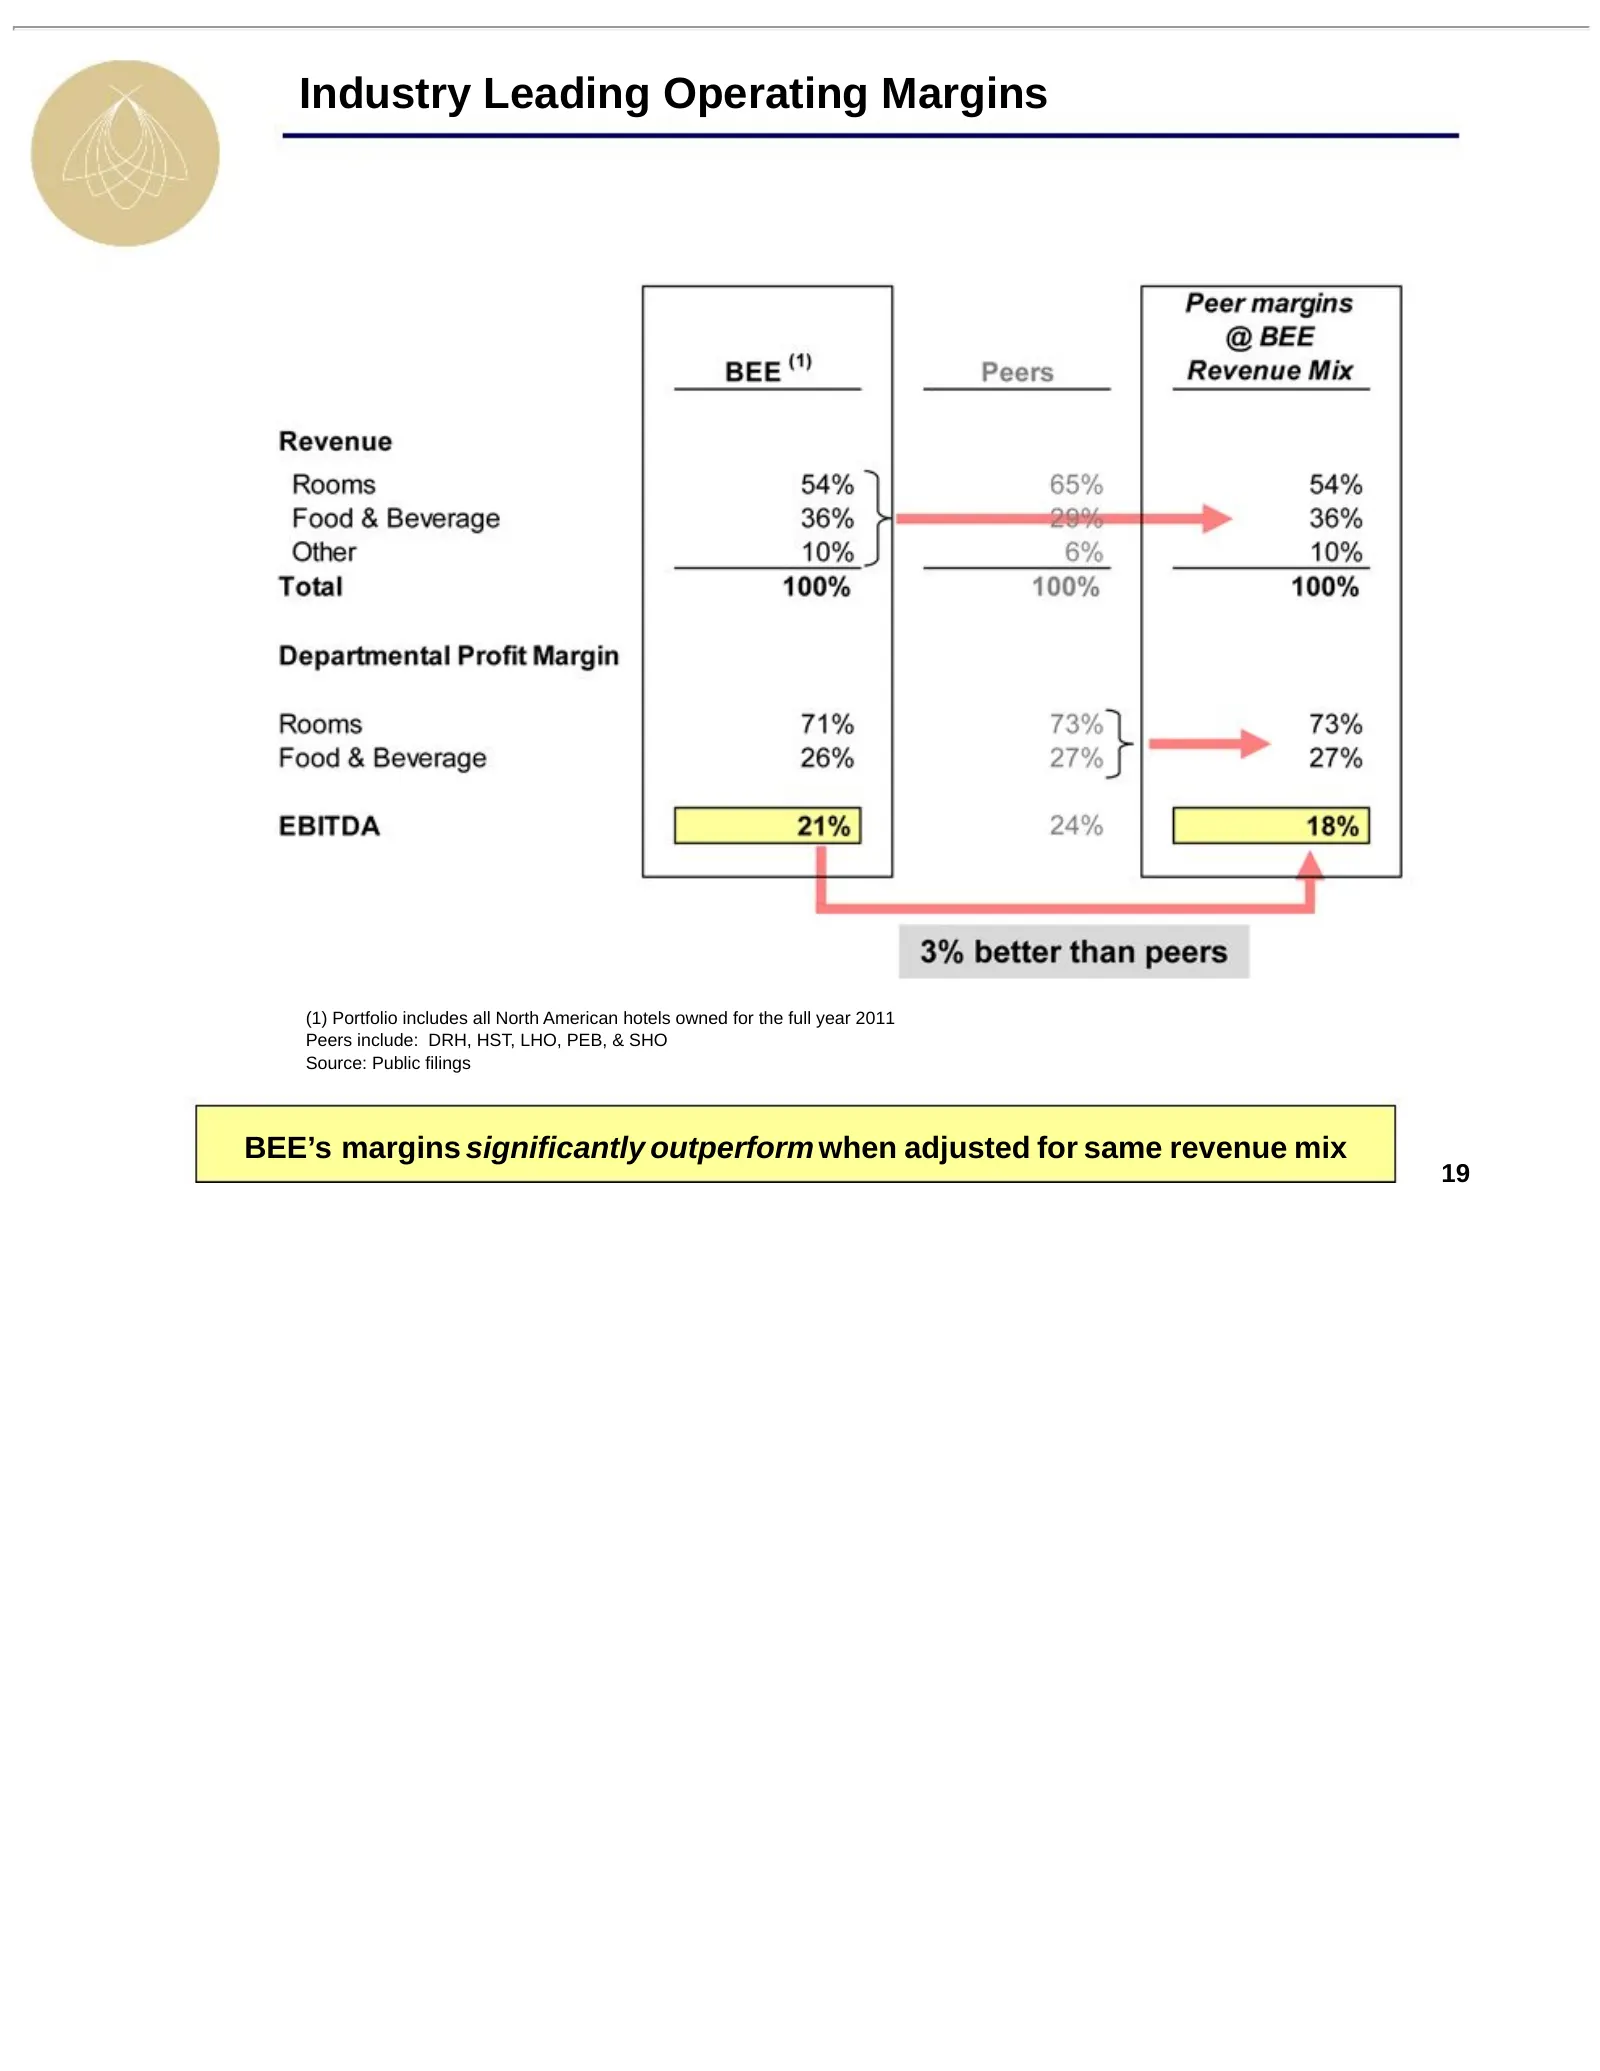
Industry Leading Operating Margins (1) Portfolio includes all North American hotels owned for the full year 2011 Peers include: DRH, HST, LHO, PEB, & SHO Source: Public filings BEE’s margins significantly outperform when adjusted for same revenue mix 19
Slide 20: Agenda
Agenda I. BEE’s Unique Value Proposition II. Company Overview III. Industry Update IV. Operating Trends 20
Slide 21: Group Booking Outlook
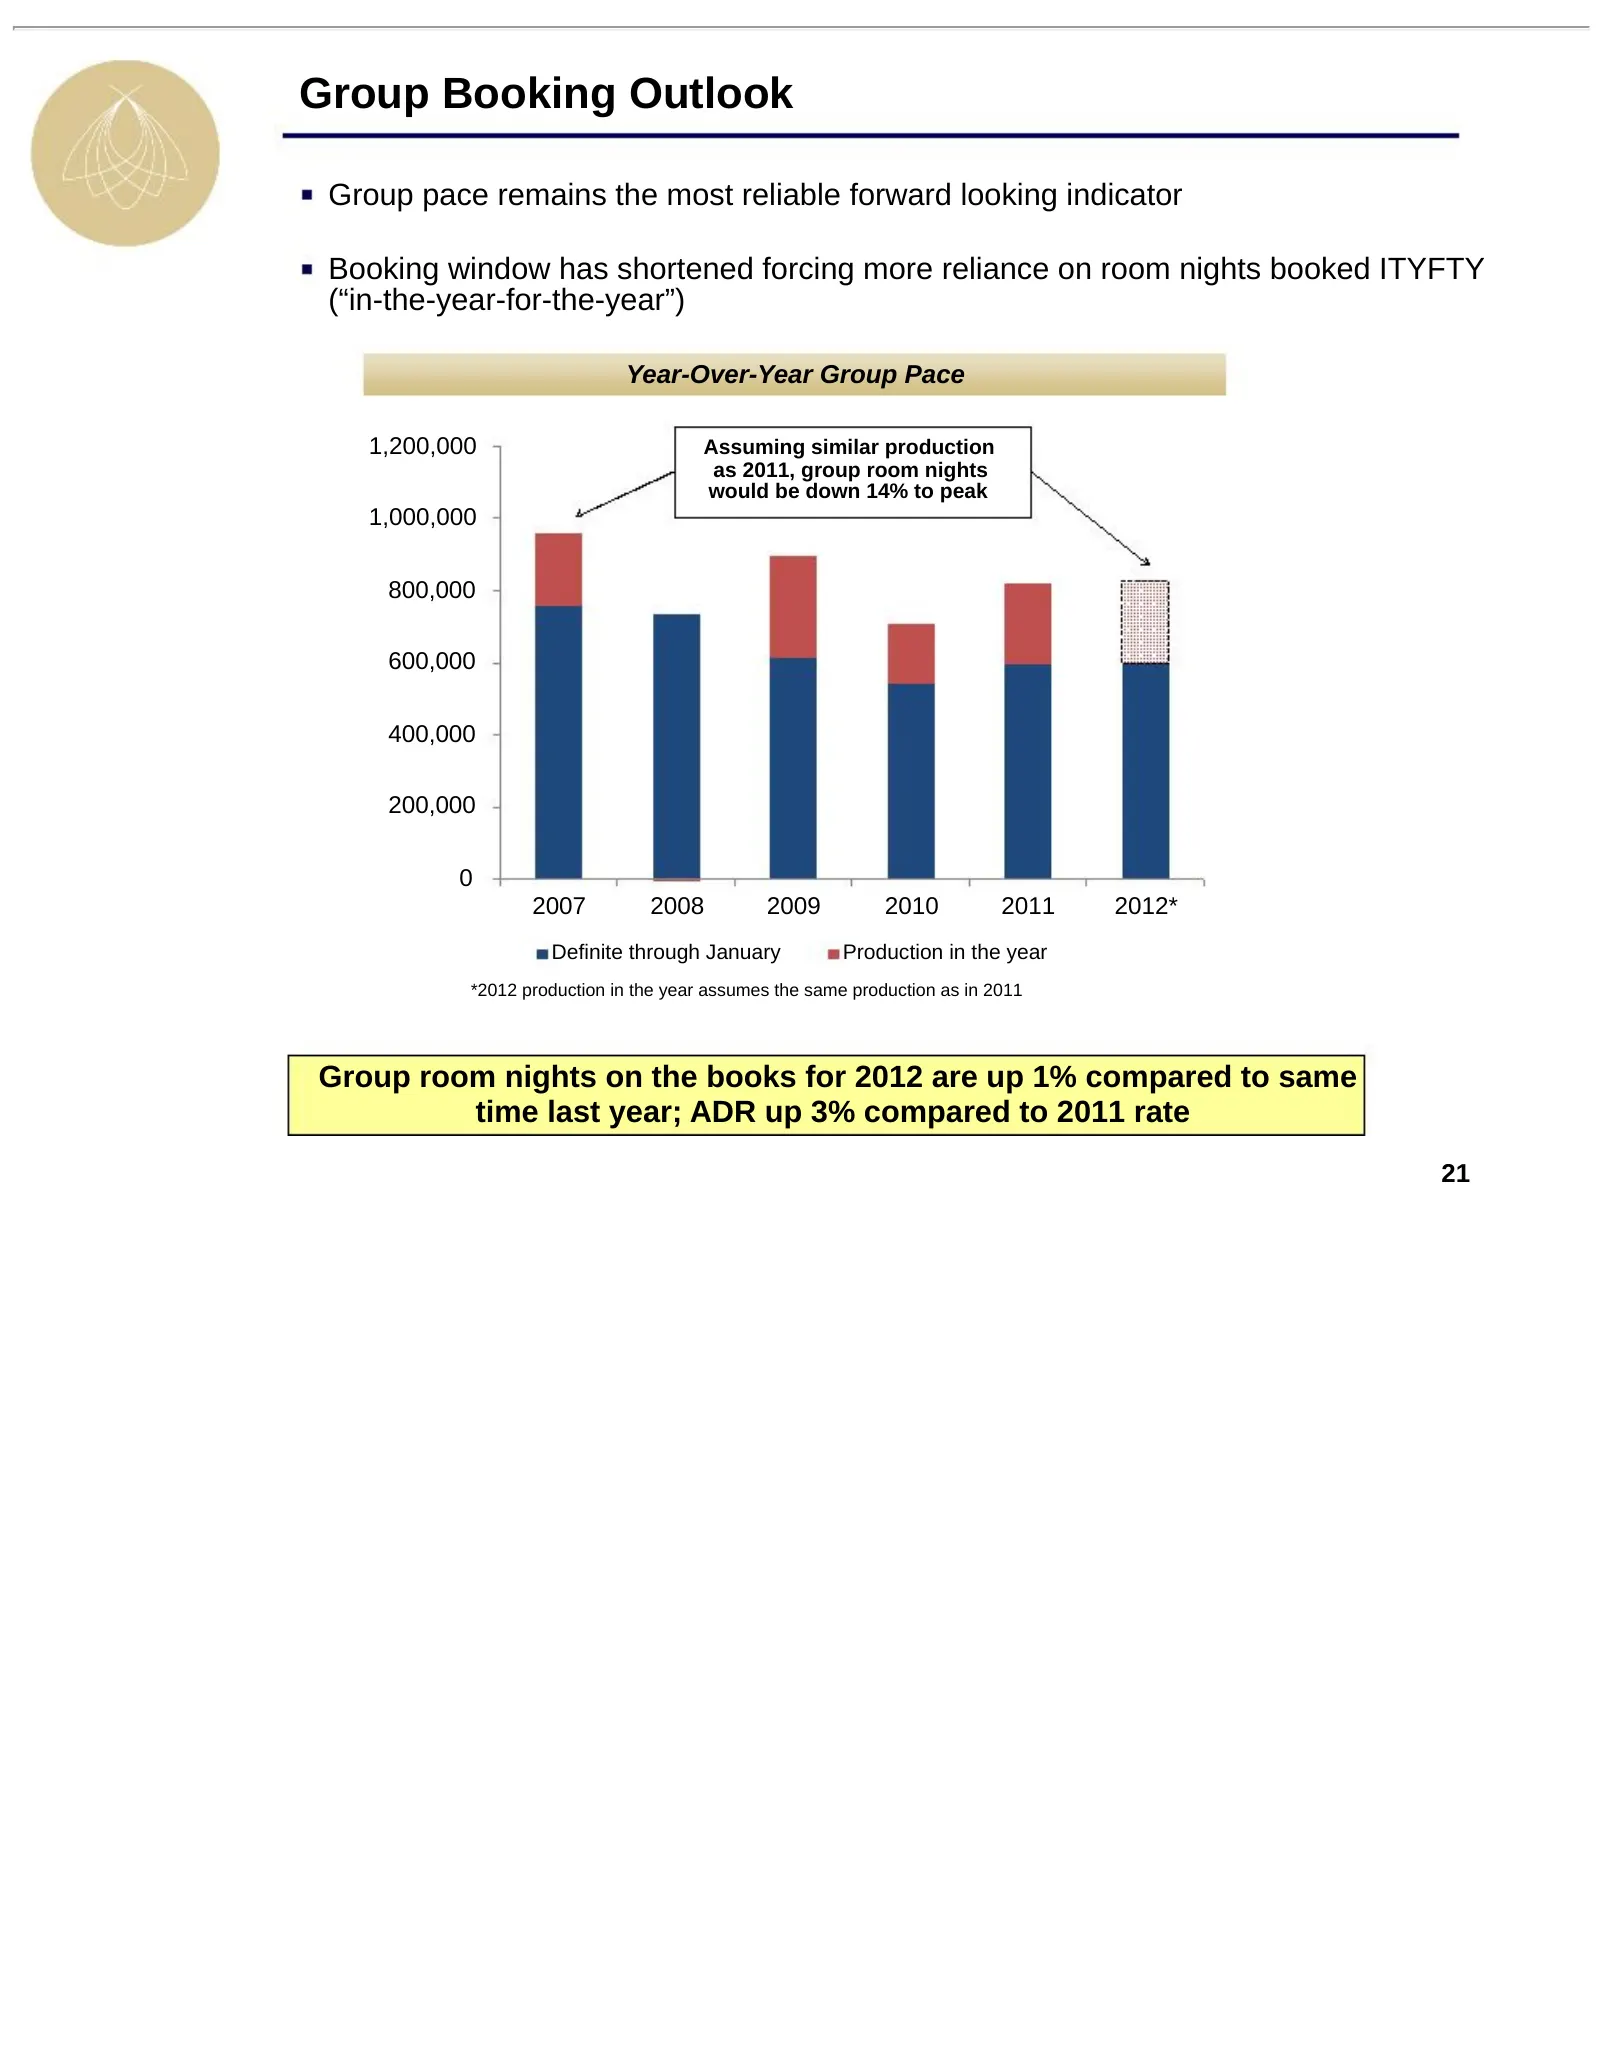
Group Booking Outlook Group pace remains the most reliable forward looking indicator Booking window has shortened forcing more reliance on room nights booked ITYFTY (“in-the-year-for-the-year”) Year-Over-Year Group Pace 1,200,000 Assuming similar production as 2011, group room nights would be down 1
Slide 22: Embedded Portfolio Growth
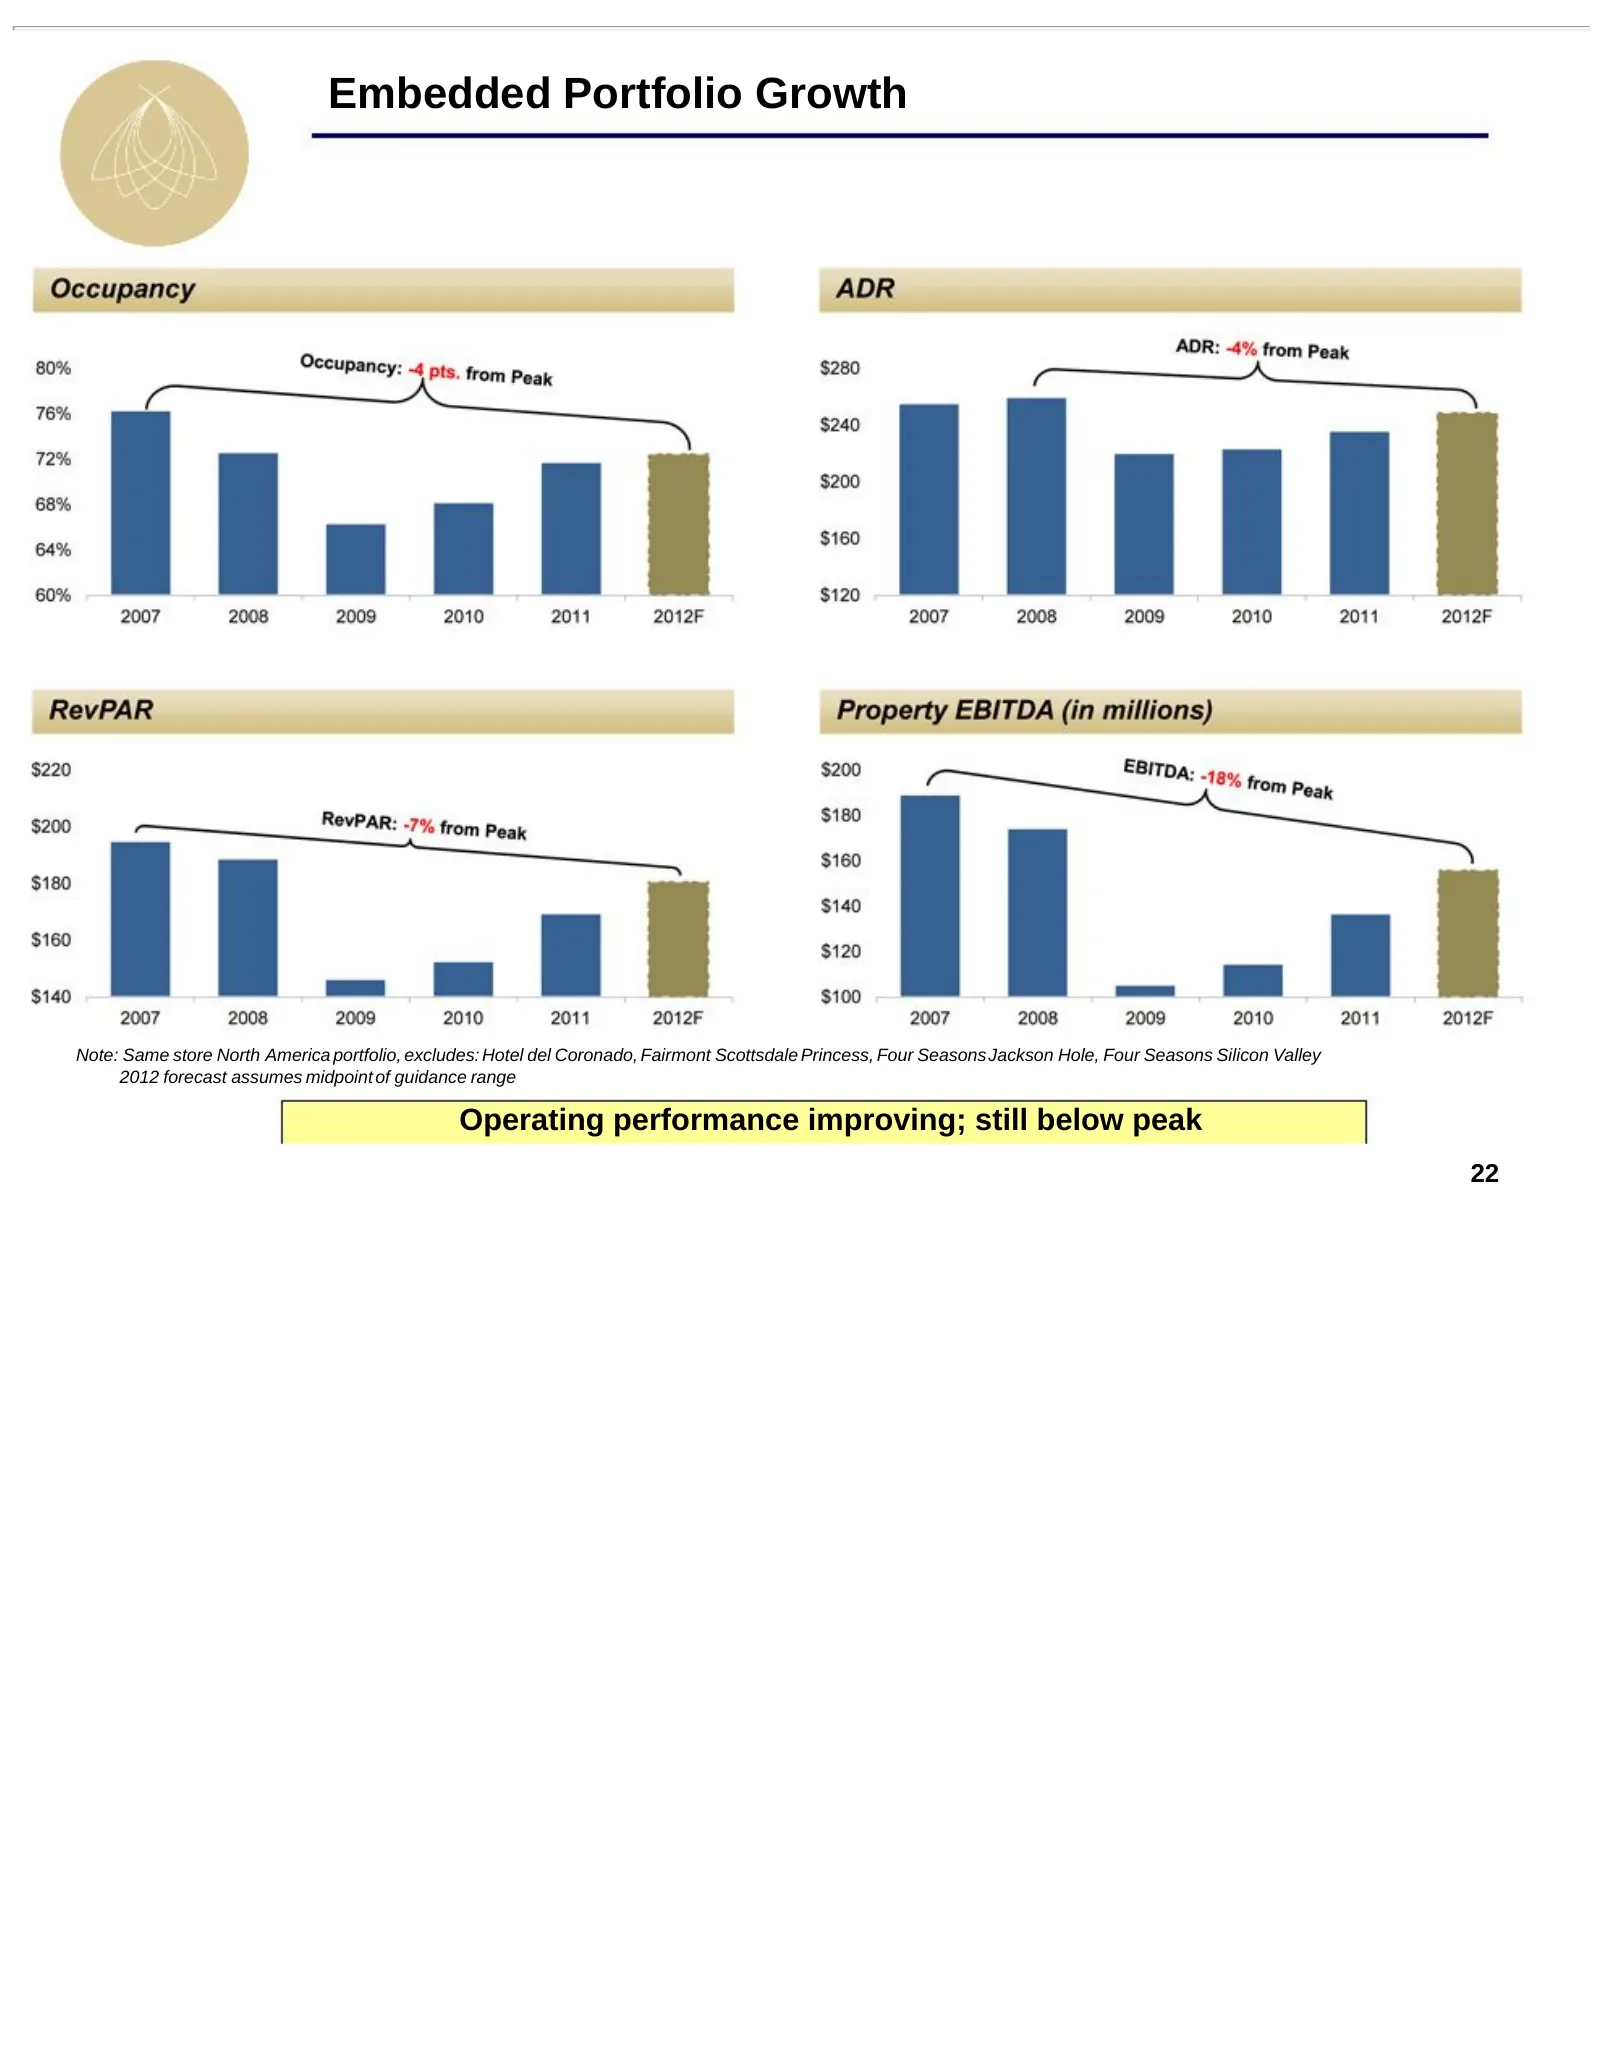
Embedded Portfolio Growth Note: Same store North America portfolio, excludes: Hotel del Coronado, Fairmont Scottsdale Princess, Four Seasons Jackson Hole, Four Seasons Silicon Valley 2012 forecast assumes midpoint of guidance range Operating performance improving; still below peak 22
Slide 23: Agenda
Agenda I. BEE’s Unique Value Proposition II. Company Overview III. Industry Update IV. Operating Trends V. Financial Overview 23
Slide 24: 2011 Results
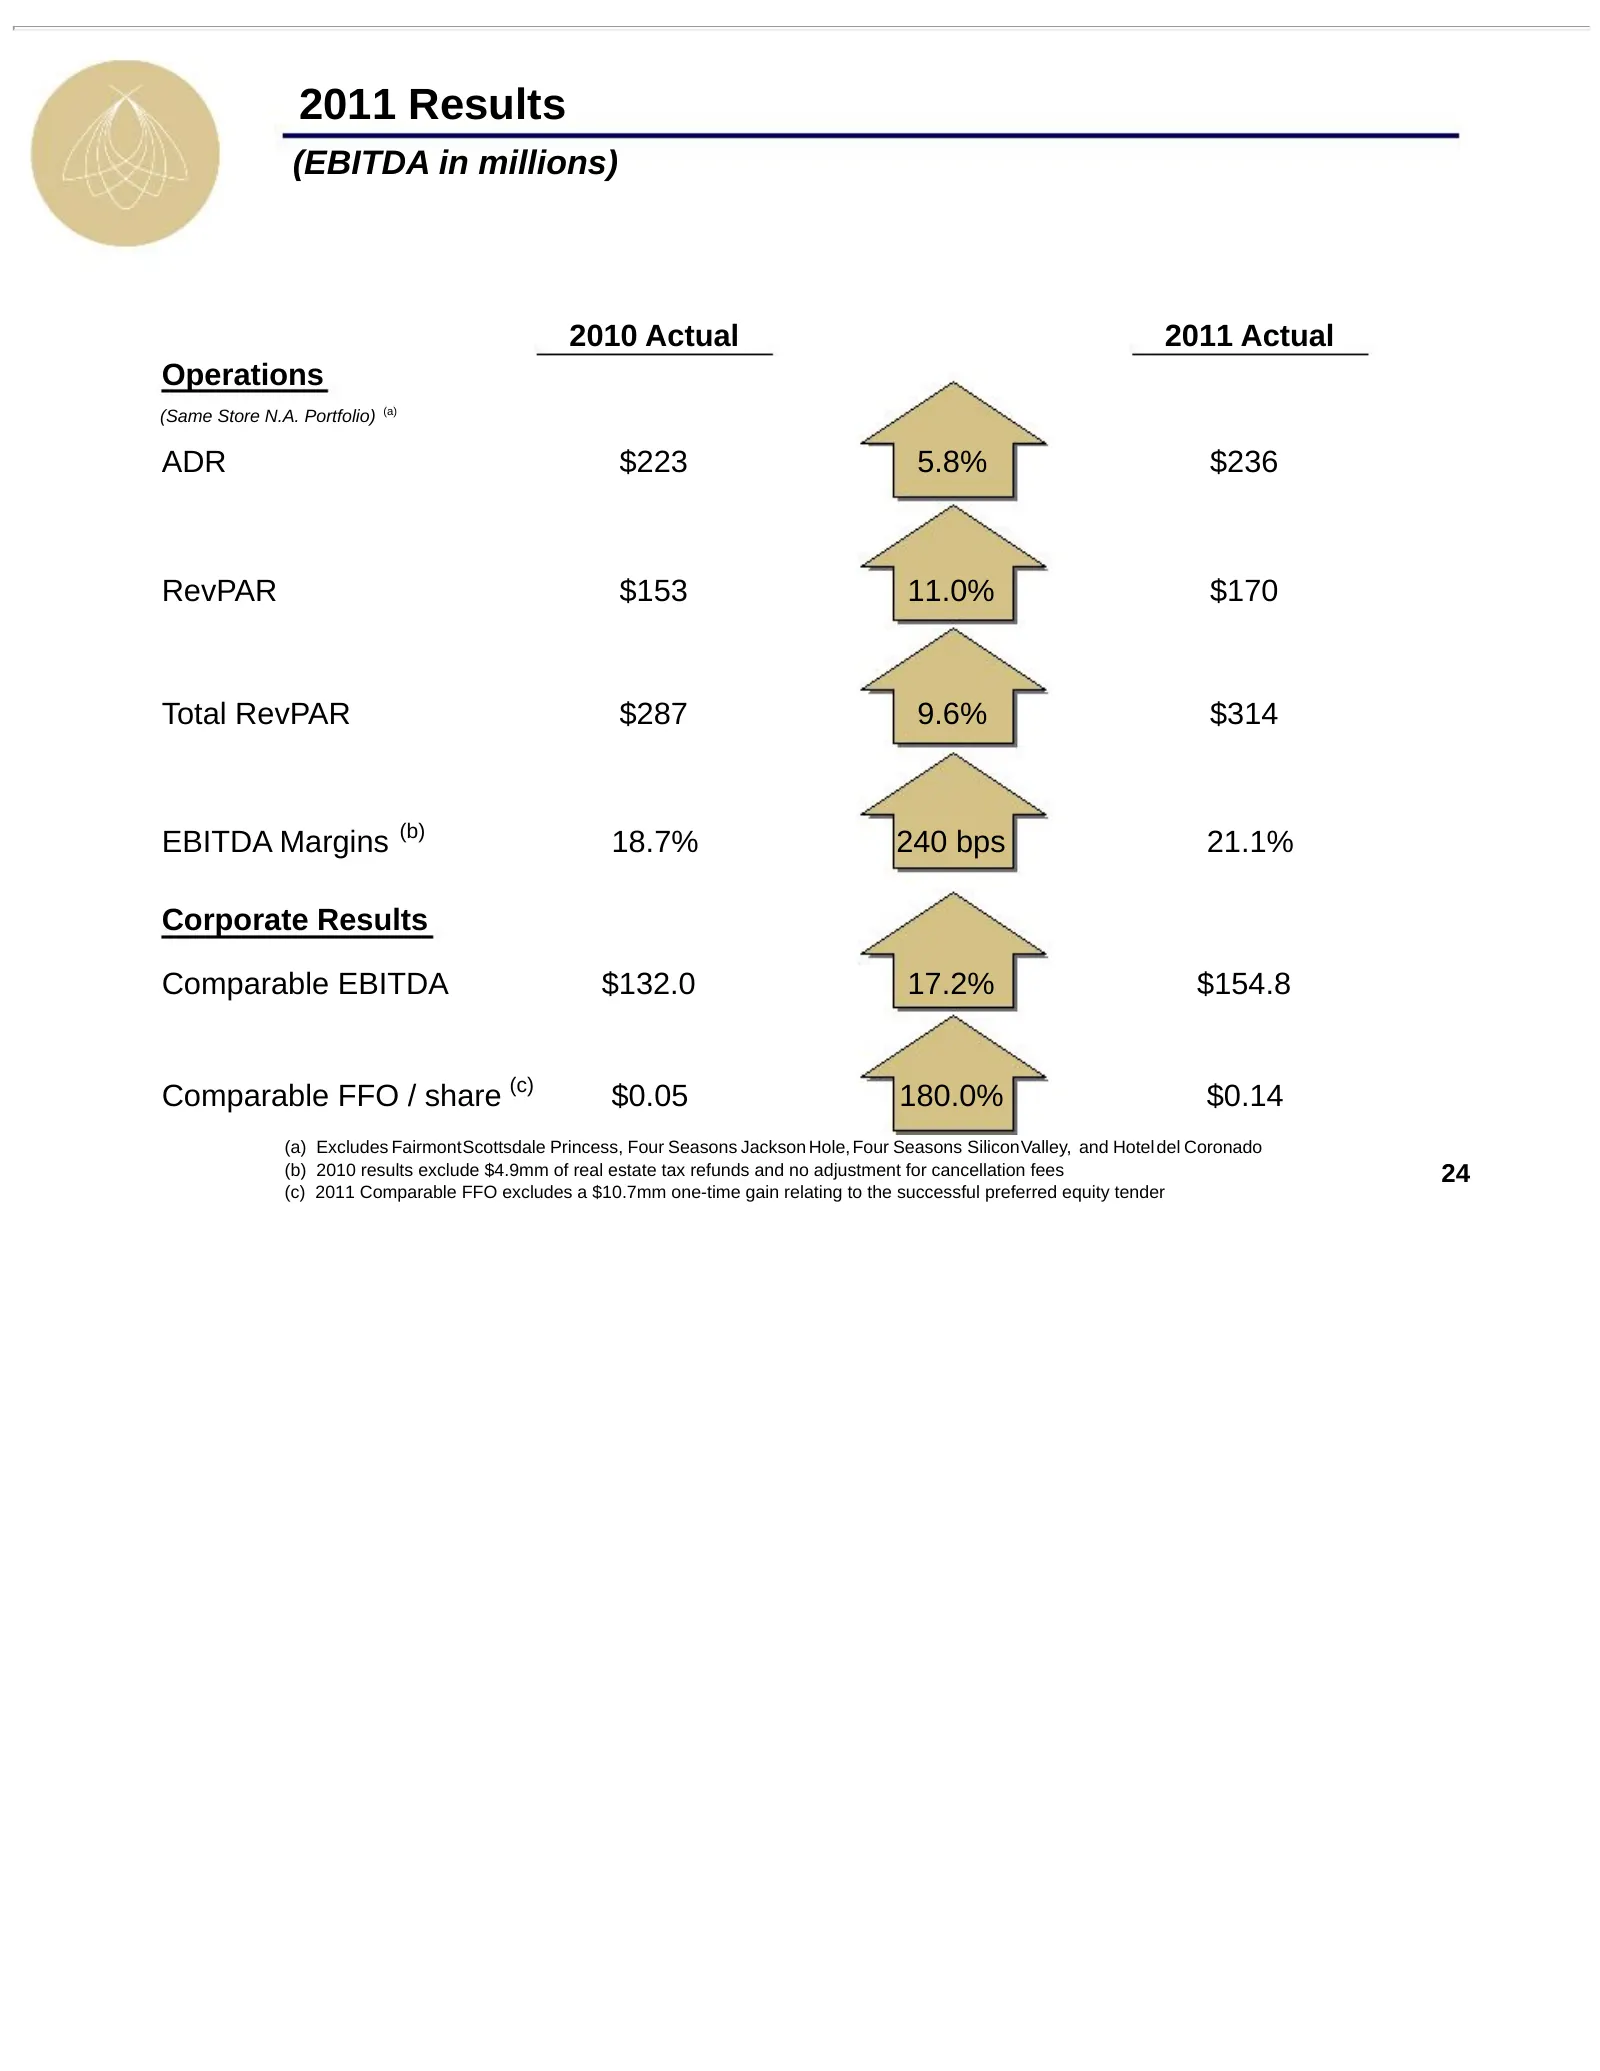
2011 Results (EBITDA in millions) 2010 Actual 2011 Actual Operations (Same Store N.A. Portfolio) (a) ADR $223 5.8% $236 RevPAR $153 11.0% $170 Total RevPAR $287 9.6% $314 EBITDA Margins (b) 18.7% 240 bps 21.1% Corporate Results Comparable EBITDA $132.0 17.2% $154.8 Comparable FFO / share (c) $0.05 1
Slide 25: 2012 Guidance
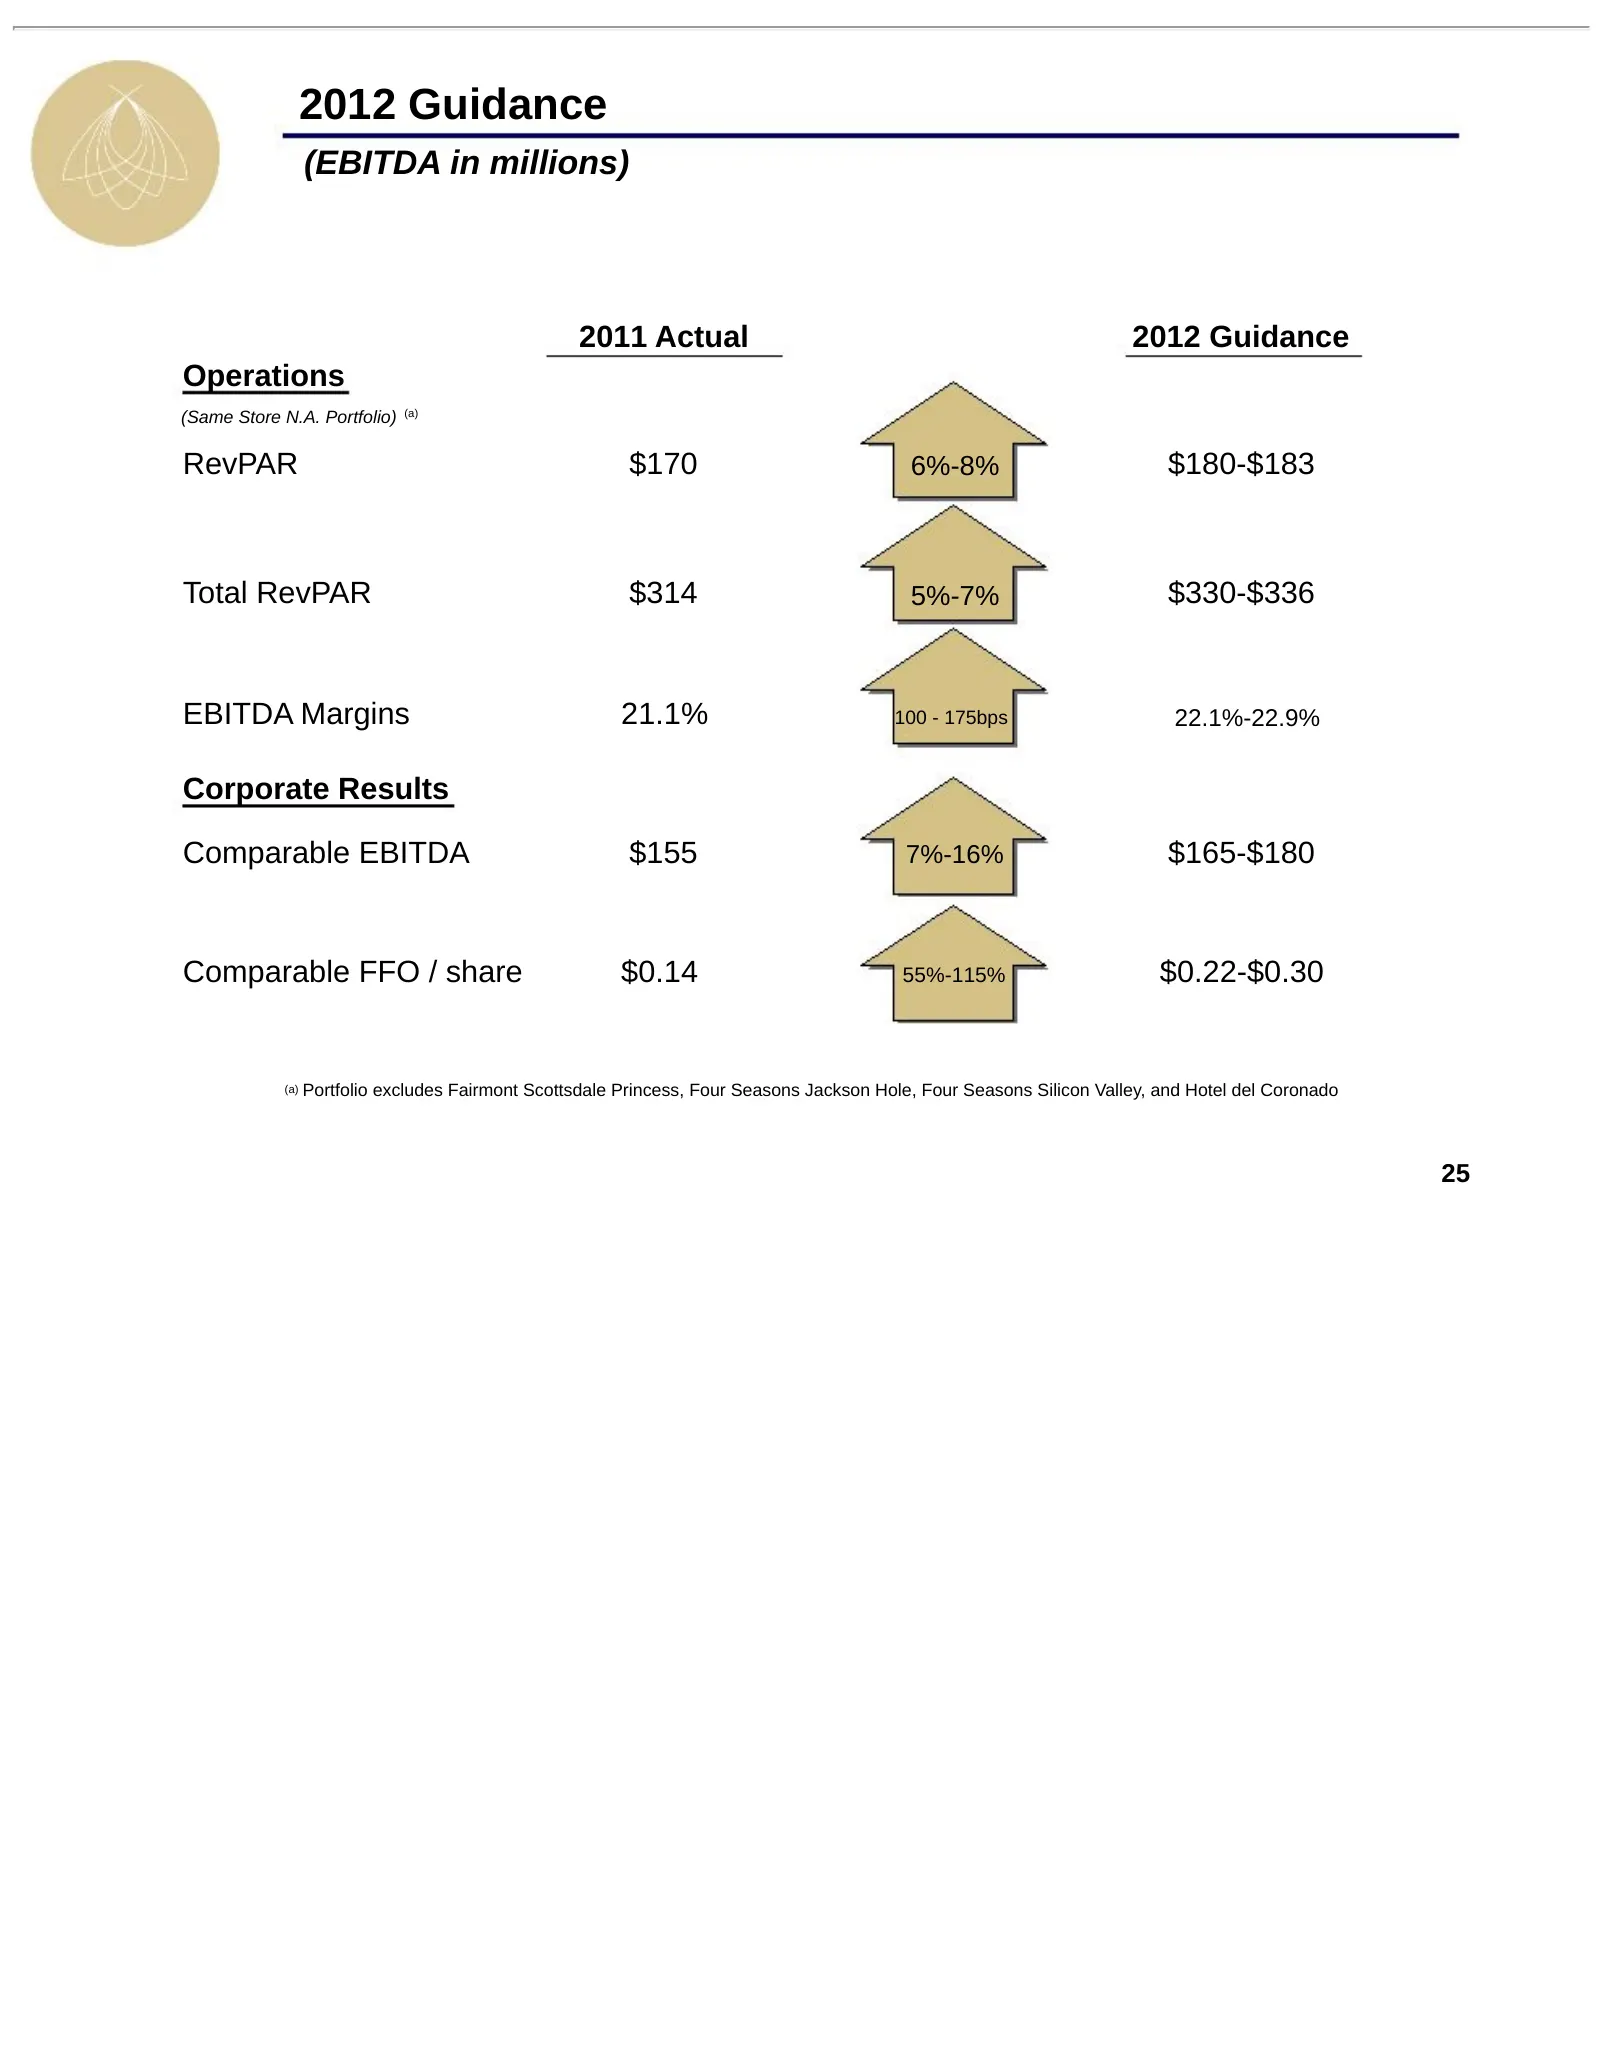
2012 Guidance (EBITDA in millions) 2011 Actual 2012 Guidance Operations (Same Store N.A. Portfolio) (a) RevPAR $170 6%-8% $180-$183 Total RevPAR $314 5%-7% $330-$336 EBITDA Margins 21.1% 100 - 175bps 22.1%-22.9% Corporate Results Comparable EBITDA $155 7%-16% $165-$180 Comparable FFO / share $0.14 5
Slide 26: Strong Recapitalized Balance Sheet
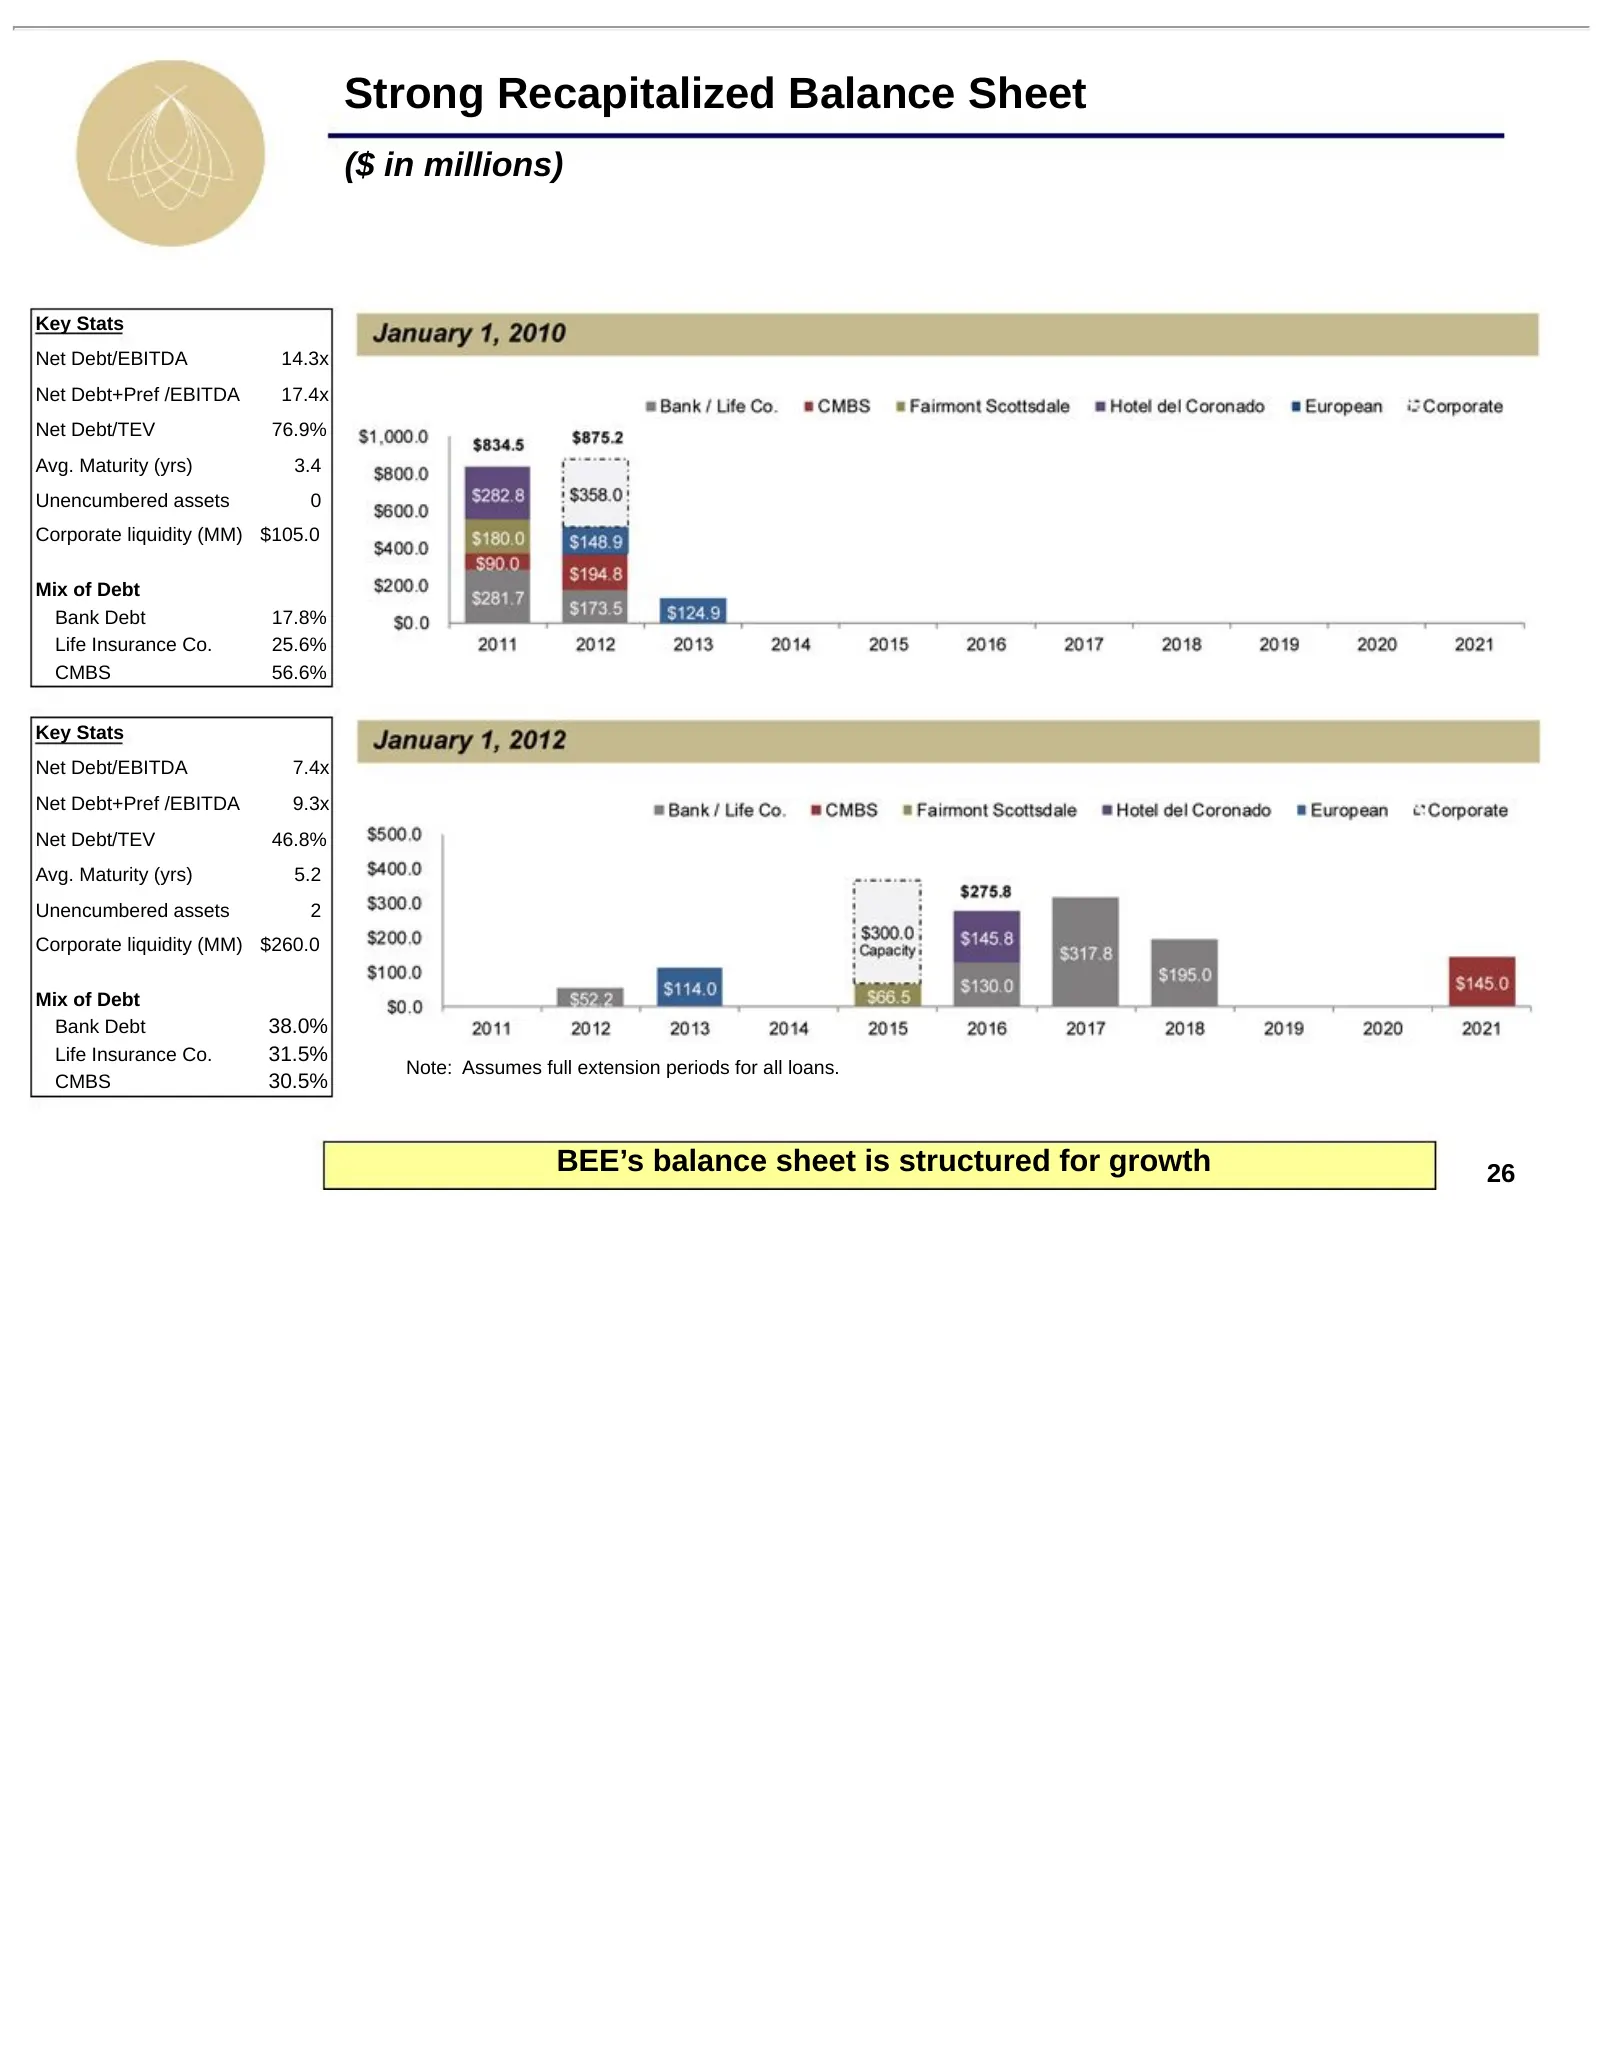
Strong Recapitalized Balance Sheet ($ in millions) Key Stats Net Debt/EBITDA 14.3x Net Debt+Pref /EBITDA 17.4x Net Debt/TEV 76.9% Avg. Maturity (yrs) 3.4 Unencumbered assets 0 Corporate liquidity (MM) $105.0 Mix of Debt Bank Debt 17.8% Life Insurance Co. 25.6% CMBS 56.6% Key Stats Net Debt/EBITDA 7.
Slide 27: BEE's Unique Value Proposition
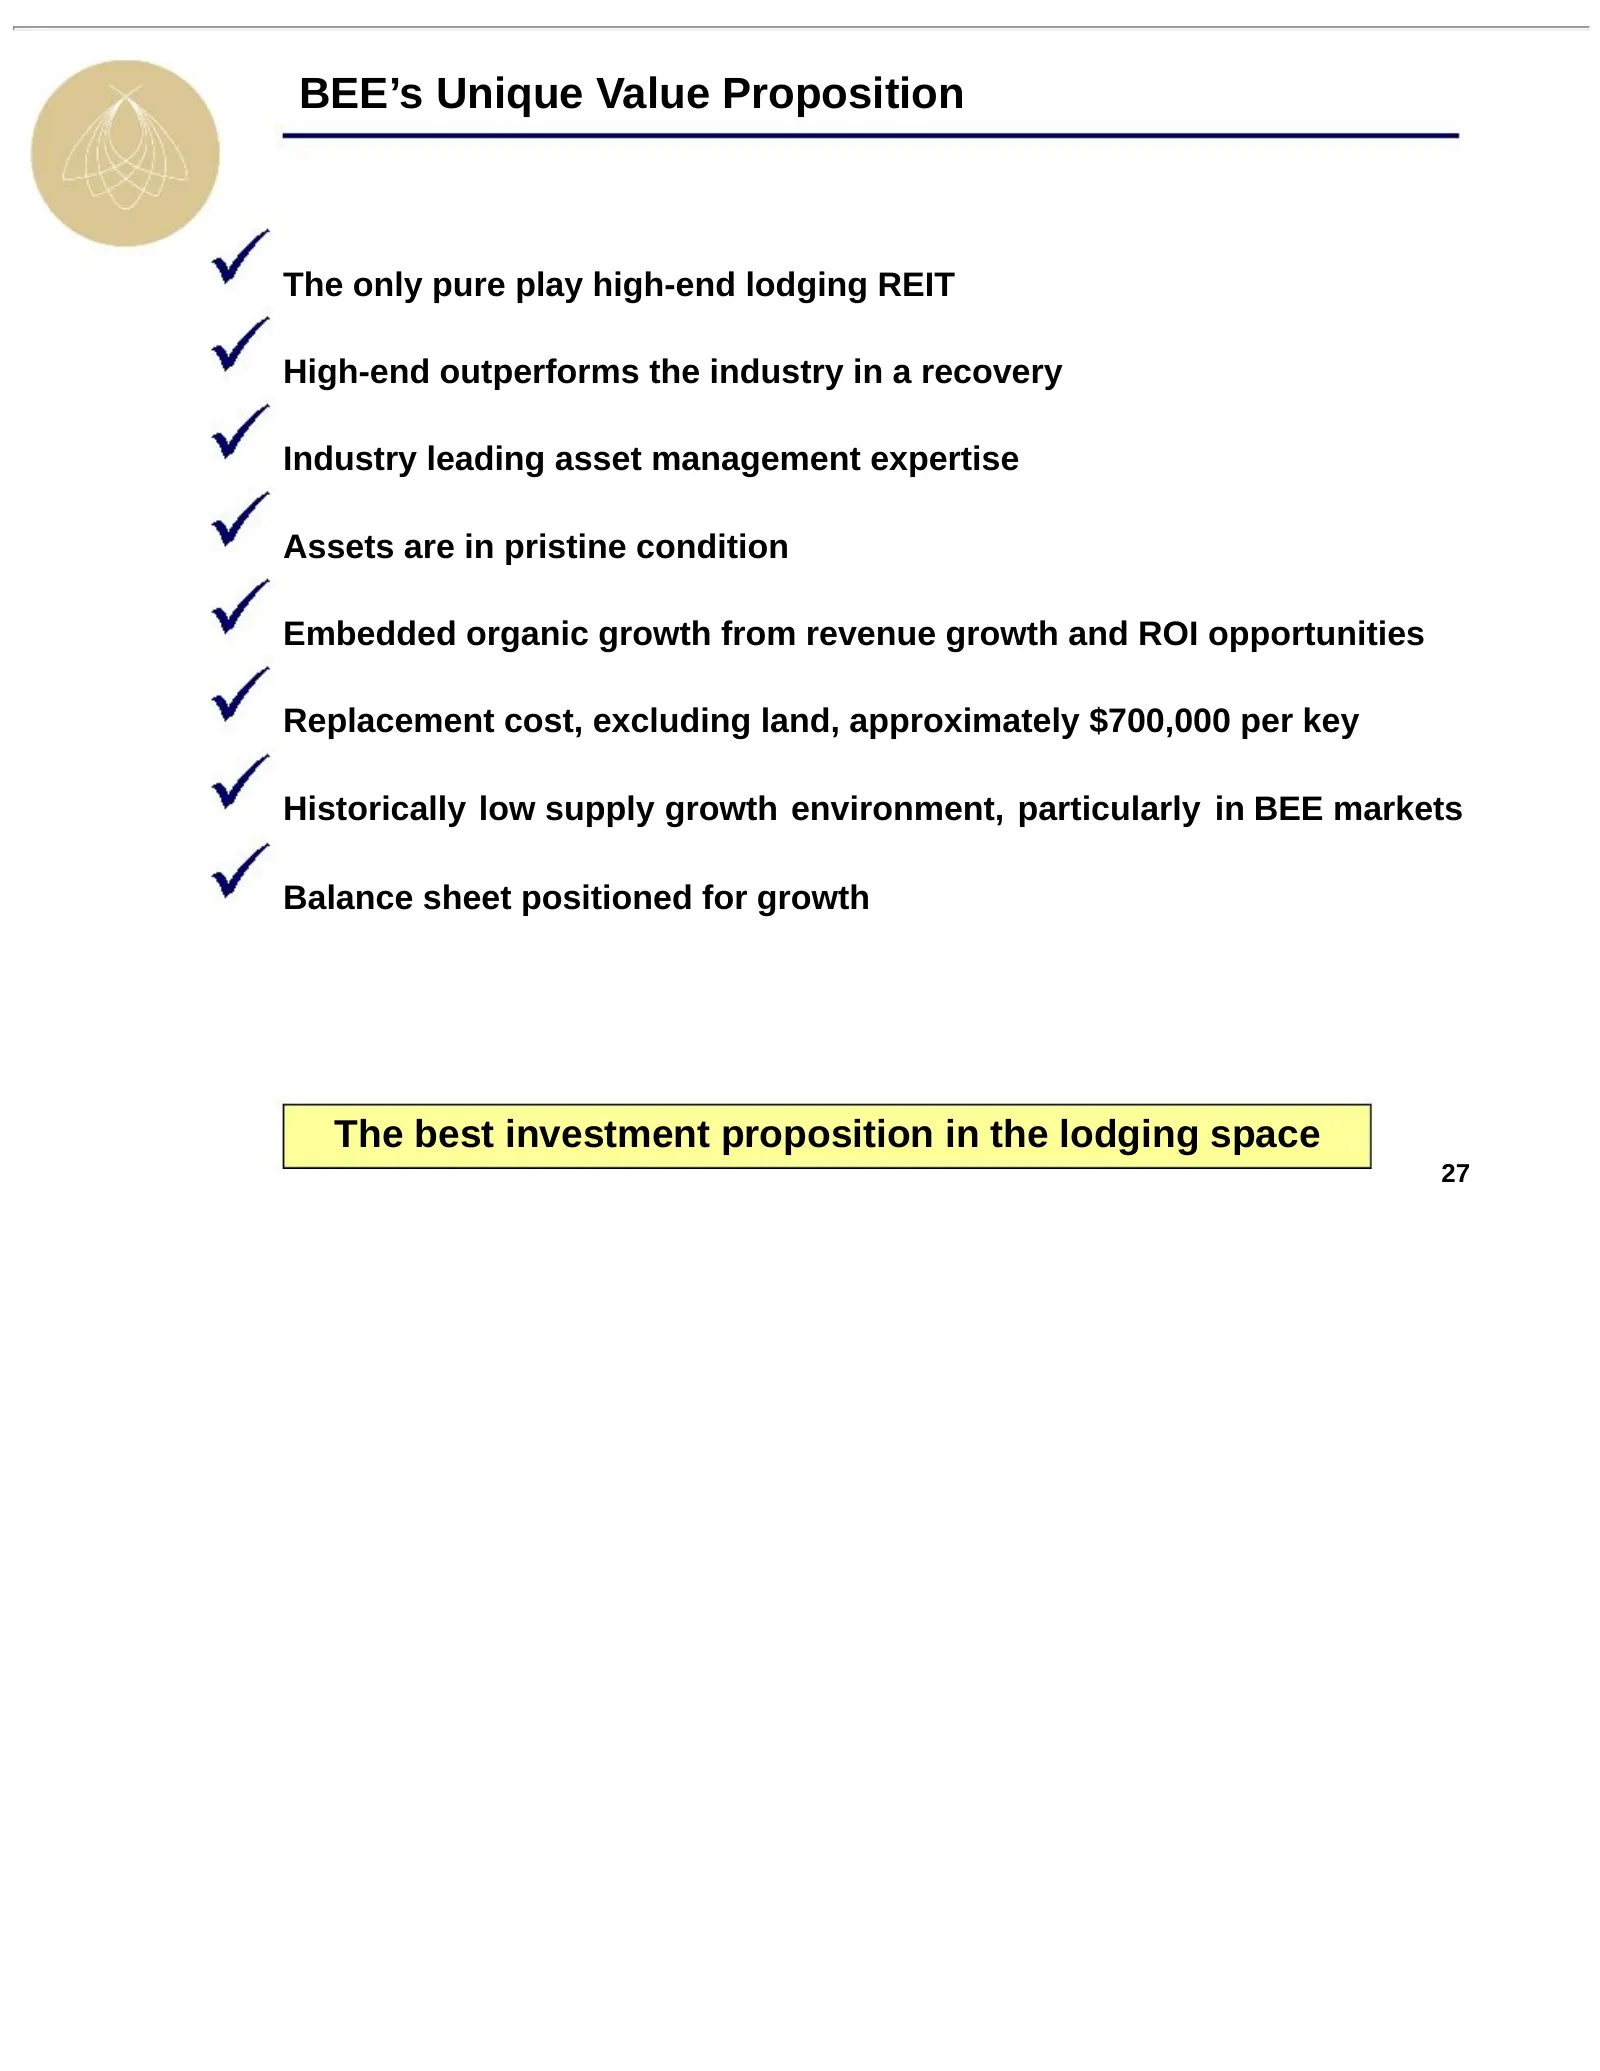
BEE’s Unique Value Proposition The only pure play high-end lodging REIT High-end outperforms the industry in a recovery Industry leading asset management expertise Assets are in pristine condition Embedded organic growth from revenue growth and ROI opportunities Replacement cost, excluding land, app
Slide 28: Disclaimer
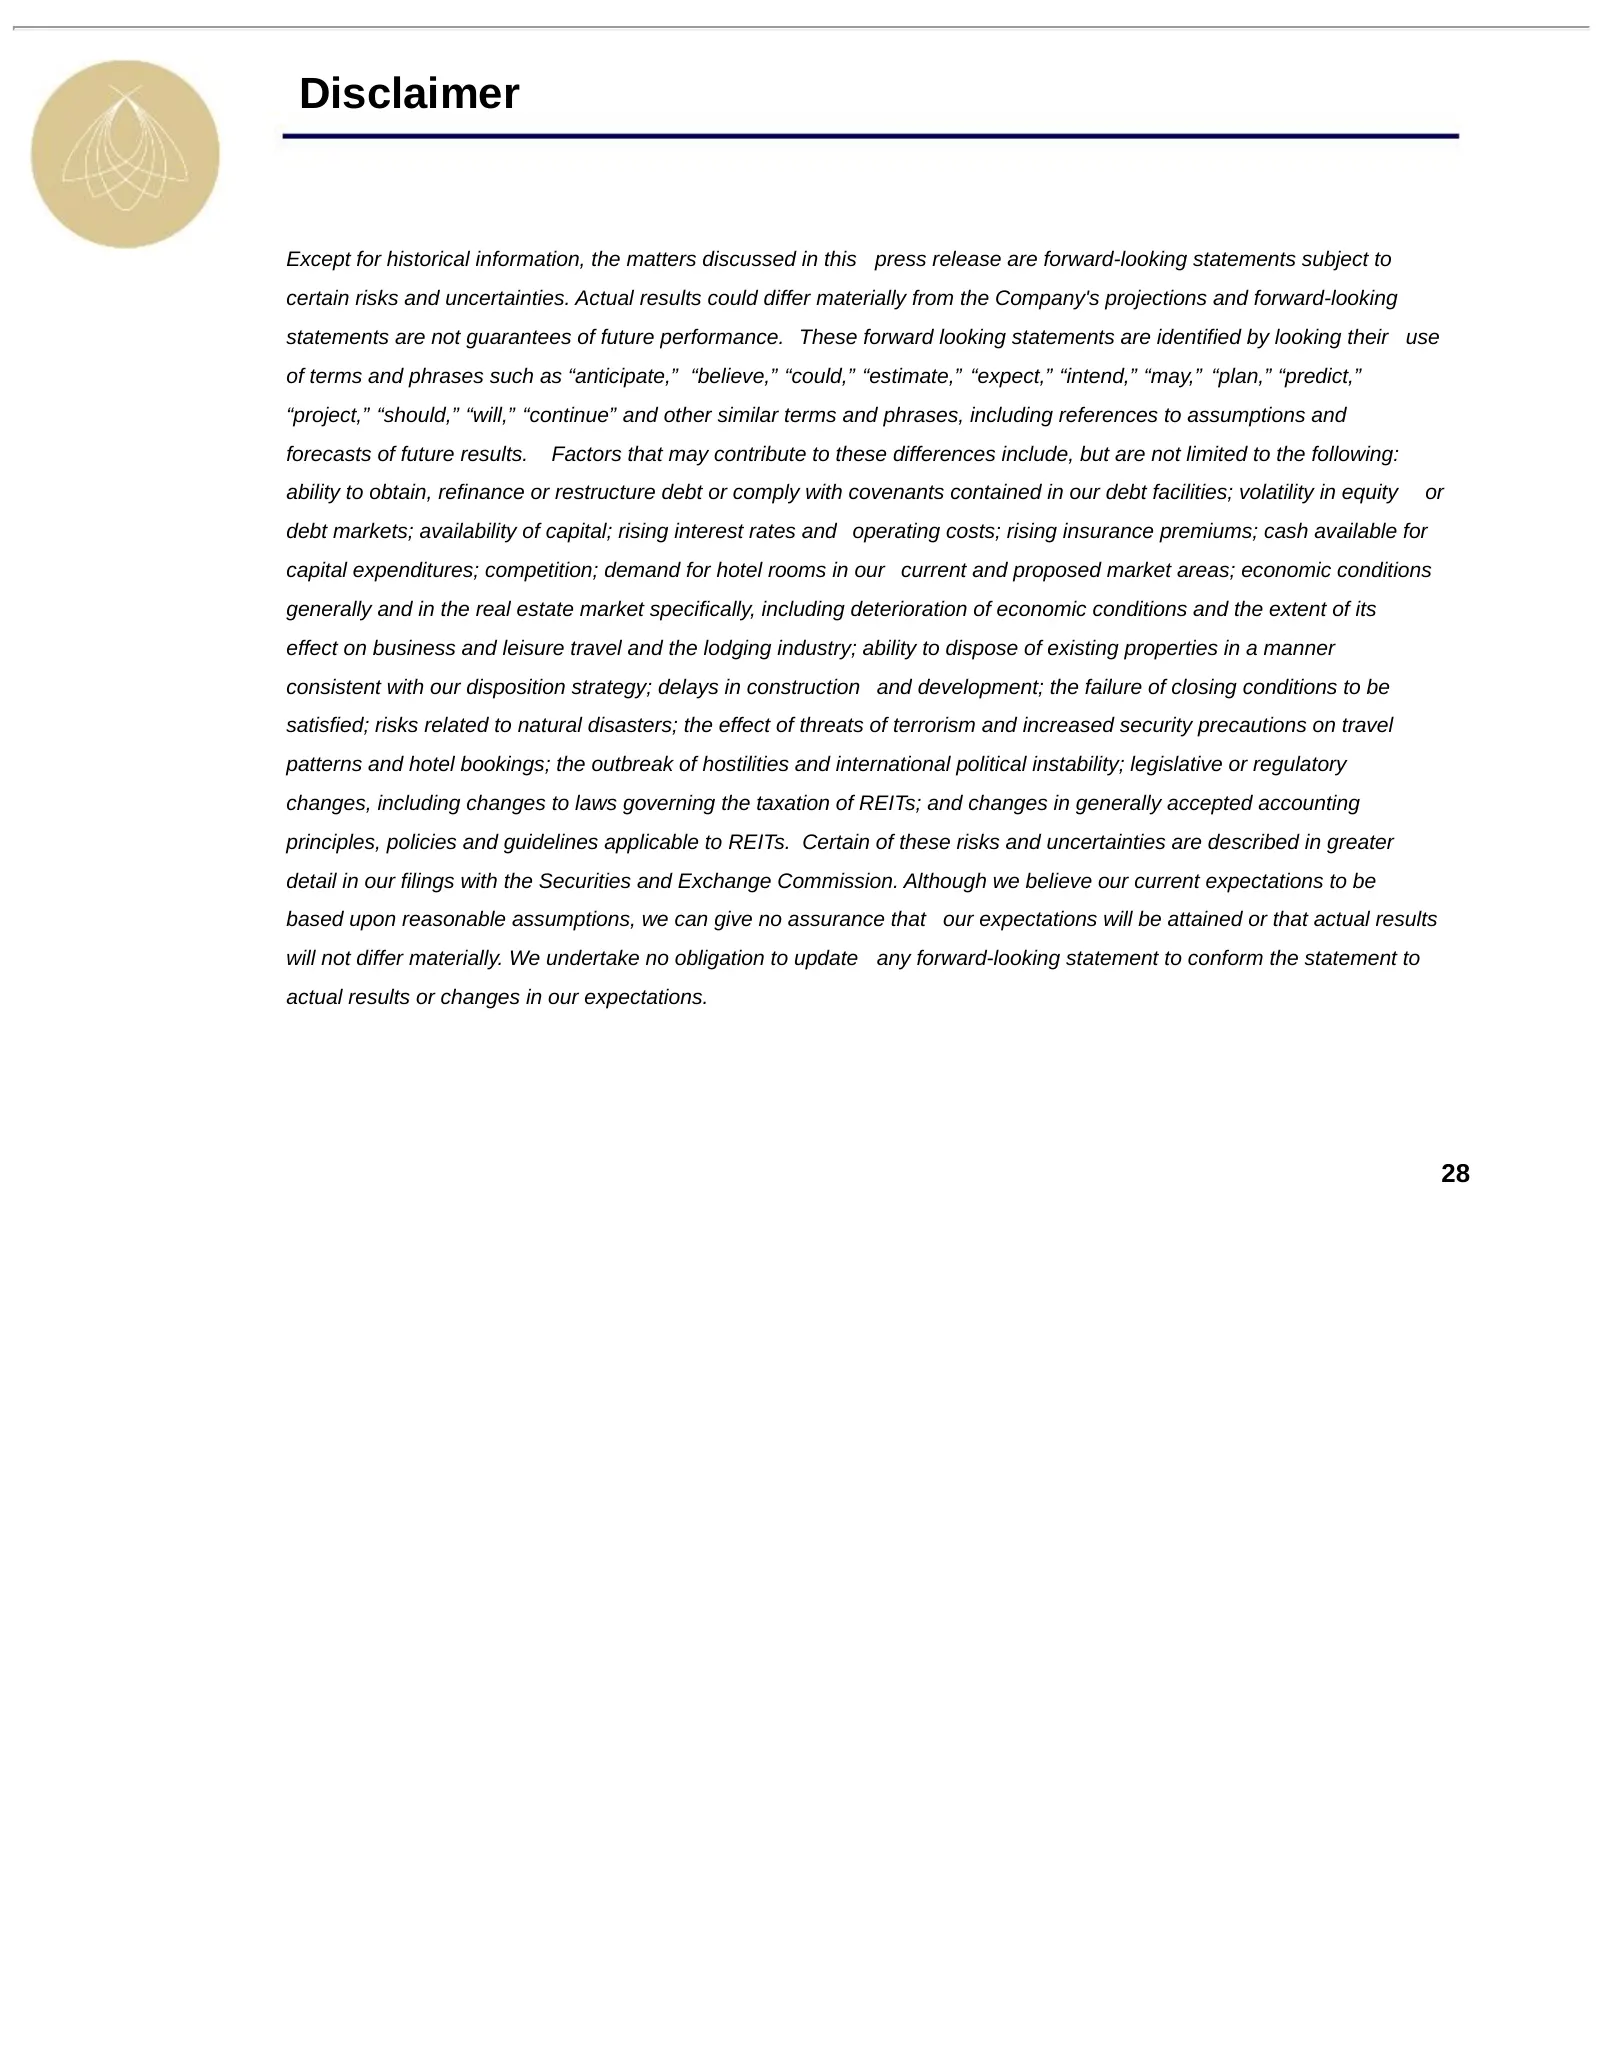
Disclaimer Except for historical information, the matters discussed in this press release are forward-looking statements subject to certain risks and uncertainties. Actual results could differ materially from the Company's projections and forward-looking statements are not guarantees of future perfo
Slide 29: Non-GAAP to GAAP Reconciliations
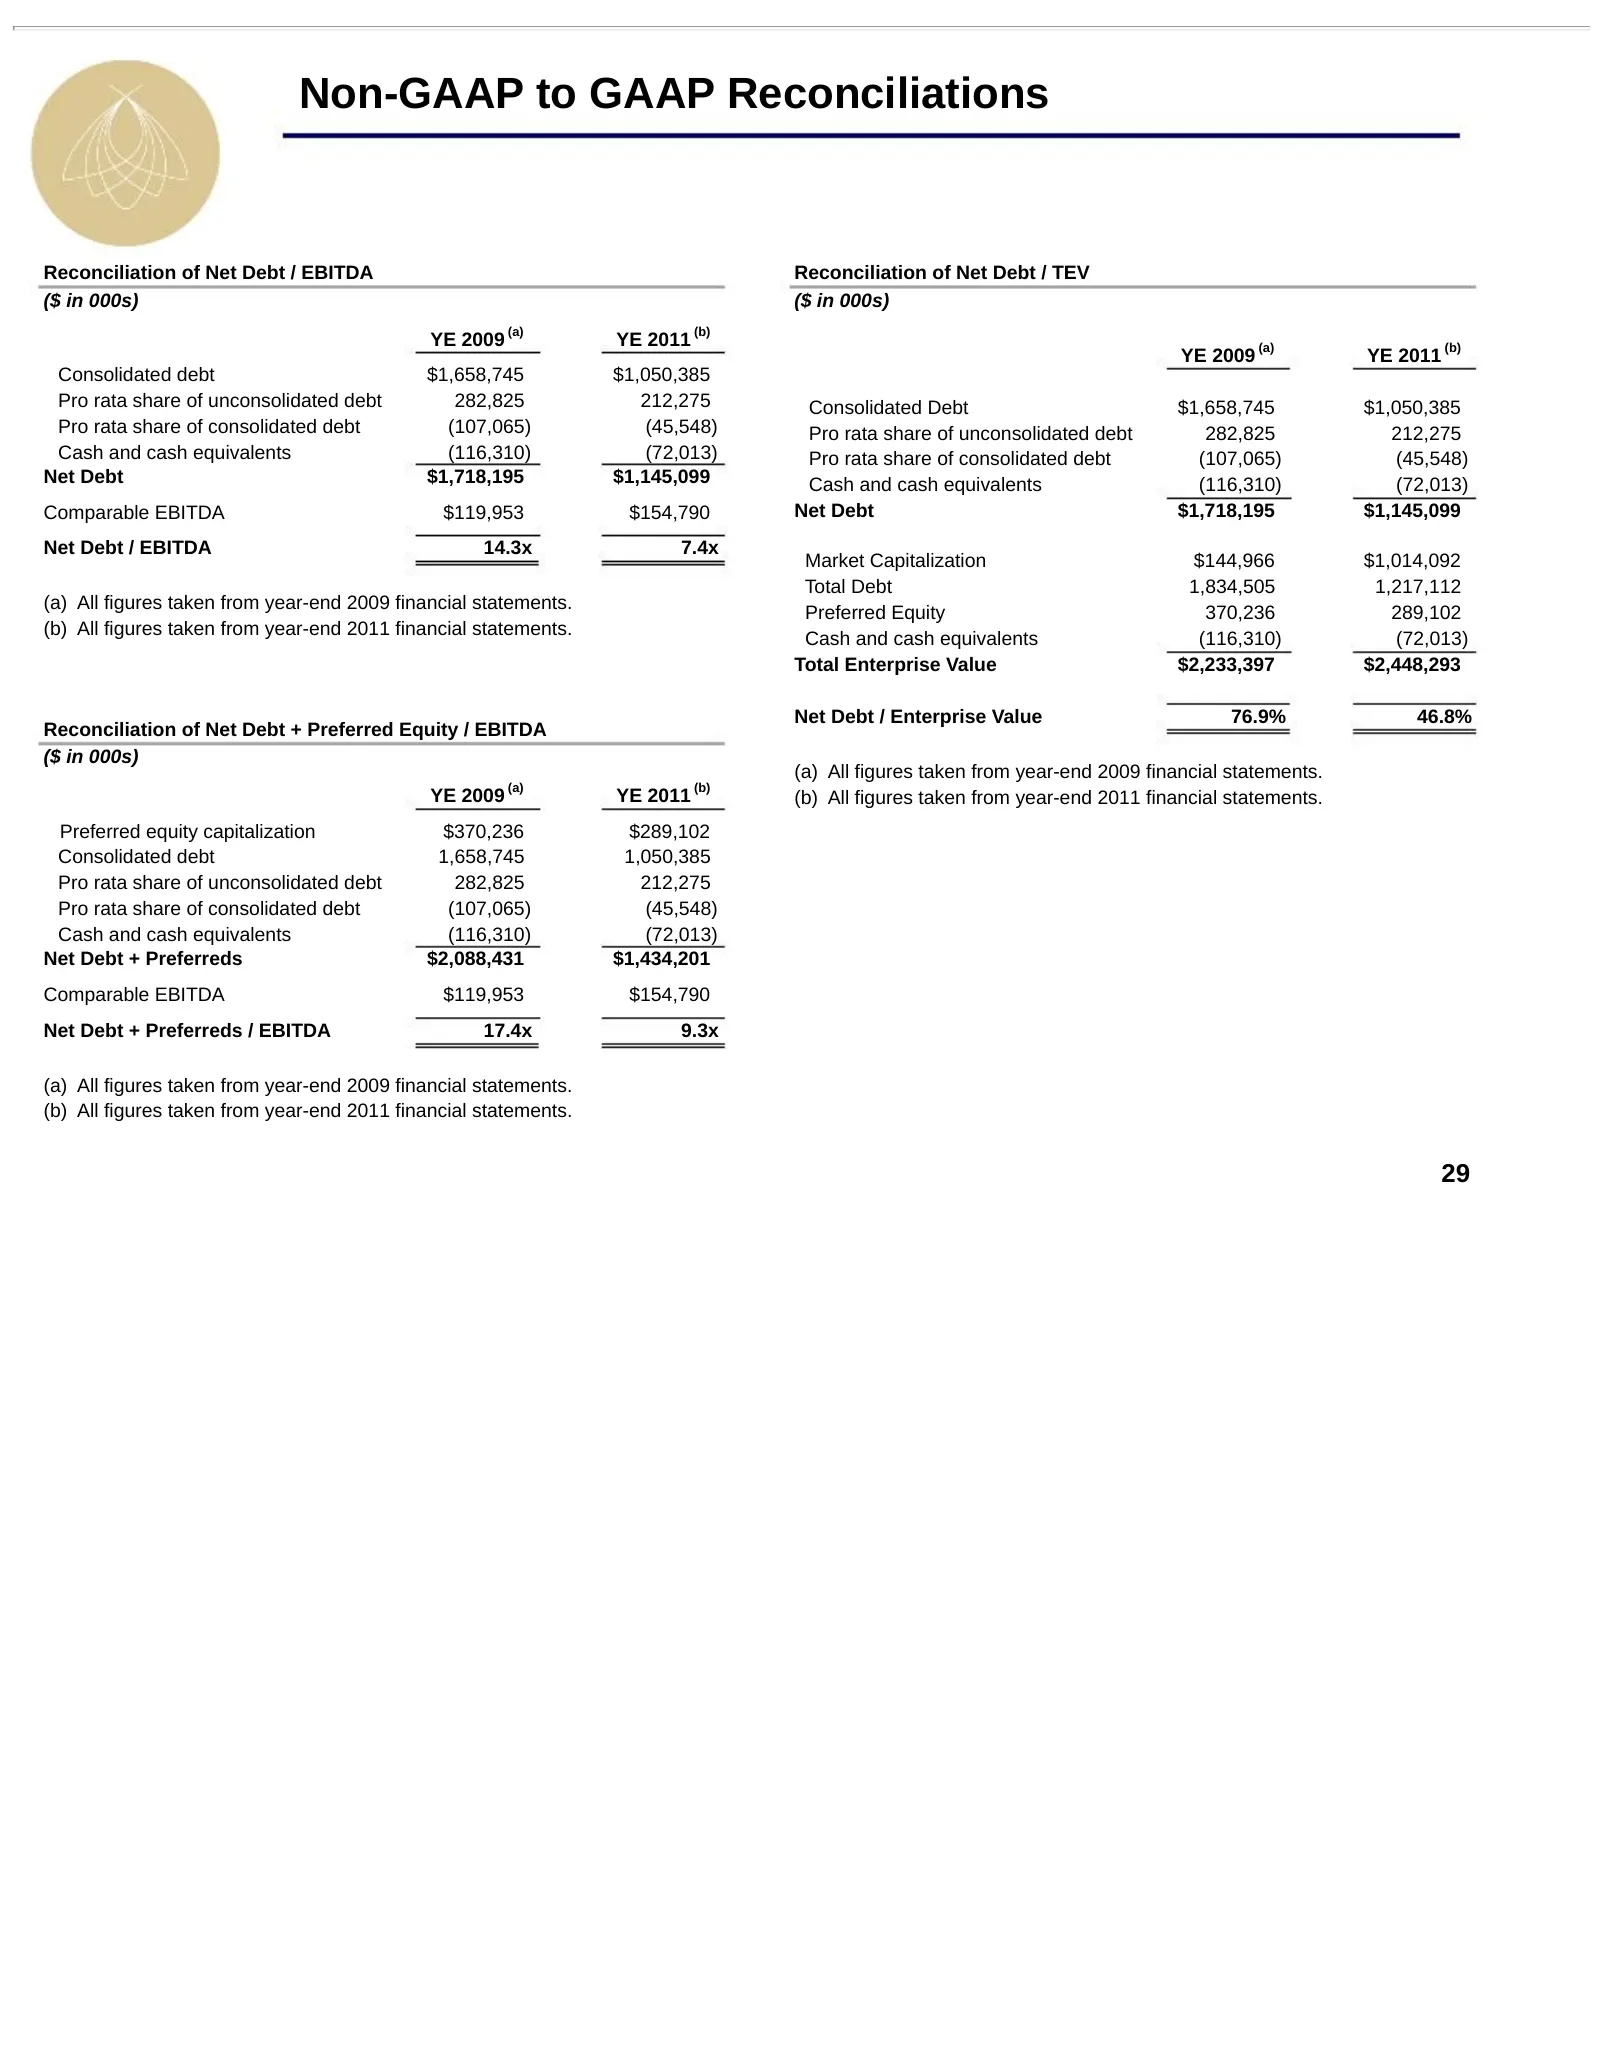
Non-GAAP to GAAP Reconciliations Reconciliation of Net Debt / EBITDA Reconciliation of Net Debt / TEV ($ in 000s) ($ in 000s) (a) (b) YE 2009 YE 2011 (a) (b) YE 2009 YE 2011 Consolidated debt $1,658,745 $1,050,385 Pro rata share of unconsolidated debt 282,825 212,275 Consolidated Debt $1,658,745 $1,
Slide 30: Non-GAAP to GAAP Reconciliations
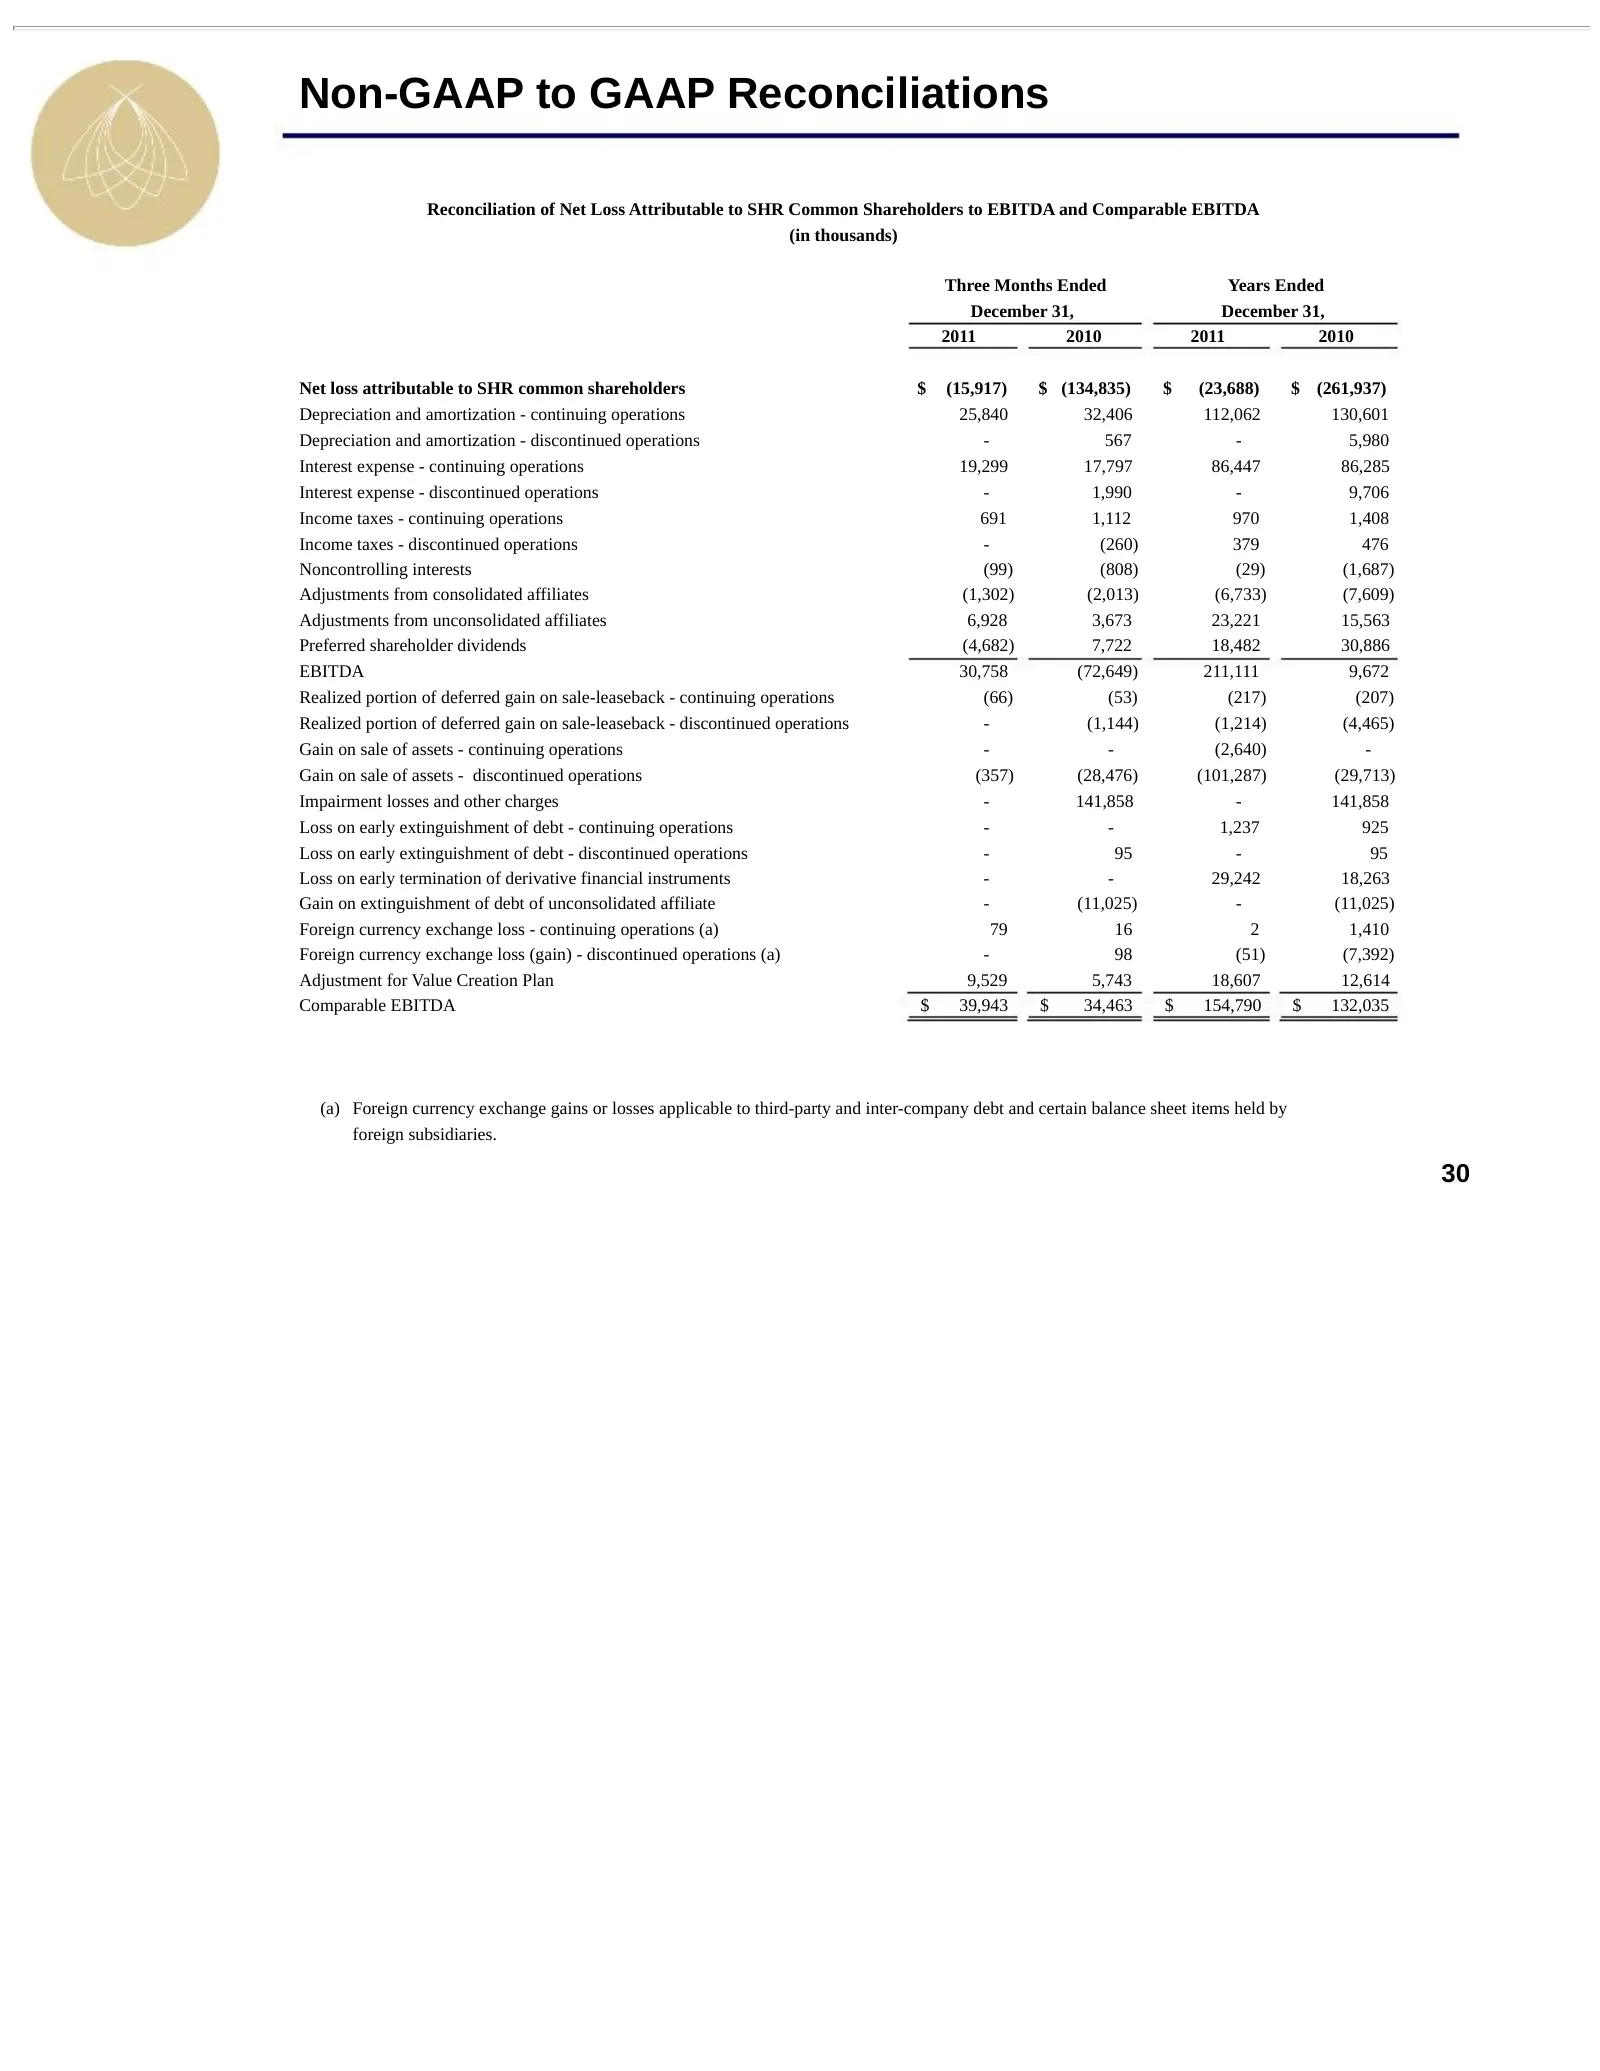
Non-GAAP to GAAP Reconciliations Reconciliation of Net Loss Attributable to SHR Common Shareholders to EBITDA and Comparable EBITDA (in thousands) Three Months Ended Years Ended December 31, December 31, 2011 2010 2011 2010 Net loss attributable to SHR common shareholders $ (15,917) $ (134,835) $ (2
Slide 31: Non-GAAP to GAAP Reconciliations
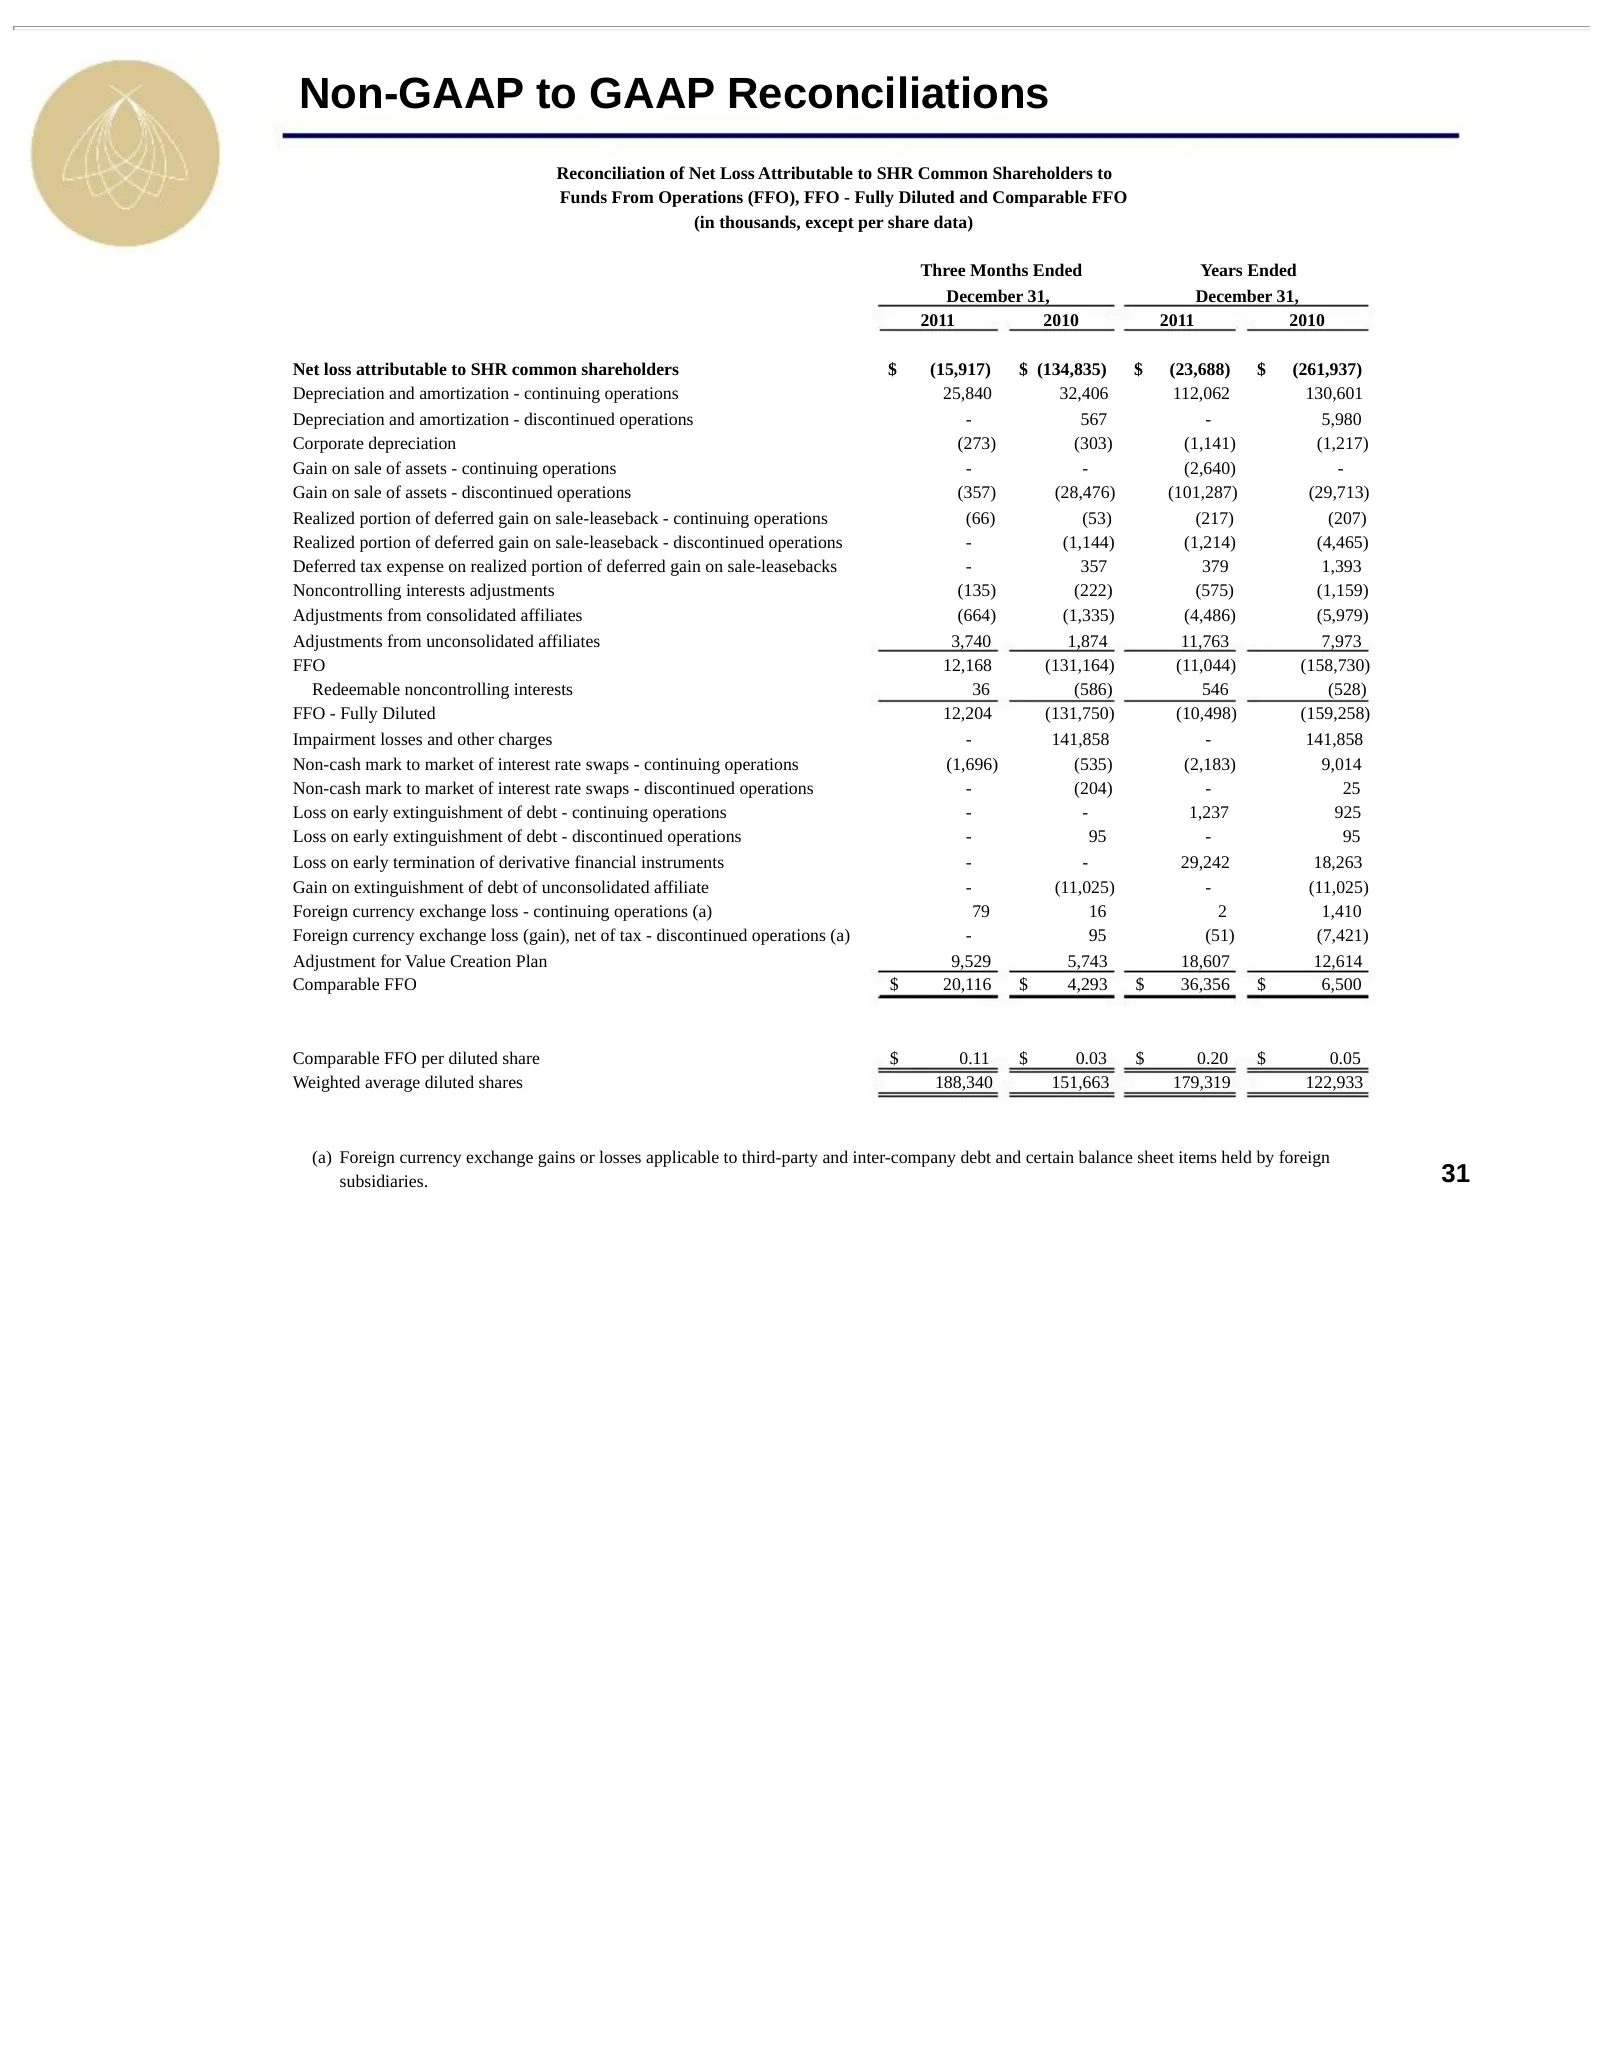
Non-GAAP to GAAP Reconciliations Reconciliation of Net Loss Attributable to SHR Common Shareholders to Funds From Operations (FFO), FFO - Fully Diluted and Comparable FFO (in thousands, except per share data) Three Months Ended Years Ended December 31, December 31, 2011 2010 2011 2010 Net loss attri
Slide 32: Non-GAAP to GAAP Reconciliations
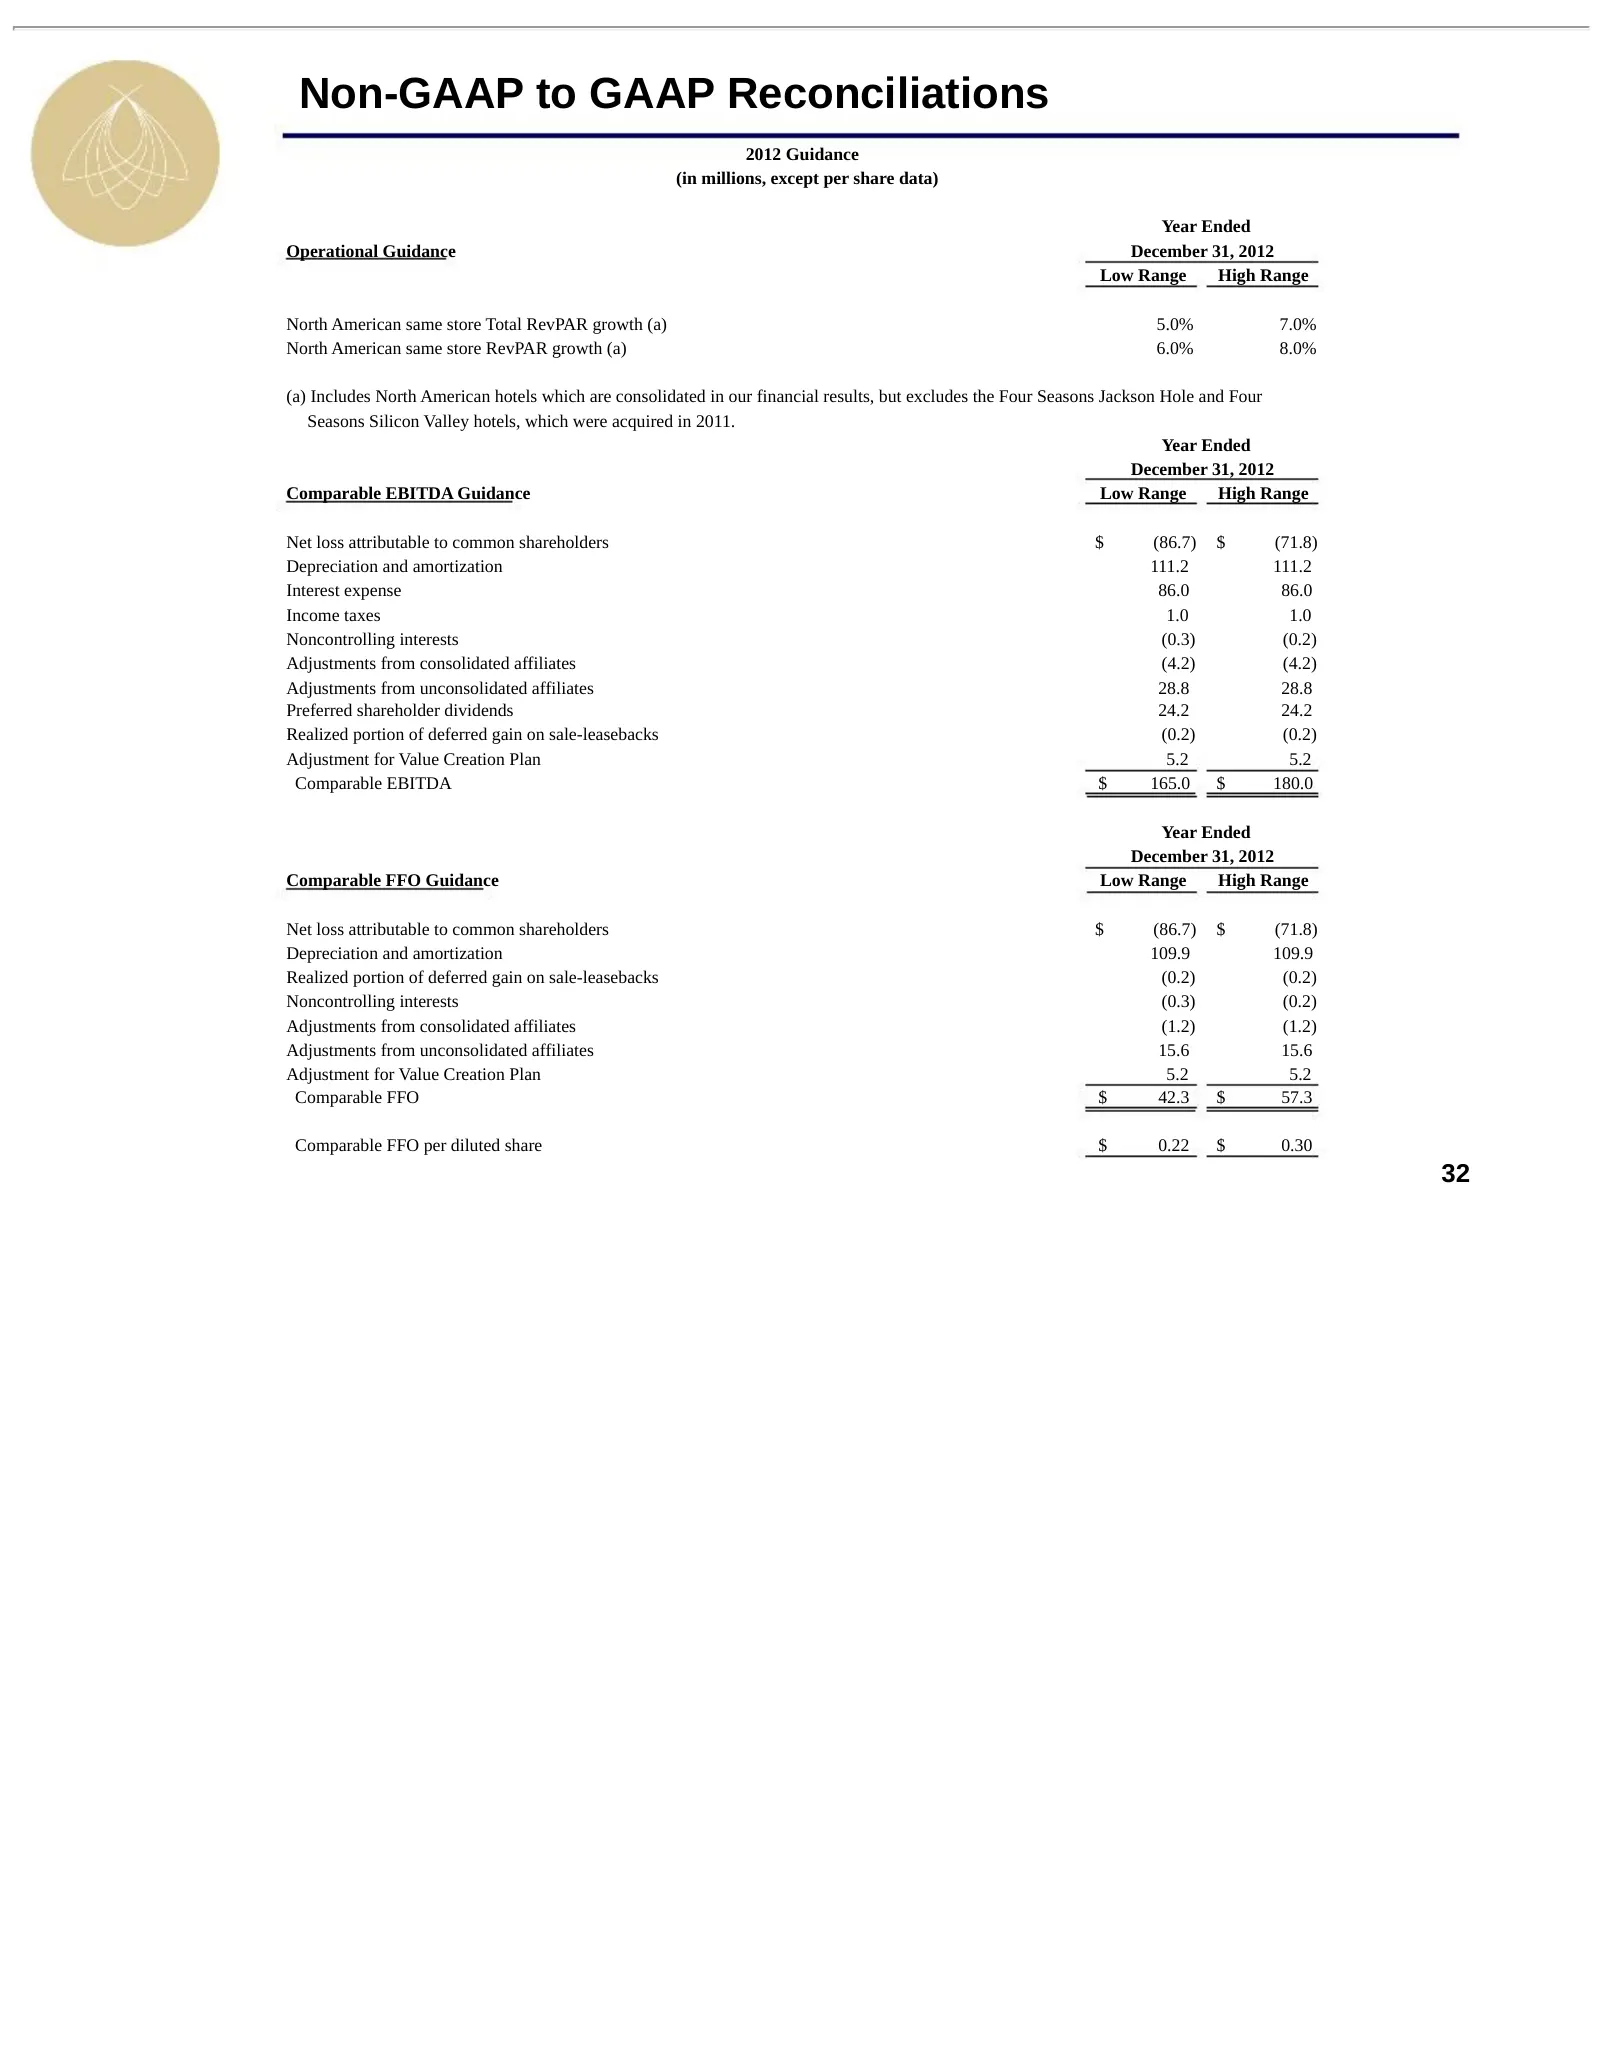
Non-GAAP to GAAP Reconciliations 2012 Guidance (in millions, except per share data) Year Ended Operational Guidance December 31, 2012 Low Range High Range North American same store Total RevPAR growth (a) 5.0% 7.0% North American same store RevPAR growth (a) 6.0% 8.0% (a) Includes North American hot

Slide 33: •* * * * * * * * * * * * ************* •*
•* * * * * * * * * * * * ************* •* * * * * * * * * * * * * * * * * * * * * * *
Source: SEC EDGAR · 8-K filed Mar 7, 2012
More decks from Strategic Hotels and Resorts Inc
 Investor Presentation (June 2015)43 slides · Jun 1, 2015
 Investor Presentation (February 2015)43 slides · Feb 24, 2015
 Investor Presentation (January 2015)44 slides · Jan 26, 2015
 Investor Presentation (November 2014)50 slides · Nov 5, 2014
 Investor Presentation (October 2014)50 slides · Oct 3, 2014
 Investor Day (September 2014)67 slides · Sep 22, 2014