Tiger Brands Limited · JSE:TBS
Tiger Brands — H1 2011 Earnings Presentation
48 slides from Tiger Brands's earnings presentation, 2011

Slide 1: Interim Financial Results: Condensed Investor Presentation 2011
ee oe & eevee w wees 8 we eee owe 8 © Tiger Brands Interim Financial Results: Condensed Investor Presentation 201 1

Slide 2: Group interim results and declaration of interim dividend
Tiger Brands Tiger Brands Limited Interim Financial Results: Condensed Investor Presentation cmt | Group interim results and declaration of interim dividend for the period ended 31 March 2011 NOTES:

Slide 3: A corporate strategy to address current and future challenges
© © ||| A corporate strategy to address current and future challenges | @ - VISION MISSION ™ | To be the most admired branded To deliver revenue growth that is 3% greater than SA GDP plus | FMCG company in emerging markets inflation and achieve our blended operating margin of 15%, thereby | | achiev

Slide 4: Competitive landscape
| Competitive landscape Business performance was impacted by the following: | . Rand strength ° Increased competitive environment ° Aproliferation of imports * An increase in Dealer Owned Brands . Significant cost push 2 TIGER BRANDS LIMITED Interim Financial Results: Condensed Investor Presentation

Slide 5: How we are responding
© © oueseveeeeweeeeeexeeweet & & ee wos 8 How we are responding * Investment in our brands ° Investment in consumer insight s Judicious price point management ° Pack format changes | . Increased customer activity bd Continuous improvement initiatives ] A number of initiatives were undertaken to ensu
Slide 6: Economic environment 2011 — global and local indicators
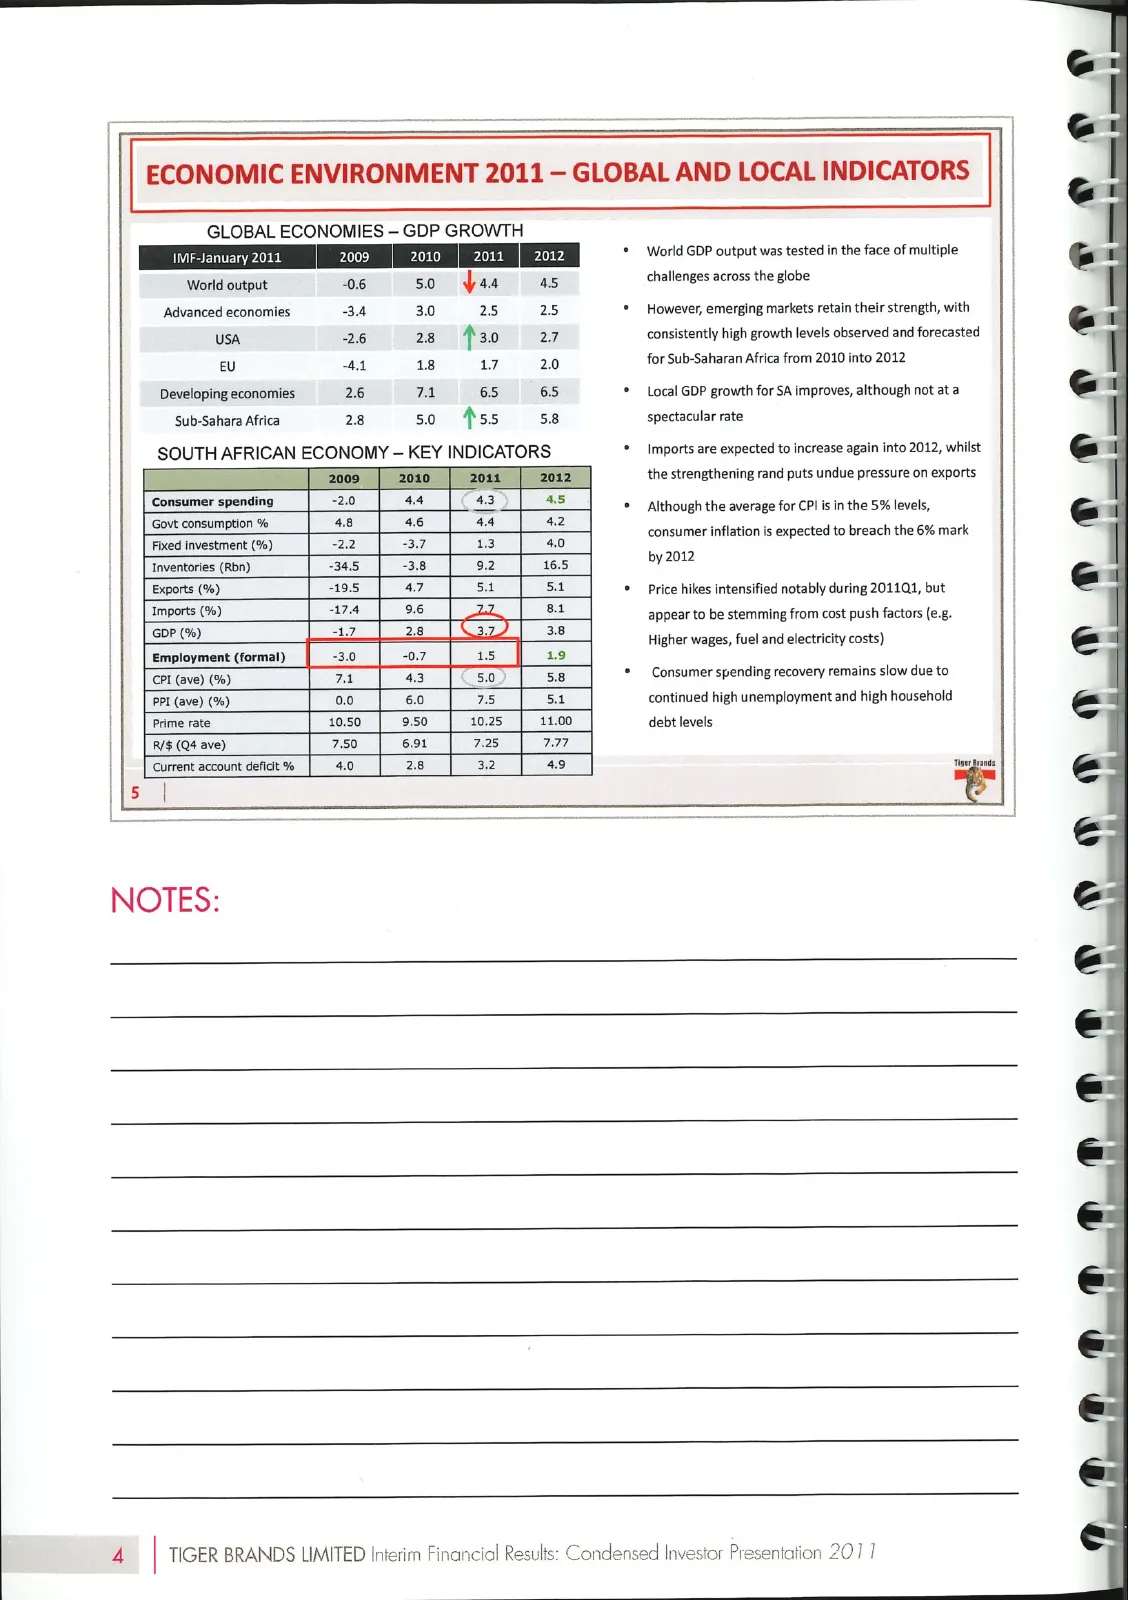
ECONOMIC ENVIRONMENT 2011 — GLOBAL AND LOCAL INDICATORS GLOBAL ECONOMIES — GDP GROWTH | | | | World output 06 so yaa as challenges across the globe | Advanced economies 34 3.0 25 25 * However, emerging markets retain their strength, with | USA 26 zane Pao Baz consistently high growth levels observed
Slide 7: Economic environment 1 - retail sales growth
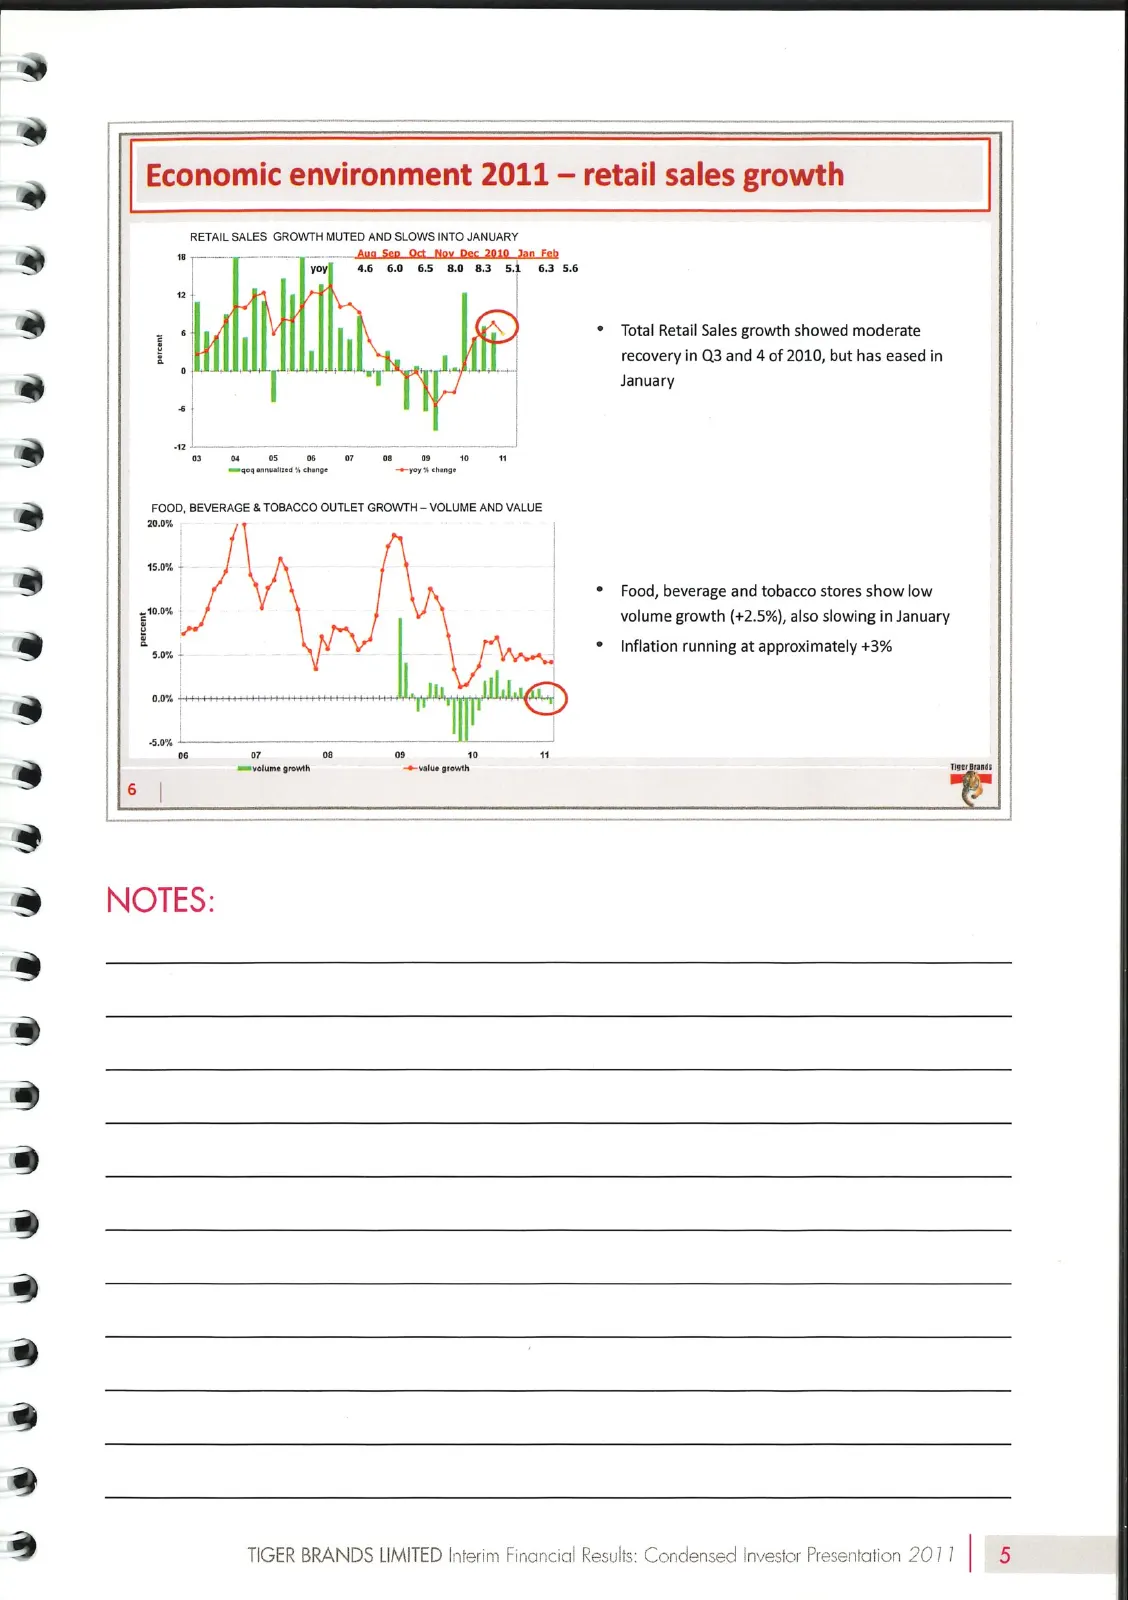
a2aeee eovuvpuueeeeteeueeeeunues XY Economic environment 2011 - retail sales growth 200% 15.0% RETAIL SALES GROWTH MUTED AND SLOWS INTO JANUARY 46 6.0 65 80 83 Si 63 56 FOOD, BEVERAGE & TOBACCO OUTLET GROWTH — VOLUME AND VALUE 7 oe 0 0 ” Total Retail Sales growth showed moderate recovery in Q3 and 4
Slide 8: Economic environment 2011 — Consumer expenditure
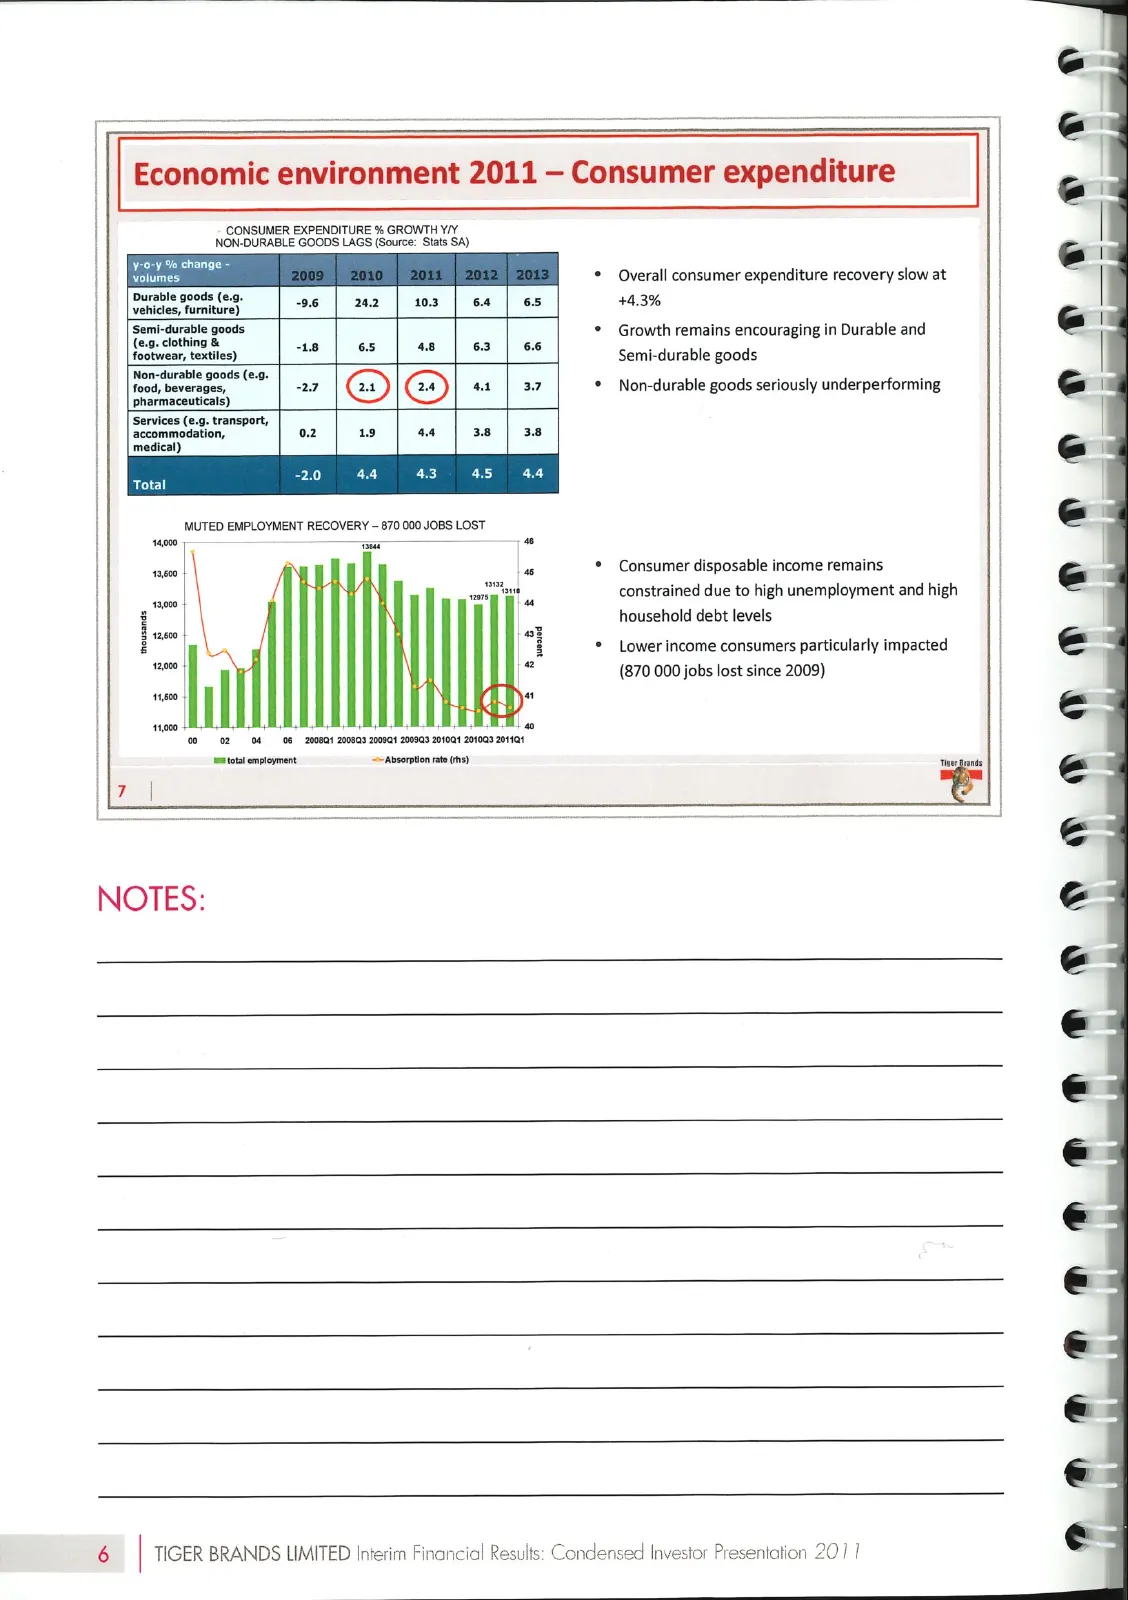
oe ——— Economic environment 2011 — Consumer expenditure ‘CONSUMER EXPENDITURE % GROWTH Y/Y NON-DURABLE GOODS LAGS (Source: Stats SA) | change | * Overall consumer expenditure recovery slow at | Durable goods (e.g. | Durable anode (ea 26 | m2 | 103 | 64 | 65 +4,3% | ‘Semi-durable goods * Growth remai
Slide 9: Impact on consumer spending
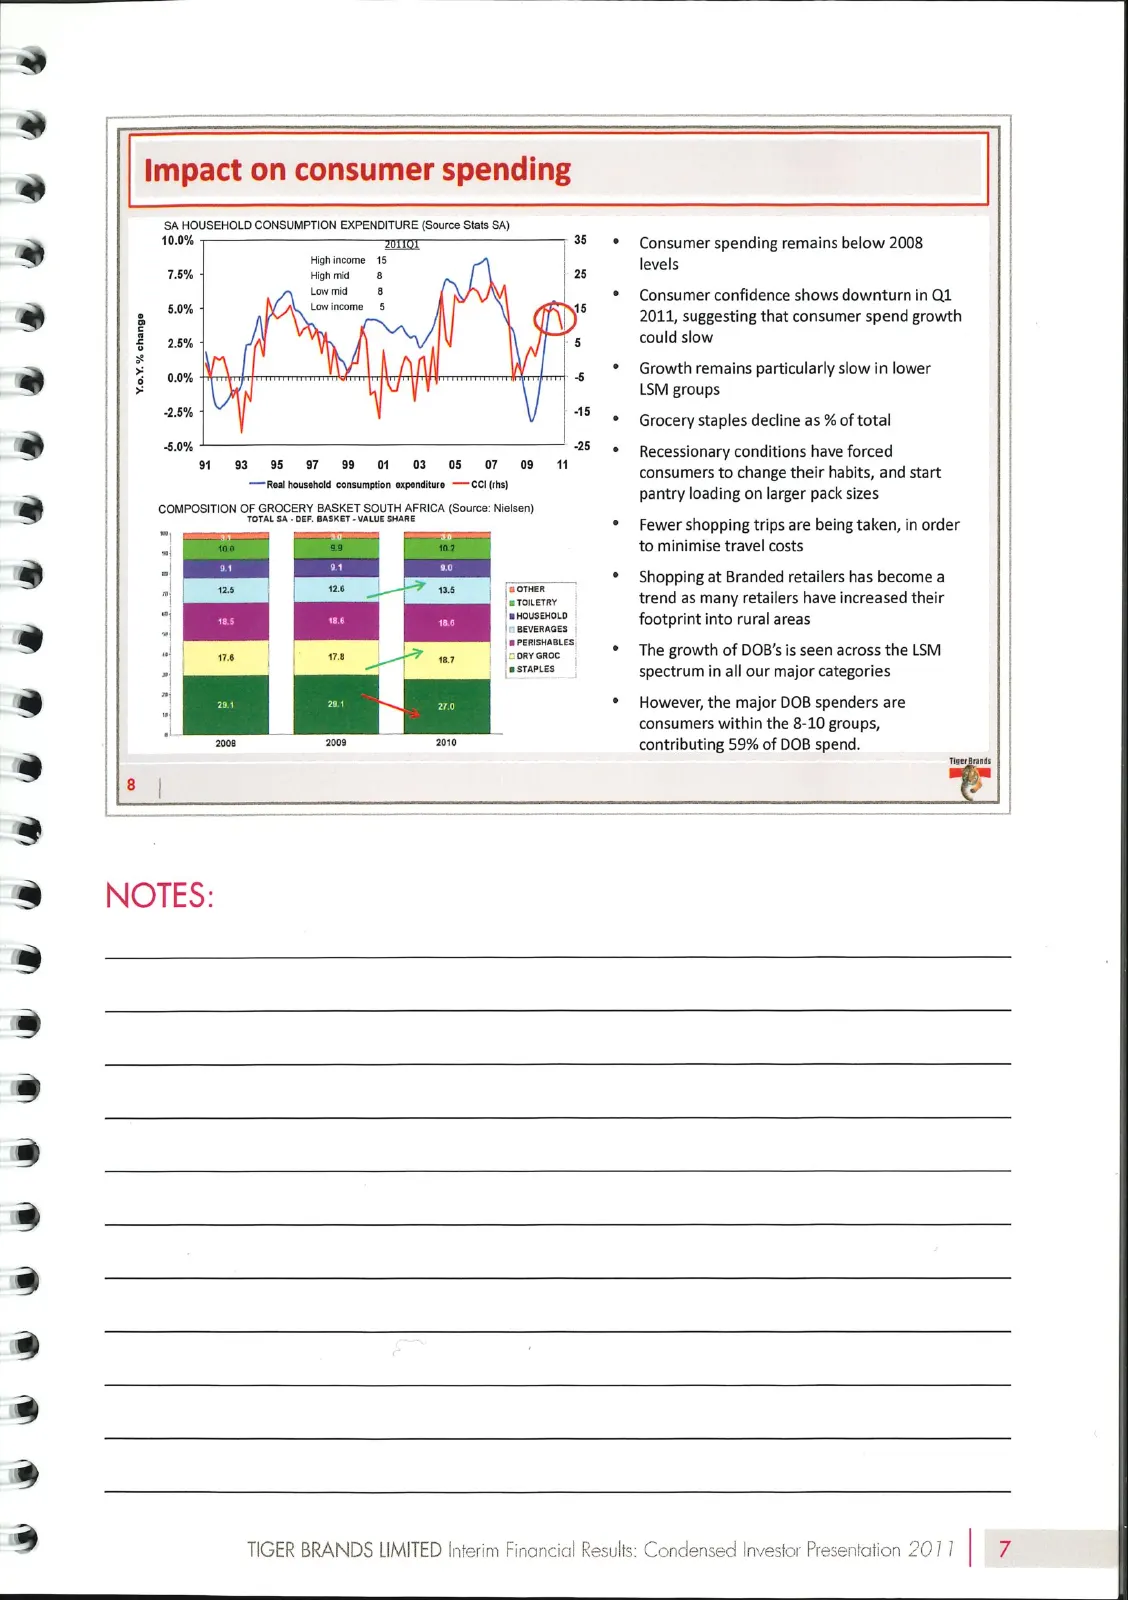
& eowvesvioeoeueewveeeweeeeeeese ese bebe oe o Impact on consumer spending SA HOUSEHOLD CONSUMPTION EXPENDITURE (Source Stats SA) 10.0% aan High income 15 18% Honmd 8 Lowmid 8 5.0% 25% Y.0.¥. % change —Real household consumption expenditure — CCl (hs) COMPOSITION OF GROCERY BASKET SOUTH AFRICA (Sour
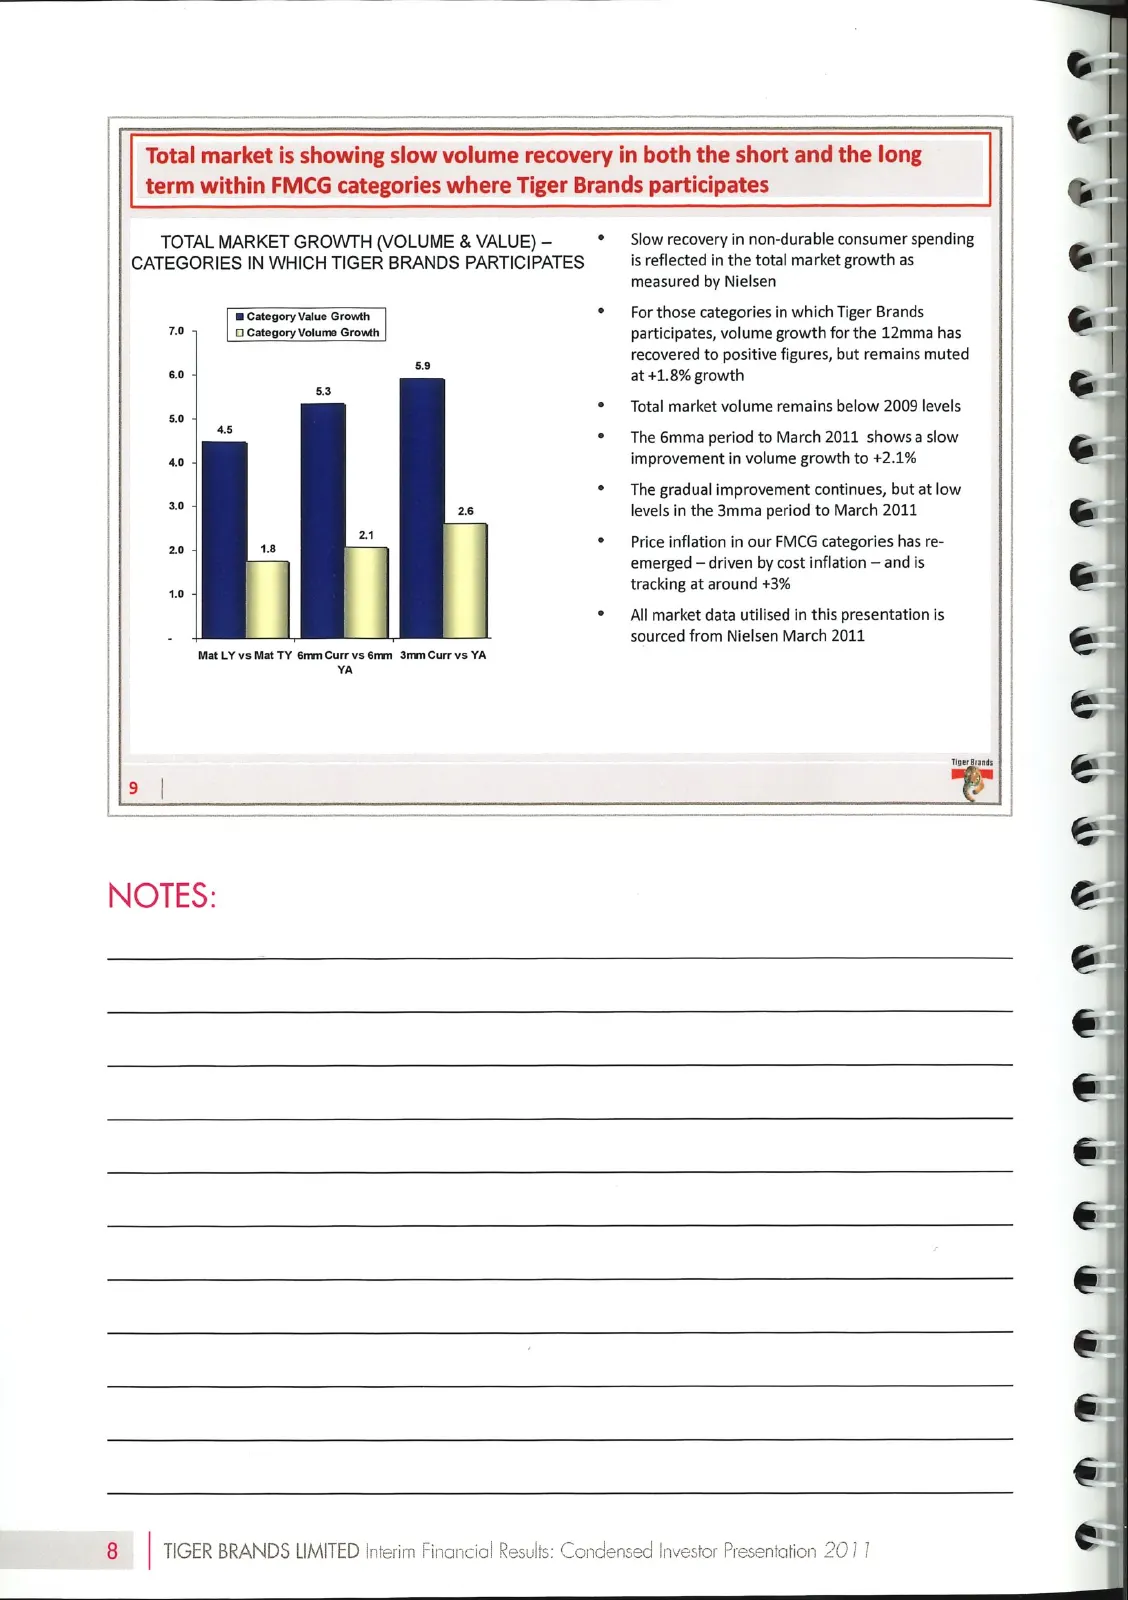
Slide 10: Total market is showing slow volume recovery
Total market is showing slow volume recovery in both the short and the long term within FMCG categories where Tiger Brands participates TOTAL MARKET GROWTH (VOLUME & VALUE)- —*_Slowrrecovery in non-durable consumer spending CATEGORIES IN WHICH TIGER BRANDS PARTICIPATES is reflected in the total mark
Slide 11: In summary
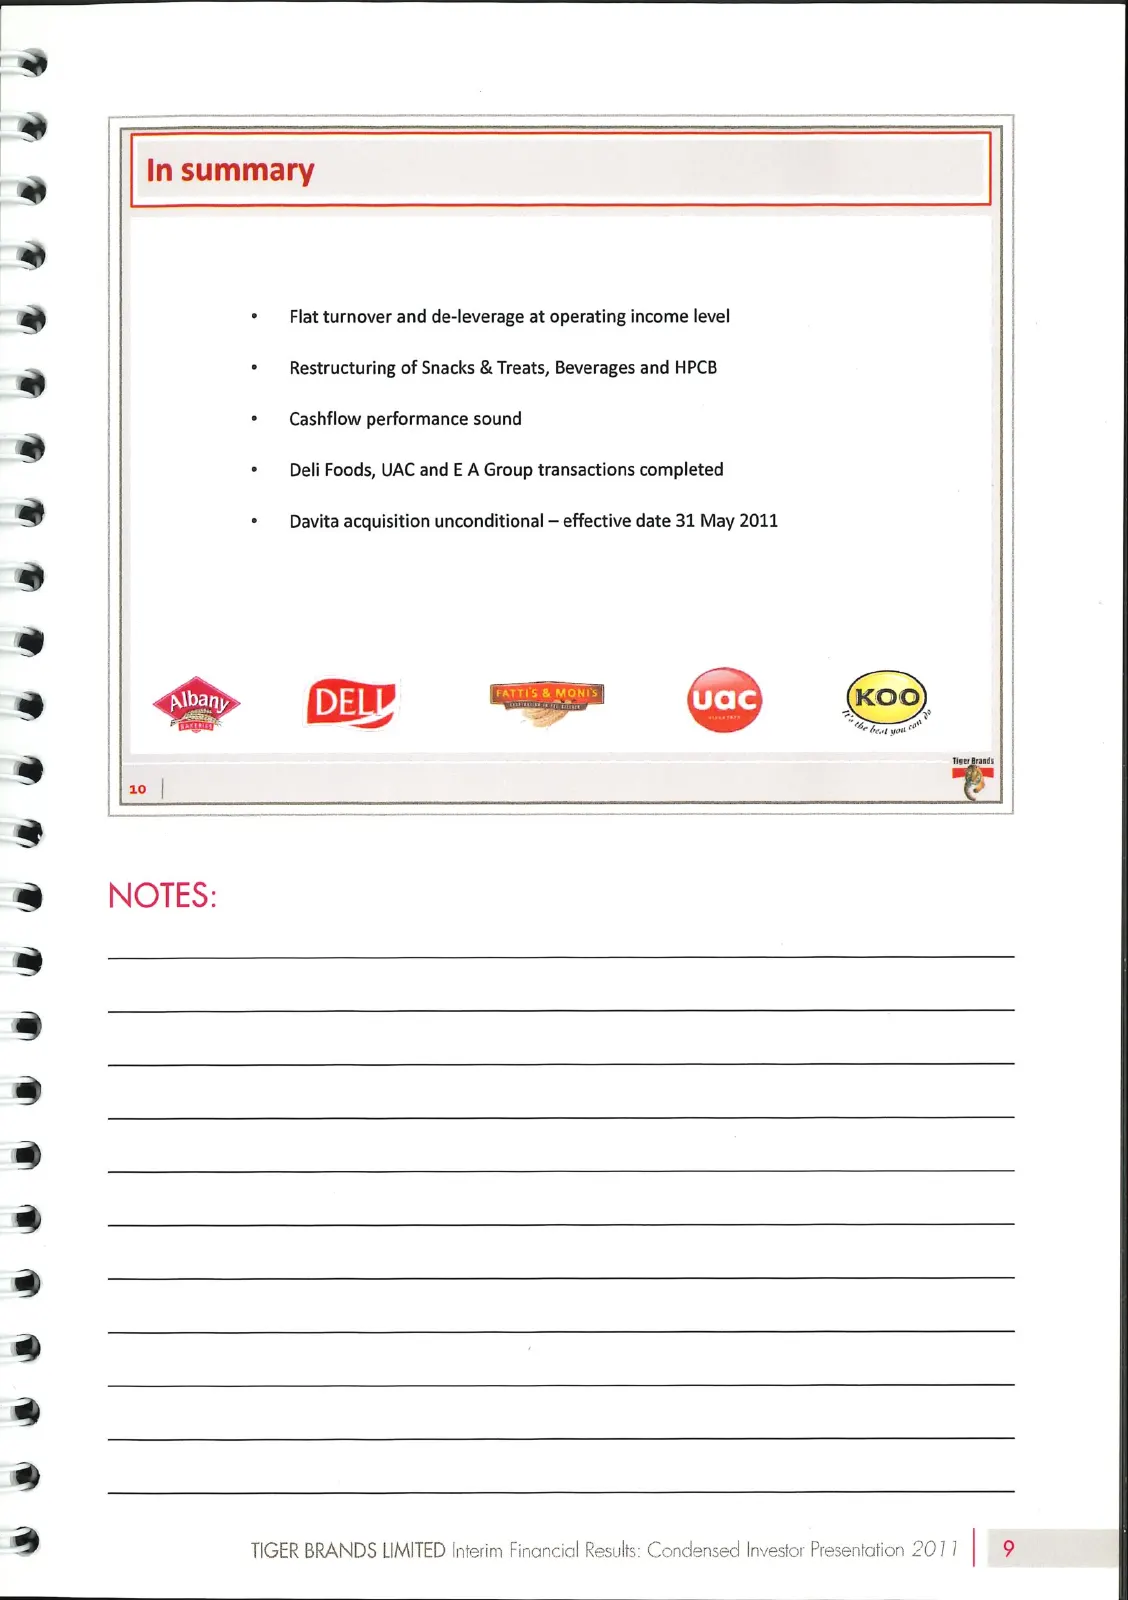
& ae & ae & eoesesupeueuesueeeweeneseeeaeueye In summary | * Cashflow performance sound * Flat turnover and de-leverage at operating income level * — Restructuring of Snacks & Treats, Beverages and HPCB | * Deli Foods, UAC and E A Group transactions completed * Davita acquisition unconditional — eff
Slide 12: Income Statement
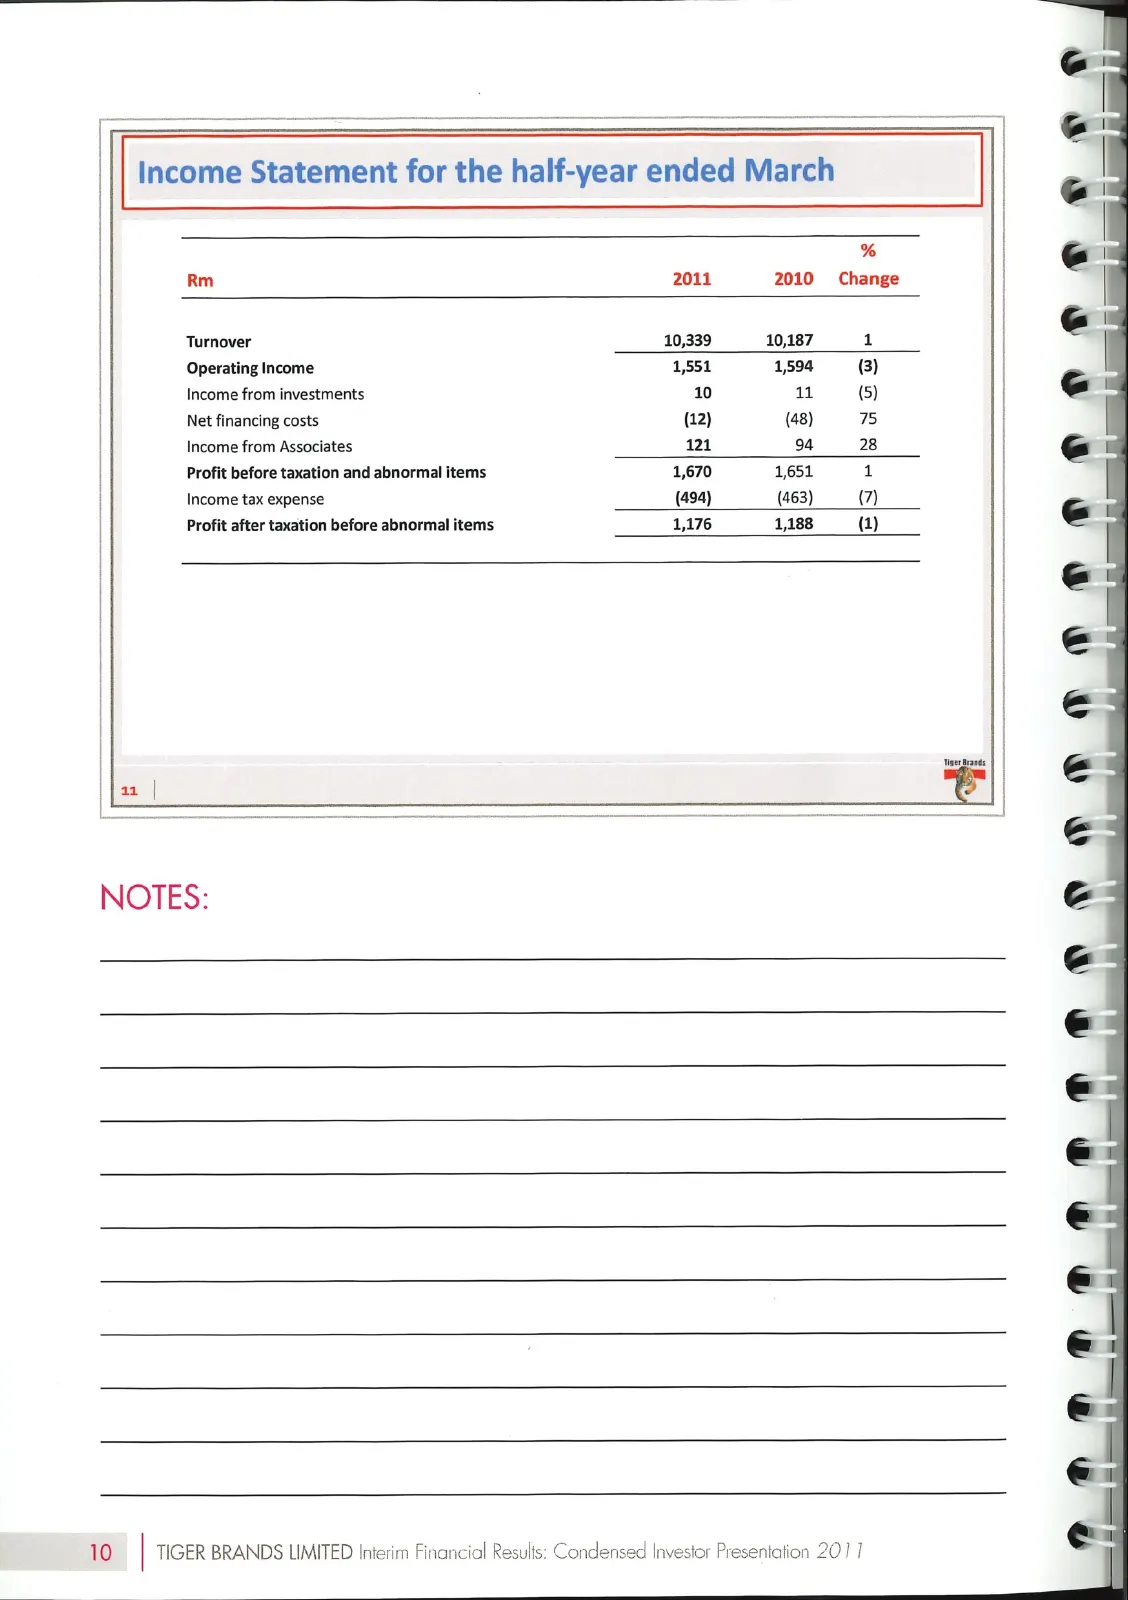
x | Rm 2011 2010 Change | ' | @! Turnover 10,339 10,187 1 | Operating Income 1,551 1594 (3) | Income from investments 10 1 (5) | Net financing costs (12) (48) 75 Income from Associates 121 9428 Profit before taxation and abnormal items 1,670 1,651 1 Income tax expense (494) (463) (7) Profit after ta
Slide 13: Income Statement for the half-year ended March
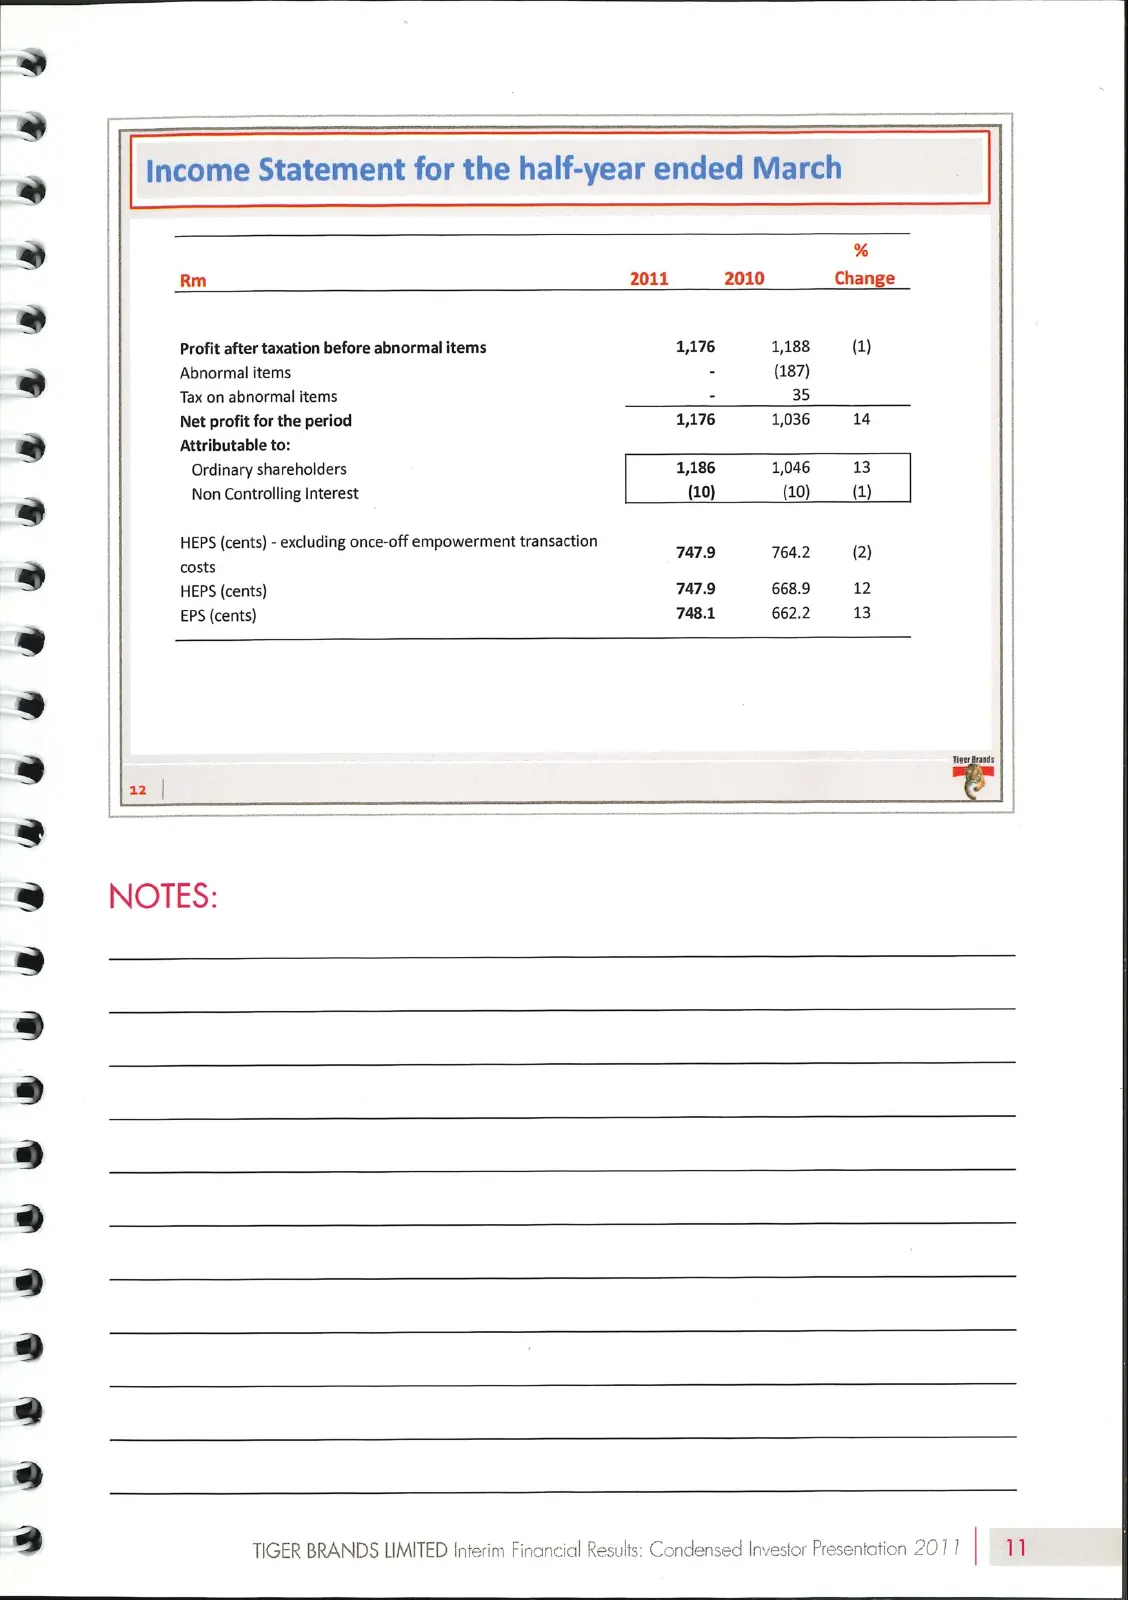
& Income Statement for the half-year ended March ae % | Rm 2011 2010 Change > | | Profit after taxation before abnormal items 1,176 1,188 (1) | 2 | Abnormal items - (187) | | Tax on abnormal items : 35 | | Net profit for the period 1,176 1,036 «14 | @ | Attributable to: | | Ordinary shareholders 1,1
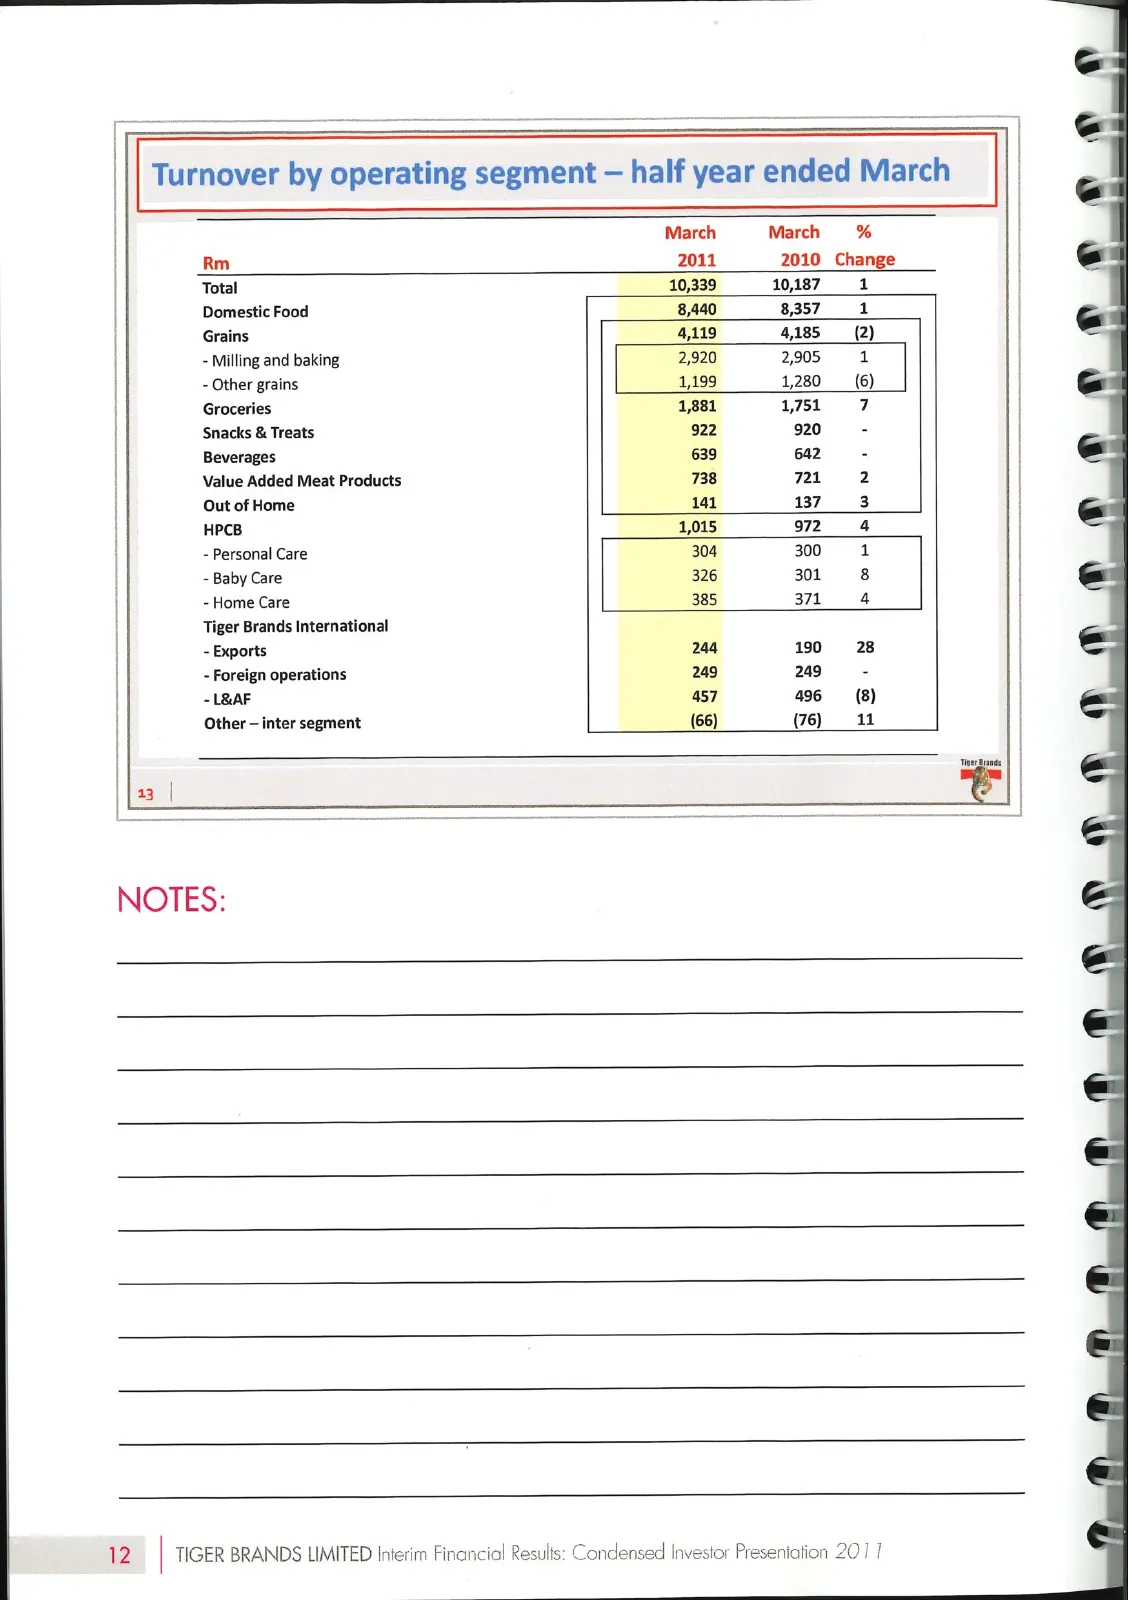
Slide 14: Turnover by operating segment — half year ended March
Turnover by operating segment — half year ended March March March % Rm 2011 2010 Change Total 10,339 10,1871 Domestic Food 8,440 83571 Grains 4,119 4185 (2) - Milling and baking 2,920 2,905 1 - Other grains 1,199 1,280___(6) Groceries 1,881 17517 Snacks & Treats 922 9200 - Beverages 639 642 - Value
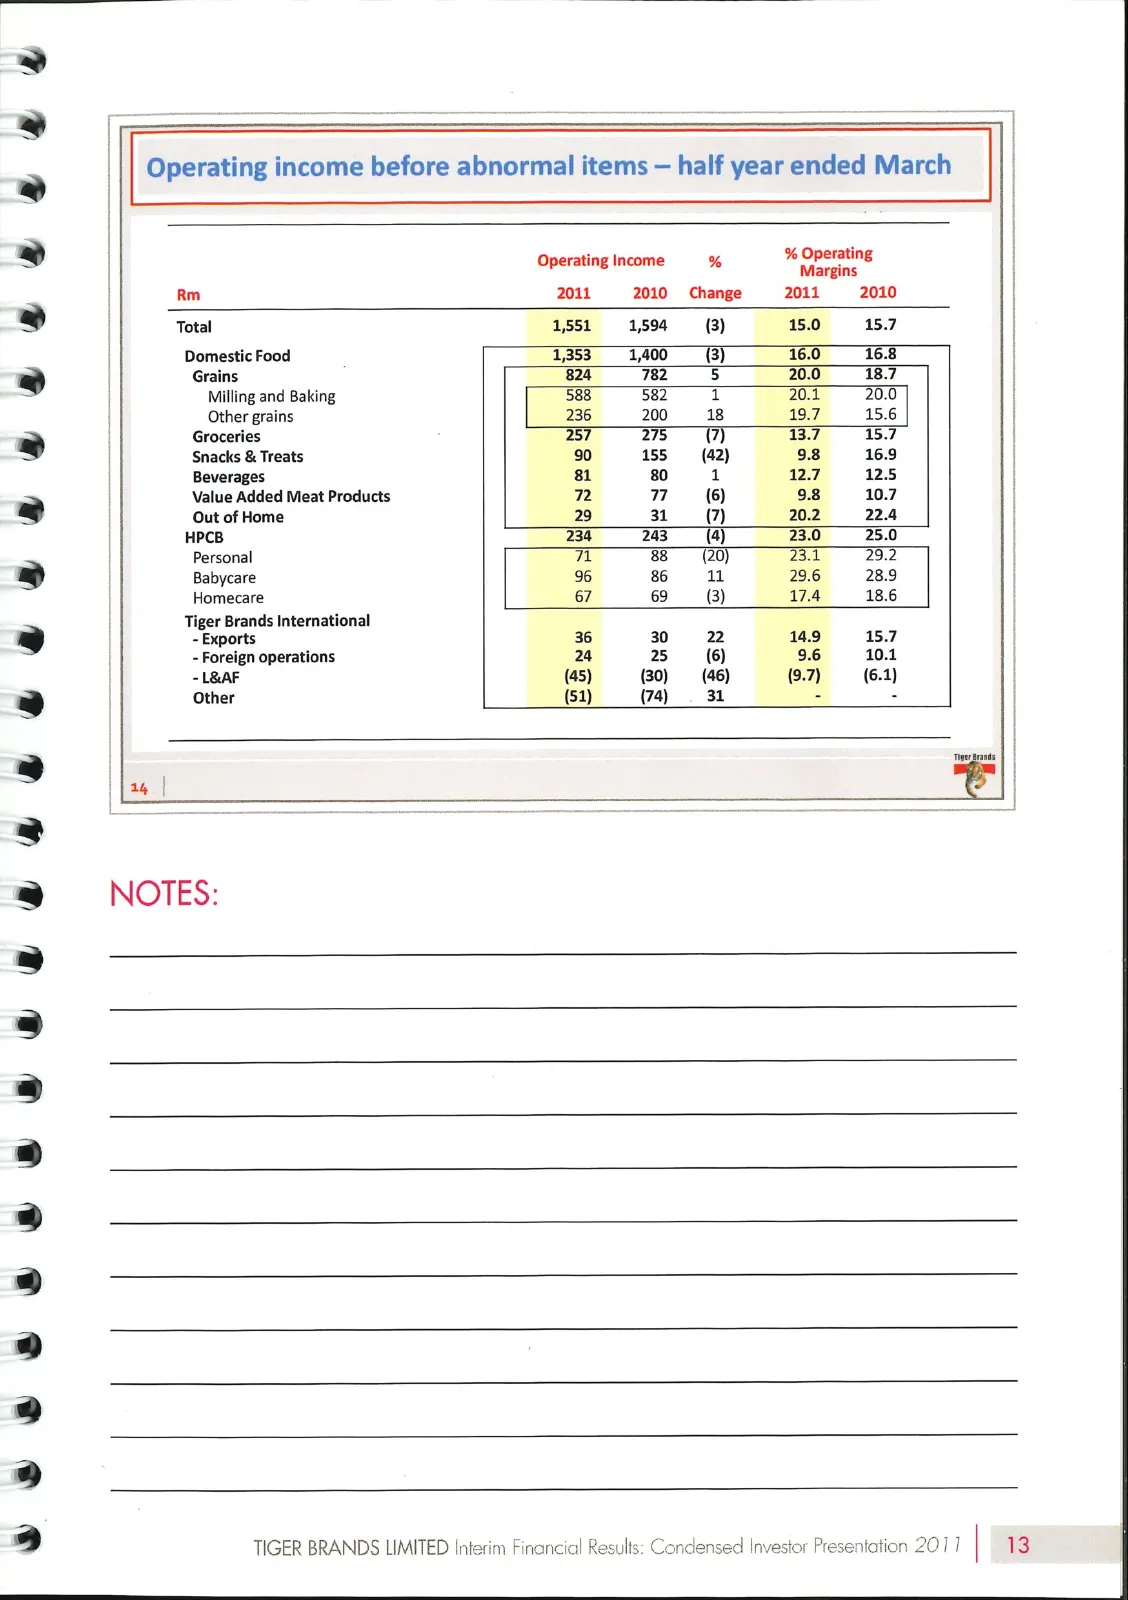
Slide 15: Operating income before abnormal items — half year ended March
& w Operating income before abnormal items — half year ended March co 7 % Operatin, | Operating Income % one | Rm 2011-2010 Change = 2011._—S— 2010 ® | Total 1551 1,594 (3) 15.0 15.7 | | Domestic Food 1,353 1,400 B) 16.0 16.8 ) | Grains 824 782_—=S 20.0 18.7 - | Milling and Baking 588 5a «1 20.1 20.
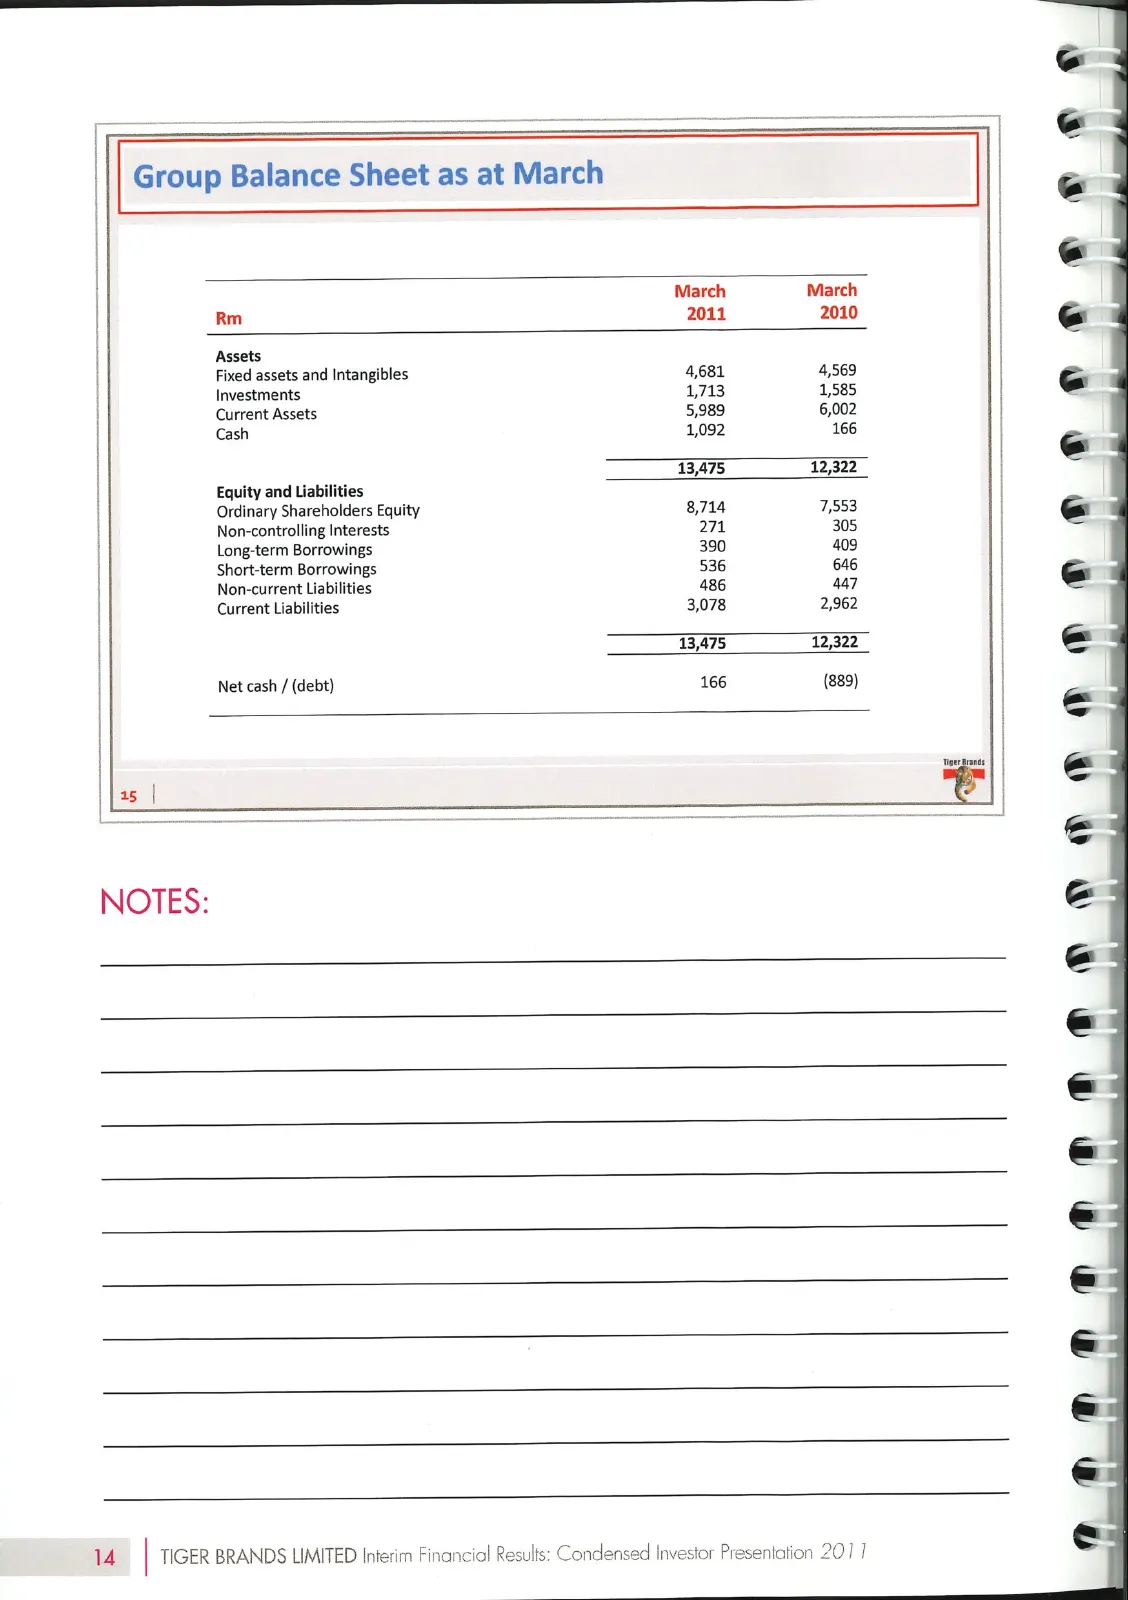
Slide 16: Group Balance Sheet as at March
Group Balance Sheet as at March March March Rm 2011 2010 Assets Fixed assets and Intangibles 4,681 4,569 Investments 1,713 1,585 Current Assets 5,989 6,002 Cash 1,092 166 13,475 12,322 Equity and Liabilities Ordinary Shareholders Equity 8,714 7,553, Non-controlling Interests 271 305 Long-term Borrow
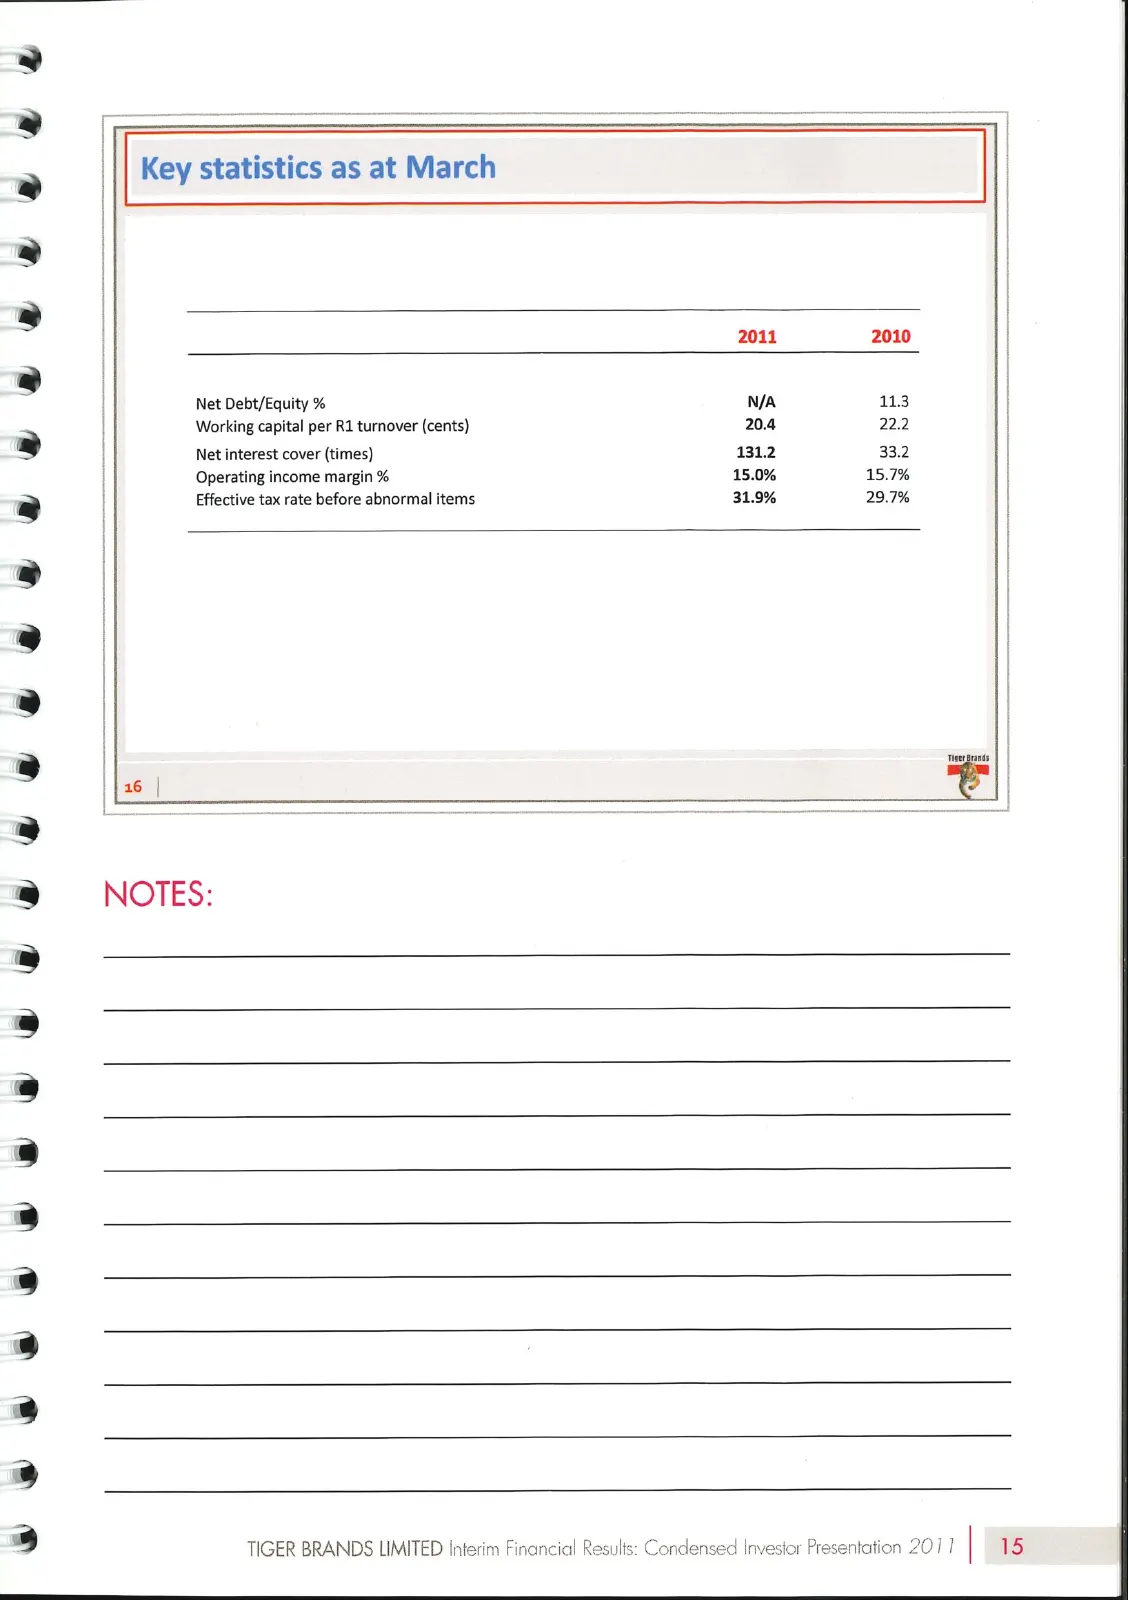
Slide 17: Key statistics as at March
aye ve oweweweieoeoweweeseeunuveneHe#hse ewe ese wo Key statistics as at March | Effective tax rate before abnormal items 2011 2010 Net Debt/Equity % N/A 113 Working capital per Ri turnover (cents) 20.4 22.2 Net interest cover (times) 131.2 33.2 Operating income margin % 15.0% 15.7% 31.9% 29.7% TIGE
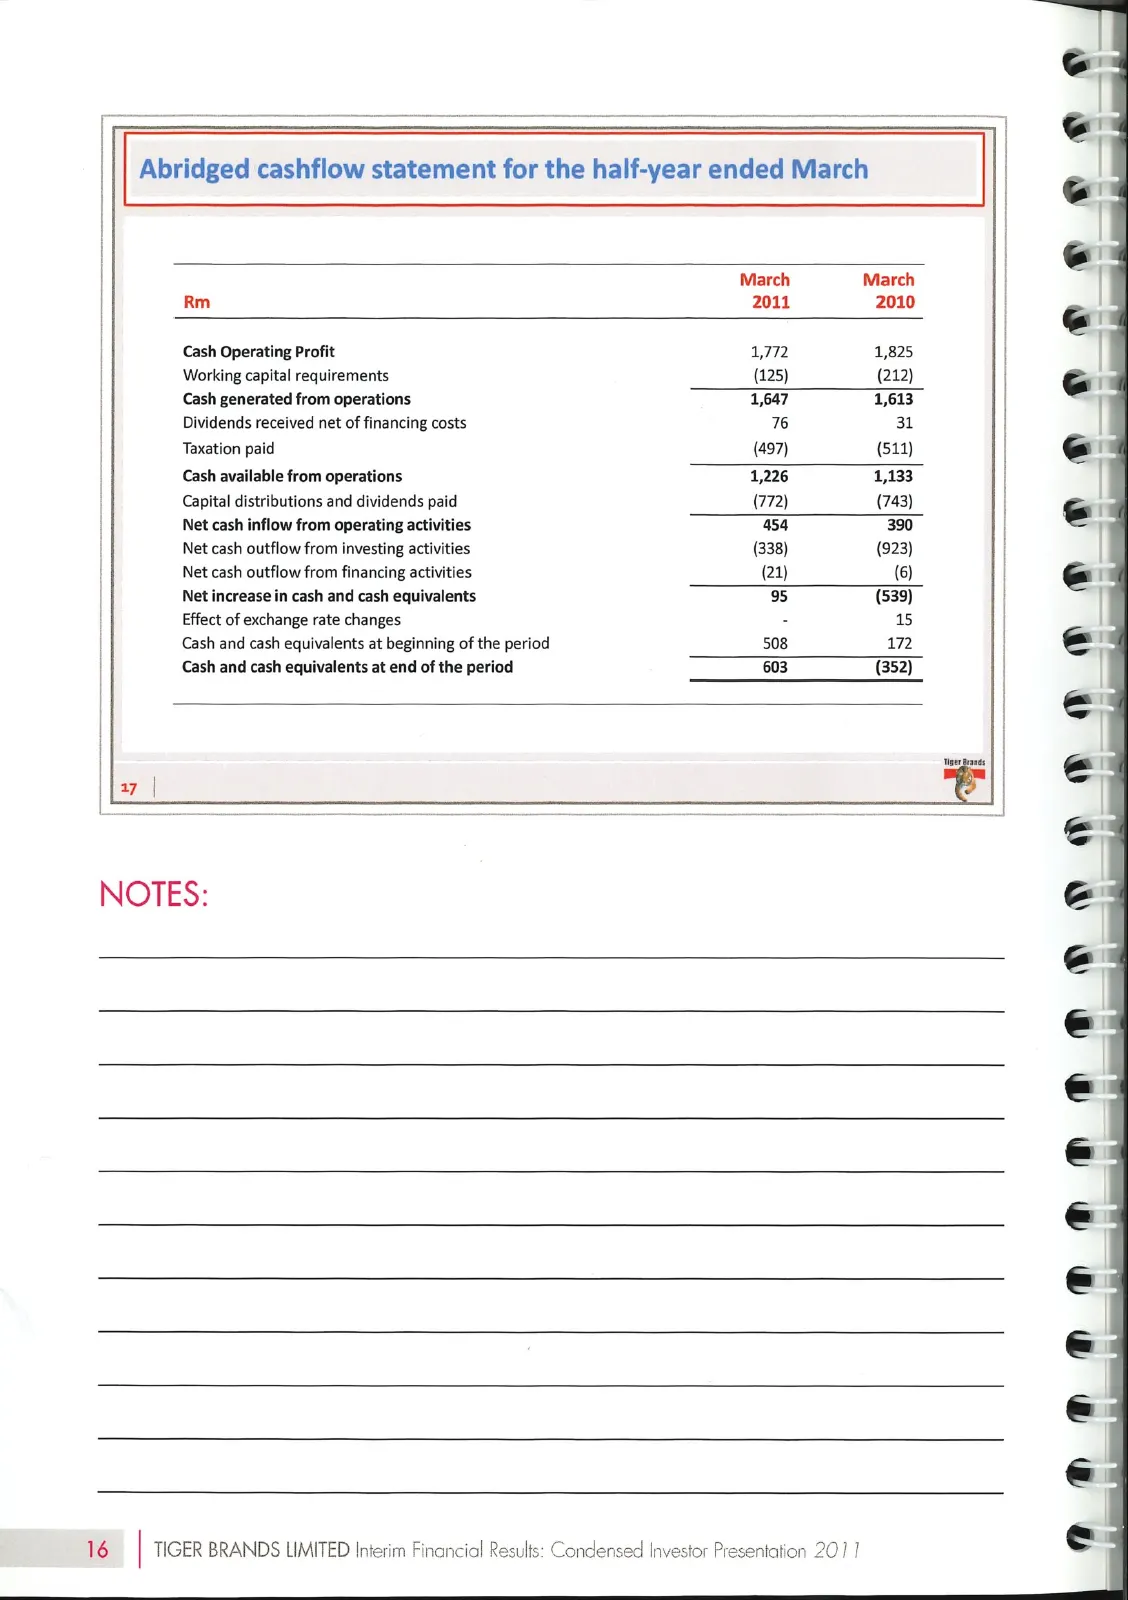
Slide 18: Abridged cashflow statement for the half-year ended March
© Abridged cashflow statement for the half-year ended March March March Rm 2011 2010 T Cash Operating Profit 1,772 1,825 | Working capital requirements (125) (212) r Cash generated from operations 1,647 1,613 , | Dividends received net of financing costs 16 31 | Taxation paid (497) (511) T Cash avai
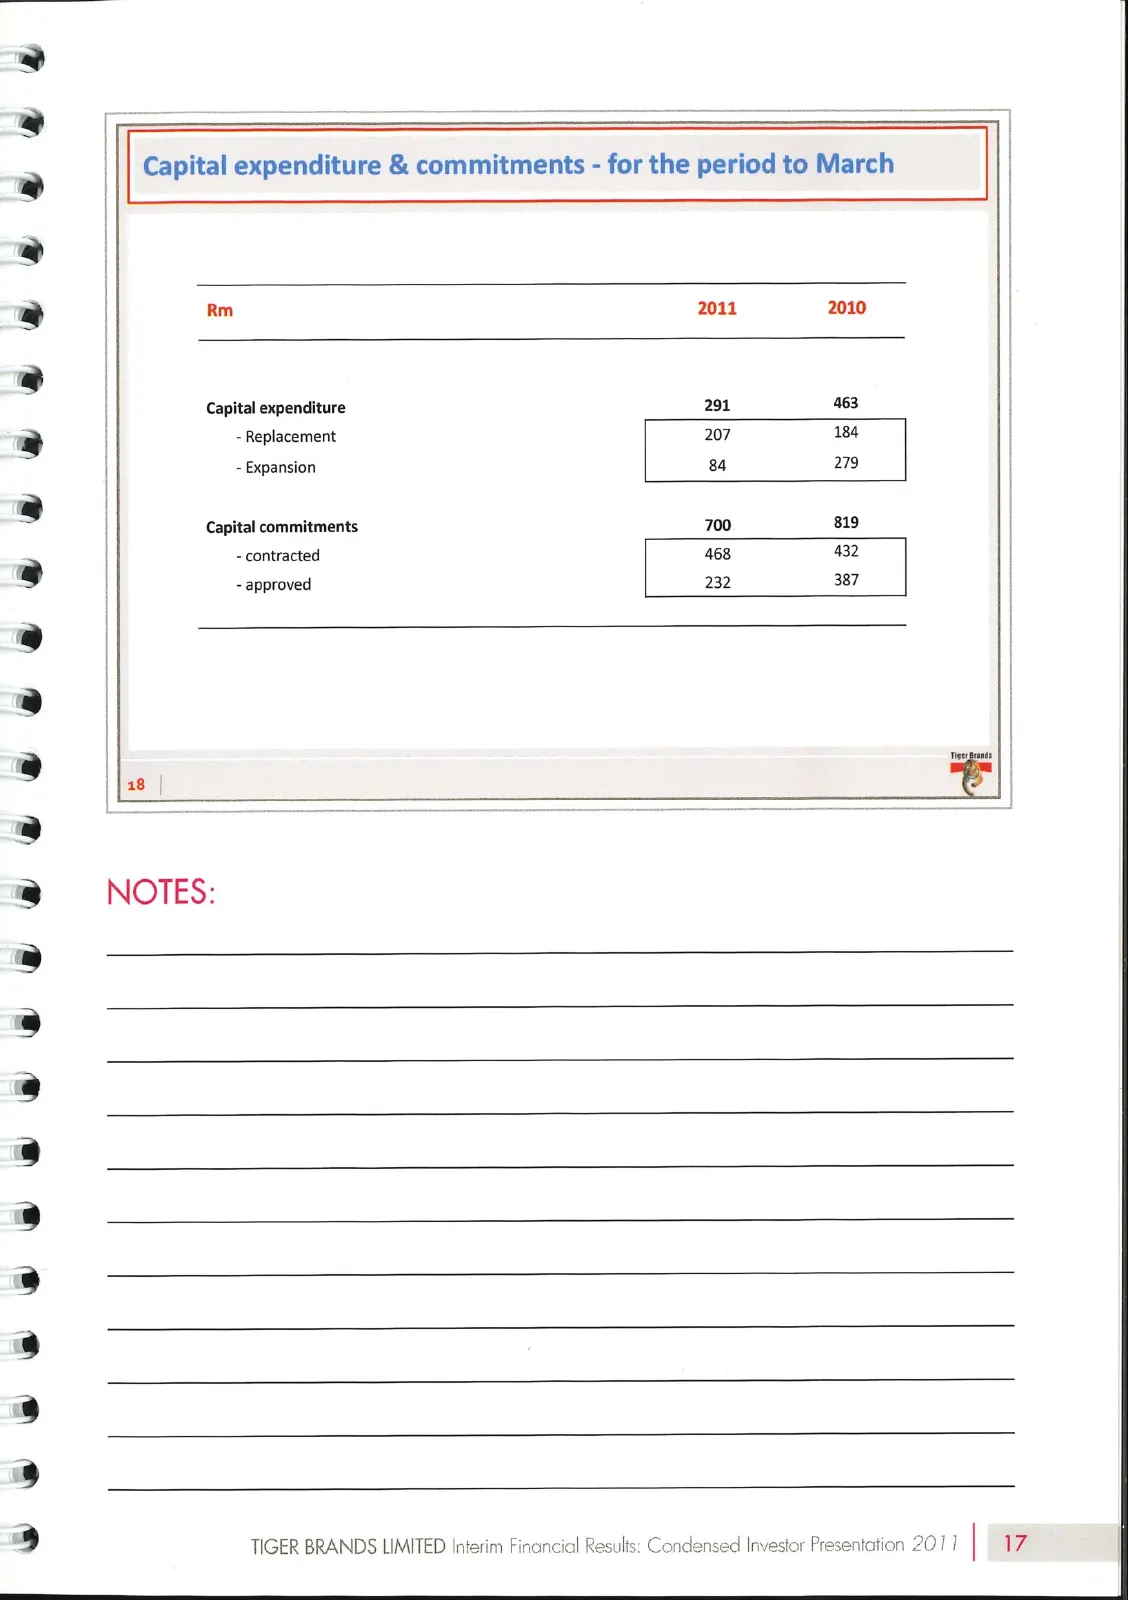
Slide 19: Capital expenditure & commitments
ae & oo a w& awweweexevess eo w swe wsewvwstuse ew Capital expenditure & commitments - for the period to March | | | Rm 2011 2010 | | | | Capital expenditure 291 463 | | - Replacement 207 184 | - Expansion 84 279 | Capital commitments 700 819 | | - contracted 468 432 | | - approved 232 387 | | | | |
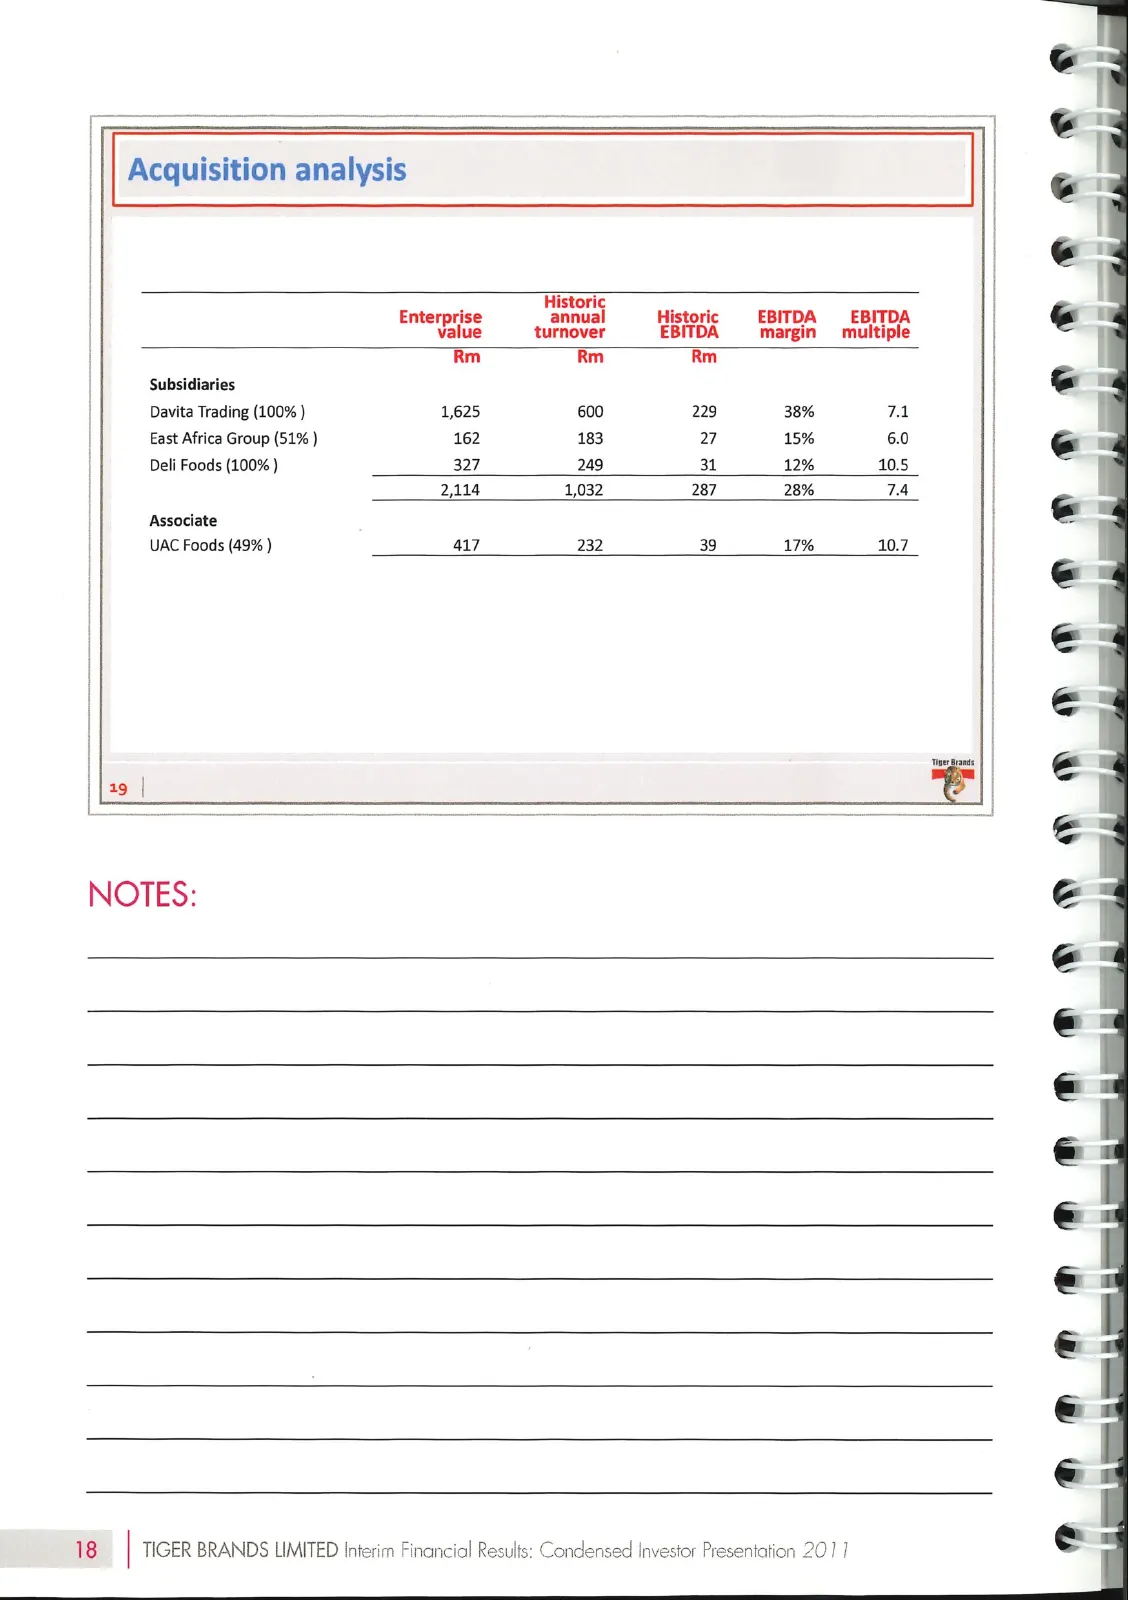
Slide 20: Acquisition analysis
° Acquisition analysis | OP OP © HH | Enterprise Penal Historic EBITDA EBITDA | value turnover EBITDA margin multiple Rm Rm Rm Subsidiaries Davita Trading (100% ) 1,625 600 229 38% wl | | East Africa Group (51% ) 162 183 27 15% 6.0 | | Deli Foods (100% ) Eid 249 31 12% 10.5 | 2114 1,032 287 28% 74 |
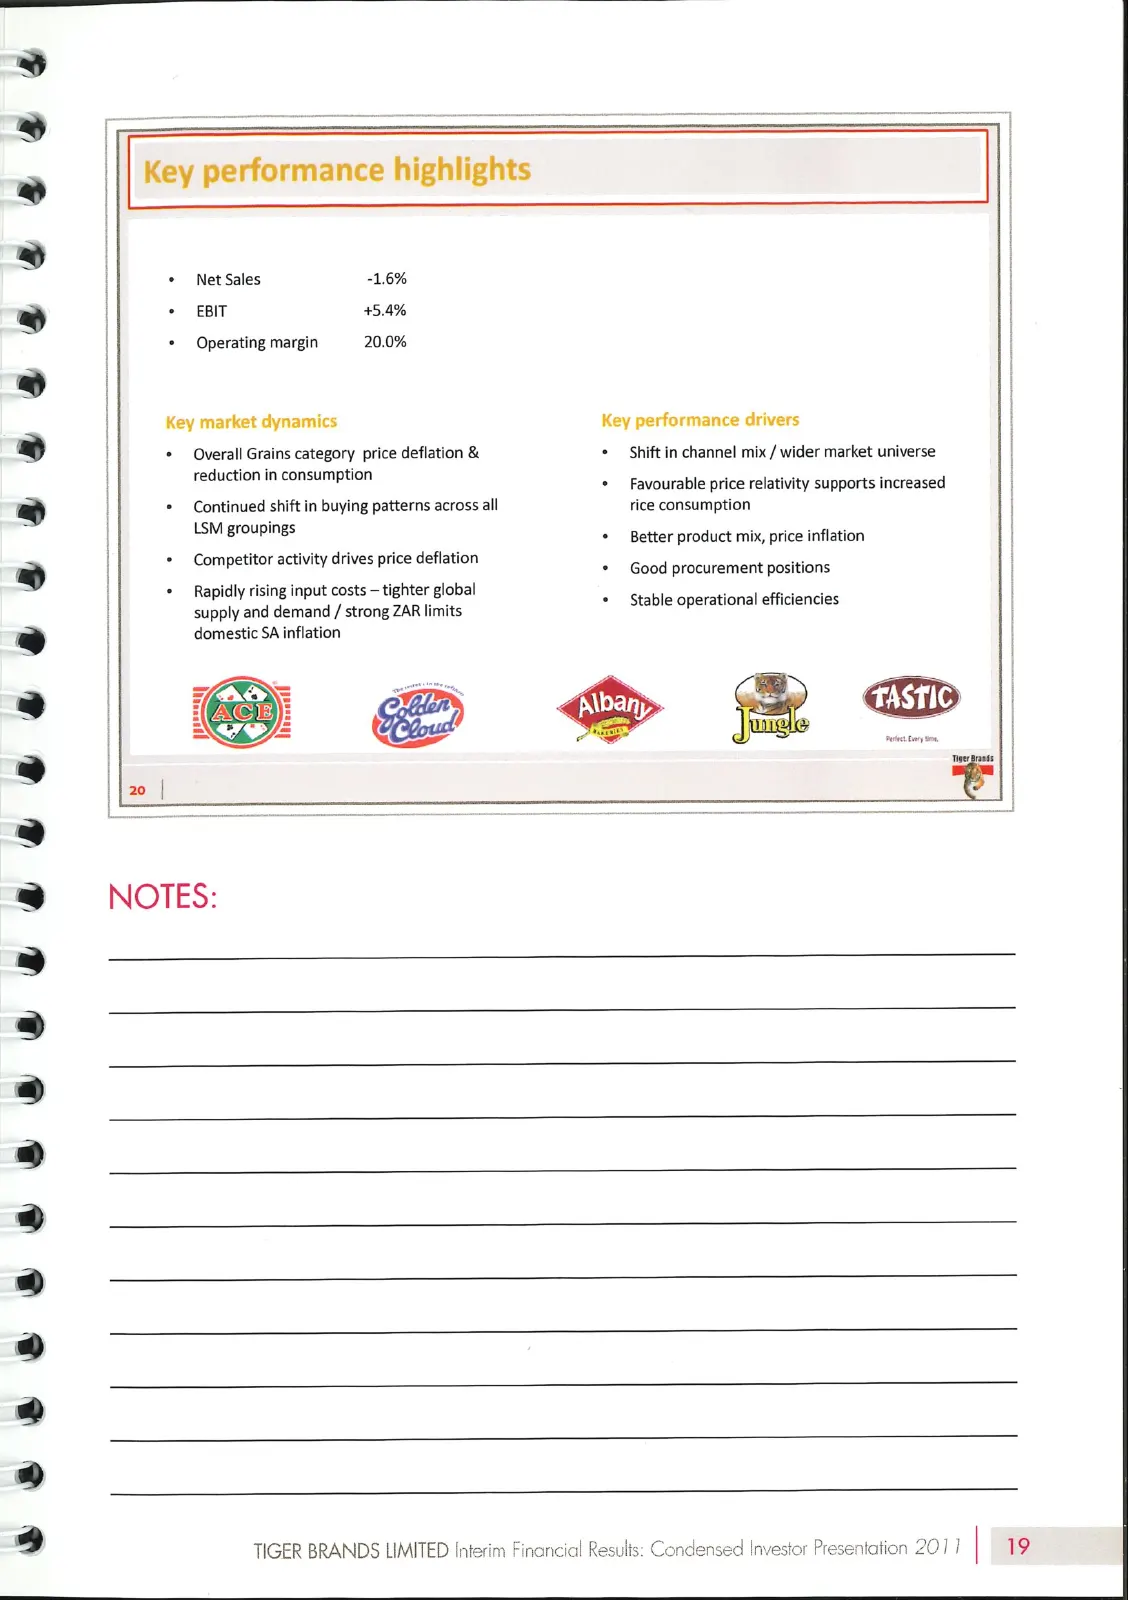
Slide 21: Grains
@#eeywe #eeoeoagerv, es & ) 2 esse epuusue oes | Key performance highlights + Net Sales -1.6% + EBIT 45.4% + Operating margin 20.0% Key market dynamics * Overall Grains category price deflation & reduction in consumption * Continued shift in buying patterns across all LSM groupings * Competitor acti
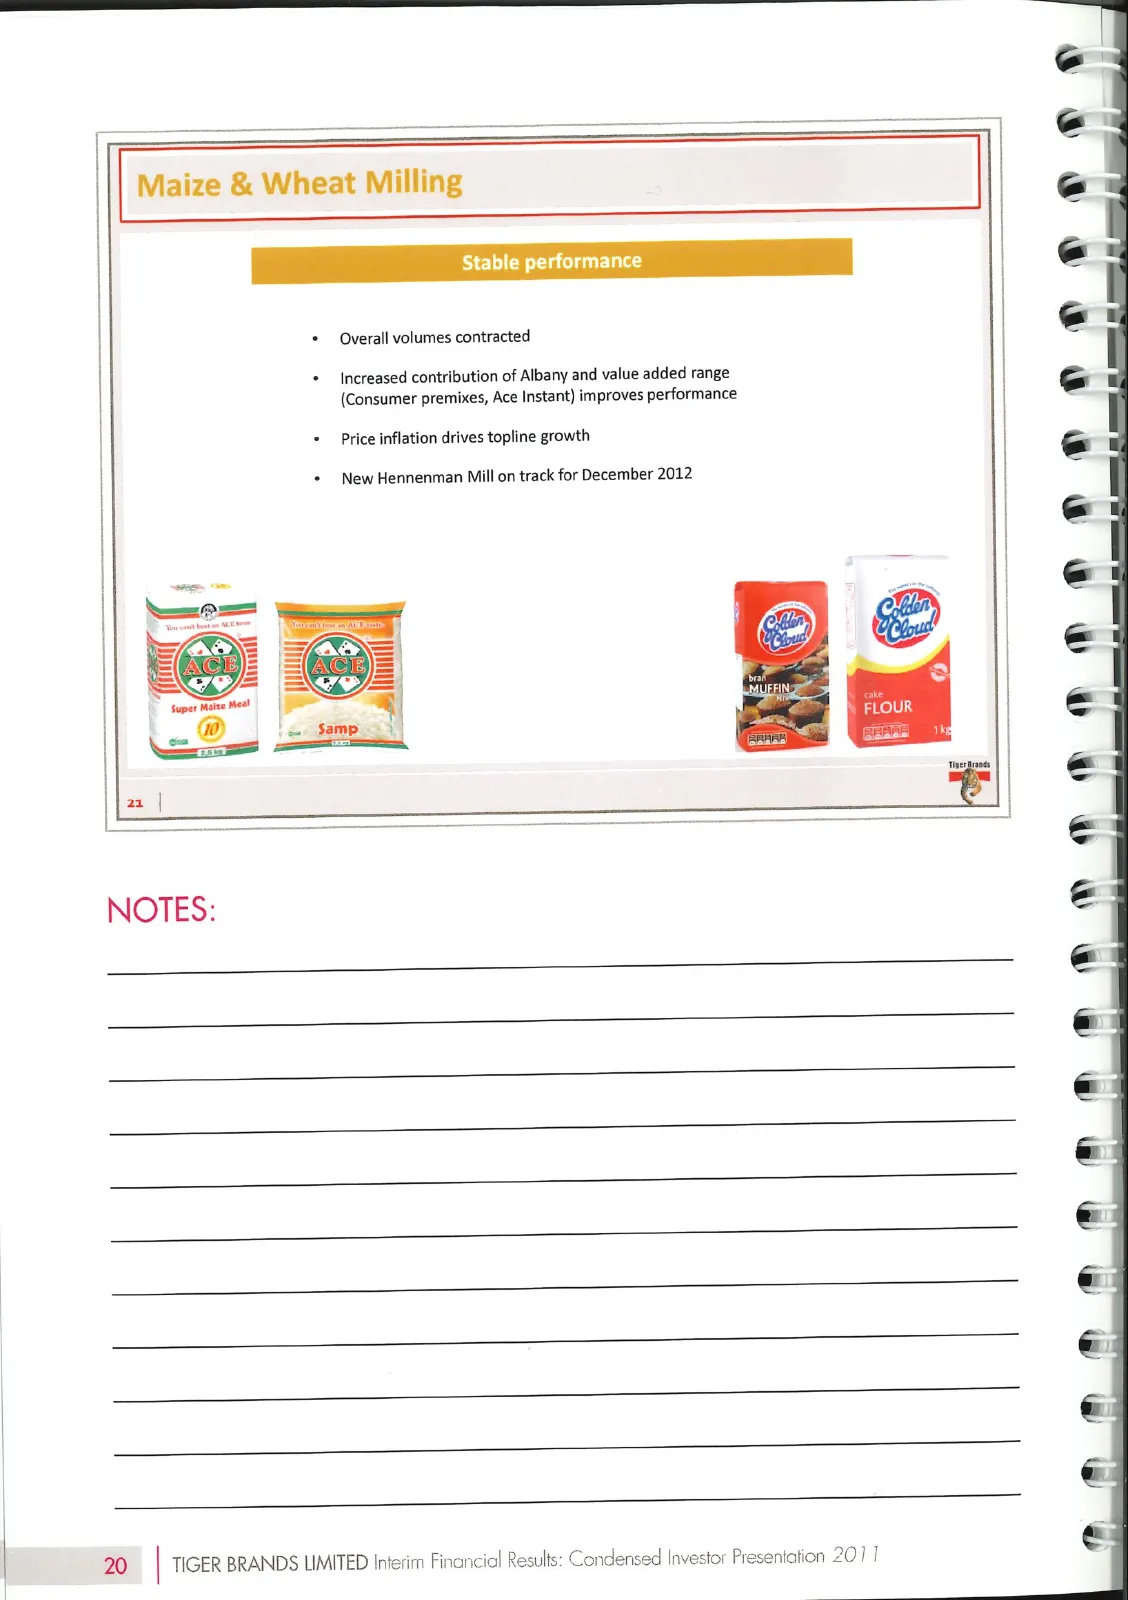
Slide 22: Maize & Wheat Milling
Maize & Wheat Milling Stable performance i qy * Overall volumes contracted + Increased contribution of Albany and value added range (Consumer premixes, Ace Instant) improves performance + Price inflation drives topline growth * New Hennenman Mill on track for December 2012 7D RHRHMAHADOHN DH OHHH HD
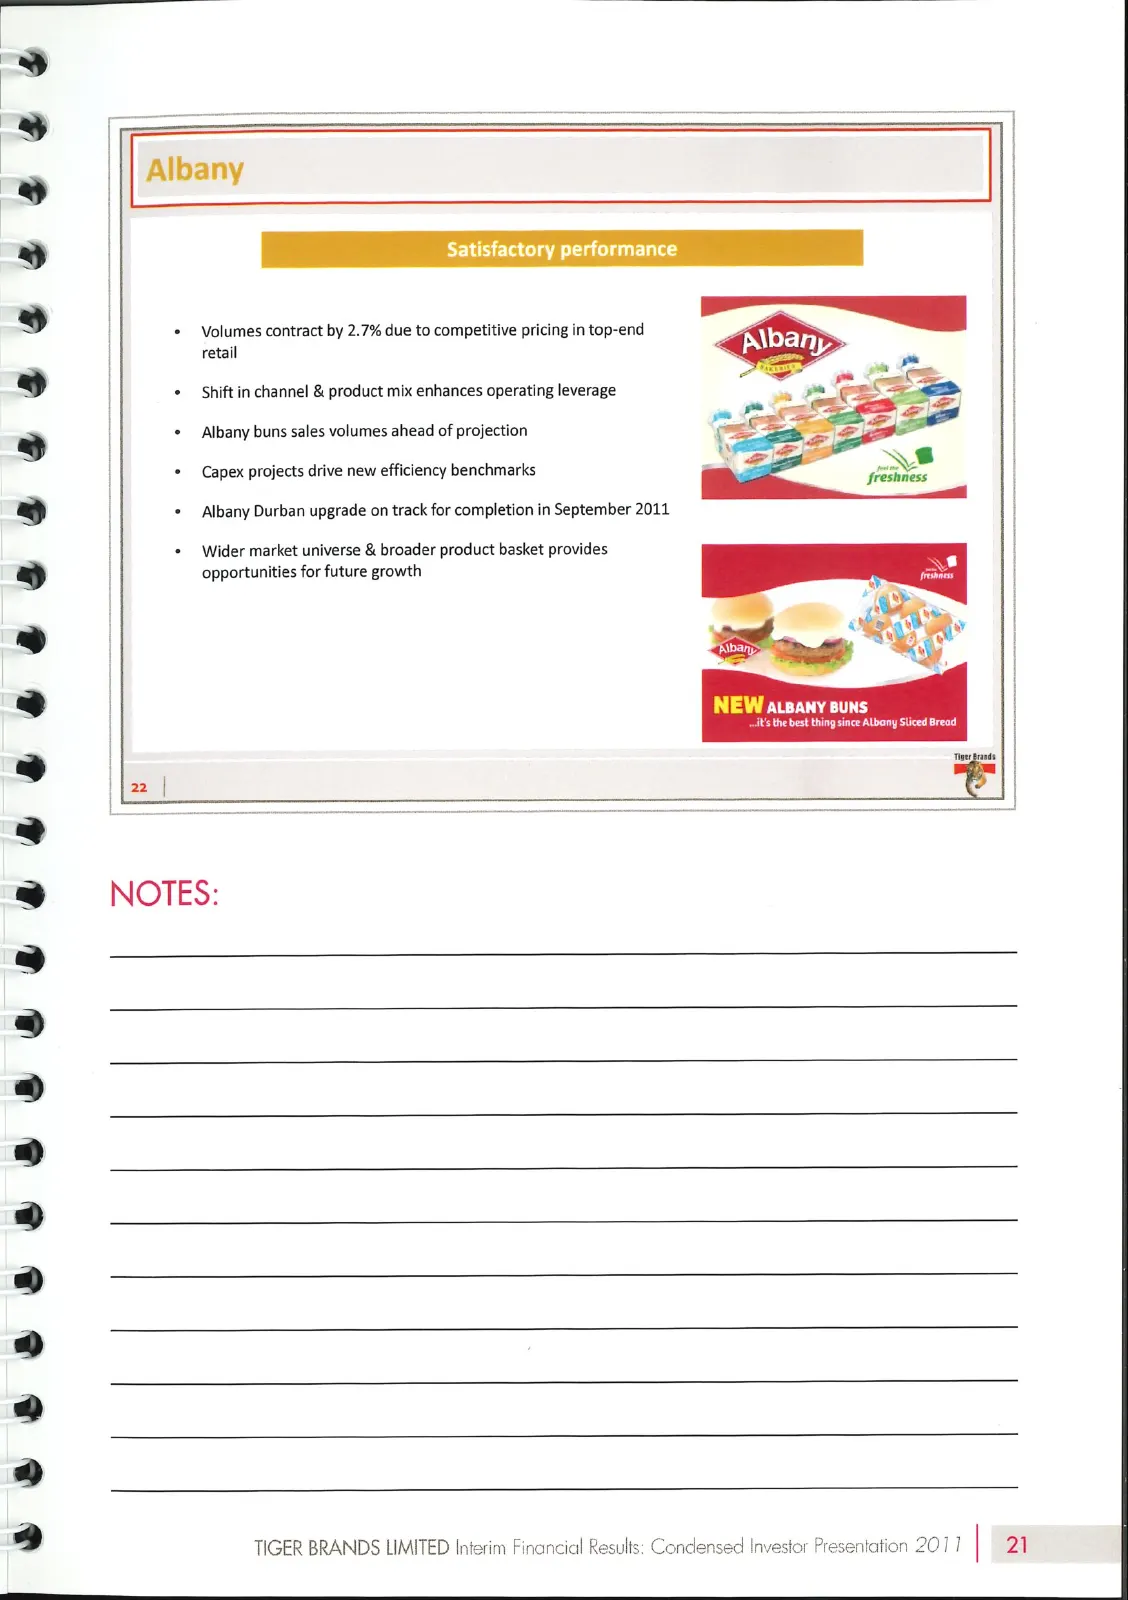
Slide 23: Albany factory performance
#®#e#eseeeveeeees8Ceeze ey 8 @ ees ugzueyusyuses ||| Albany factory performance + Volumes contract by 2.7% due to competitive pricing in top-end retail + Shift in channel & product mix enhances operating leverage + Albany buns sales volumes ahead of projection * Capex projects drive new efficiency b
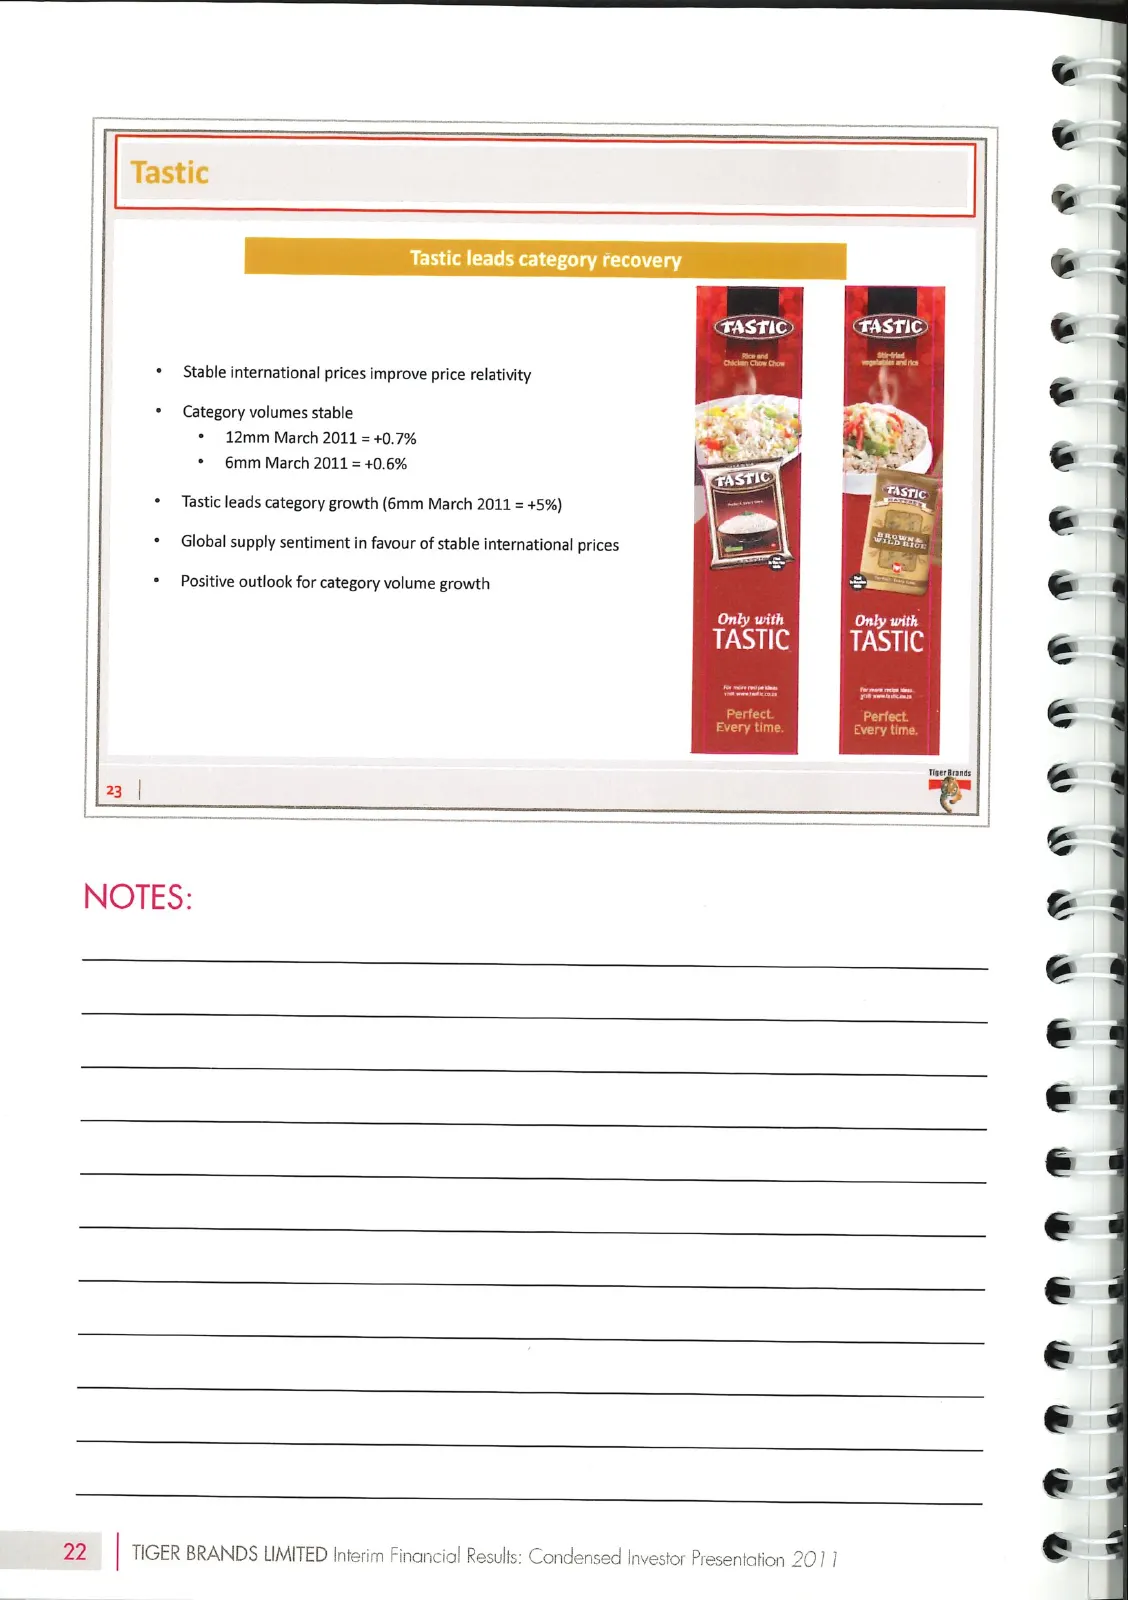
Slide 24: Rice
* Stable international prices improve price relativity * Category volumes stable | + 12mm March 2011 = +0.7% | + 6mm March 2011 = +0.6% * Tastic leads category growth (6mm March 2011 = +5%) + Global supply sentiment in favour of stable international prices * Positive outlook for category volume grow
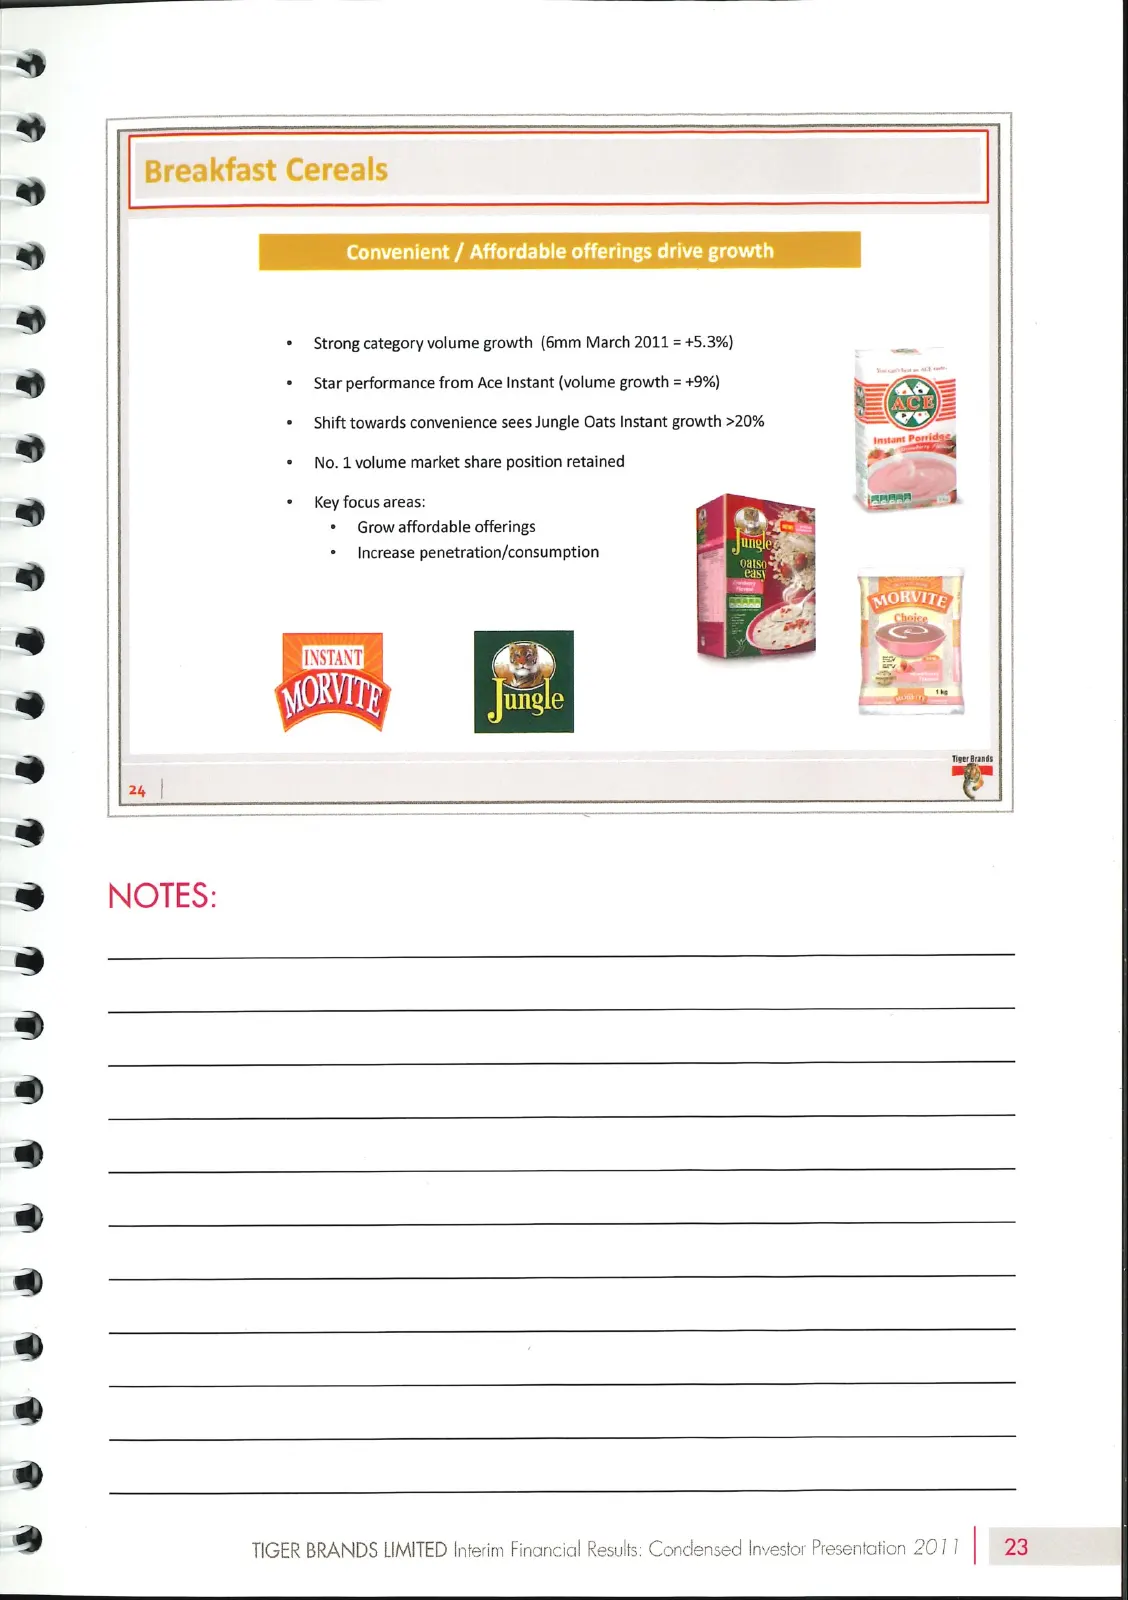
Slide 25: Breakfast Cereals
& & Breakfast Cereals Convenient / Affordable offerings drive growth | | * Strong category volume growth (6mm March 2011 = +5.3%) & 8 8 + Star performance from Ace Instant (volume growth = +9%) | + Shift towards convenience sees Jungle Oats Instant growth >20% * No. 1 volume market share position re
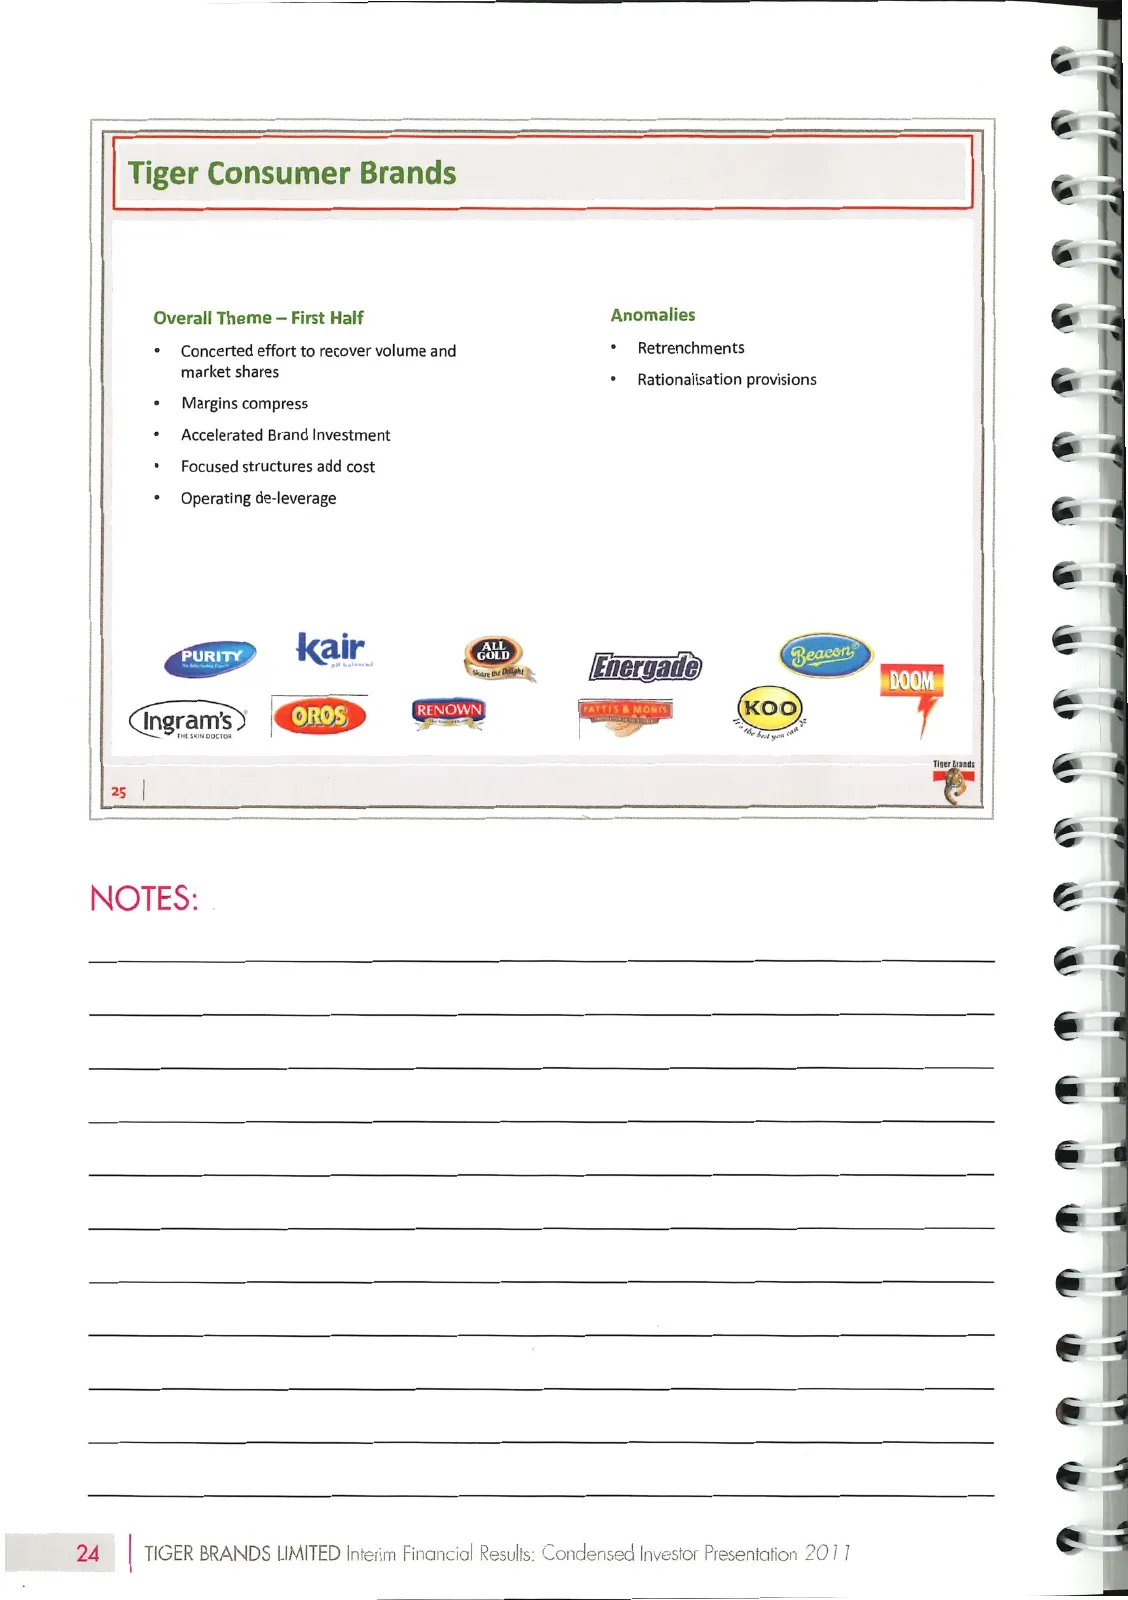
Slide 26: Tiger Consumer Brands
Tiger Consumer Brands Overall Theme — First Half * Concerted effort to recover volume and market shares + Margins compress + Accelerated Brand Investment * Focused structures add cost + Operating de-leverage ep kair Anomalies + Retrenchments + Rationalisation provisions 2. 24 TIGER BRANDS LIMITED In
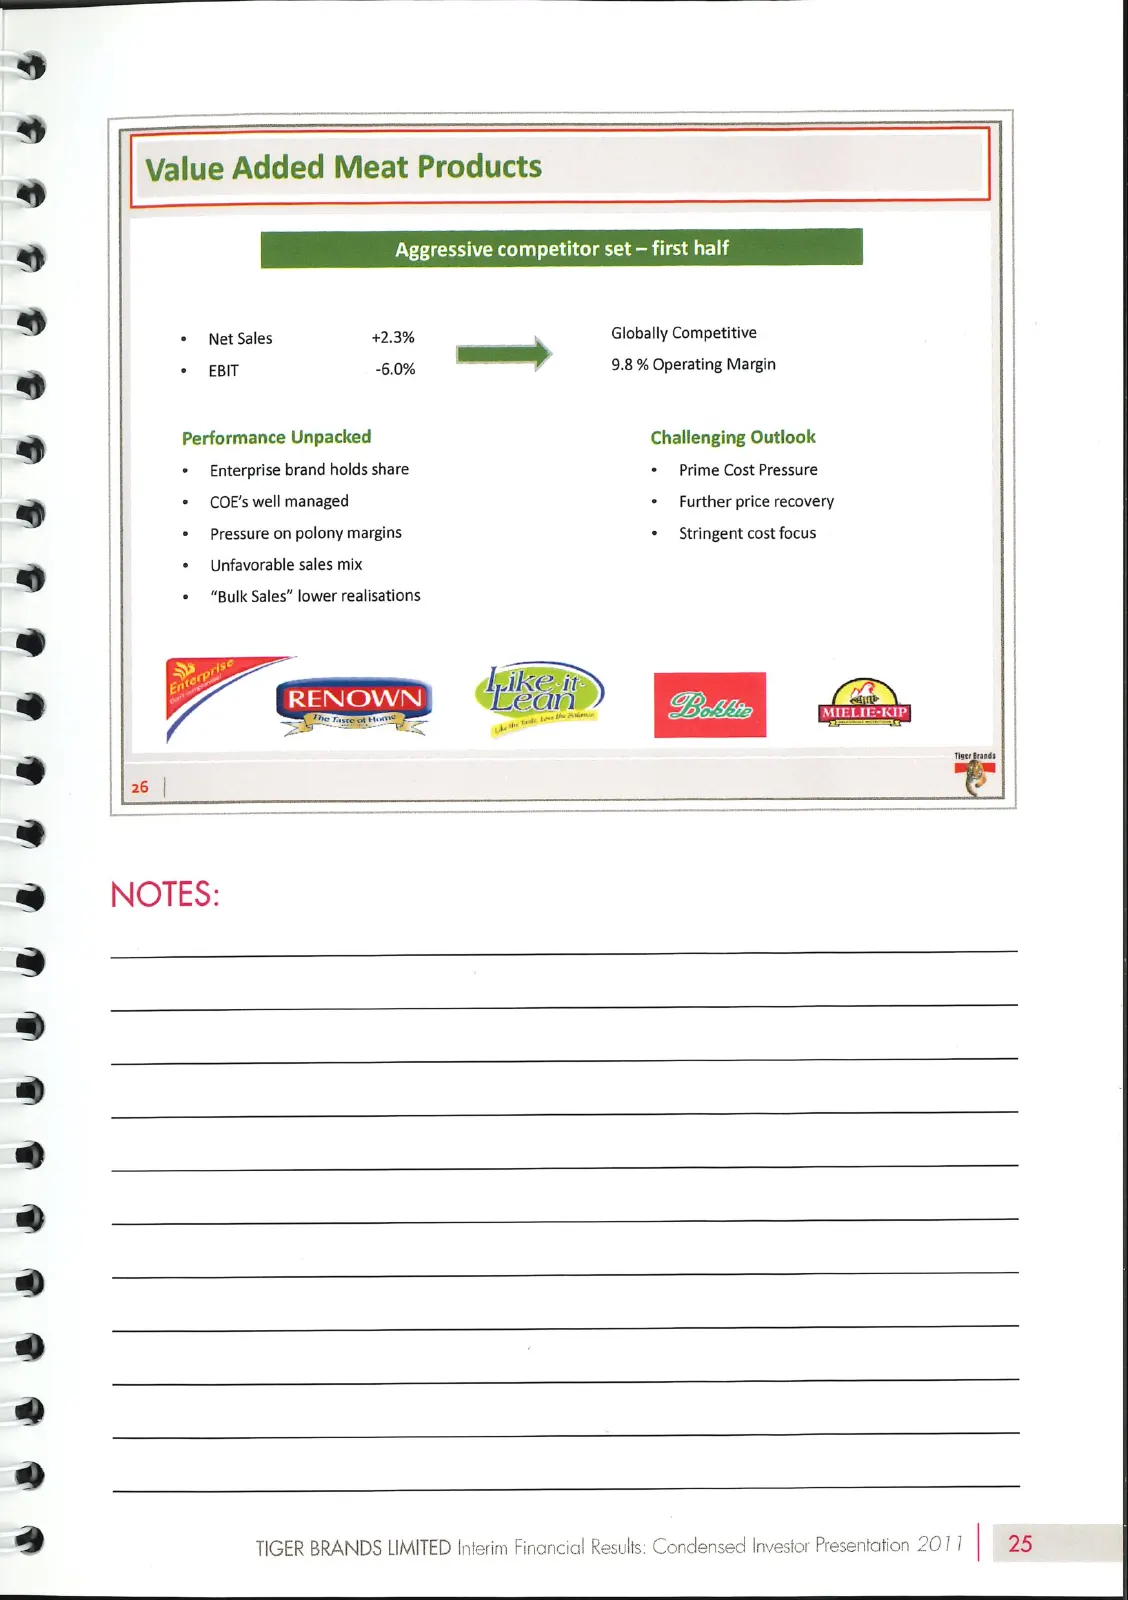
Slide 27: Value Added Meat Products
eS & | Value Added Meat Products e & 8 Globally Competitive + Net Sales 42.3% F Fame 9.8 % Operating Margin | + EBIT -6.0% | Performance Unpacked Challenging Outlook | | | | * Enterprise brand holds share * Prime Cost Pressure + COE’s well managed + Further price recovery | * Pressure on polony marg
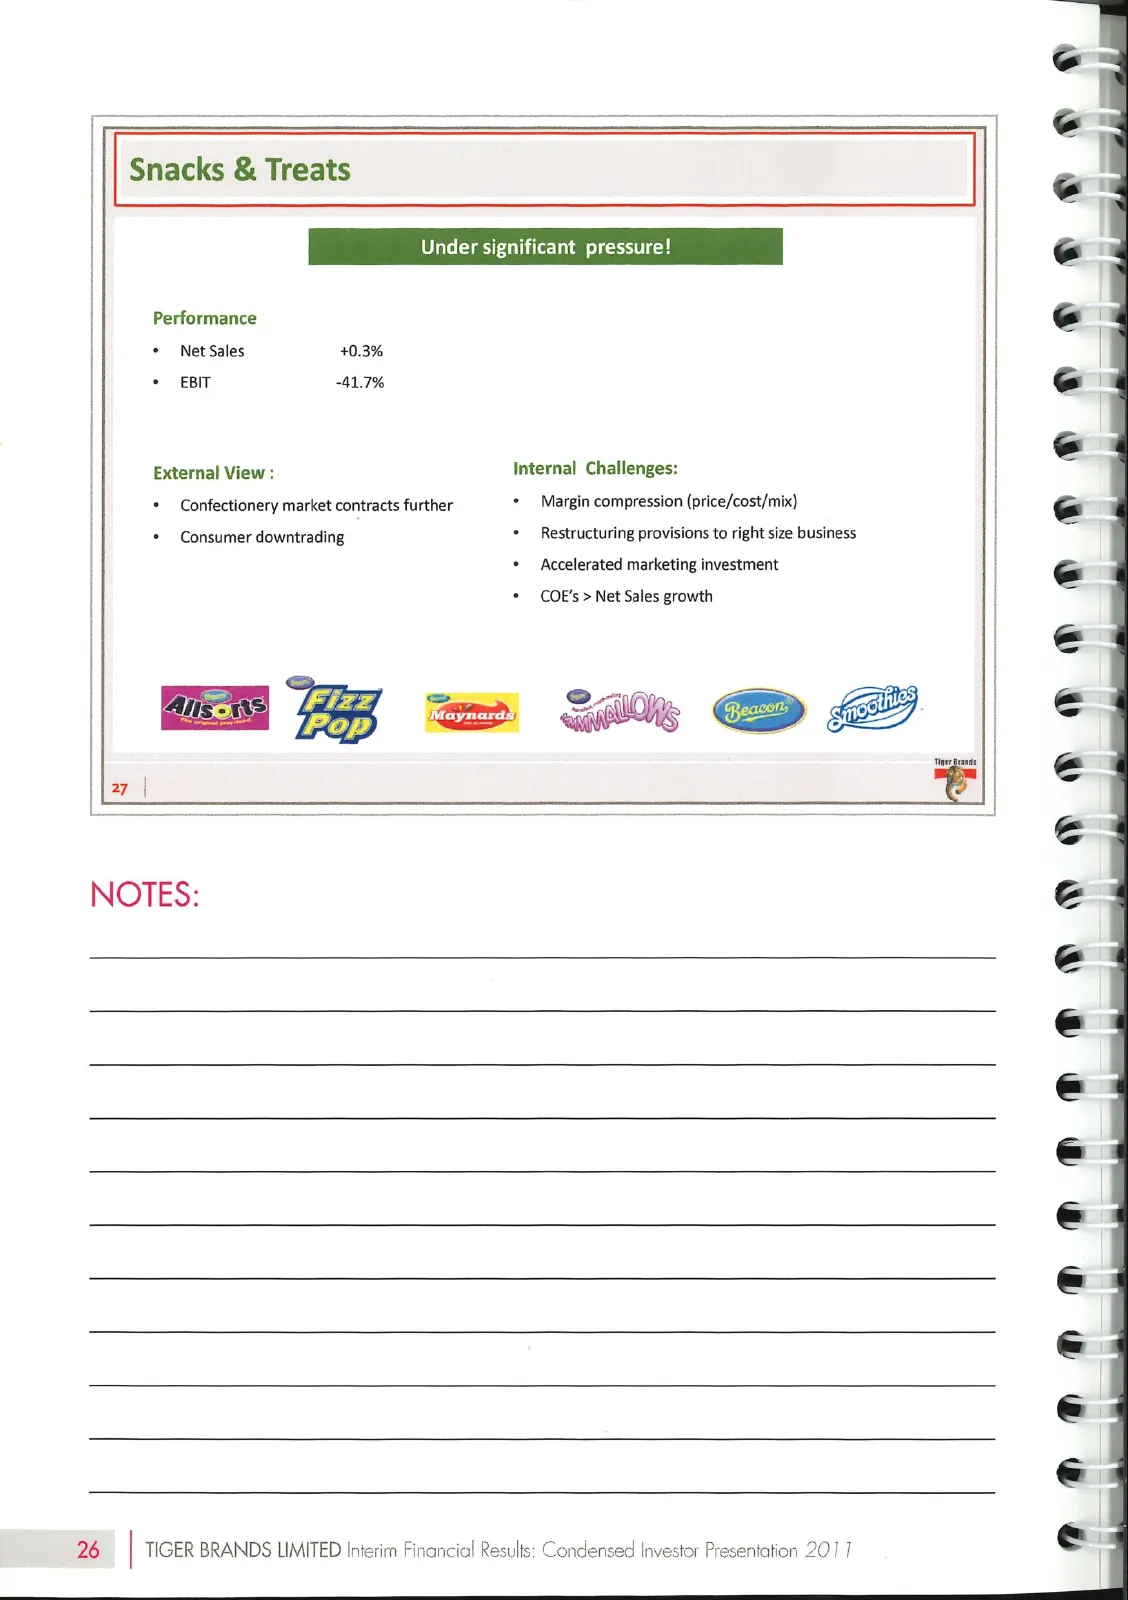
Slide 28: Snacks & Treats
Snacks & Treats Under si ant pressure Performance e . * Net Sales 40.3% * EBIT 41.7% i External View : Internal Challenges: * Confectionery market contracts further * Margin compression (price/cost/mix) * Consumer downtrading * Restructuring provisions to right size business * Accelerated marketing
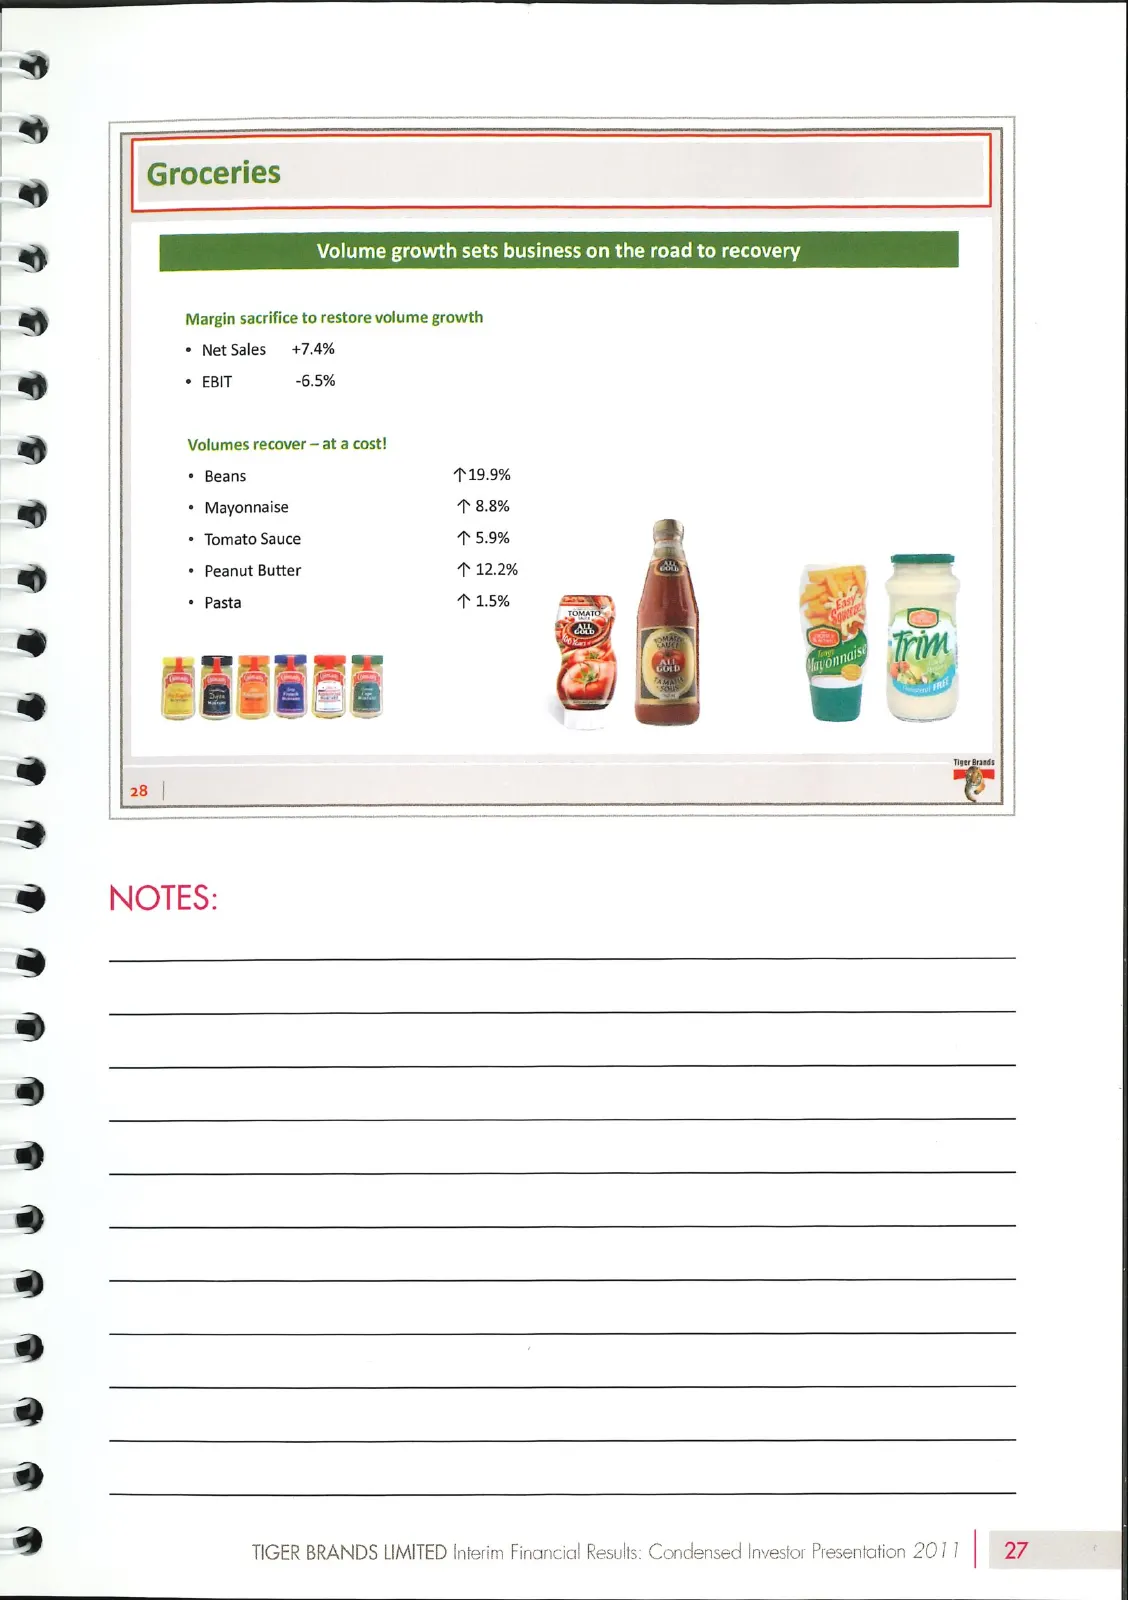
Slide 29: Groceries
& & ees *es# seuss 8 SY eseosugusuuseeguas Groceries Margin sacrifice to restore volume growth * Net Sales +7.4% * EBIT ~6.5% Volumes recover — at a cost! + Beans 719.9% + Mayonnaise 18.8% | + Tomato Sauce 45.9% + Peanut Butter 4 12.2% + Pasta 15% | GHEE | Volume growth sets business on the road to
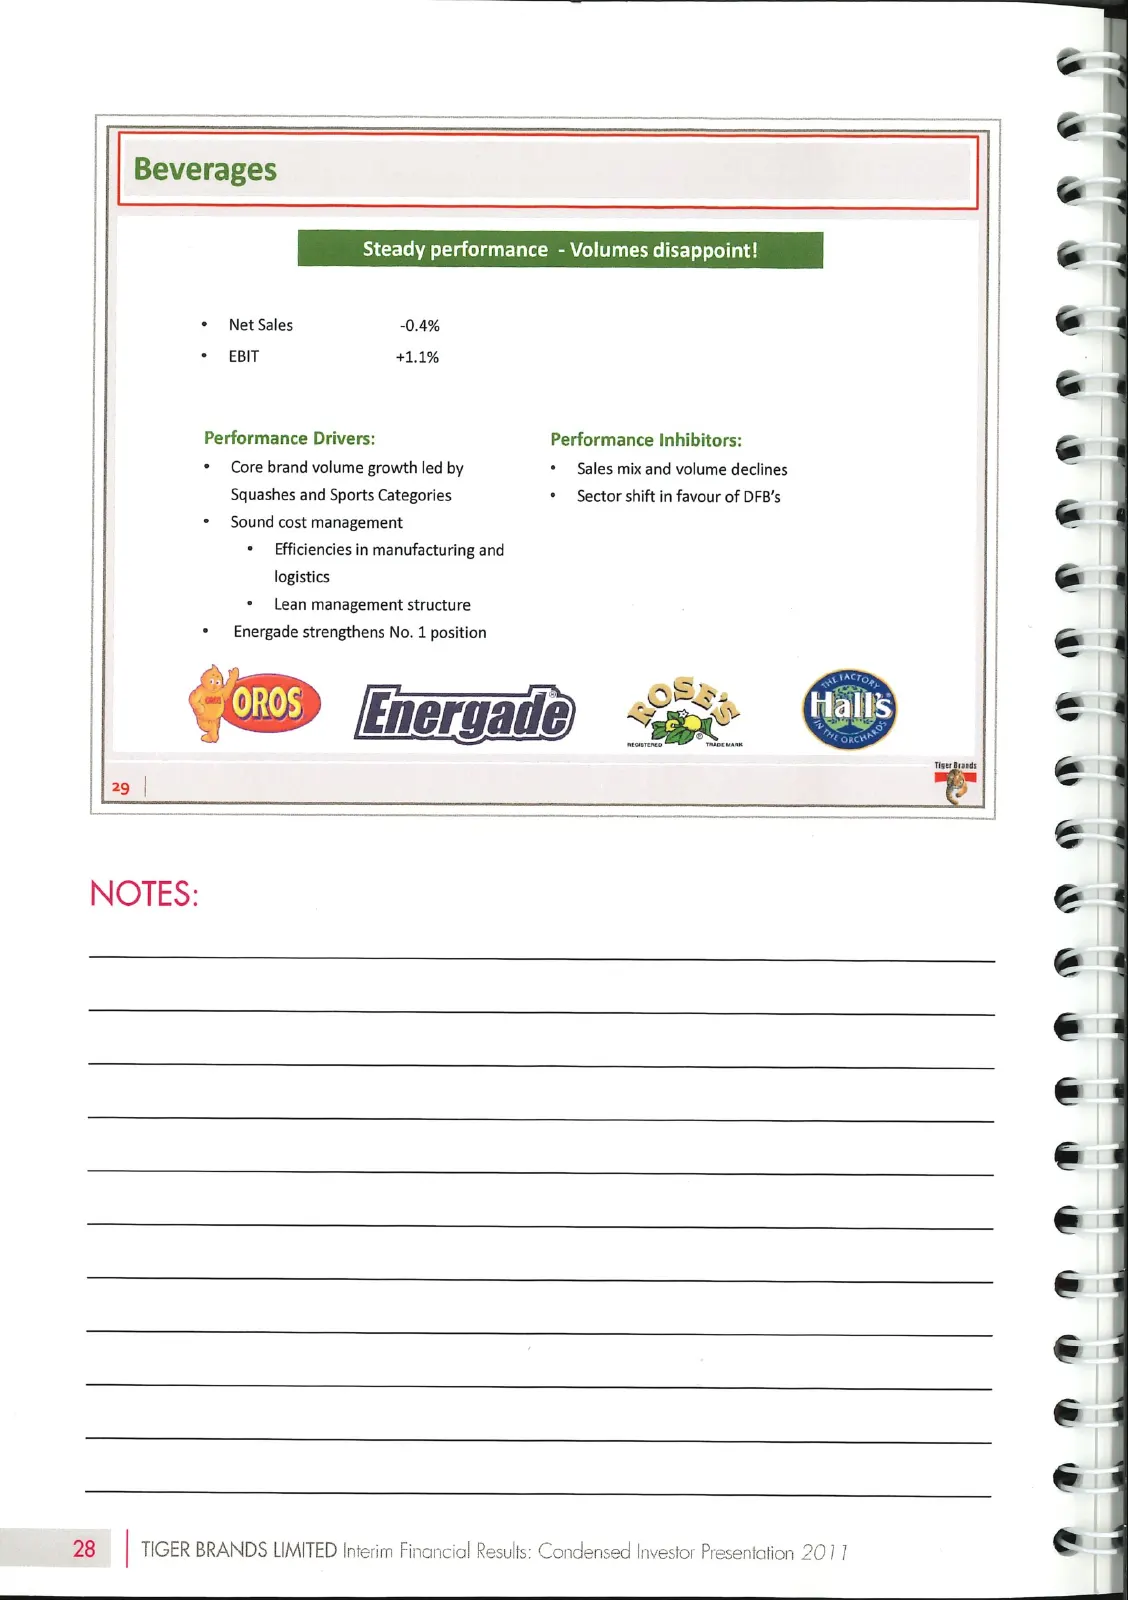
Slide 30: Beverages
® ® Beverages | | 5 | Steady performance - Volumes disappoint! | ® ® ® * Net Sales 0.4% * EBIT 41.1% | Se | | Performance Drivers: Performance Inhibitors: € * Core brand volume growth led by * Sales mix and volume declines a ‘Squashes and Sports Categories * Sector shift in favour of DFB’s ® + Sound
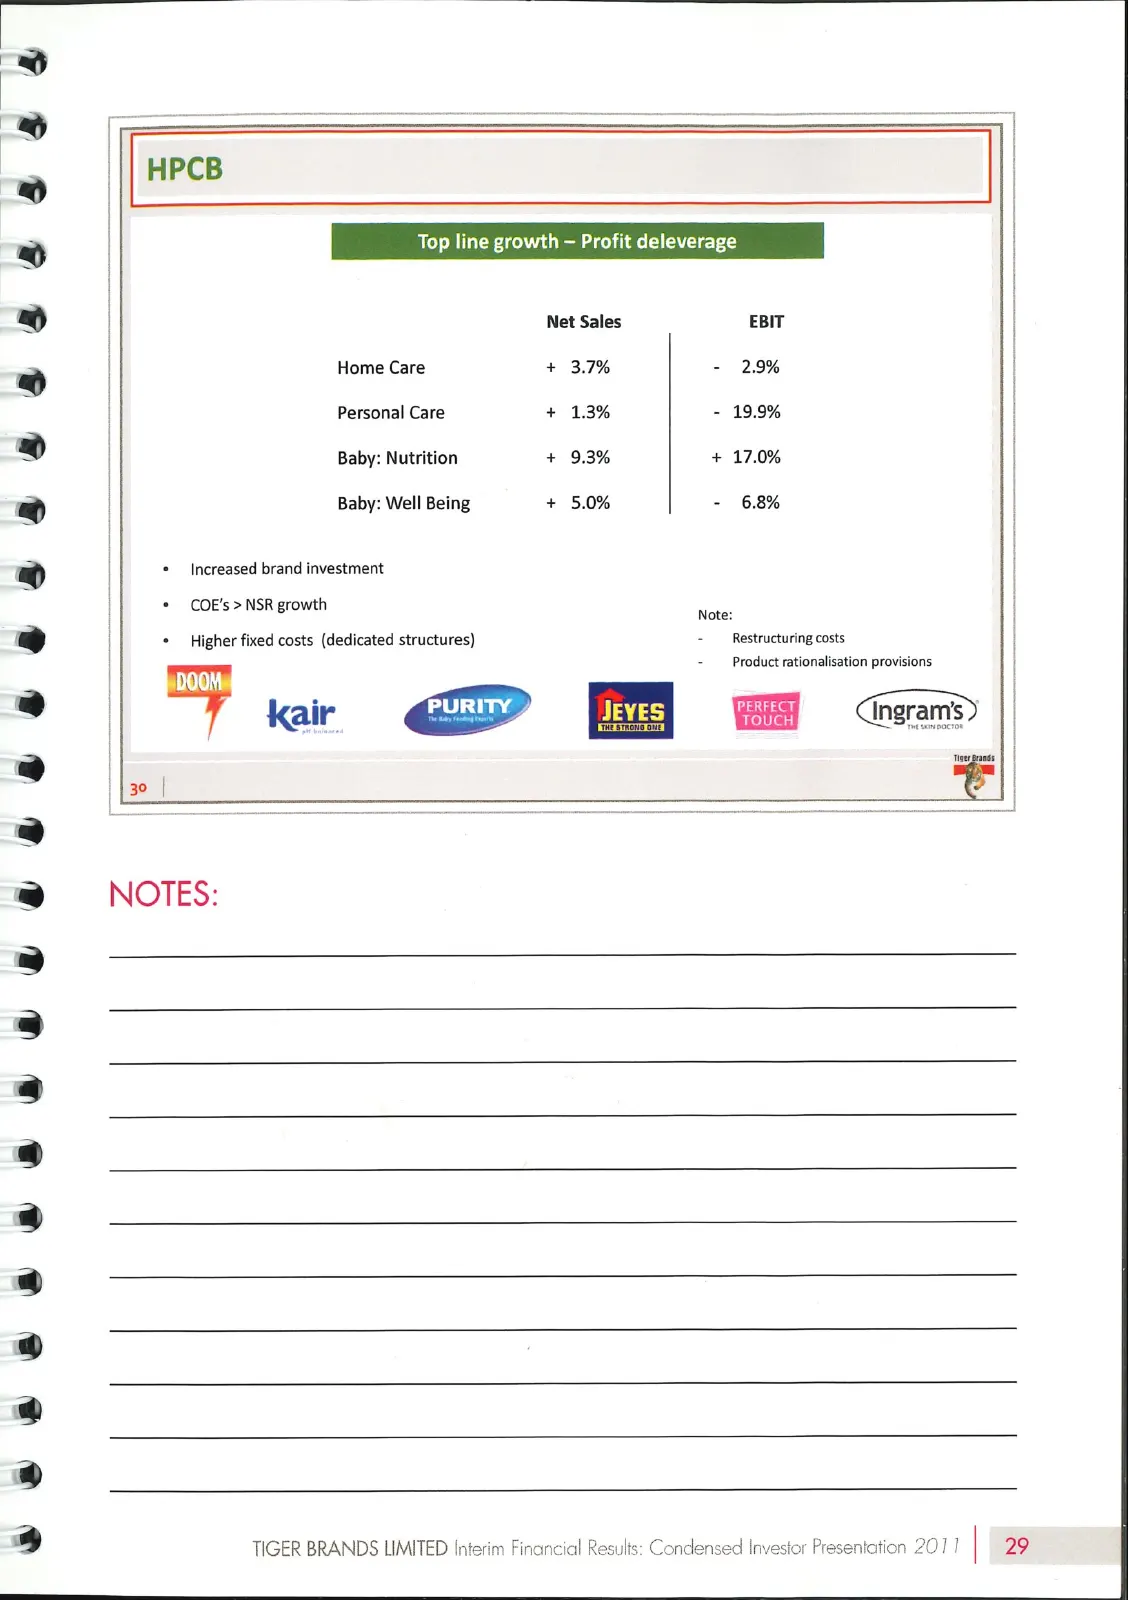
Slide 31: HPCB
. 8 | HPCB oe a | Top line growth — Profit deleverage » Net Sales EBIT @ | Home Care + 3.7% - 2.9% | Personal Care + 1.3% - 19.9% » | Baby: Nutrition + 9.3% + 17.0% @ | Baby: Well Being + 5.0% - 6.8% @ | * Increased brand investment _ | | © COE’s > NSR growth Note: | = Higher fixed costs (dedicated
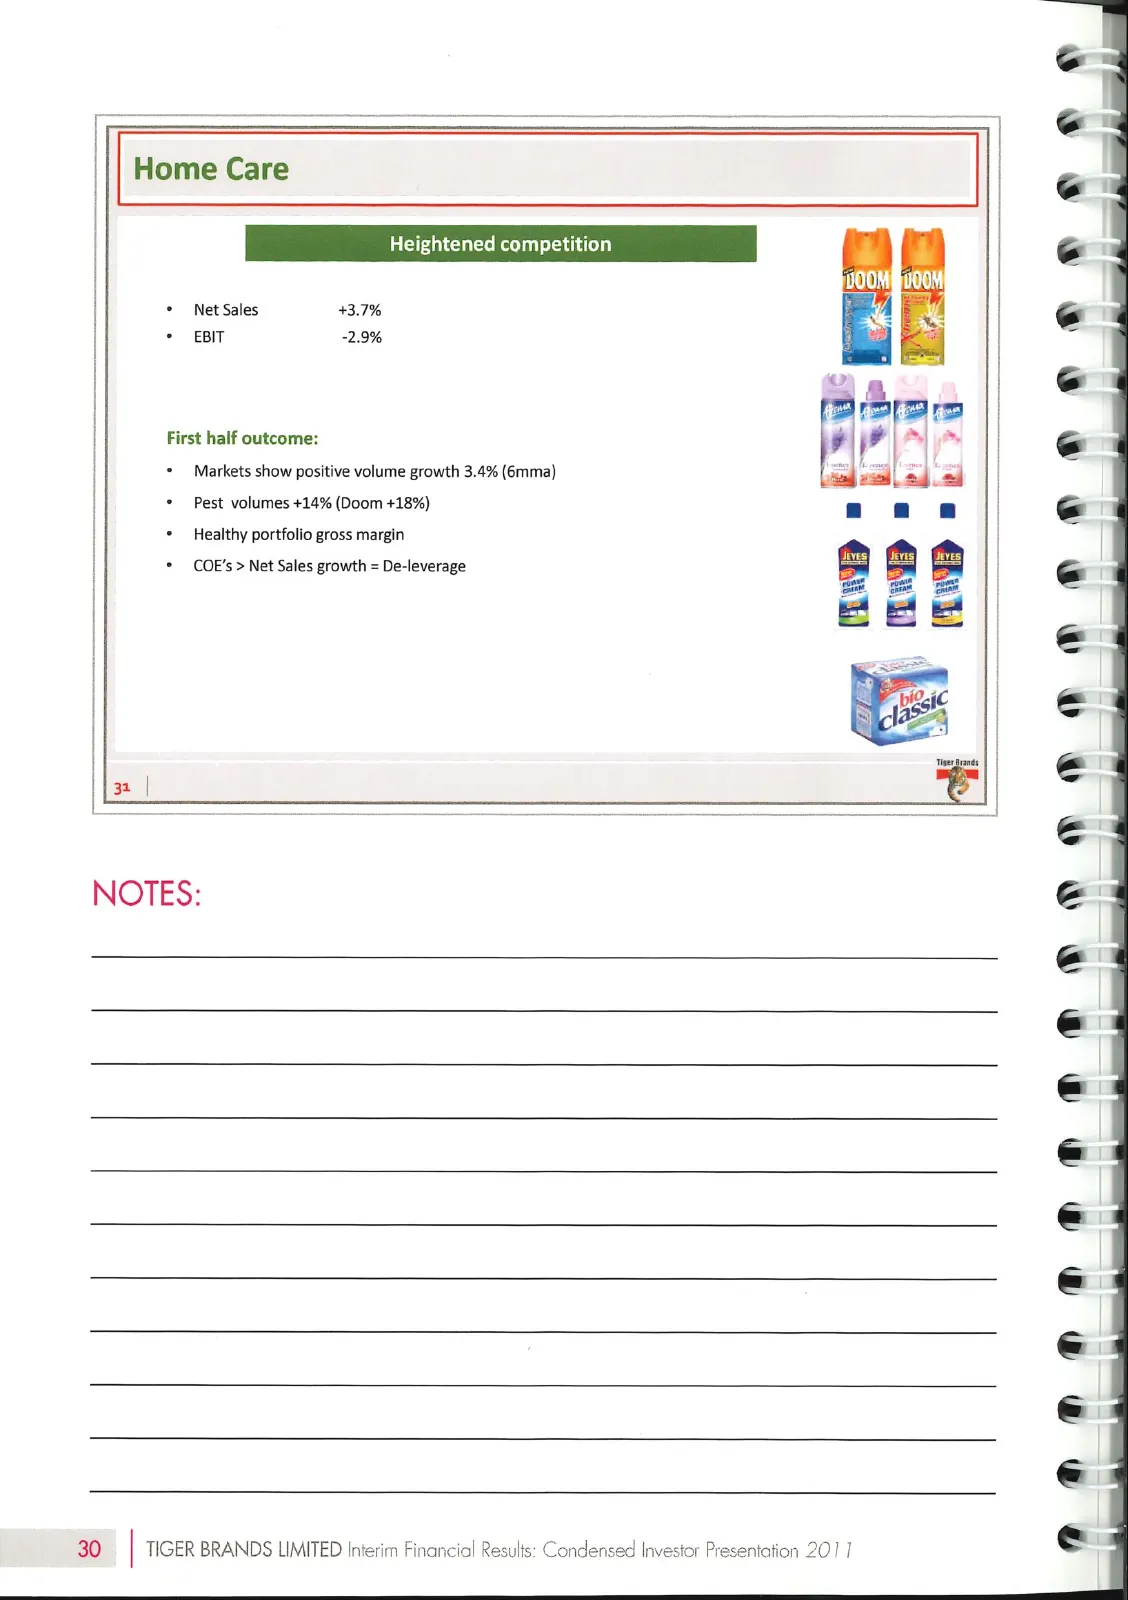
Slide 32: Home Care
—_—_—O e Home Care © Heightened competition @ Net Sales +3.7% EBIT -2.9% e First half outcome: Markets show positive volume growth 3.4% (émma) Pest volumes +14% (Doom +18%) Healthy portfolio gross margin | © COE’s > Net Sales growth = De-leverage NOTES: AannmnOPHPDPDHM®APA@AAP& AFA HAD DH HH OH 30 T

Slide 33: Personal Care
6838 ¢ #*eeseesksss esseogcegeguggegees Personal Care + Net Sales +1.3% + EBIT -19.9% Performance Inhibitors: + Sustained competitor activity + Pricing pressure suppresses top line * GM maintained + COE’ s> Net Sales growth Product rationalisation provision Sluggish top line PROTEIN FEED cone kair C
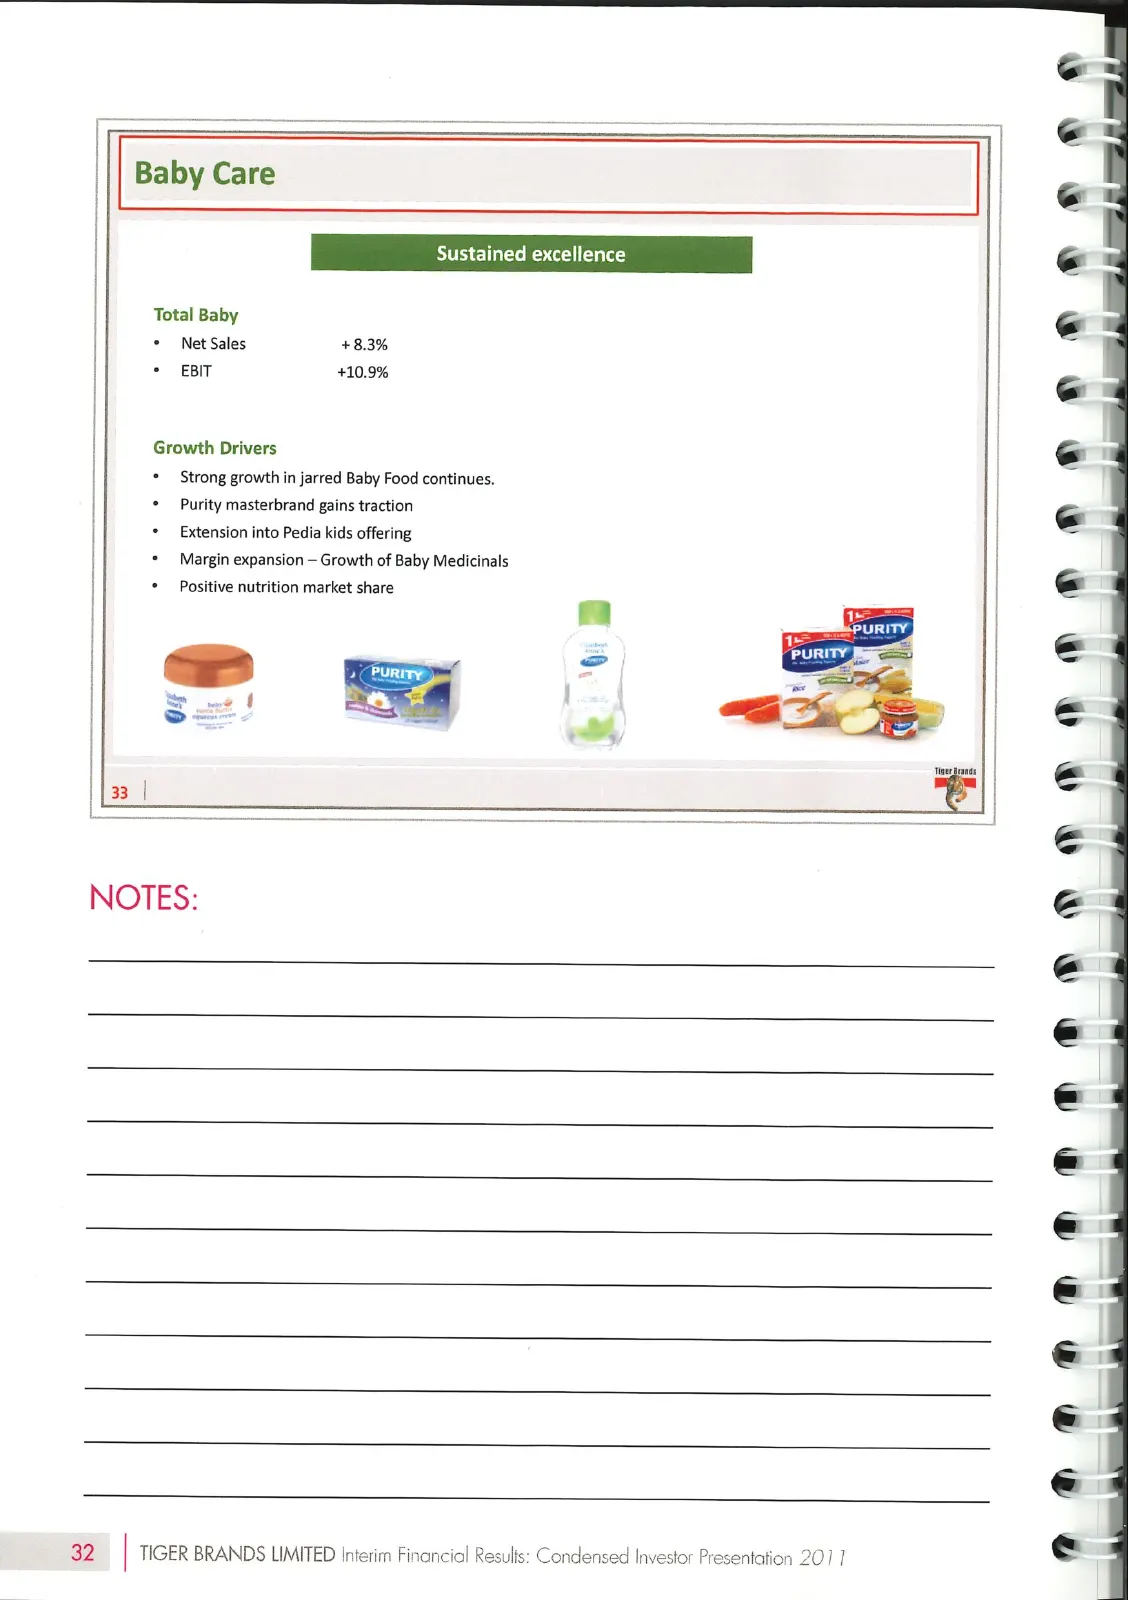
Slide 34: Baby Care
®) | | | | | | | | | | | | | =i ® Baby Care Sustaii excellence Total Baby + Net Sales +8.3% + EBIT +10.9% Growth Drivers * Strong growth in jarred Baby Food continues. * Purity masterbrand gains traction * Extension into Pedia kids offering * Margin expansion — Growth of Baby Medicinals * Positive n
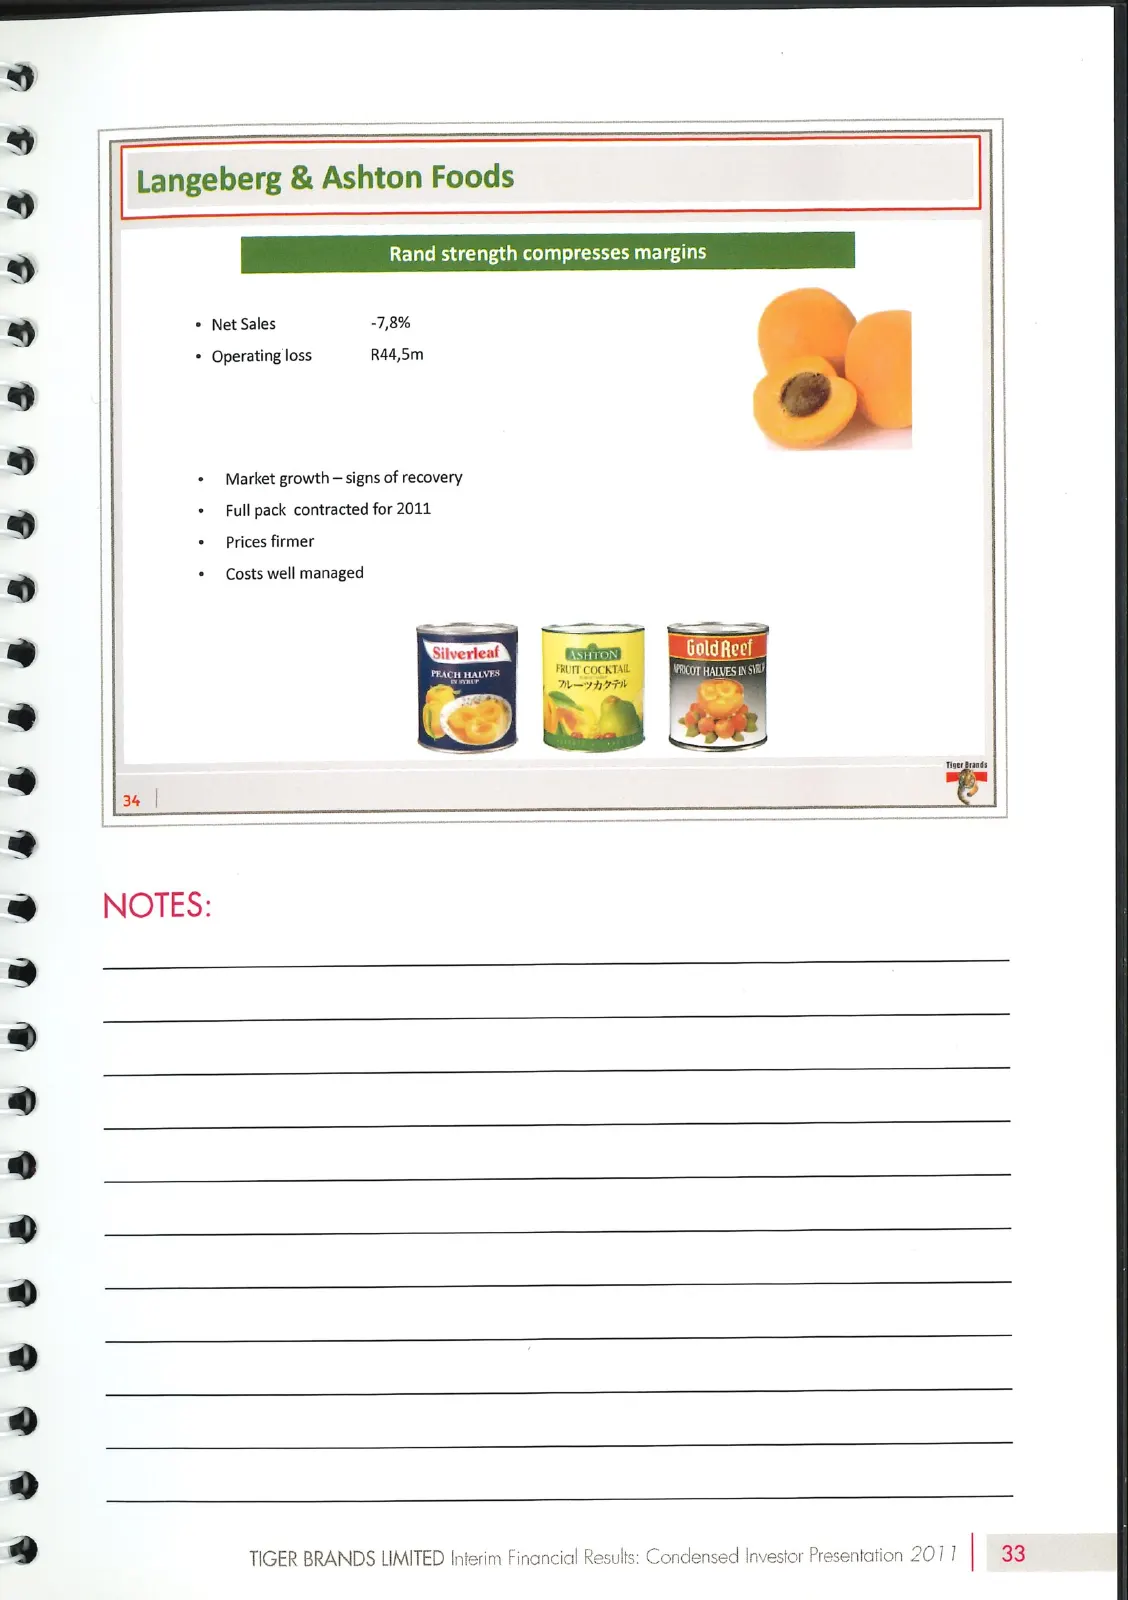
Slide 35: Langeberg & Ashton Foods
9 @8ses8s 8 8 Seeu-e ese bes eeeeesss Langeberg & Ashton Foods * Net Sales -7,8% + Operating loss R44,5m Market growth — signs of recovery Full pack contracted for 2011 Prices firmer + Costs well managed Rand strength compresses margins NOTES: TIGER BRANDS LIMITED Interim Financial Rs Condensed tati
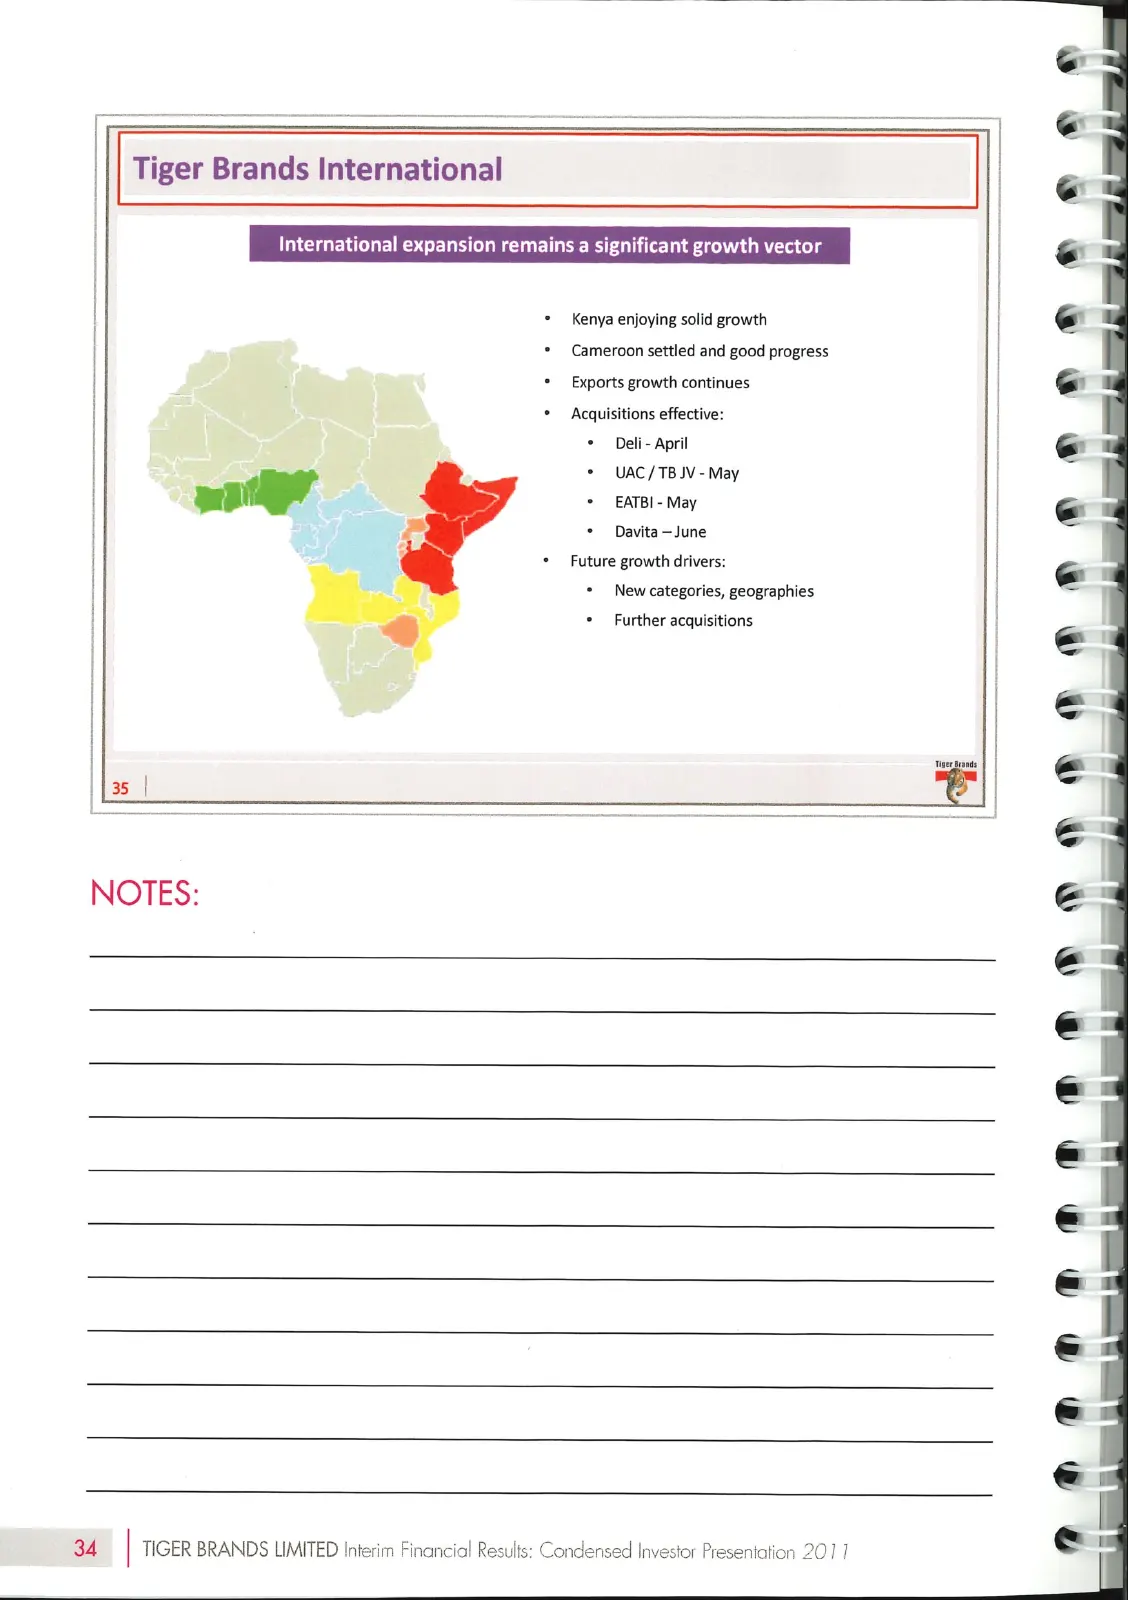
Slide 36: Tiger Brands International
Tiger Brands International International expansion remains a signi nt growth vecto: + Kenya enjoying solid growth © © © * Cameroon settled and good progress * Exports growth continues * Acquisitions effective: + Deli- April + UAC/TBJV-May + EATBI-May + Davita—June Future growth drivers: + New catego
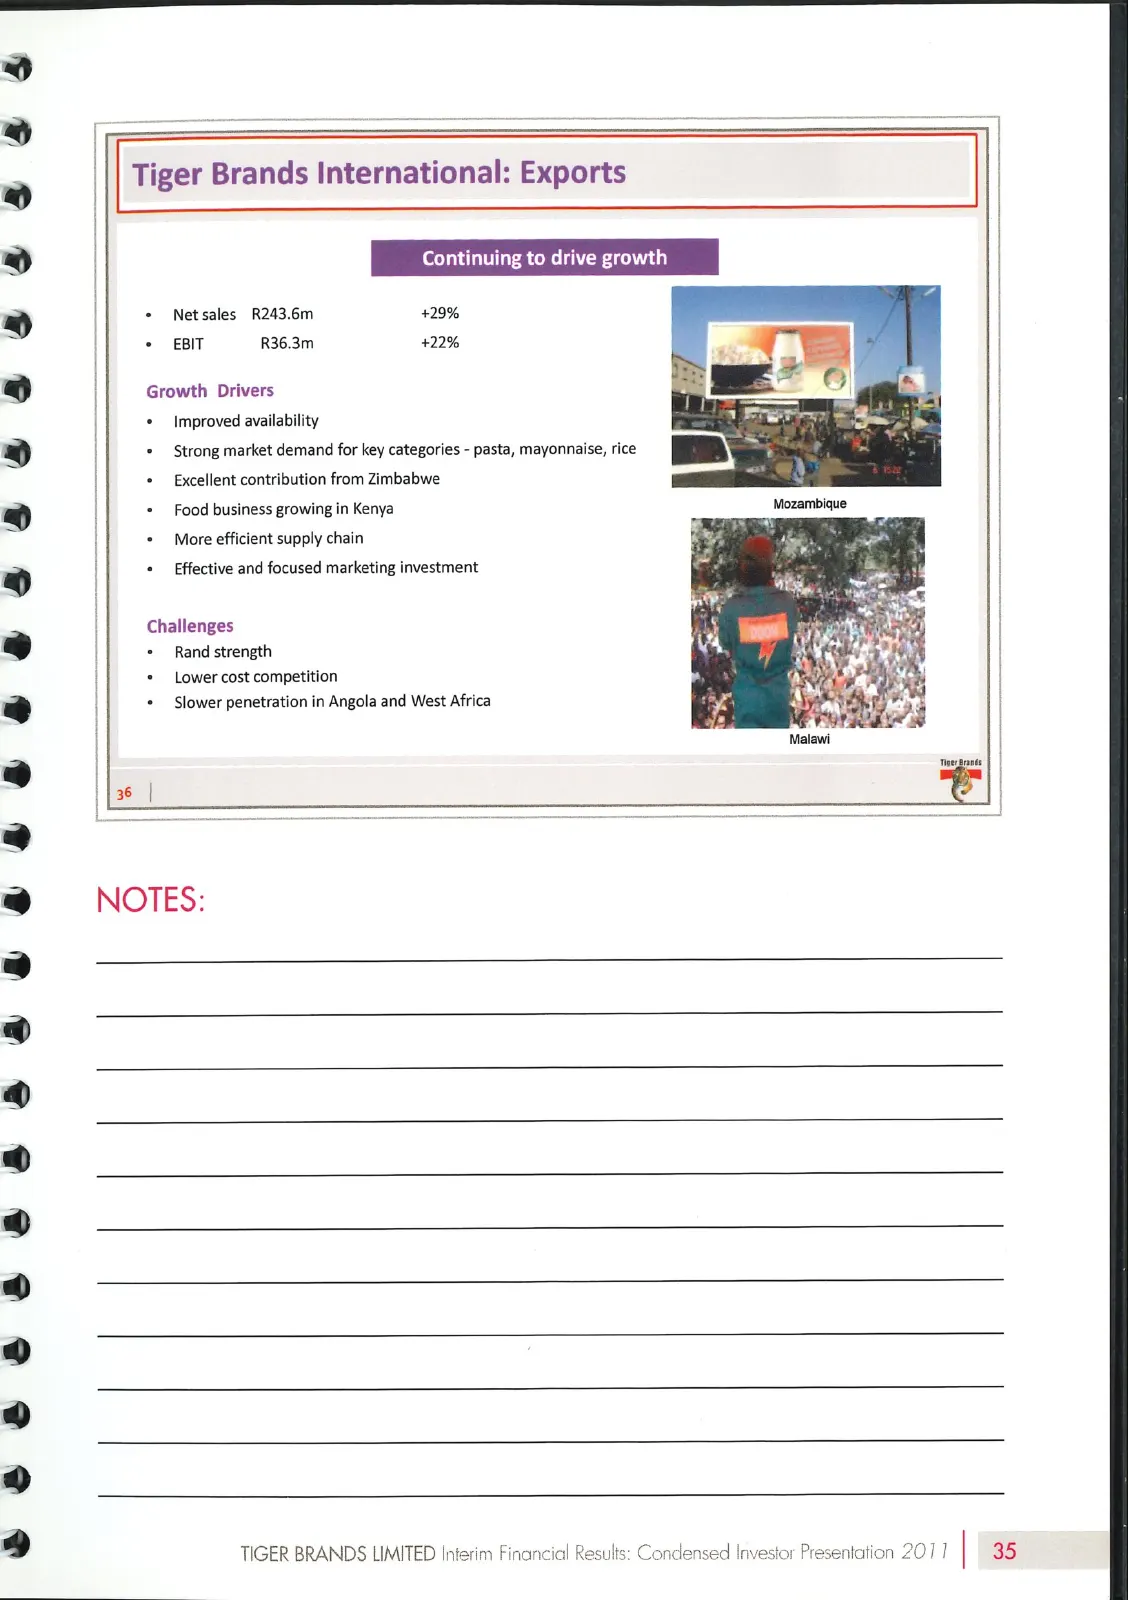
Slide 37: Tiger Brands International: Exports
es 89s eo 8s ##s eees & 6 @ a 8 eeess Tiger Brands International: Exports | Continuing to drive gr + Netsales R243.6m +29% + EBIT R36.3m +22% Growth Drivers + Improved availability | * Strong market demand for key categories - pasta, mayonnaise, rice || + Excellent contribution from Zimbabwe | = Foo
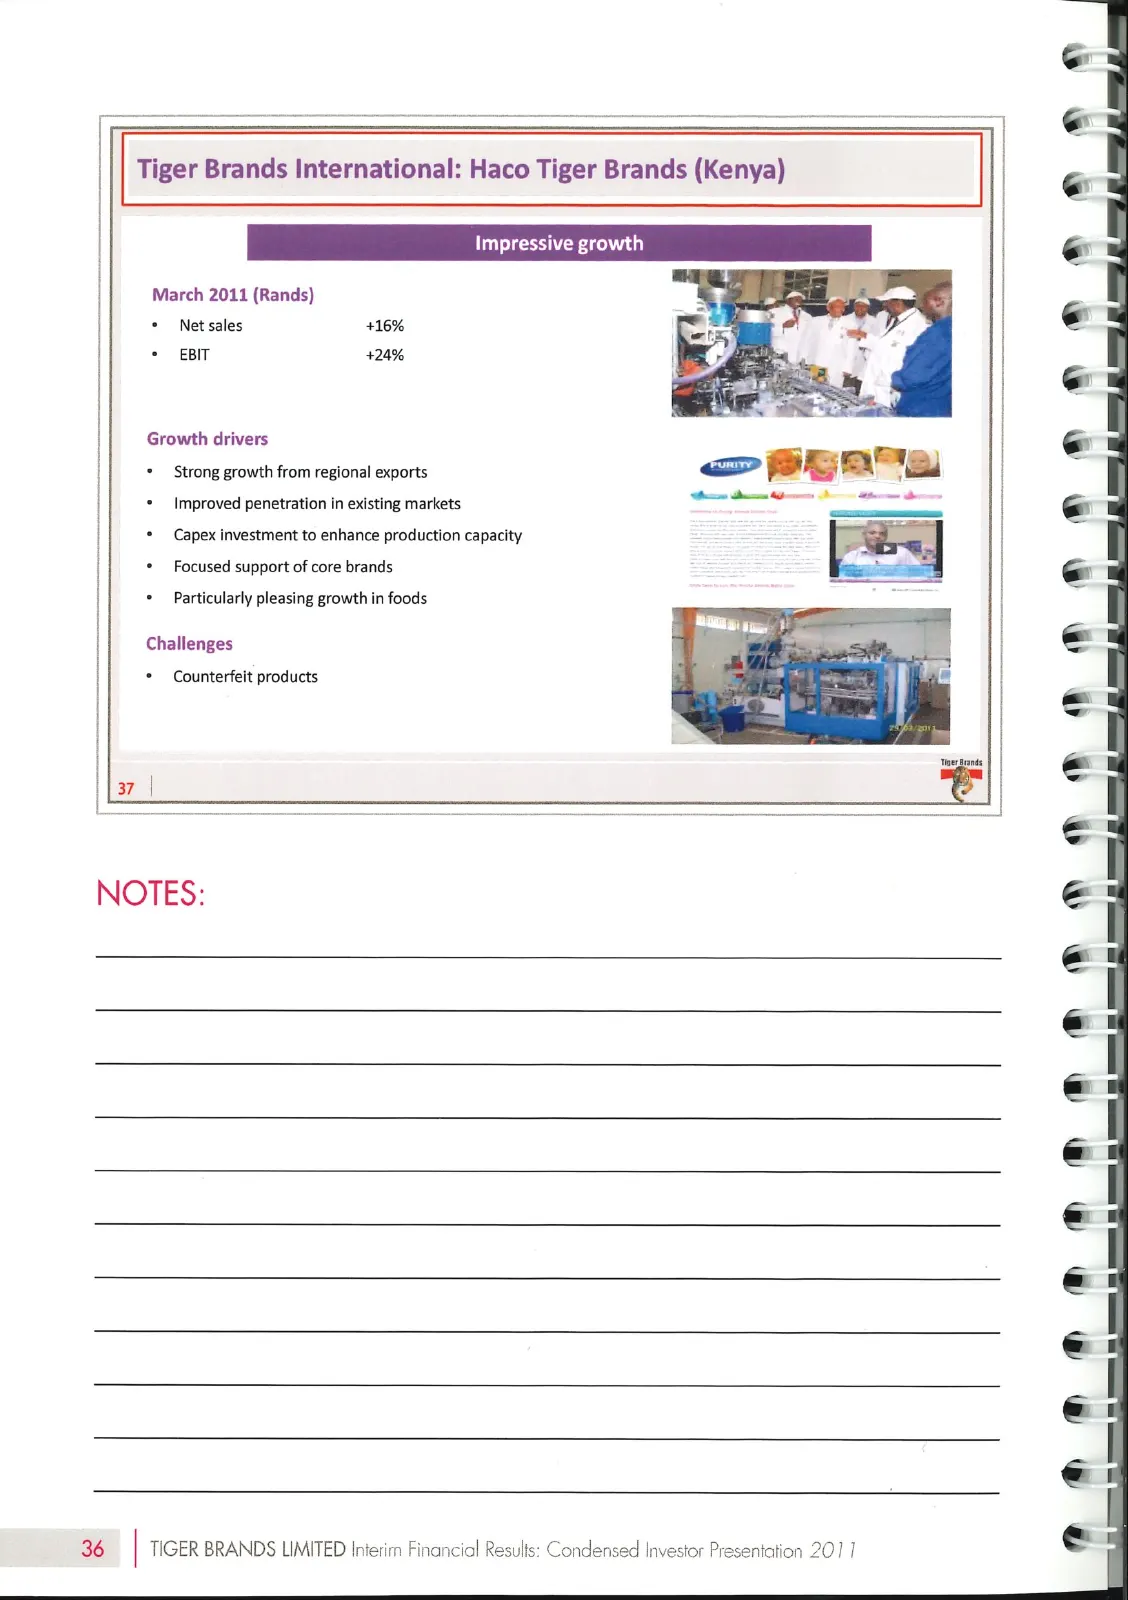
Slide 38: Tiger Brands International: Haco Tiger Brands (Kenya)
® ® Tiger Brands International: Haco Tiger Brands (Kenya) FH : ® © March 2011 (Rands) + Net sales +16% + BIT 424% a® Growth drivers ® + Strong growth from regional exports + Improved penetration in existing markets * Capex investment to enhance production capacity * Focused support of core brands *
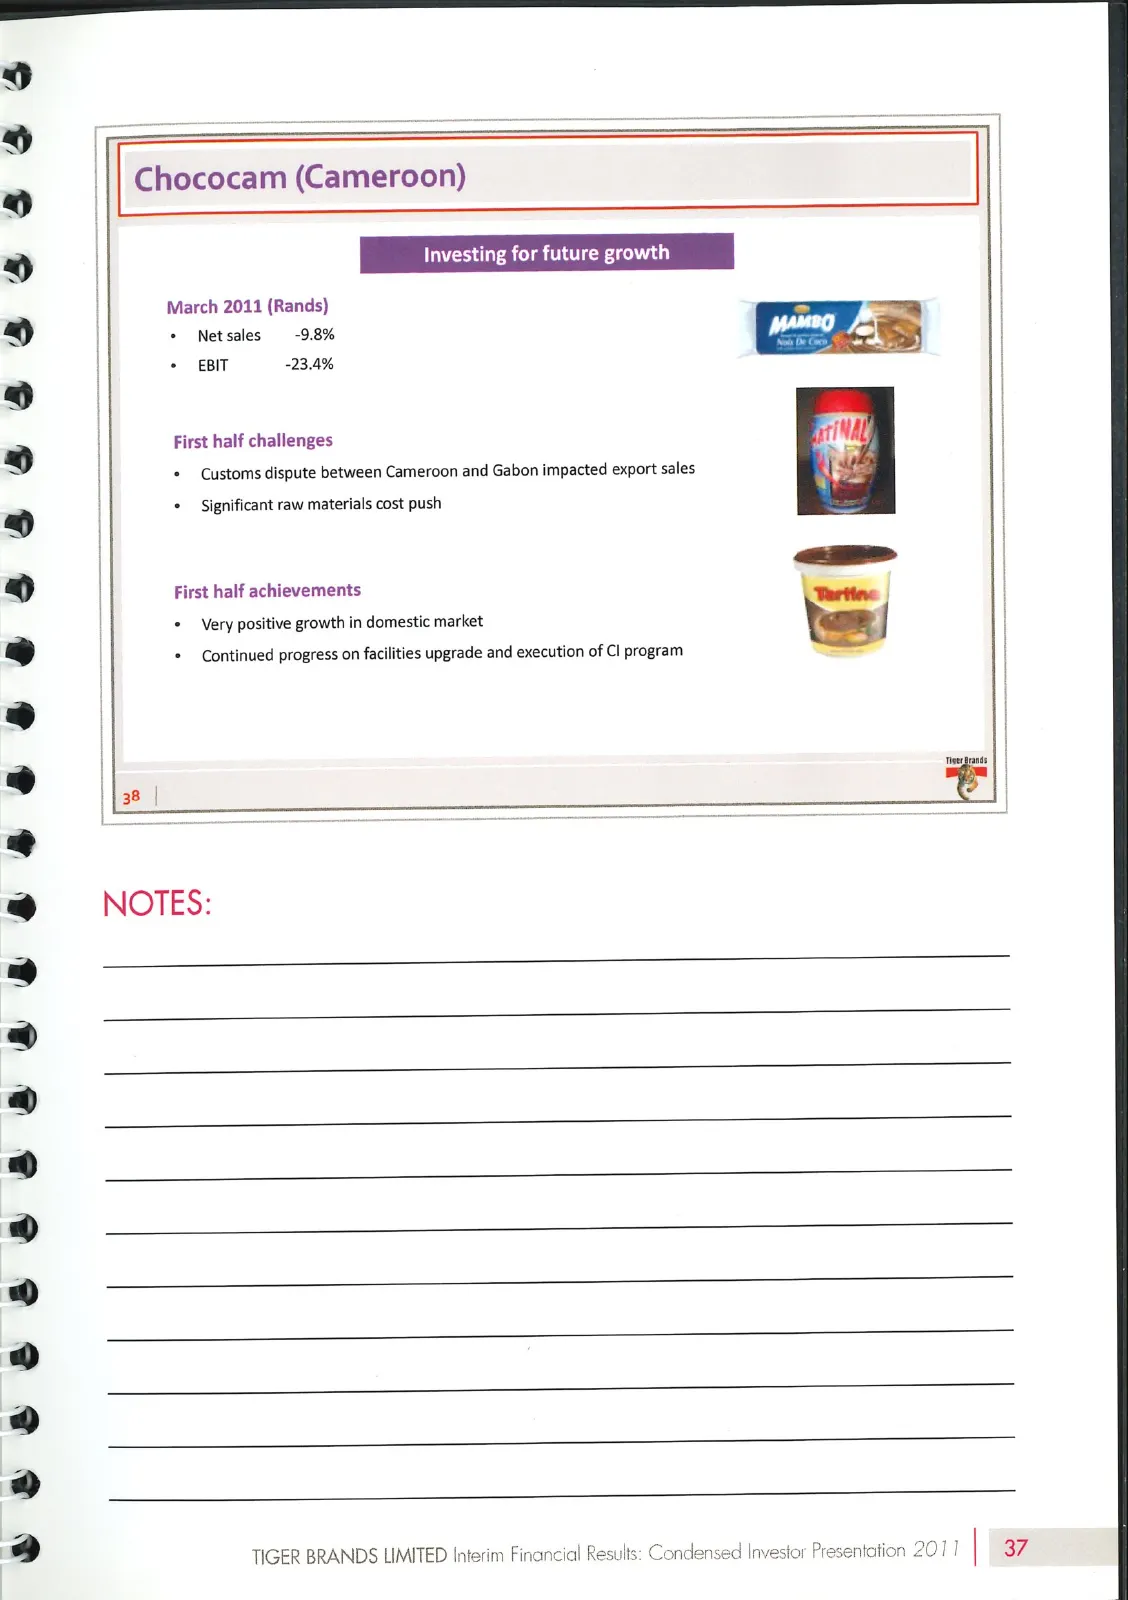
Slide 39: Chococam (Cameroon)
S$eeeseesees 3S Bees ee bs es ees es 8 Chococam (Cameroon) Investing for future growt! March 2011 (Rands) + Net sales -9.8% + EBIT -23.4% | First half challenges + Customs dispute between Cameroon and Gabon impacted export sales + Significant raw materials cost push First half achievements | | + Ver
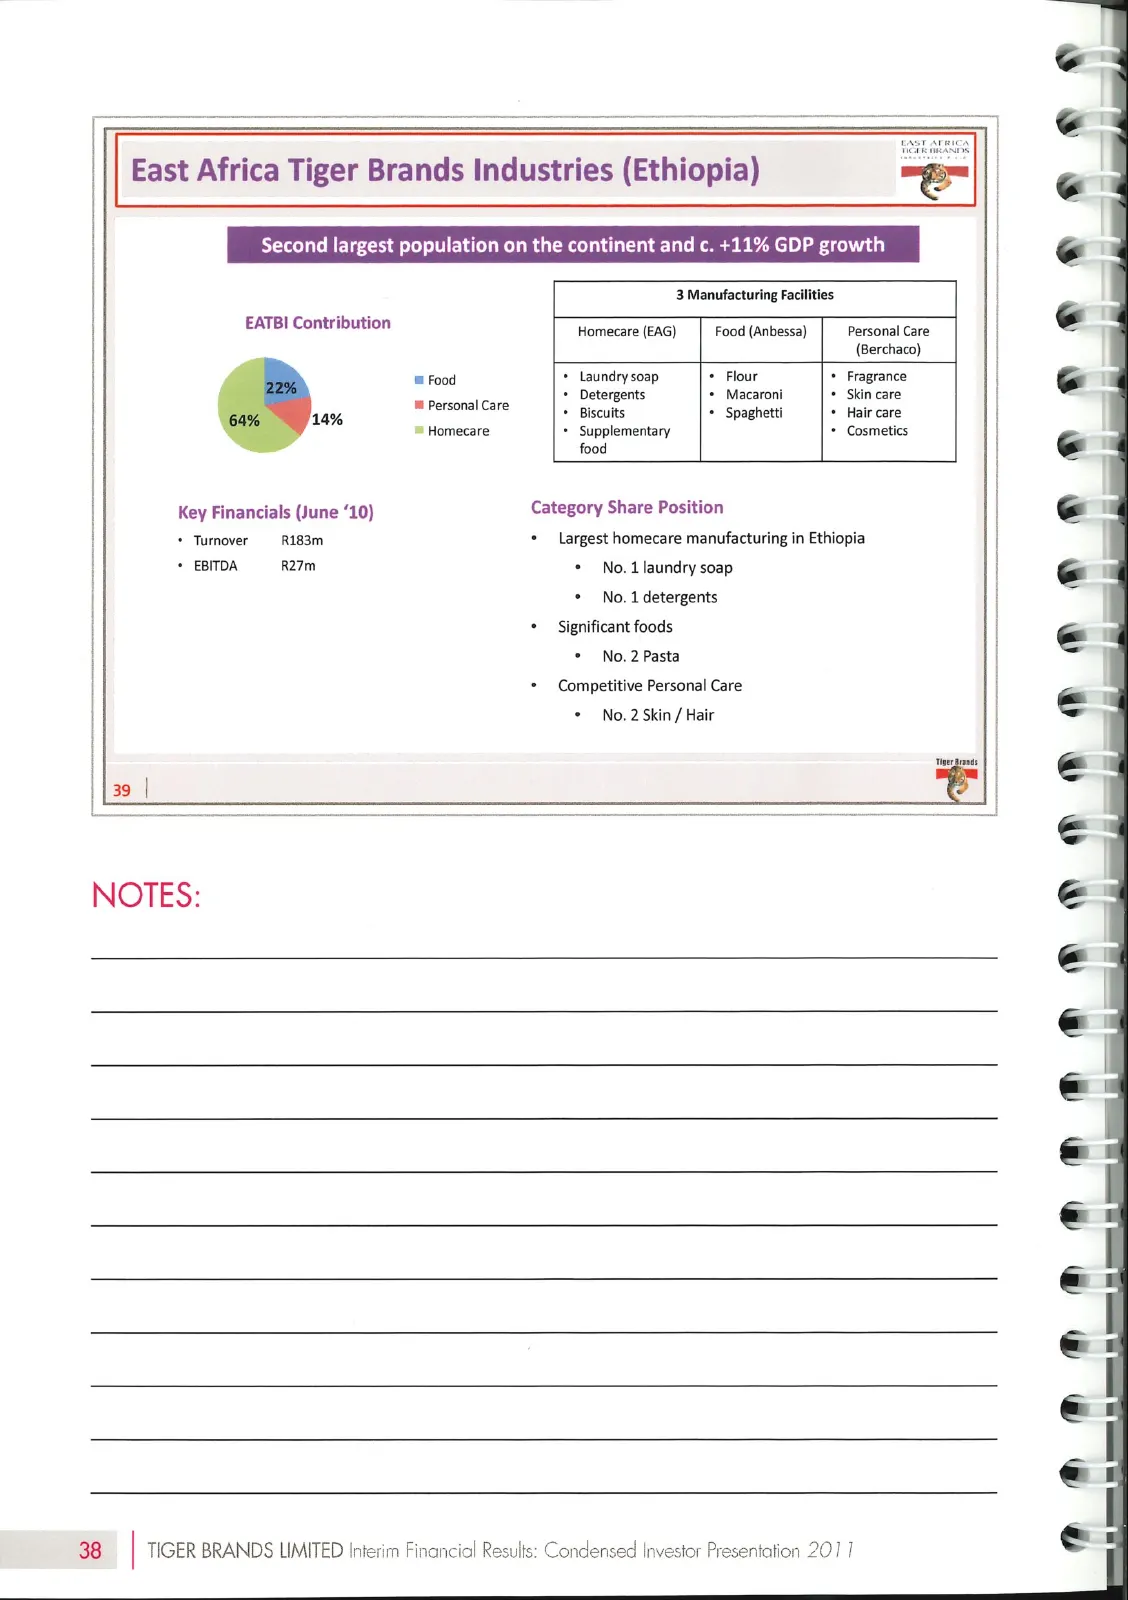
Slide 40: EATBI Contribution
EATBI Contribution 14% Key Financials (June ‘10) + Turnover R183m + EBITDA R27m 39 | Food m Personal Care © Homecare food he continent and c. +11% GDP growth 3 Manufacturing Facilities Homecare (EAG) Food (Anbessa) Personal Care (Berchaco) + Laundry soap * Flour * Fragrance + Detergents Macaroni Ski
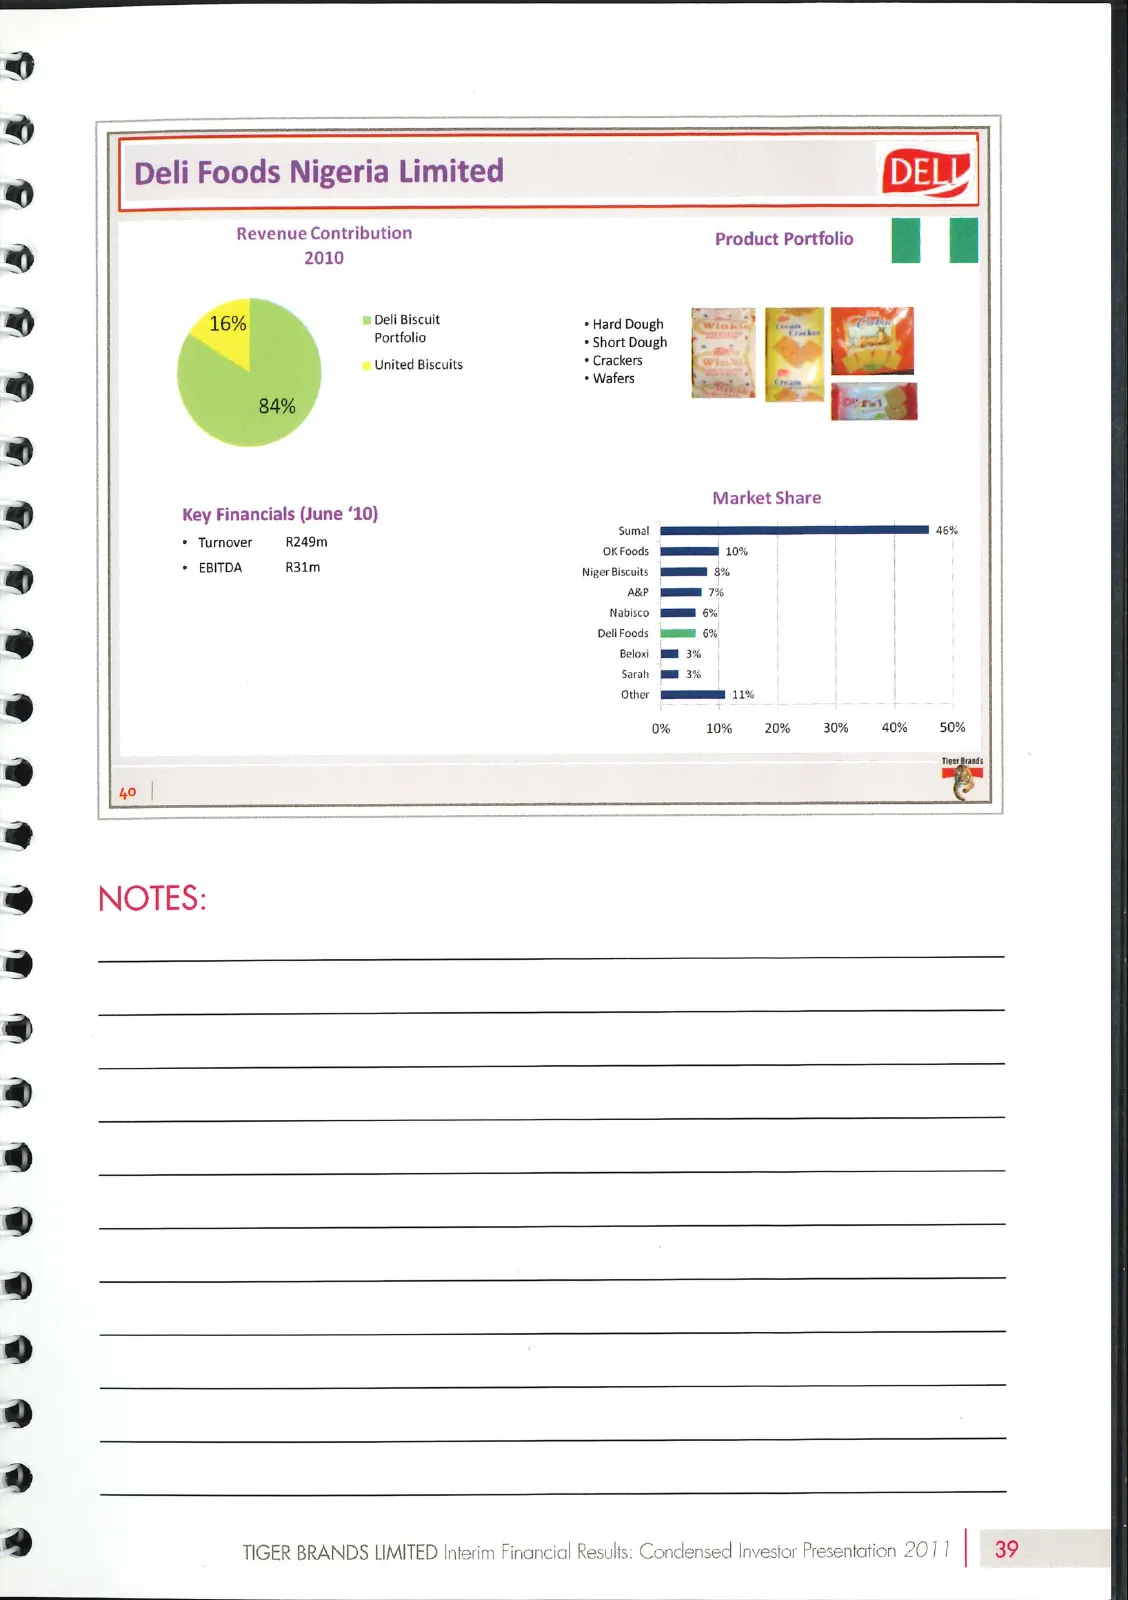
Slide 41: Deli Foods Nigeria Limited
a 8 8s 86888 8 See euteese Bs eeeess ||] Deli Foods Nigeria Limited [DELY Revenue Contribution | 2010 © Deli Biscuit Portfolio © United Biscuits Key Financials (June ‘10) + Turnover —-R249m. | + EBITDA R3im —S Product Portfolio ze | Market Share + Hard Dough * Short Dough * Crackers + Wafers TT 1 Ok
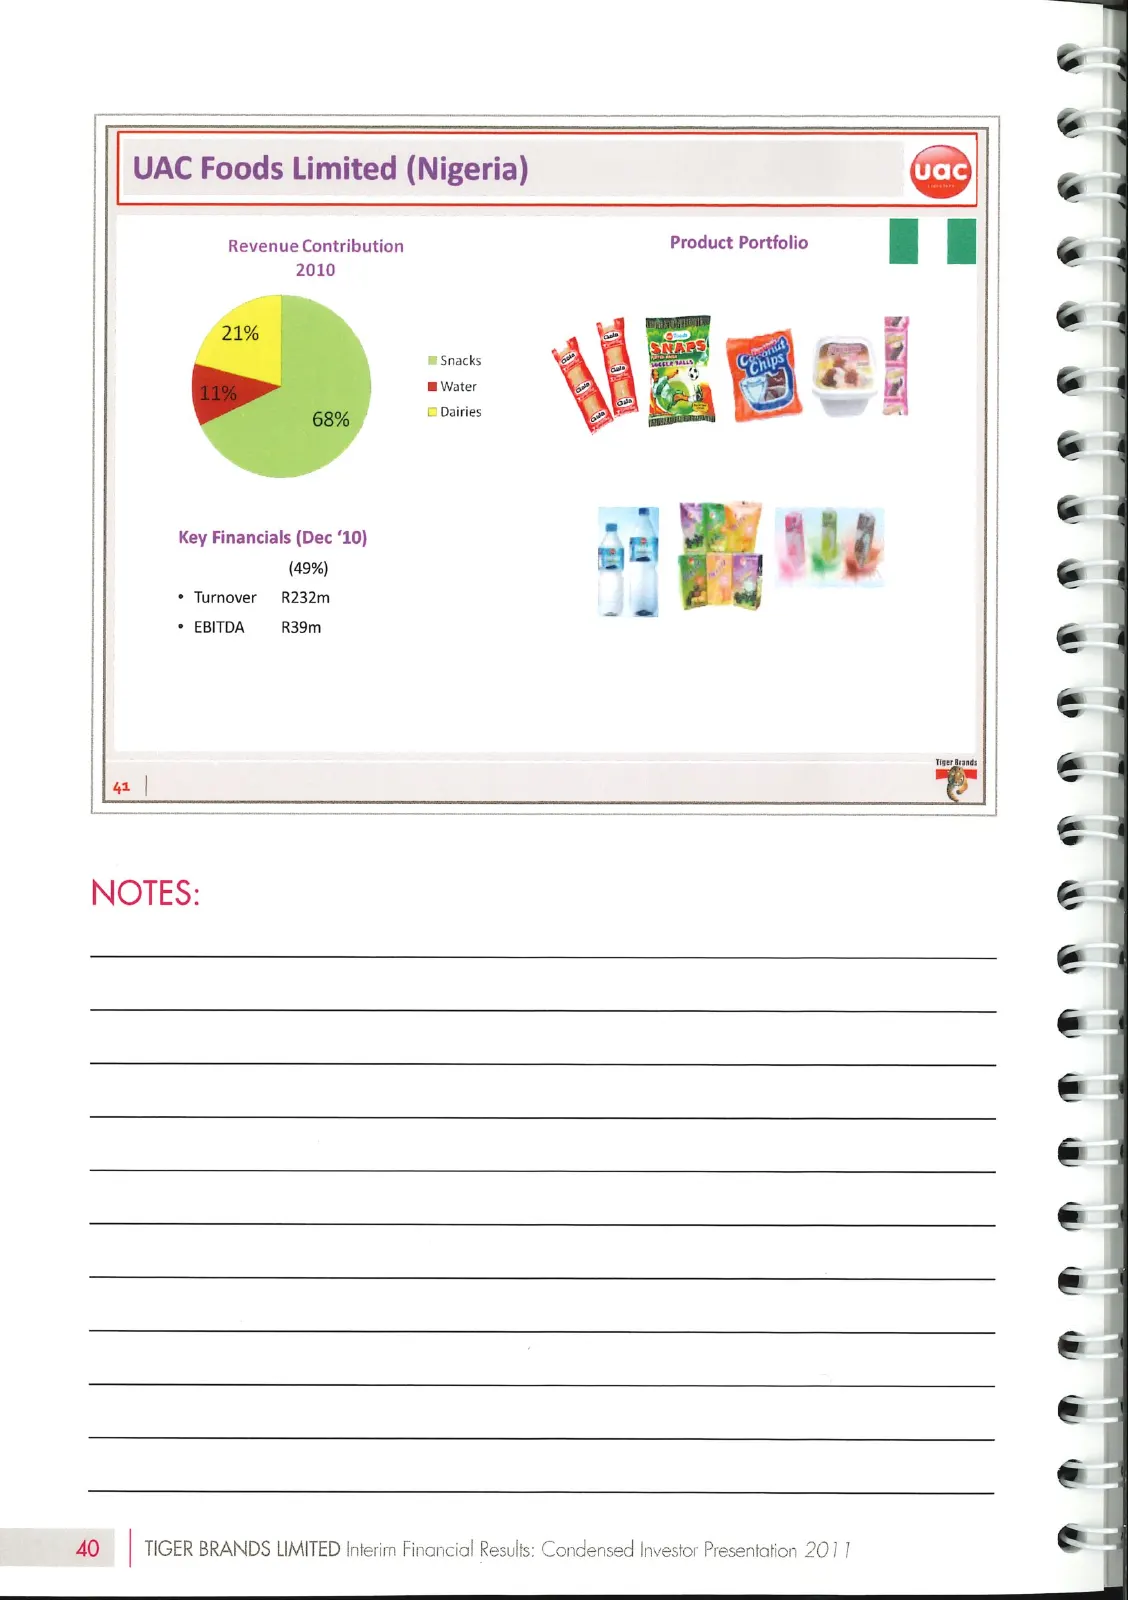
Slide 42: UAC Foods Limited (Nigeria)
® UAC Foods Limited (Nigeria) @ Revenue Contribution Product Portfolio 2010 i me snacks Sd m Water i" 4 © Dairies Key Financials (Dec ‘10) a | i (49%) ts ¥ * Turnover R232m a * EBITDA R39m ~ ARRnTrOPPM@ HP D®AAMAA HH PDH® HH FH H# MH FH 40 TIGER BRANDS LIMITED Interim Financial Results: Condensed In
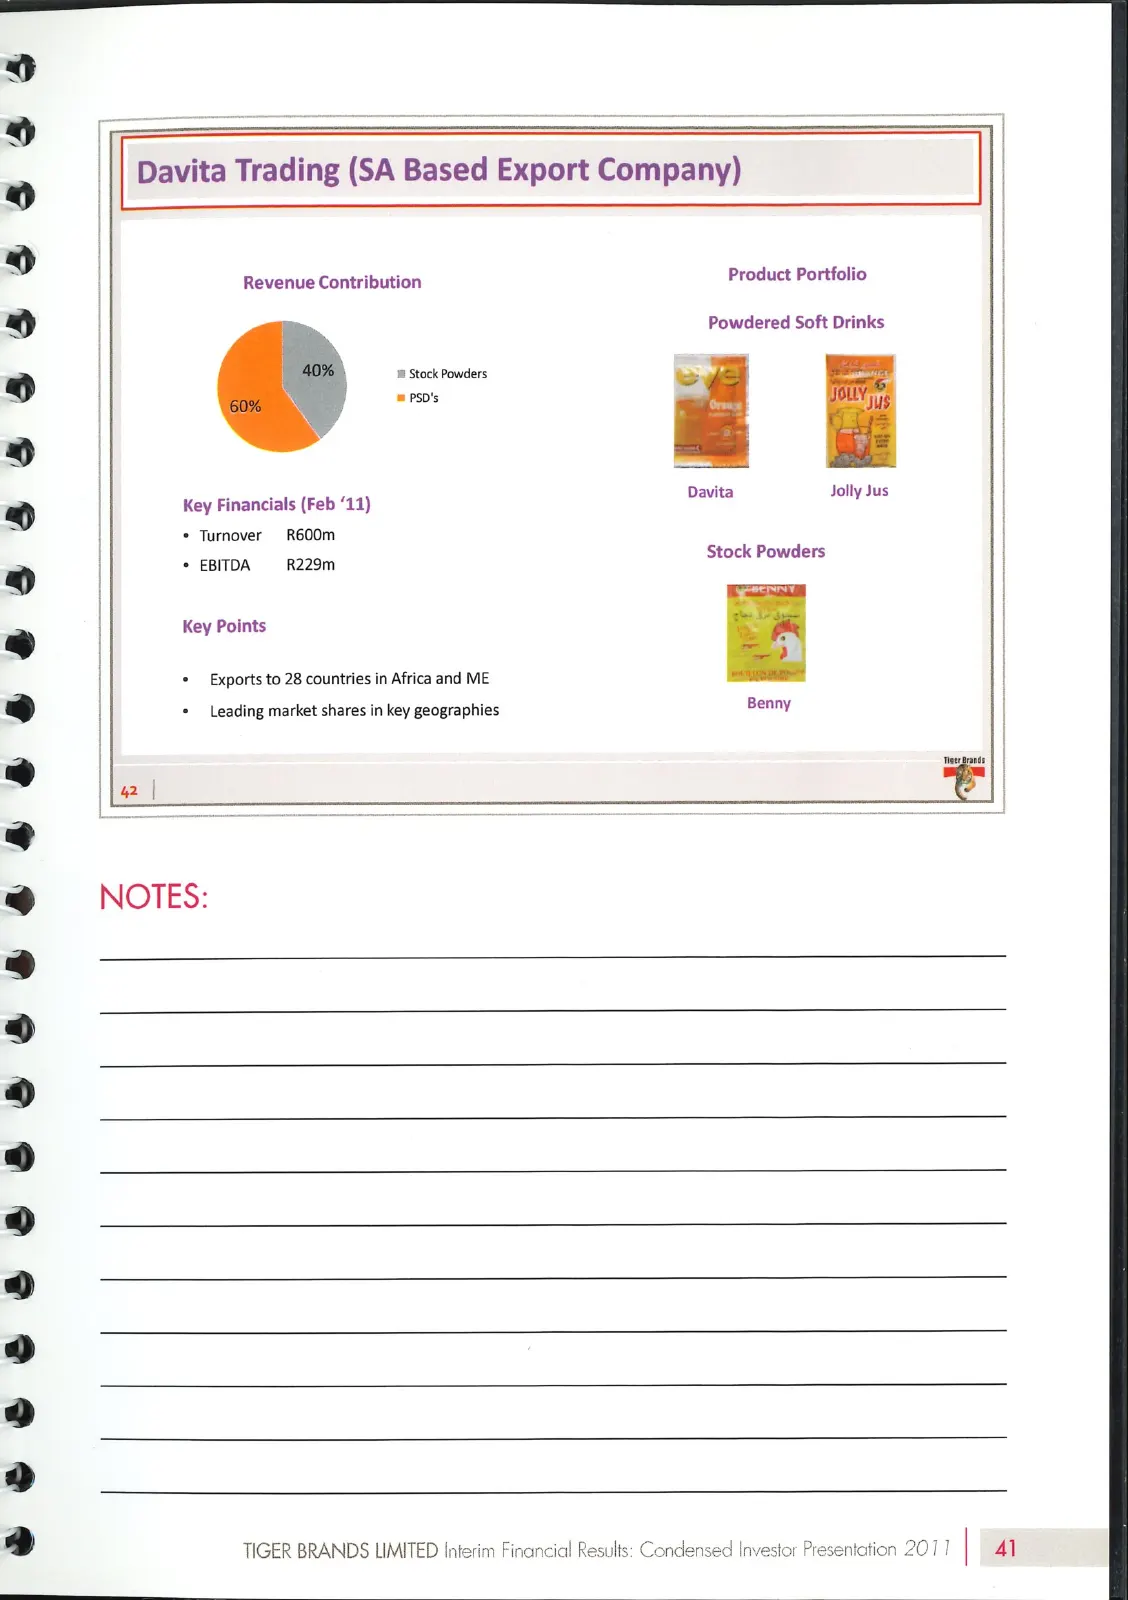
Slide 43: Davita Trading (SA Based Export Company)
ad 63s $68 ®eeesesese se Sees SEEES ||| Davita Trading (SA Based Export Company) | Revenue Contribution Product Portfolio Powdered Soft Drinks lm Stock Powders ce | = PSD's Key Financials (Feb ‘11) Davita * Turnover 600m * EBITDA R229m Key Points * Exports to 28 countries in Africa and ME * Leading
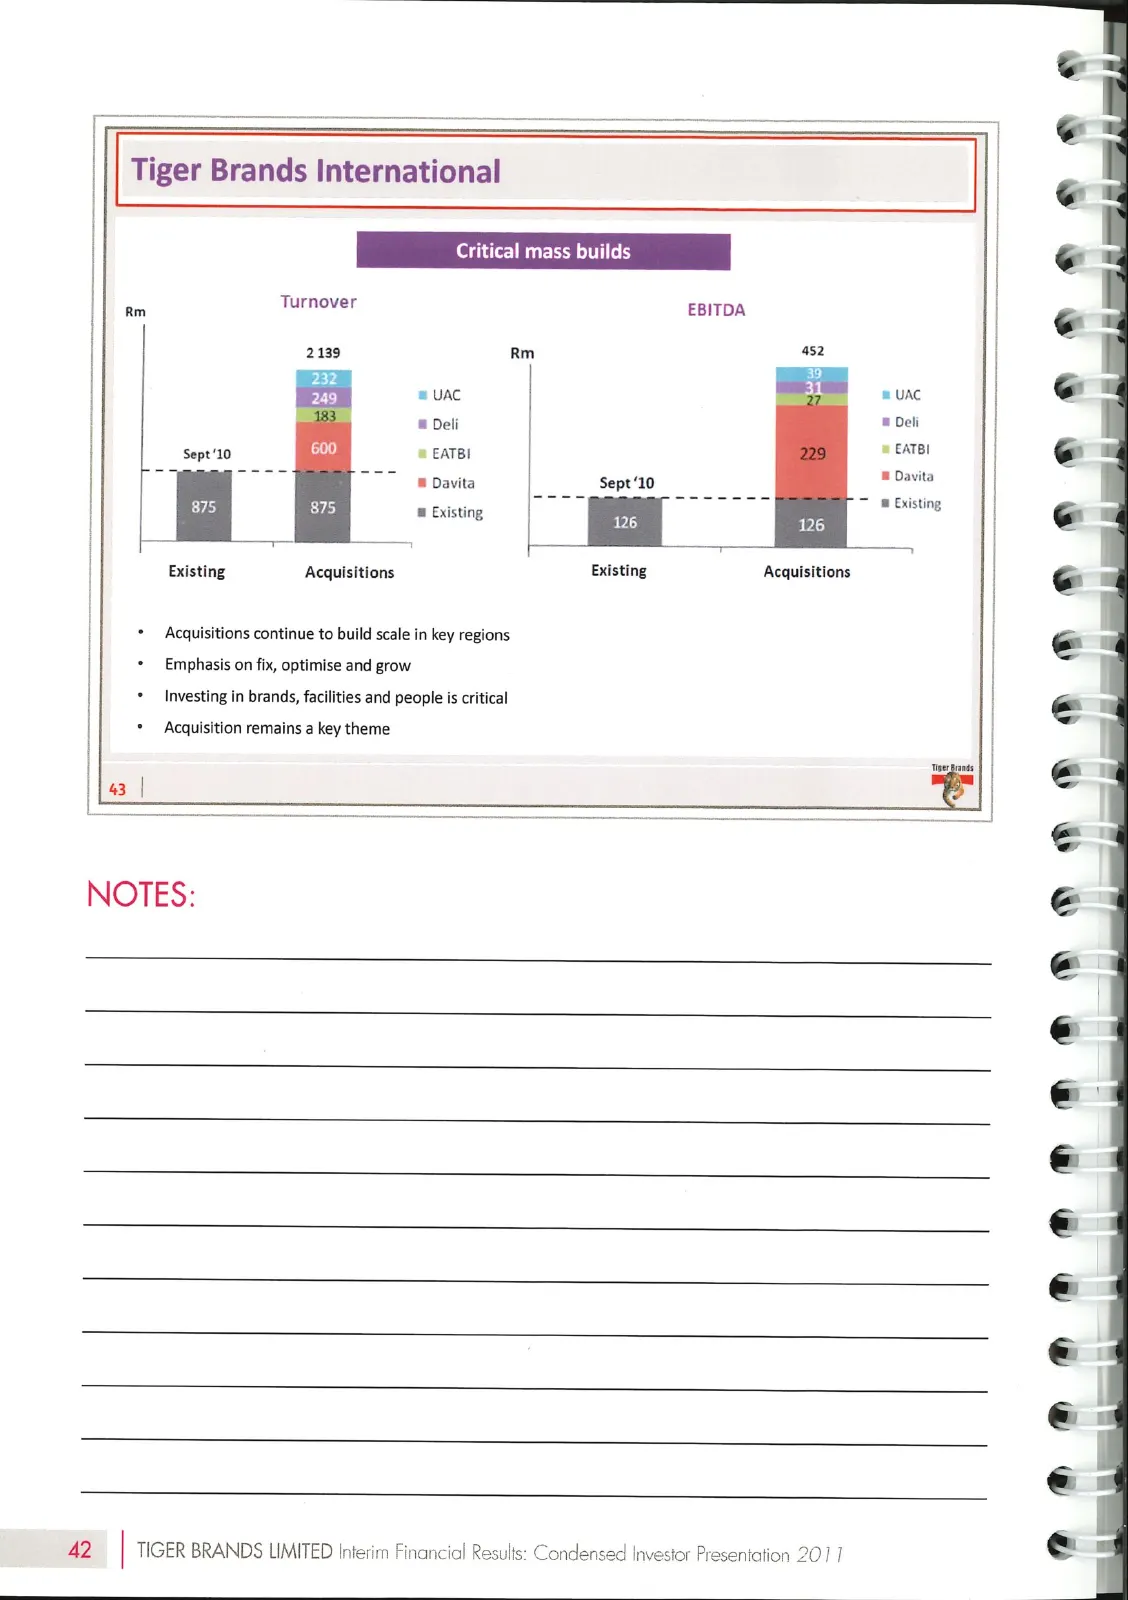
Slide 44: Tiger Brands International: Critical mass builds
Tiger Brands International Critical mass builds Turnover * Acquisitions continue to build scale in key regions + Emphasis on fix, optimise and grow + Investing in brands, facilities and people is critical * Acquisition remains a key theme Rm EBITDA 2139 Rm 452 =) 232 249 = UAC | 31 m= UAC & Deli | =
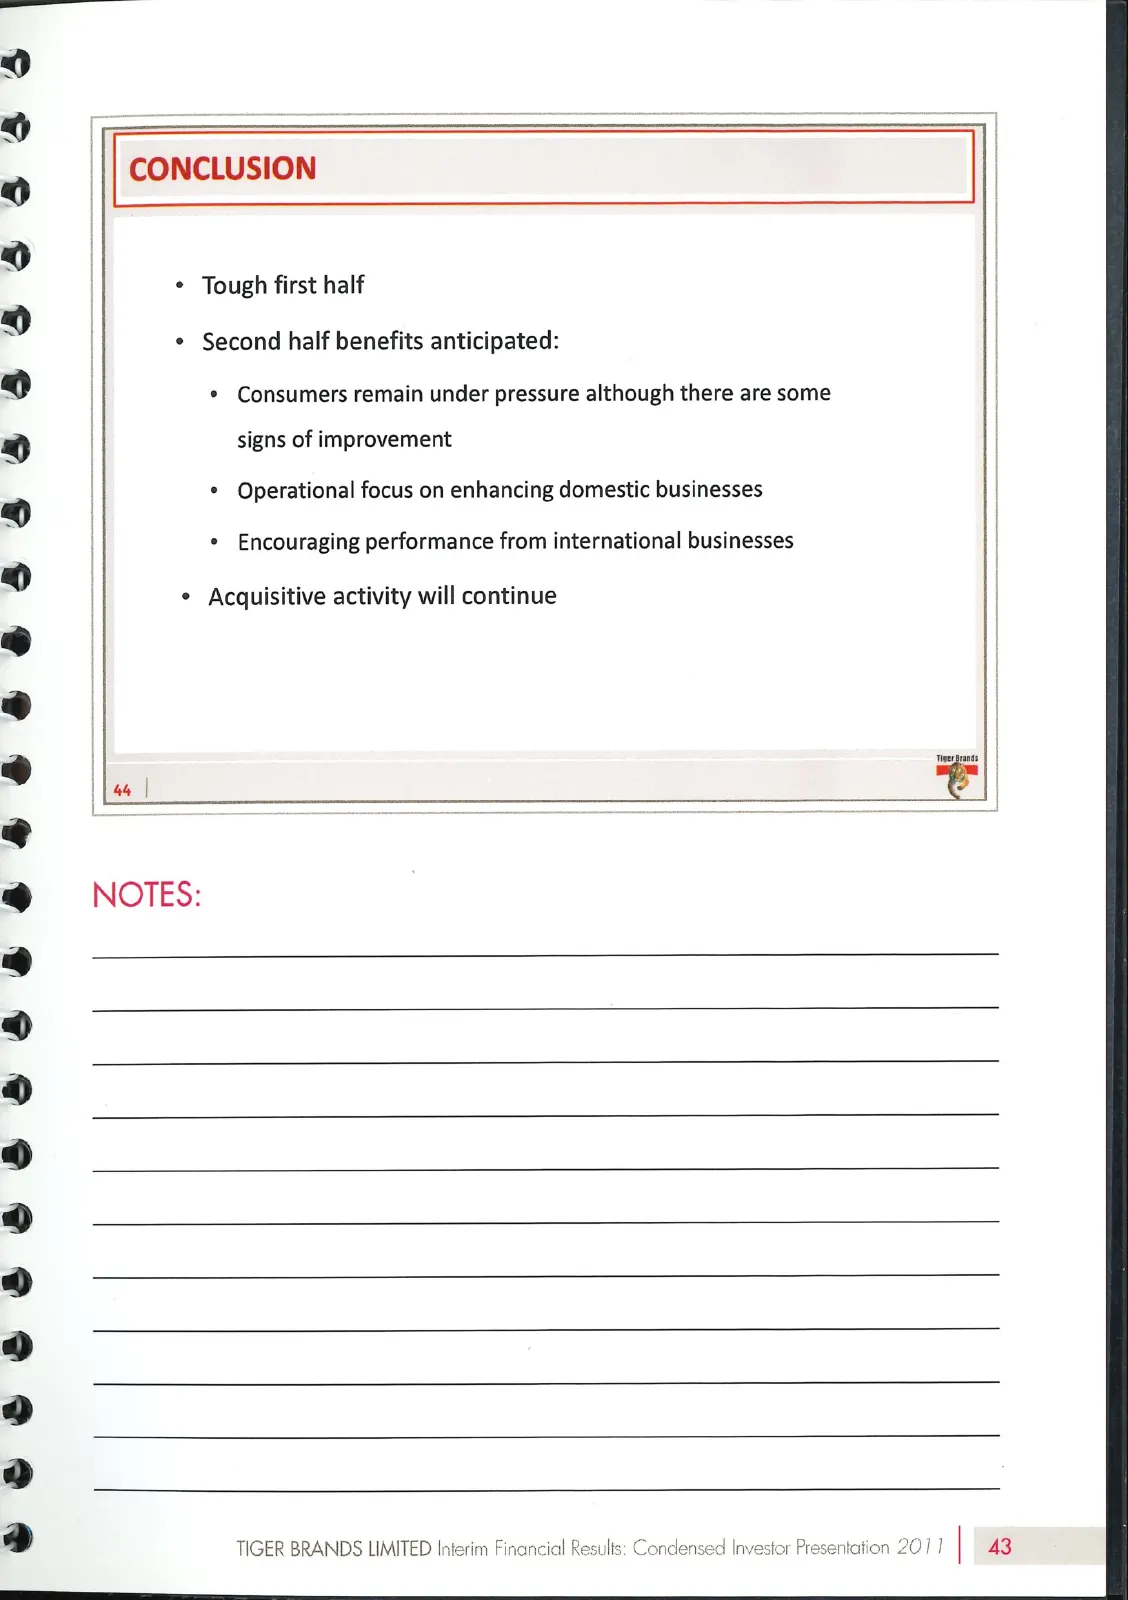
Slide 45: Conclusion
S 3 CONCLUSION * Tough first half | 3oo98 * Second half benefits anticipated: | * Consumers remain under pressure although there are some 33d signs of improvement | * Operational focus on enhancing domestic businesses | 3 ¢ Encouraging performance from international businesses ° Acquisitive activity
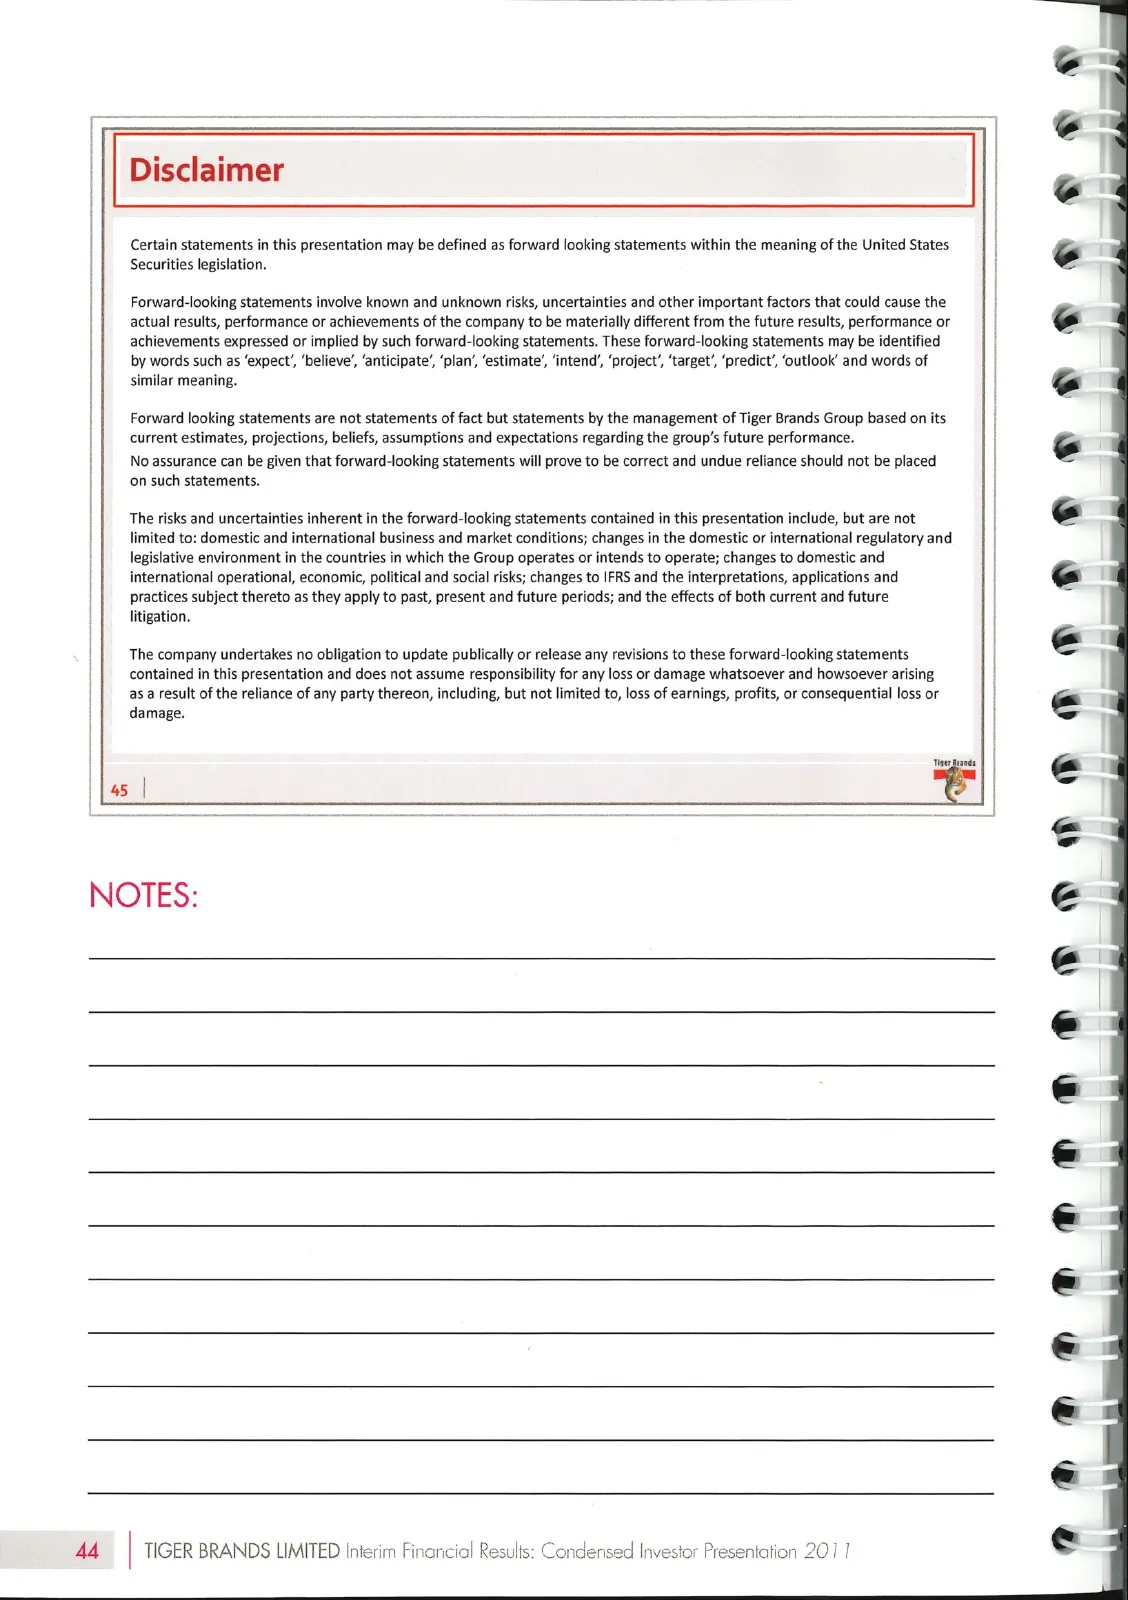
Slide 46: Disclaimer
Disclaimer ® © # Certain statements in this presentation may be defined as forward looking statements within the meaning of the United States | Securities legislation. | ® Forward-looking statements involve known and unknown risks, uncertainties and other important factors that could cause the actua

Slide 47: BASTION GRAPHICS,
BASTION GRAPHICS,

Slide 48: Tiger Brands
Tiger Brands Tiger Brands Limited Registration number 1944/017881/06 (Incorporated in the Republic of South Africa) Share code: TBS ISIN: ZAEOO007 1080 www.tigerbrands.com ® & ® ® ® & ® ® ® PRmnnDnOPDBR DOM O®@ mh MH ®
Source: Internet Archive copy of tigerbrands.com
More decks from Tiger Brands Limited
 H1 2026 Earnings Presentation37 slides · Jun 1, 2026
 H1 2026 Earnings Presentation38 slides · Jun 1, 2026
 FY2025 Earnings Presentation38 slides · Nov 26, 2025
 H1 2025 Earnings Presentation43 slides · May 28, 2025
 H1 FY2024 Earnings Presentation38 slides · May 27, 2024
 FY2023 Earnings Presentation45 slides · Dec 1, 2023