Componenta Oyj · OMXHEX:CTH1V
Componenta Oyj — H1 2002 Earnings Presentation
21 slides from Componenta Oyj's earnings presentation, Jun 30, 2002
Slide 1: Componenta Corporation Interim report 1 January - 30 June 2002
Componenta Corporation Interim report 1 January - 30 June 2002
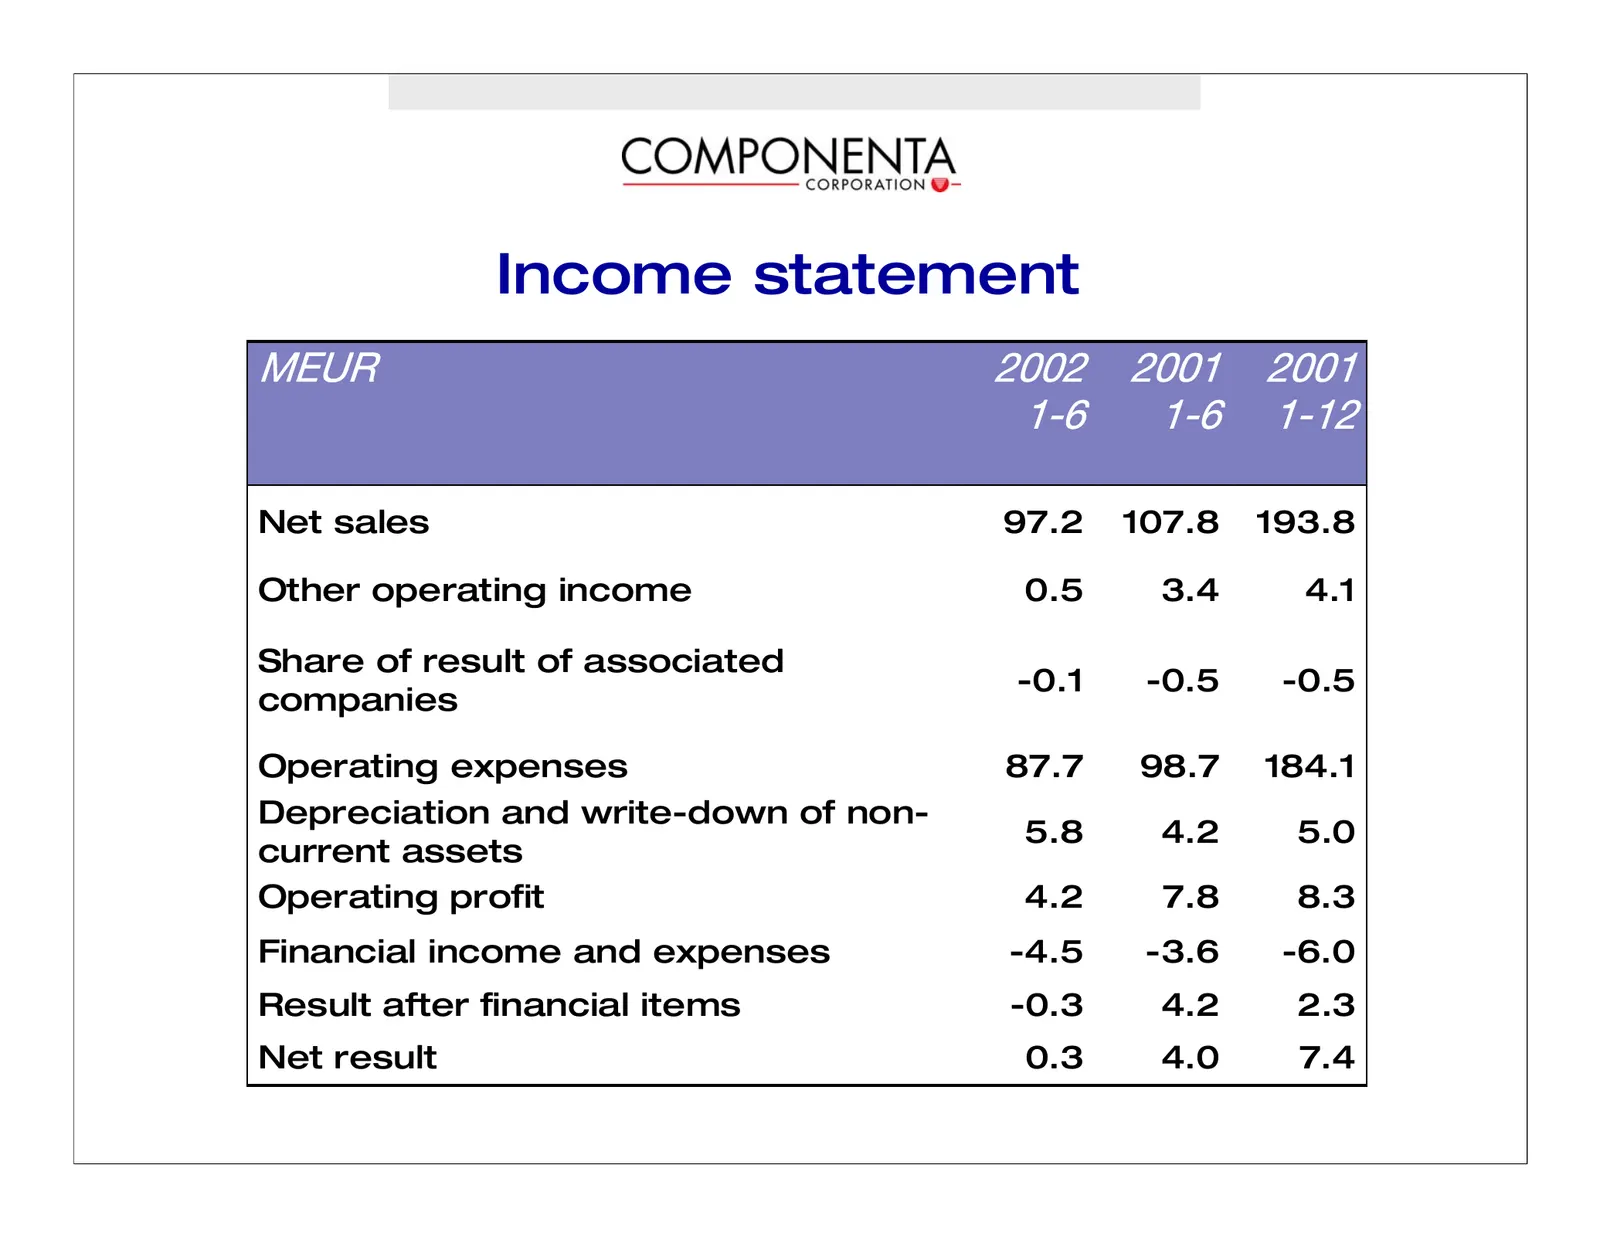
Slide 2: Income statement
Income statement jbro OMMO OMMN OMMN NJS NJS NJNO Net sales 97.2 107.8 193.8 Other operating income 0.5 3.4 4.1 Share of result of associated -0.1 -0.5 -0.5 companies Operating expenses 87.7 98.7 184.1 Depreciation and write-down of non- 5.8 4.2 5.0 current assets Operating profit 4.2 7.8 8.3 Financ
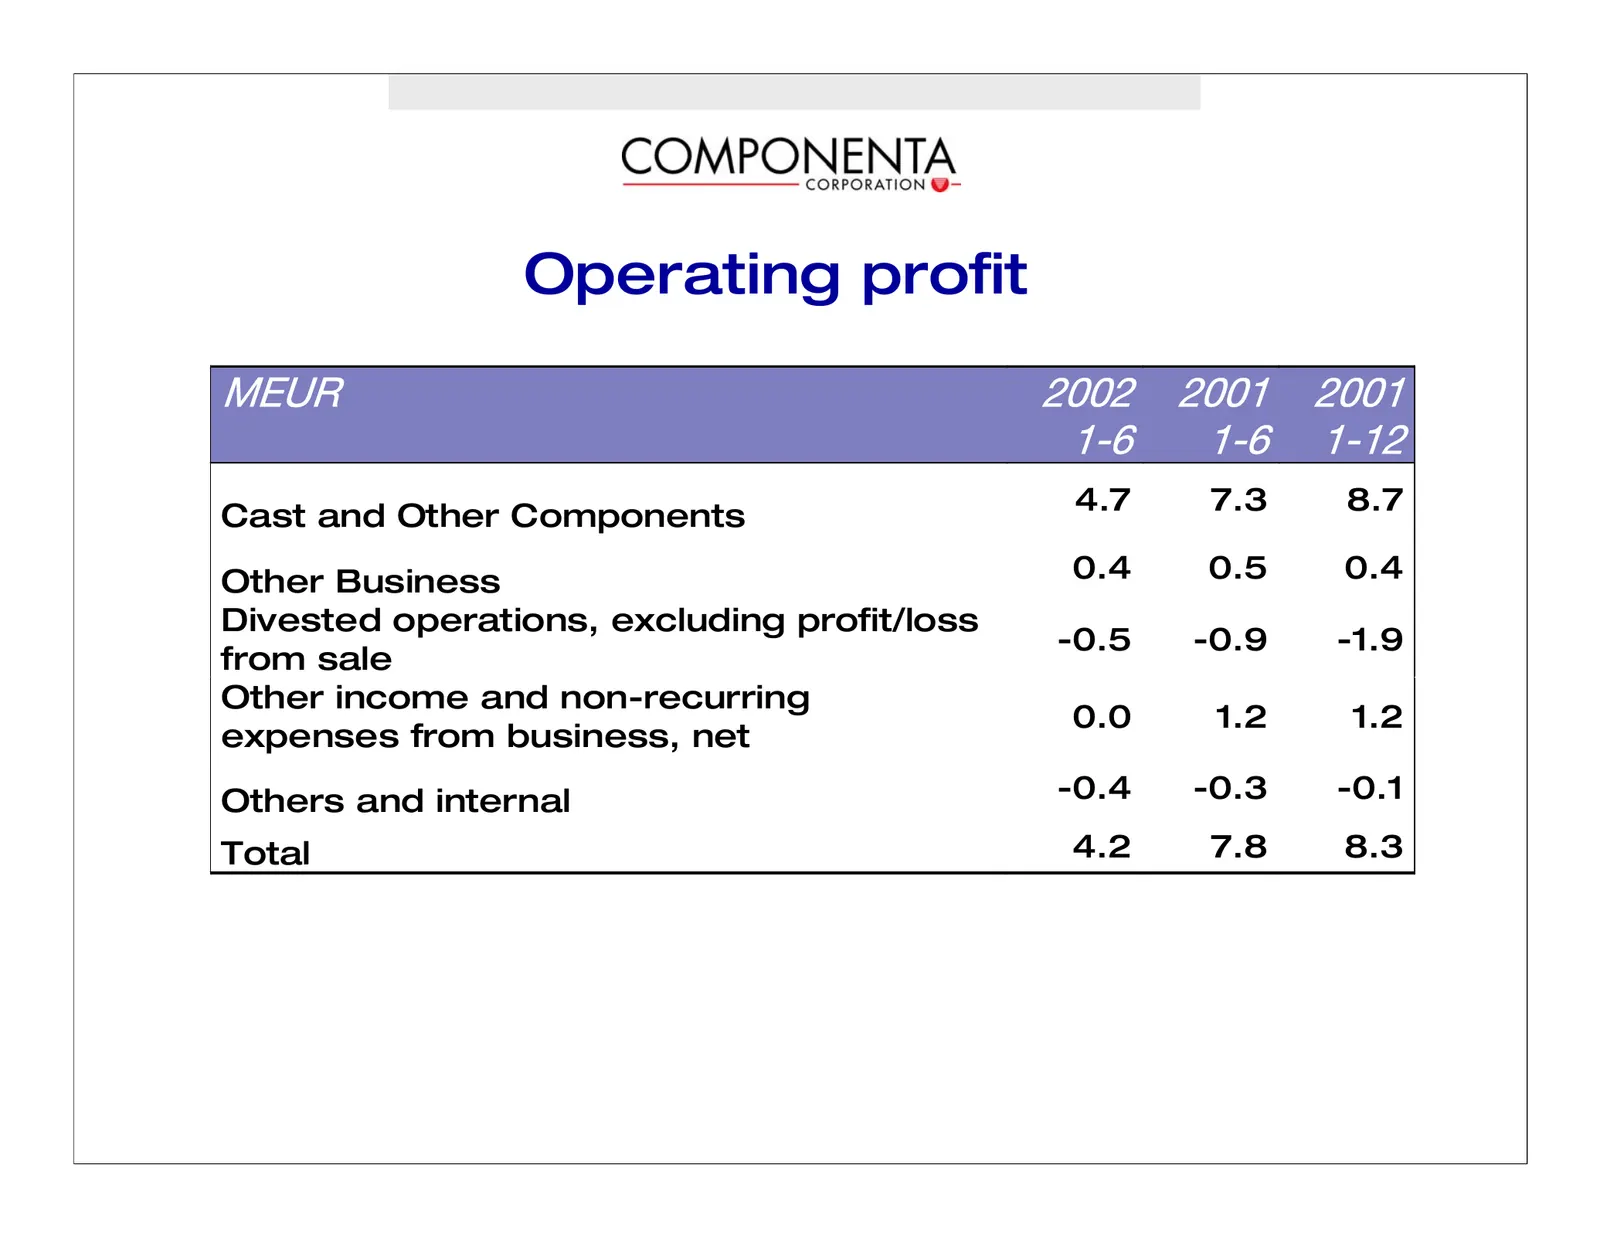
Slide 3: Operating profit
Operating profit jbro OMMO OMMN OMMN NJS NJS NJNO Cast and Other Components 4.7 7.3 8.7 Other Business 0.4 0.5 0.4 Divested operations, excluding profit/loss -0.5 -0.9 -1.9 from sale Other income and non-recurring 0.0 1.2 1.2 expenses from business, net Others and internal -0.4 -0.3 -0.1 Total 4.2 7
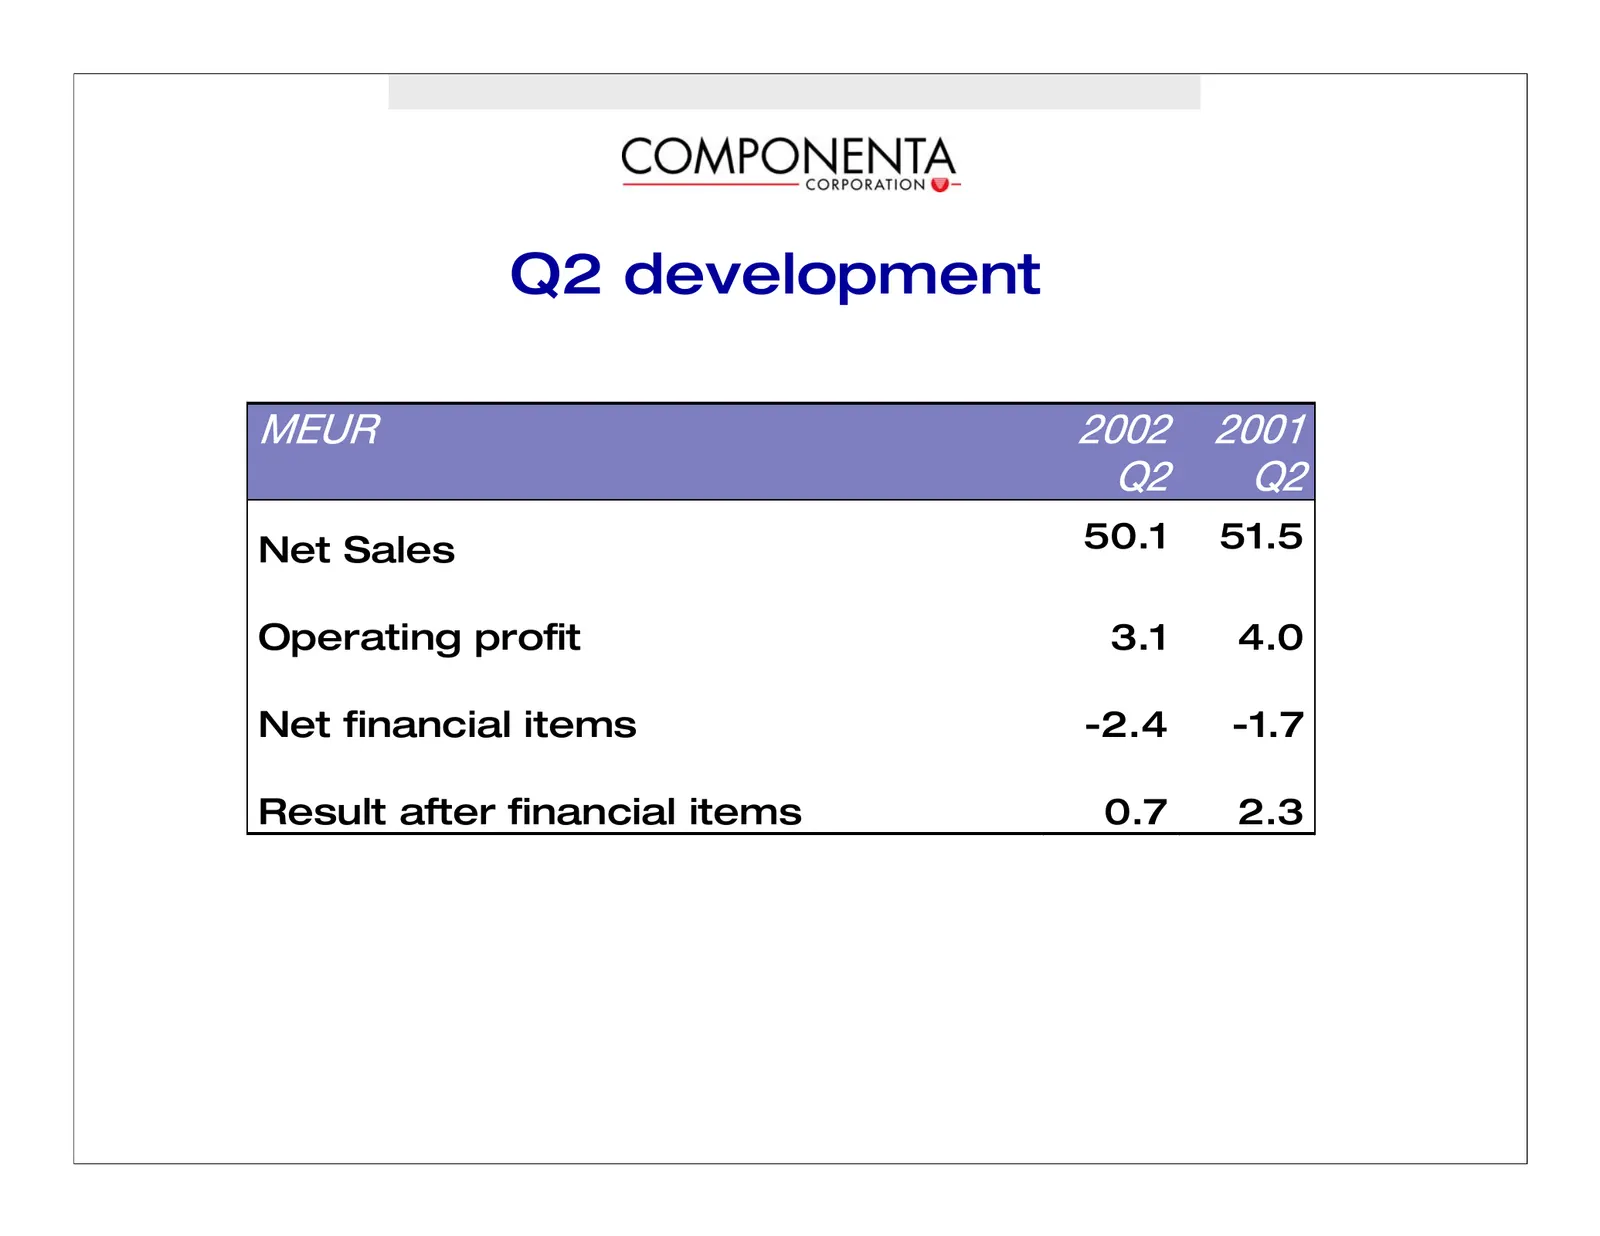
Slide 4: Q2 development
Q2 development jbro OMMO OMMN nO nO Net Sales 50.1 51.5 Operating profit 3.1 4.0 Net financial items -2.4 -1.7 Result after financial items 0.7 2.3
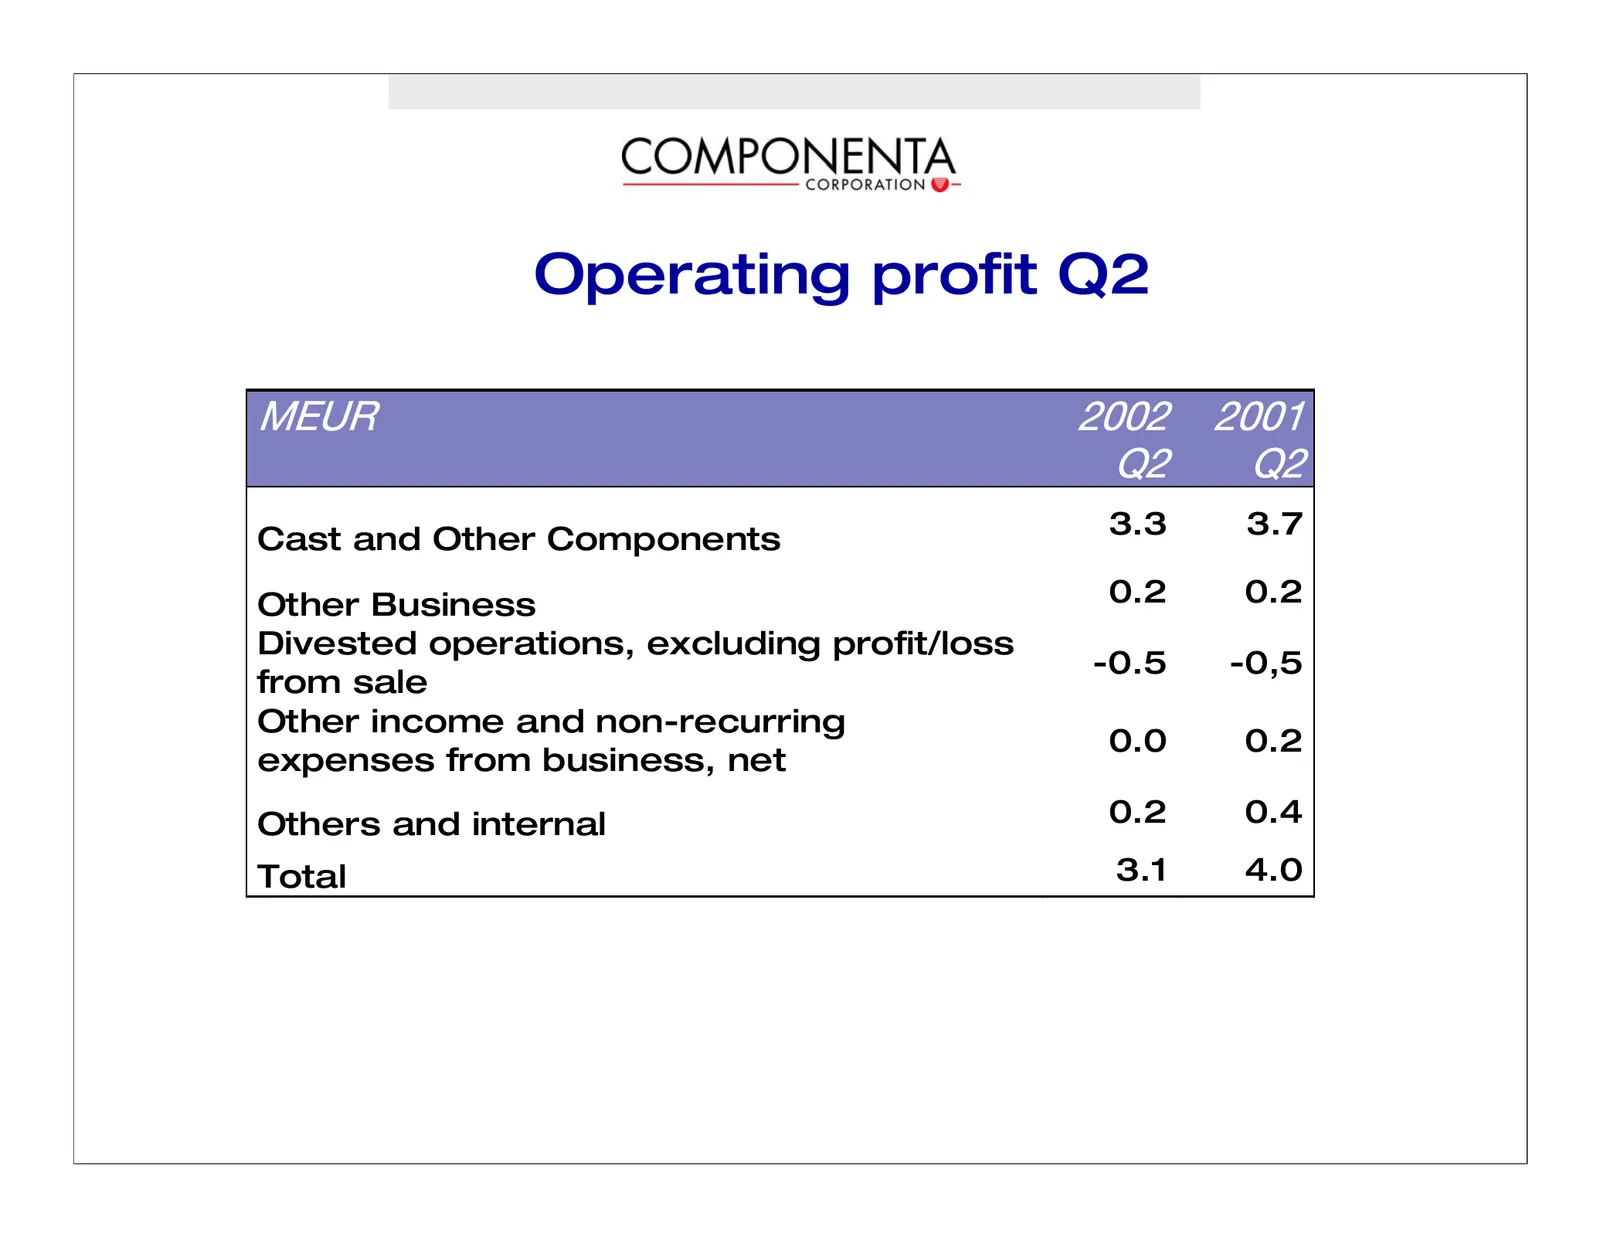
Slide 5: Operating profit Q2
Operating profit Q2 jbro OMMO OMMN nO nO Cast and Other Components 3.3 3.7 Other Business 0.2 0.2 Divested operations, excluding profit/loss -0.5 -0,5 from sale Other income and non-recurring 0.0 0.2 expenses from business, net Others and internal 0.2 0.4 Total 3.1 4.0
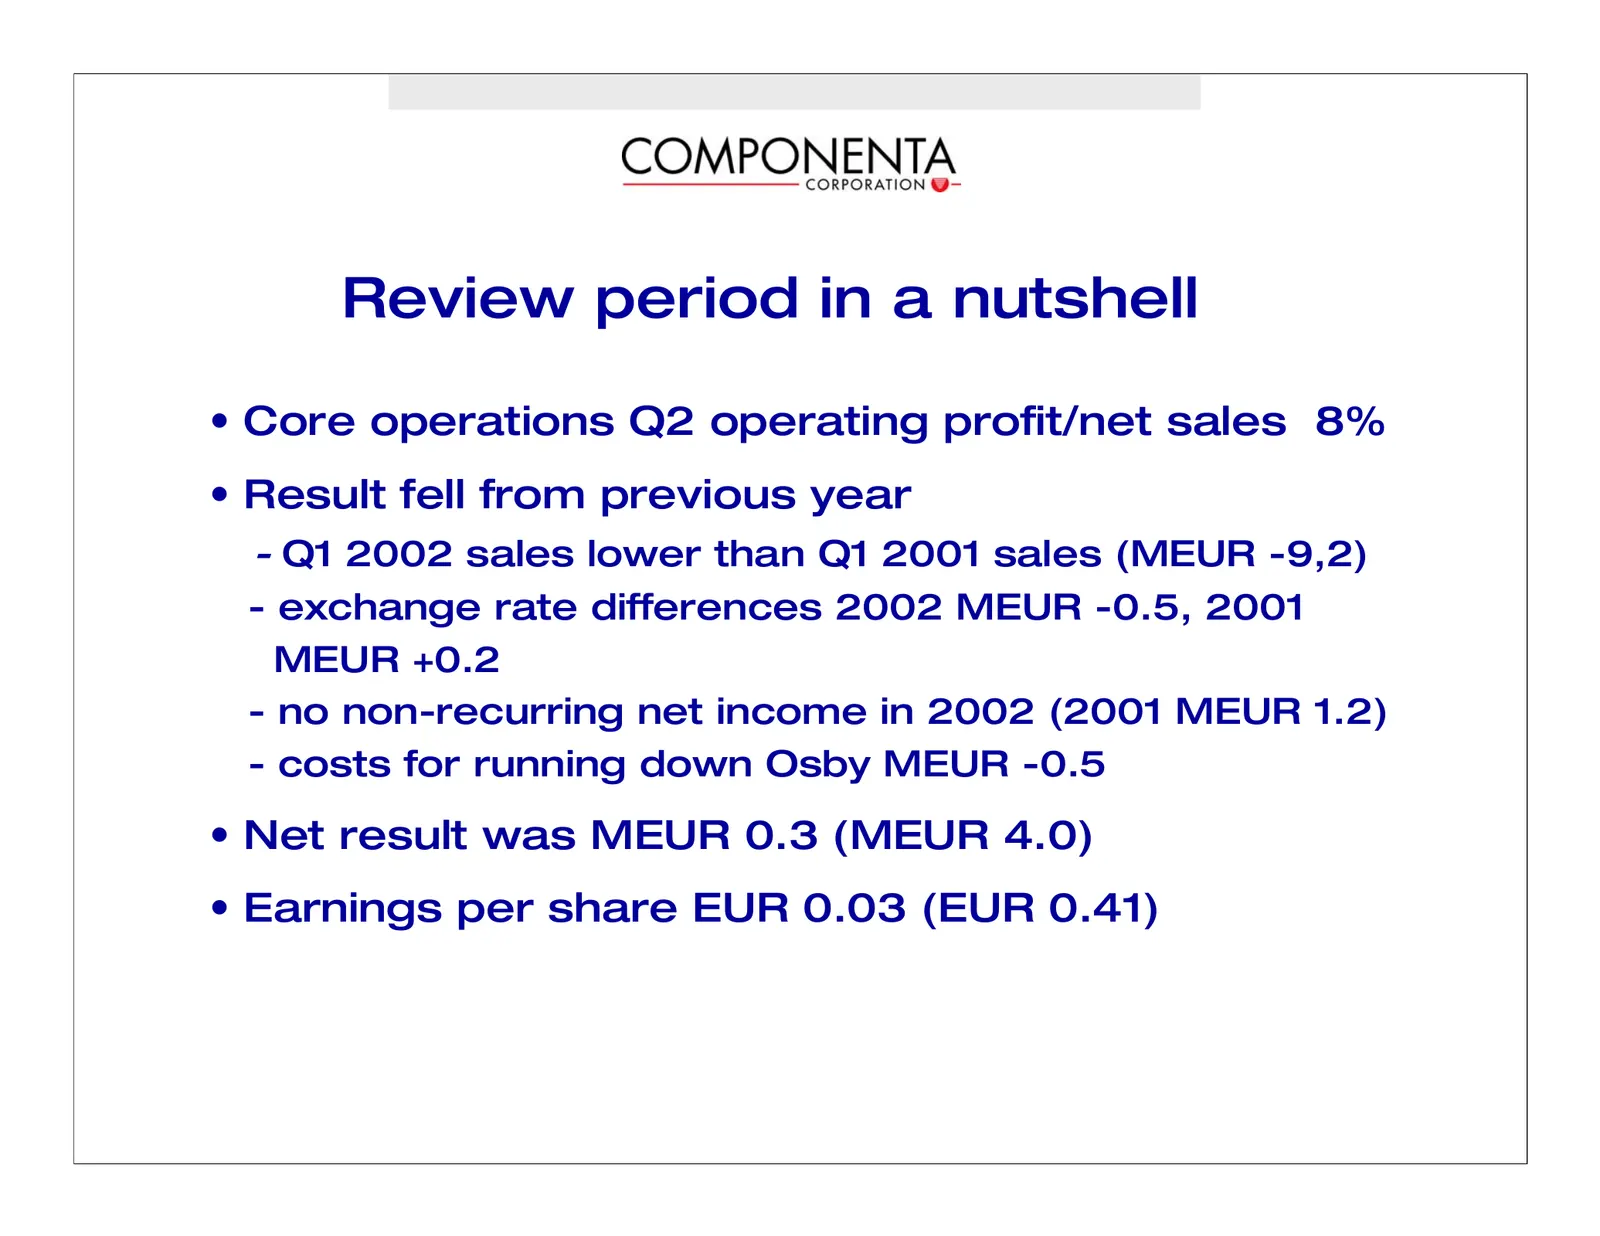
Slide 6: Review period in a nutshell
Review period in a nutshell • Core operations Q2 operating profit/net sales 8% • Result fell from previous year - Q1 2002 sales lower than Q1 2001 sales (MEUR -9,2) - exchange rate differences 2002 MEUR -0.5, 2001 MEUR +0.2 - no non-recurring net income in 2002 (2001 MEUR 1.2) - costs for running do
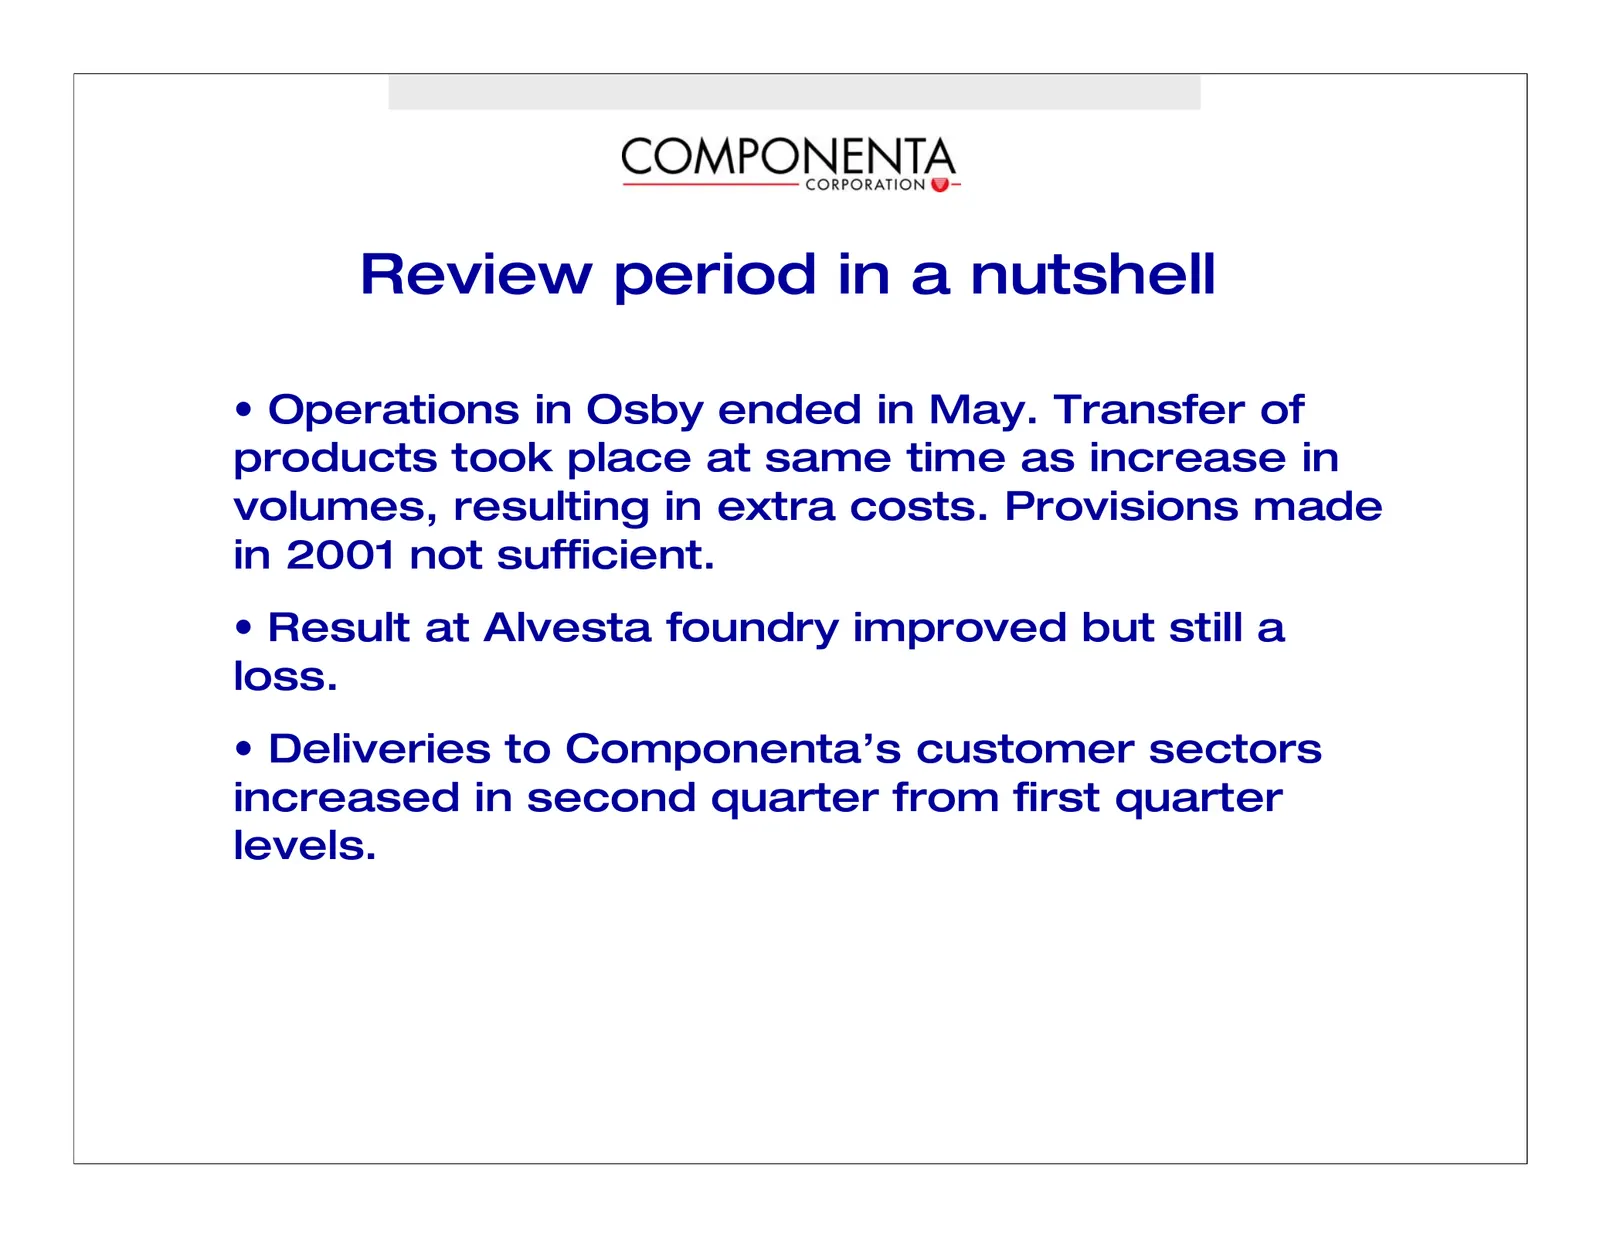
Slide 7: Review period in a nutshell
Review period in a nutshell • Operations in Osby ended in May. Transfer of products took place at same time as increase in volumes, resulting in extra costs. Provisions made in 2001 not sufficient. • Result at Alvesta foundry improved but still a loss. • Deliveries to Componenta’s customer sectors i
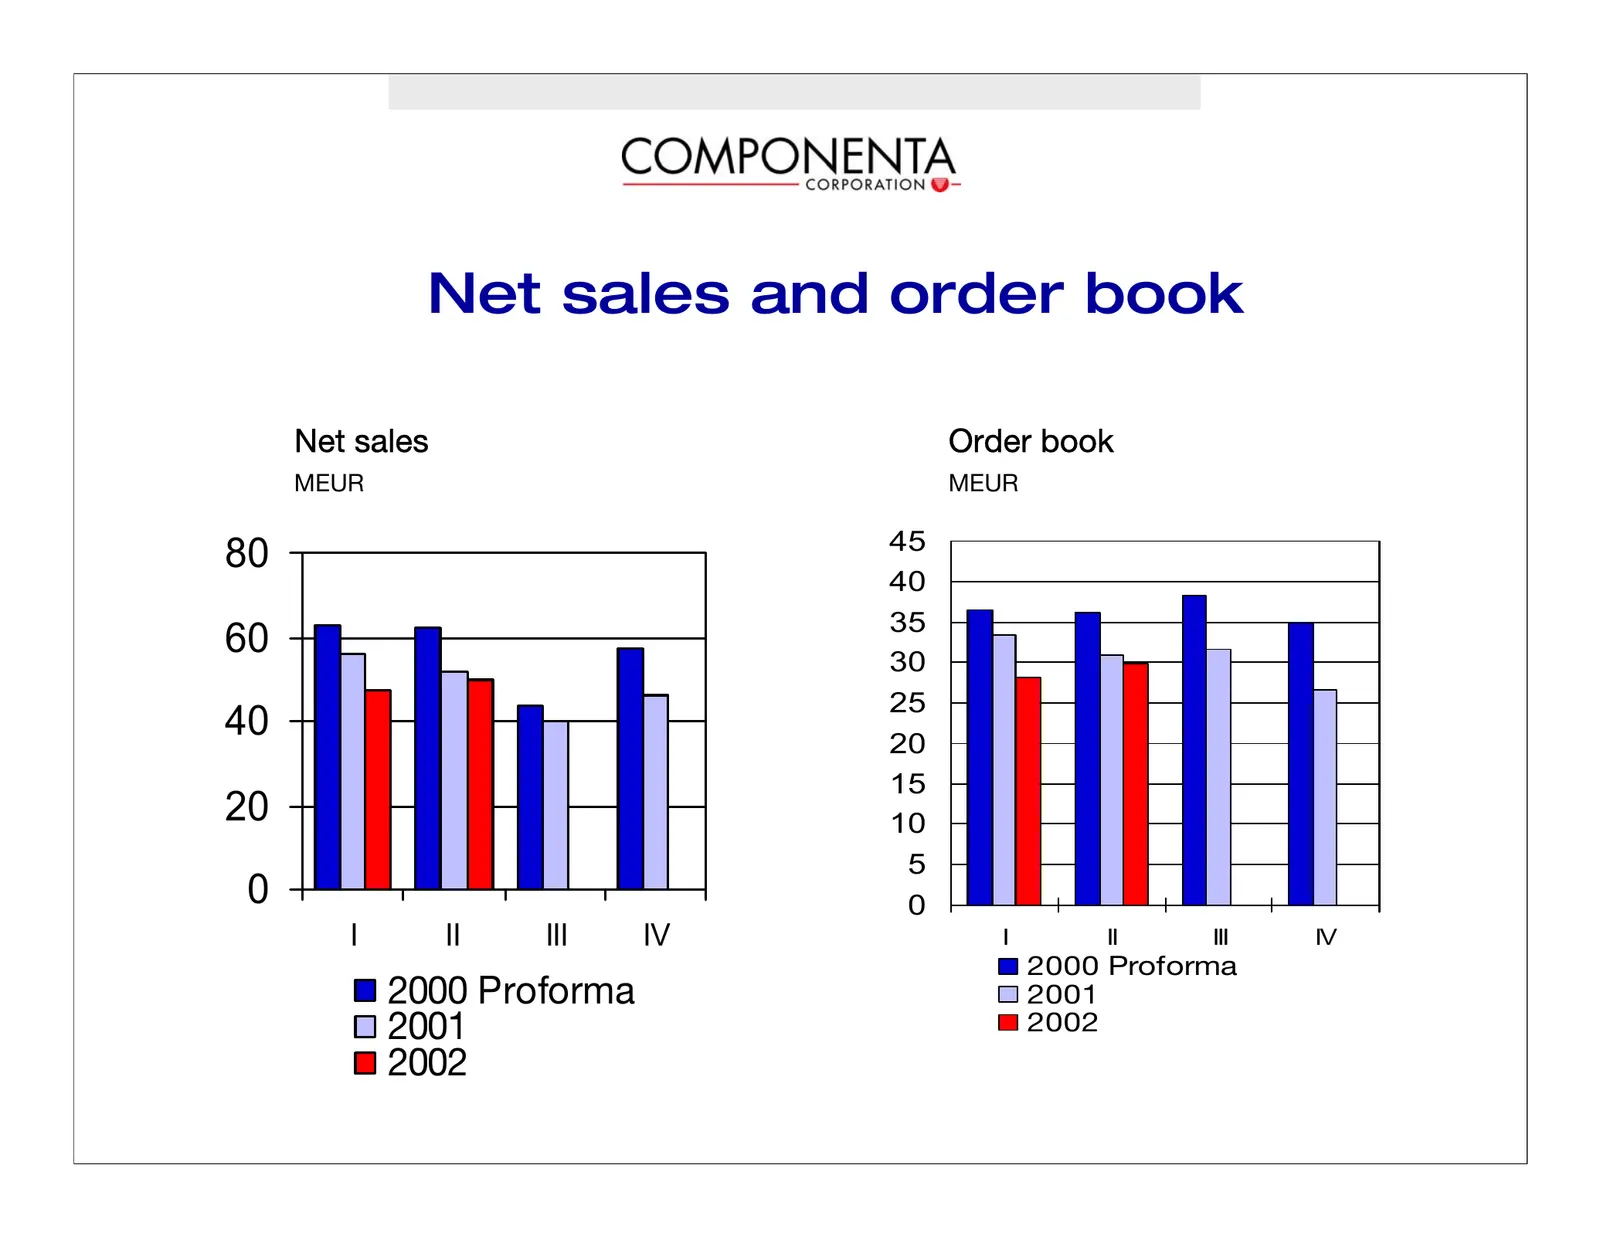
Slide 8: Net sales and order book
Net sales and order book kÉí=ë~äÉë lêÇÉê=Äççâ jbro jbro 45 80 40 35 60 30 25 40 20 15 20 10 5 0 0 I II III IV I II III IV OMMM=mêçÑçêã~== OMMM=mêçÑçêã~ OMMN OMMN OMMO OMMO
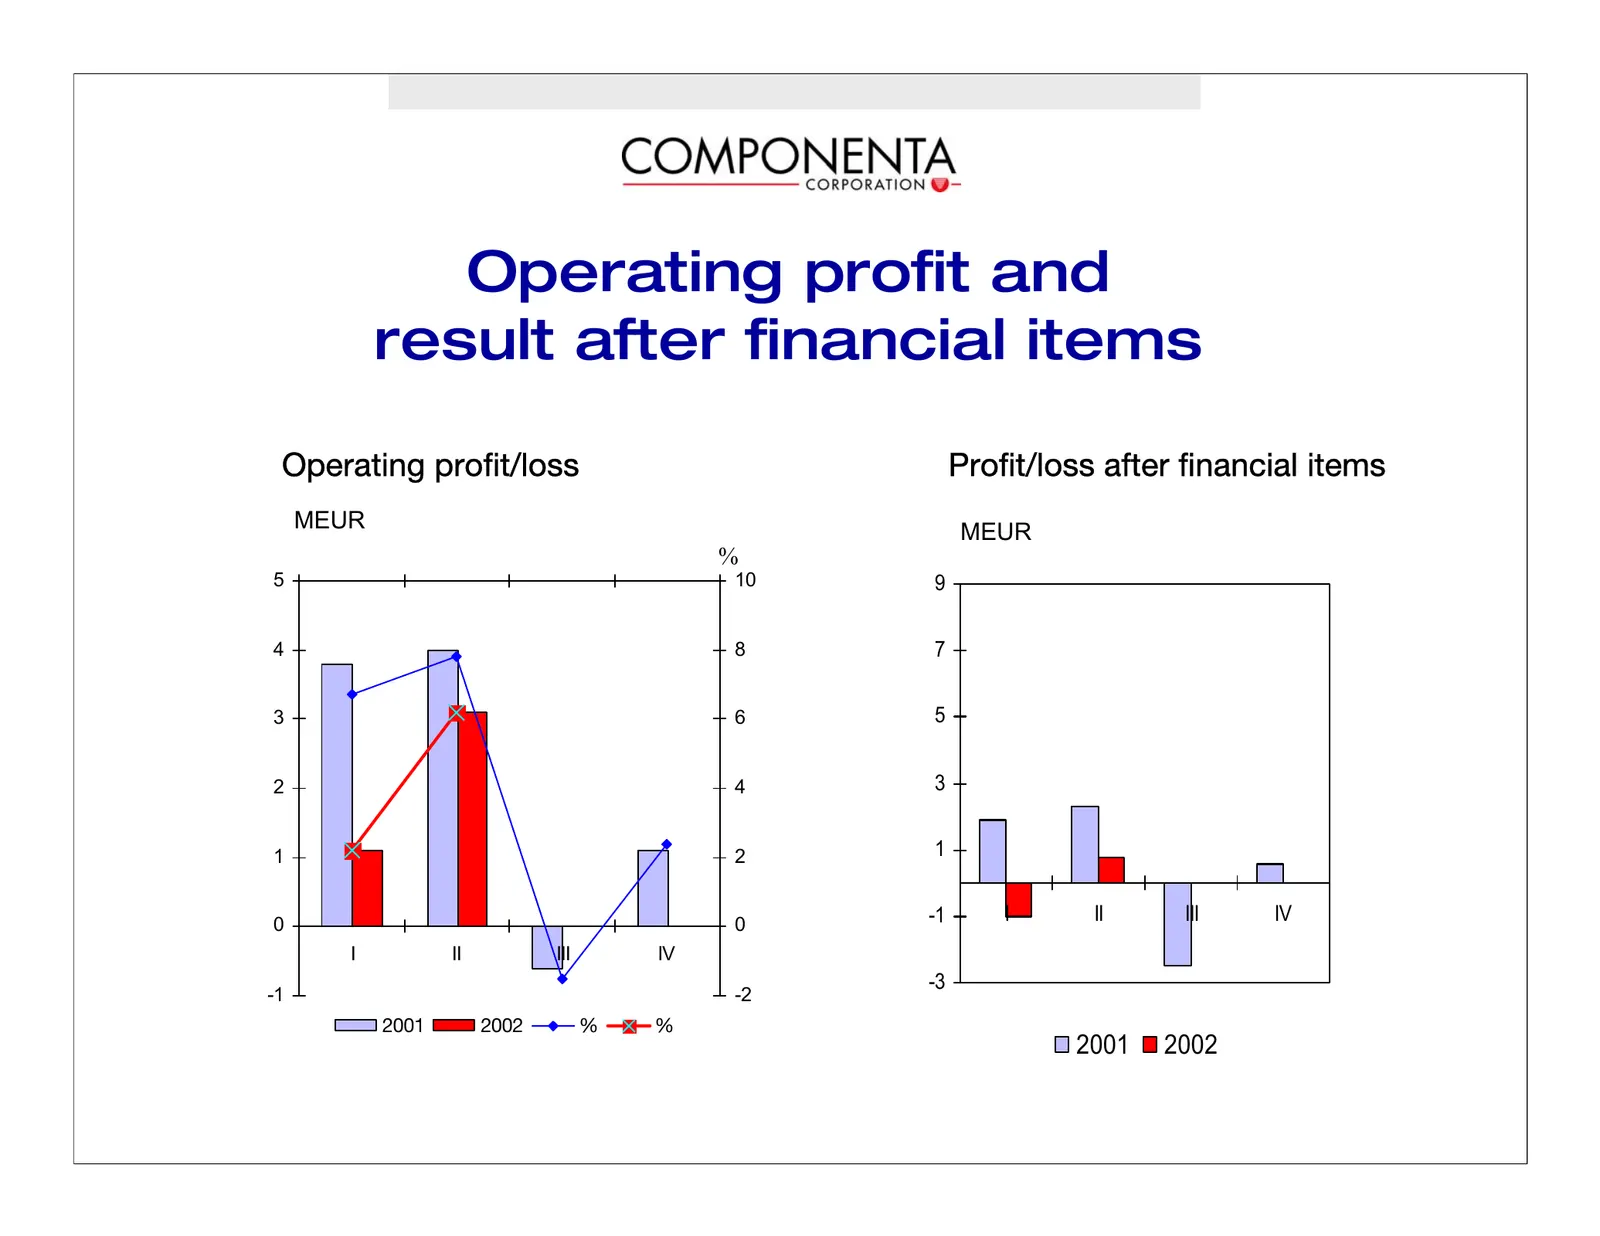
Slide 9: Operating profit and result after financial items
Operating profit and result after financial items léÉê~íáåÖ=éêçÑáíLäçëë mêçÑáíLäçëë=~ÑíÉê=Ñáå~åÅá~ä=áíÉãë MEUR MEUR I II III IV % 5 10 9 4 8 7 3 6 5 2 4 3 1 2 1 0 0 -1 I II III IV I II III IV -3 -1 -2 OMMN OMMO B B 2001 2002
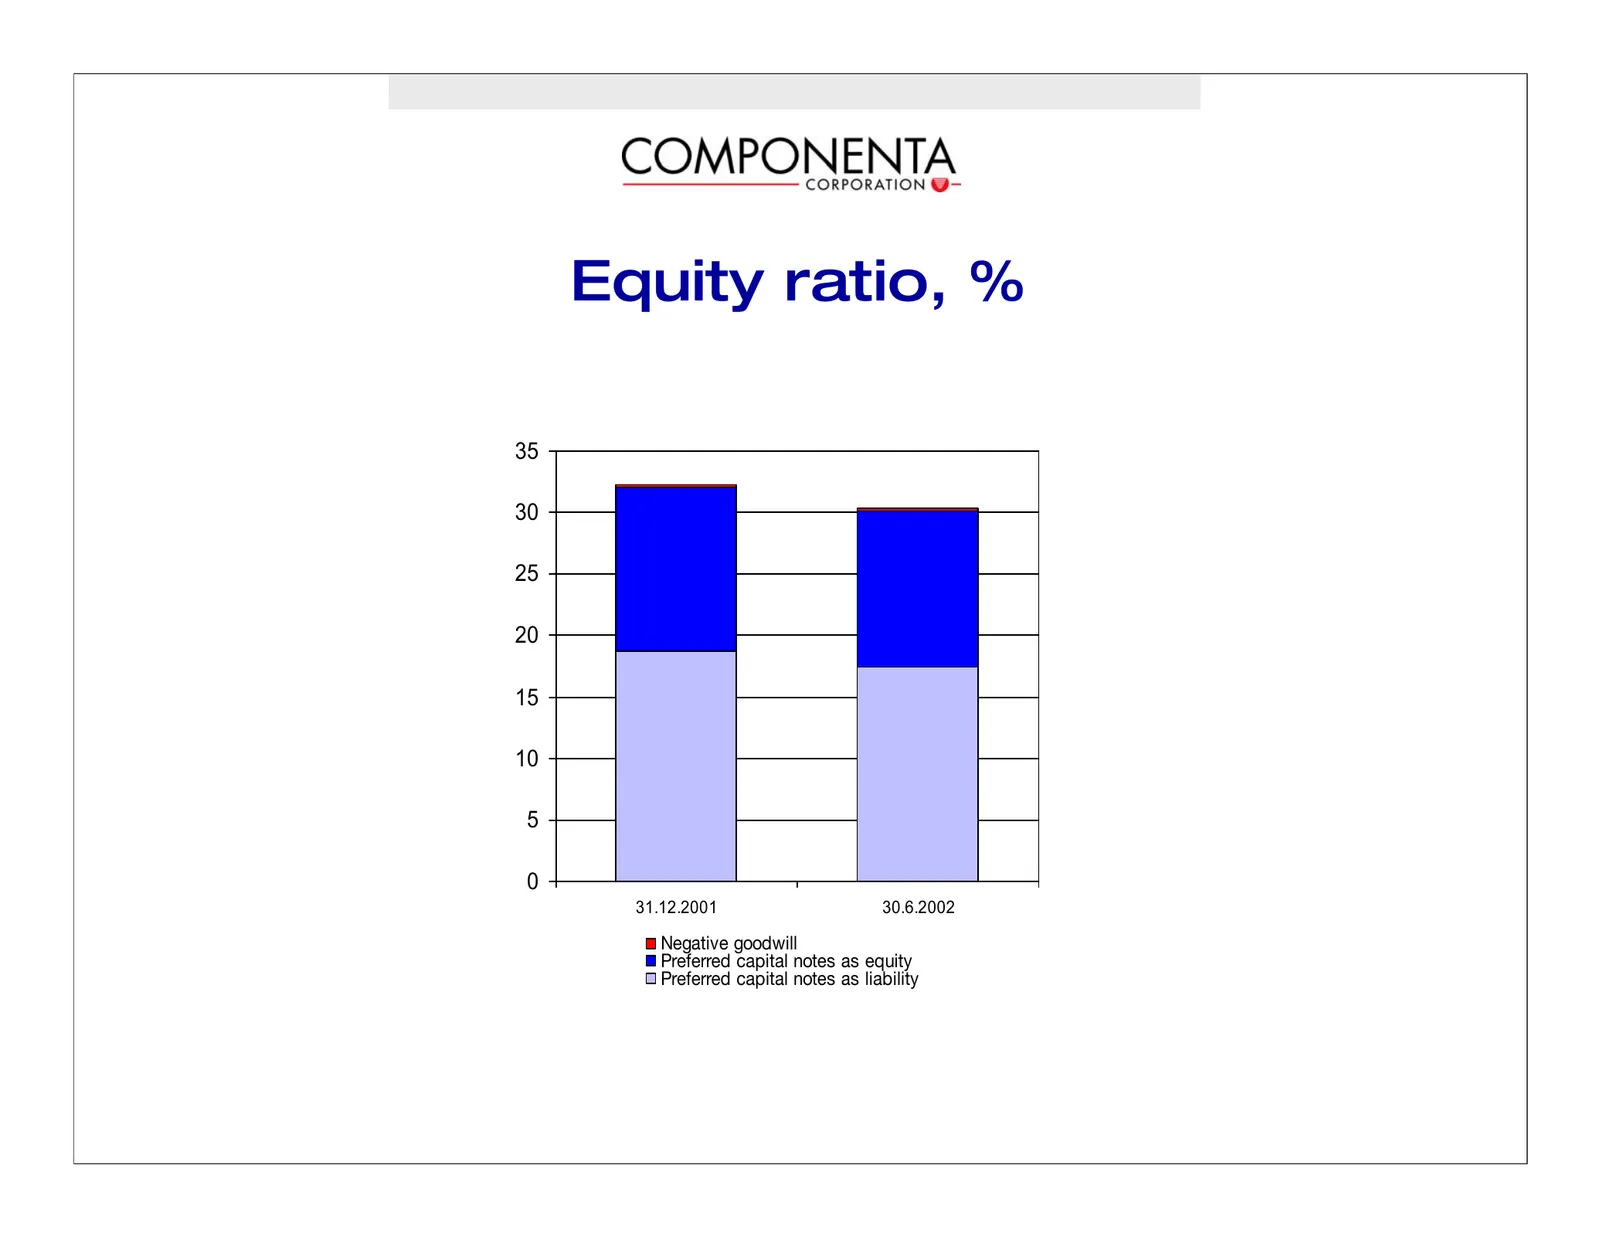
Slide 10: Equity ratio, %
Equity ratio, % 35 30 25 20 15 10 5 0 31.12.2001 30.6.2002 kÉÖ~íáîÉ=ÖççÇïáää mêÉÑÉêêÉÇ=Å~éáí~ä=åçíÉë=~ë=Éèìáíó mêÉÑÉêêÉÇ=Å~éáí~ä=åçíÉë=~ë=äá~Äáäáíó
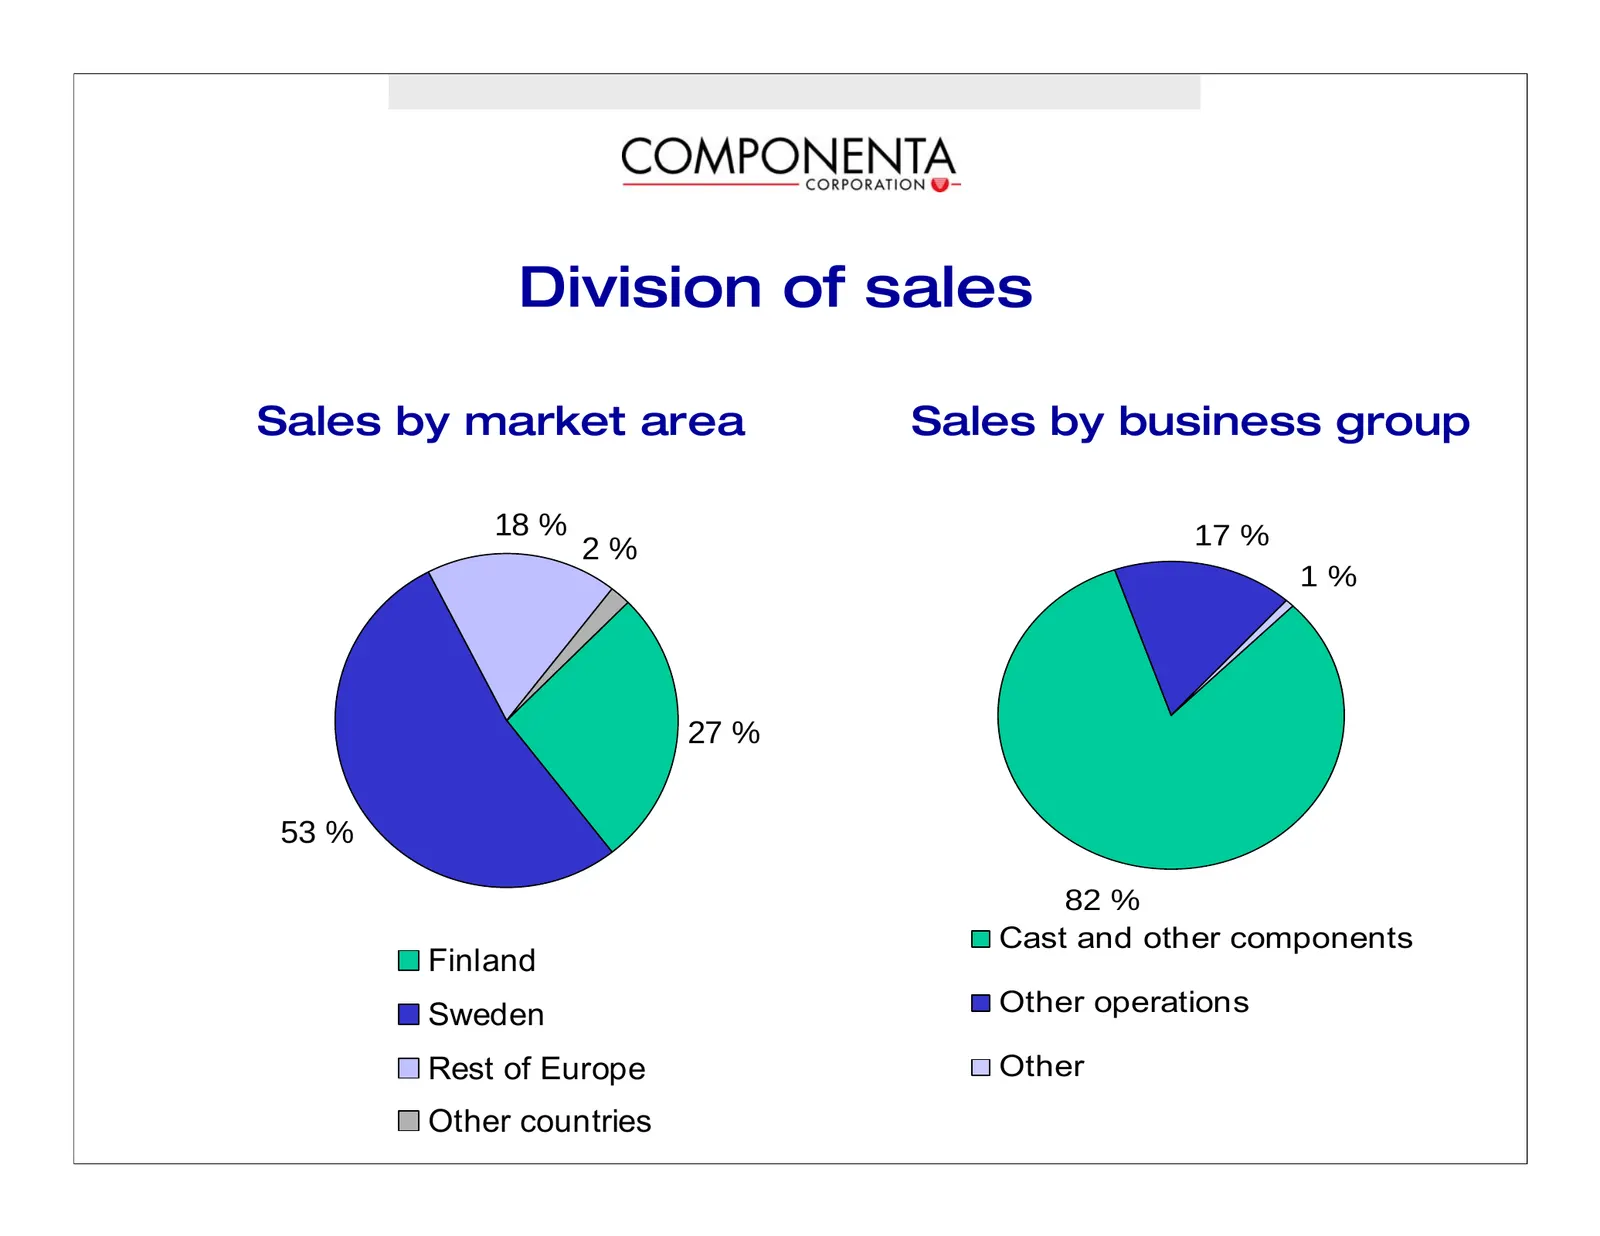
Slide 11: Division of sales
Division of sales Sales by market area Sales by business group 18 % 17 % 2% 1% 27 % 53 % 82 % Cast and other components Finland Sweden Other operations Rest of Europe Other Other countries
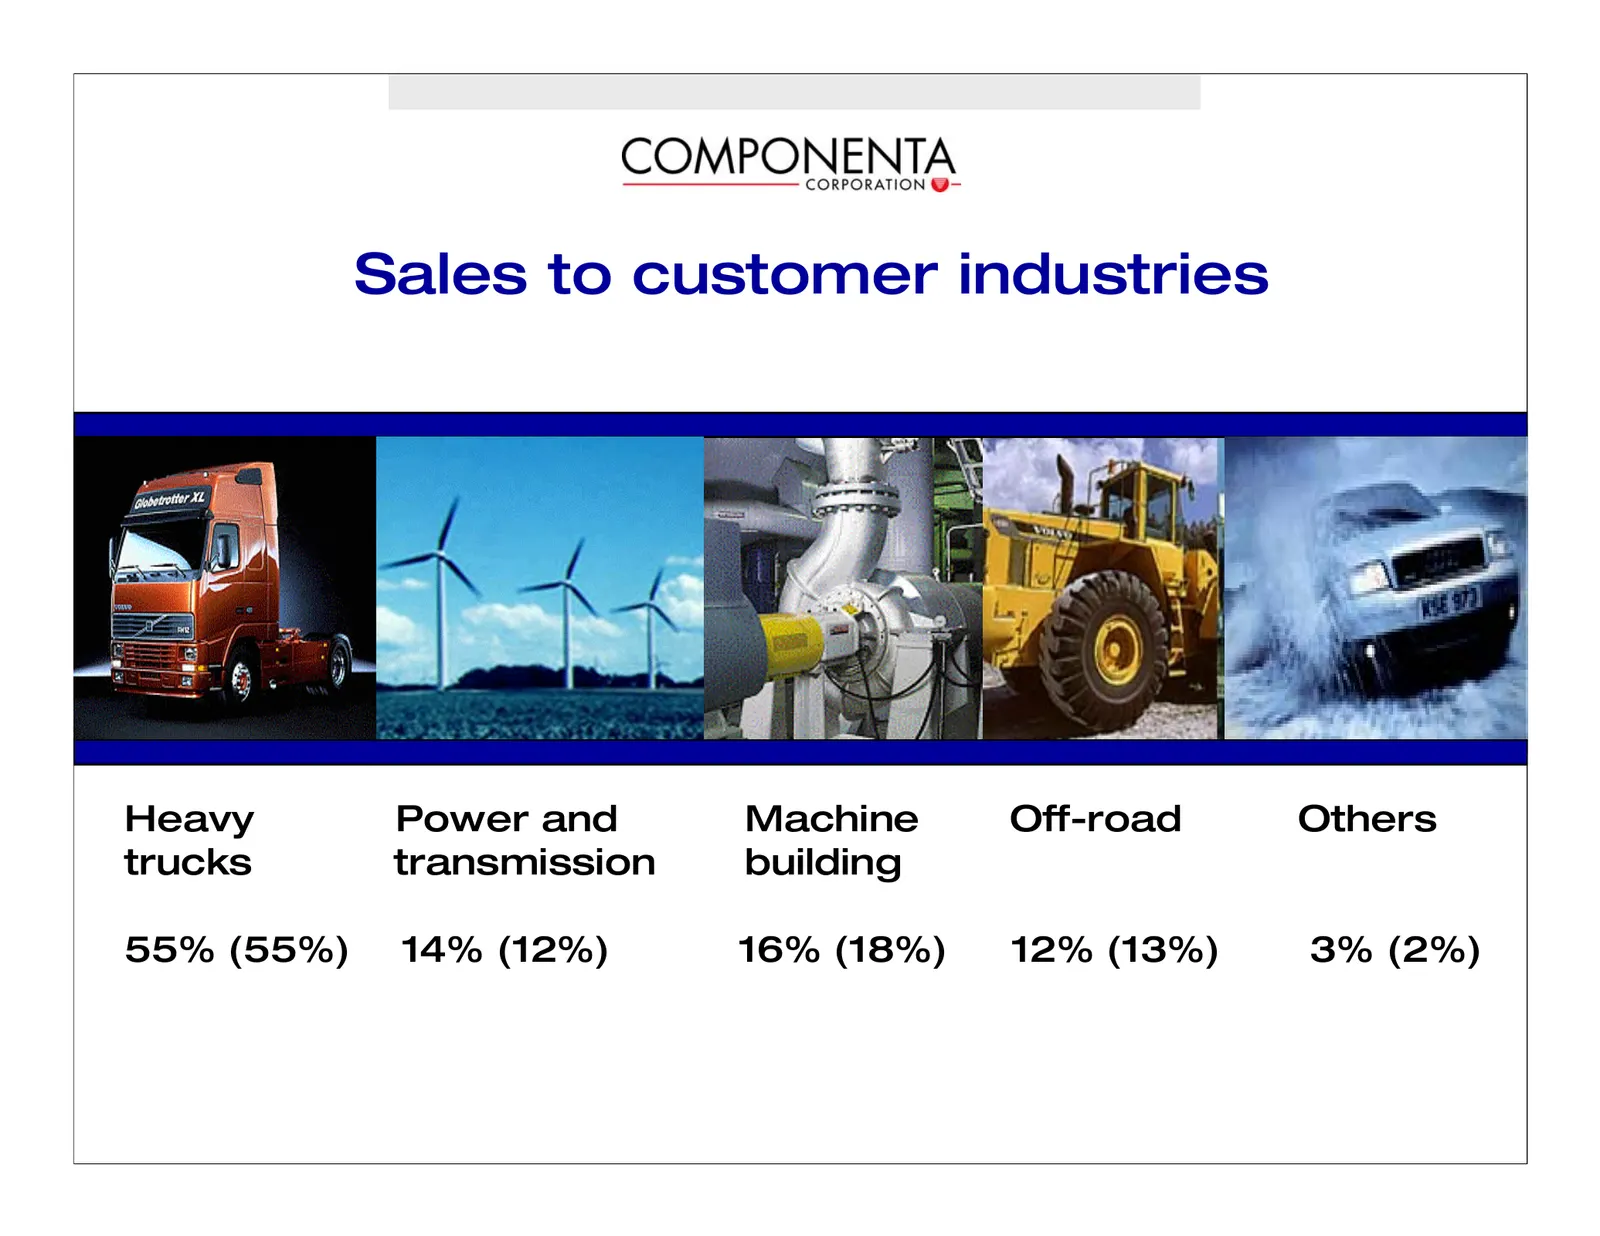
Slide 12: Sales to customer industries
Sales to customer industries Heavy Power and Machine Off-road Others trucks transmission building 55% (55%) 14% (12%) 16% (18%) 12% (13%) 3% (2%)
Slide 13: Cast and Other Components
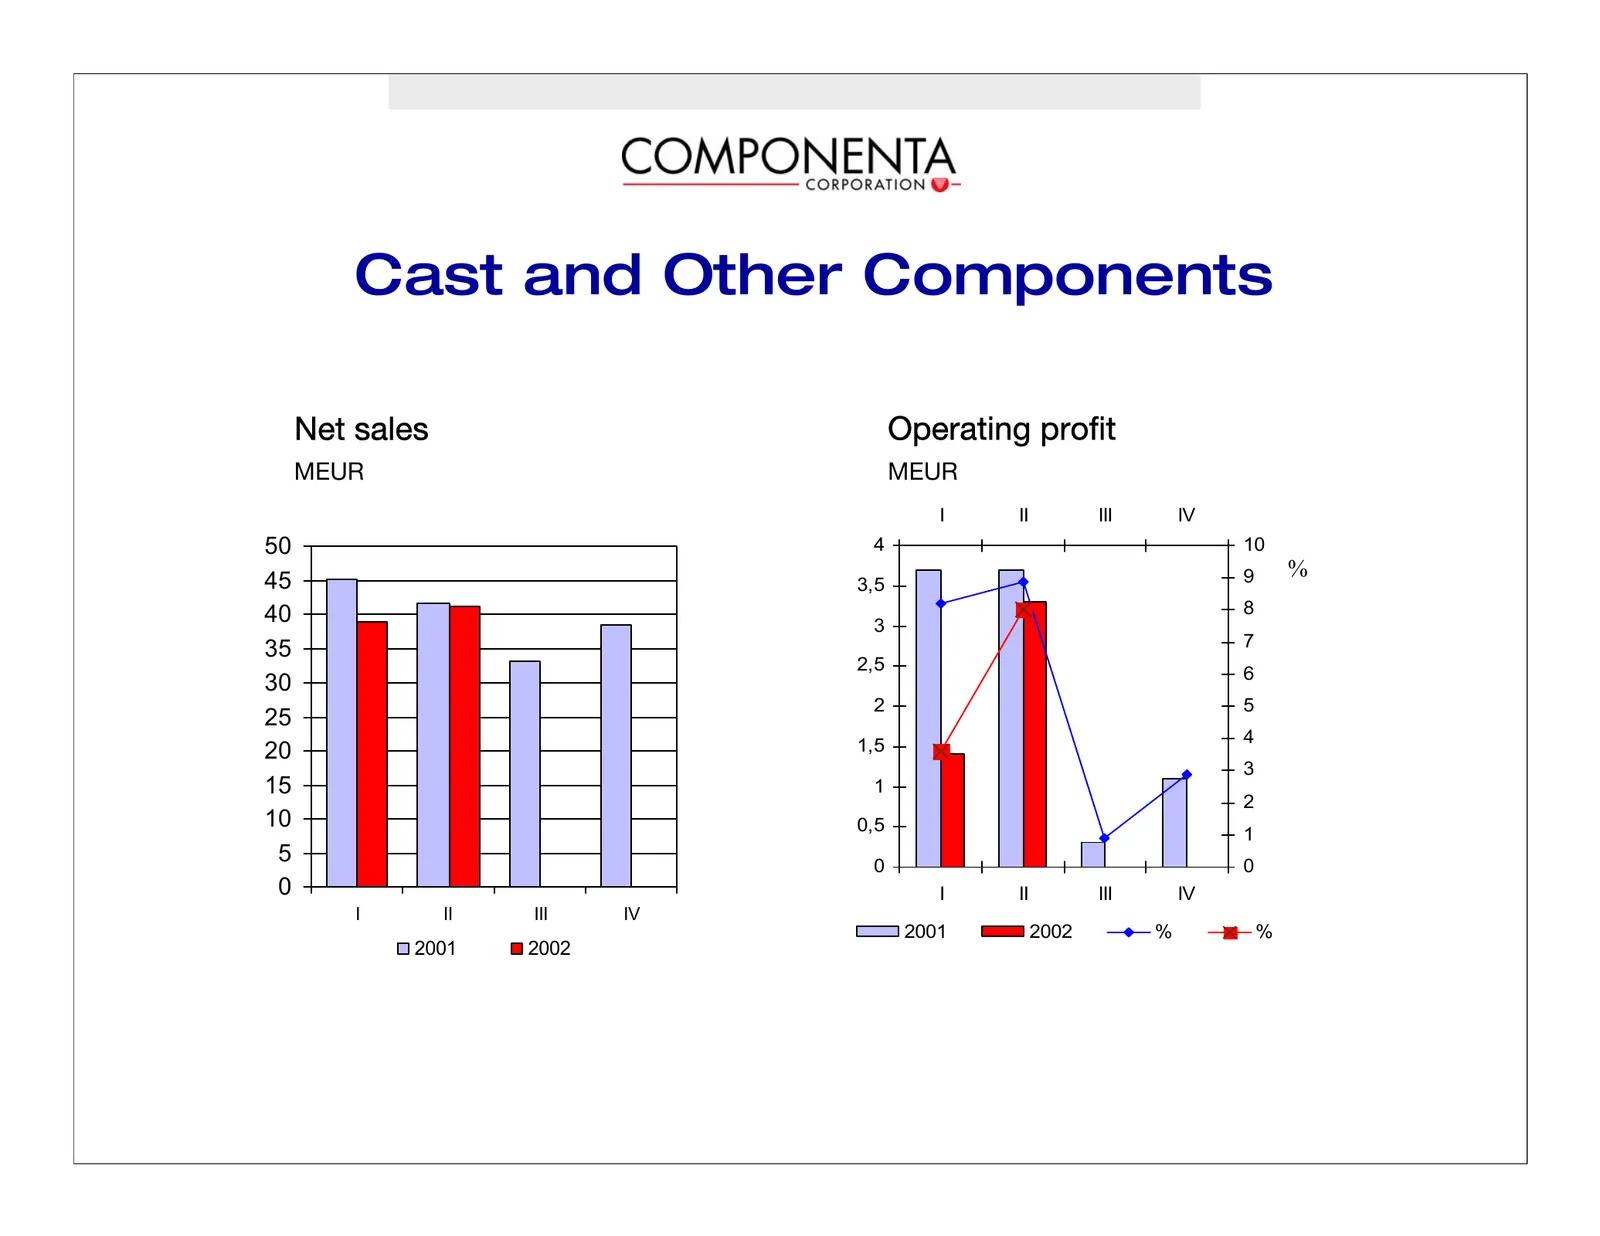
Cast and Other Components kÉí=ë~äÉë léÉê~íáåÖ=éêçÑáí jbro jbro I II III IV 50 4 10 9 % 45 3,5 40 8 3 35 7 2,5 6 30 2 5 25 1,5 4 20 3 15 1 2 10 0,5 1 5 0 0 0 I II III IV I II III IV 2001 2002 % % 2001 2002
Slide 14: Cast and Other Components
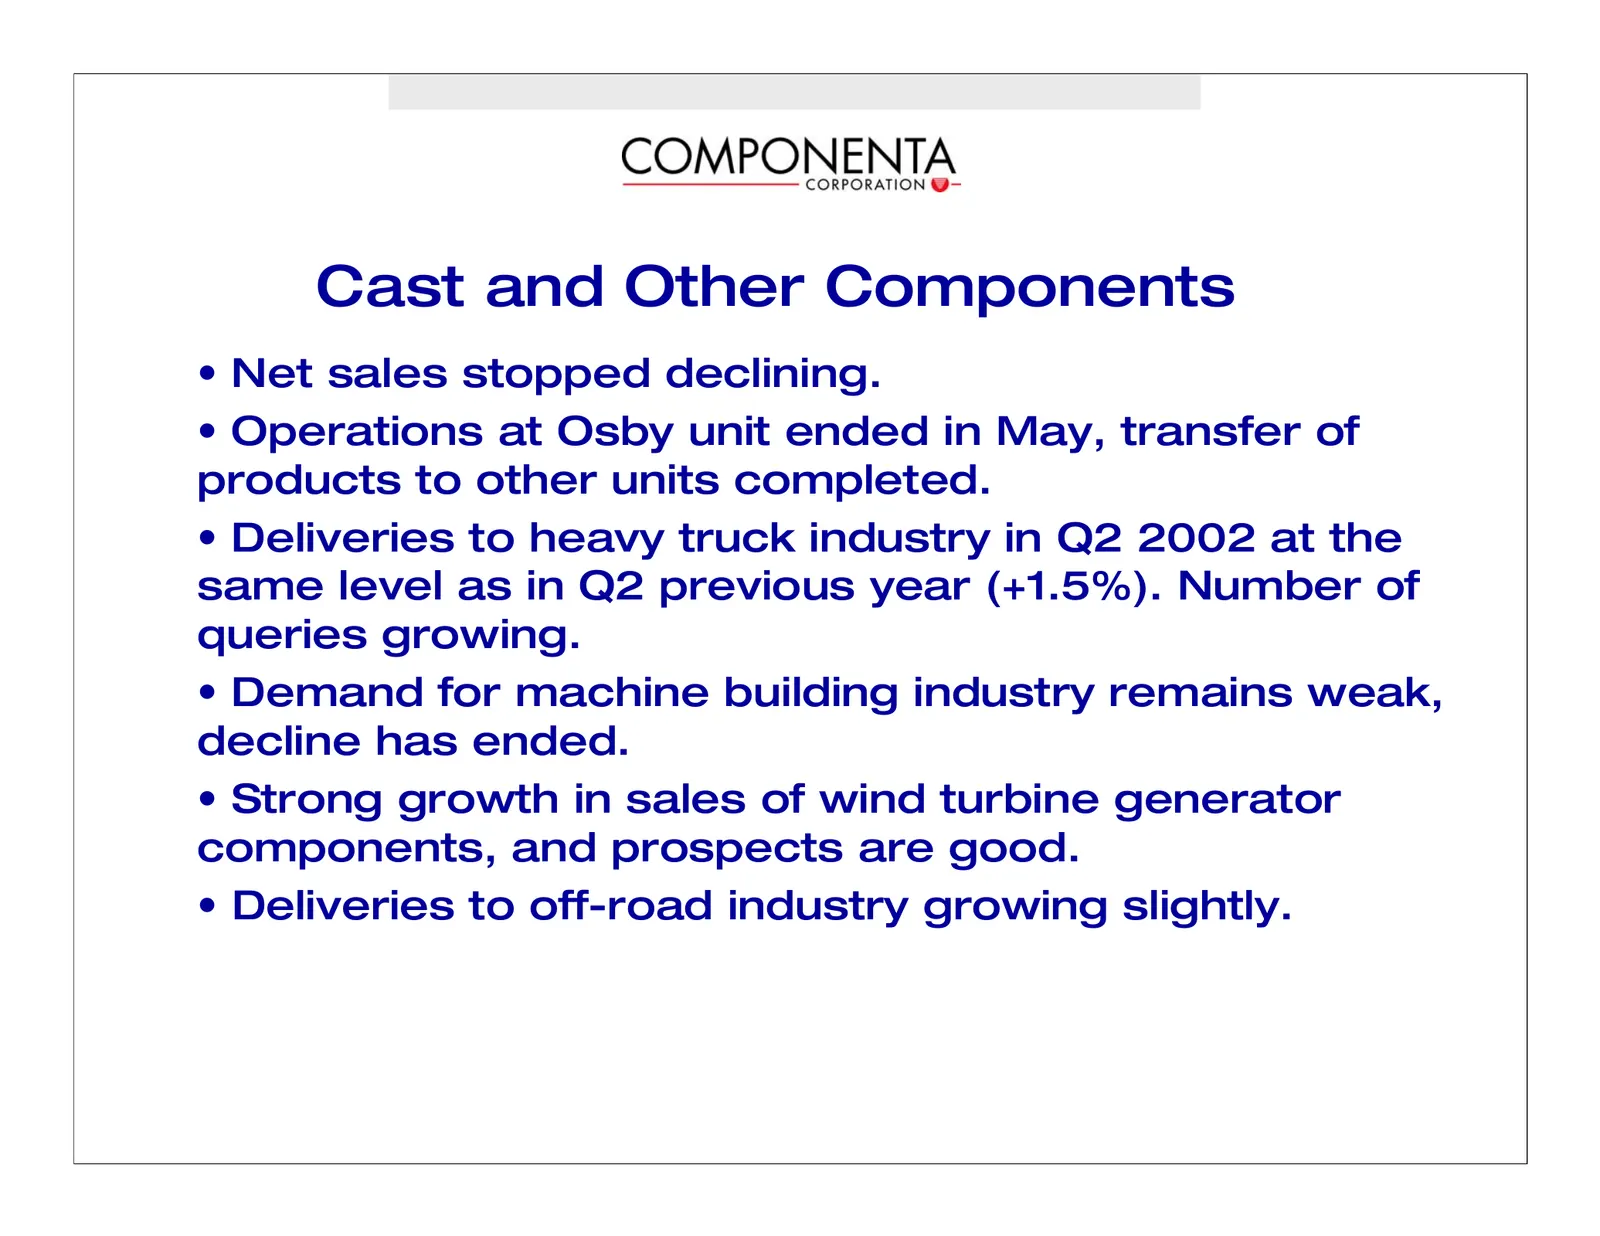
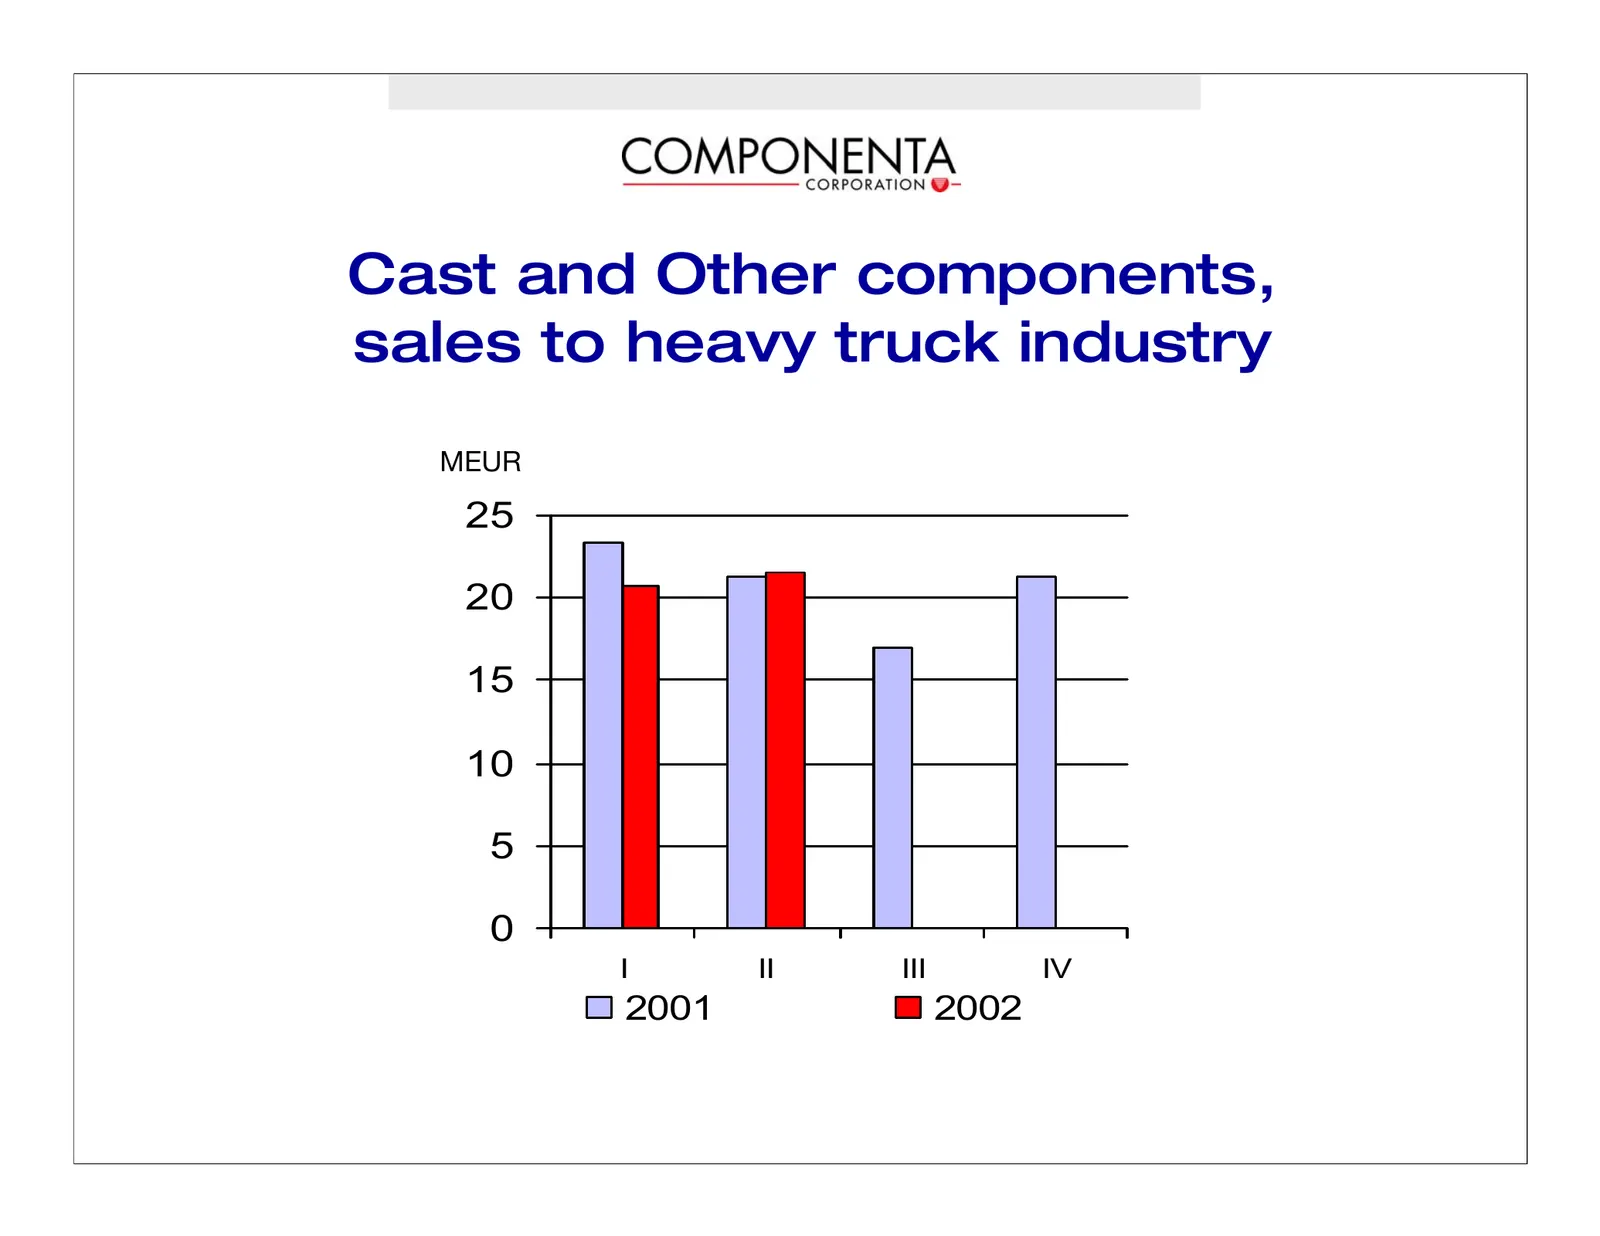
Cast and Other Components • Net sales stopped declining. • Operations at Osby unit ended in May, transfer of products to other units completed. • Deliveries to heavy truck industry in Q2 2002 at the same level as in Q2 previous year (+1.5%). Number of queries growing. • Demand for machine building i
Slide 15: Components, sales to heavy truck industry
Cast and Other components, sales to heavy truck industry jbro 25 20 15 10 5 0 I II III IV 2001 2002
Slide 16: Components, sales to power and transmission industries
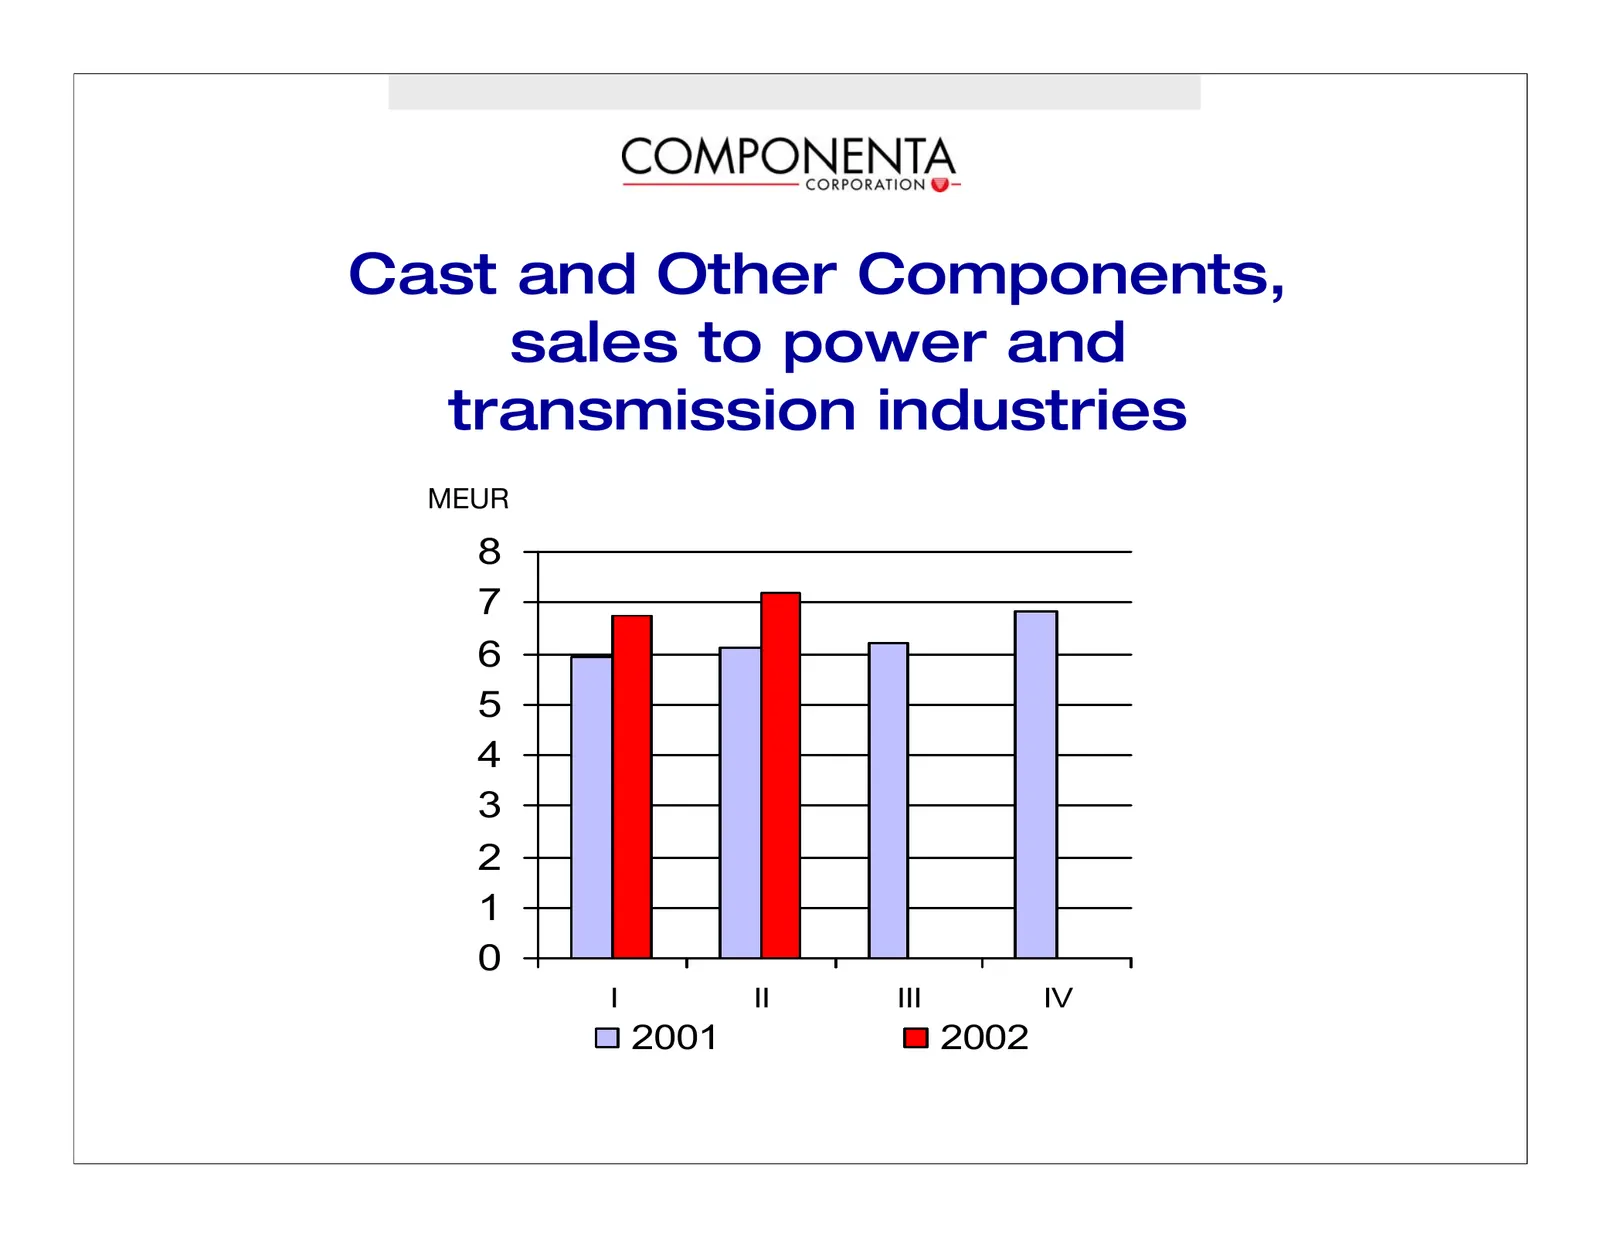
Cast and Other Components, sales to power and transmission industries jbro= 8 7 6 5 4 3 2 1 0 I II III IV 2001 2002
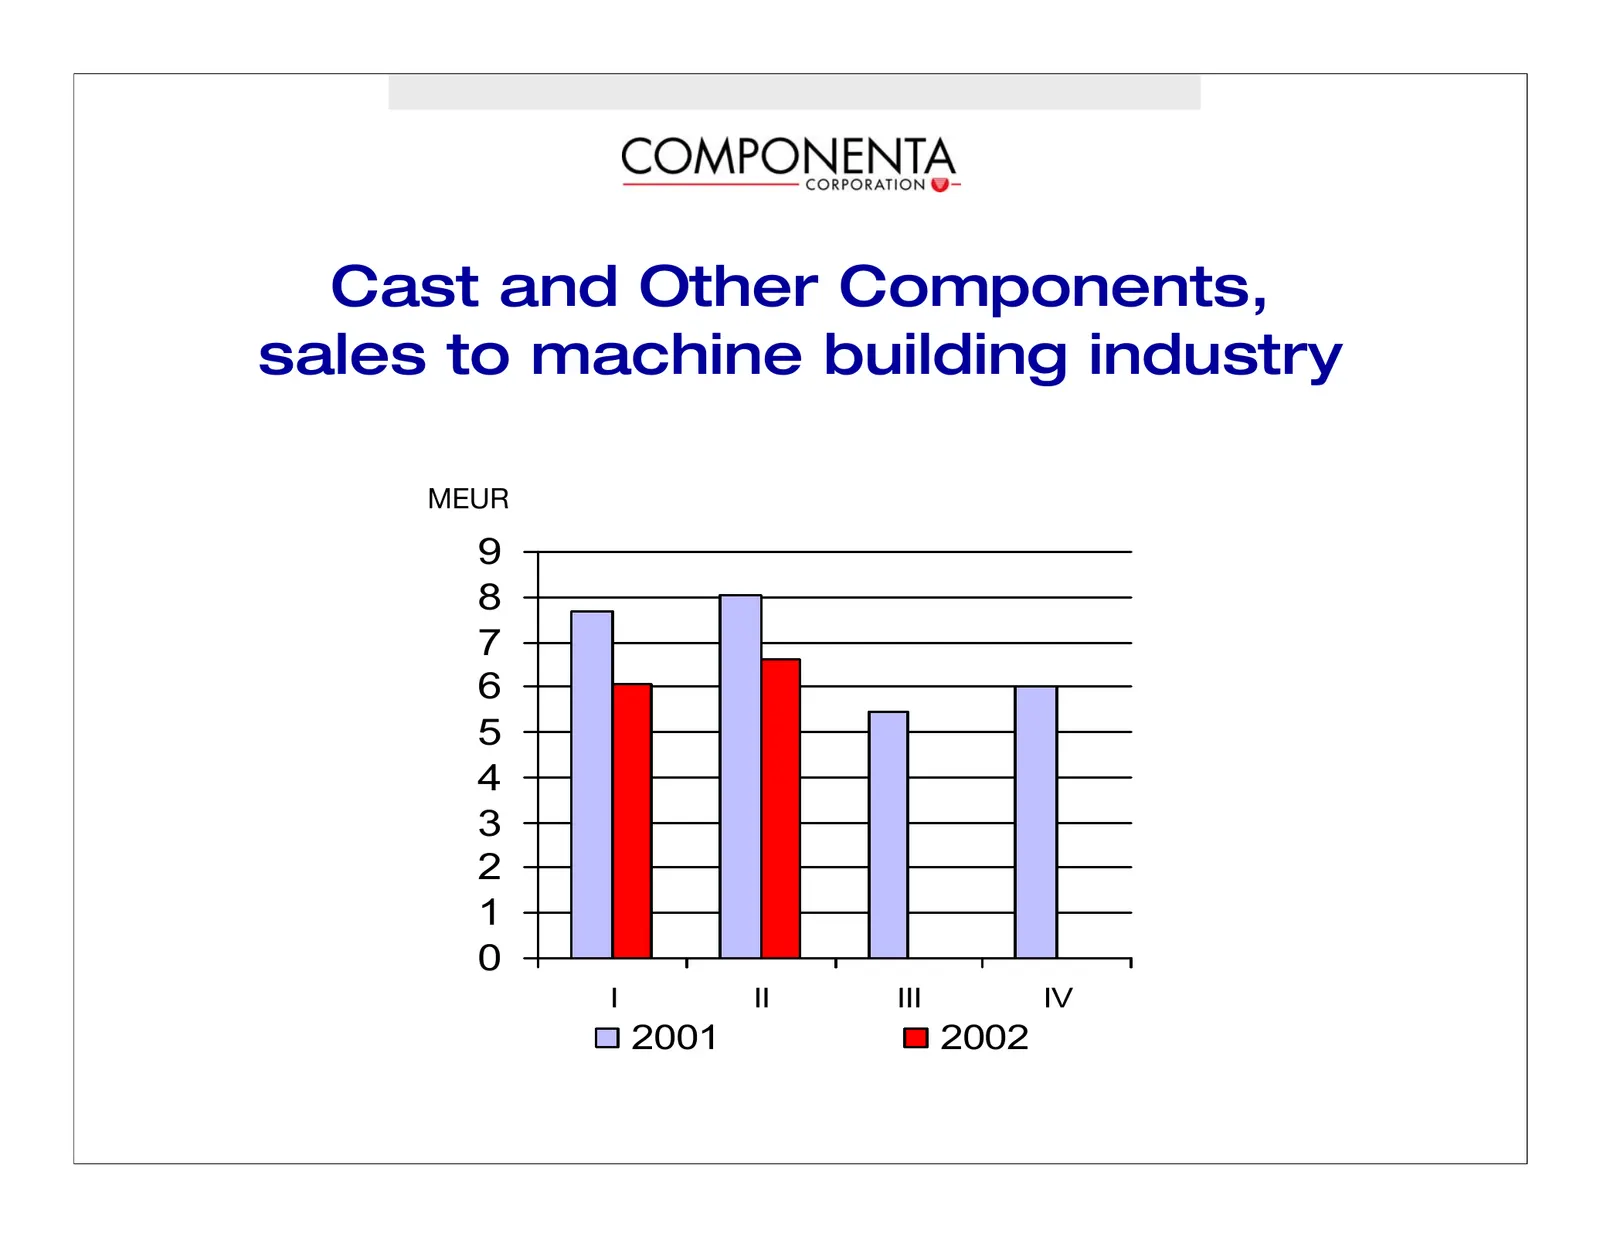
Slide 17: Components, sales to machine building industry
Cast and Other Components, sales to machine building industry jbro= 9 8 7 6 5 4 3 2 1 0 I II III IV 2001 2002
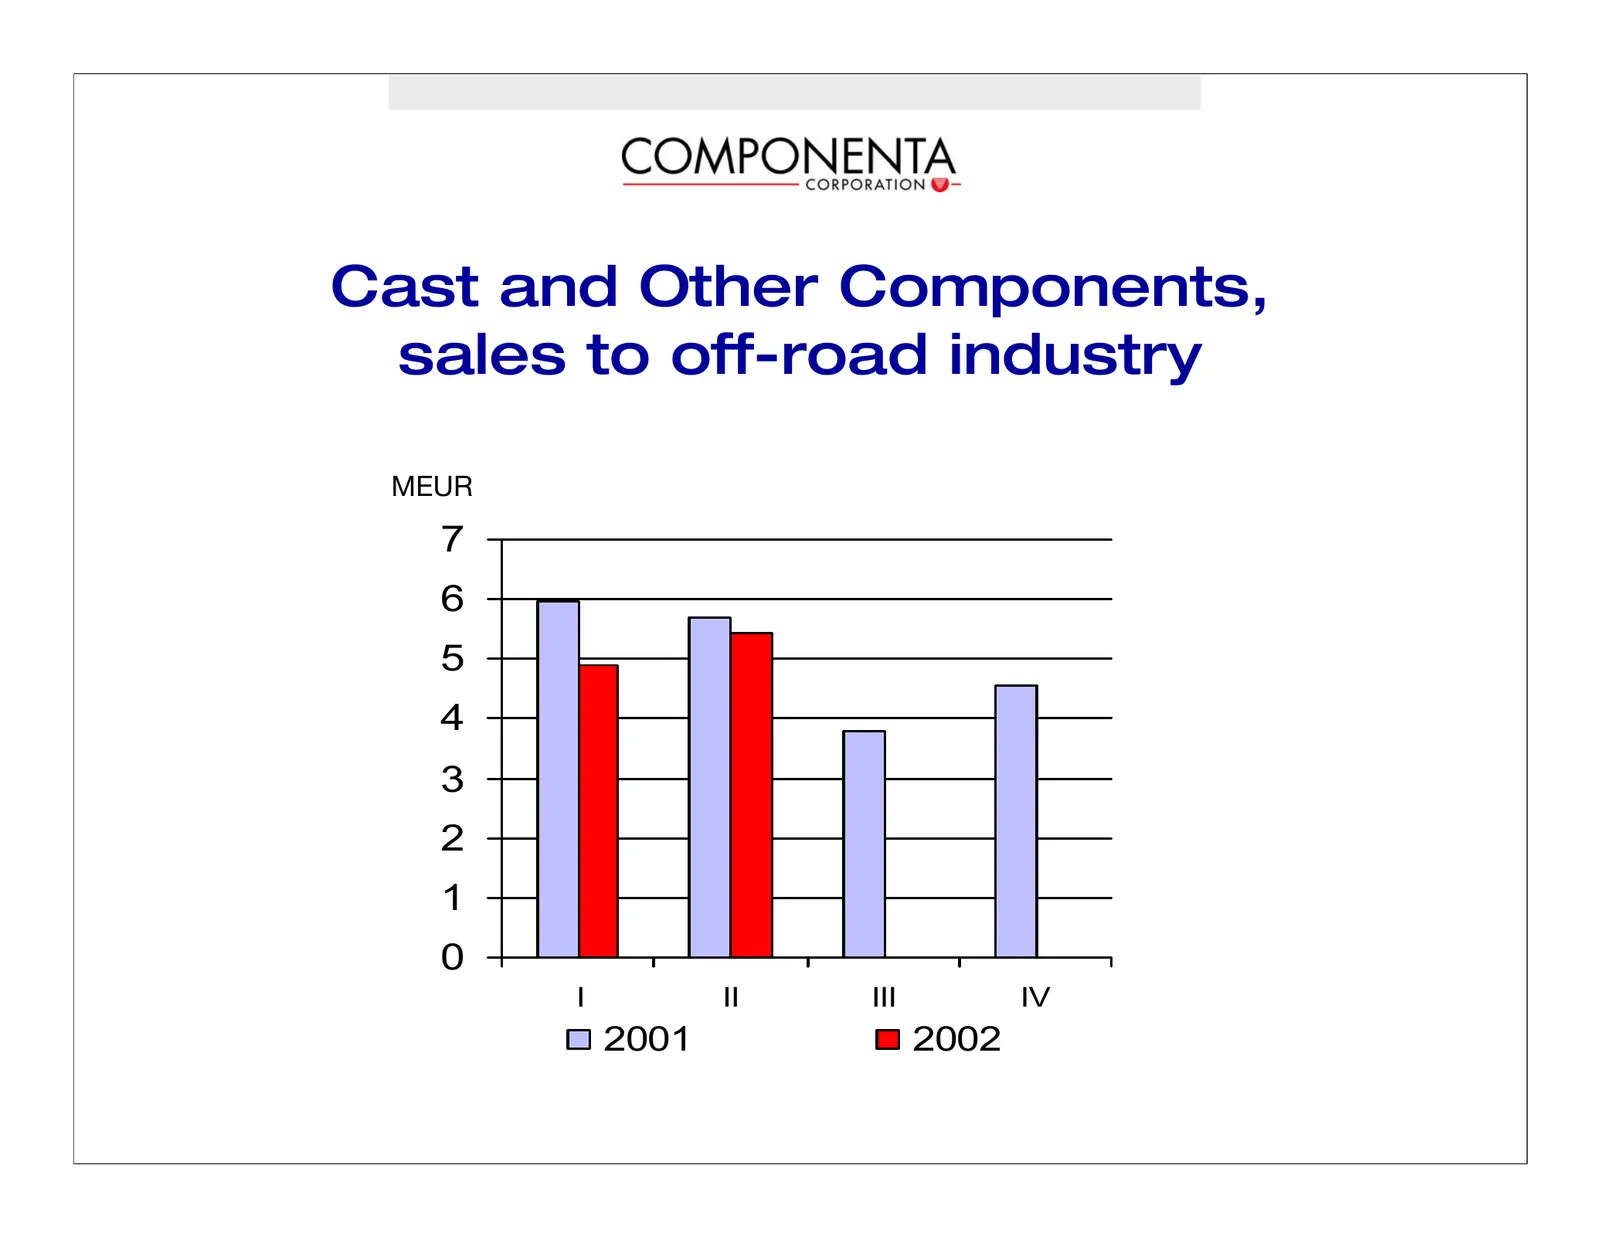
Slide 18: Components, sales to off-road industry
Cast and Other Components, sales to off-road industry jbro= 7 6 5 4 3 2 1 0 I II III IV 2001 2002
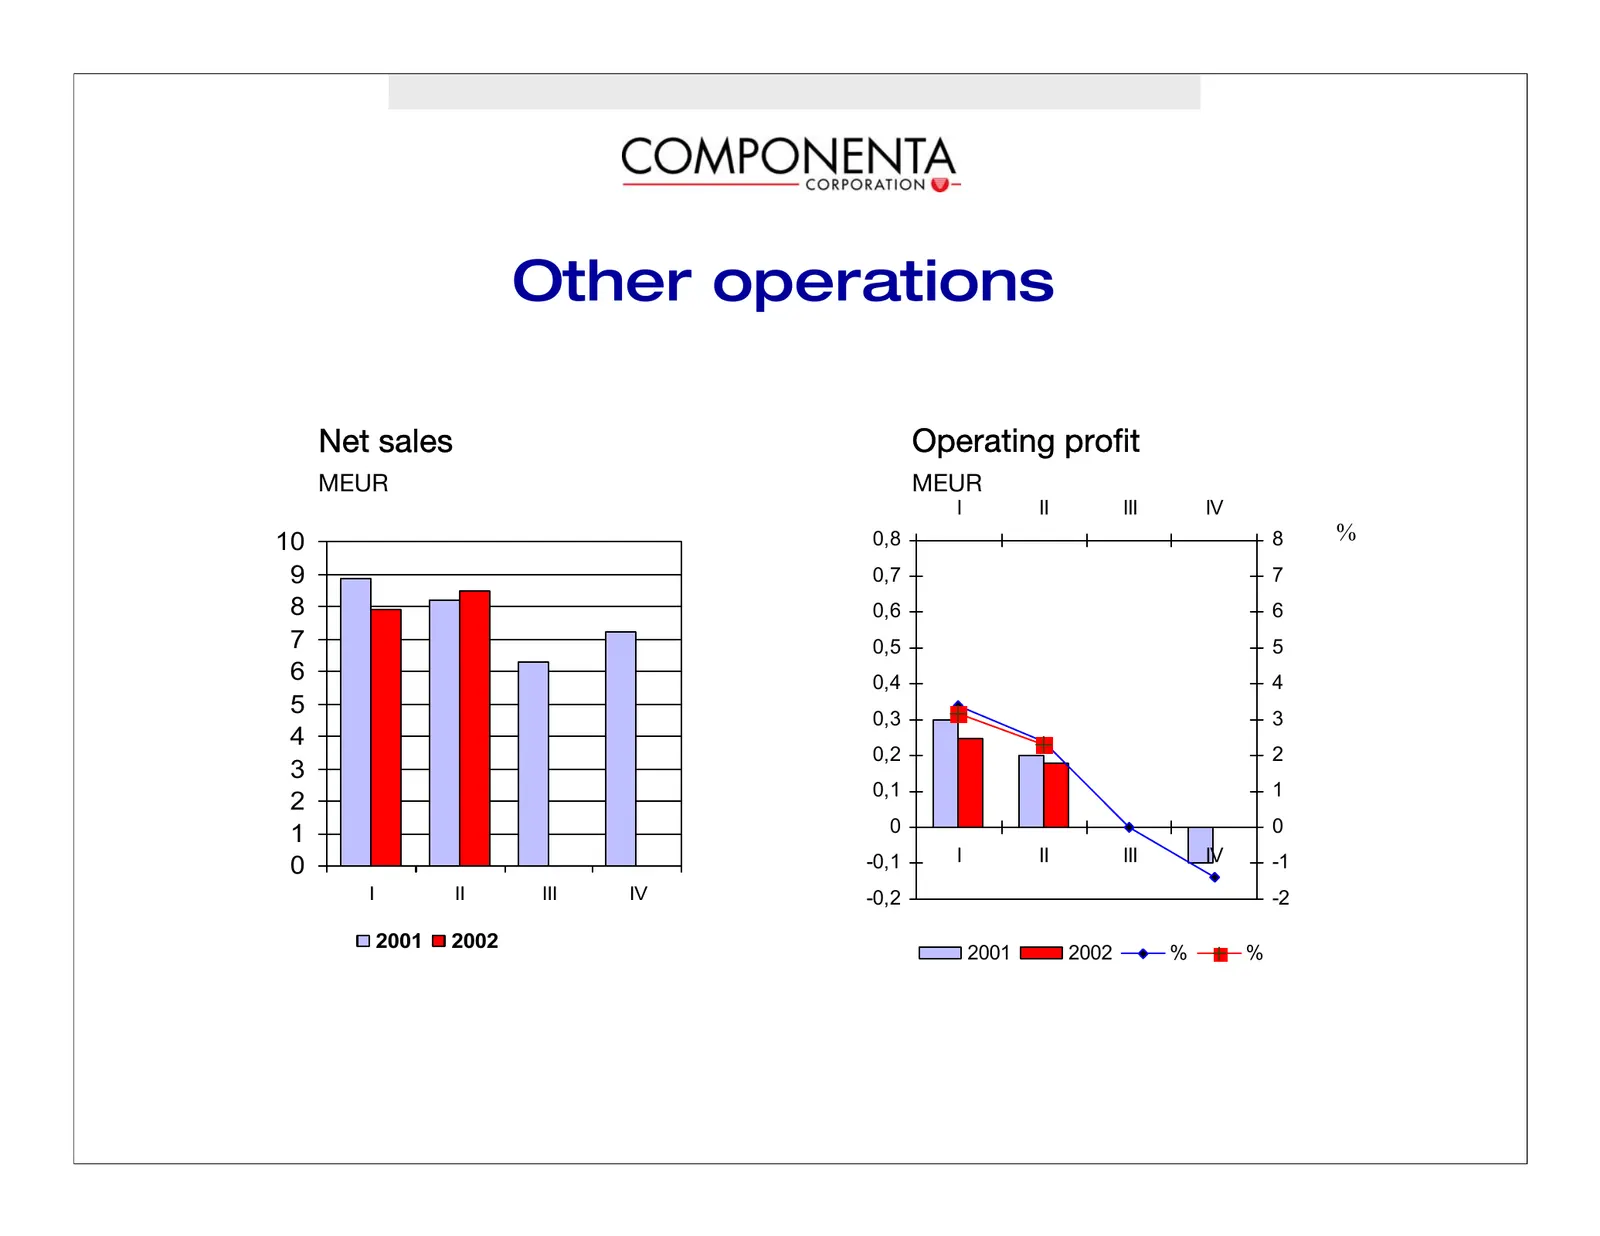
Slide 19: Other operations
Other operations kÉí=ë~äÉë léÉê~íáåÖ=éêçÑáí jbro jbro I II III IV 10 0,8 8 % 9 0,7 7 8 0,6 6 7 0,5 5 6 0,4 4 5 0,3 3 4 0,2 2 3 0,1 1 2 1 0 0 -0,1 I II III IV -1 0 I II III IV -0,2 -2 2001 2002 2001 2002 % %
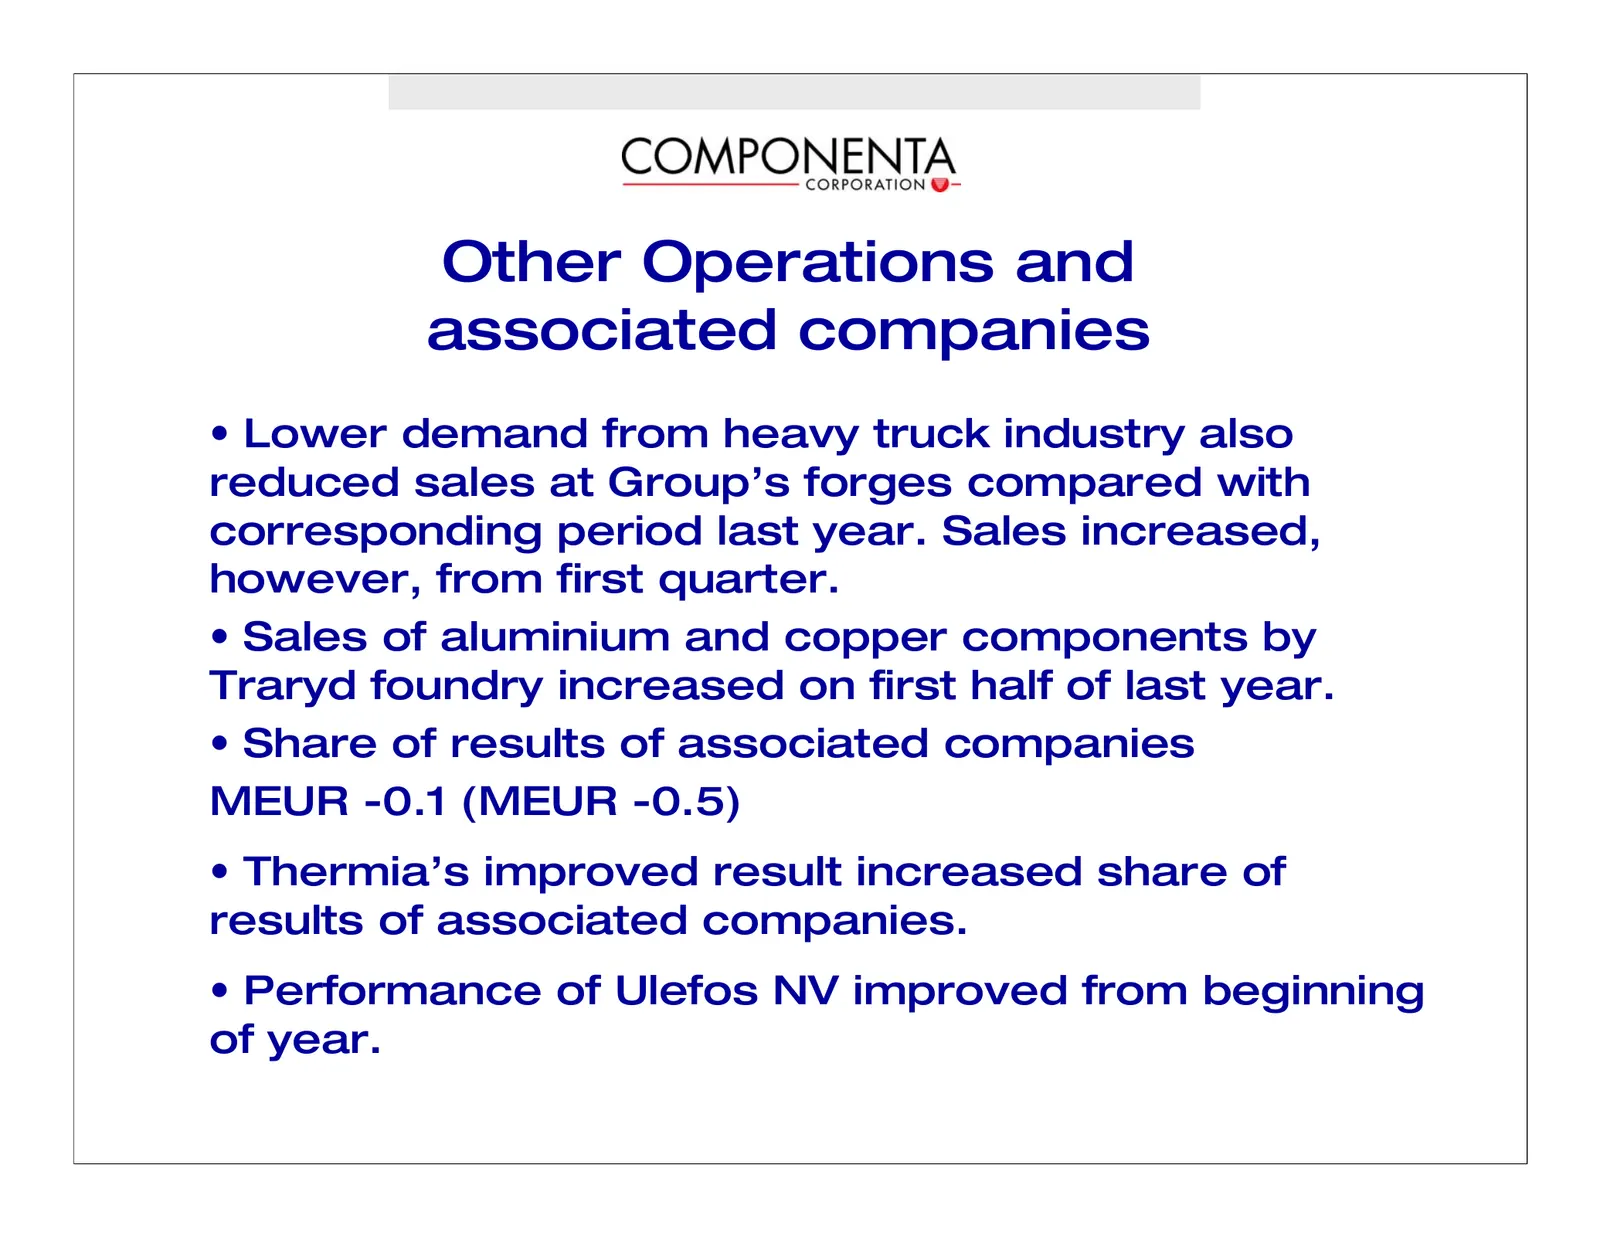
Slide 20: Other Operations and associated companies
Other Operations and associated companies • Lower demand from heavy truck industry also reduced sales at Group’s forges compared with corresponding period last year. Sales increased, however, from first quarter. • Sales of aluminium and copper components by Traryd foundry increased on first half of
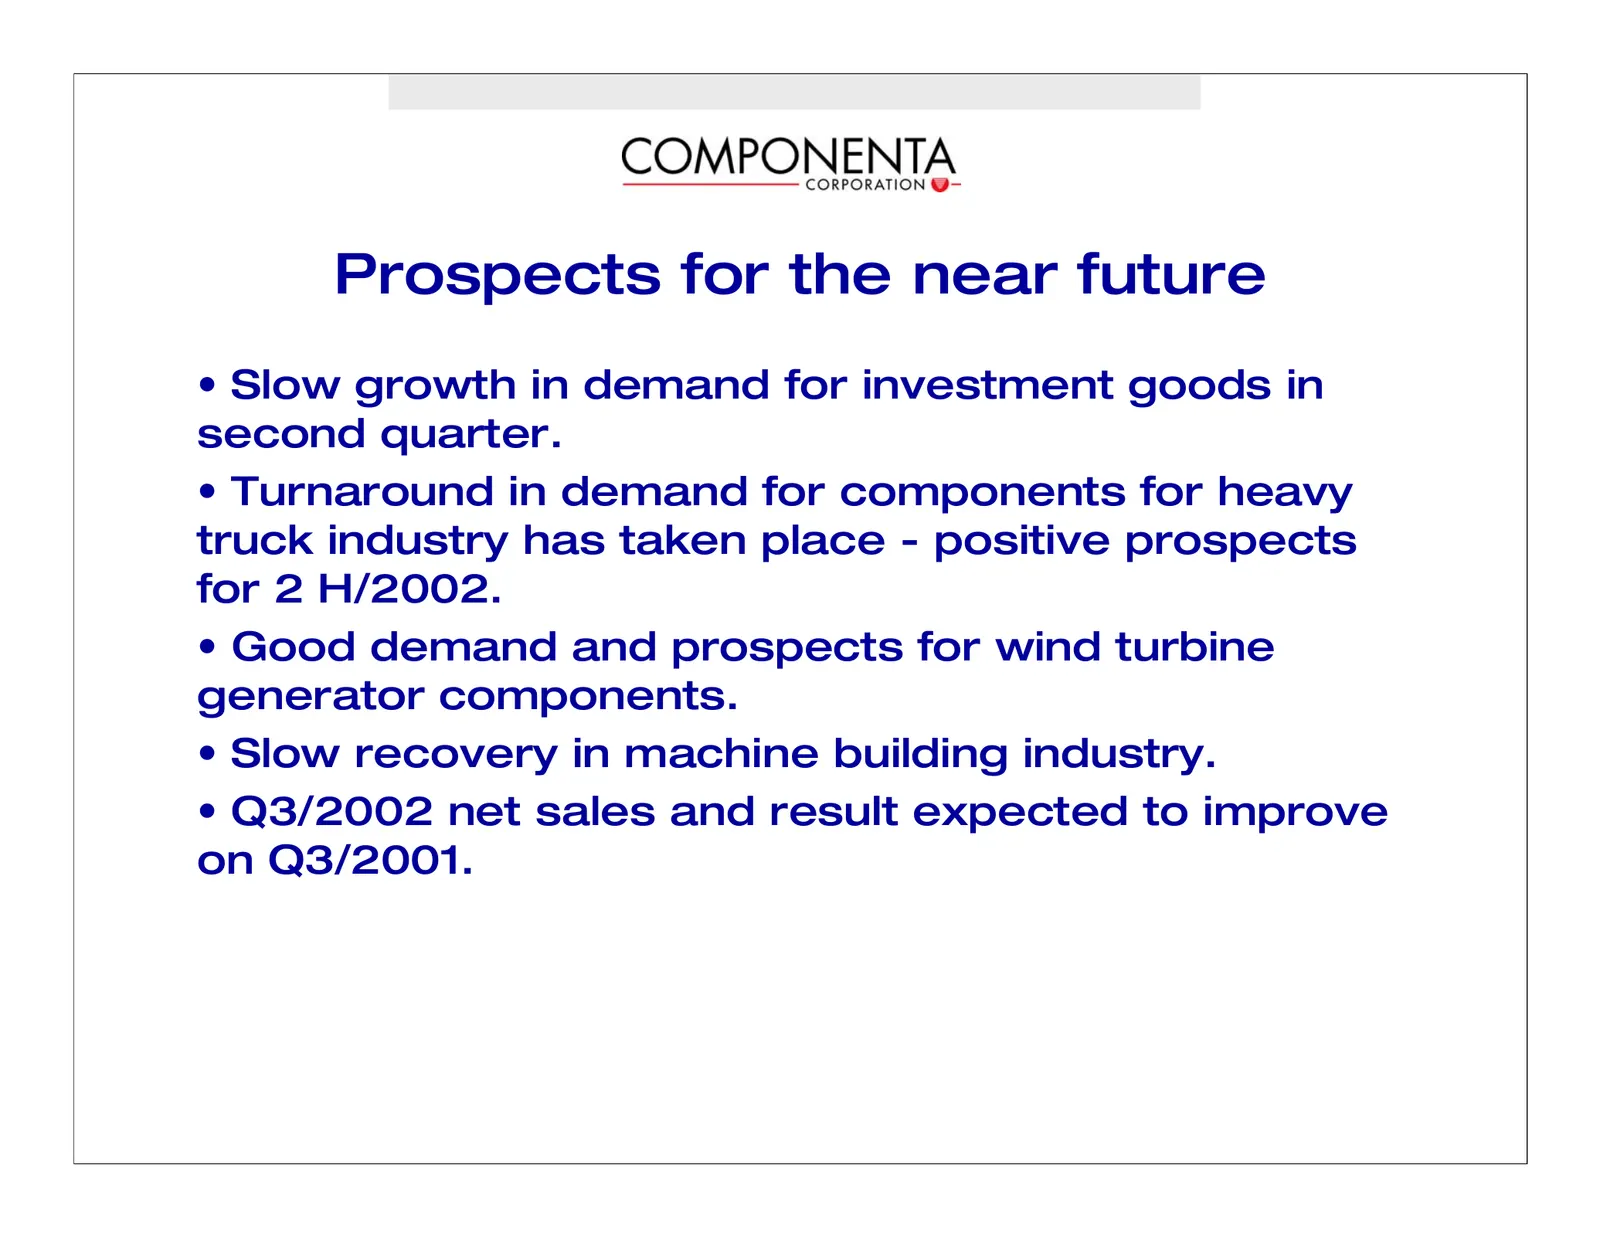
Slide 21: Prospects for the near future
Prospects for the near future • Slow growth in demand for investment goods in second quarter. • Turnaround in demand for components for heavy truck industry has taken place - positive prospects for 2 H/2002. • Good demand and prospects for wind turbine generator components. • Slow recovery in machin
Source: Internet Archive copy of componenta.com
More decks from Componenta Oyj
 H1 2026 Earnings Presentation11 slides · Jul 23, 2026
 Q1 2026 Earnings Presentation10 slides · May 8, 2026
 FY2025 Earnings Presentation11 slides · Mar 6, 2026
 Q3 2025 Earnings Presentation12 slides · Oct 30, 2025
 H1 2025 Earnings Presentation12 slides · Jul 23, 2025
 Q1 2025 Earnings Presentation11 slides · May 9, 2025