Extended Stay America — Q1 2019 Earnings Presentation
15 slides from Extended Stay America's earnings presentation, May 1, 2019
Slide 1: Q1 2019 Earnings Summary
Q1 2019 Earnings Summary May 1, 2019 Extended Stay America, Inc. ESH Hospitality, Inc.
Slide 2: Important Disclosure Information
important disclosure information This presentation contains forward-looking statements within the meaning of the federal securities laws. These statements include, but are not limited to, statements related to our expectations regarding our business performance, financial results, liquidity and capi
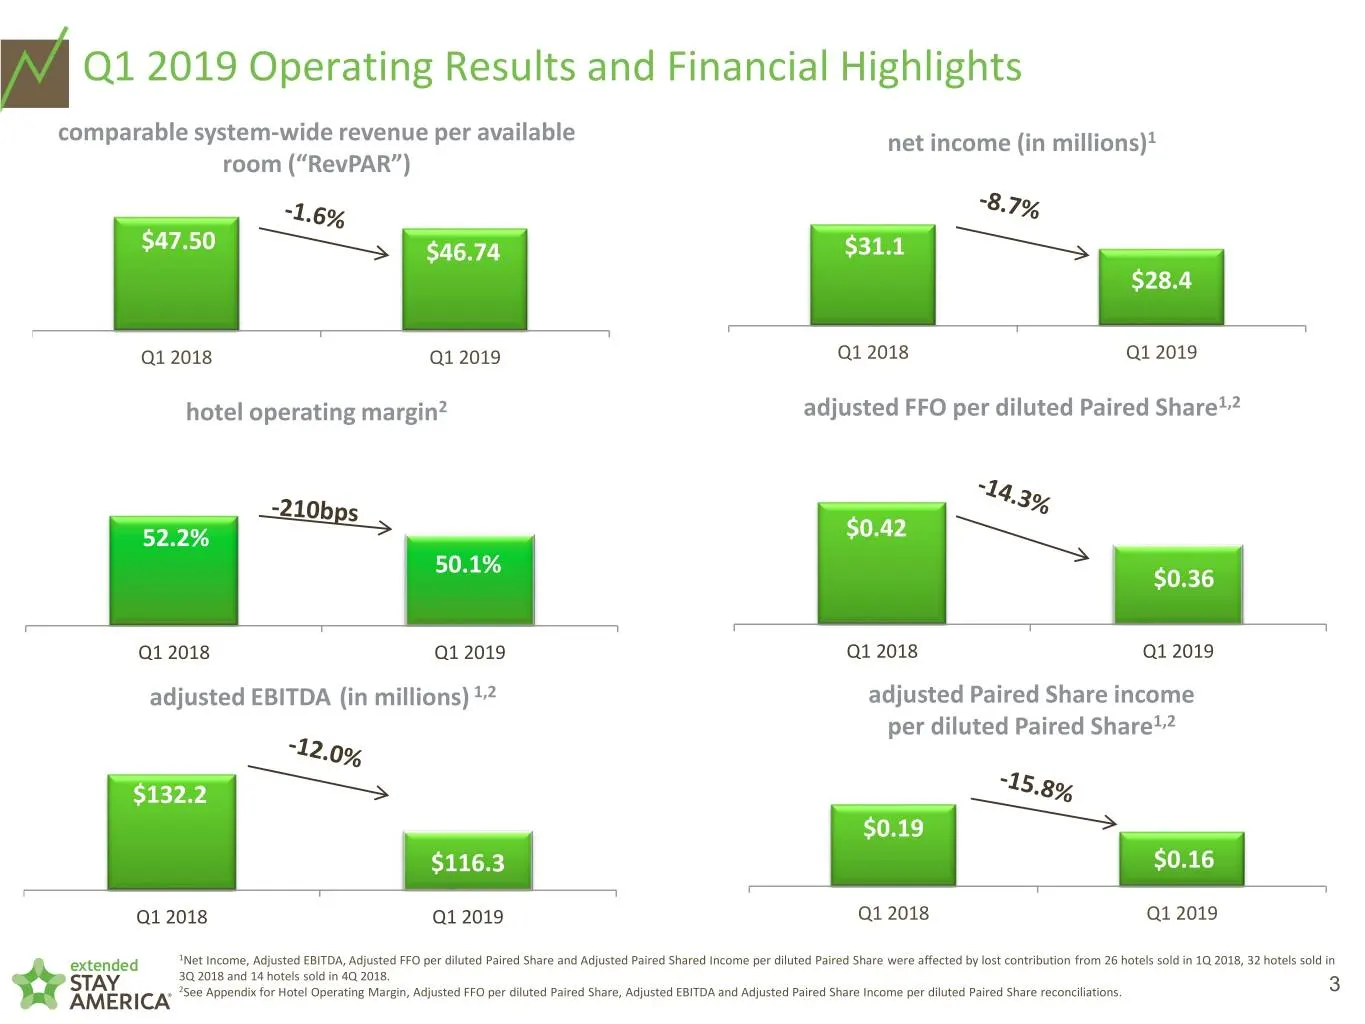
Slide 3: Q1 2019 Operating Results and Financial Highlights
Q1 2019 Operating Results and Financial Highlights comparable system-wide revenue per available net income (in millions)1 room (“RevPAR”) $47.50 $46.74 $31.1 $28.4 Q1 2018 Q1 2019 Q1 2018 Q1 2019 hotel operating margin2 adjusted FFO per diluted Paired Share1,2 52.2% $0.42 50.1% $0.36 Q1 2018 Q1 2019
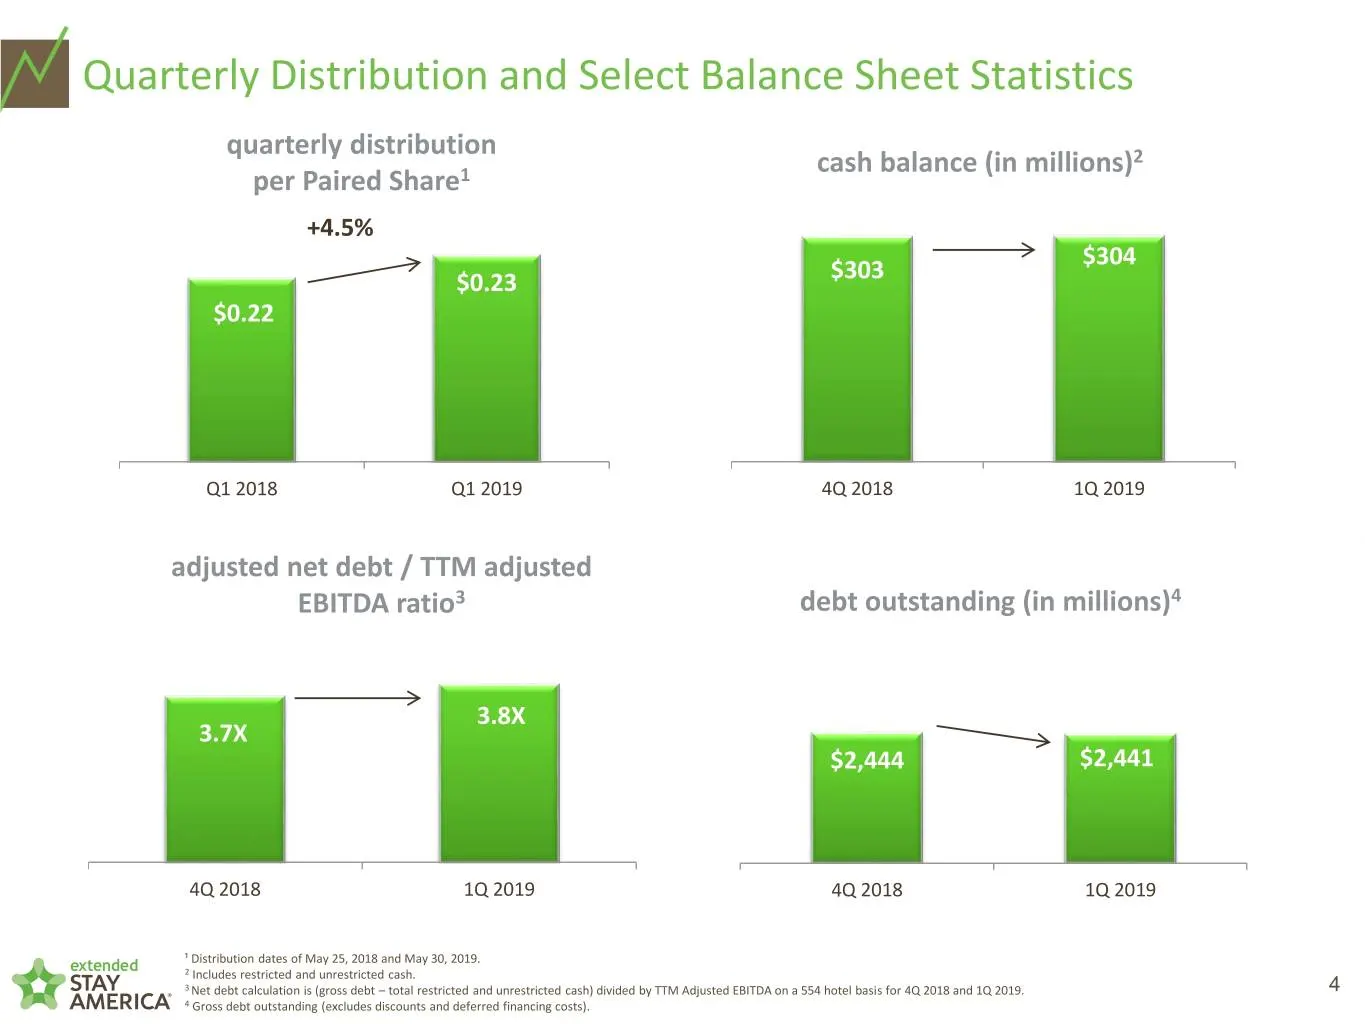
Slide 4: Quarterly Distribution and Select Balance Sheet Statistics
Quarterly Distribution and Select Balance Sheet Statistics quarterly distribution cash balance (in millions)2 per Paired Share1 +4.5% $304 $0.23 $303 $0.22 Q1 2018 Q1 2019 4Q 2018 1Q 2019 adjusted net debt / TTM adjusted EBITDA ratio3 debt outstanding (in millions)4 3.8X 3.7X $2,444 $2,441 4Q 2018 1
Slide 5: STAY Dividend History
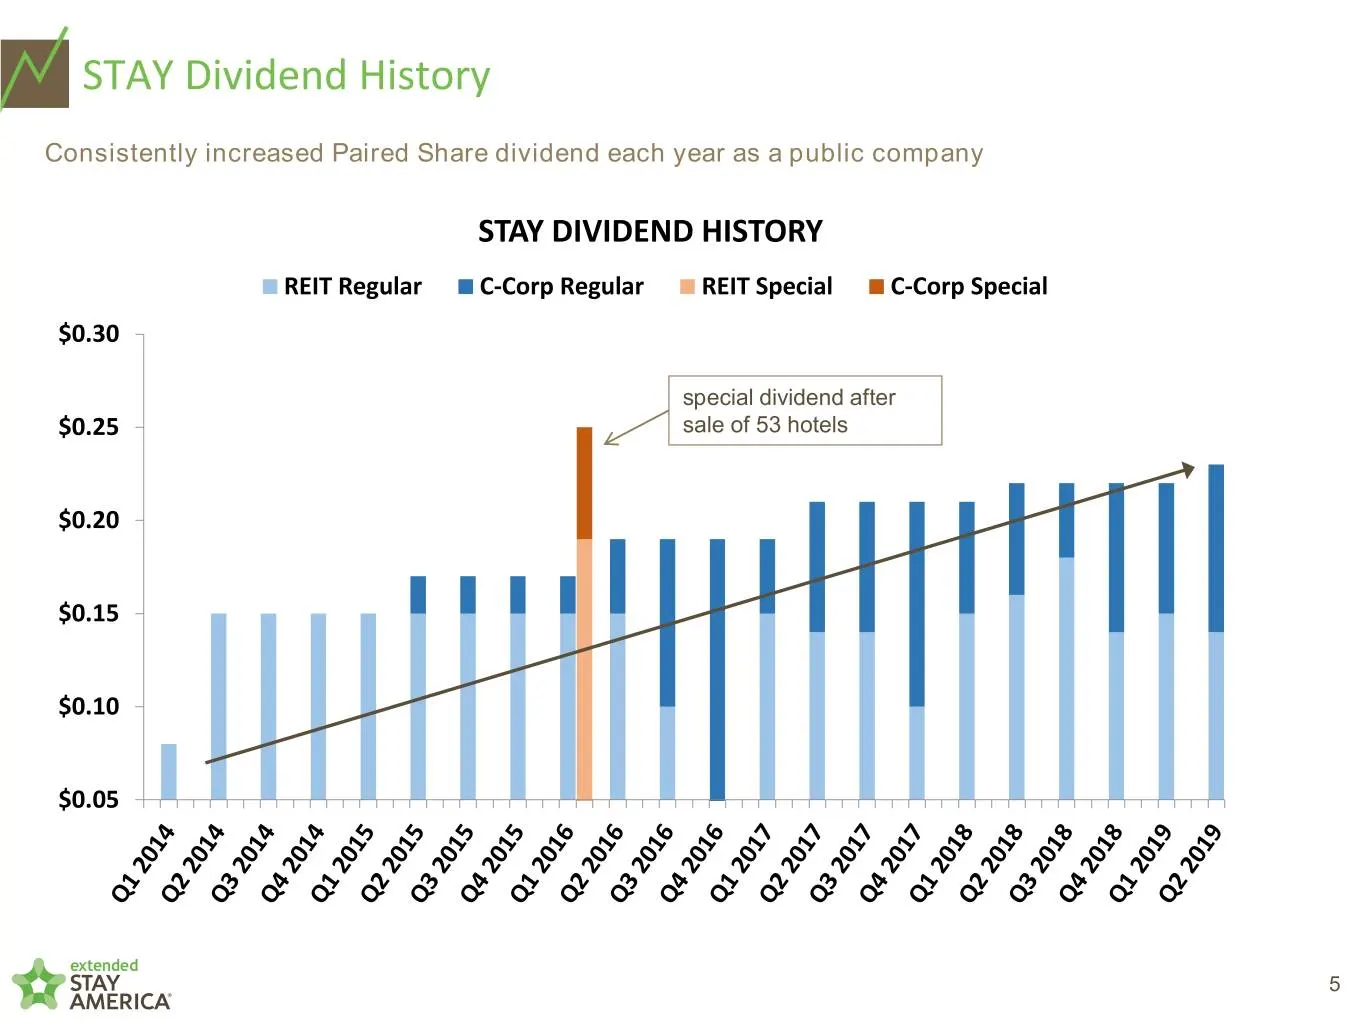
STAY Dividend History Consistently increased Paired Share dividend each year as a public company STAY DIVIDEND HISTORY REIT Regular C-Corp Regular REIT Special C-Corp Special $0.30 special dividend after $0.25 sale of 53 hotels $0.20 $0.15 $0.10 $0.05 5
Slide 6: Pipeline Update
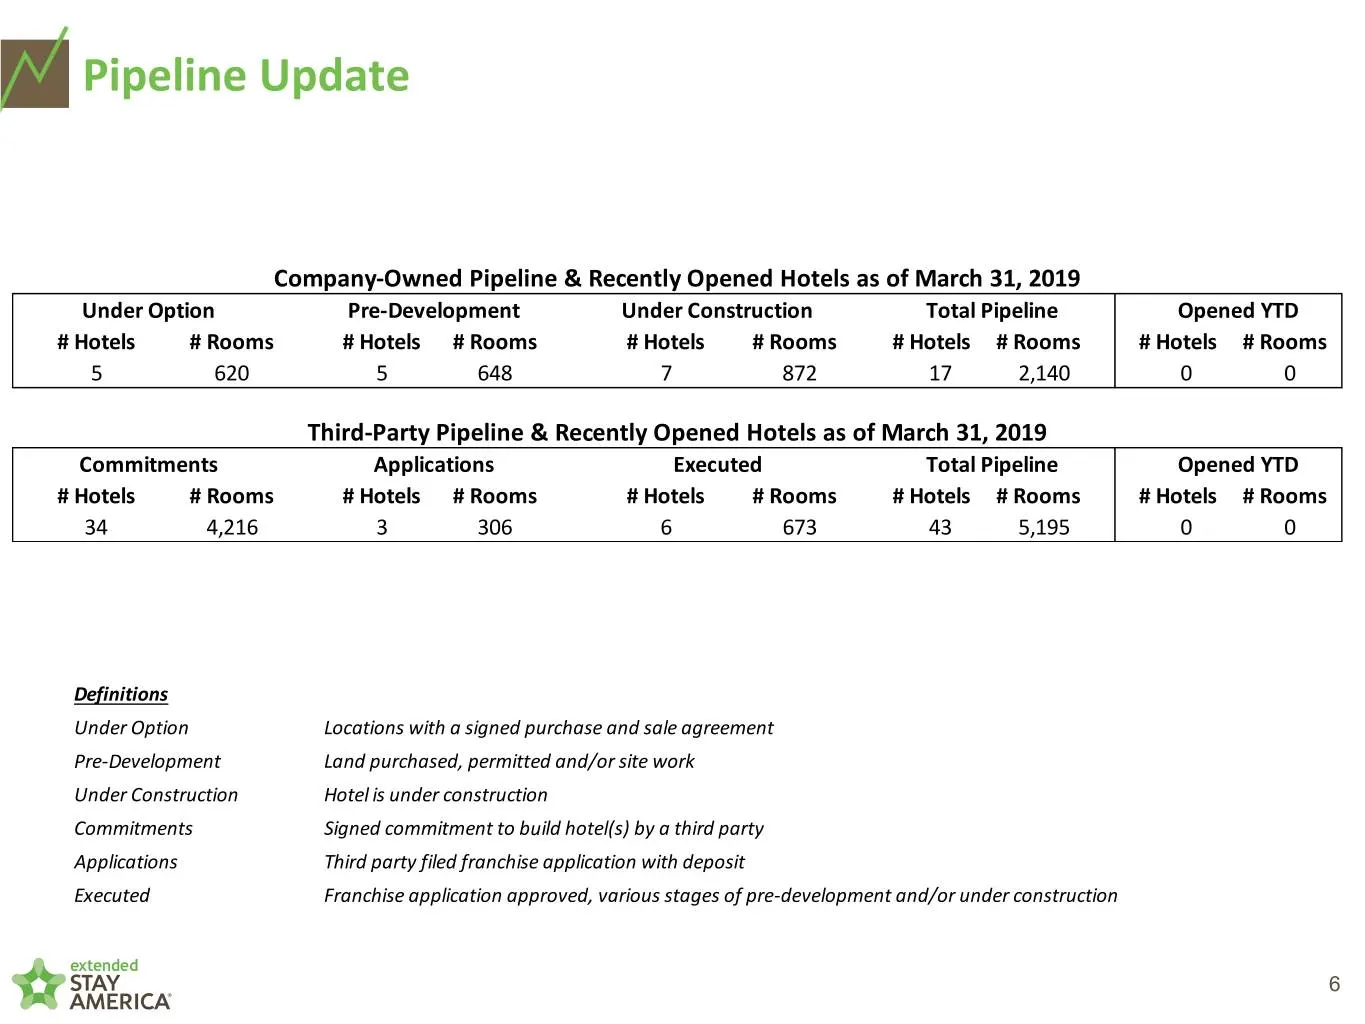
Pipeline Update Company-Owned Pipeline & Recently Opened Hotels as of March 31, 2019 Under Option Pre-Development Under Construction Total Pipeline Opened YTD # Hotels # Rooms # Hotels # Rooms # Hotels # Rooms # Hotels # Rooms # Hotels # Rooms 5 620 5 648 7 872 17 2,140 0 0 Third-Party Pipeline & Re
Slide 7: Progress on ESA 2.0 new build construction
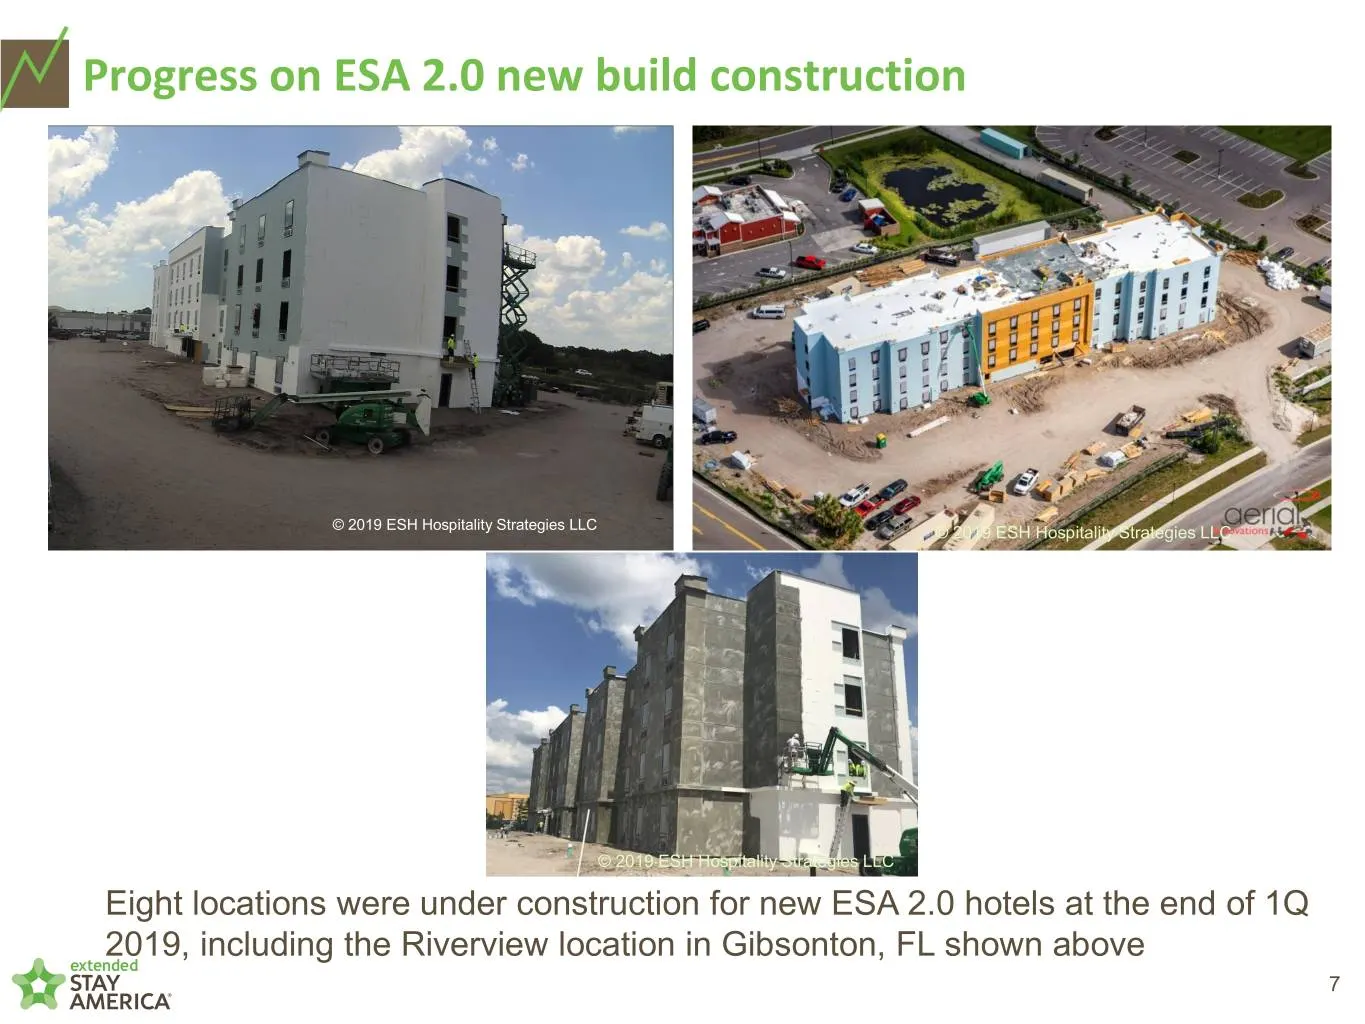
Progress on ESA 2.0 new build construction © 2019 ESH Hospitality Strategies LLC © 2019 ESH Hospitality Strategies LLC © 2019 ESH Hospitality Strategies LLC Eight locations were under construction for new ESA 2.0 hotels at the end of 1Q 2019, including the Riverview location in Gibsonton, FL shown a
Slide 8: Q1 2019 Results, Q2 2019 Outlook and Full Year 2019 Outlook
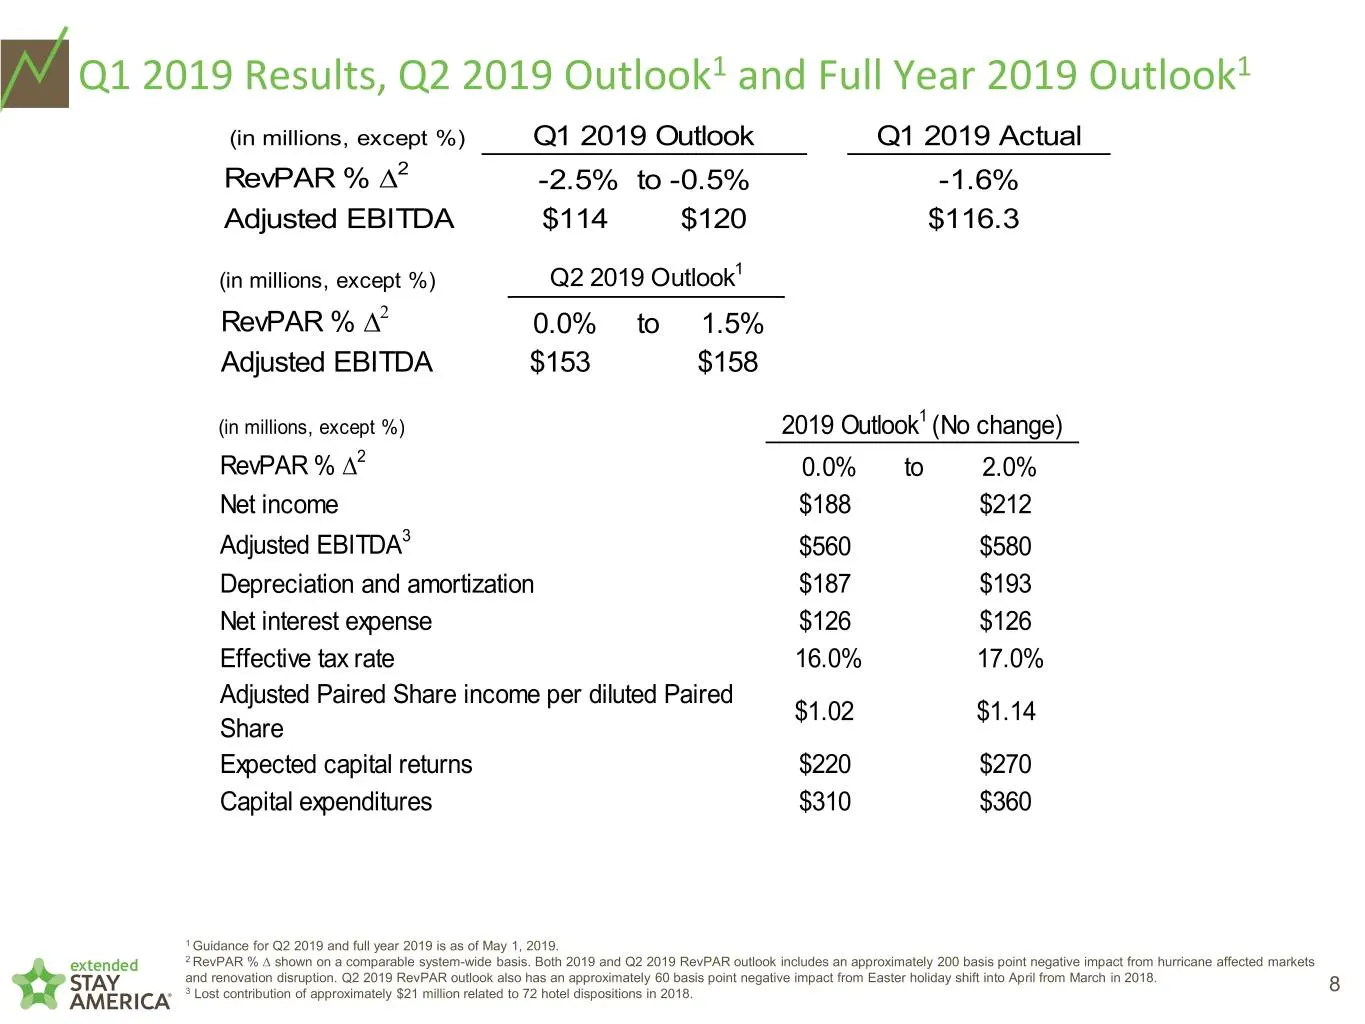
Q1 2019 Results, Q2 2019 Outlook1 and Full Year 2019 Outlook1 (in millions, except %) Q1 2019 Outlook Q1 2019 Actual RevPAR % D2 -2.5% to -0.5% -1.6% Adjusted EBITDA $114 $120 $116.3 1 (in millions, except %) Q2 2019 Outlook RevPAR % D2 0.0% to 1.5% Adjusted EBITDA $153 $158 1 4 (in millions, except

Slide 9: Appendix
appendix
Slide 10: Reconciliation to Hotel Operating Profit and Hotel Operating Margin
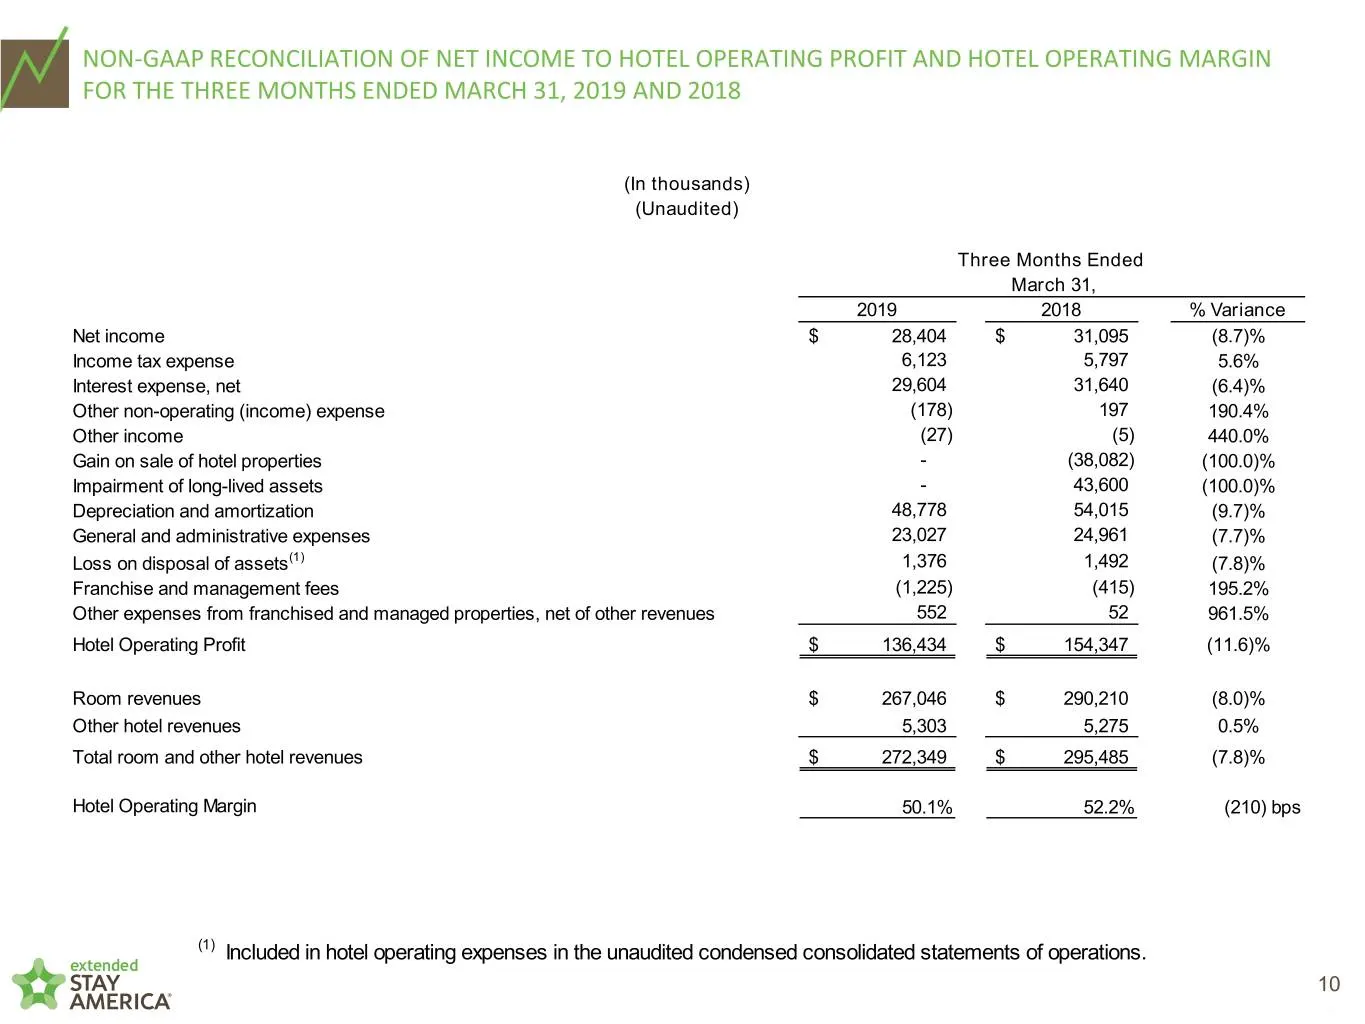
NON-GAAP RECONCILIATION OF NET INCOME TO HOTEL OPERATING PROFIT AND HOTEL OPERATING MARGIN FOR THE THREE MONTHS ENDED MARCH 31, 2019 AND 2018 (In thousands) (Unaudited) Three Months Ended March 31, 2019 2018 % Variance Net income $ 28,404 $ 31,095 (8.7)% Income tax expense 6,123 5,797 5.6% Interest
Slide 11: Reconciliation to EBITDA and Adjusted EBITDA
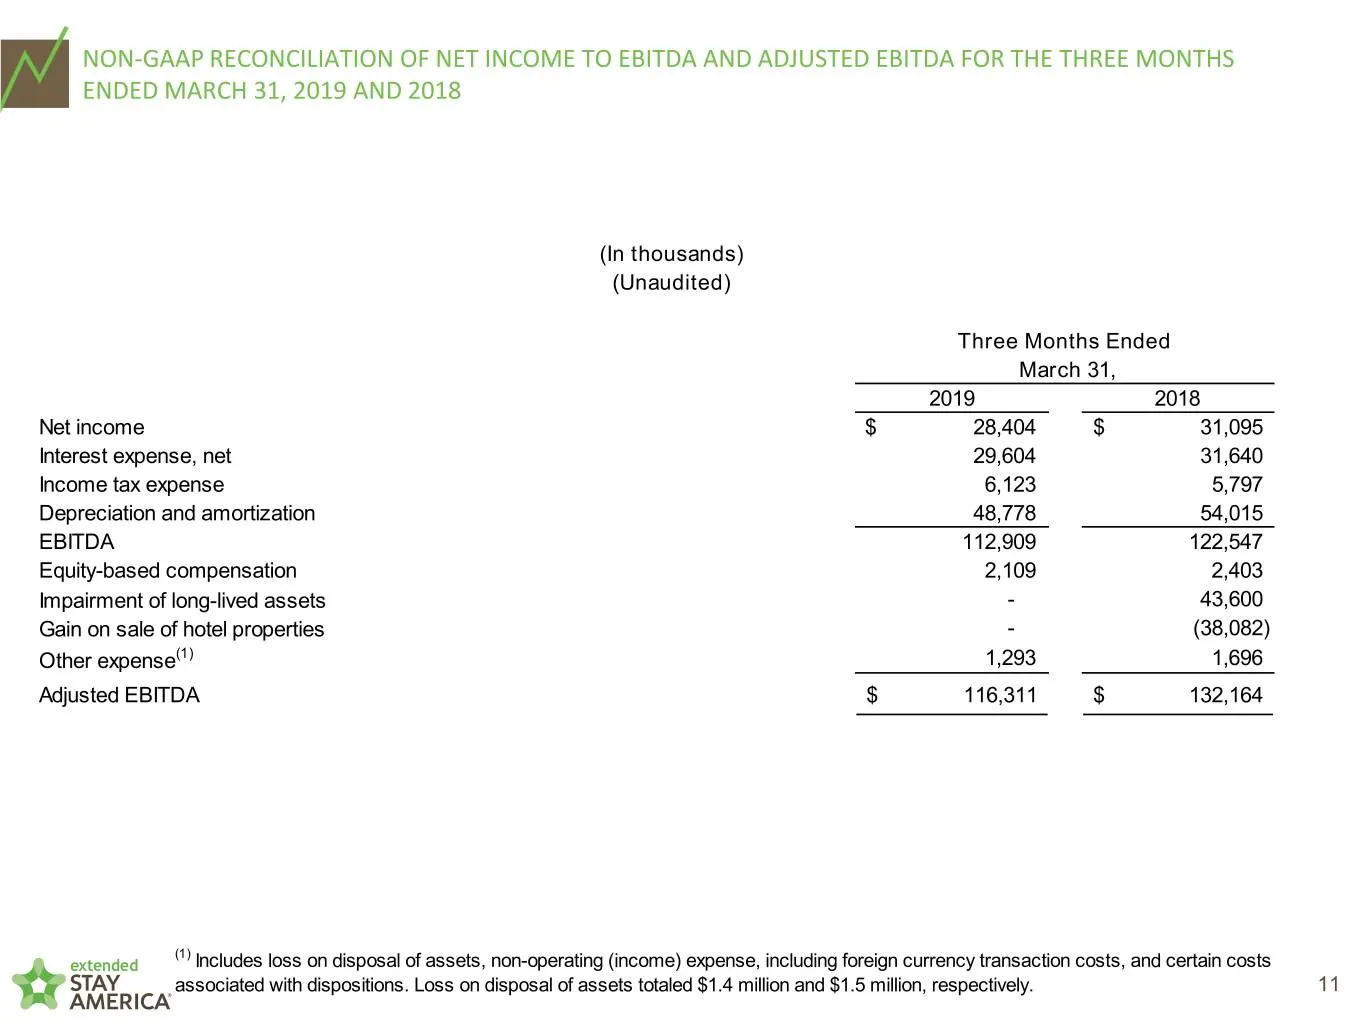
NON-GAAP RECONCILIATION OF NET INCOME TO EBITDA AND ADJUSTED EBITDA FOR THE THREE MONTHS ENDED MARCH 31, 2019 AND 2018 (In thousands) (Unaudited) Three Months Ended March 31, 2019 2018 Net income $ 28,404 $ 31,095 Interest expense, net 29,604 31,640 Income tax expense 6,123 5,797 Depreciation and am
Slide 12: Reconciliation to Funds From Operations and Adjusted FFO per Paired Share
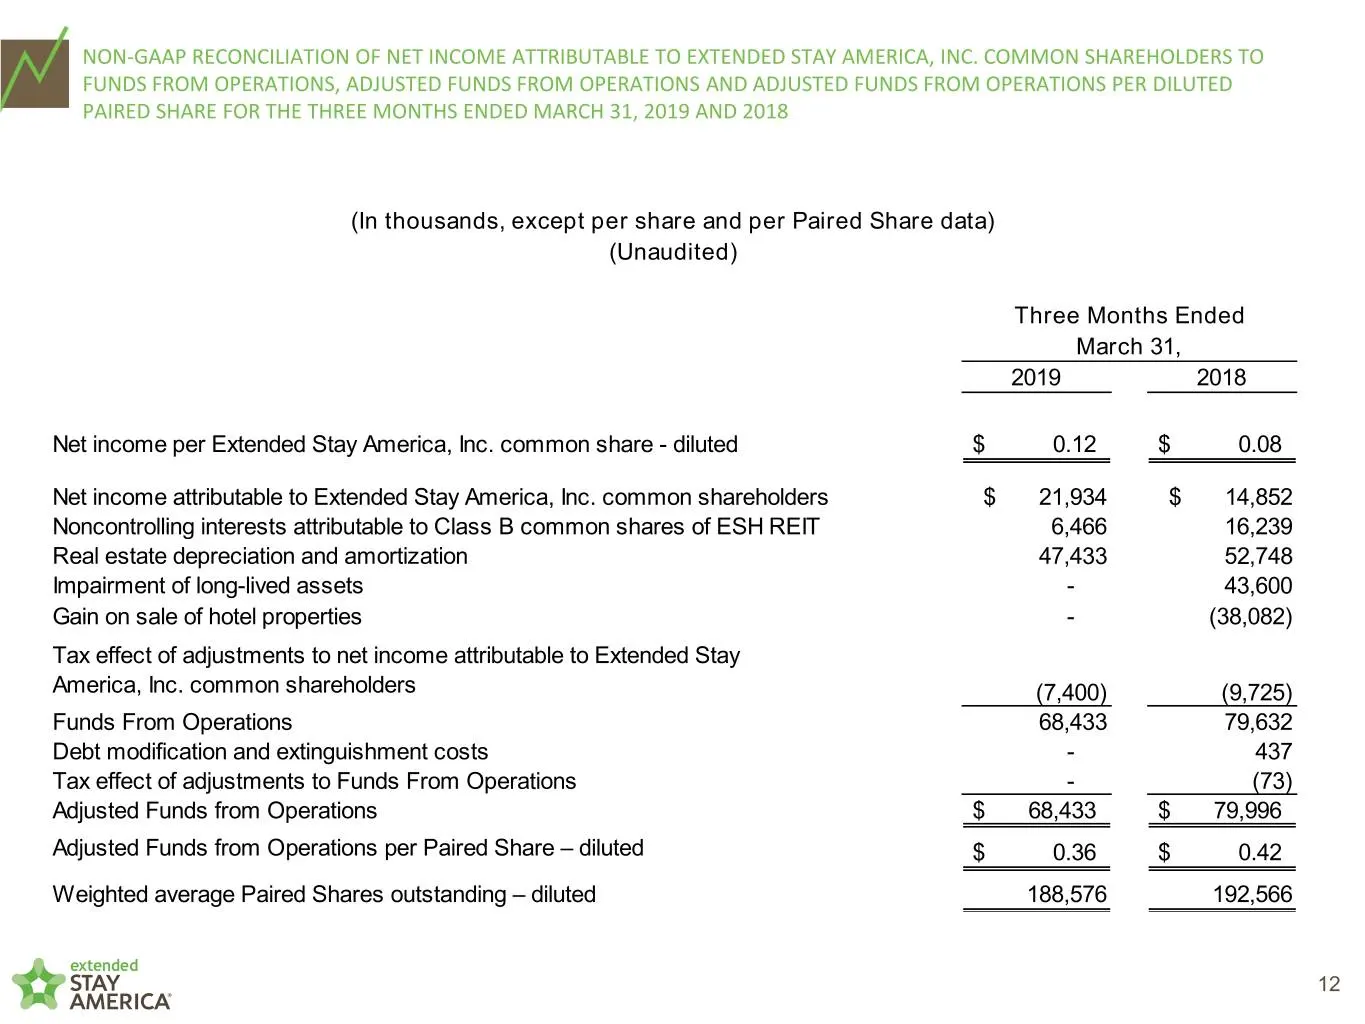
NON-GAAP RECONCILIATION OF NET INCOME ATTRIBUTABLE TO EXTENDED STAY AMERICA, INC. COMMON SHAREHOLDERS TO FUNDS FROM OPERATIONS, ADJUSTED FUNDS FROM OPERATIONS AND ADJUSTED FUNDS FROM OPERATIONS PER DILUTED PAIRED SHARE FOR THE THREE MONTHS ENDED MARCH 31, 2019 AND 2018 (In thousands, except per shar
Slide 13: Reconciliation to Paired Share Income and Adjusted Paired Share Income
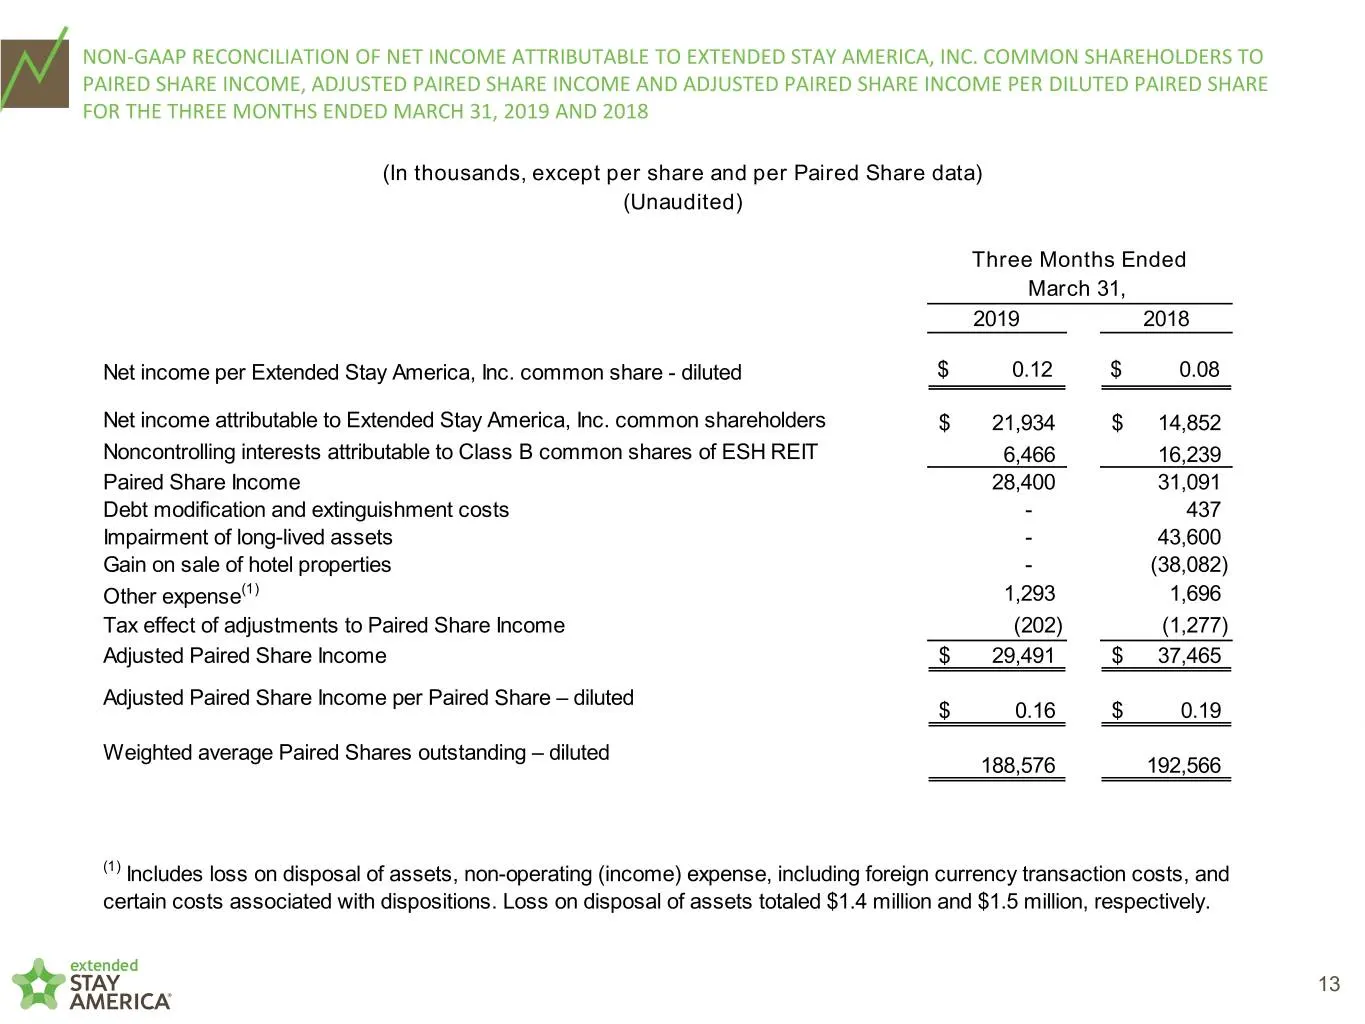
NON-GAAP RECONCILIATION OF NET INCOME ATTRIBUTABLE TO EXTENDED STAY AMERICA, INC. COMMON SHAREHOLDERS TO PAIRED SHARE INCOME, ADJUSTED PAIRED SHARE INCOME AND ADJUSTED PAIRED SHARE INCOME PER DILUTED PAIRED SHARE FOR THE THREE MONTHS ENDED MARCH 31, 2019 AND 2018 (In thousands, except per share and
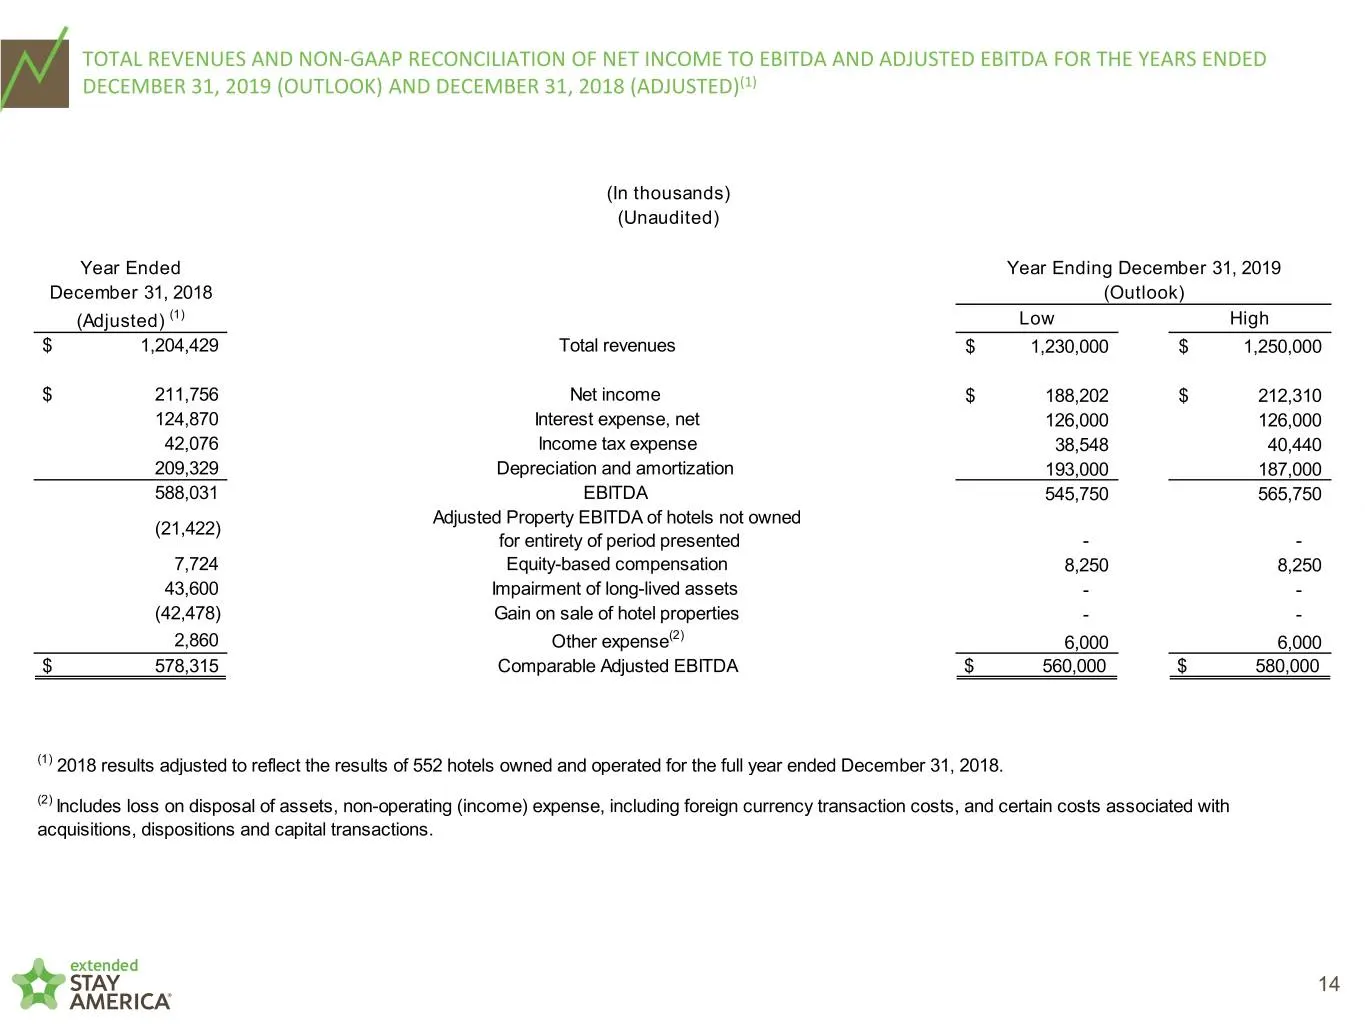
Slide 14: Reconciliation of 2019 Outlook to EBITDA and Adjusted EBITDA
TOTAL REVENUES AND NON-GAAP RECONCILIATION OF NET INCOME TO EBITDA AND ADJUSTED EBITDA FOR THE YEARS ENDED DECEMBER 31, 2019 (OUTLOOK) AND DECEMBER 31, 2018 (ADJUSTED)(1) (In thousands) (Unaudited) Year Ended Year Ending December 31, 2019 December 31, 2018 (Outlook) (Adjusted) (1) Low High $ 1,204,4
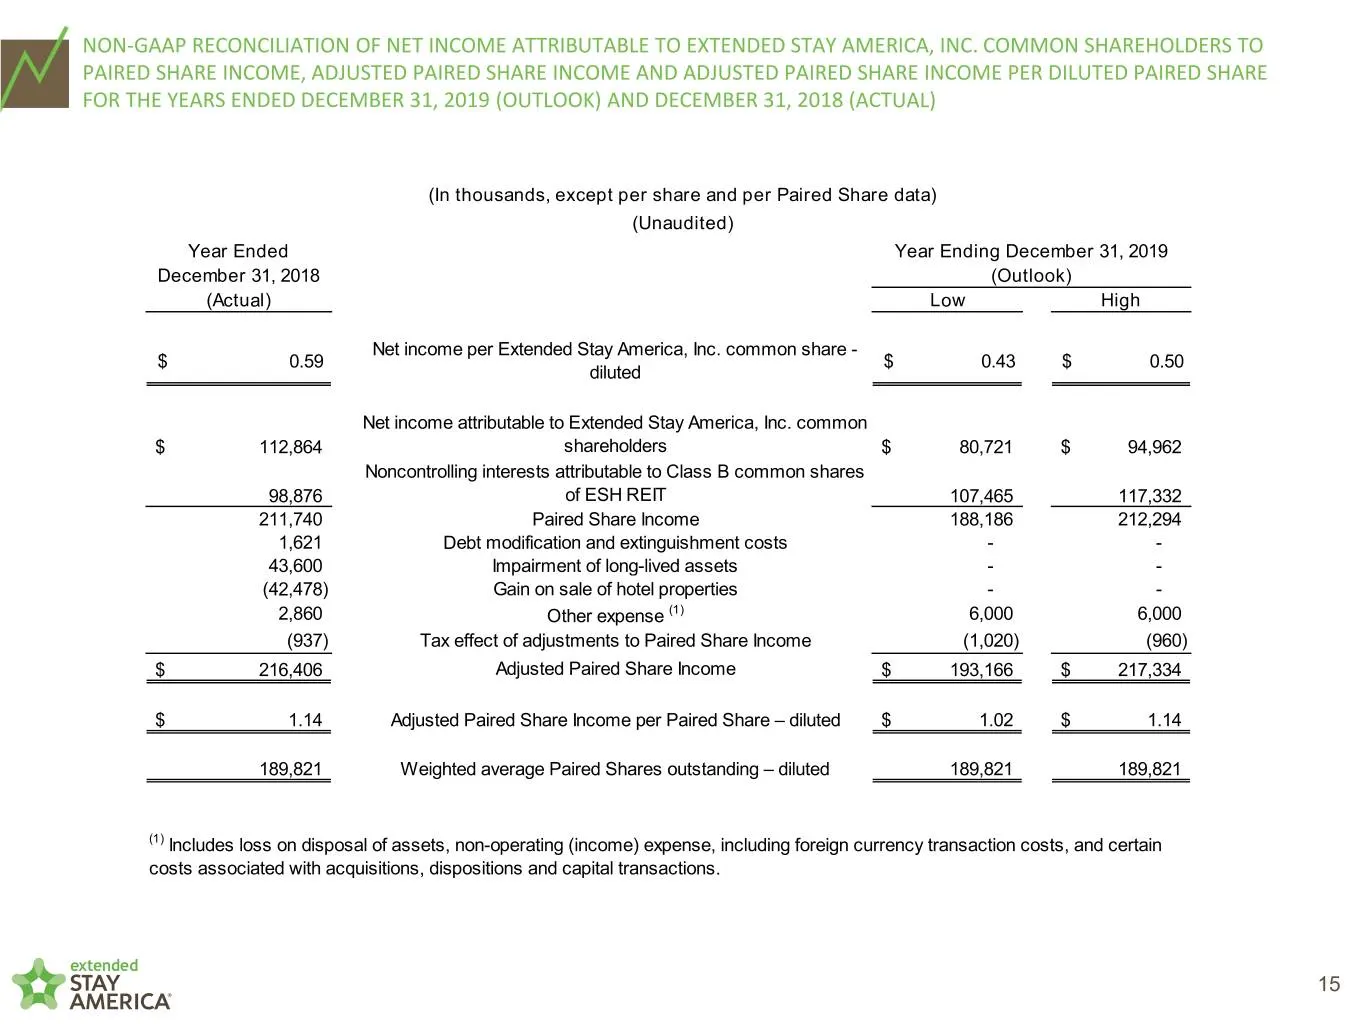
Slide 15: Reconciliation of 2019 Outlook to Adjusted Paired Share Income
NON-GAAP RECONCILIATION OF NET INCOME ATTRIBUTABLE TO EXTENDED STAY AMERICA, INC. COMMON SHAREHOLDERS TO PAIRED SHARE INCOME, ADJUSTED PAIRED SHARE INCOME AND ADJUSTED PAIRED SHARE INCOME PER DILUTED PAIRED SHARE FOR THE YEARS ENDED DECEMBER 31, 2019 (OUTLOOK) AND DECEMBER 31, 2018 (ACTUAL) (In thou
Source: SEC EDGAR · 8-K filed May 1, 2019
More decks from Extended Stay America Inc
 Proxy Contest (May 2021)40 slides · May 19, 2021
 Proxy Contest (May 2021)97 slides · May 18, 2021
 Q4 2020 Earnings Presentation30 slides · Feb 25, 2021
 Q3 2020 Earnings Presentation15 slides · Nov 9, 2020
 Q2 2020 Earnings Presentation15 slides · Aug 10, 2020
 Q1 2020 Earnings Presentation15 slides · May 6, 2020