Blue Apron — Investor Day (May 2022)
135 slides from Blue Apron's investor day presentation, May 10, 2022
Slide 1: Blue Apron Investor Day May 10, 2022
Blue Apron Investor Day May 10, 2022
Slide 2: Disclaimer: Forward Looking Statements and Use of Non-GAAP Information
2 Disclaimer: Forward Looking Statements and Use of Non - GAAP Information This presentation includes statements concerning Blue Apron Holdings, Inc. and its future expectations, plans and prospects t hat constitute "forward - looking statements" within the meaning of the Private Securities Litigati
Slide 3: Disclaimer (continued)
3 delivery of ingredients, and parcel and freight carrier interruptions or delays and/or higher freight or fuel costs, as a res ult of inflation or otherwise; the company’s ability to effectively compete; the company’s ability to maintain and grow the value of its brand and reputation; t he company’
Slide 4: Linda Findley, President, Chief Executive Officer
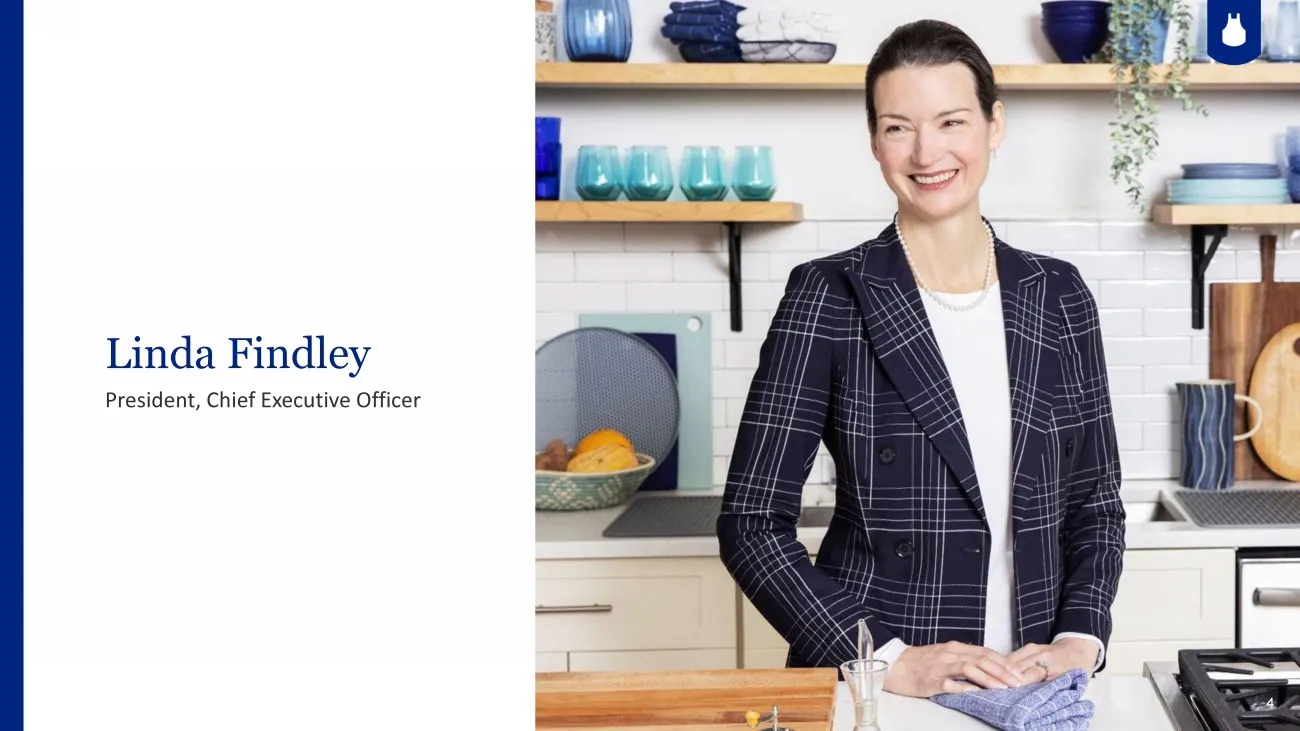
Linda Findley President, Chief Executive Officer 4
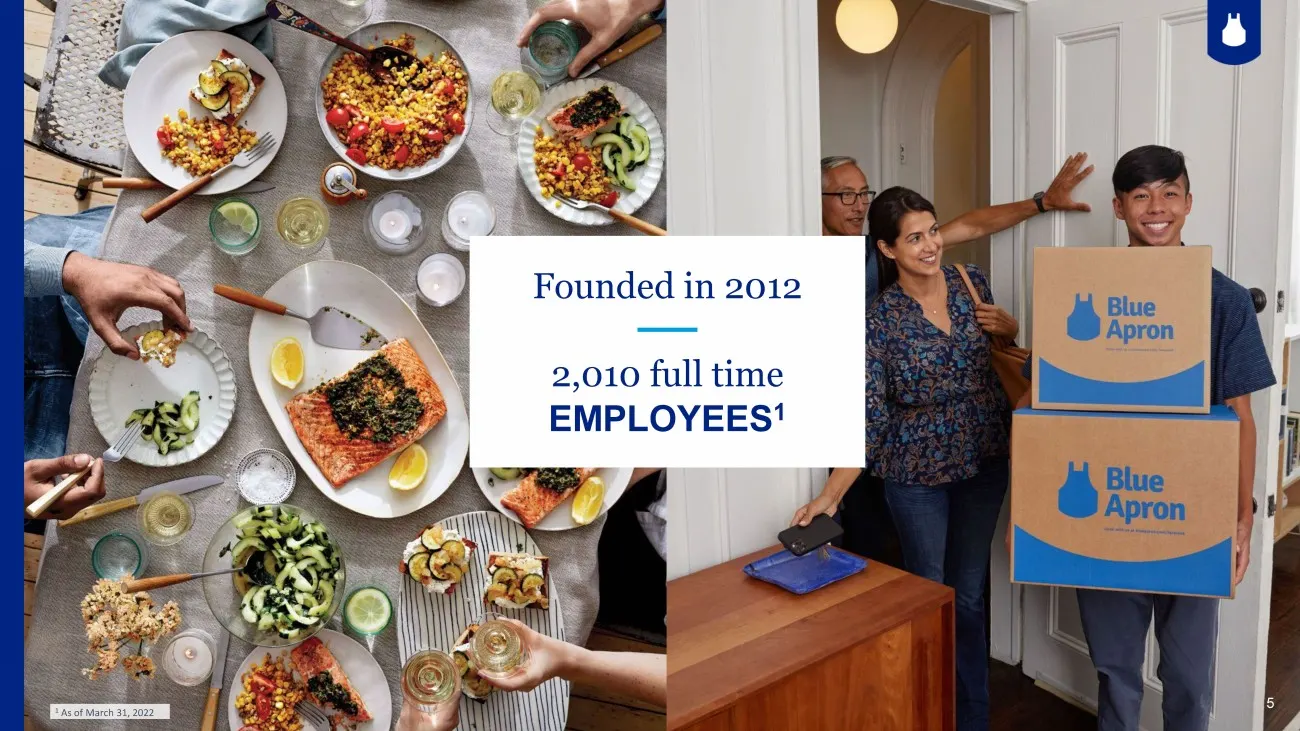
Slide 5: Founded in 2012, 2,010 full time employees
5 Founded in 2012 2,010 full time EMPLOYEES 1 1 As of March 31, 2022 5
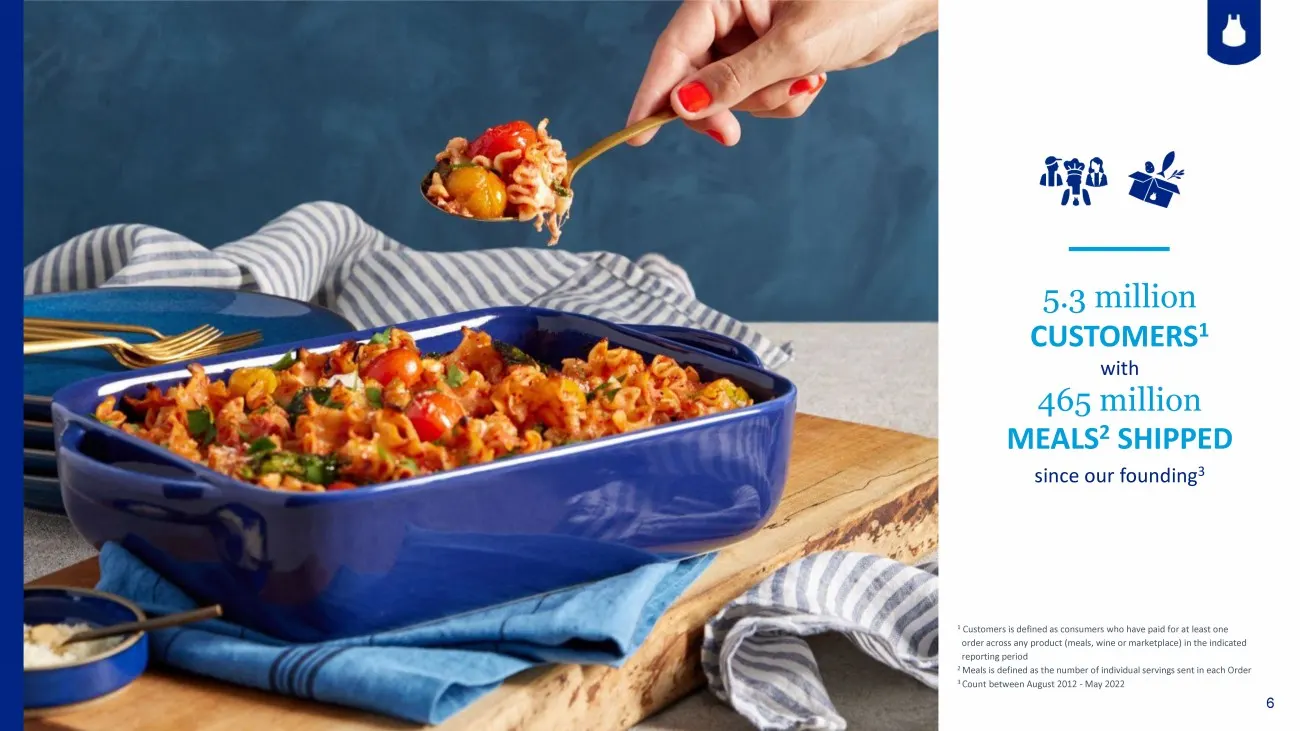
Slide 6: 5.3 million customers and meals shipped since founding
6 5.3 million CUSTOMERS 1 with 465 million MEALS 2 SHIPPED since our founding 3 1 Customers is defined as consumers who have paid for at least one order across any product (meals, wine or marketplace) in the indicated reporting period 2 Meals is defined as the number of individual servings sent in e
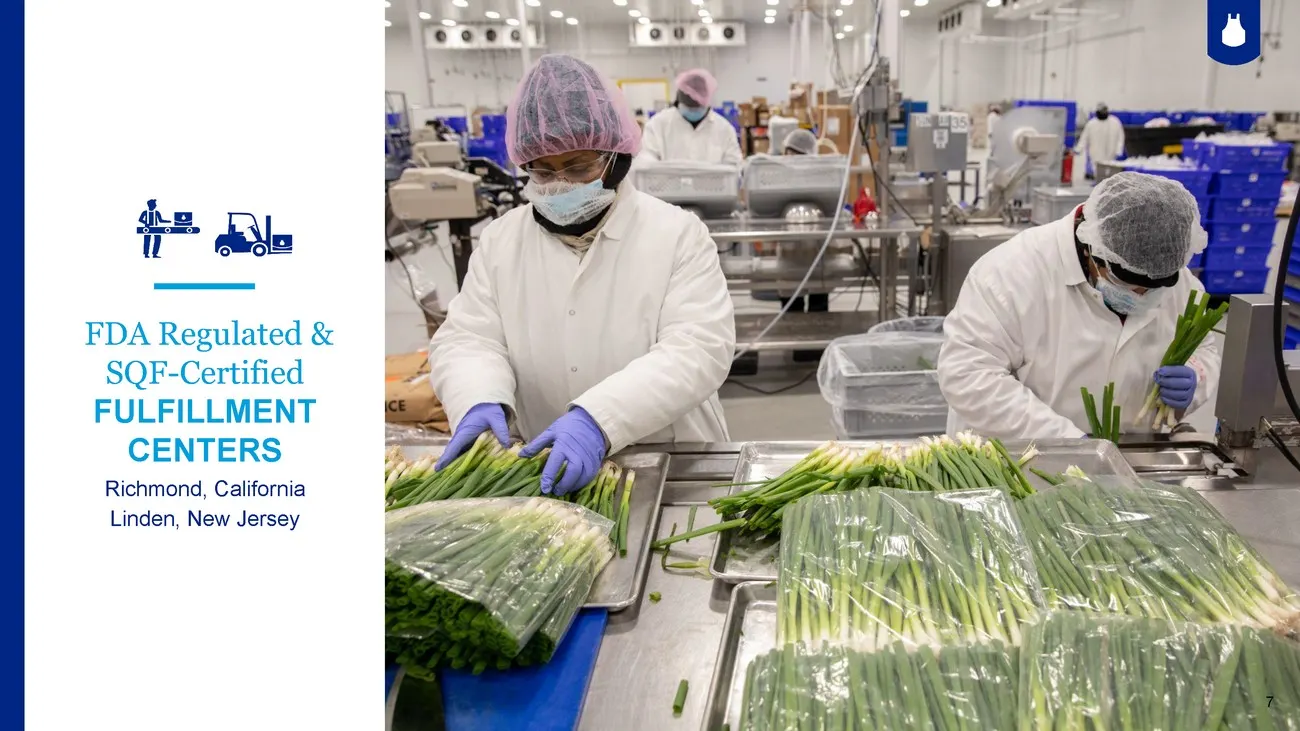
Slide 7: FDA Regulated & SQF-Certified Fulfillment Centers
7 FDA Regulated & SQF-Certified FULFILLMENT CENTERS Richmond, California Linden, New Jersey
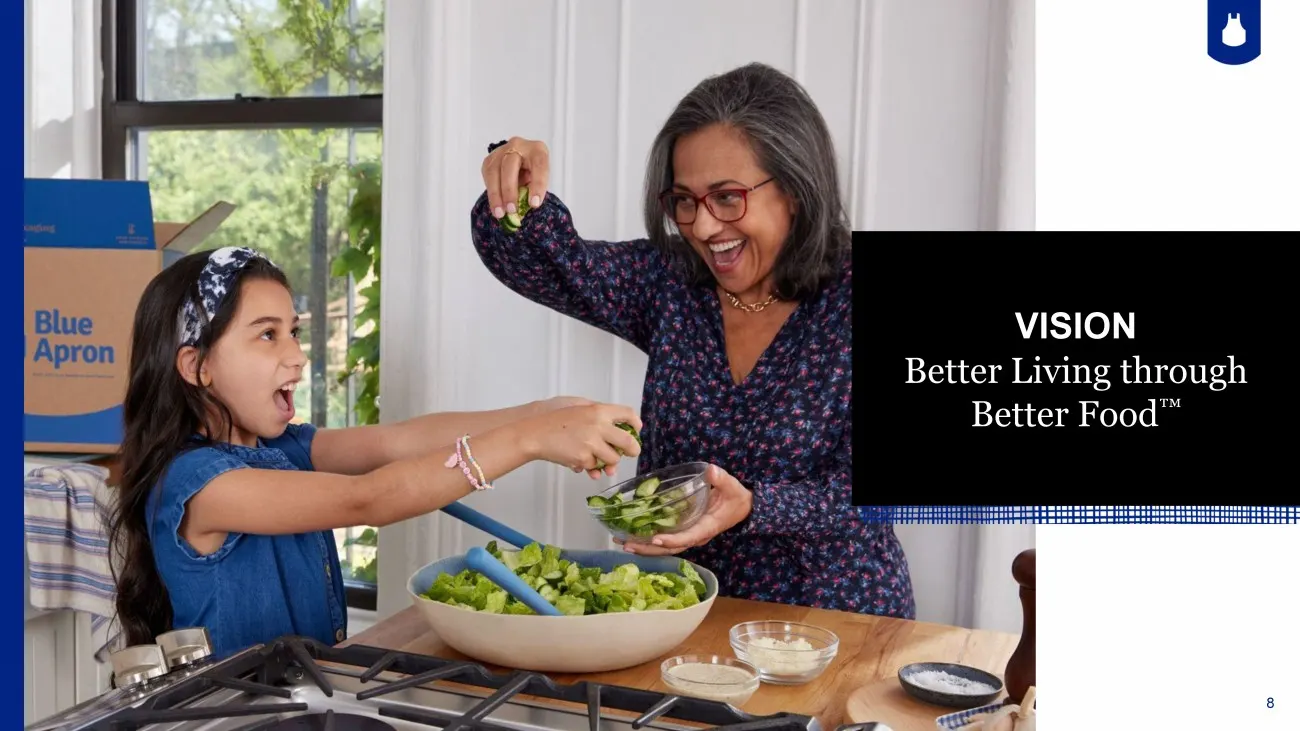
Slide 8: Vision: Better Living through Better Food
8 TM VISION Better Living through Better Food Œ
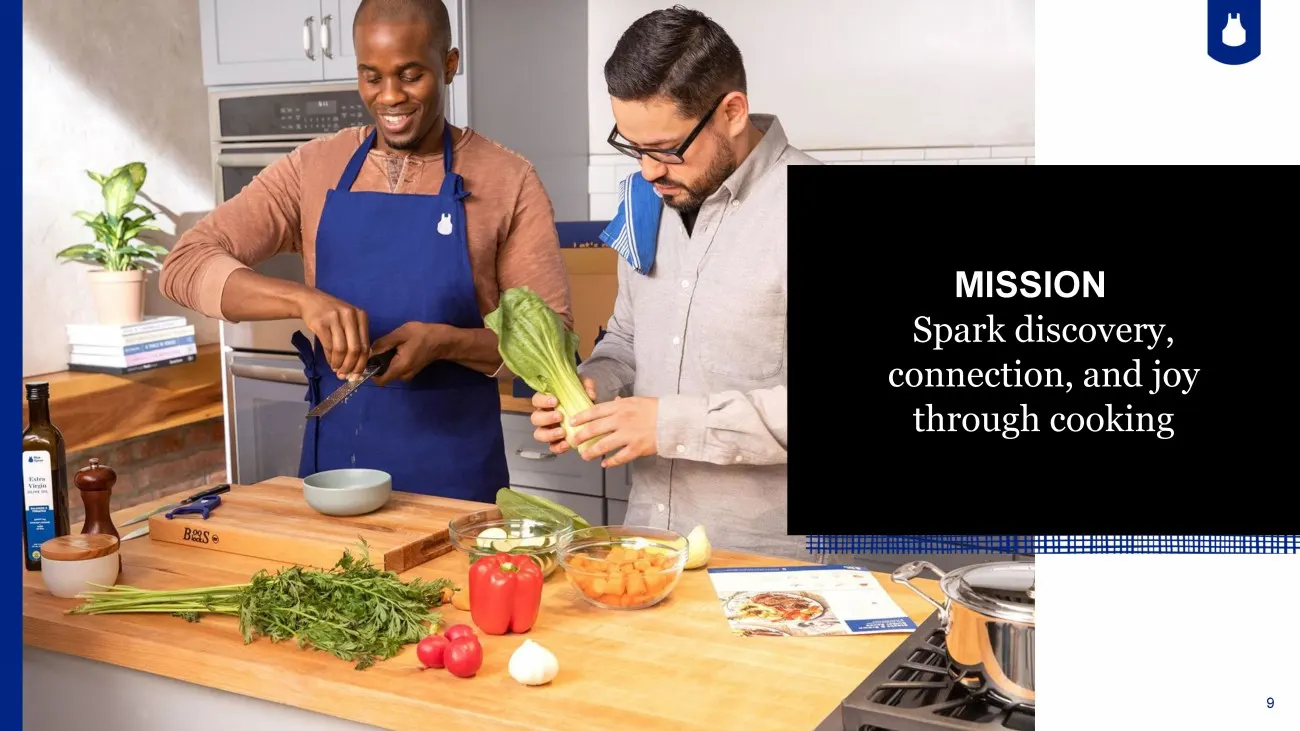
Slide 9: Mission: Spark discovery, connection, and joy through cooking
9 TM MISSION Spark discovery, connection, and joy through cooking
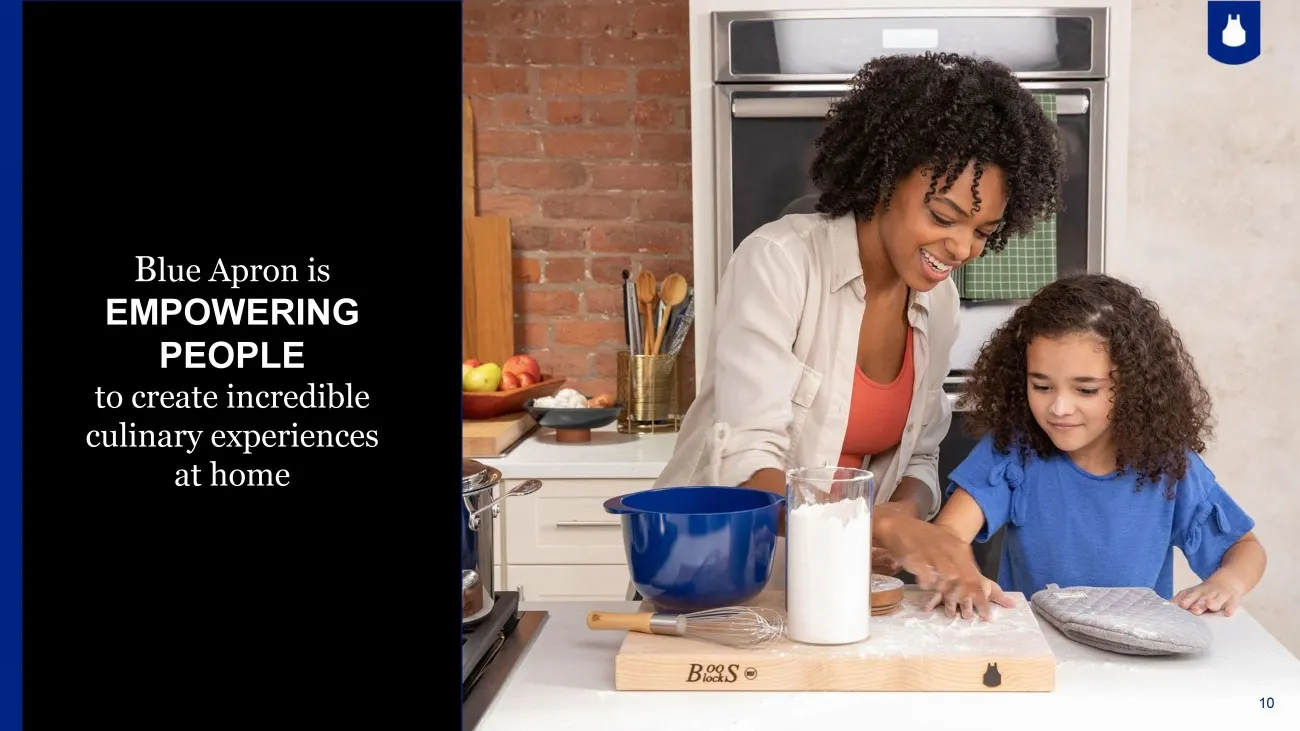
Slide 10: Blue Apron is empowering people to create incredible culinary experiences at home
10 B lue Apron is EMPOWERING PEOPLE to create incredible culinary experiences at home 10
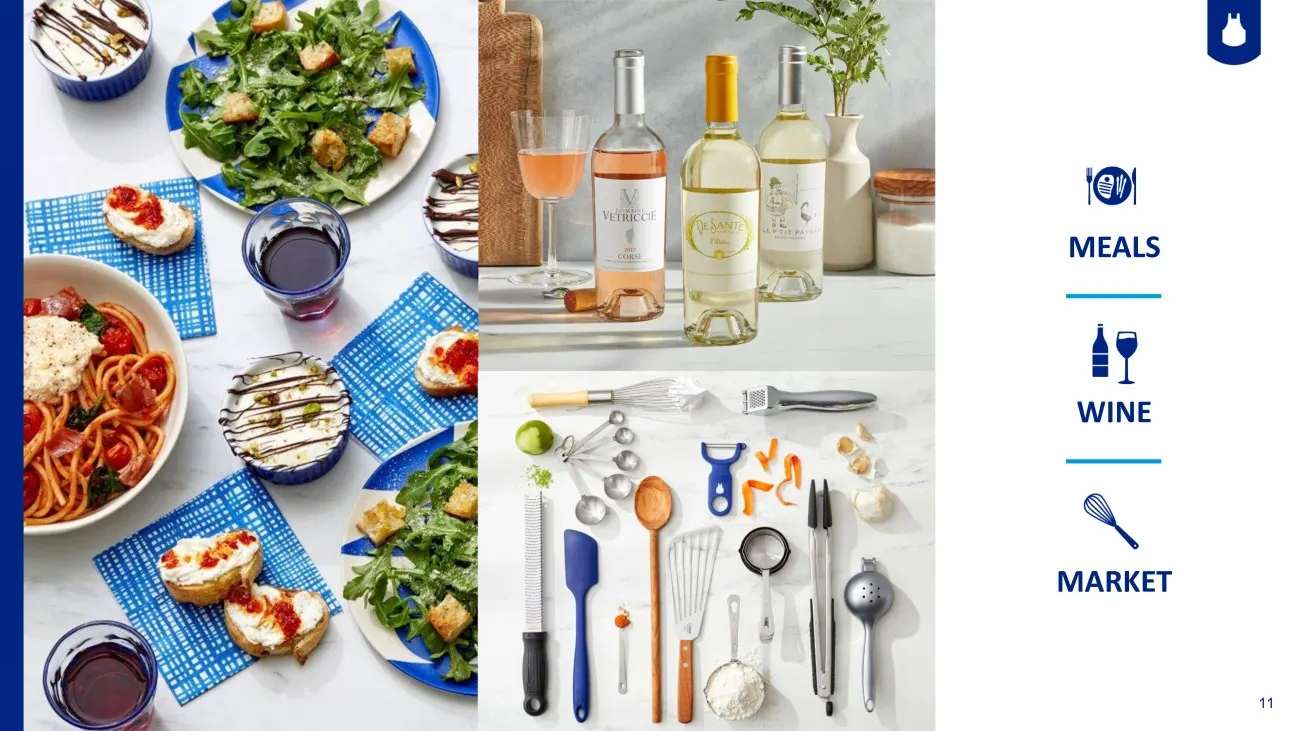
Slide 11: Meals, Wine, Market
11 MEALS WINE MARKET
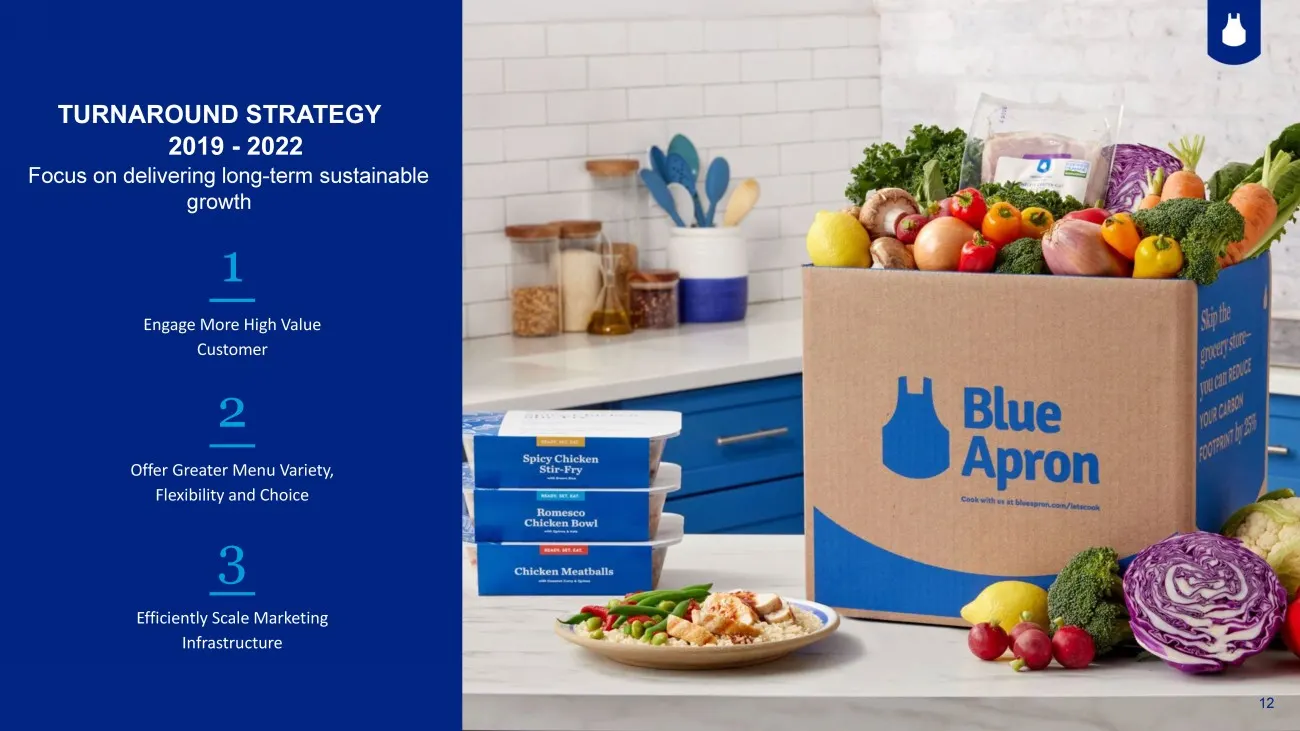
Slide 12: Turnaround Strategy 2019-2022
12 TURNAROUND STRATEGY 2019 - 2022 Focus on delivering long - term sustainable growth 1 Engage More High Value Customer 2 Offer Greater Menu Variety, Flexibility and Choice 3 Efficiently Scale Marketing Infrastructure 12
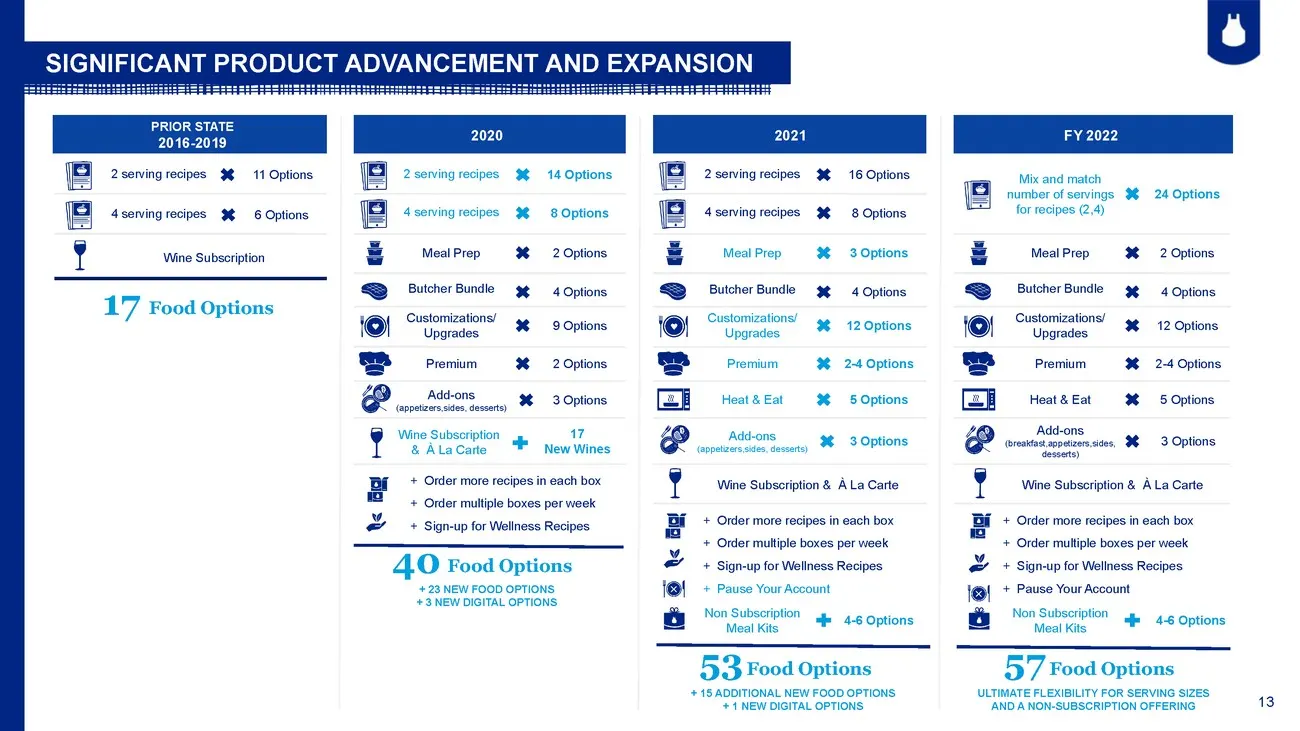
Slide 13: Significant product advancement and expansion
13 SIGNIFICANT PRODUCT ADVANCEMENT AND EXPANSION 8 Options Meal Prep 2 Options Butcher Bundle 4 Options Customizations/ Upgrades 9 Options 3 Options Wine Subscription & La Carte 17 New Wines Wine Subscription + Order more recipes in each box + Order multiple boxes per week + Sign-up for Wellness Rec
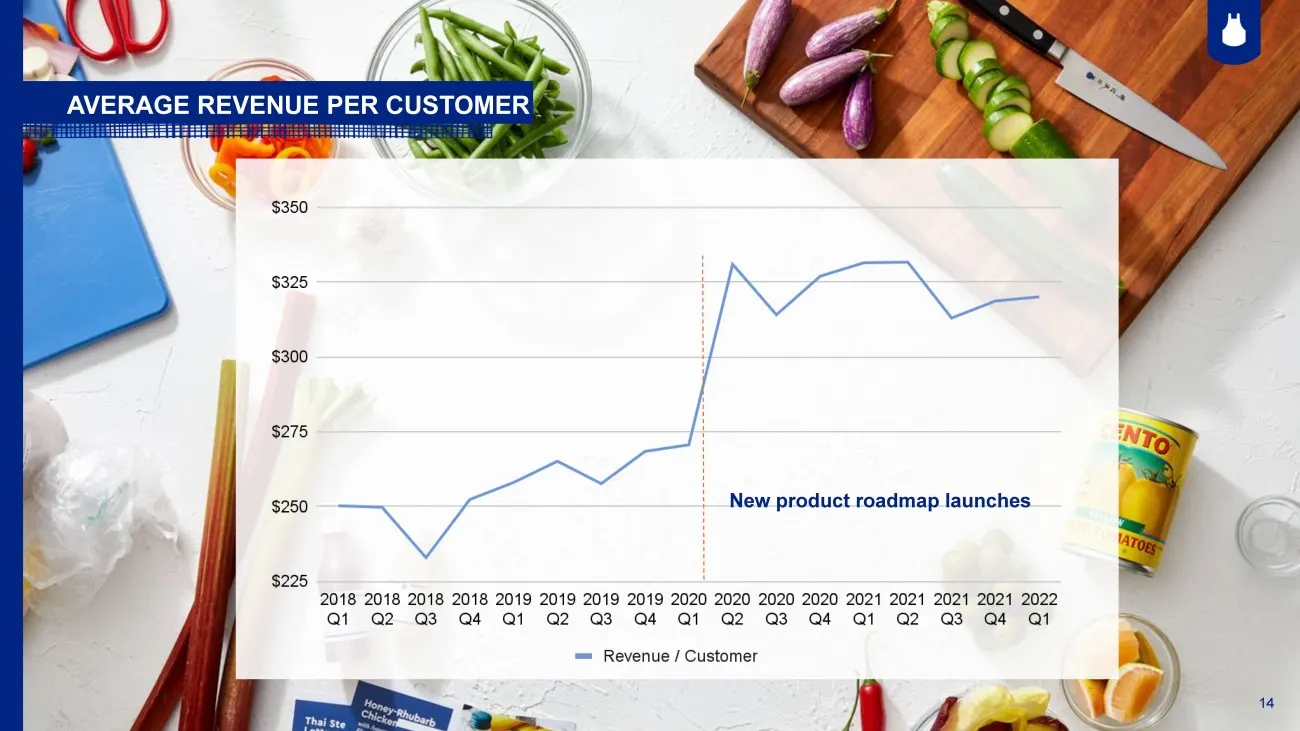
Slide 14: Average revenue per customer
14 New product roadmap launches AVERAGE REVENUE PER CUSTOMER 14
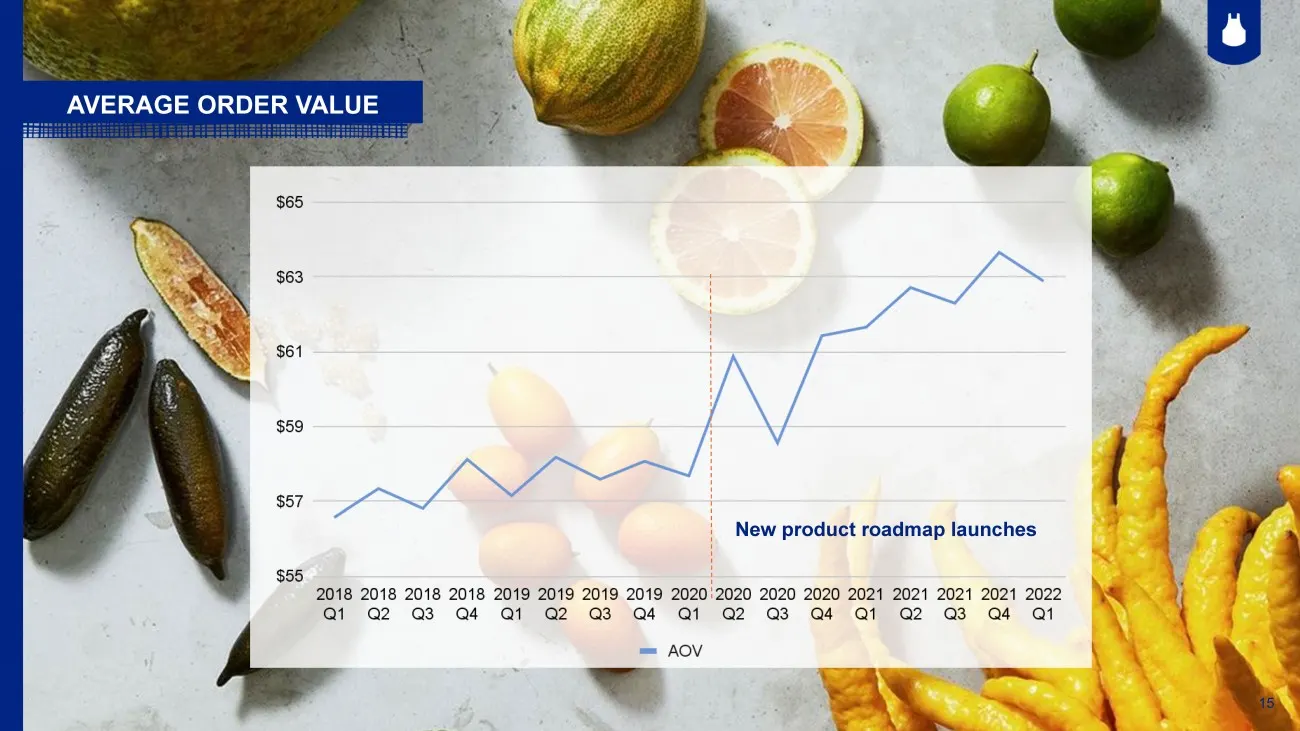
Slide 15: Average order value
15 AVERAGE ORDER VALUE New product roadmap launches 15
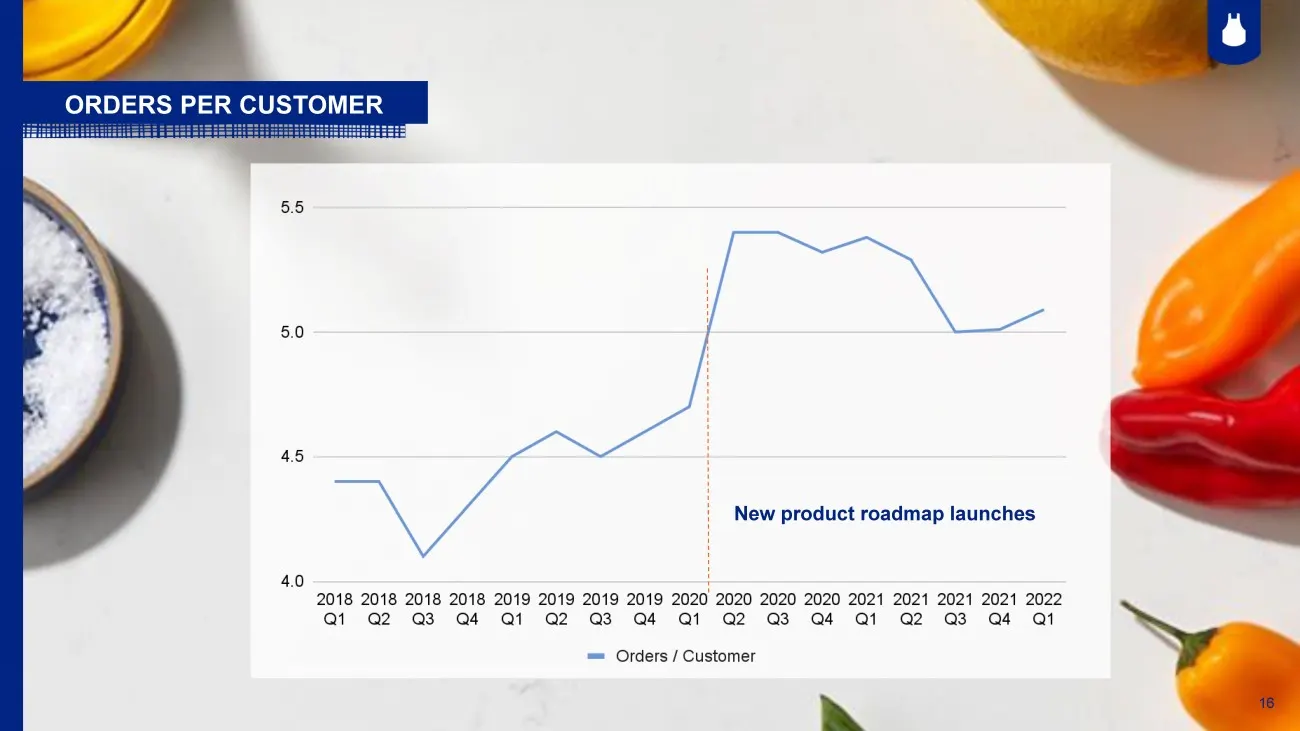
Slide 16: Orders per customer
16 ORDERS PER CUSTOMER New product roadmap launches 16

Slide 17: Doing more with less
1D DOING MORE “ é, WITH LESS
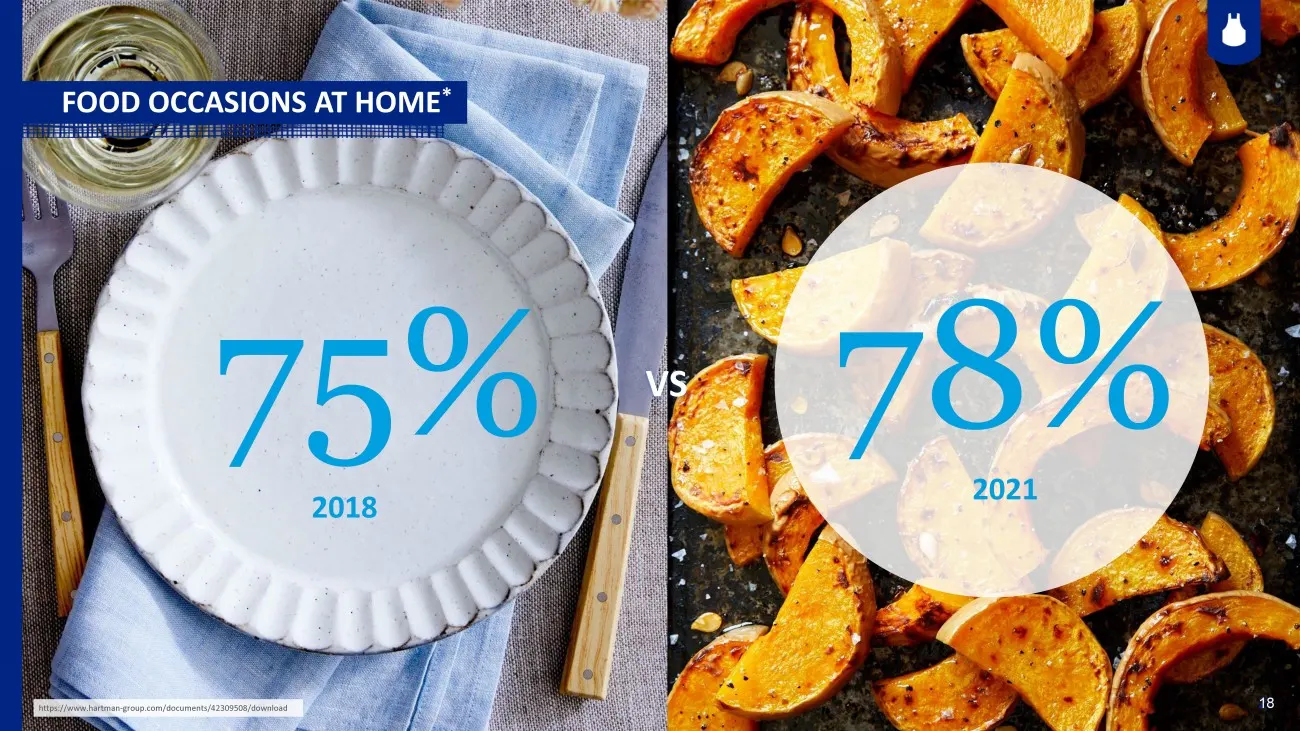
Slide 18: Food occasions at home
18 27 FOOD OCCASIONS AT HOME * 75% VS 78% 2021 2018 https://www.hartman - group.com/documents/42309508/download 18
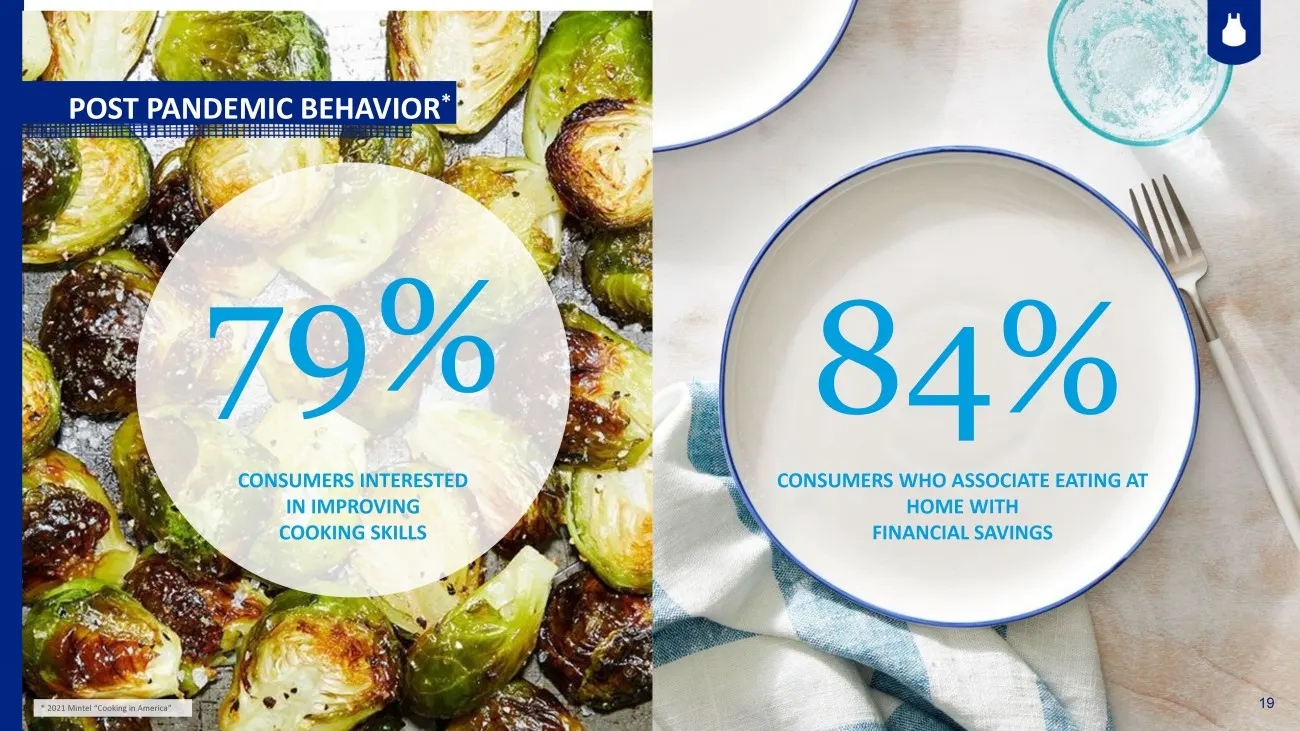
Slide 19: Post pandemic behavior
19 * 2021 Mintel “Cooking in America” 84% 79% POST PANDEMIC BEHAVIOR * CONSUMERS WHO ASSOCIATE EATING AT HOME WITH FINANCIAL SAVINGS CONSUMERS INTERESTED IN IMPROVING COOKING SKILLS 19
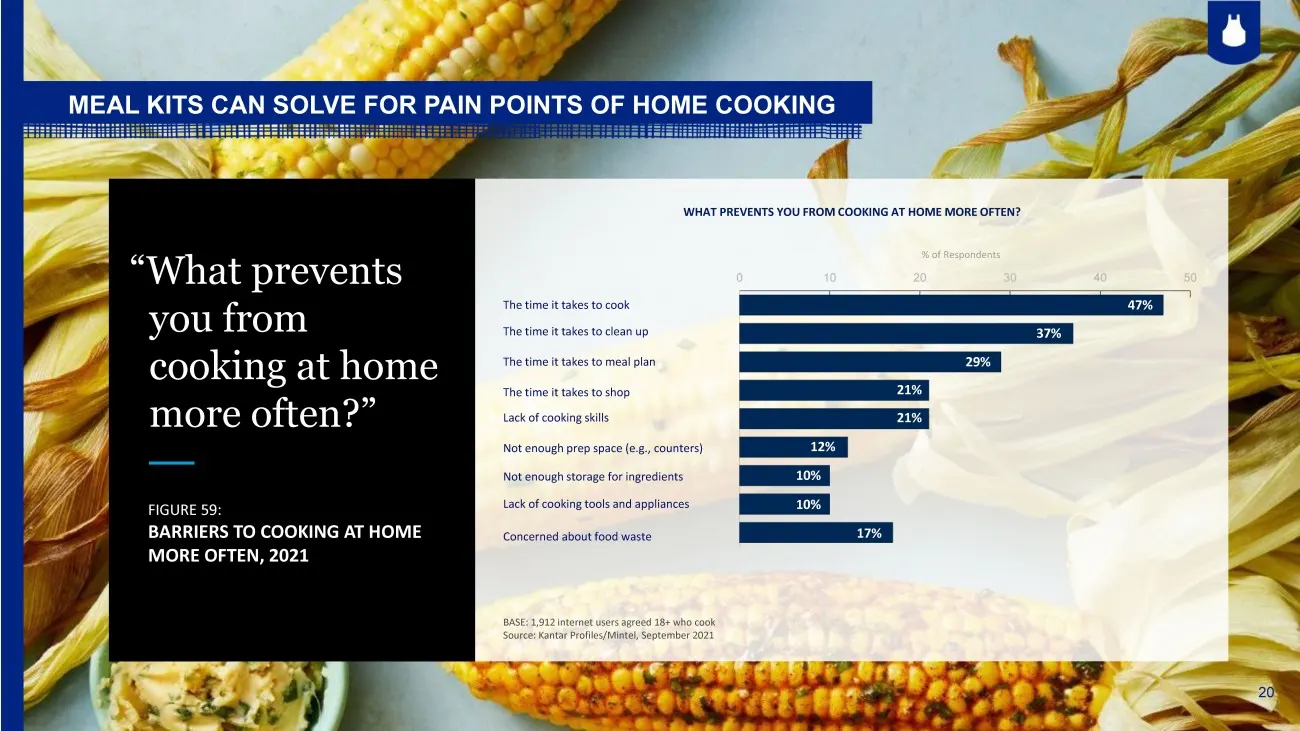
Slide 20: Meal kits can solve for pain points of home cooking
20 MEAL KITS CAN SOLVE FOR PAIN POINTS OF HOME COOKING FIGURE 59: BARRIERS TO COOKING AT HOME MORE OFTEN, 2021 “What prevents you from cooking at home more often?” The time it takes to cook The time it takes to clean up 47% The time it takes to meal plan The time it takes to shop Lack of cooking ski
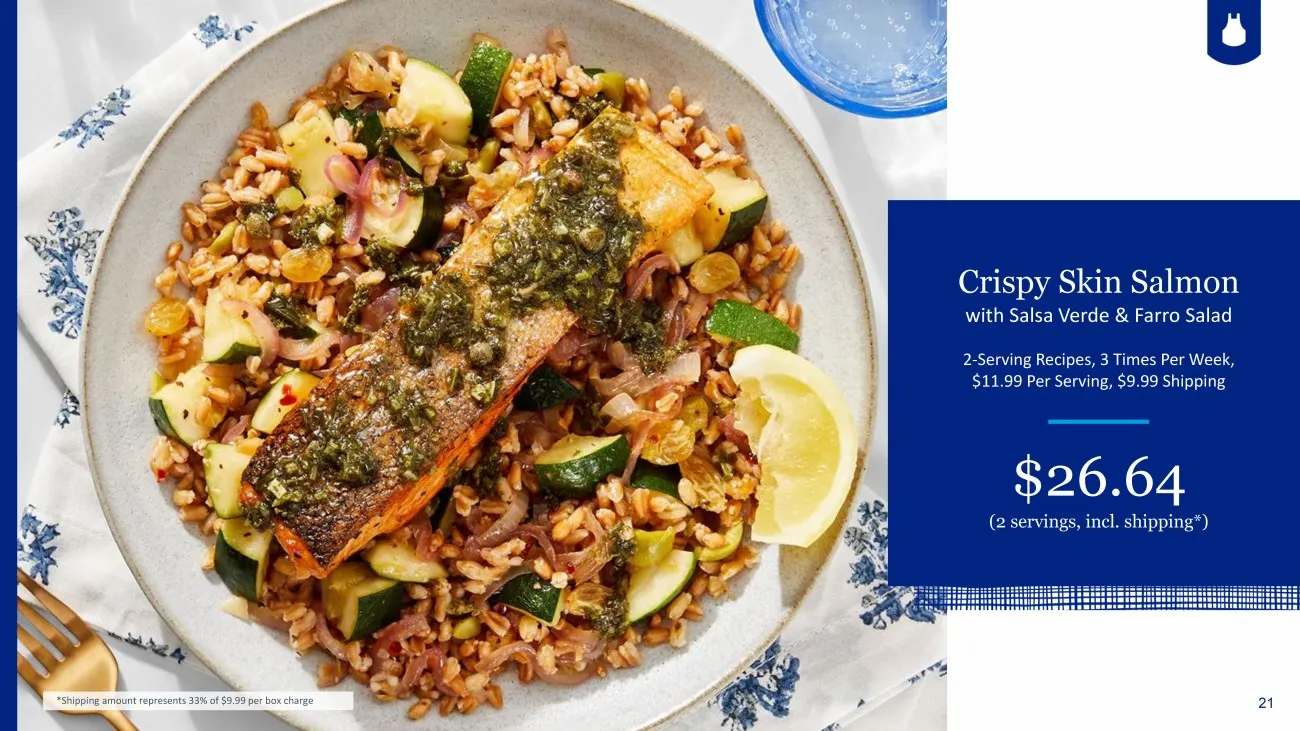
Slide 21: Illustrative recipe pricing per serving
21 $26.64 (2 servings, incl. shipping*) 2 - Serving Recipes, 3 Times Per Week, $11.99 Per Serving, $9.99 Shipping Crispy Skin Salmon with Salsa Verde & Farro Salad *Shipping amount represents 33% of $9.99 per box charge
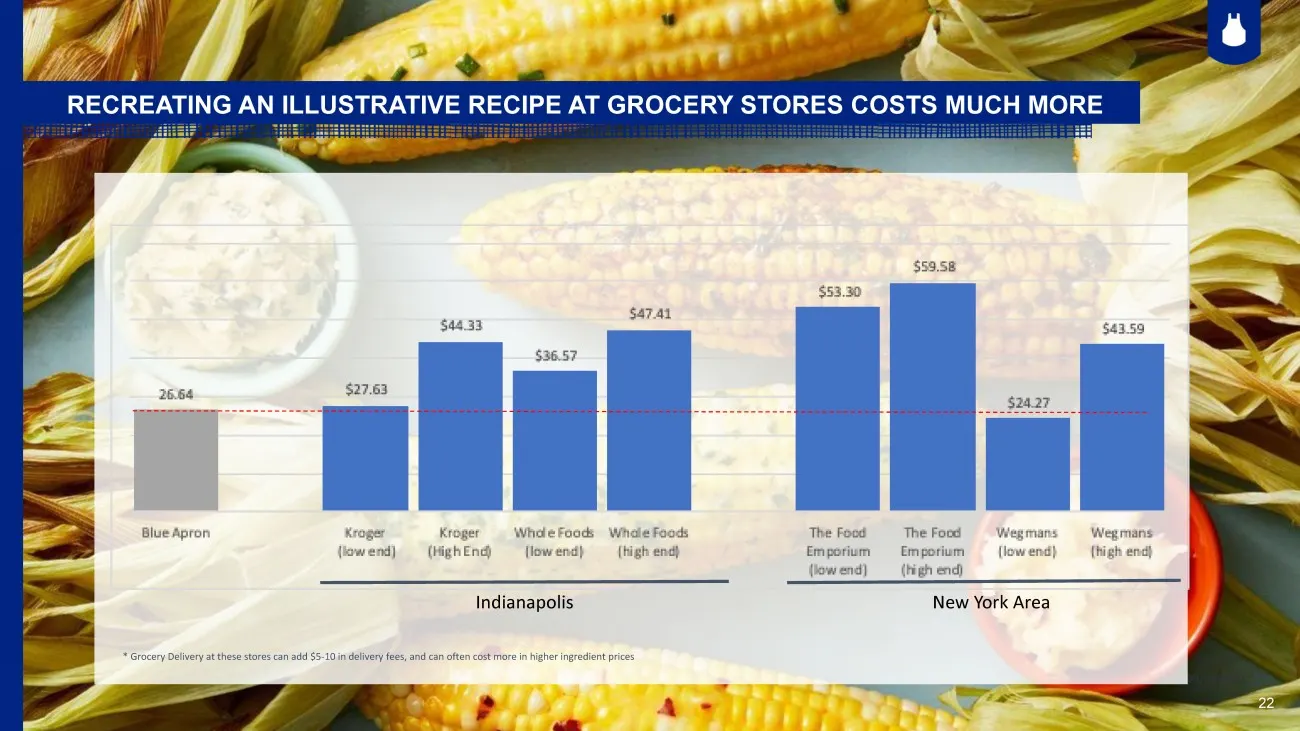
Slide 22: Recreating a recipe at grocery stores costs much more
22 CONFIDENTIAL RECREATING AN ILLUSTRATIVE RECIPE AT GROCERY STORES COSTS MUCH MORE New York Area Indianapolis * Grocery Delivery at these stores can add $5 - 10 in delivery fees, and can often cost more in higher ingredient prices 22
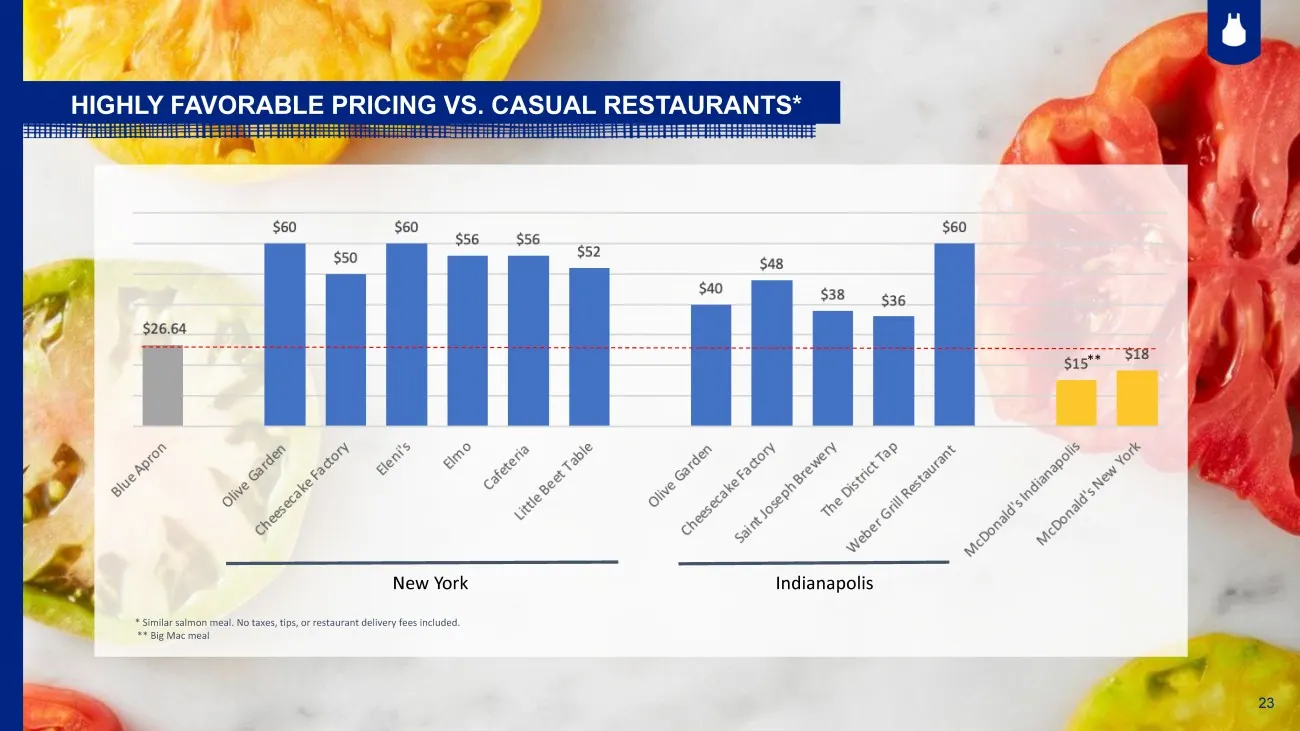
Slide 23: Highly favorable pricing vs. casual restaurants
23 HIGHLY FAVORABLE PRICING VS. CASUAL RESTAURANTS* New York Indianapolis ** * Similar salmon meal. No taxes, tips, or restaurant delivery fees included. ** Big Mac meal 23
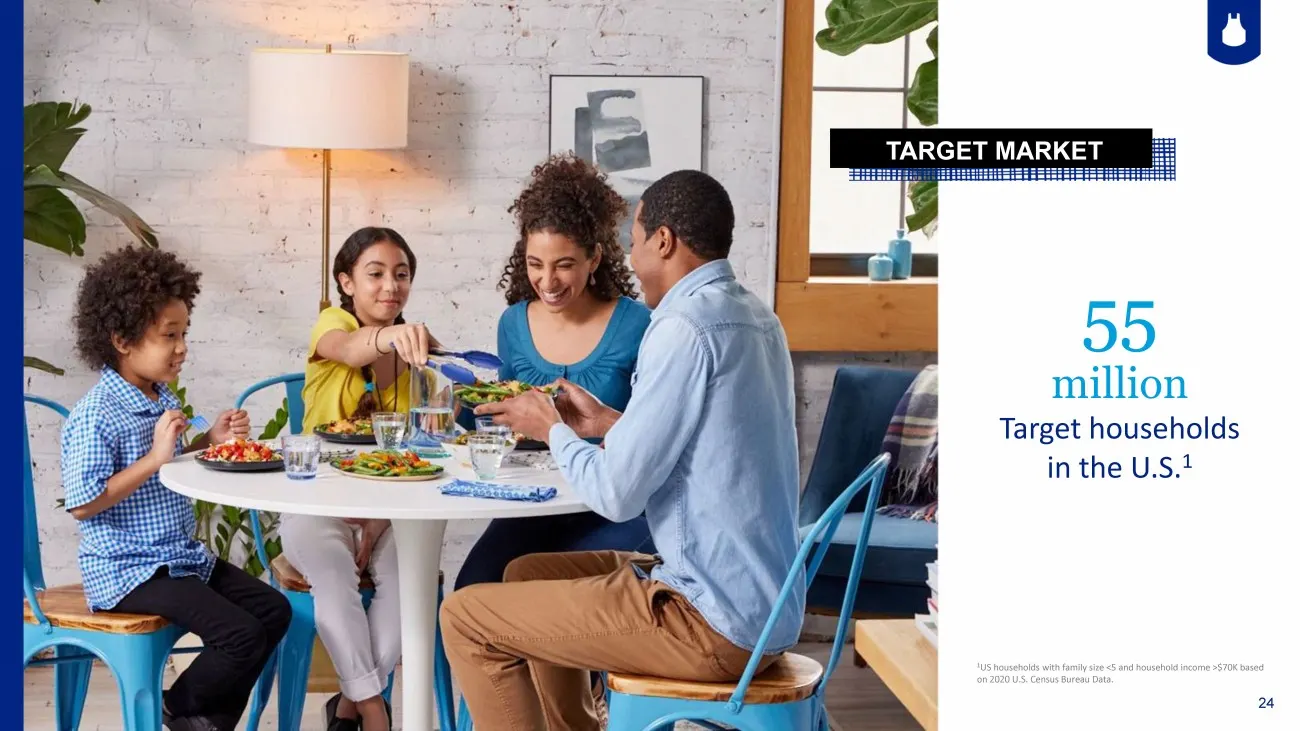
Slide 24: Target market: 55 million households
1 US households with family size <5 and household income >$70K based on 2020 U.S. Census Bureau Data. TARGET MARKET 55 million Target households in the U.S. 1 24
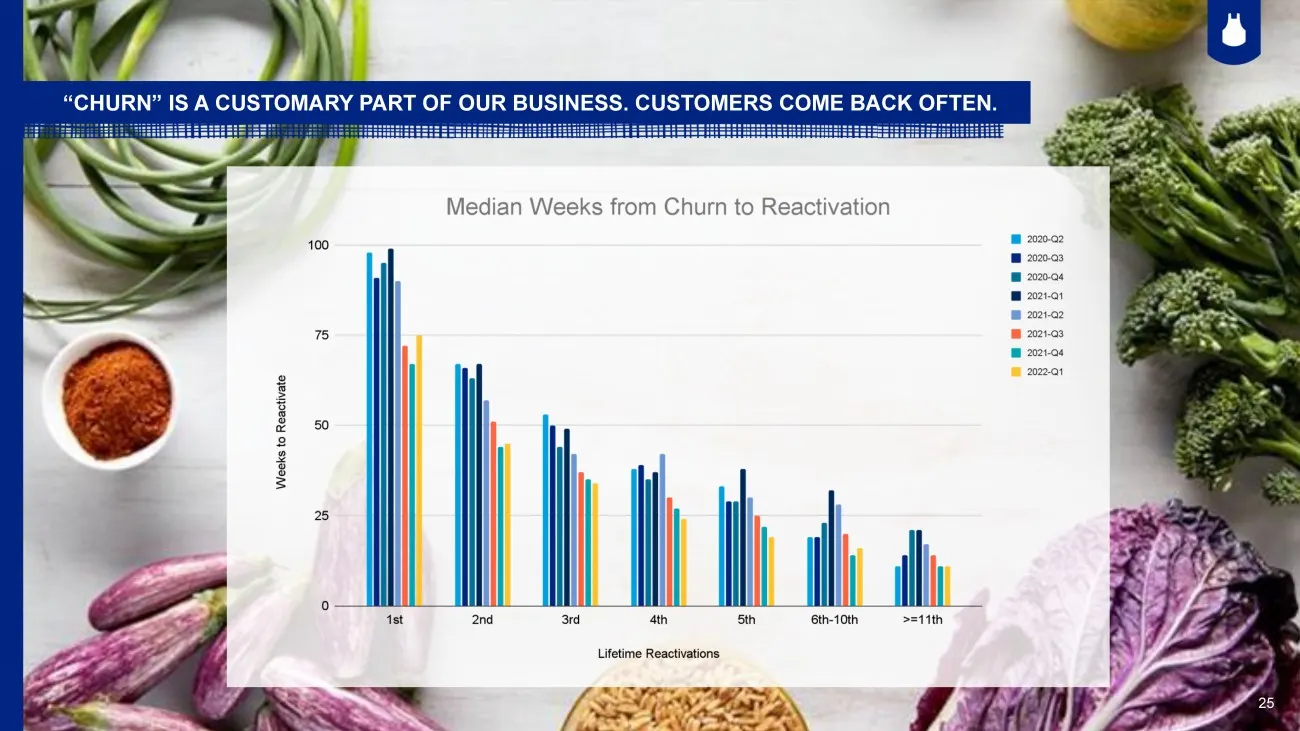
Slide 25: Churn is a customary part of our business
25 “CHURN” IS A CUSTOMARY PART OF OUR BUSINESS. CUSTOMERS COME BACK OFTEN. 25
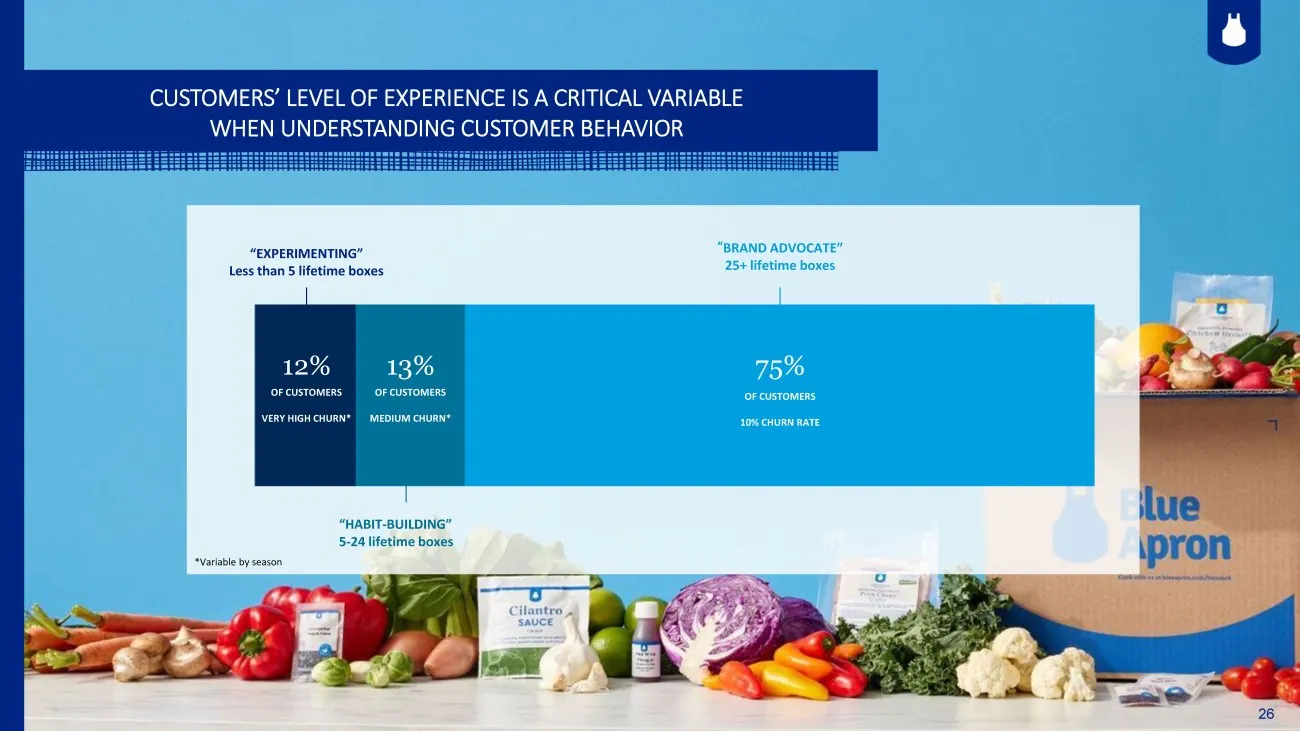
Slide 26: Customer experience level is critical to behavior
26 CUSTOMERS’ LEVEL OF EXPERIENCE IS A CRITICAL VARIABLE WHEN UNDERSTANDING CUSTOMER BEHAVIOR “EXPERIMENTING” Less than 5 lifetime boxes “HABIT - BUILDING” 5 - 24 lifetime boxes “ BRAND ADVOCATE” 25+ lifetime boxes OF CUSTOMERS VERY HIGH CHURN* OF CUSTOMERS 10% CHURN RATE 12% OF CUSTOMERS MEDIUM CHU
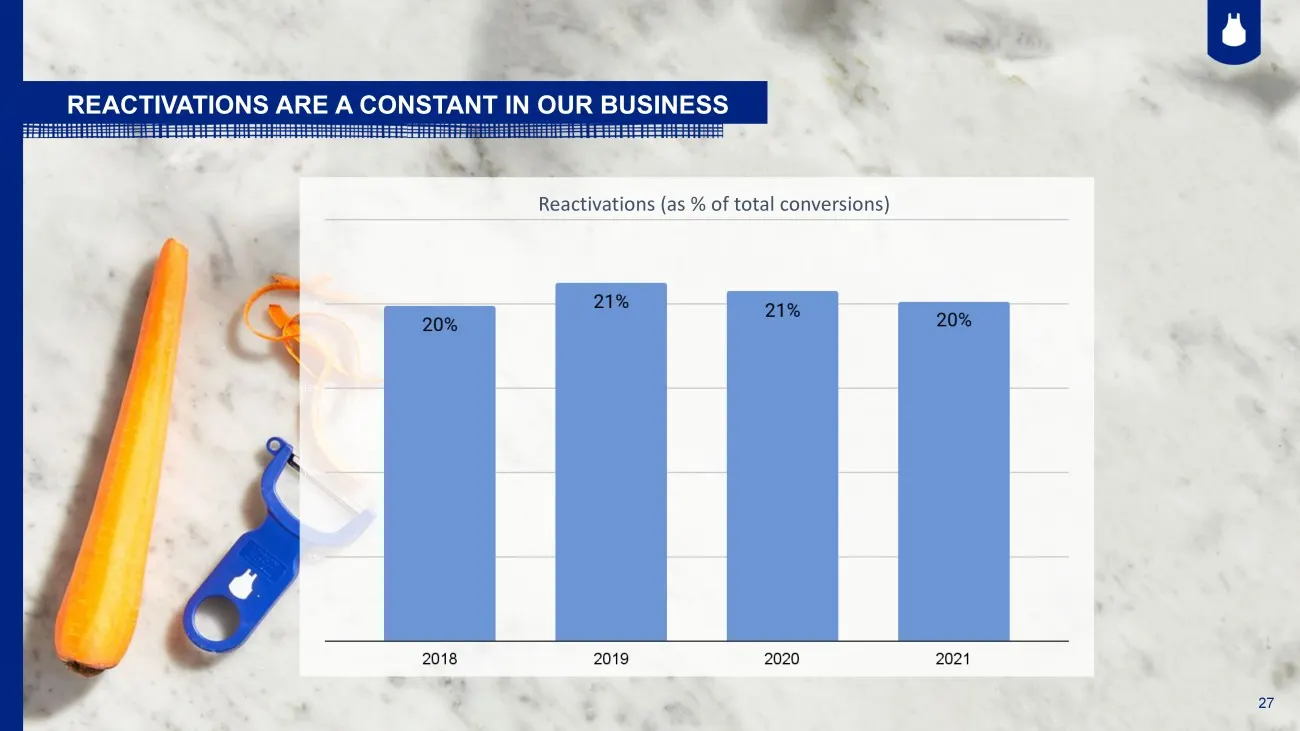
Slide 27: Reactivations are a constant in our business
27 27 REACTIVATIONS ARE A CONSTANT IN OUR BUSINESS Reactivations (as % of total conversions)
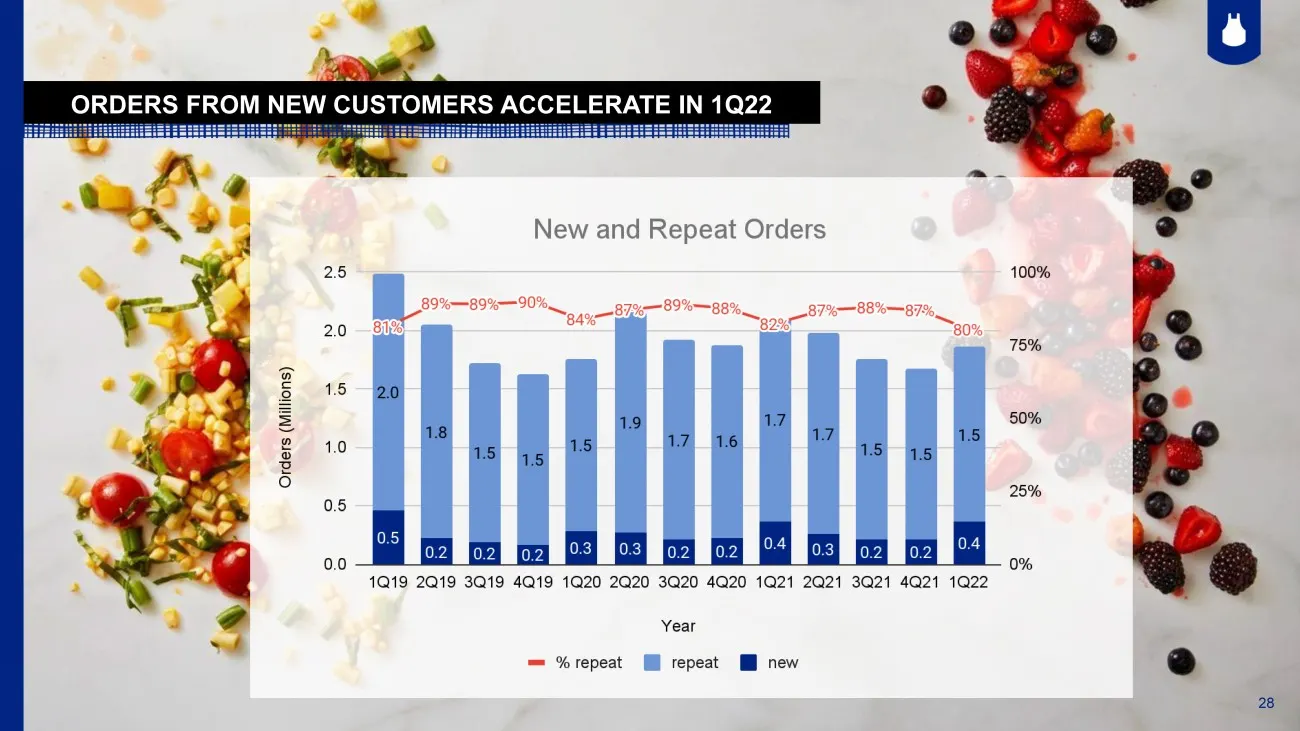
Slide 28: Orders from new customers accelerate in 1Q22
28 ORDERS FROM NEW CUSTOMERS ACCELERATE IN 1Q22 28
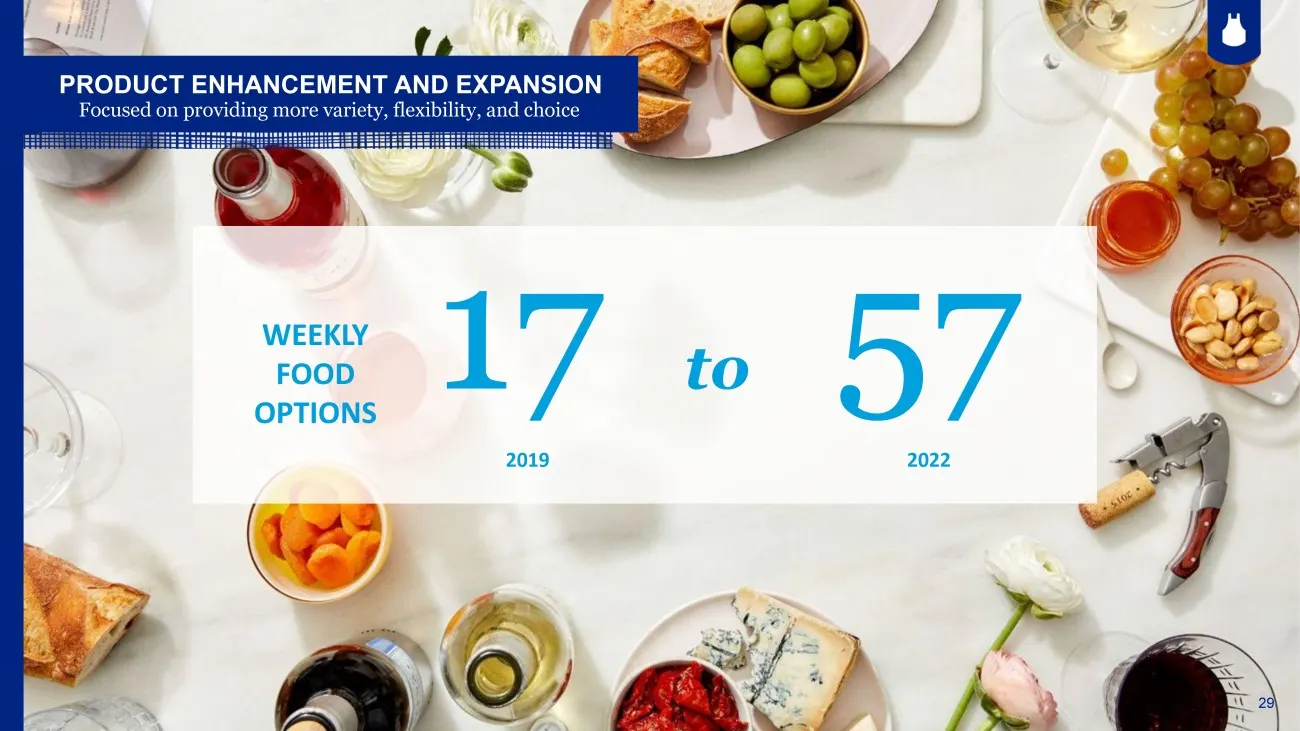
Slide 29: Product enhancement and expansion
29 17 to 57 PRODUCT ENHANCEMENT AND EXPANSION Focused on providing more variety, flexibility, and choice 2019 2022 WEEKLY FOOD OPTIONS 29
Slide 30: Heat & Eat
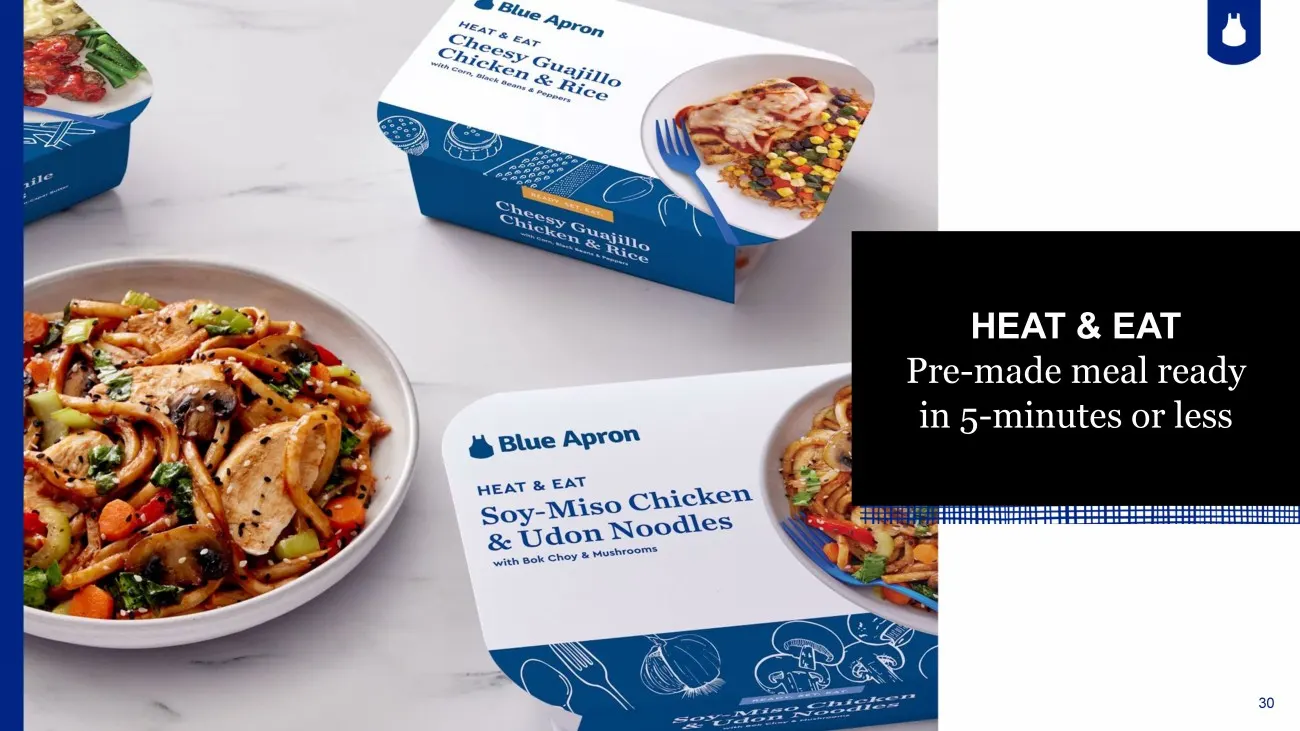
30 TM HEAT & EAT Pre - made meal ready in 5 - minutes or less
Slide 31: Expanding partnerships & collaborations with leading brands
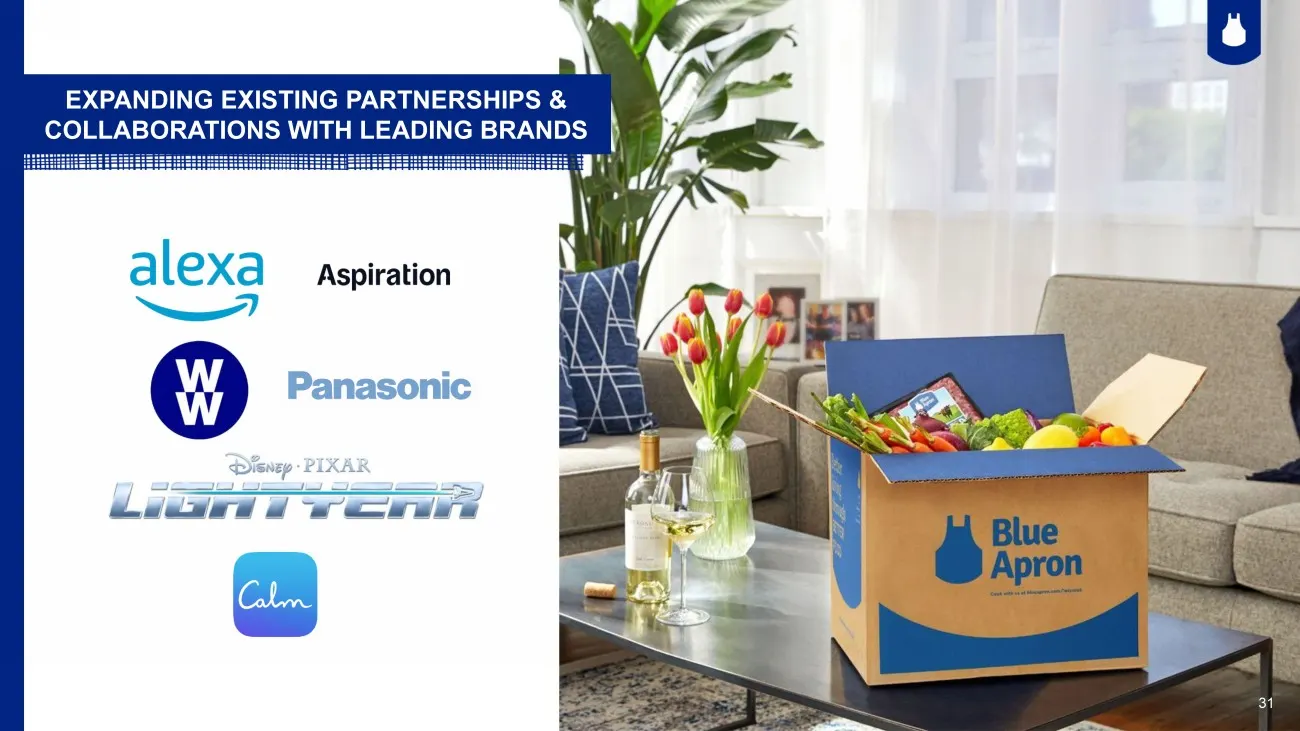
31 EXPANDING EXISTING PARTNERSHIPS & COLLABORATIONS WITH LEADING BRANDS 31
Slide 32: Partnerships with notable chefs
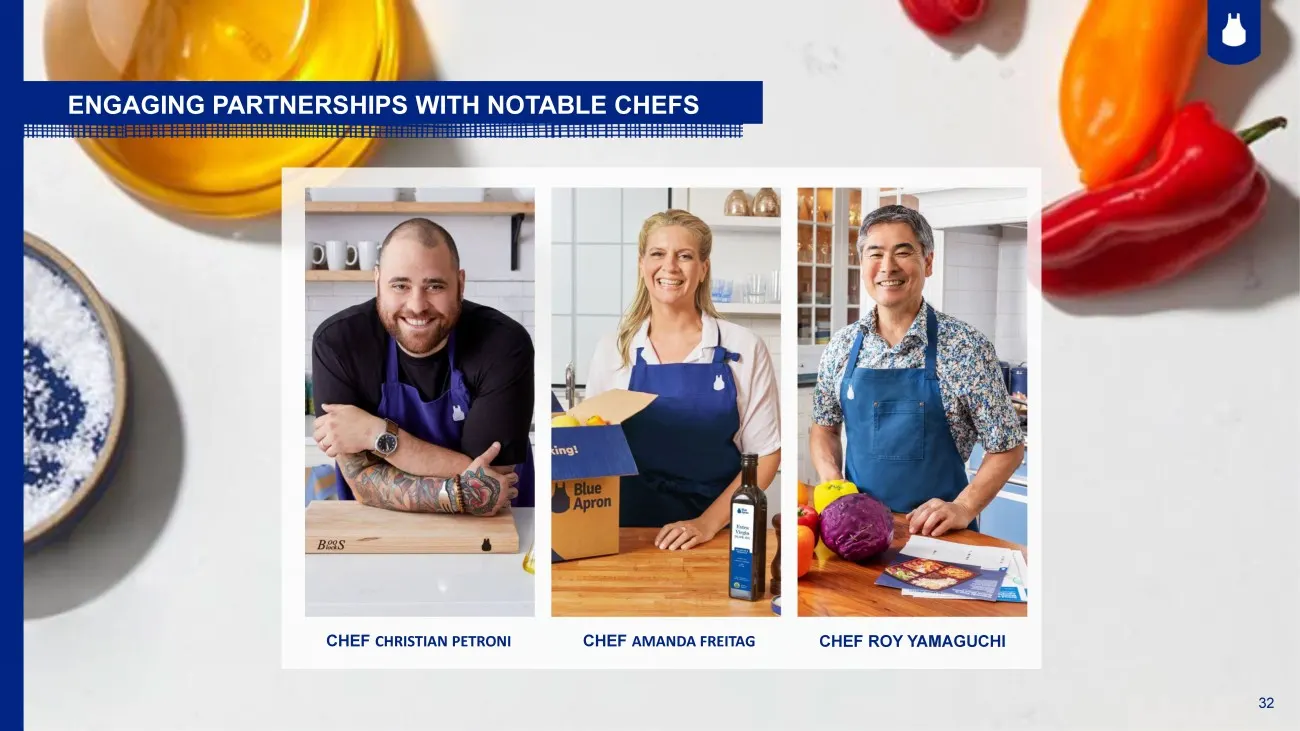
32 CHEF ROY YAMAGUCHI CHEF CHRISTIAN PETRONI CHEF AMANDA FREITAG ENGAGING PARTNERSHIPS WITH NOTABLE CHEFS 32
Slide 33: Customers: all ages
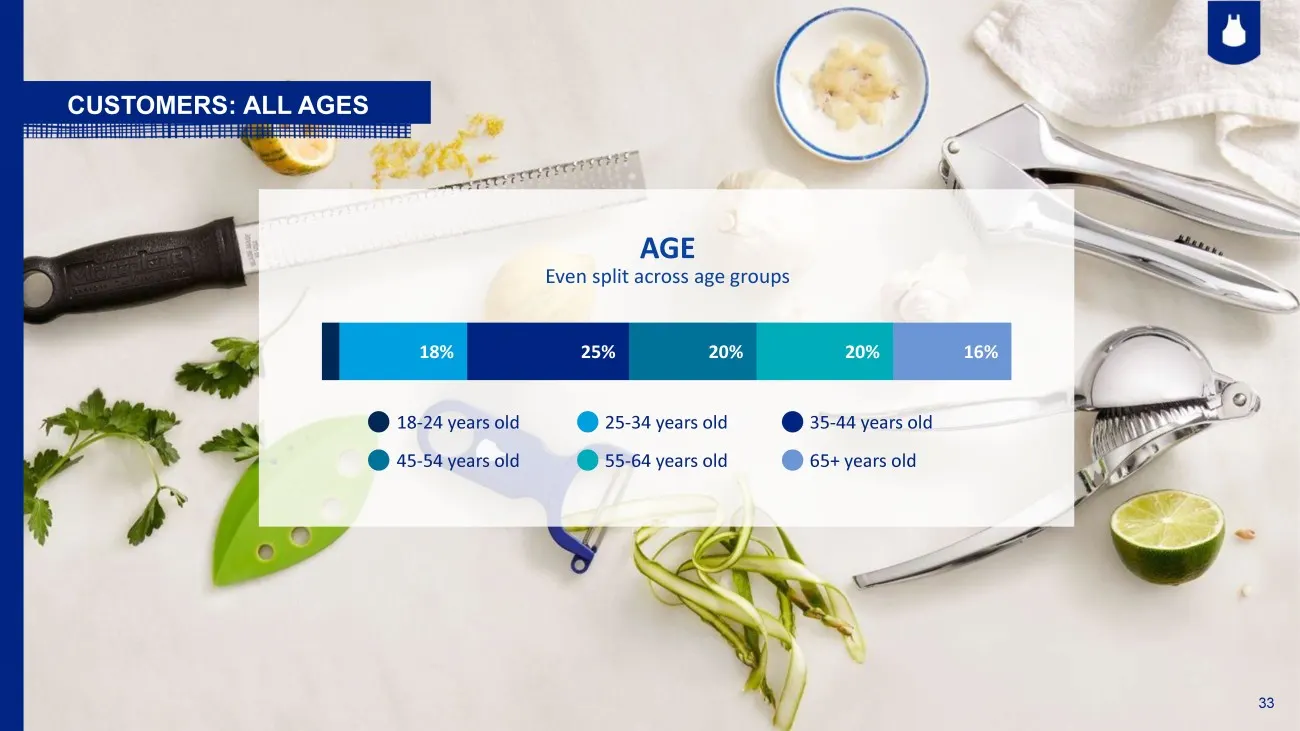
33 AGE Even split across age groups CUSTOMERS: ALL AGES 16% 20% 20% 25% 18% 18 - 24 years old 25 - 34 years old 35 - 44 years old 45 - 54 years old 55 - 64 years old 65+ years old 33
Slide 34: Household size
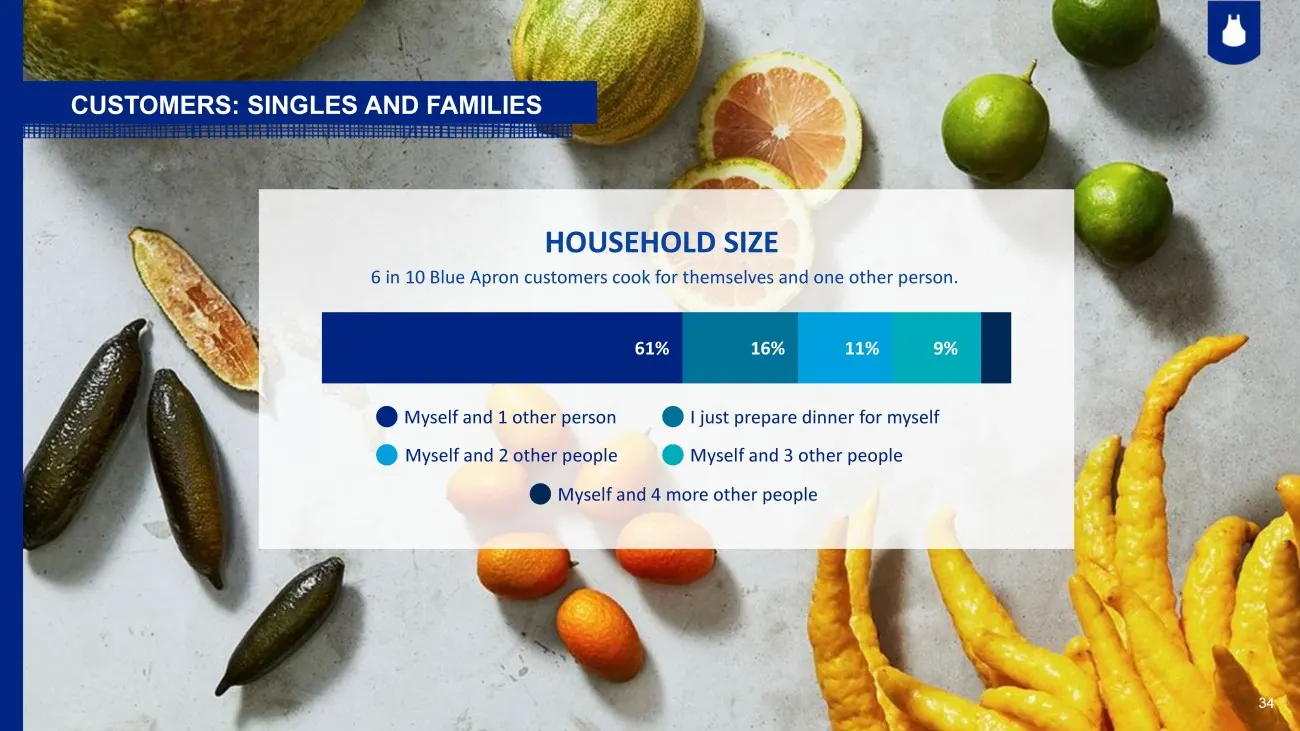
34 HOUSEHOLD SIZE 6 in 10 Blue Apron customers cook for themselves and one other person. CUSTOMERS: SINGLES AND FAMILIES 9% 11% 16% 61% Myself and 1 other person I just prepare dinner for myself Myself and 2 other people Myself and 3 other people Myself and 4 more other people 34
Slide 35: Children
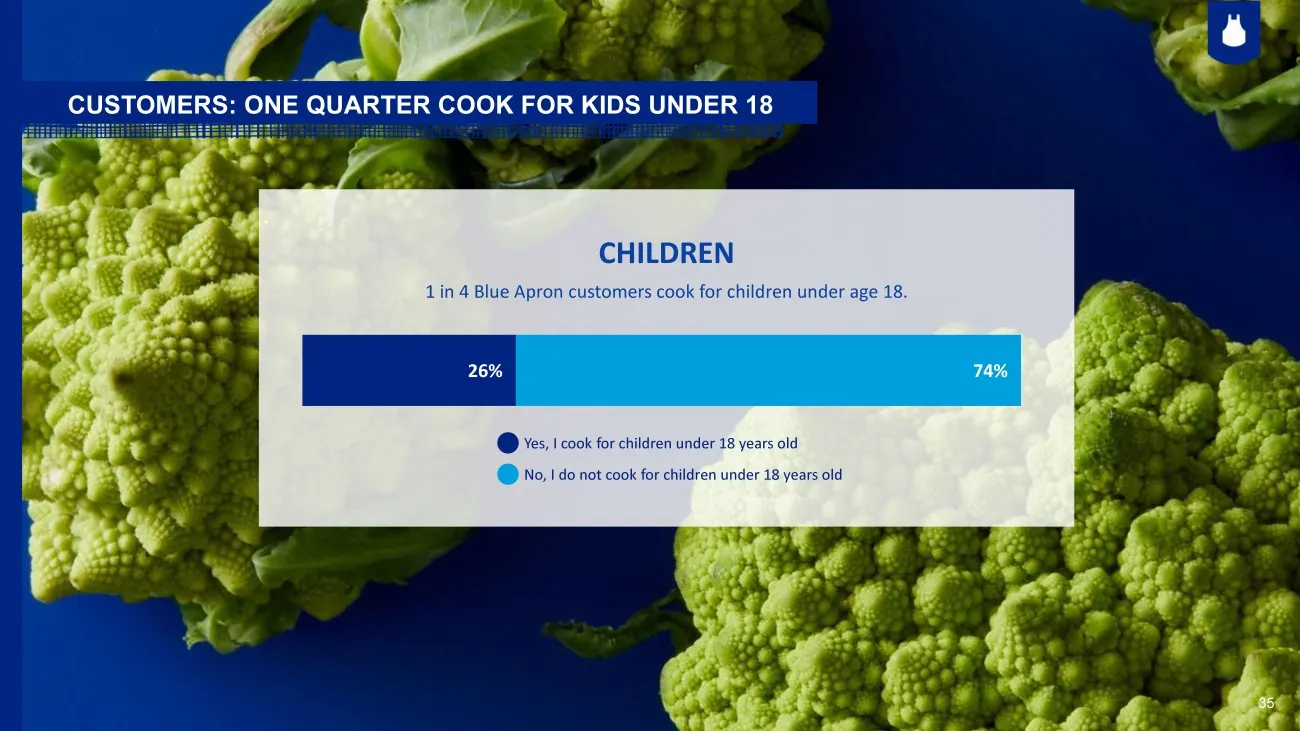
35 CHILDREN 1 in 4 Blue Apron customers cook for children under age 18. 74% 26% CUSTOMERS: ONE QUARTER COOK FOR KIDS UNDER 18 No, I do not cook for children under 18 years old Yes, I cook for children under 18 years old 35
Slide 36: Where do Blue Apron customers live?
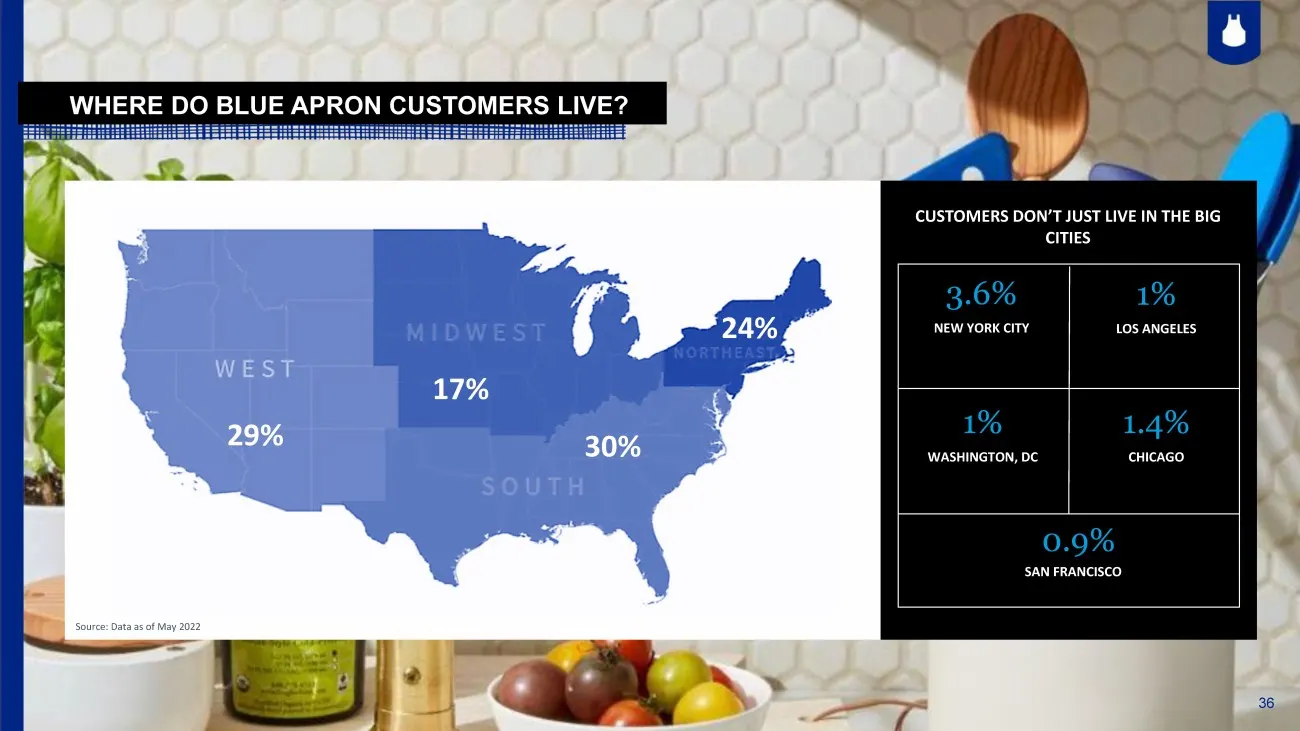
36 WHERE DO BLUE APRON CUSTOMERS LIVE? 24% 30% 29% 17% 3.6% NEW YORK CITY CUSTOMERS DON’T JUST LIVE IN THE BIG CITIES 1% LOS ANGELES 1% WASHINGTON, DC 1.4% CHICAGO 0.9% SAN FRANCISCO Source: Data as of May 2022 36
Slide 37: Average annual household income
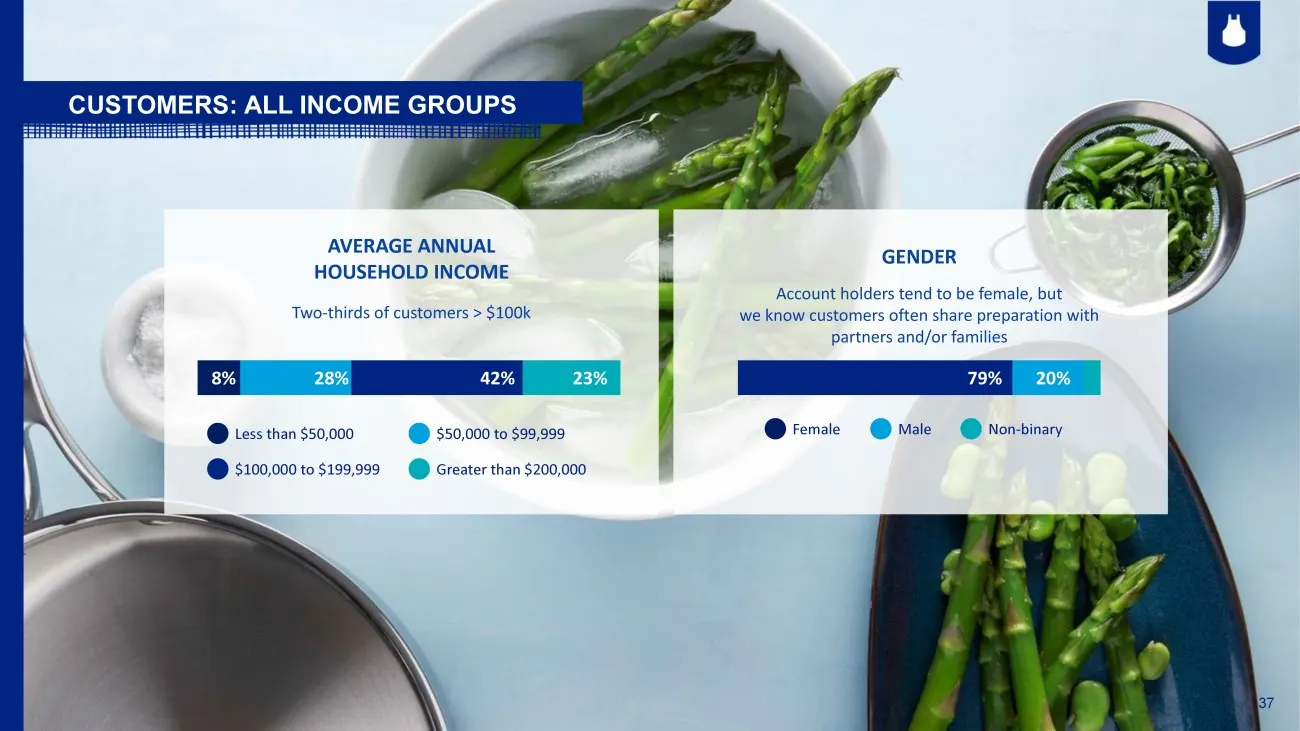
37 AVERAGE ANNUAL HOUSEHOLD INCOME Two - thirds of customers > $100k 8% 28% 42% 23% GENDER Account holders tend to be female, but we know customers often share preparation with partners and/or families CUSTOMERS: ALL INCOME GROUPS 79% 20% Less than $50,000 $50,000 to $99,999 $100,000 to $199,999 Gre
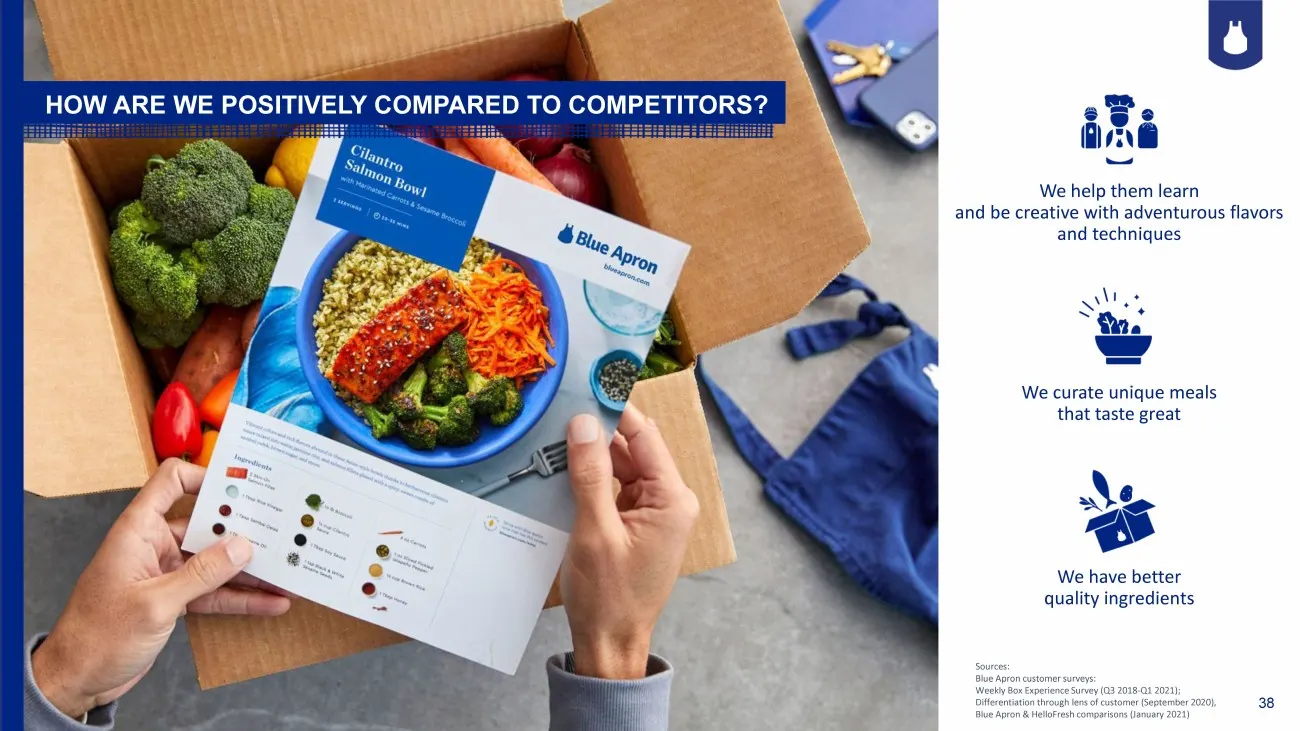
Slide 38: How are we positively compared to competitors?
38 We help them learn and be creative with adventurous flavors and techniques Sources: Blue Apron customer surveys: Weekly Box Experience Survey (Q3 2018 - Q1 2021); Differentiation through lens of customer (September 2020), Blue Apron & HelloFresh comparisons (January 2021) We curate unique meals t
Slide 39: Better than other brands
39 “I've tried other companies, including … and felt Blue Apron is by far the best in recipe, customer service, portion size, and overall cost.” (MARCH 2022) BETTER THAN OTHER BRANDS “The food quality is excellent… The flavors are amazing and unique and the meals are easy to prepare. I’ve tried […]
Slide 40: Perception of value
40 PERCEPTION OF VALUE “I really enjoy the ease of access to ingredients. If I went to the store to buy all these ingredients, it would be a higher cost and I would be left with things I need to use of throw away. … I can have gourmet meals that taste better than ordering from a restaurant and are a
Slide 41: Empowerment
41 EMPOWERMENT “Very convenient. … The recipes are very well written and have given my two sons and husband the confidence to get dinner started without me. It’s been a huge blessing.” ( NOVEMBER 2021) “I LOVE everything about Blue Apron! I used to dread everything about dinnertime. I felt unenthuse
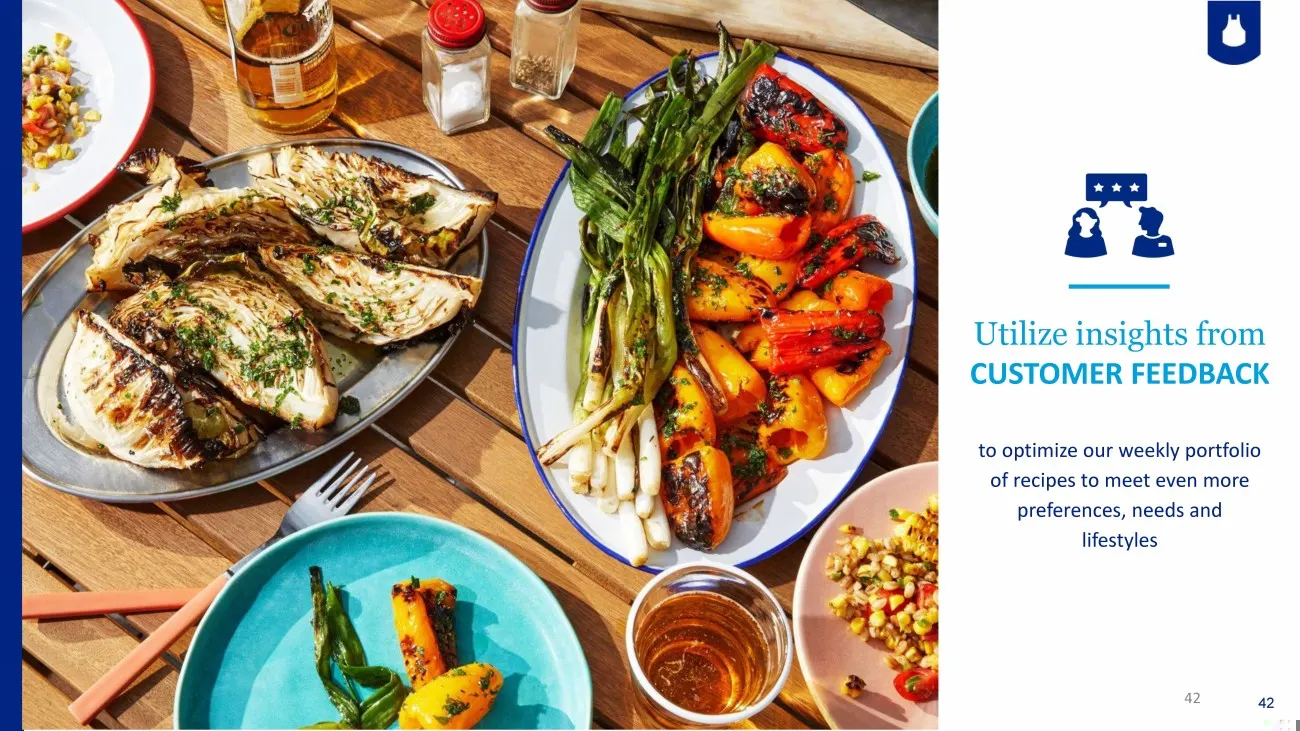
Slide 42: Utilize customer feedback to optimize recipe portfolio
Utilize insights from CUSTOMER FEEDBACK to optimize our weekly portfolio of recipes to meet even more preferences, needs and lifestyles 42 42
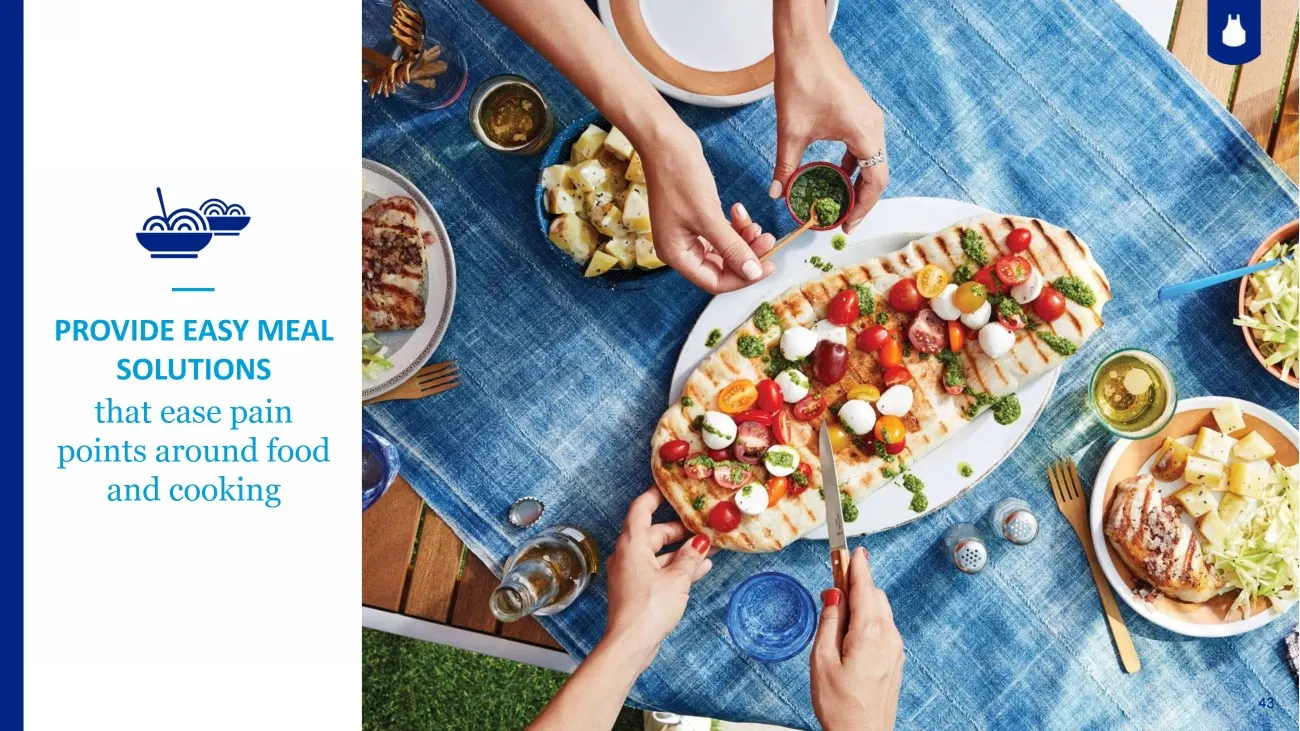
Slide 43: Provide easy meal solutions
PROVIDE EASY MEAL SOLUTIONS that ease pain points around food and cooking 43
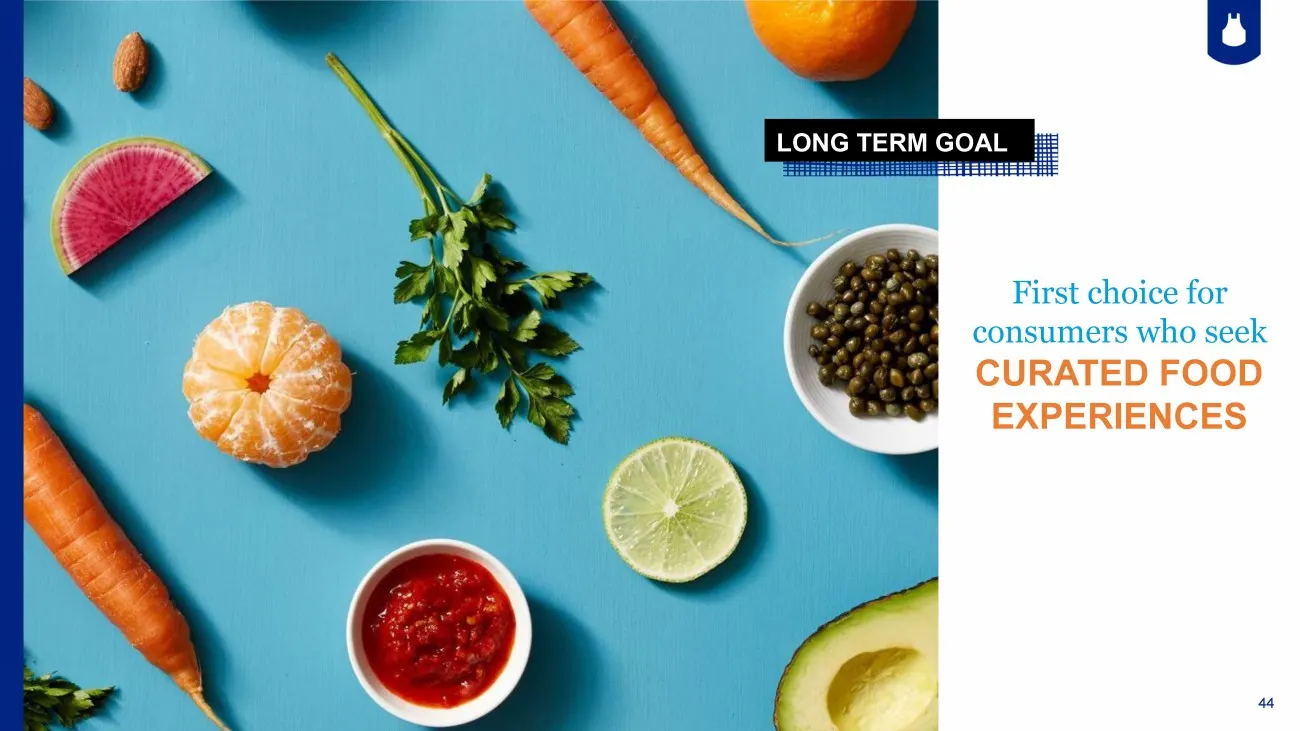
Slide 44: Long term goal: curated food experiences
44 LONG TERM GOAL CURATED FOOD EXPERIENCES First choice for consumers who seek
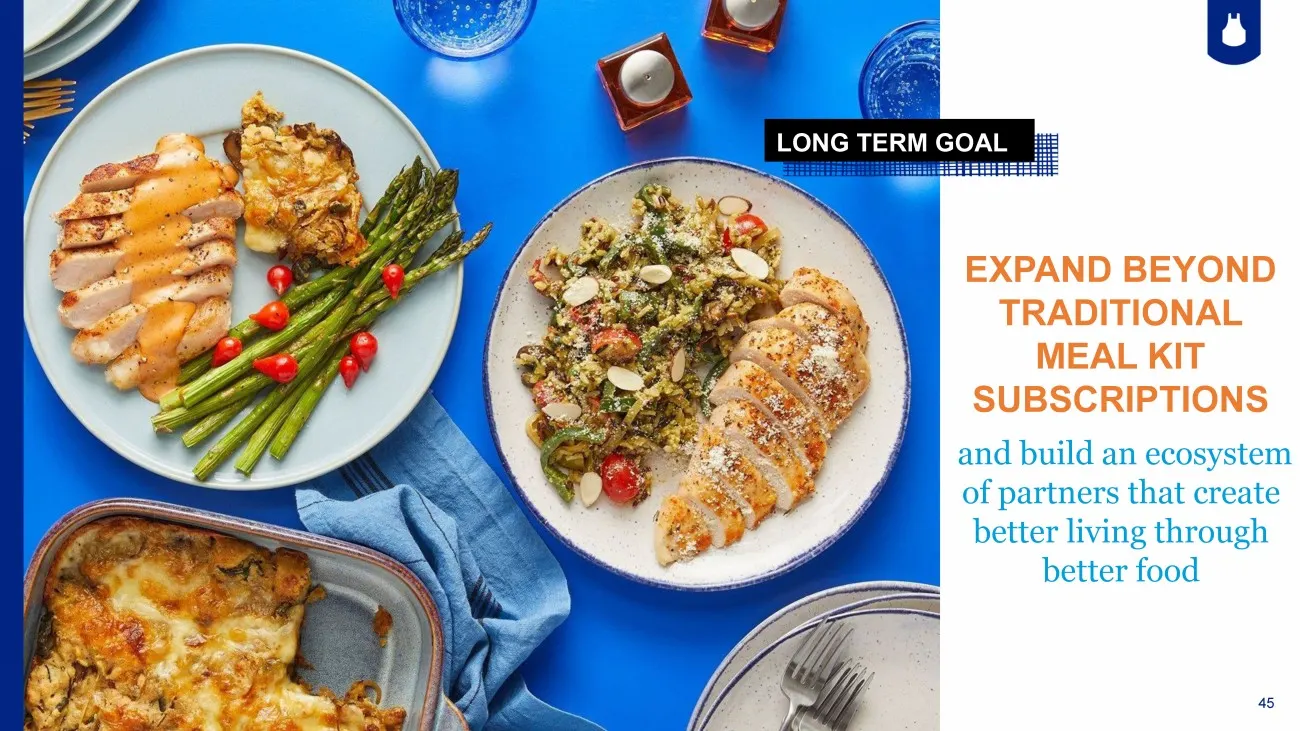
Slide 45: Long term goal: expand beyond traditional meal kit subscriptions
45 LONG TERM GOAL EXPAND BEYOND TRADITIONAL MEAL KIT SUBSCRIPTIONS and build an ecosystem of partners that create better living through better food 1
Slide 46: The Next Course
THE NEXT COURSE 46
Slide 47: The Next Course: Our 3-Year Plan
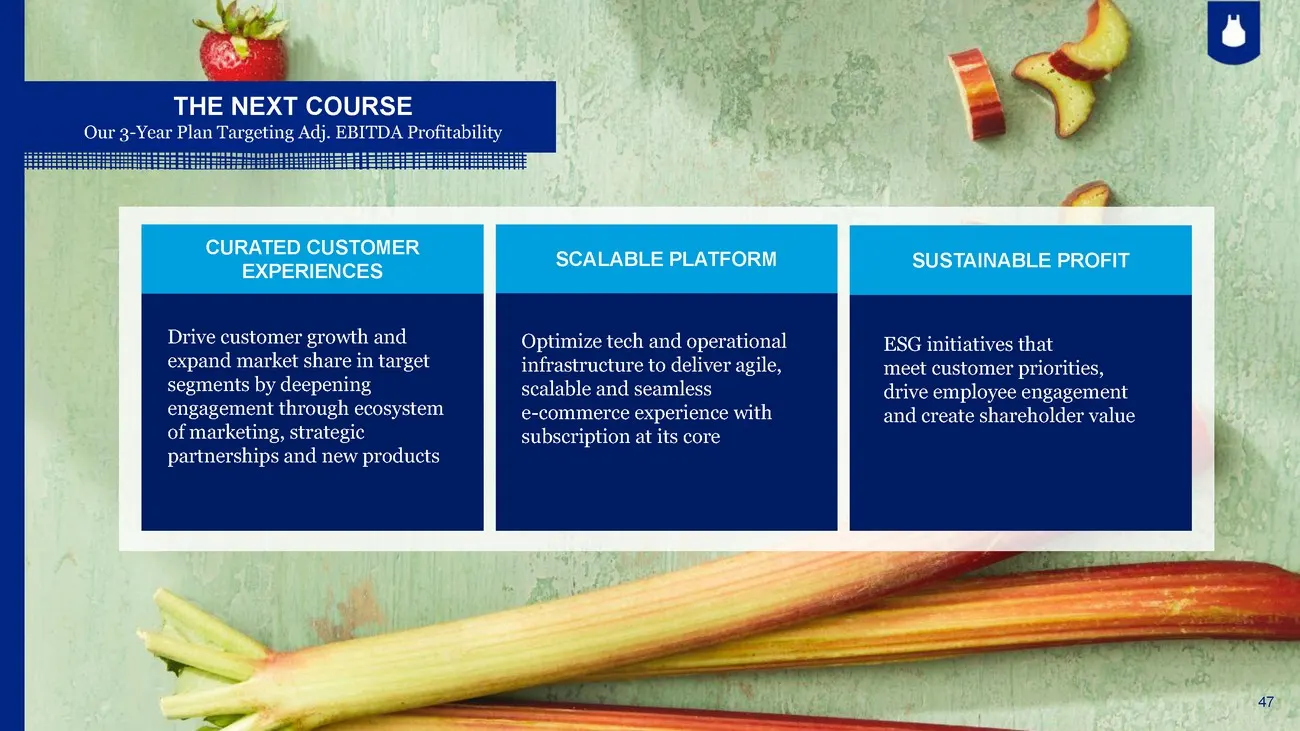
47 Optimize tech and operational infrastructure to deliver agile, scalable and seamless e-commerce experience with subscription at its core THE NEXT COURSE Our 3-Year Plan Targeting Adj. EBITDA Profitability Drive customer growth and expand market share in target segments by deepening engagement thr
Slide 48: Curated customer experiences
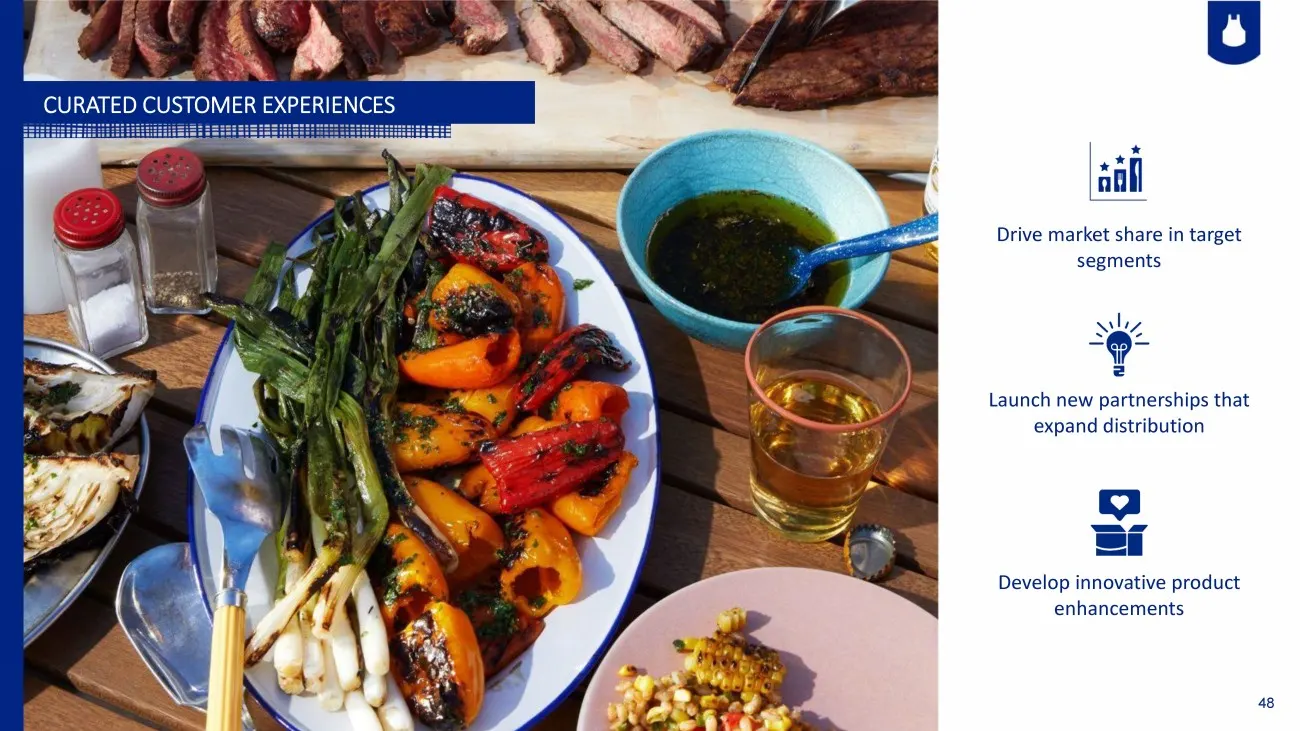
Drive market share in target segments Launch new partnerships that expand distribution Develop innovative product enhancements CURATED CUSTOMER EXPERIENCES 48
Slide 49: Blue Apron is going beyond subscription
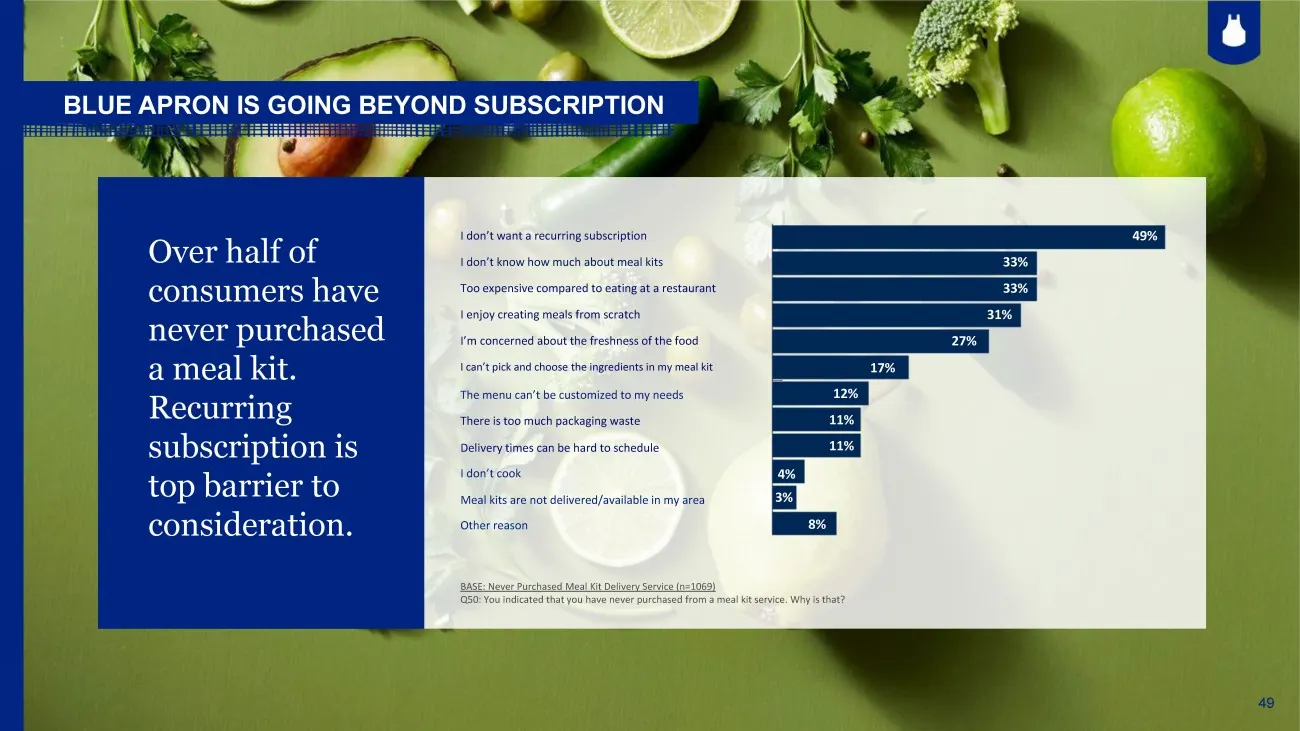
BLUE APRON IS GOING BEYOND SUBSCRIPTION Over half of consumers have never purchased a meal kit. Recurring subscription is top barrier to consideration. BASE: Never Purchased Meal Kit Delivery Service (n=1069) Q50: You indicated that you have never purchased from a meal kit service. Why is that? I do
Slide 50: Scalable platform
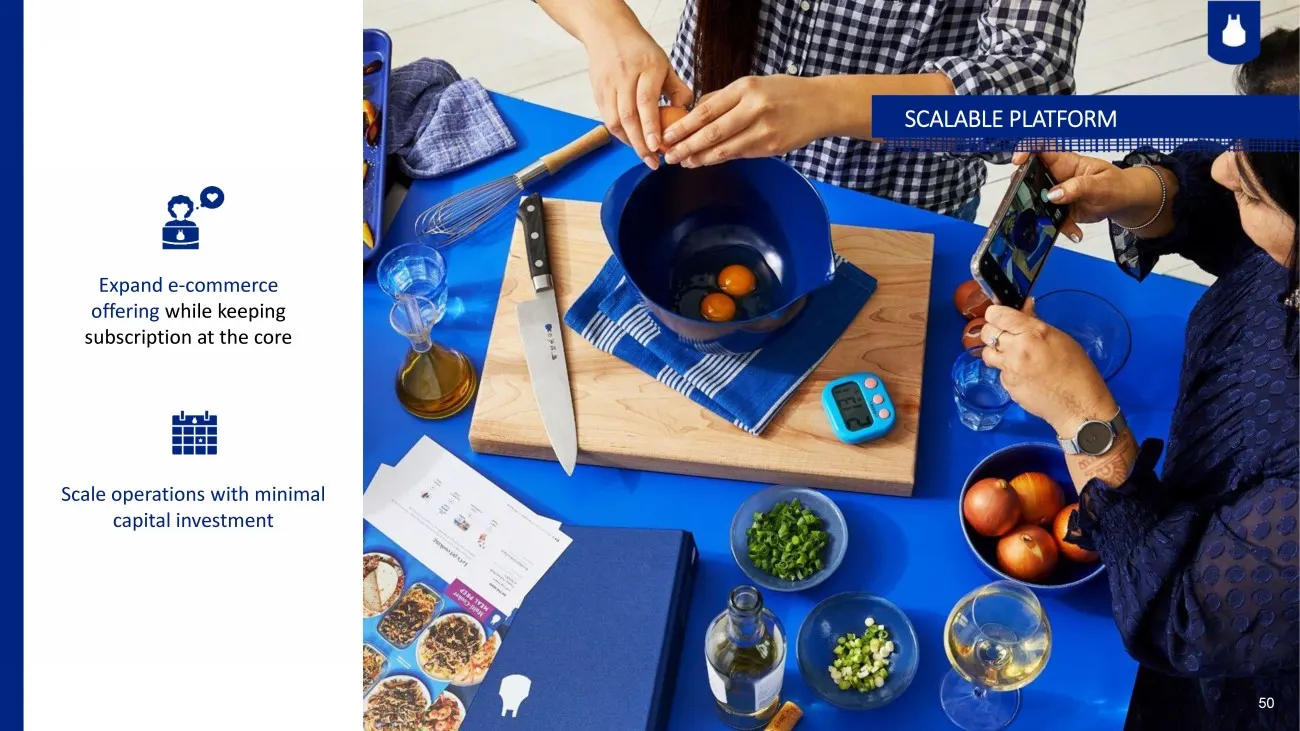
SCALABLE PLATFORM Expand e - commerce offering while keeping subscription at the core Scale operations with minimal capital investment 50
Slide 51: Sustainable profit: leverage ESG
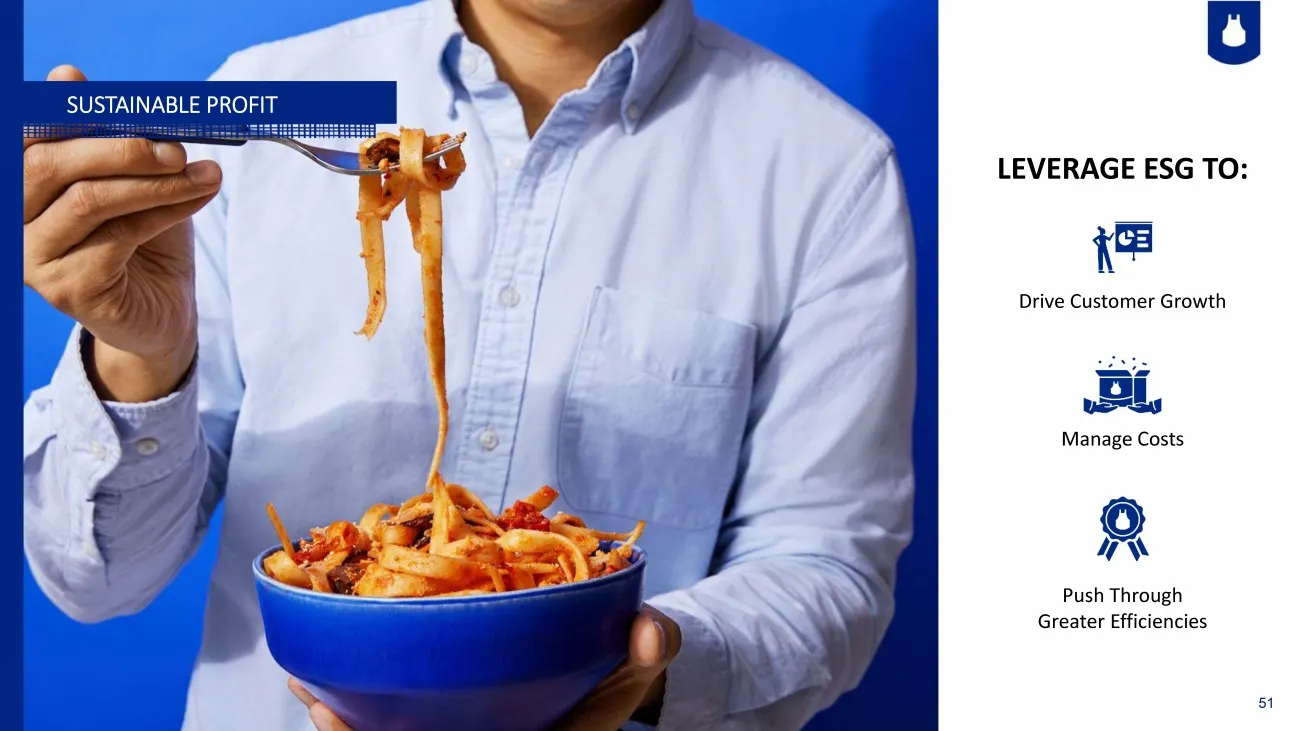
SUSTAINABLE PROFIT Drive Customer Growth Push Through Greater Efficiencies Manage Costs LEVERAGE ESG TO: 51
Slide 52: Consumers and employees on ESG best practices
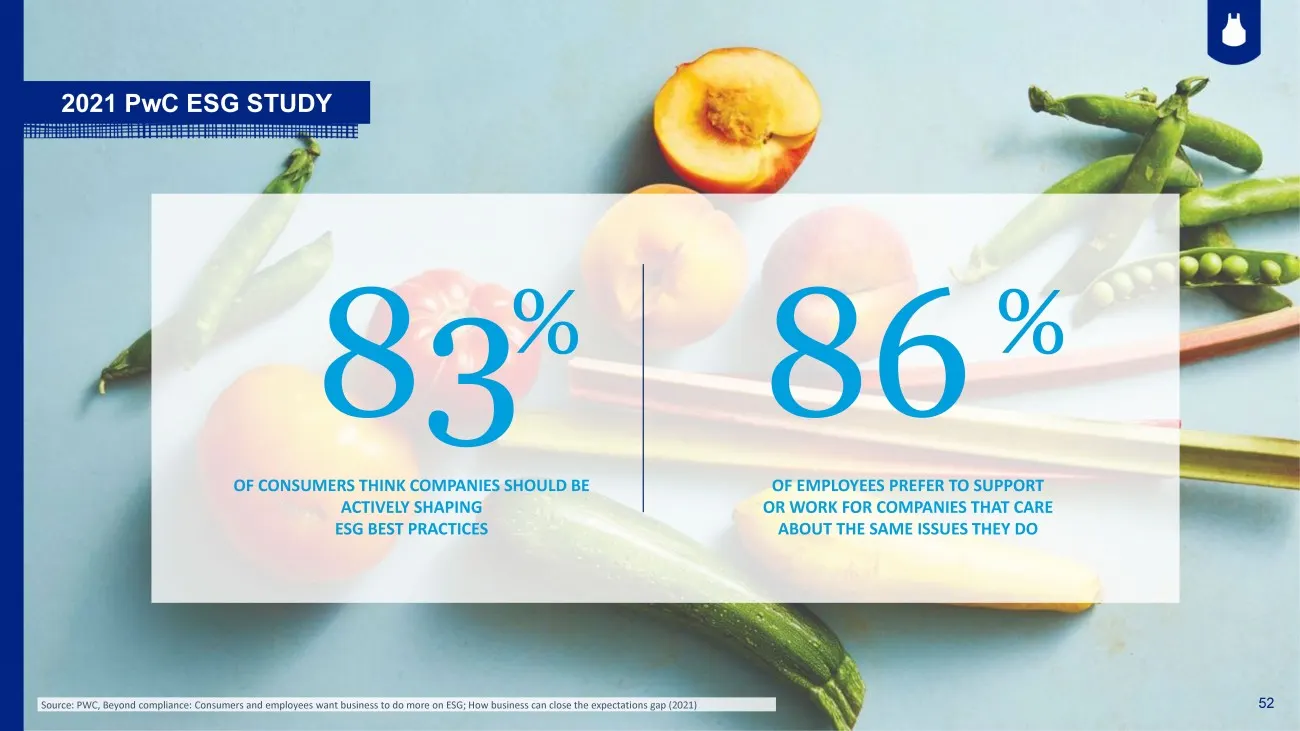
52 OF CONSUMERS THINK COMPANIES SHOULD BE ACTIVELY SHAPING ESG BEST PRACTICES OF EMPLOYEES PREFER TO SUPPORT OR WORK FOR COMPANIES THAT CARE ABOUT THE SAME ISSUES THEY DO 83 86 2021 PwC ESG STUDY % % Source: PWC, Beyond compliance: Consumers and employees want business to do more on ESG; How busines
Slide 53: 53 53
53 53
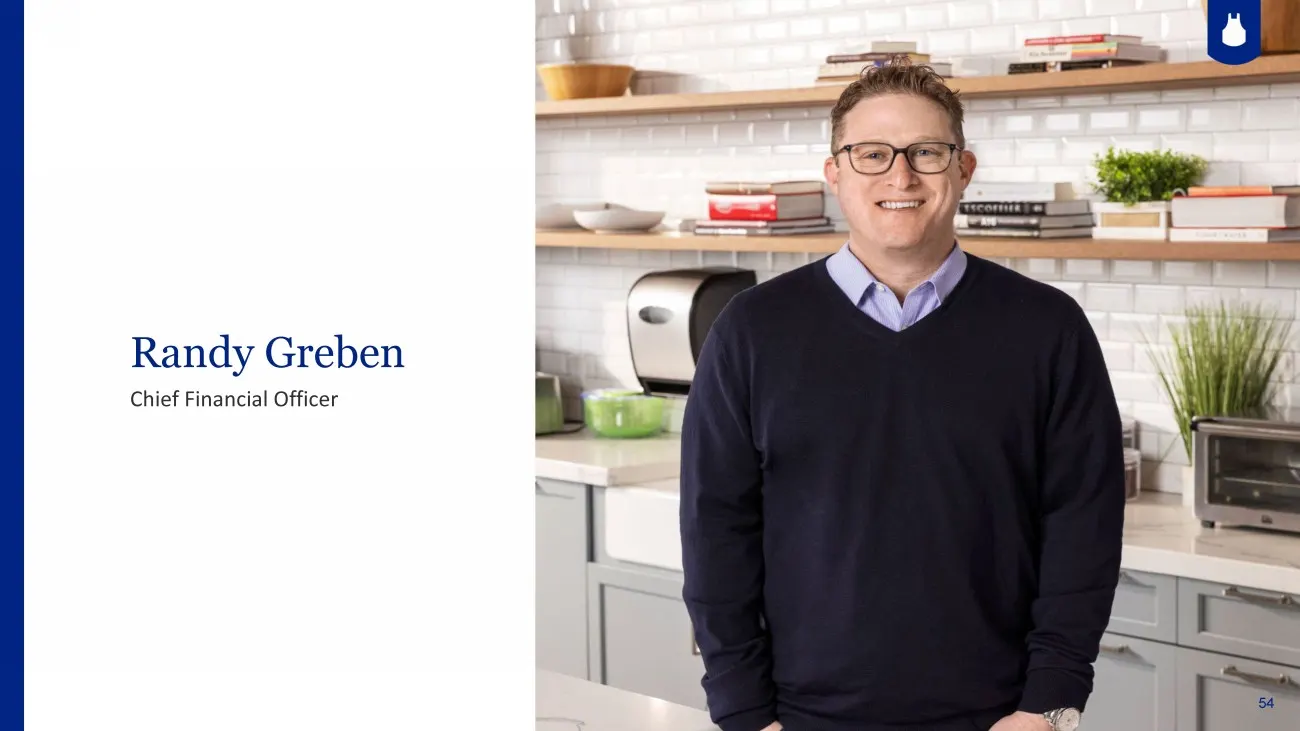
Slide 54: Randy Greben, Chief Financial Officer
54 Randy Greben Chief Financial Officer 54
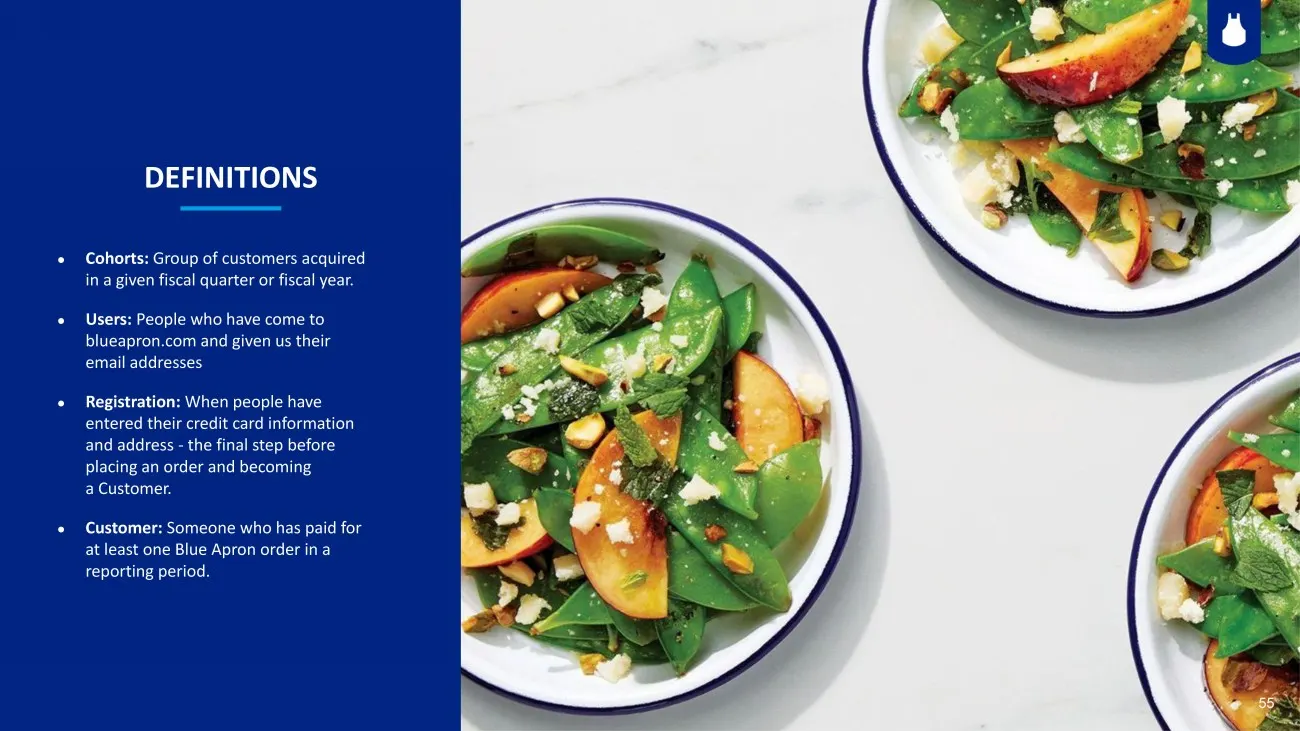
Slide 55: Definitions
55 ● Cohorts: Group of customers acquired in a given fiscal quarter or fiscal year. ● Users: P eople who have come to blueapron.com and given us their email addresses ● Registration: When people have entered their credit card information and address - the final step before placing an order and becom
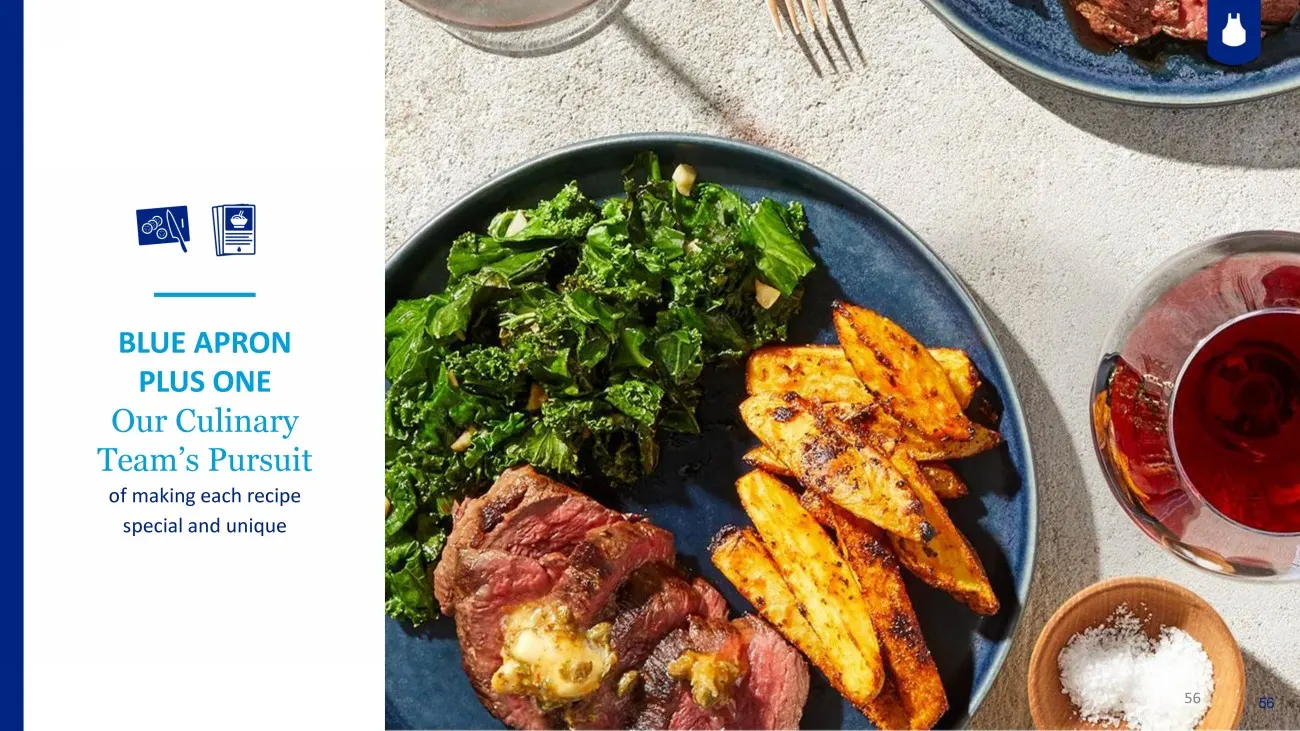
Slide 56: Blue Apron Plus One
BLUE APRON PLUS ONE Our Culinary Team’s Pursuit of making each recipe special and unique 56 56
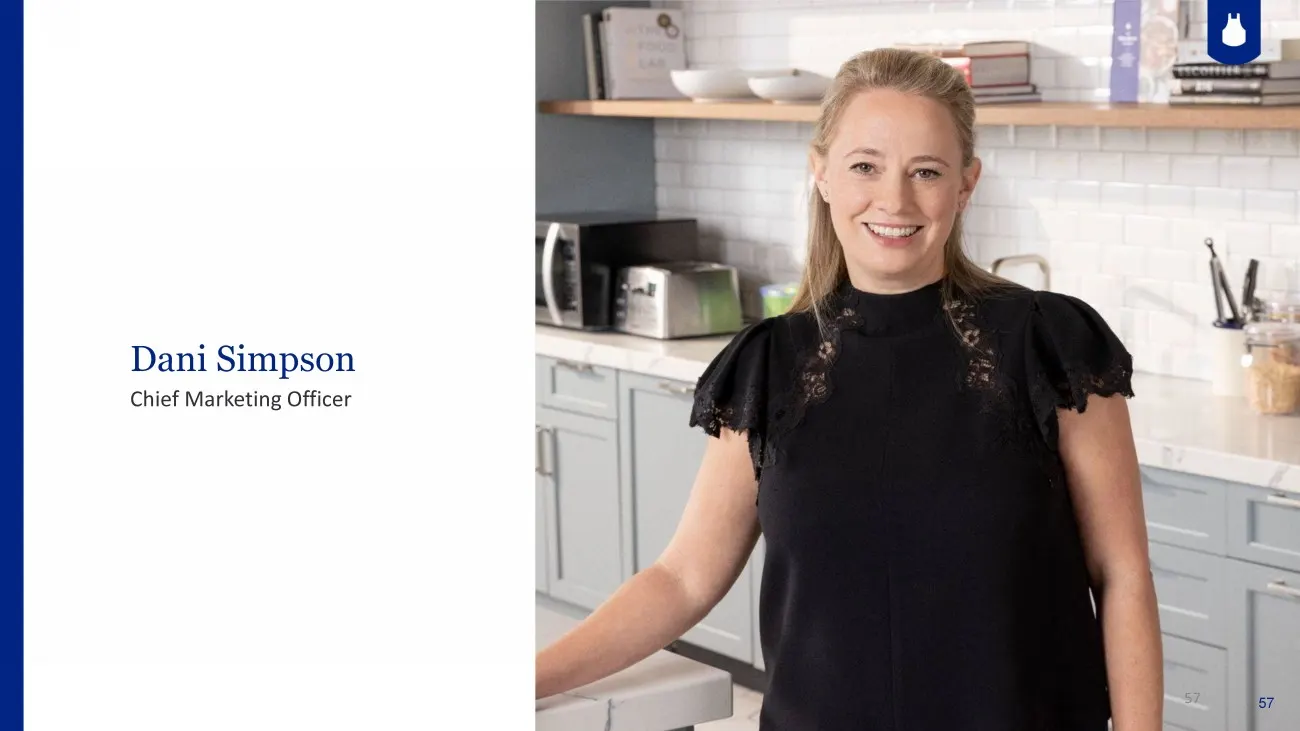
Slide 57: Dani Simpson, Chief Marketing Officer
27 CONFIDENTIAL Dani Simpson Chief Marketing Officer 57 57
Slide 58: Marketing strategy
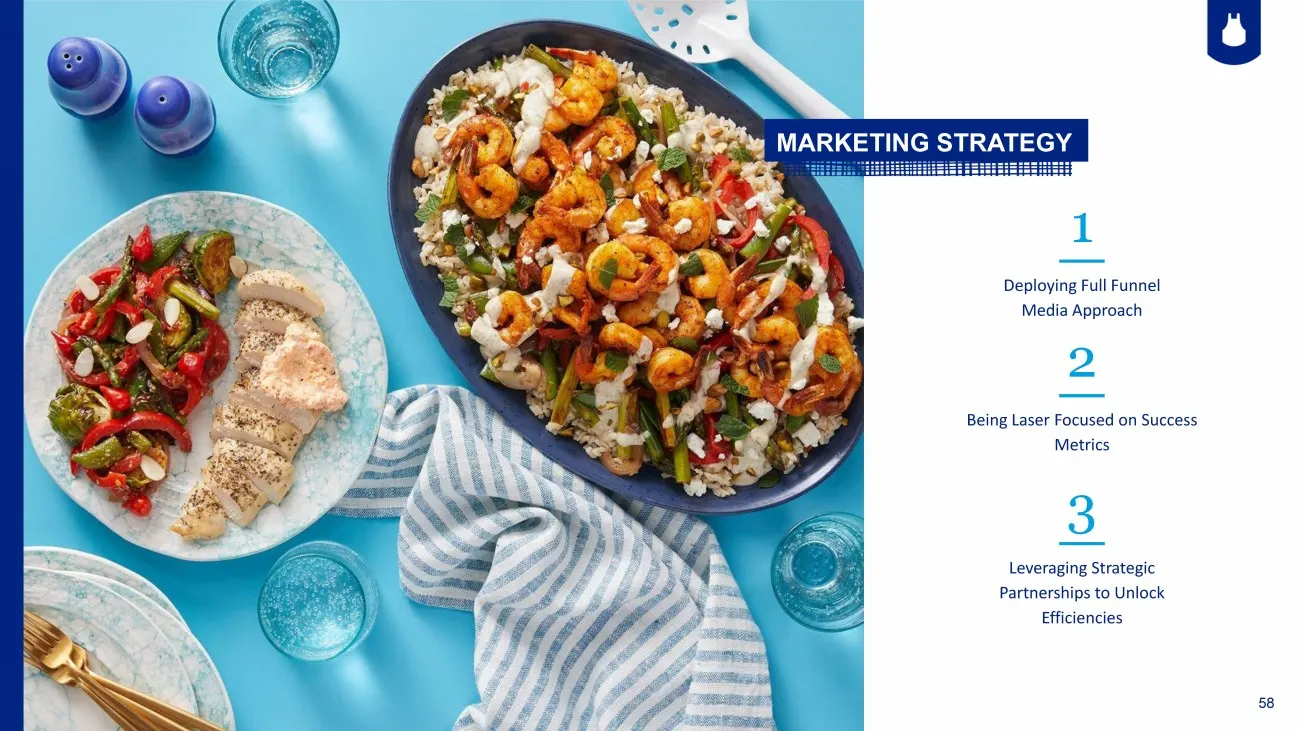
58 1 Deploying Full Funnel Media Approach 2 Being Laser Focused on Success Metrics 3 Leveraging Strategic Partnerships to Unlock Efficiencies MARKETING STRATEGY
Slide 59: Four key customer segments
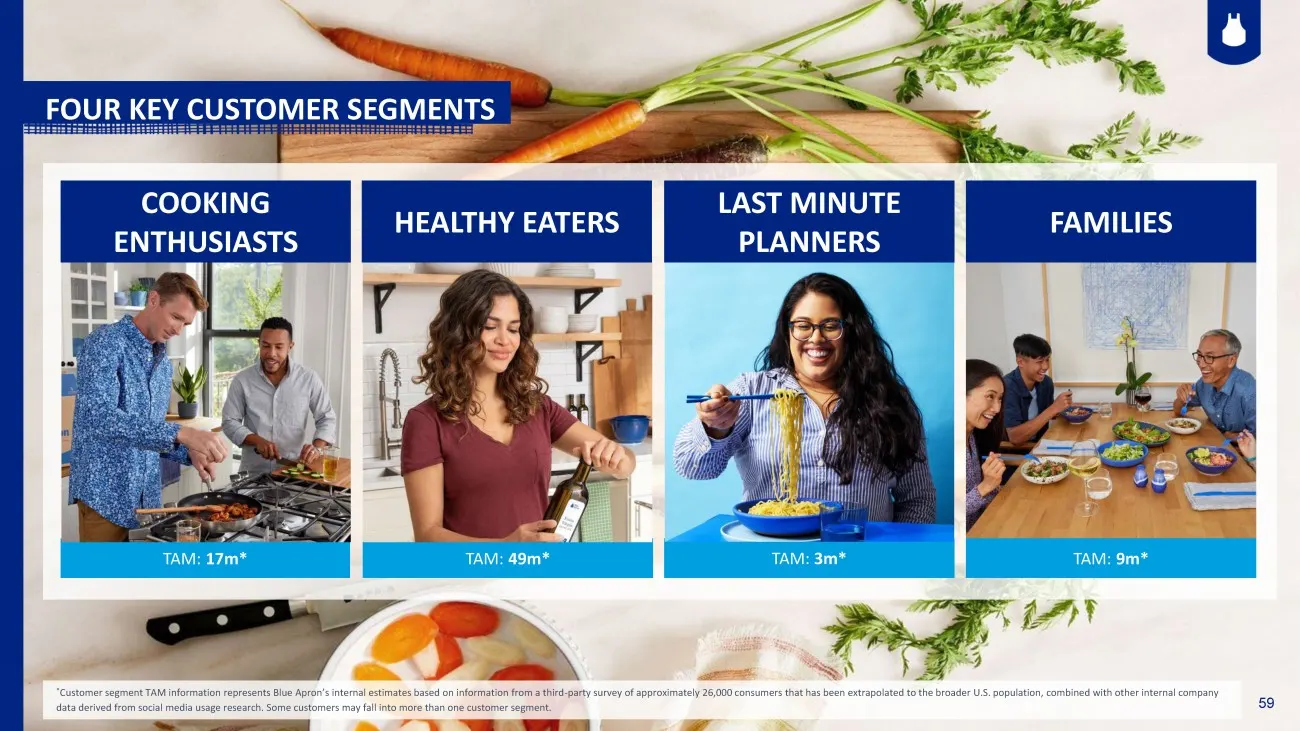
59 FOUR KEY CUSTOMER SEGMENTS TAM: 17m* TAM: 49m* TAM: 3m* TAM: 9m* HEALTHY EATERS FAMILIES COOKING ENTHUSIASTS LAST MINUTE PLANNERS * Customer segment TAM information represents Blue Apron’s internal estimates based on information from a third - party survey of ap proximately 26,000 consumers that
Slide 60: Marketing funnel
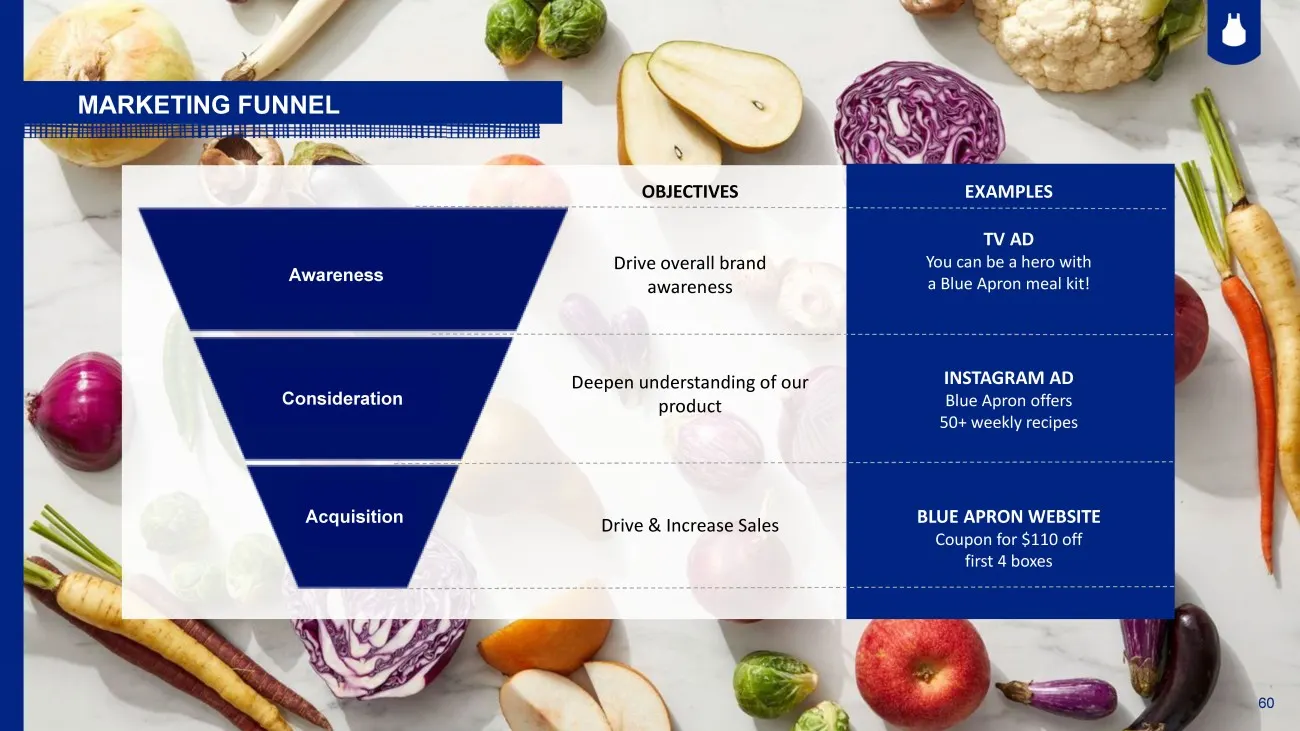
60 MARKETING FUNNEL Awareness Acquisition Consideration EXAMPLES TV AD You can be a hero with a Blue Apron meal kit! INSTAGRAM AD Blue Apron offers 50+ weekly recipes BLUE APRON WEBSITE Coupon for $110 off first 4 boxes OBJECTIVES Drive overall brand awareness Deepen understanding of our product Dri
Slide 61: Strategic shift in marketing mix
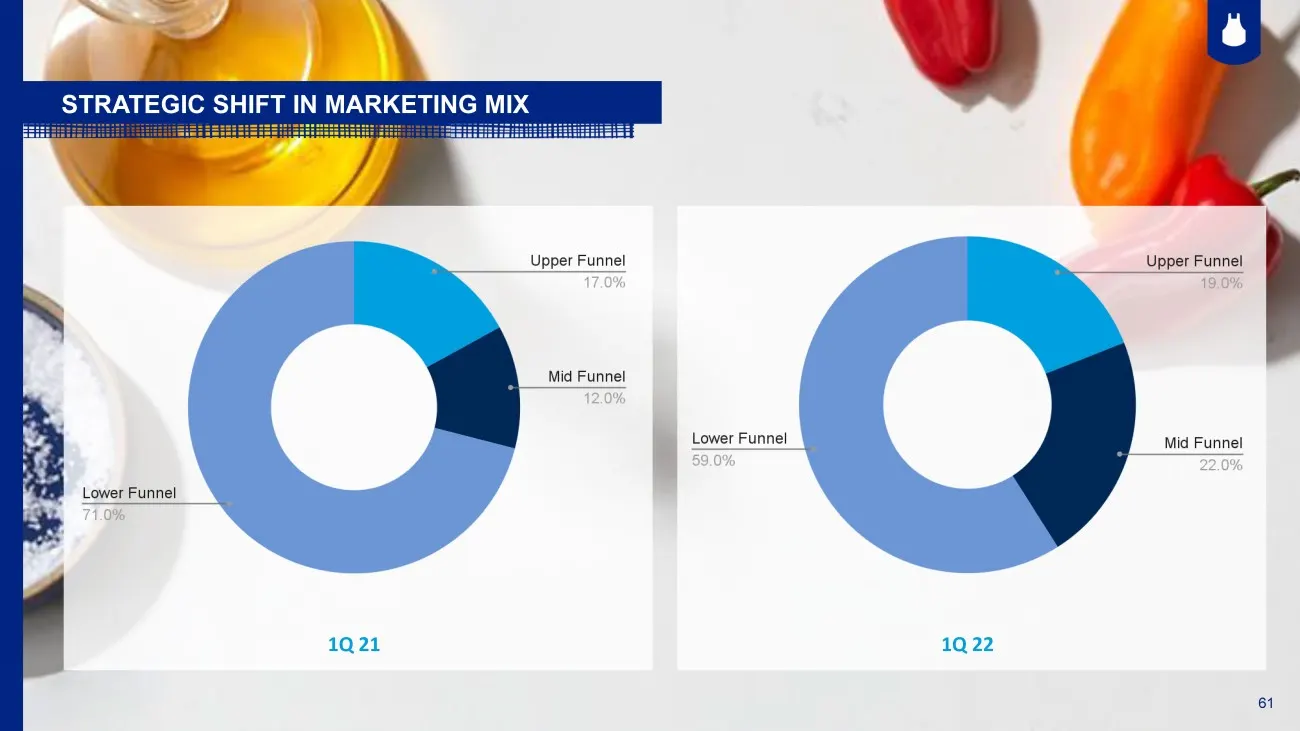
61 STRATEGIC SHIFT IN MARKETING MIX 1Q 21 1Q 22 61 1
Slide 62: National brand campaign
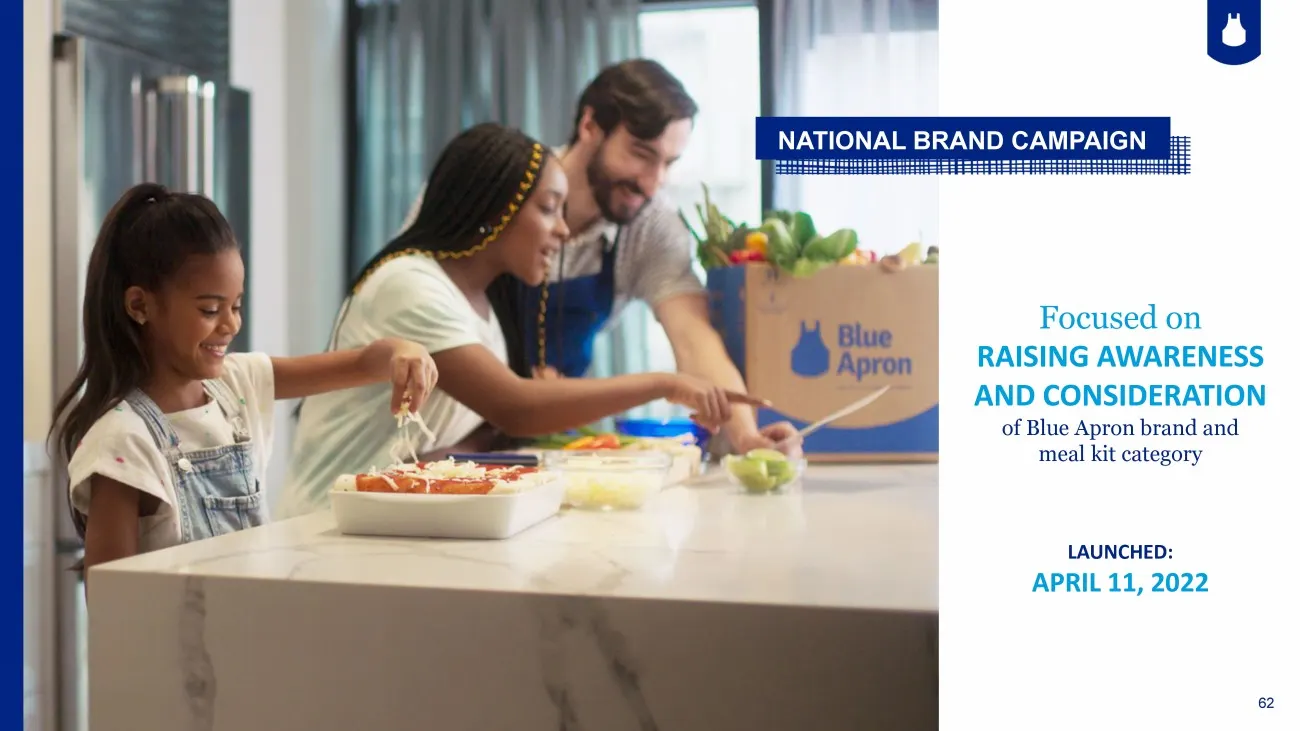
62 NATIONAL BRAND CAMPAIGN Focused on RAISING AWARENESS AND CONSIDERATION of Blue Apron brand and meal kit category LAUNCHED: APRIL 11, 2022
Slide 63: National brand campaign spots
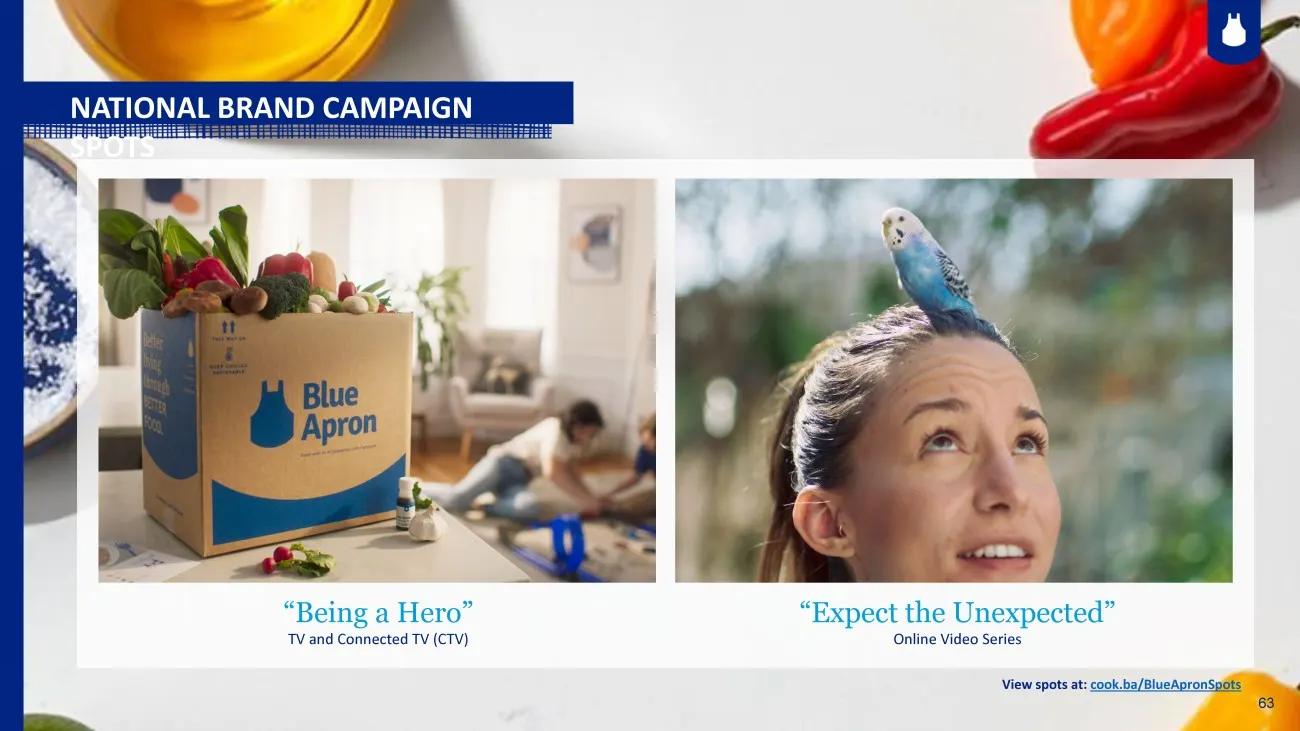
63 “Being a Hero” TV and Connected TV (CTV) “Expect the Unexpected” Online Video Series NATIONAL BRAND CAMPAIGN SPOTS View spots at: cook.ba/BlueApronSpots 63
Slide 64: National brand campaign early success
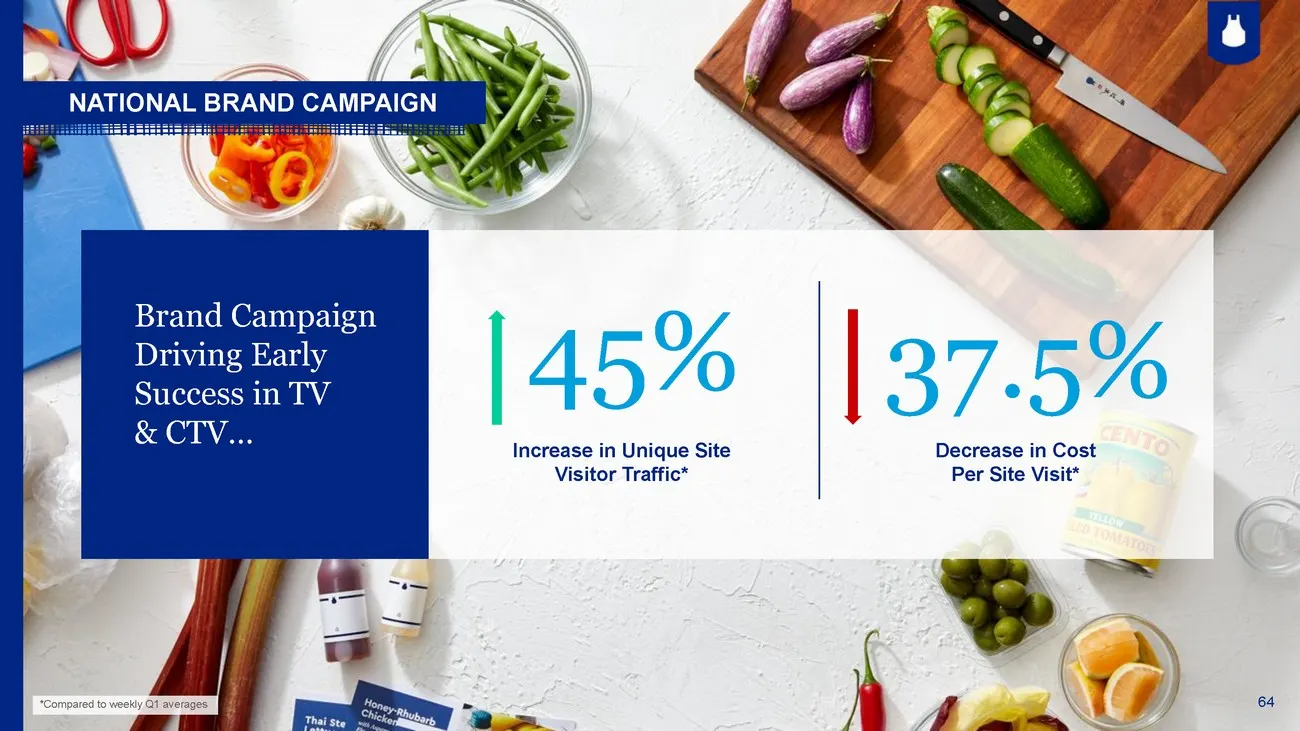
64 NATIONAL BRAND CAMPAIGN 45% 37.5% Increase in Unique Site Visitor Traffic* Decrease in Cost Per Site Visit* Brand Campaign Driving Early Success in TV & CTV *Compared to weekly Q1 averages
Slide 65: Continued improvements in conversion
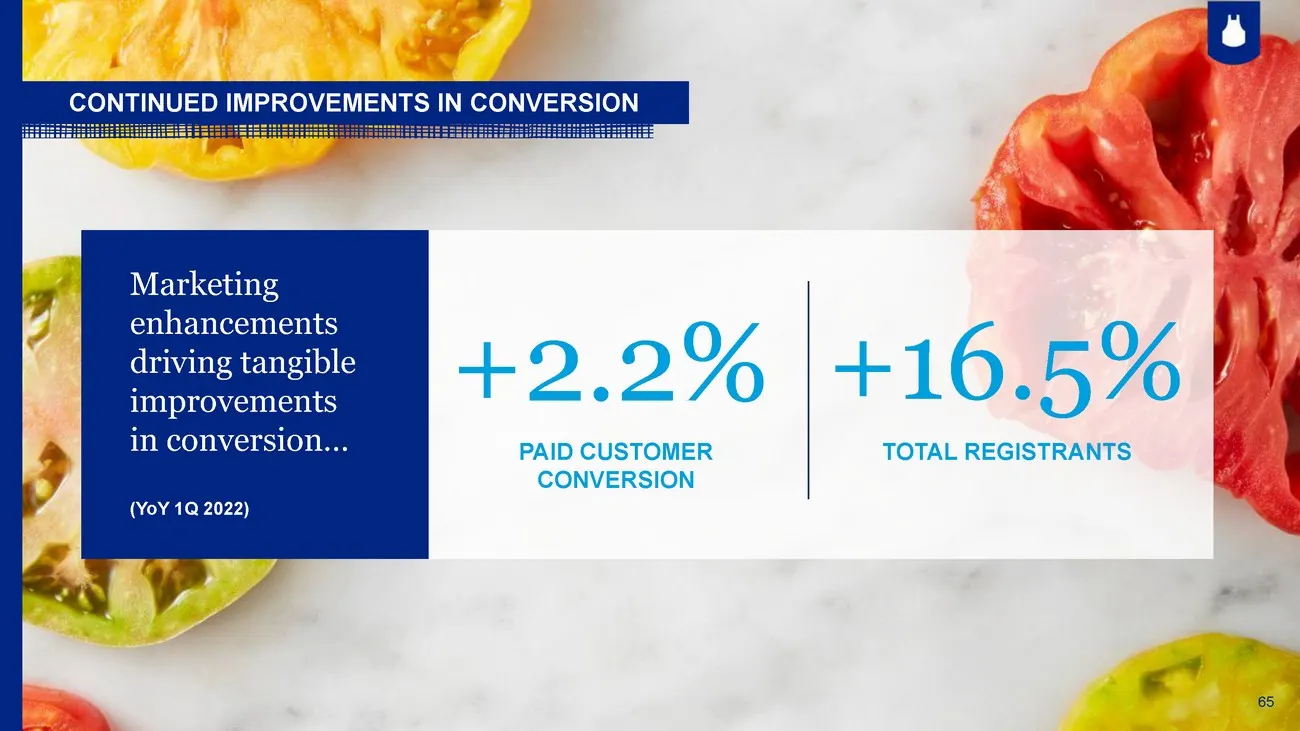
65 CONTINUED IMPROVEMENTS IN CONVERSION +2.2% +16.5% PAID CUSTOMER CONVERSION TOTAL REGISTRANTS Marketing enhancements driving tangible improvements in conversion (YoY 1Q 2022)
Slide 66: Blue Apron's brand equity continues to improve
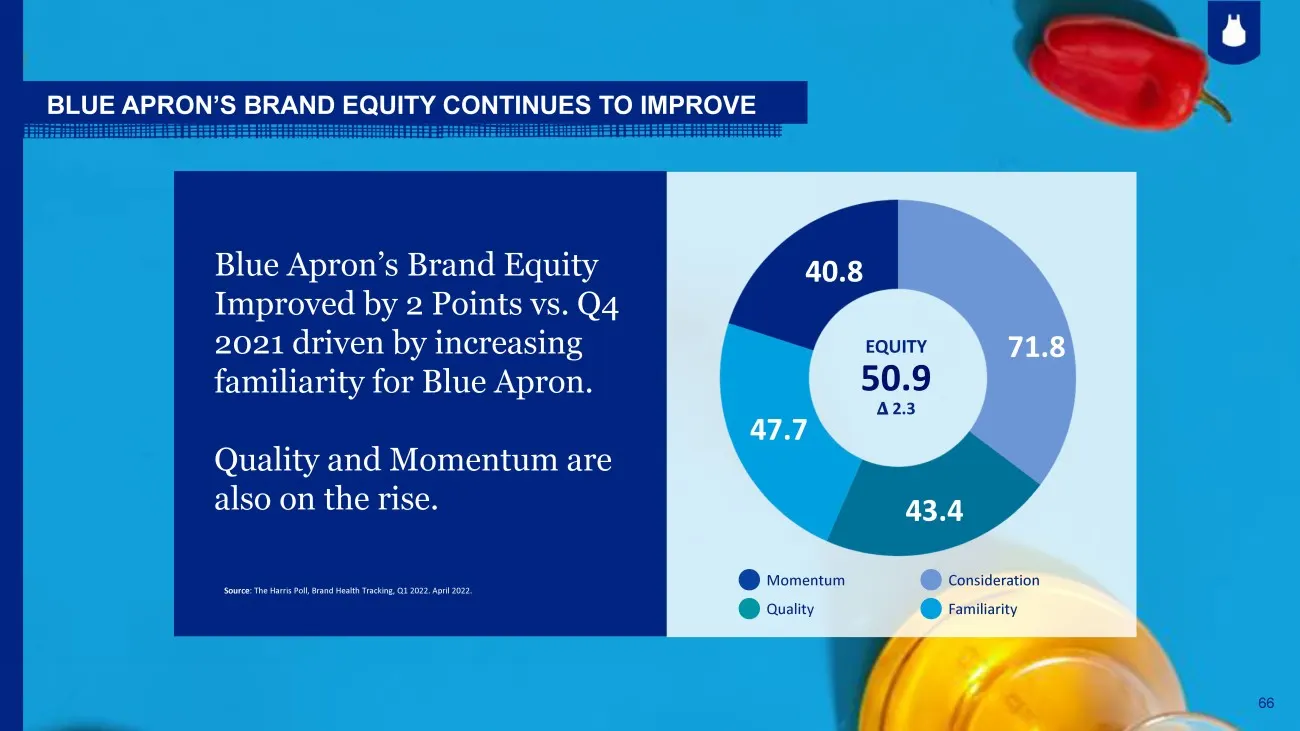
66 BLUE APRON’S BRAND EQUITY CONTINUES TO IMPROVE Source : The Harris Poll, Brand Health Tracking, Q1 2022. April 2022. Blue Apron’s Brand Equity Improved by 2 Points vs. Q4 2021 driven by increasing familiarity for Blue Apron. Quality and Momentum are also on the rise. 40.8 71.8 43.4 47.7 Momentum
Slide 67: Aiming for long-term target in mid teens
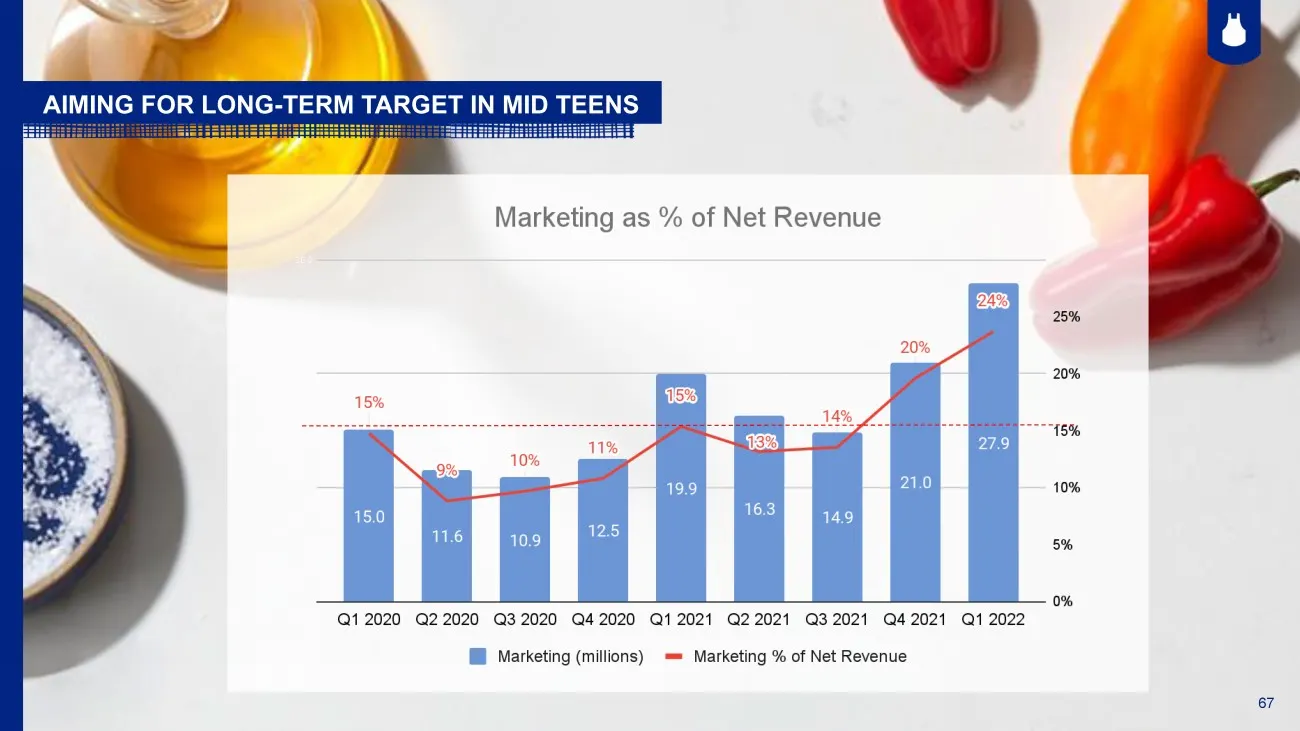
67 AIMING FOR LONG - TERM TARGET IN MID TEENS 67
Slide 68: Managing payback weeks
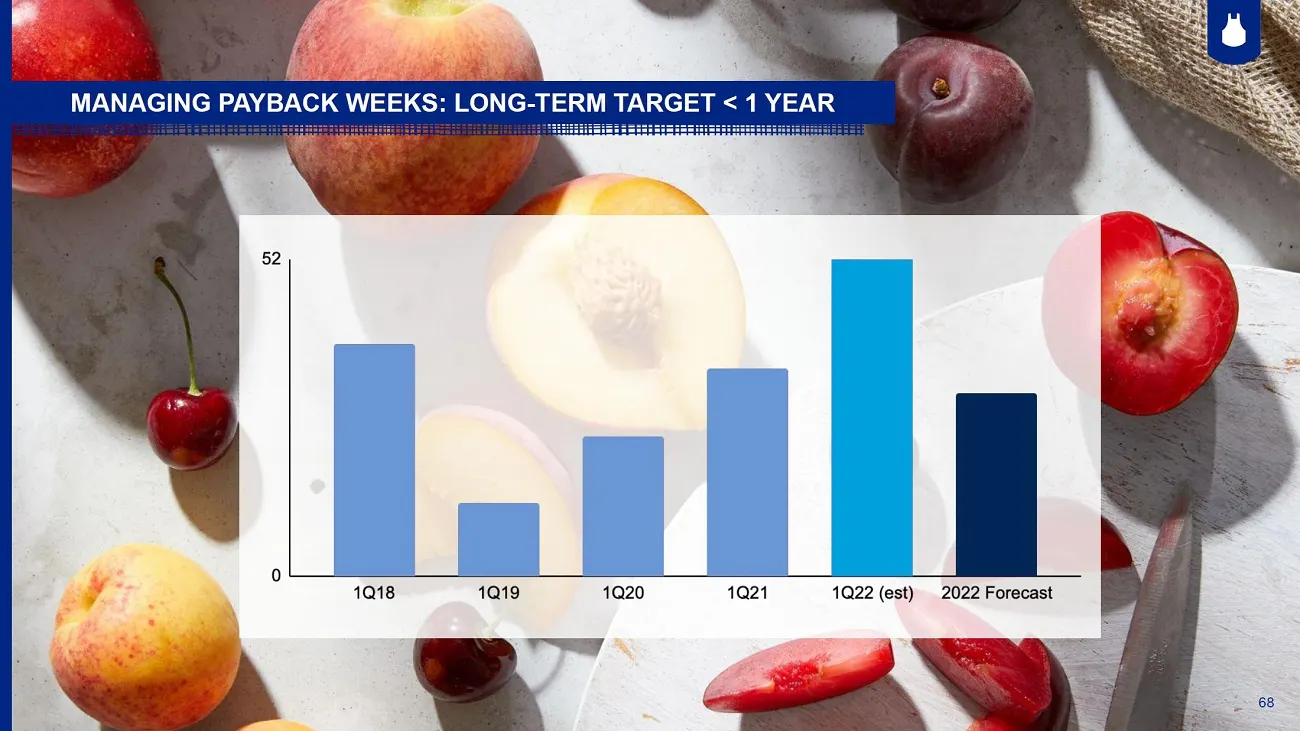
1 MANAGING PAYBACK WEEKS: LONG-TERM TARGET 1 YEAR
Slide 69: 2021 tracking ahead of pre-pandemic years
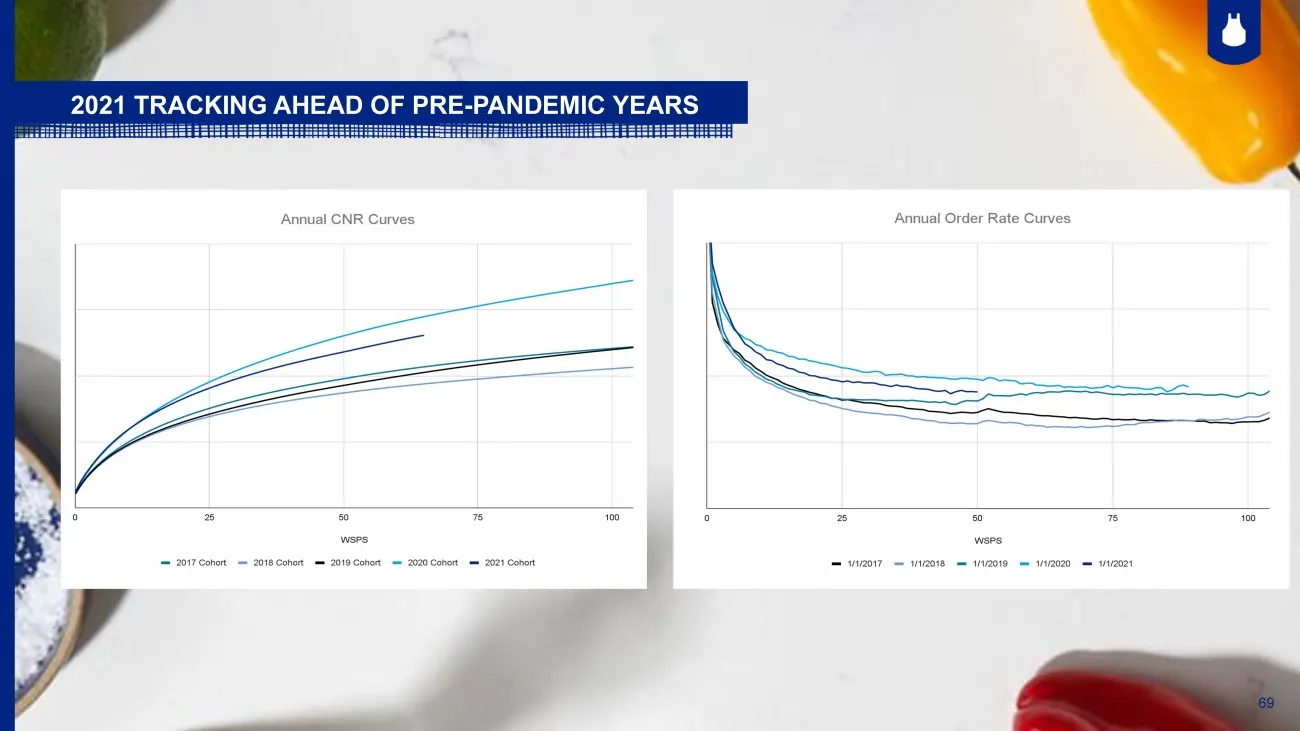
69 2021 TRACKING AHEAD OF PRE - PANDEMIC YEARS 69
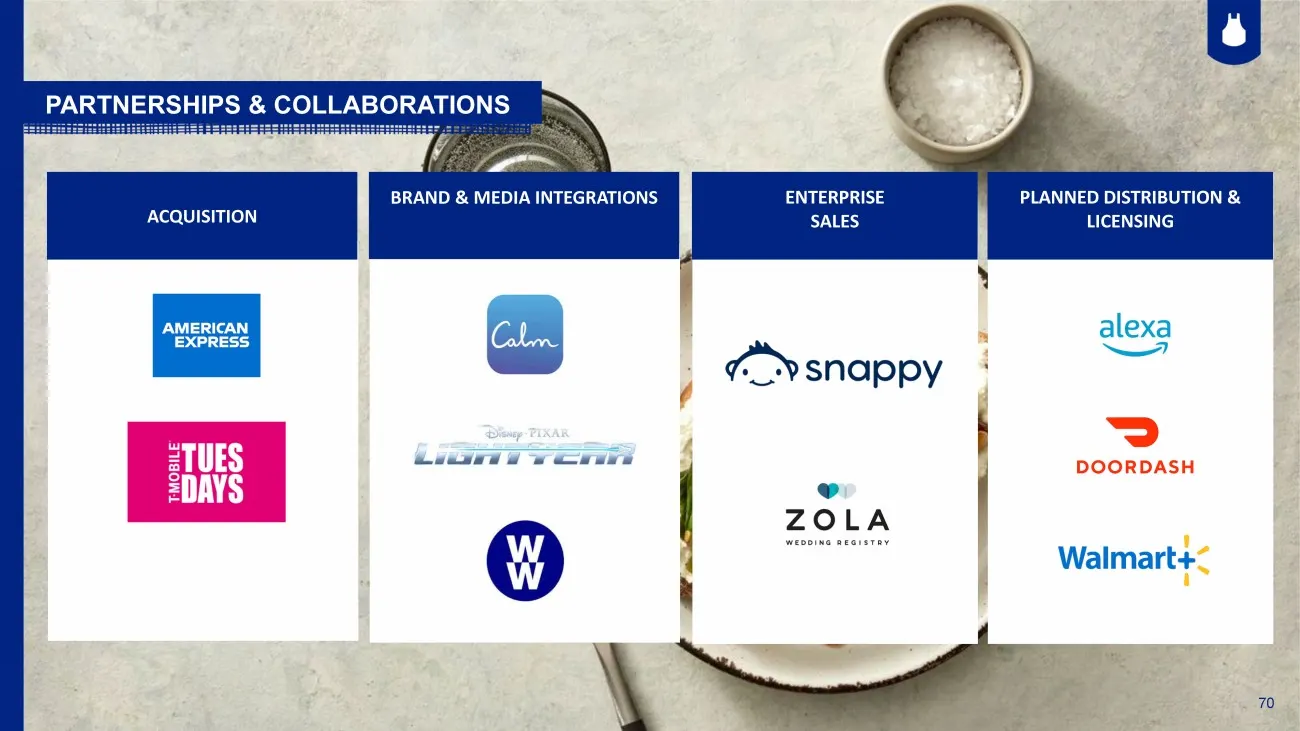
Slide 70: Partnerships & collaborations
70 PARTNERSHIPS & COLLABORATIONS ACQUISITION ENTERPRISE SALES PLANNED DISTRIBUTION & LICENSING BRAND & MEDIA INTEGRATIONS 70
Slide 71: Launching storefront on Walmart.com
71 LAUNCHING STOREFRONT ON WALMART.COM where millions of active users can buy curated selection of weekly Blue Apron boxes without a subscription WORK TO EXPAND NON - SUBSCRIPTION SALES 71
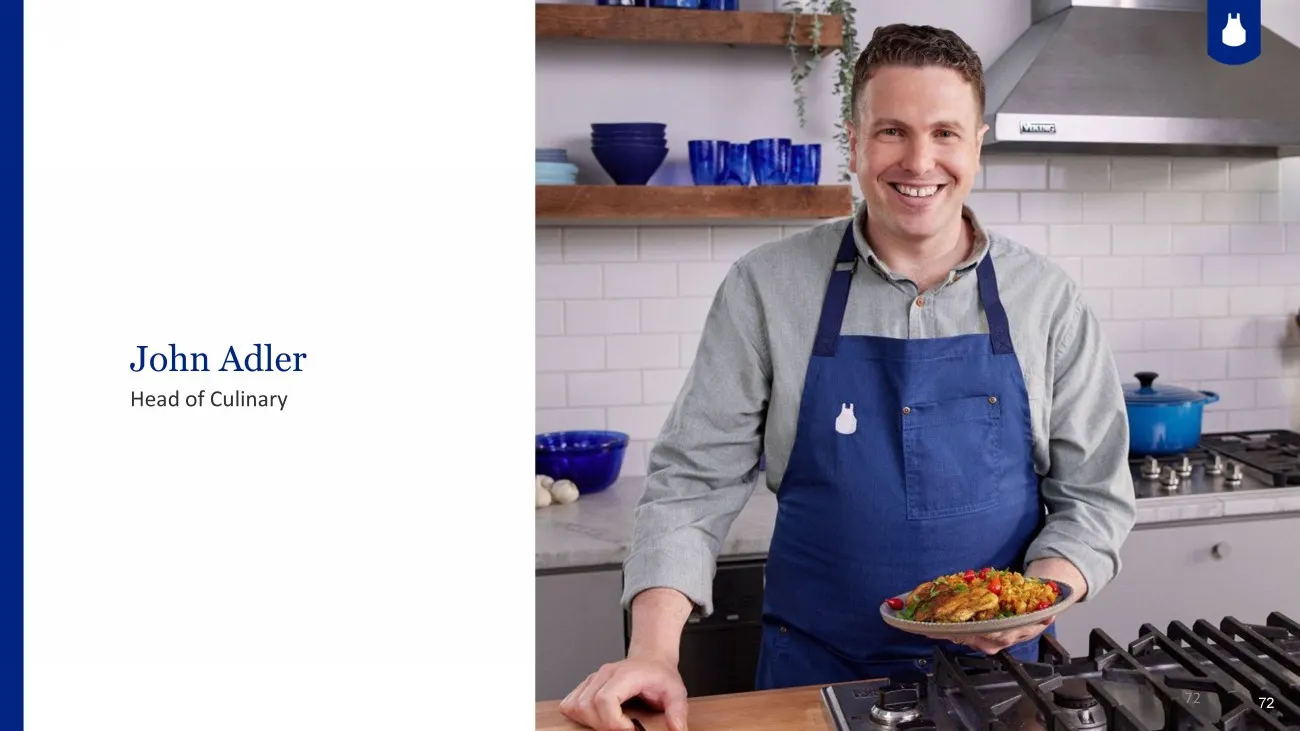
Slide 72: John Adler, Head of Culinary
27 CONFIDENTIAL John Adler Head of Culinary 72 72
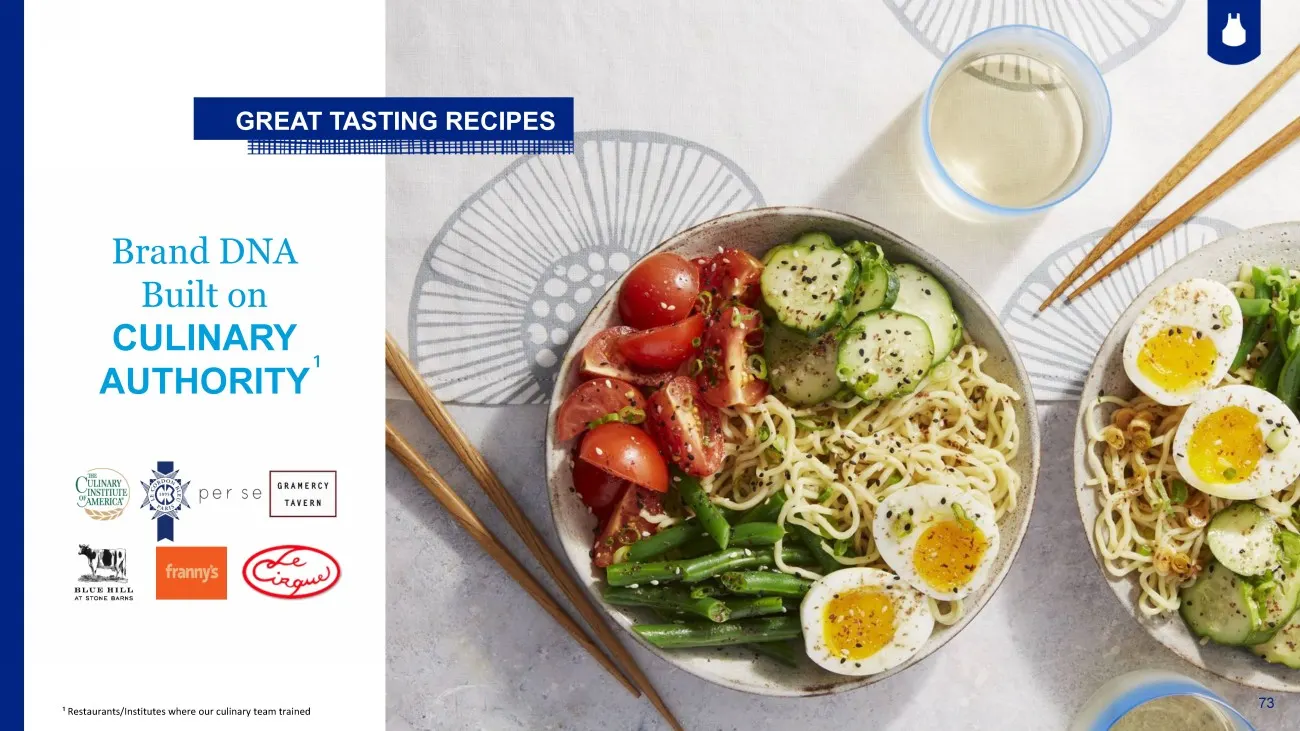
Slide 73: Brand DNA built on culinary authority
73 GREAT TASTING RECIPES Brand DNA Built on CULINARY AUTHORITY ¹ ¹ Restaurants/Institutes where our culinary team trained 73
Slide 74: High quality ingredients stand on their own
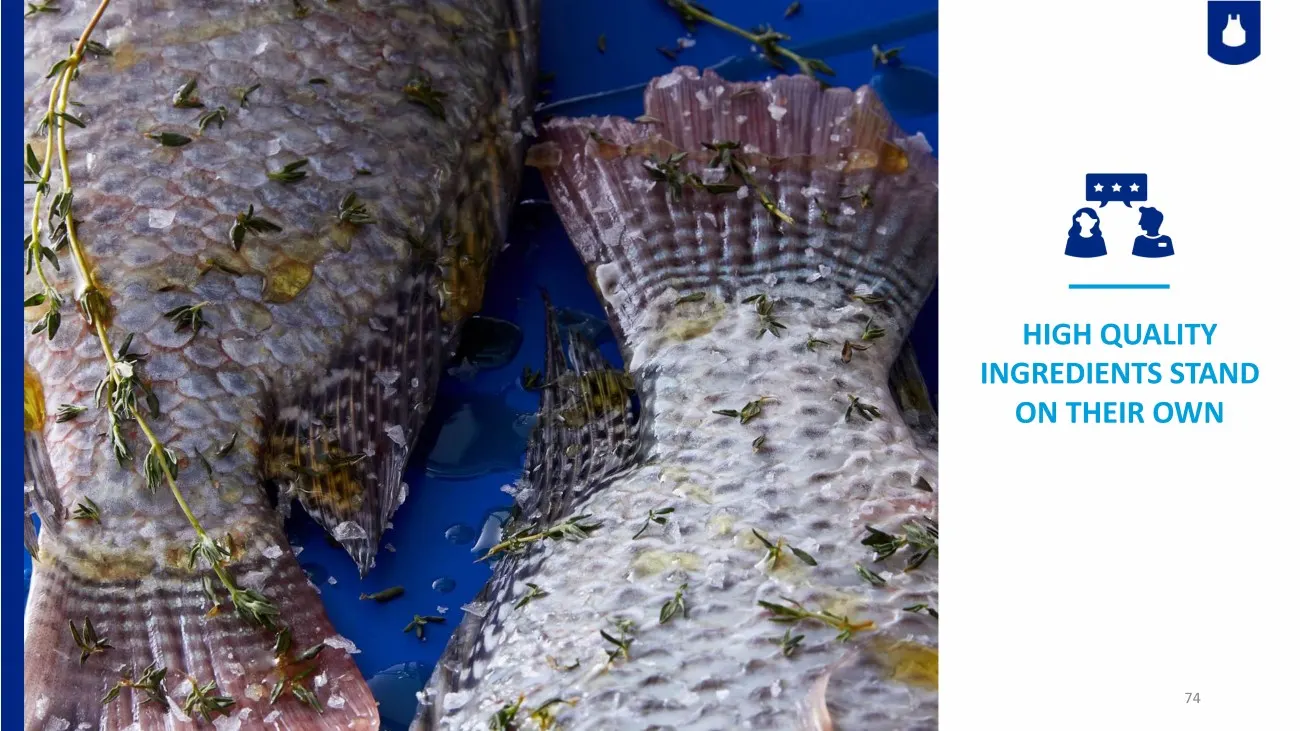
HIGH QUALITY INGREDIENTS STAND ON THEIR OWN 74
Slide 75: Deep supplier relationships
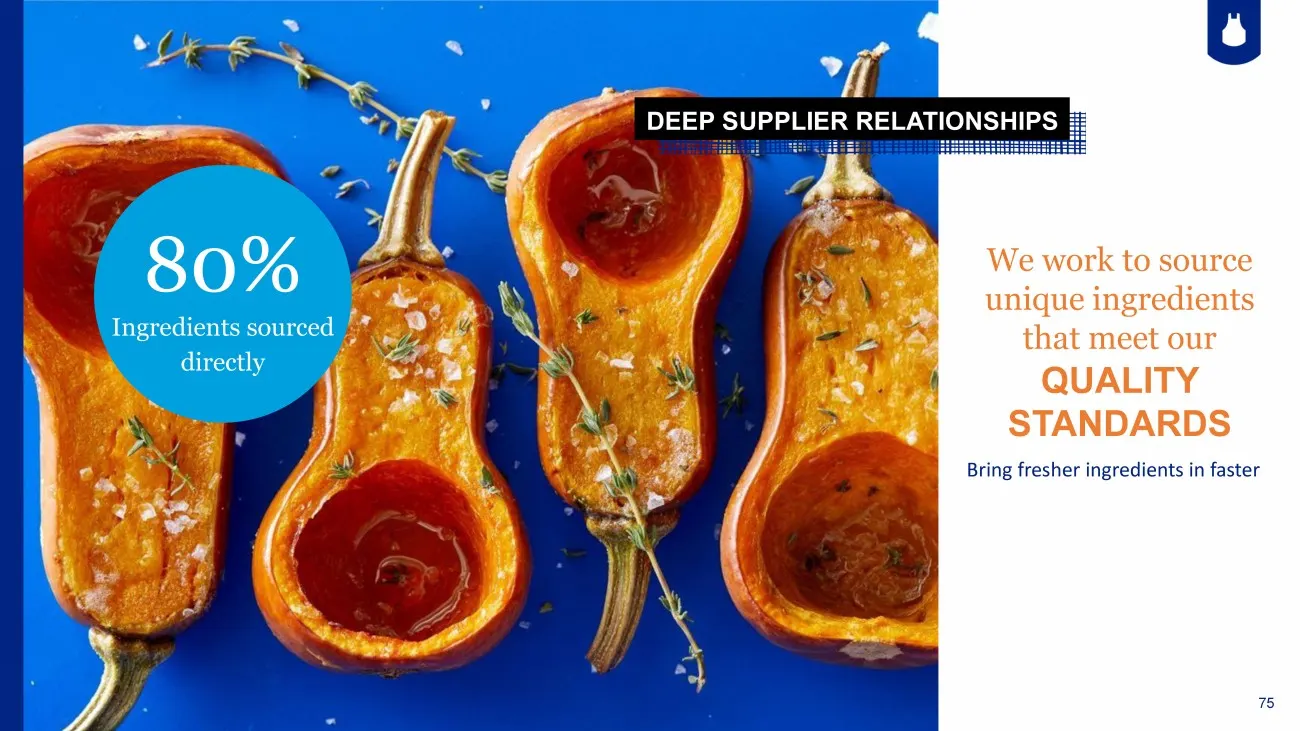
75 8 0 % Ingredients sourced directly DEEP SUPPLIER RELATIONSHIPS We work to source unique ingredients that meet our QUALITY STANDARDS Bring fresher ingredients in faster
Slide 76: Food cost per box vs PPI basket
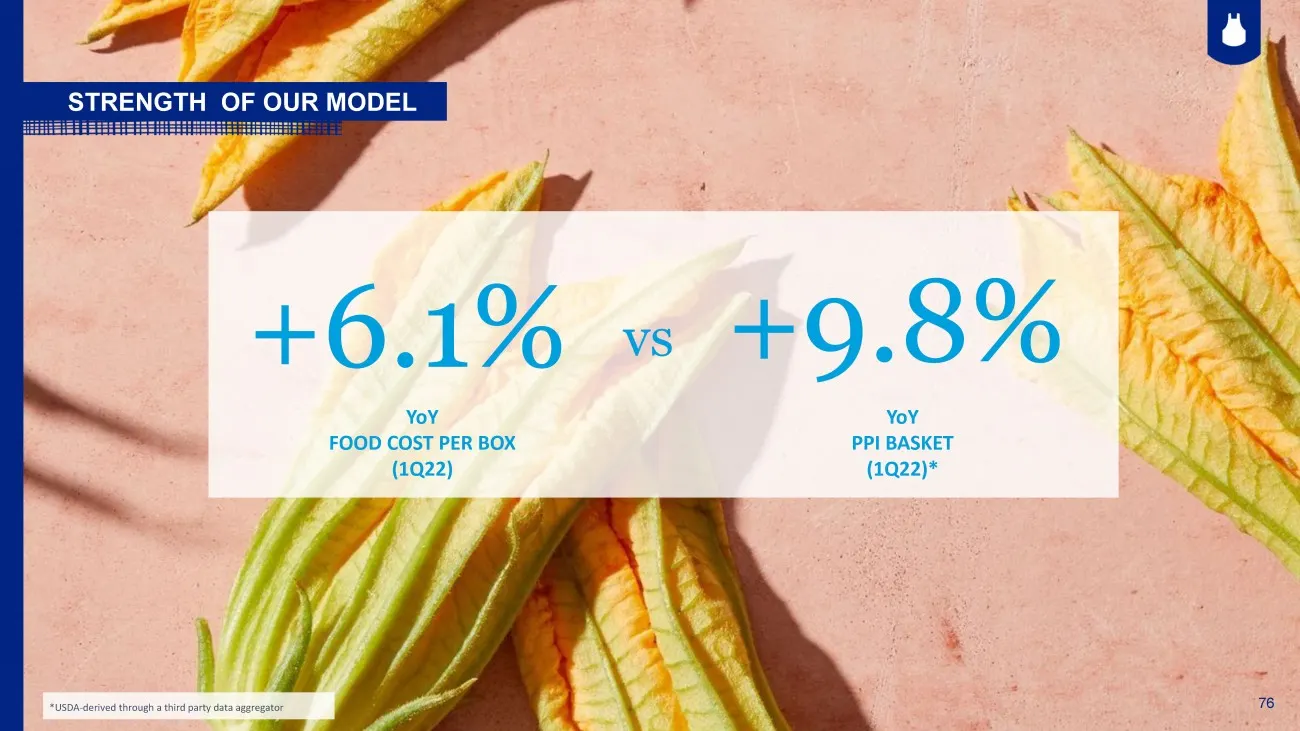
76 YoY FOOD COST PER BOX (1Q22) YoY PPI BASKET (1Q22)* +6.1% STRENGTH OF OUR MODEL +9.8% vs 76 *USDA - derived through a third party data aggregator
Slide 77: Product development informed by customer research
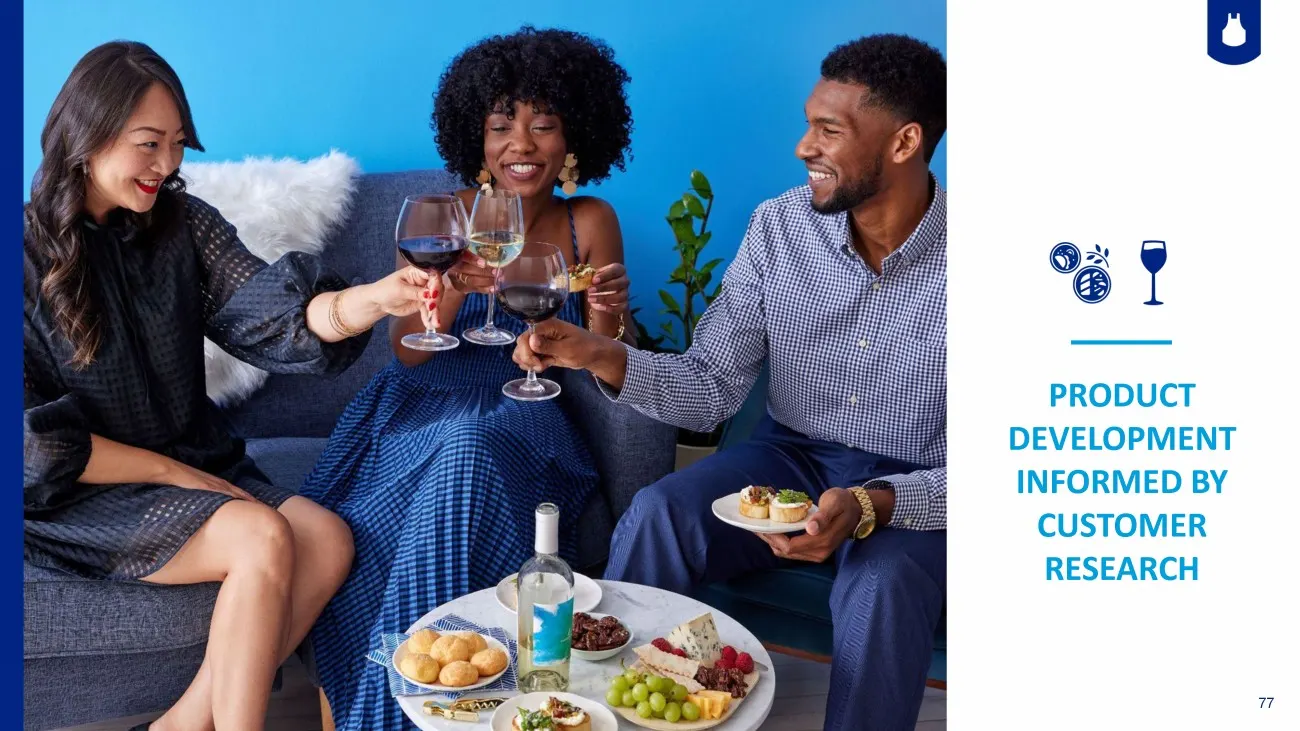
77 PRODUCT DEVELOPMENT INFORMED BY CUSTOMER RESEARCH
Slide 78: Product roadmap taking hold
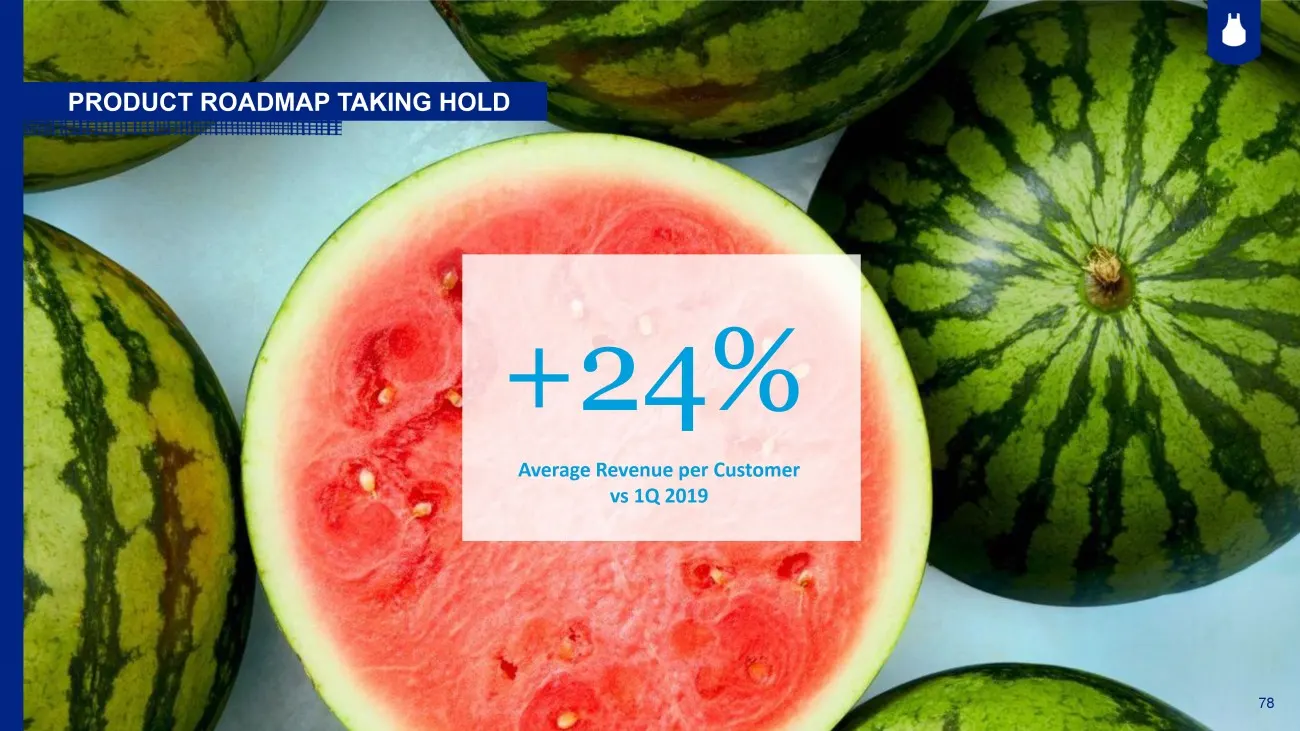
78 Average Revenue per Customer vs 1Q 2019 +24% PRODUCT ROADMAP TAKING HOLD 78
Slide 79: 22) = ° = — |, & =e = wn = /|¢é =< x
22) = ° = — |, & =e = wn = /|¢é =< x Lt ("4 [-*)
Slide 80: Annual average revenue per customer increases with tenure
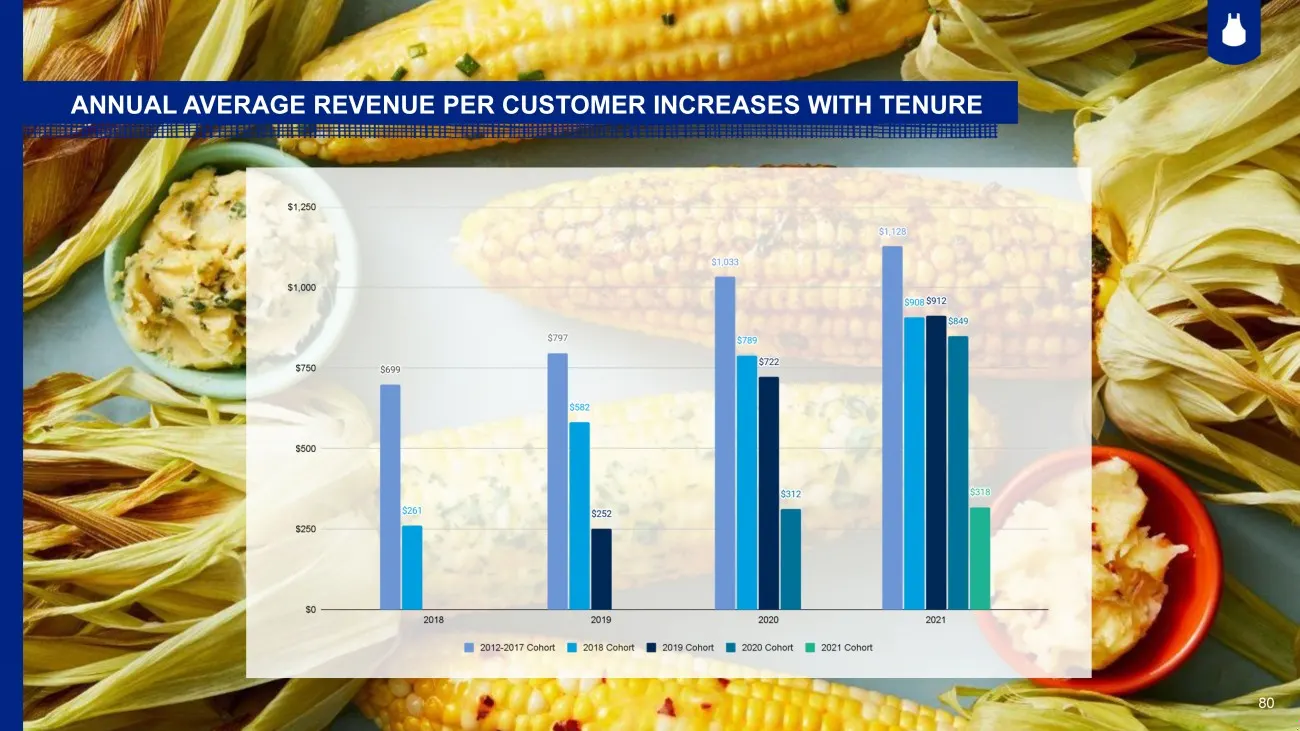
80 ANNUAL AVERAGE REVENUE PER CUSTOMER INCREASES WITH TENURE 80
Slide 81: Quarterly average order frequency increases with tenure
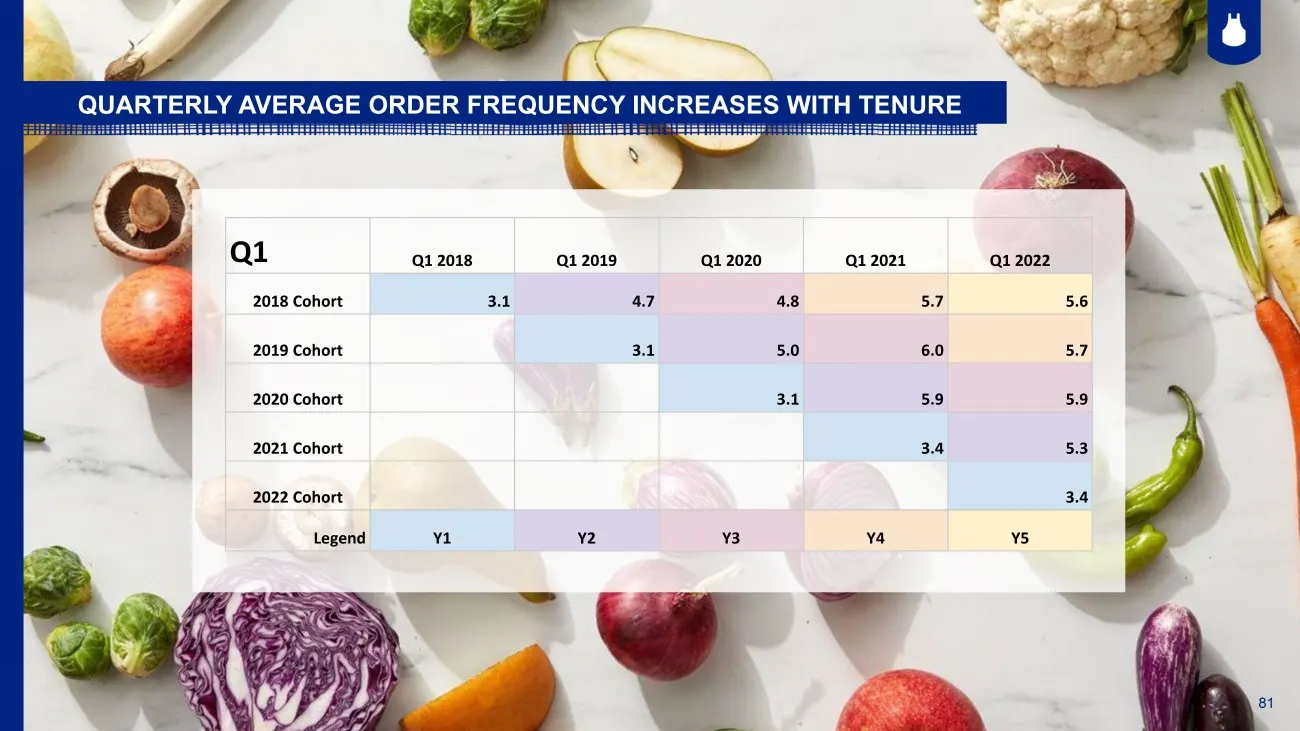
81 QUARTERLY AVERAGE ORDER FREQUENCY INCREASES WITH TENURE Q1 Q1 2018 Q1 2019 Q1 2020 Q1 2021 Q1 2022 2018 Cohort 3.1 4.7 4.8 5.7 5.6 2019 Cohort 3.1 5.0 6.0 5.7 2020 Cohort 3.1 5.9 5.9 2021 Cohort 3.4 5.3 2022 Cohort 3.4 Legend Y1 Y2 Y3 Y4 Y5 81

Slide 82: Wine
WINE 82 82
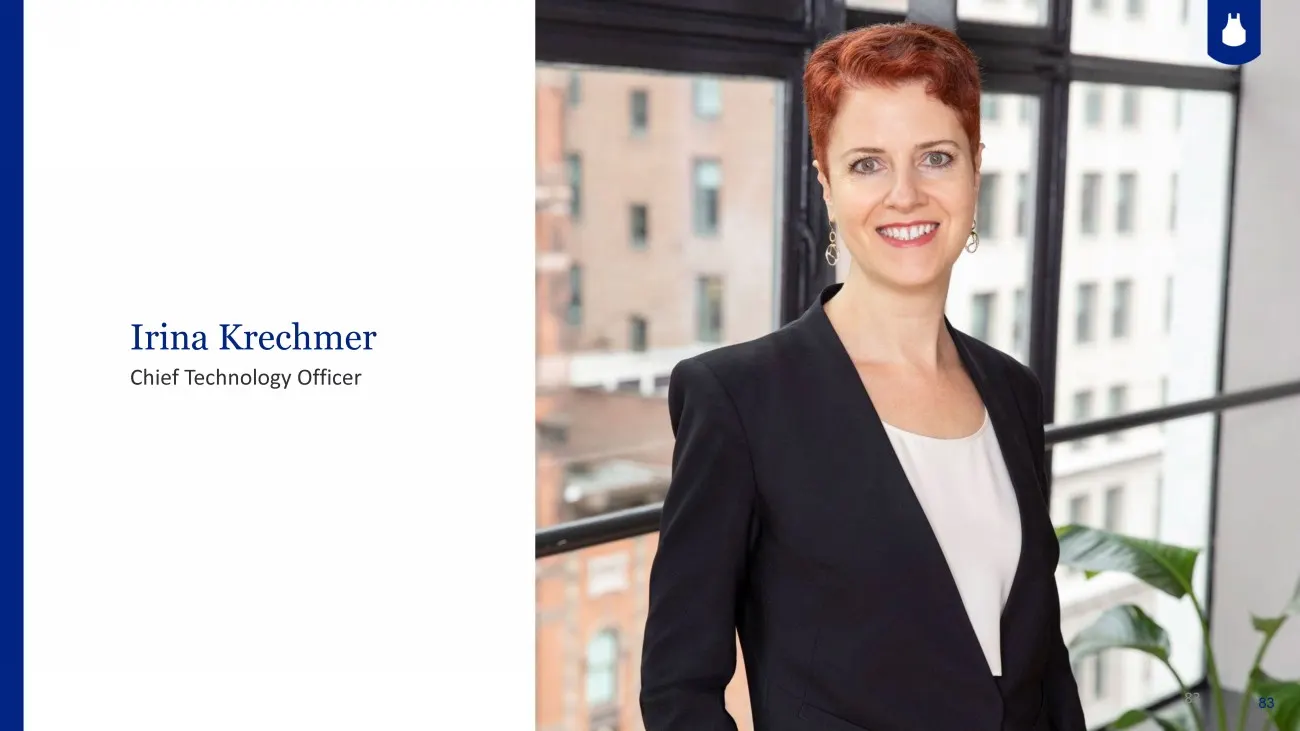
Slide 83: Irina Krechmer, Chief Technology Officer
27 CONFIDENTIAL Irina Krechmer Chief Technology Officer 83 83
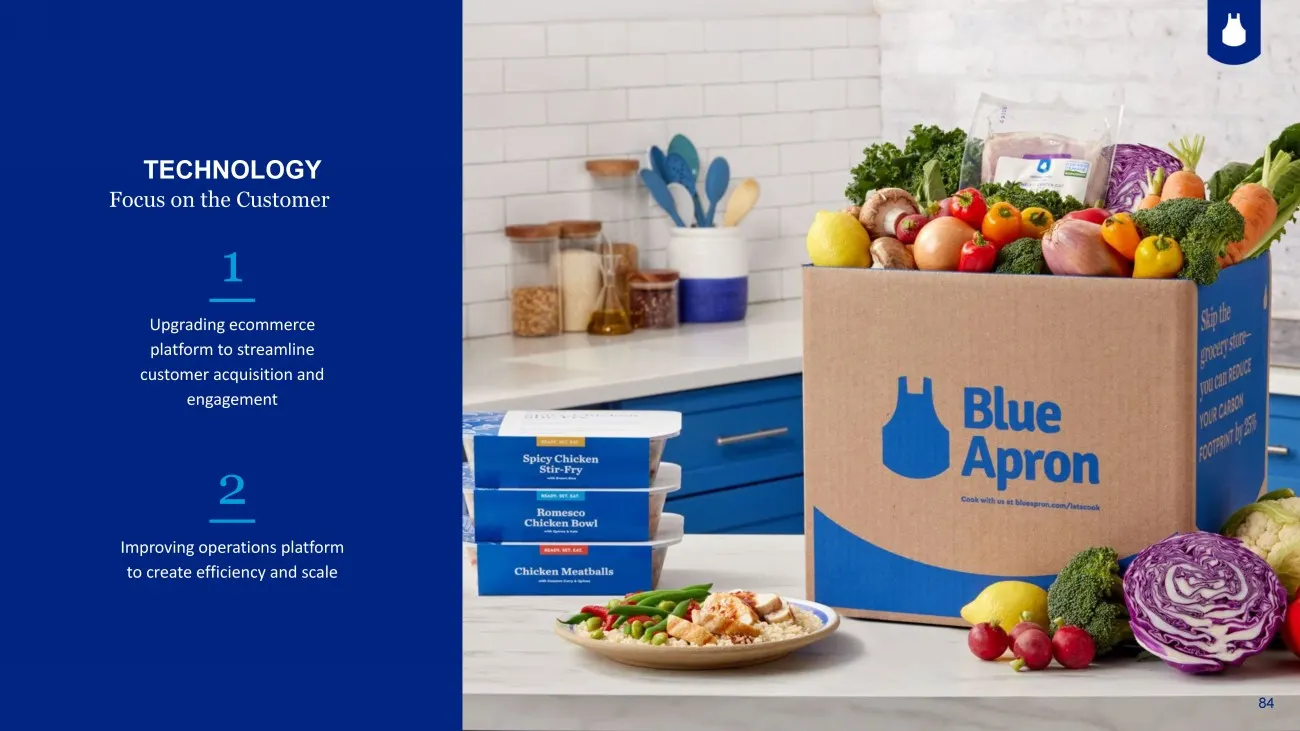
Slide 84: Technology
84 TECHNOLOGY Focus on the Customer 1 Upgrading ecommerce platform to streamline customer acquisition and engagement 2 Improving operations platform to create efficiency and scale 84
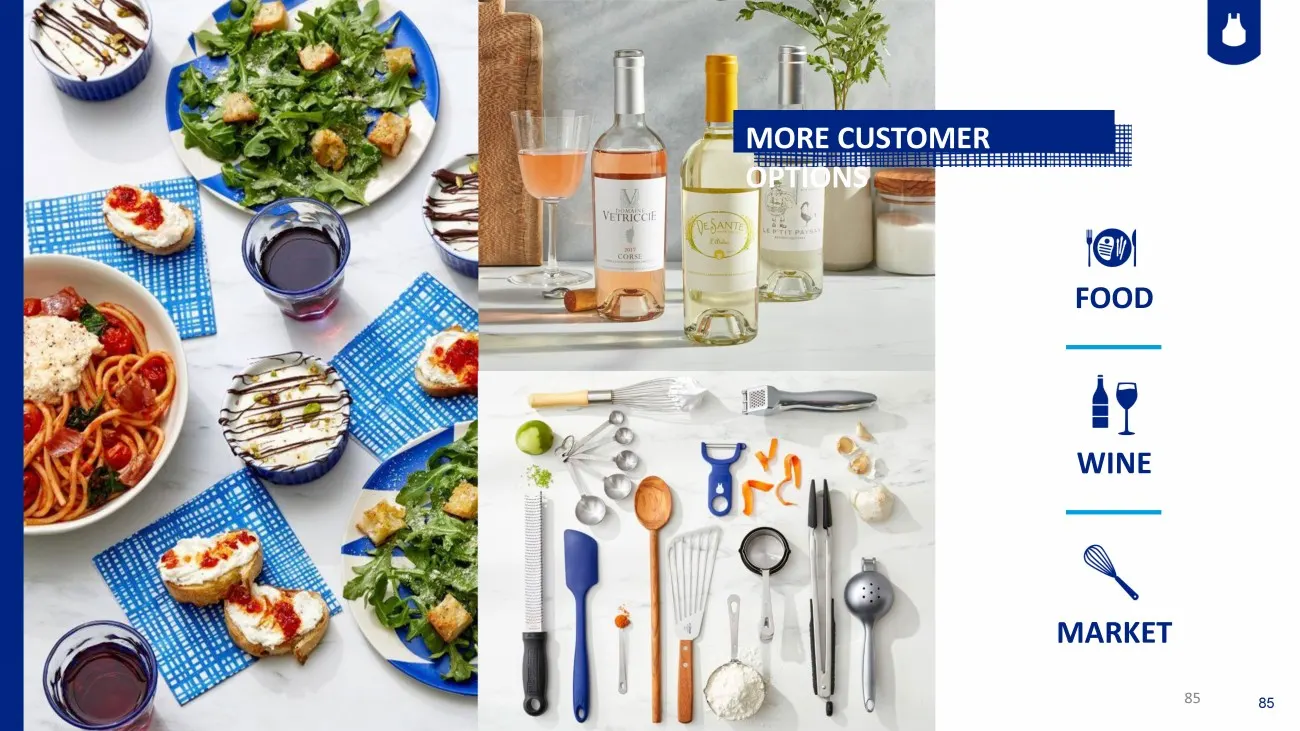
Slide 85: Food, Wine, Market: more customer options
FOOD WINE MARKET MORE CUSTOMER OPTIONS 85 85
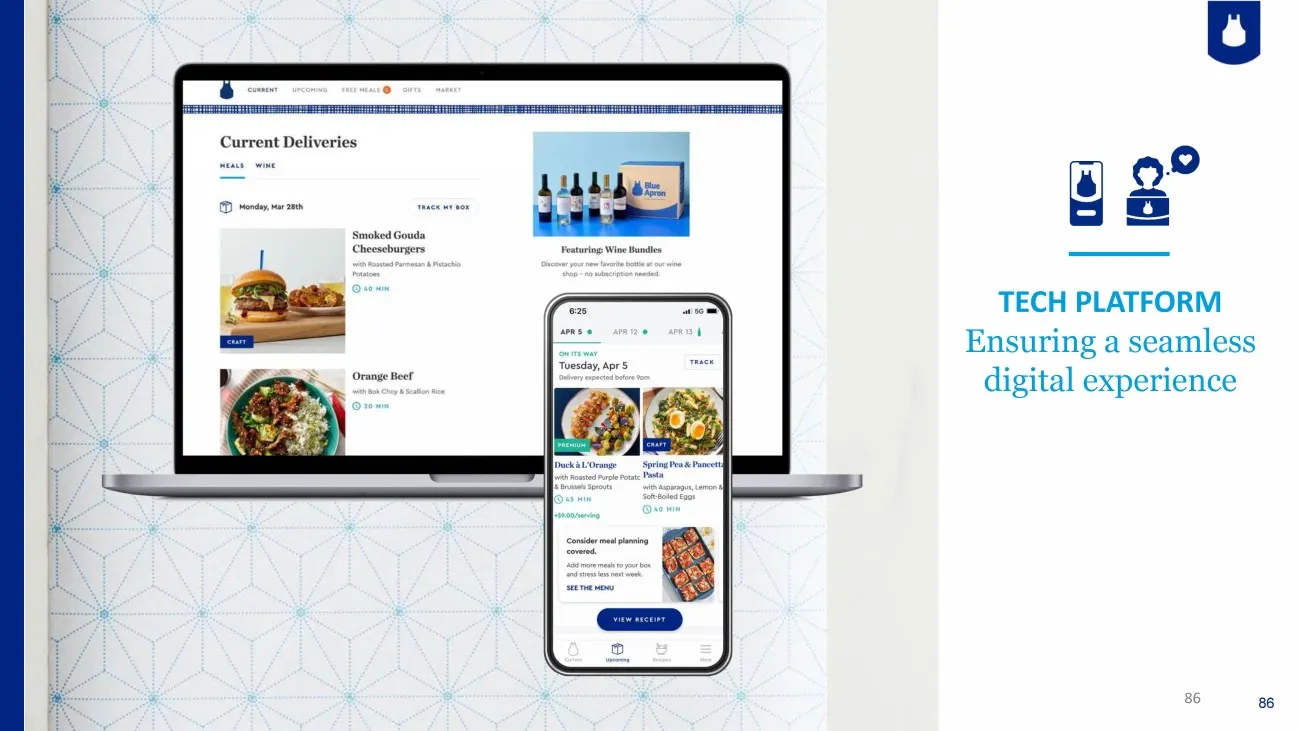
Slide 86: Tech platform
TECH PLATFORM Ensuring a seamless digital experience 86 86
Slide 87: Building agility for scalable integrations
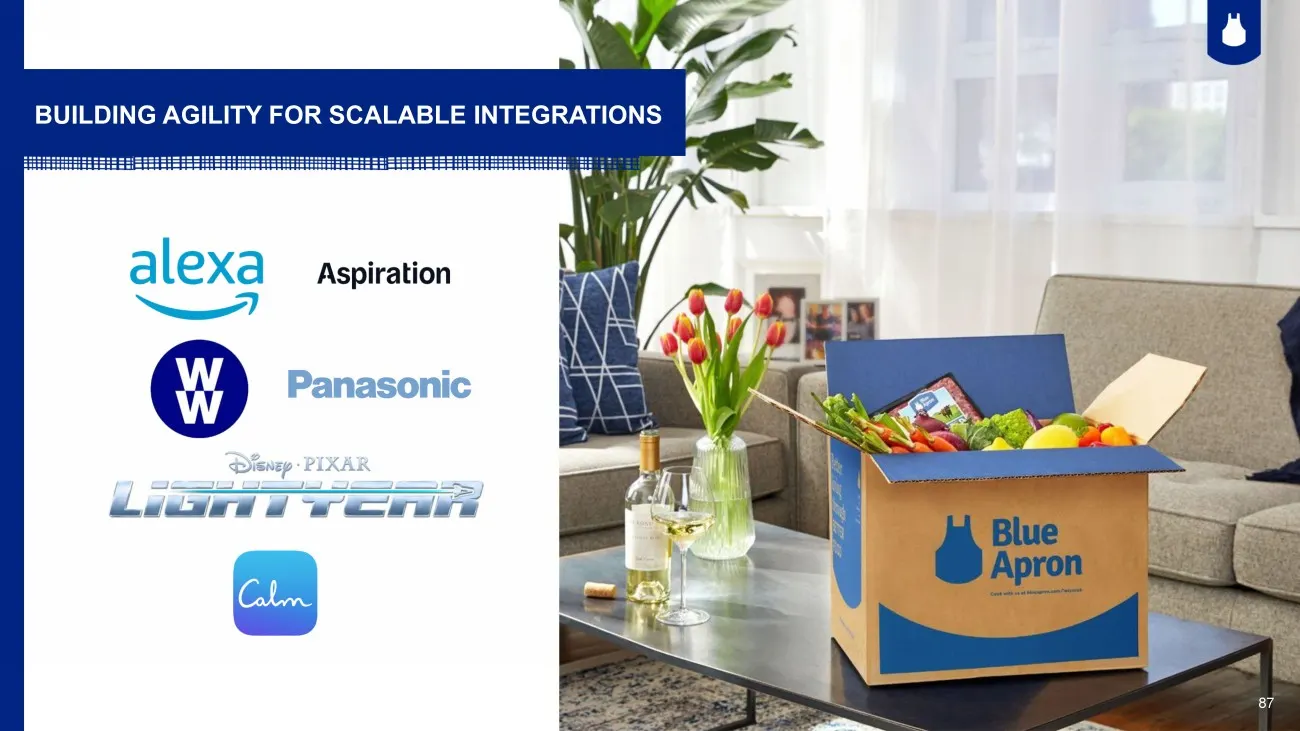
87 BUILDING AGILITY FOR SCALABLE INTEGRATIONS 87
Slide 88: Recipe assignment
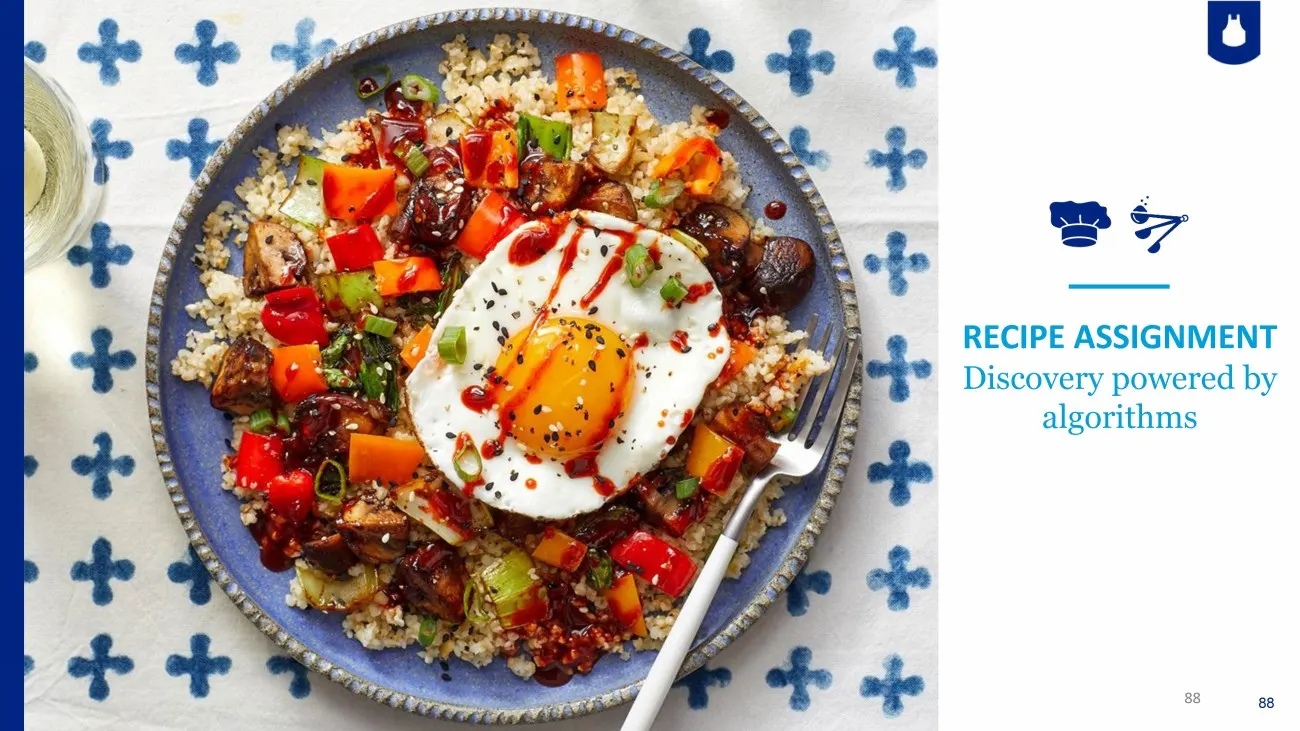
RECIPE ASSIGNMENT Discovery powered by algorithms 88 88
Slide 89: Technology driving growth and efficiencies in operations
89 TECHNOLOGY DRIVING GROWTH AND EFFICIENCIES in operations
Slide 90: Recipe forecasting
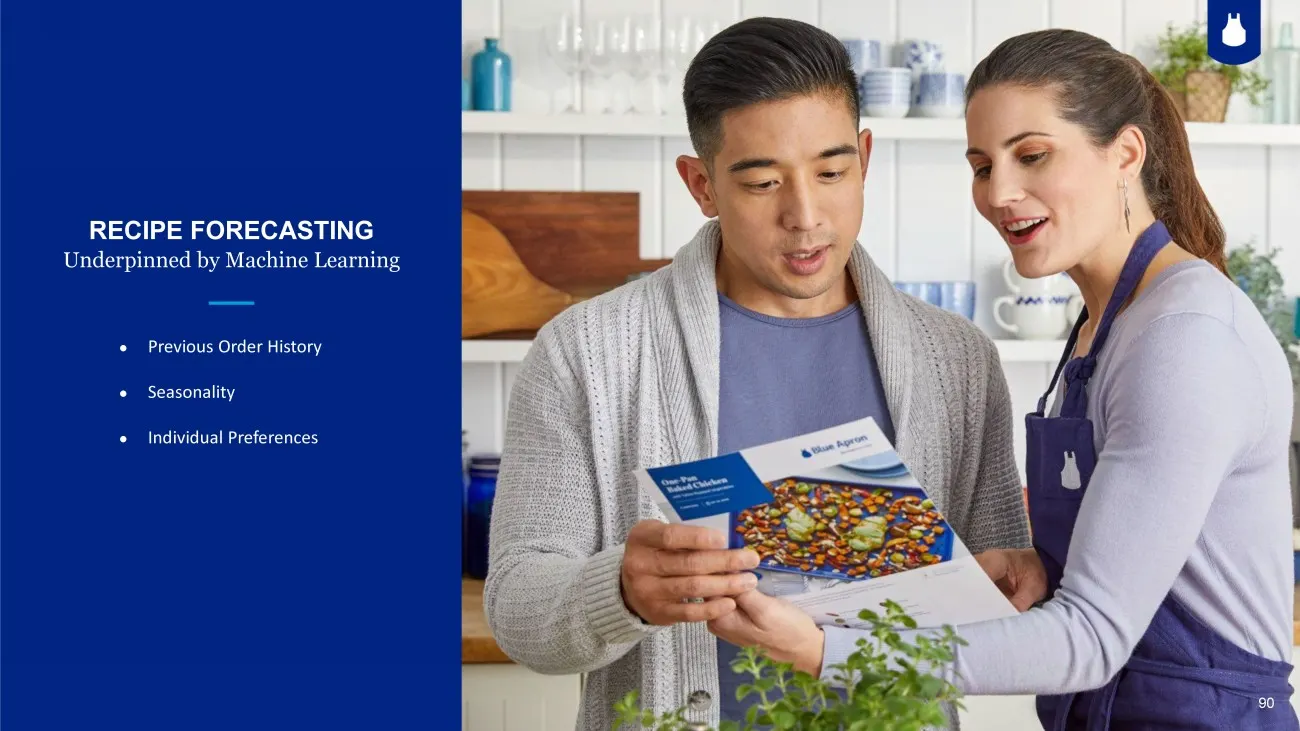
90 RECIPE FORECASTING Underpinned by Machine Learning ● Previous Order History ● Seasonality ● Individual Preferences 90
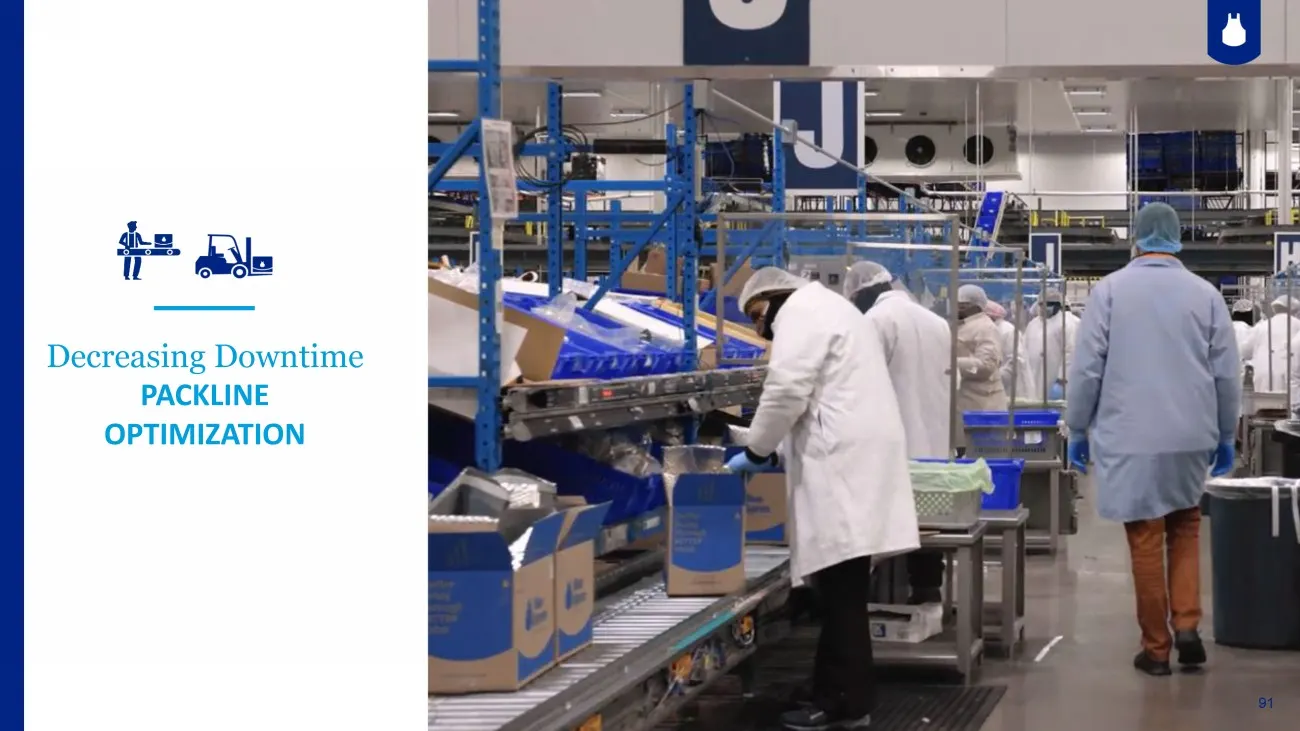
Slide 91: Packline optimization
91 Decreasing Downtime PACKLINE OPTIMIZATION 91 1
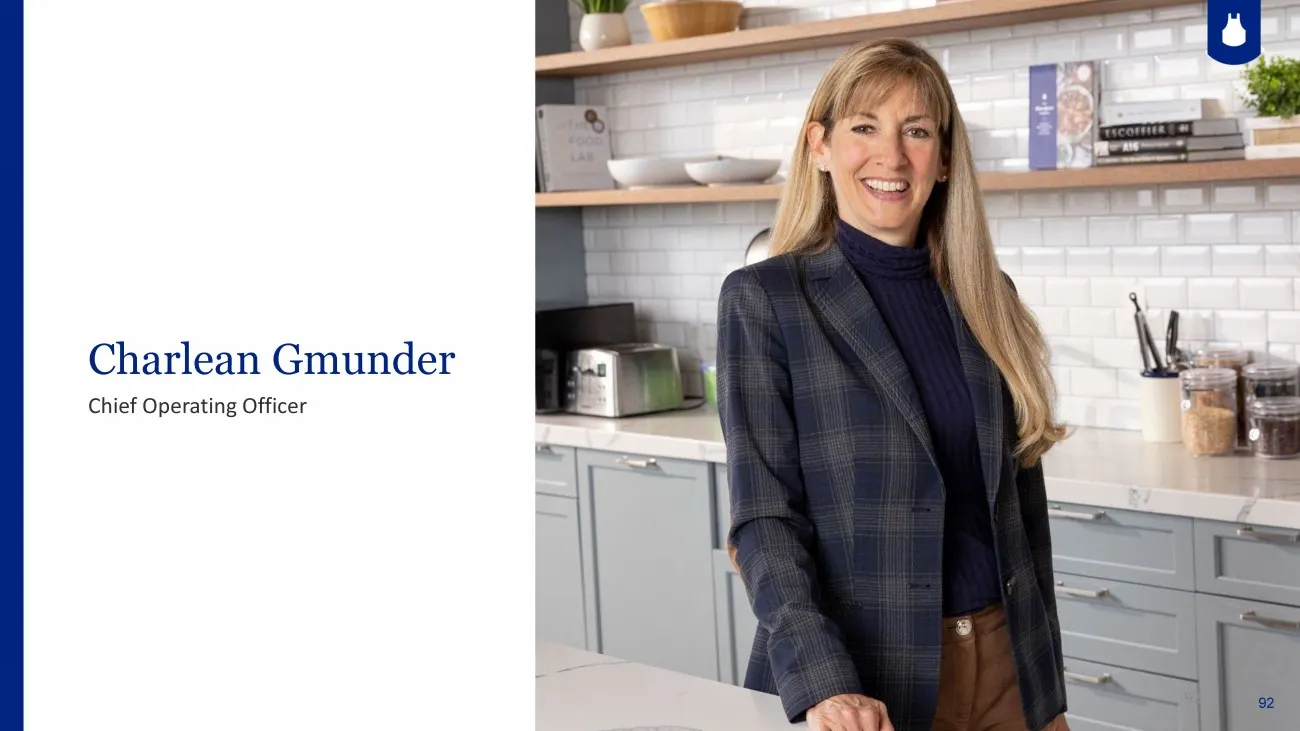
Slide 92: Charlean Gmunder, Chief Operating Officer
27 CONFIDENTIAL Charlean Gmunder Chief Operating Officer 92 92
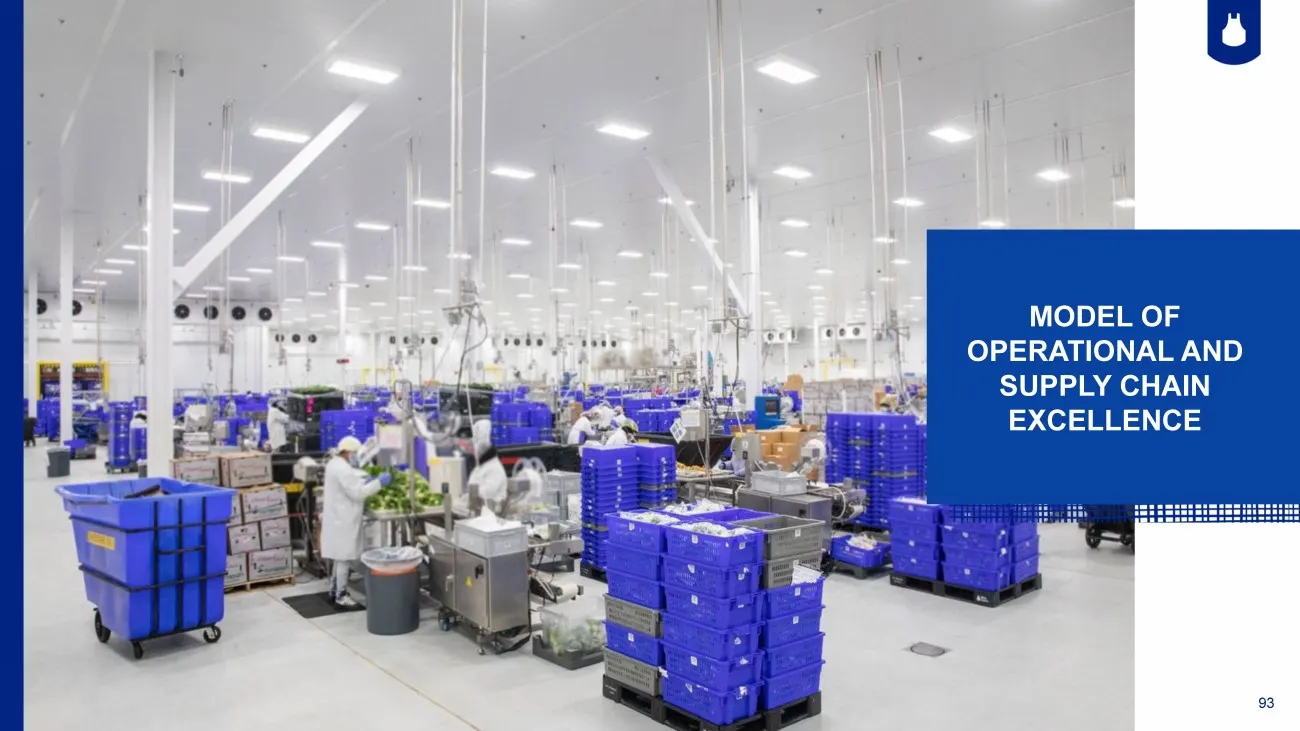
Slide 93: Model of operational and supply chain excellence
93 MODEL OF OPERATIONAL AND SUPPLY CHAIN EXCELLENCE
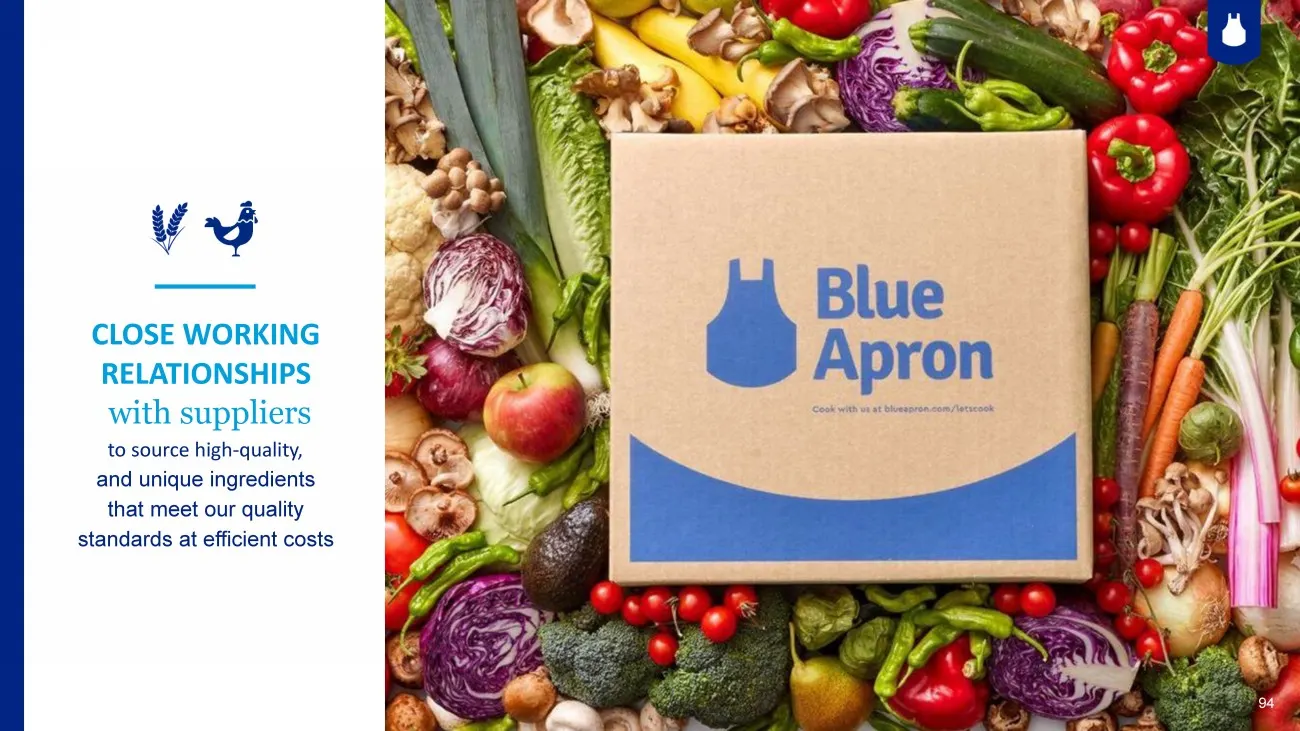
Slide 94: Close working relationships with suppliers
94 CLOSE WORKING RELATIONSHIPS with suppliers to source high - quality, and unique ingredients that meet our quality standards at efficient costs 94
Slide 95: Our kitchen
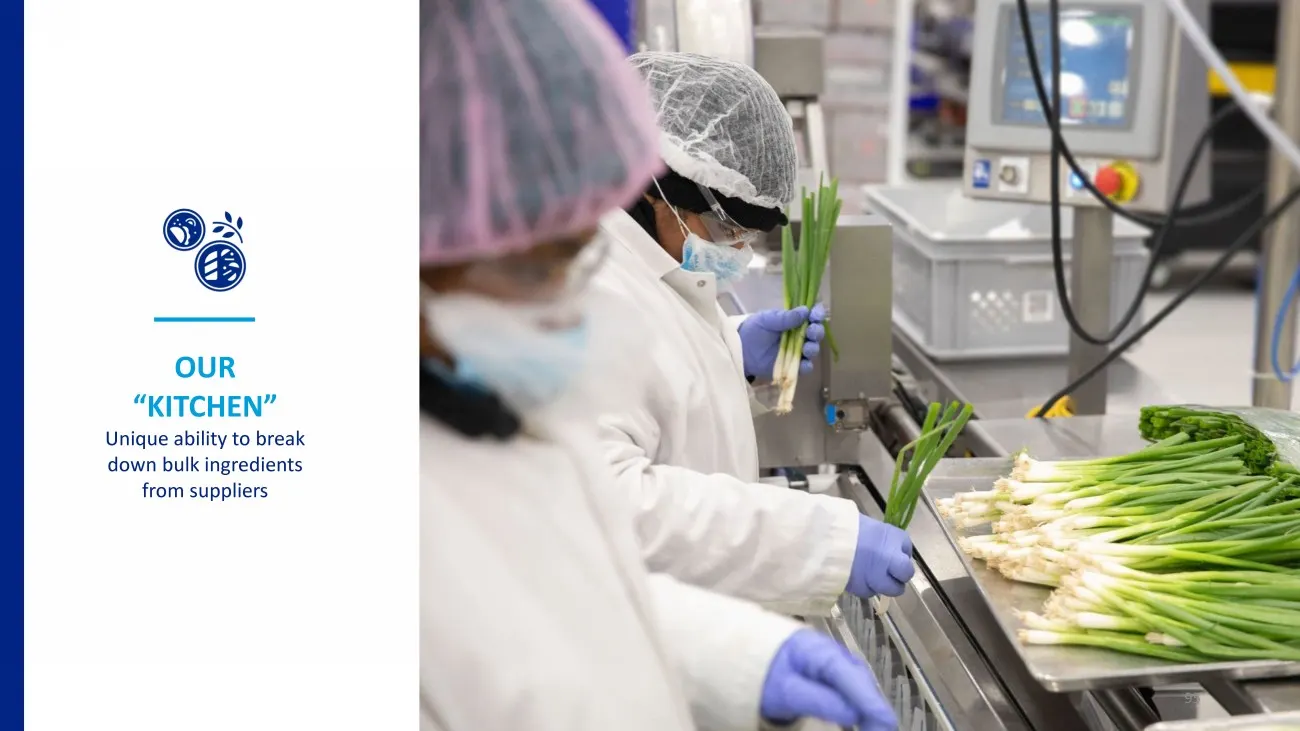
OUR “KITCHEN” Unique ability to break down bulk ingredients from suppliers 95 95
Slide 96: Perfect quality box
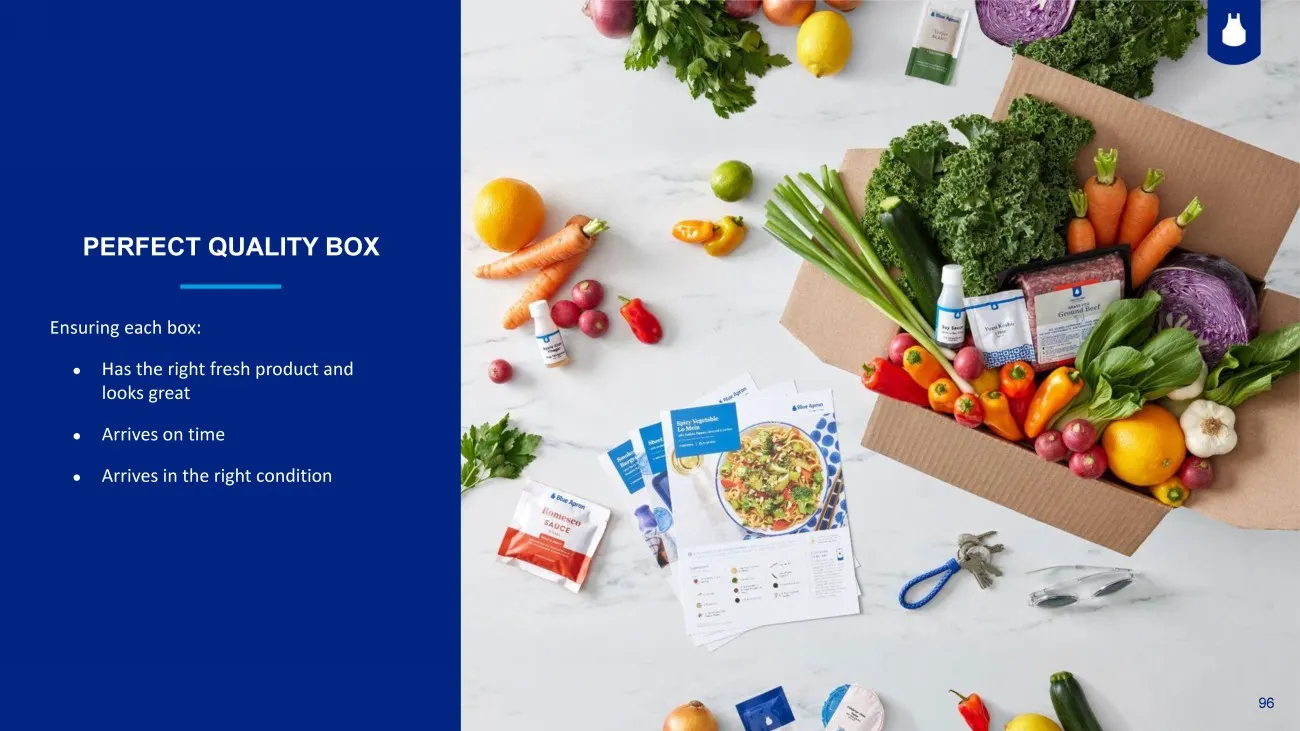
96 Ensuring each box: ● Has the right fresh product and looks great ● Arrives on time ● Arrives in the right condition PERFECT QUALITY BOX 96
Slide 97: Maintaining throughput as configuration complexity increases
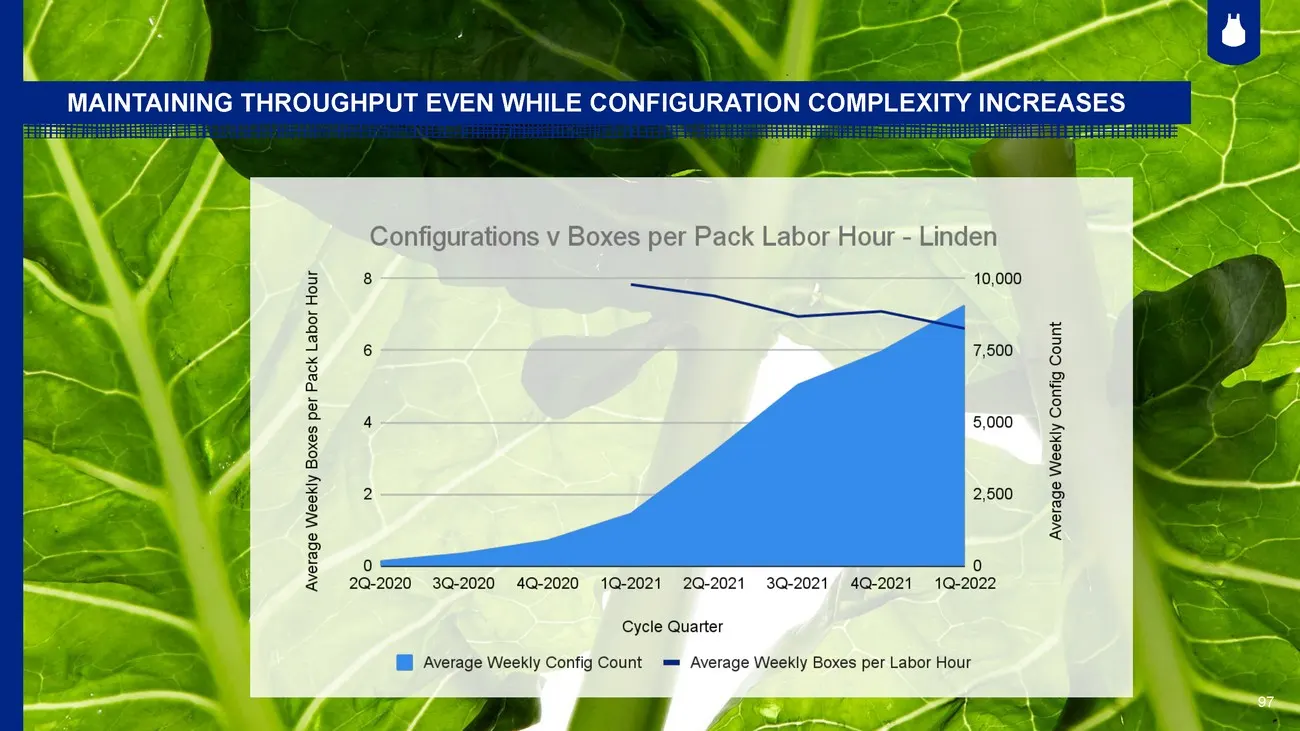
97 MAINTAINING THROUGHPUT EVEN WHILE CONFIGURATION COMPLEXITY INCREASES
Slide 98: Logistics
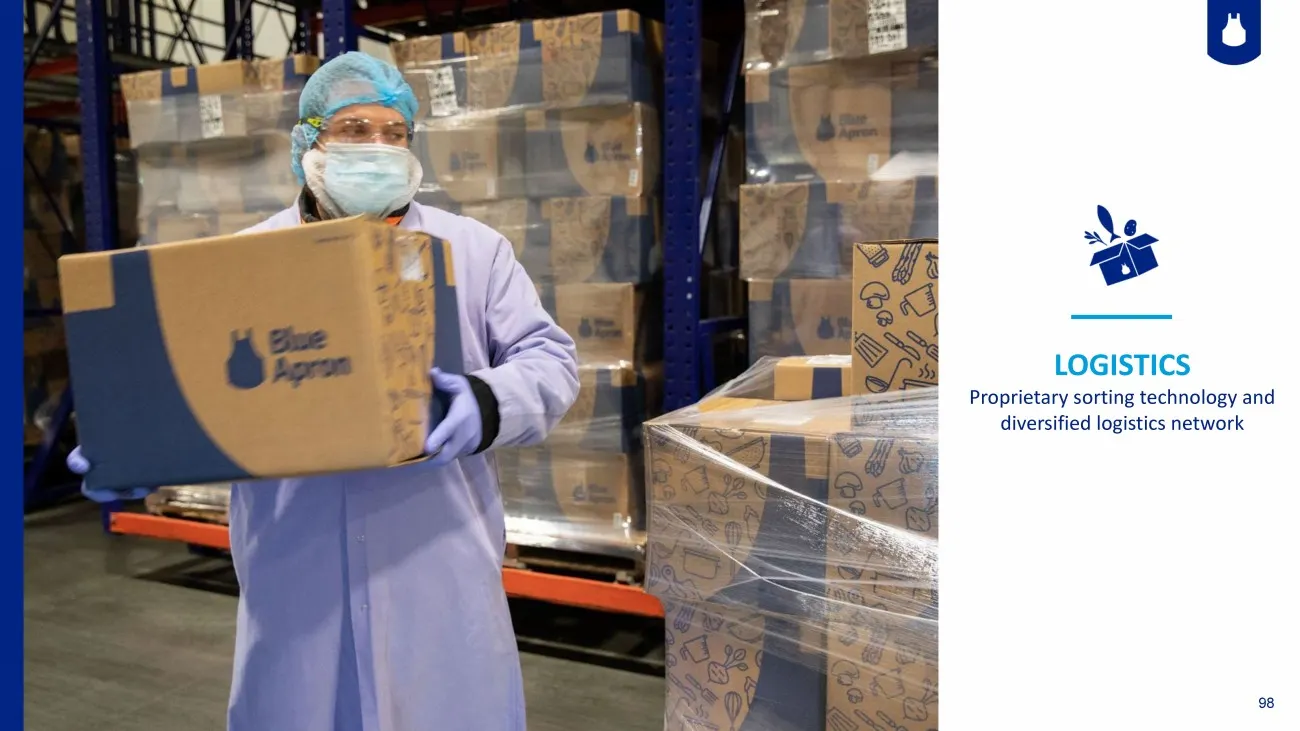
98 LOGISTICS Proprietary sorting technology and diversified logistics network
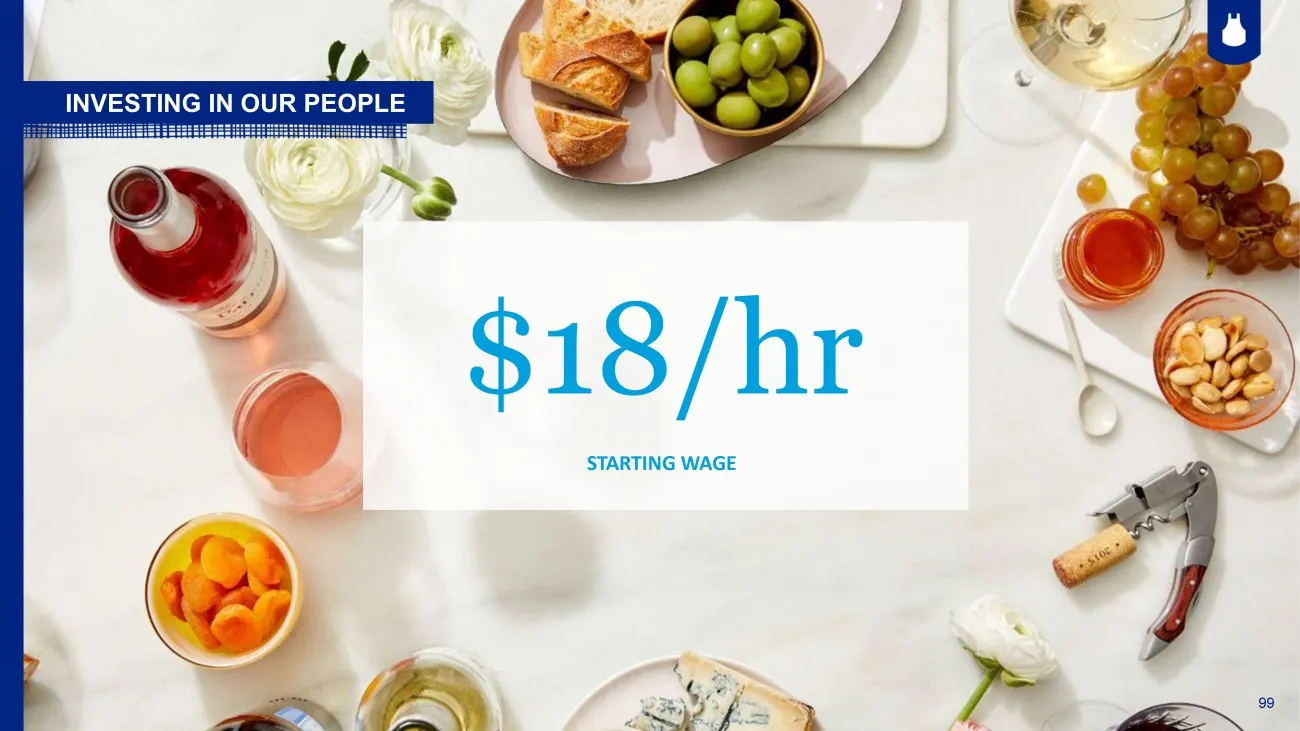
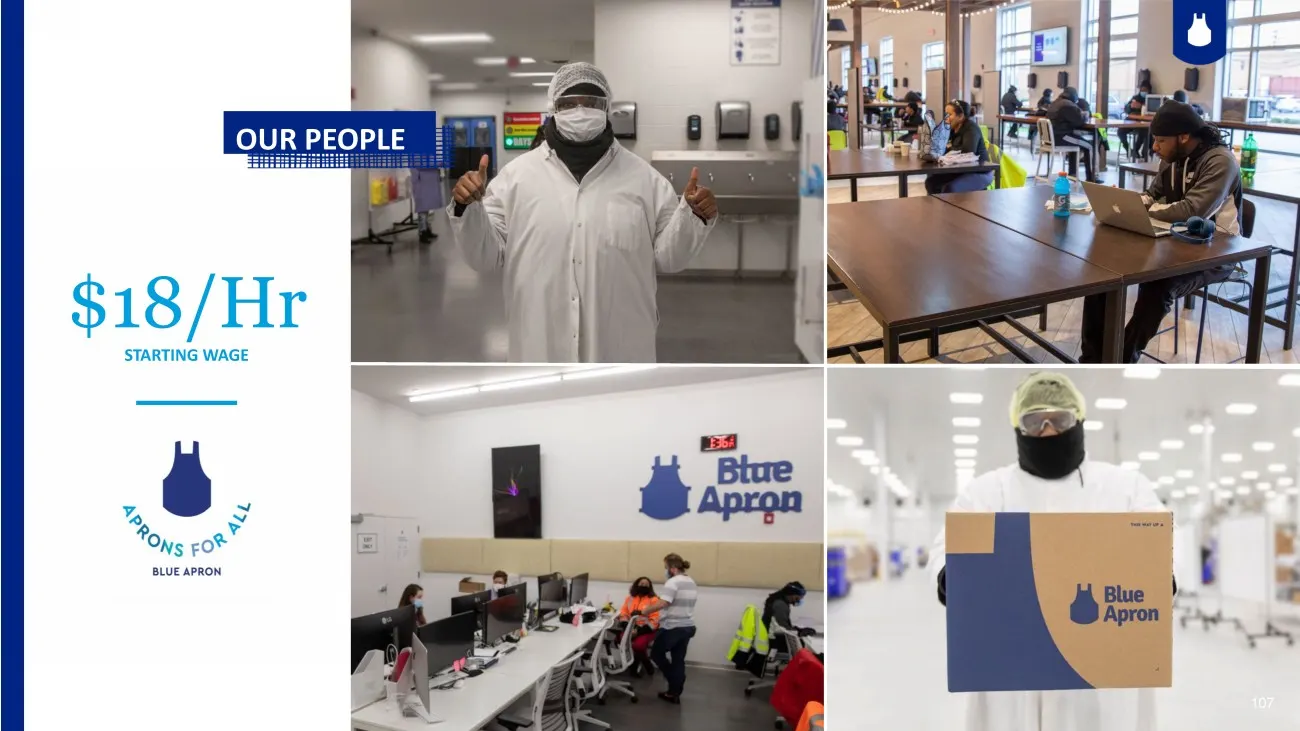
Slide 99: $18/hr starting wage
99 $18/hr STARTING WAGE INVESTING IN OUR PEOPLE 99
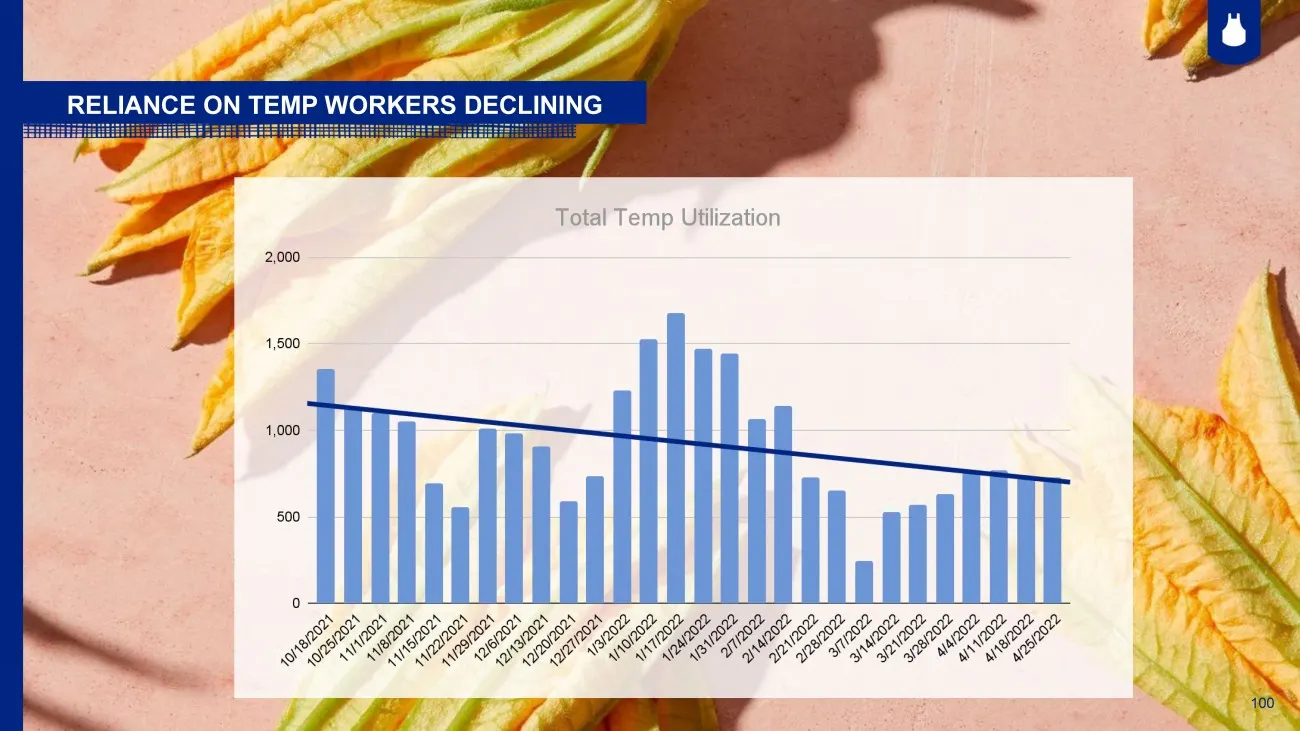
Slide 100: Reliance on temp workers declining
100 RELIANCE ON TEMP WORKERS DECLINING 100
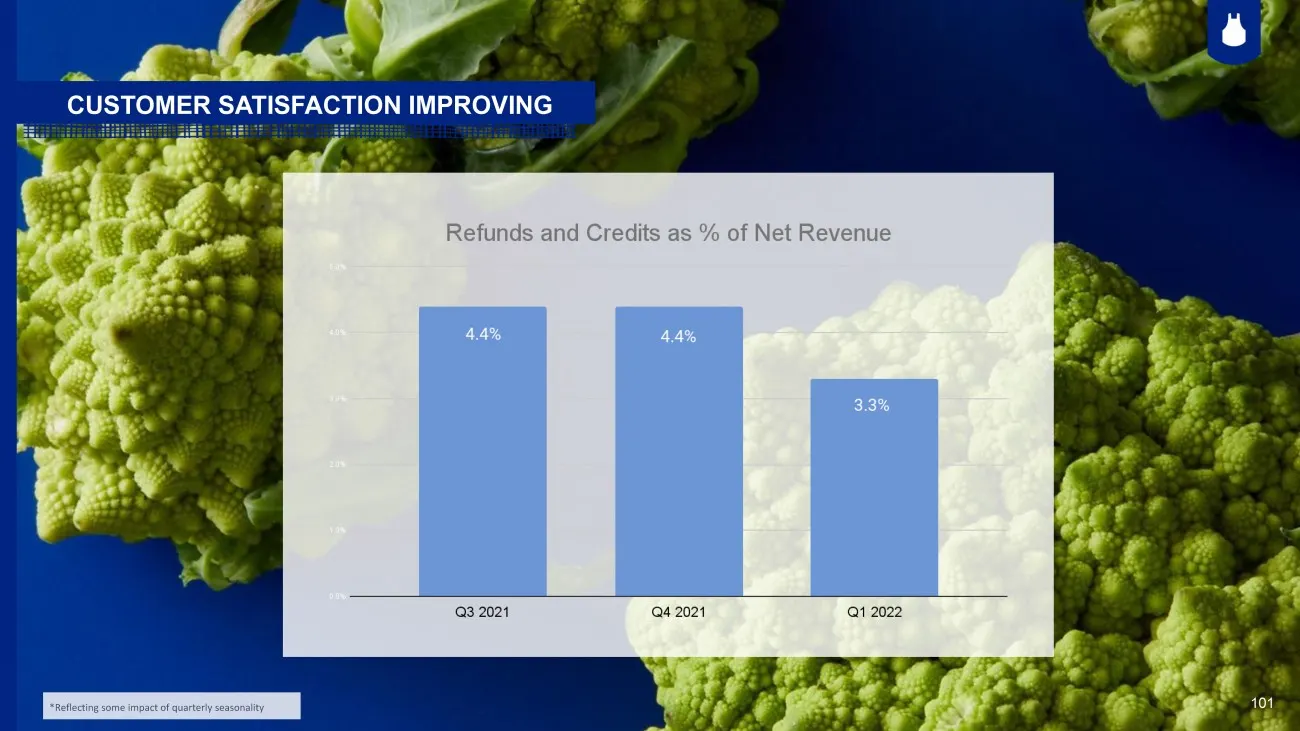
Slide 101: Customer satisfaction improving
101 CUSTOMER SATISFACTION IMPROVING 101 *Reflecting some impact of quarterly seasonality
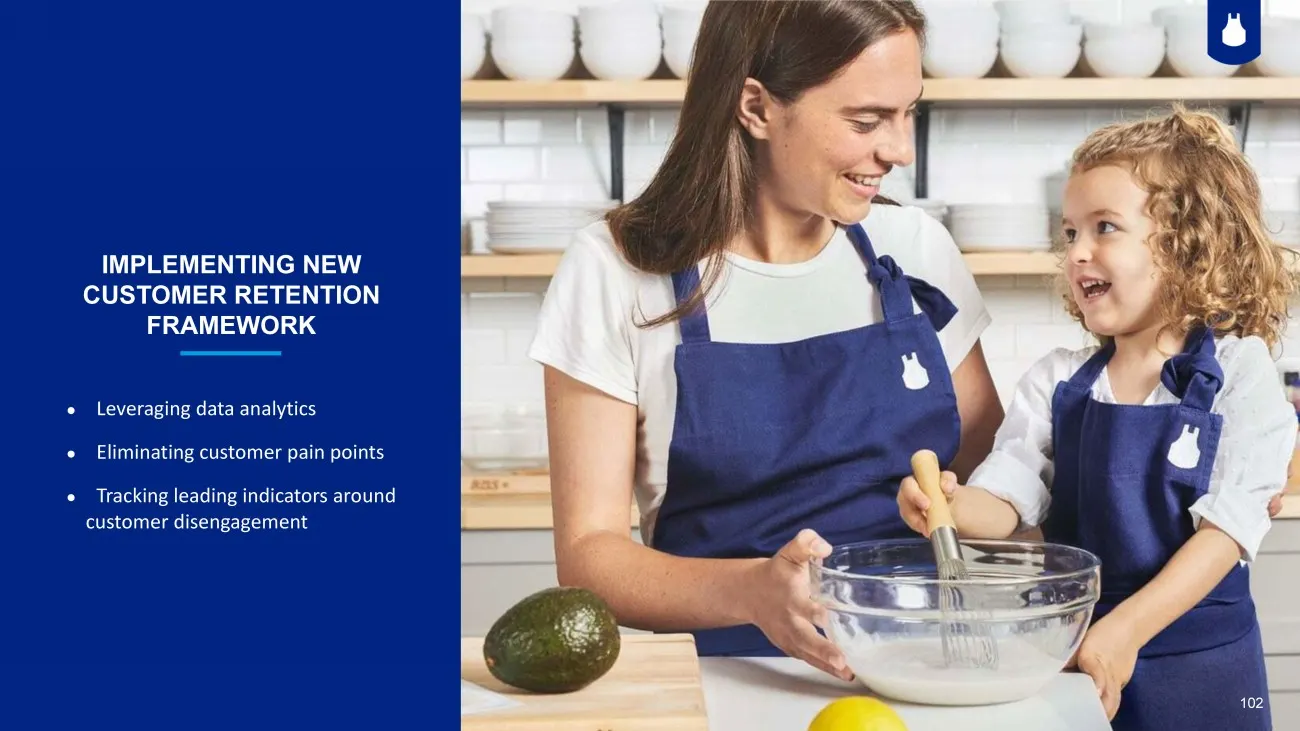
Slide 102: Implementing new customer retention framework
102 ● Leveraging data analytics ● Eliminating customer pain points ● Tracking leading indicators around customer disengagement IMPLEMENTING NEW CUSTOMER RETENTION FRAMEWORK 102
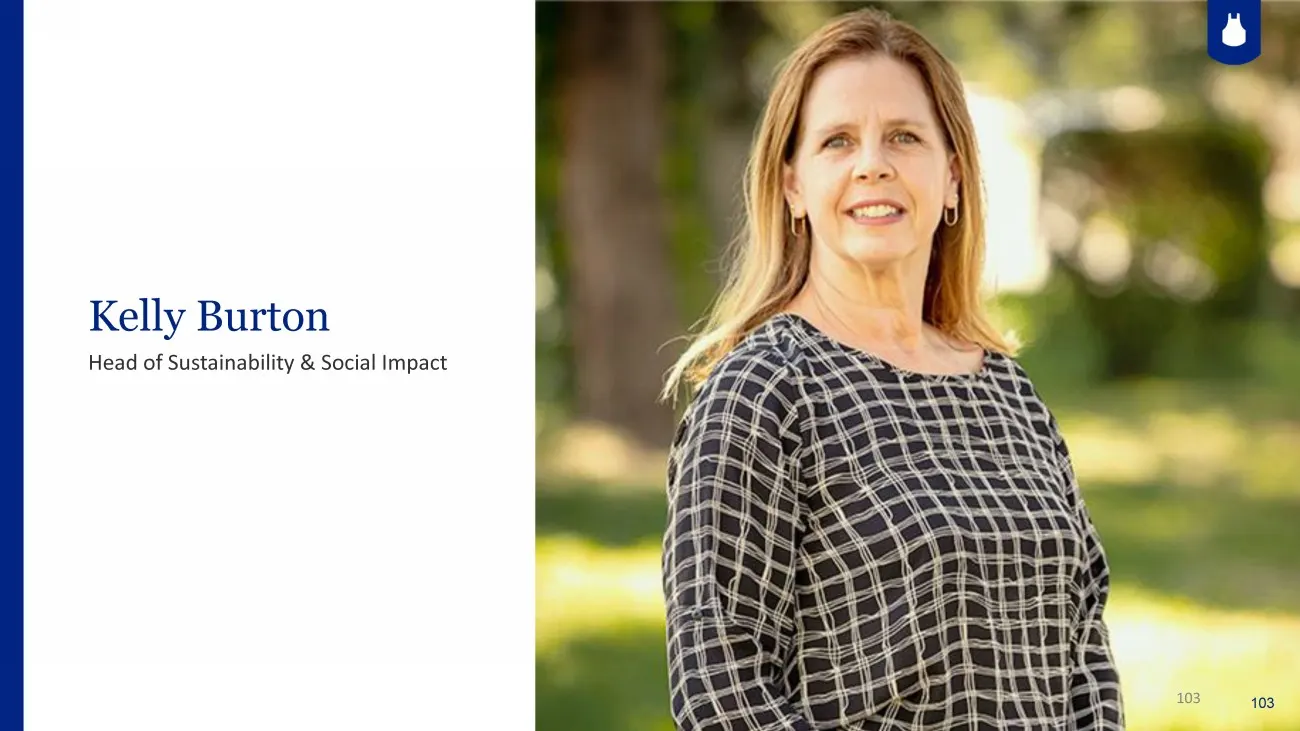
Slide 103: Kelly Burton, Head of Sustainability & Social Impact
27 Kelly Burton Head of Sustainability & Social Impact 103 103
Slide 104: Sustainability is in Blue Apron's DNA
SUSTAINABILITY is in Blue Apron’s DNA 104 104
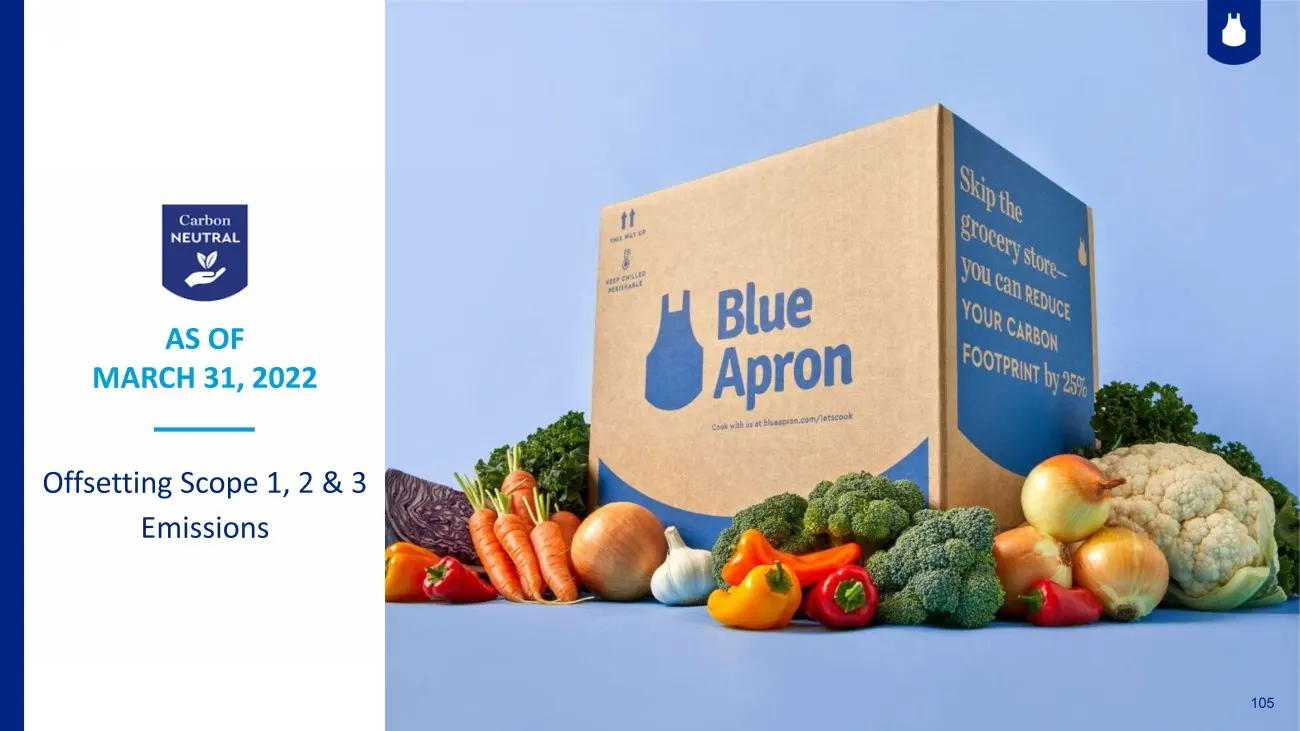
Slide 105: Offsetting Scope 1 and 2 emissions
105 27 AS OF MARCH 31, 2022 Offsetting Scope 1, 2 & 3 Emissions 105
Slide 106: Better Living Roadmap
106 BETTER LIVING ROADMAP PEOPLE PRODUCT PROGRESS
Slide 107: $18/hr starting wage: our people
107 $18/Hr STARTING WAGE OUR PEOPLE 107

Slide 108: Responsible sourcing, packaging, and handling of food
108 TM RESPONSIBLE SOURCING, PACKAGING, & HANDLING OF FOOD 1234
Slide 109: 1.3 million meals donated to Feeding America in 2021
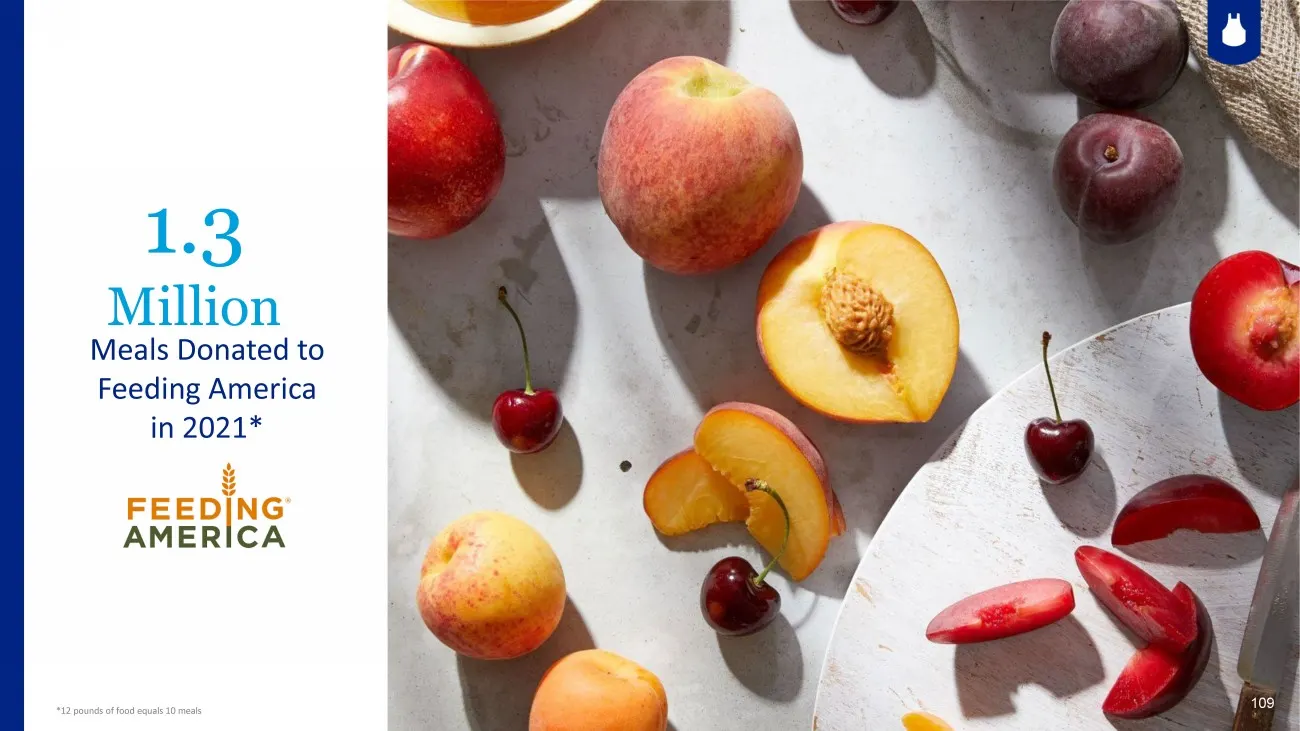
109 1.3 Million Meals Donated to Feeding America in 2021* 109 *12 pounds of food equals 10 meals
Slide 110: 500,000 meals donated to employees through Farmer's Market
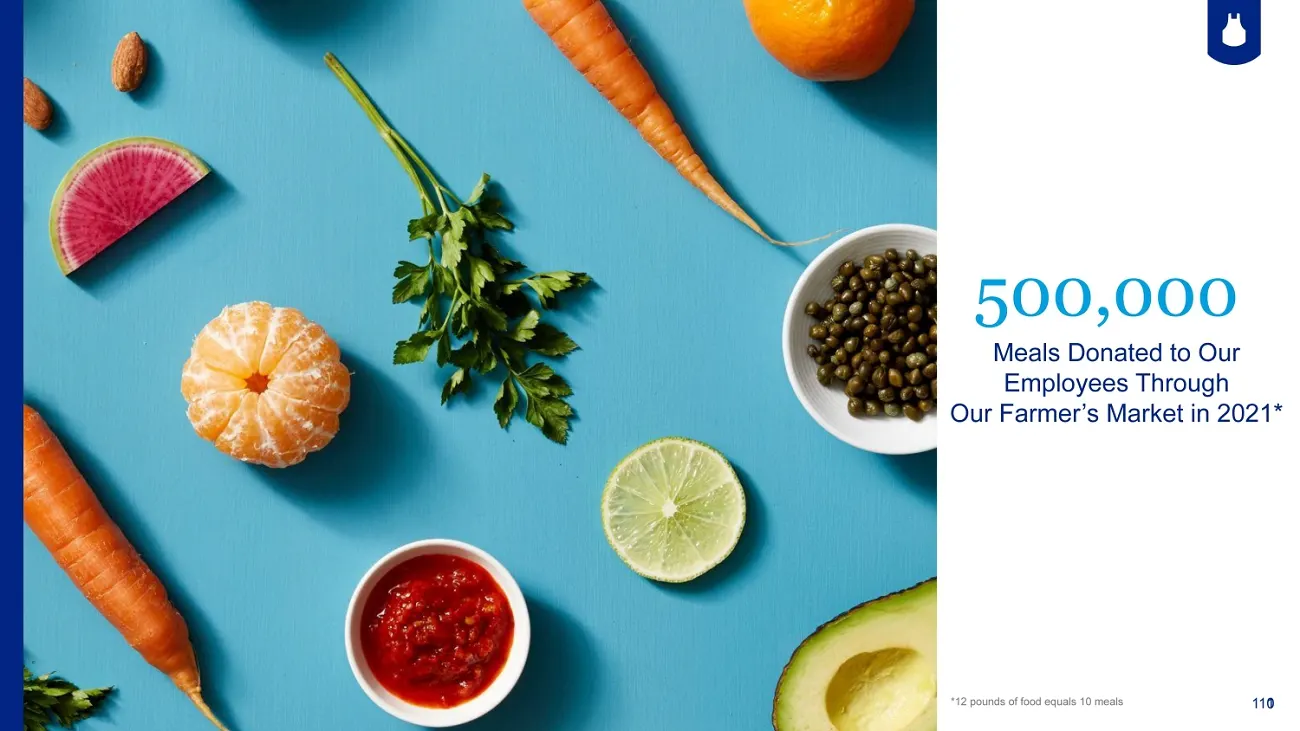
110 500,000 Meals Donated to Our Employees Through Our Farmer’s Market In 2021* 110 *12 pounds of food equals 10 meals
Slide 111: High quality and responsible sourcing
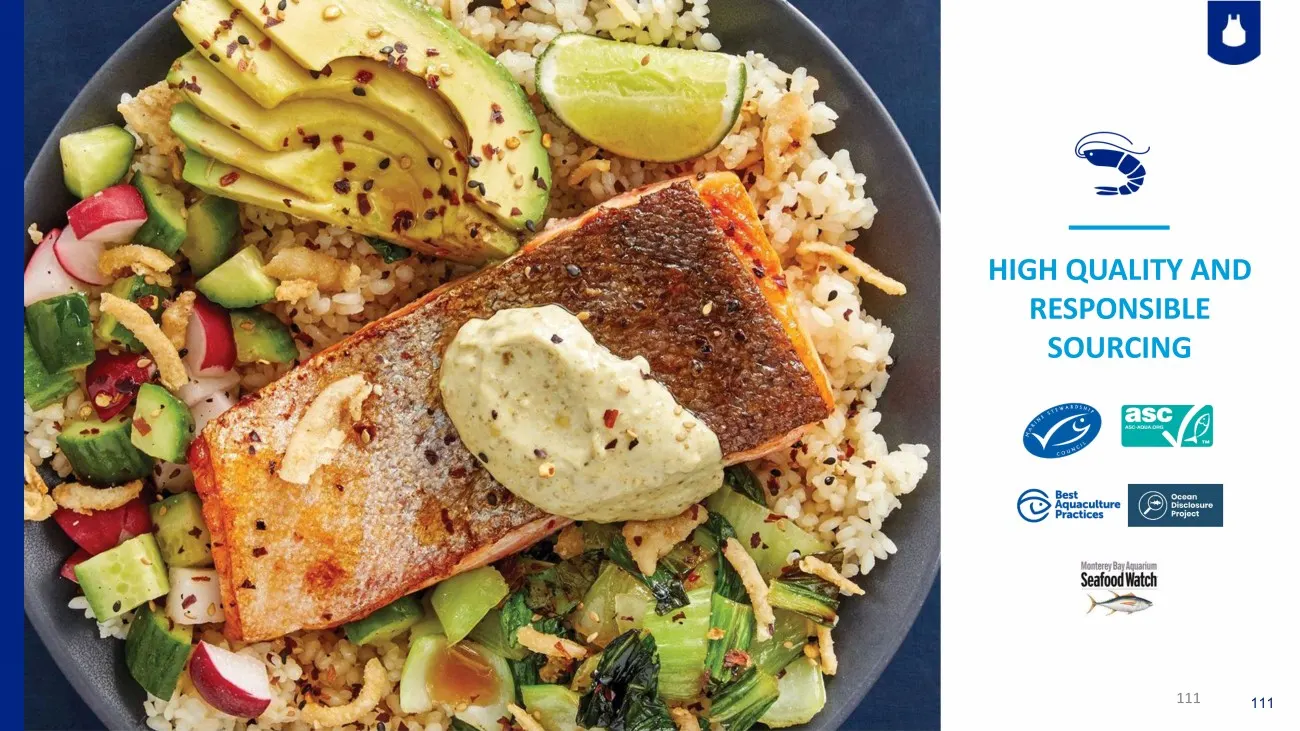
HIGH QUALITY AND RESPONSIBLE SOURCING 111 111
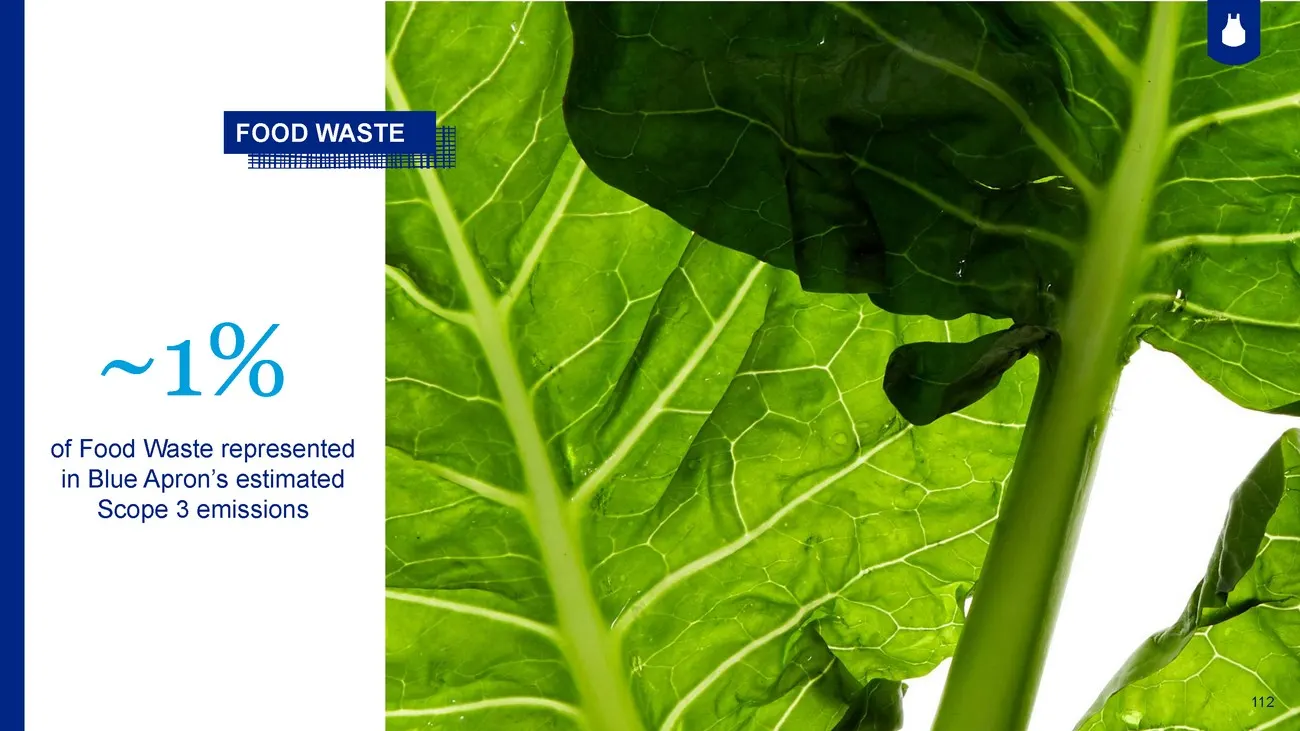
Slide 112: Food waste
112 ~1% of Food Waste represented in Blue Apron's estimated Scope 3 emissions FOOD WASTE
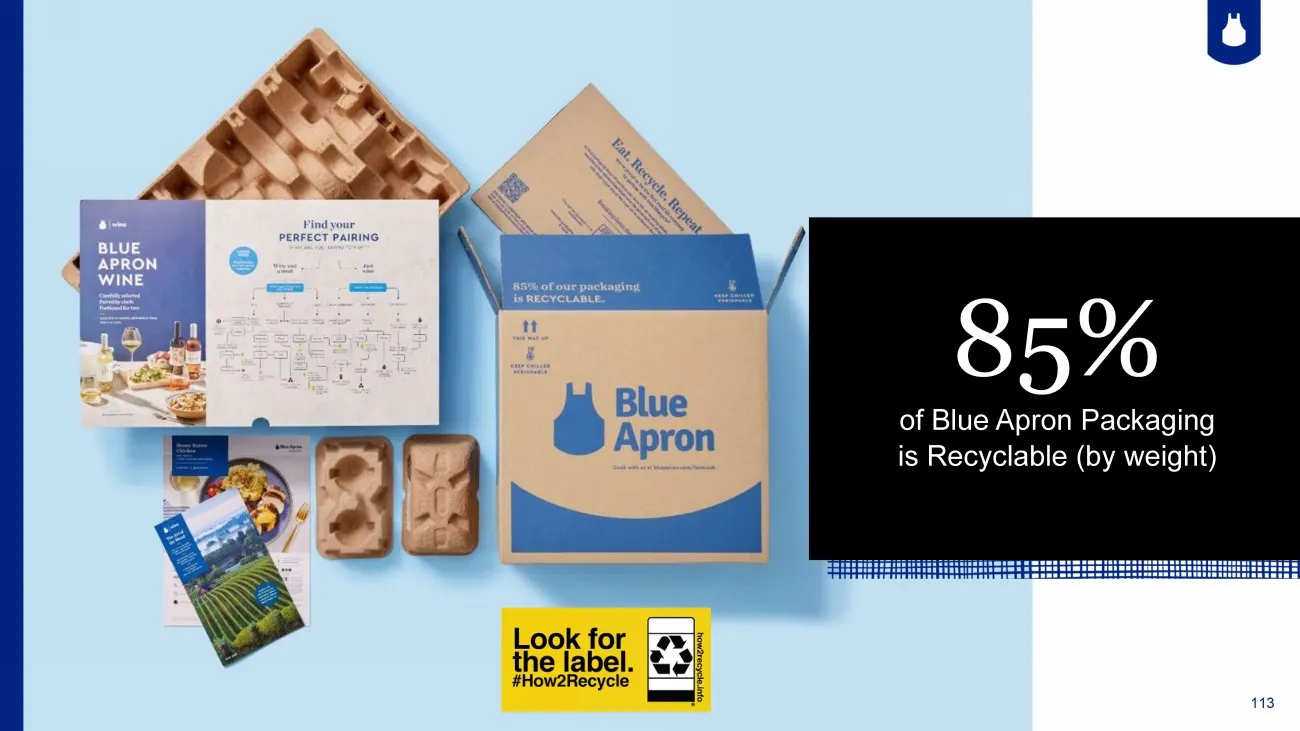
Slide 113: 85% of packaging is recyclable
113 TM 85% of Blue Apron Packaging is Recyclable (by weight)
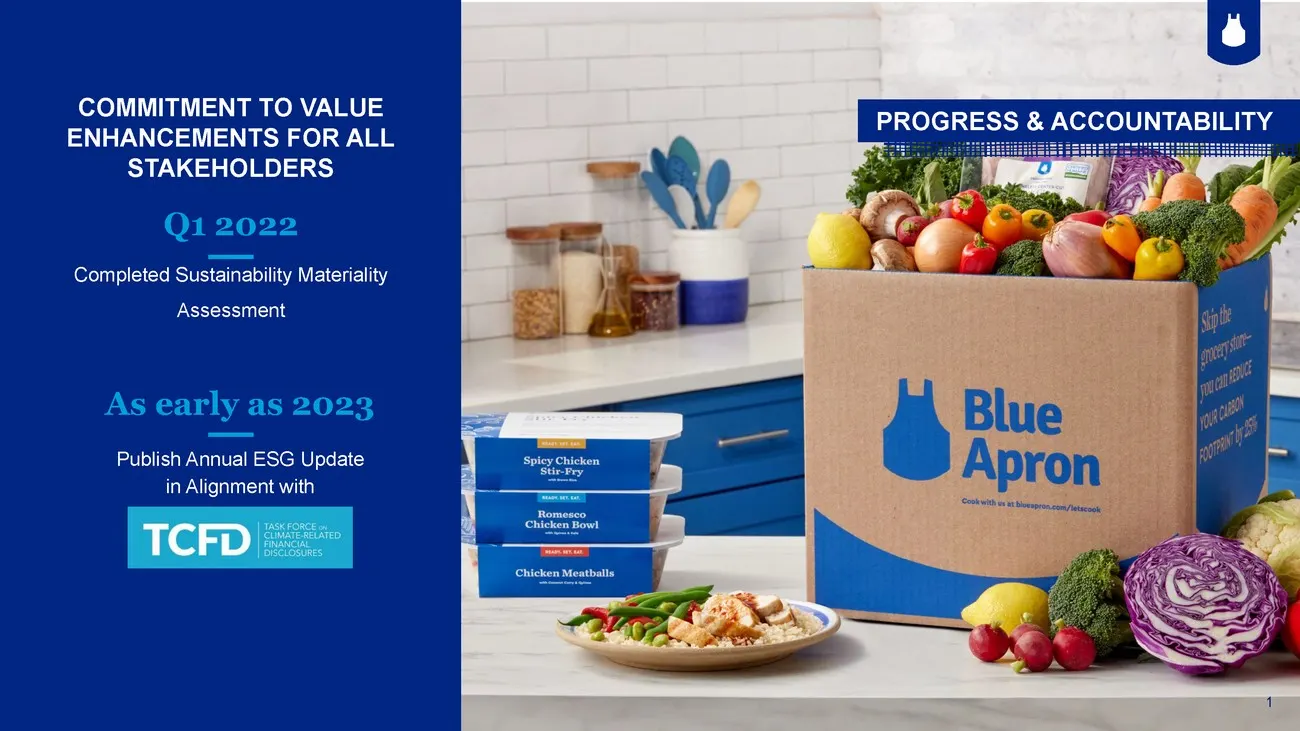
Slide 114: Sustainability materiality assessment and ESG reporting
1 Q1 2022 Completed Sustainability Materiality Assessment COMMITMENT TO VALUE PROGRESS & ACCOUNTABILITY ENHANCEMENTS FOR ALL STAKEHOLDERS As early as 2023 Publish Annual ESG Update in Alignment with
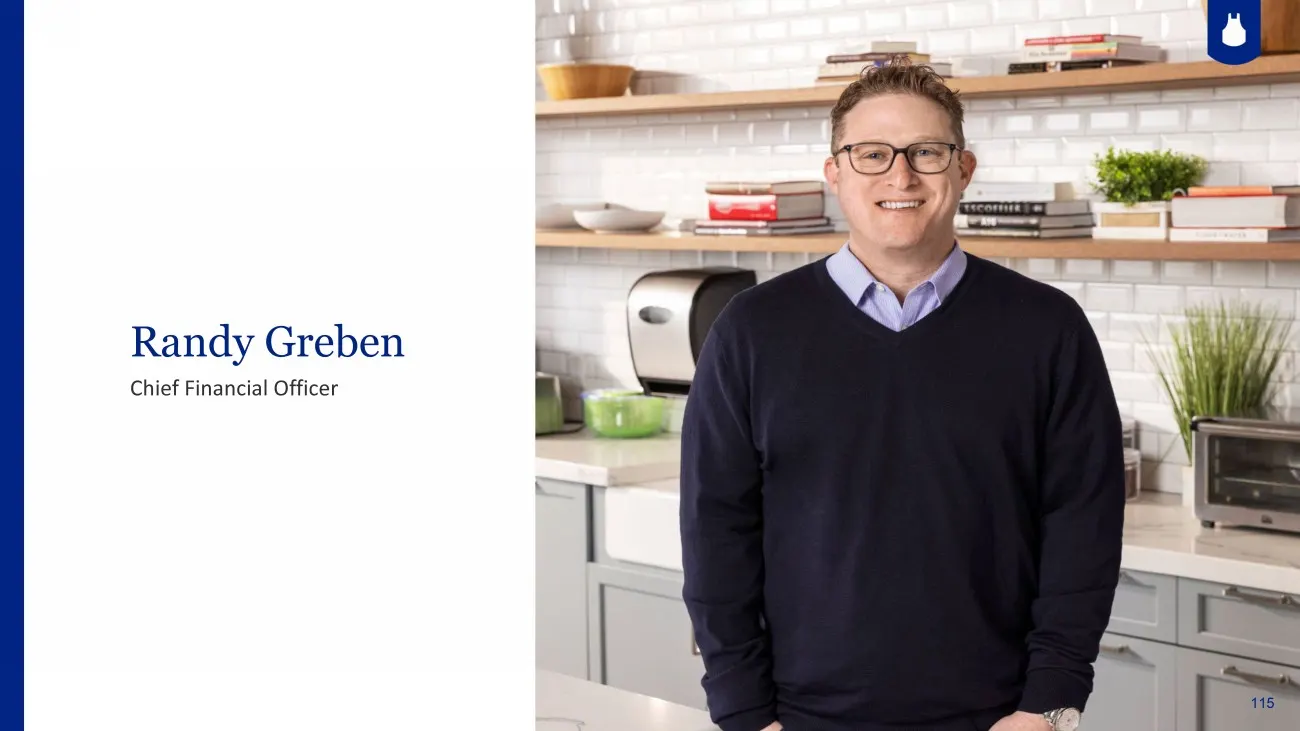
Slide 115: Randy Greben, Chief Financial Officer
115 Randy Greben Chief Financial Officer 115
Slide 116: Benefits of cooking go beyond functional
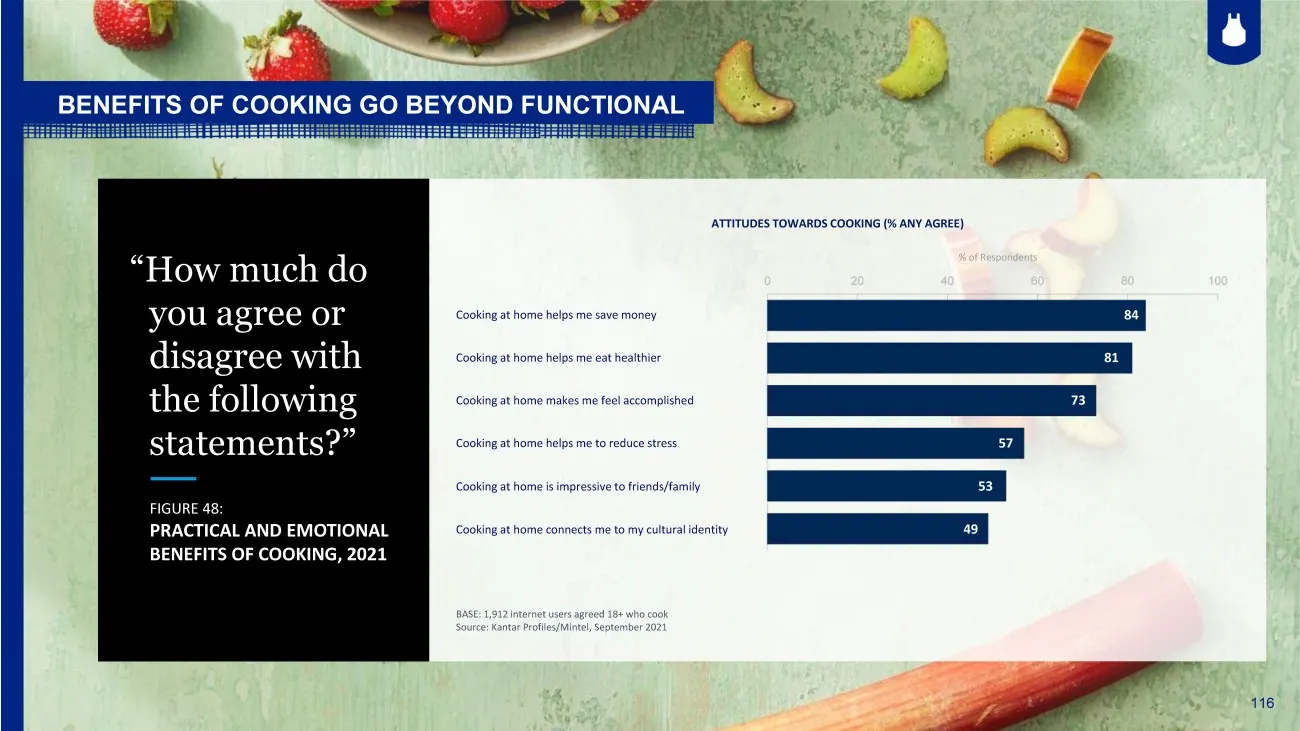
116 BENEFITS OF COOKING GO BEYOND FUNCTIONAL FIGURE 48: PRACTICAL AND EMOTIONAL BENEFITS OF COOKING, 2021 “How much do you agree or disagree with the following statements?” Cooking at home helps me save money Cooking at home helps me eat healthier 84 Cooking at home makes me feel accomplished Cookin
Slide 117: Quarterly net revenue by annual cohort
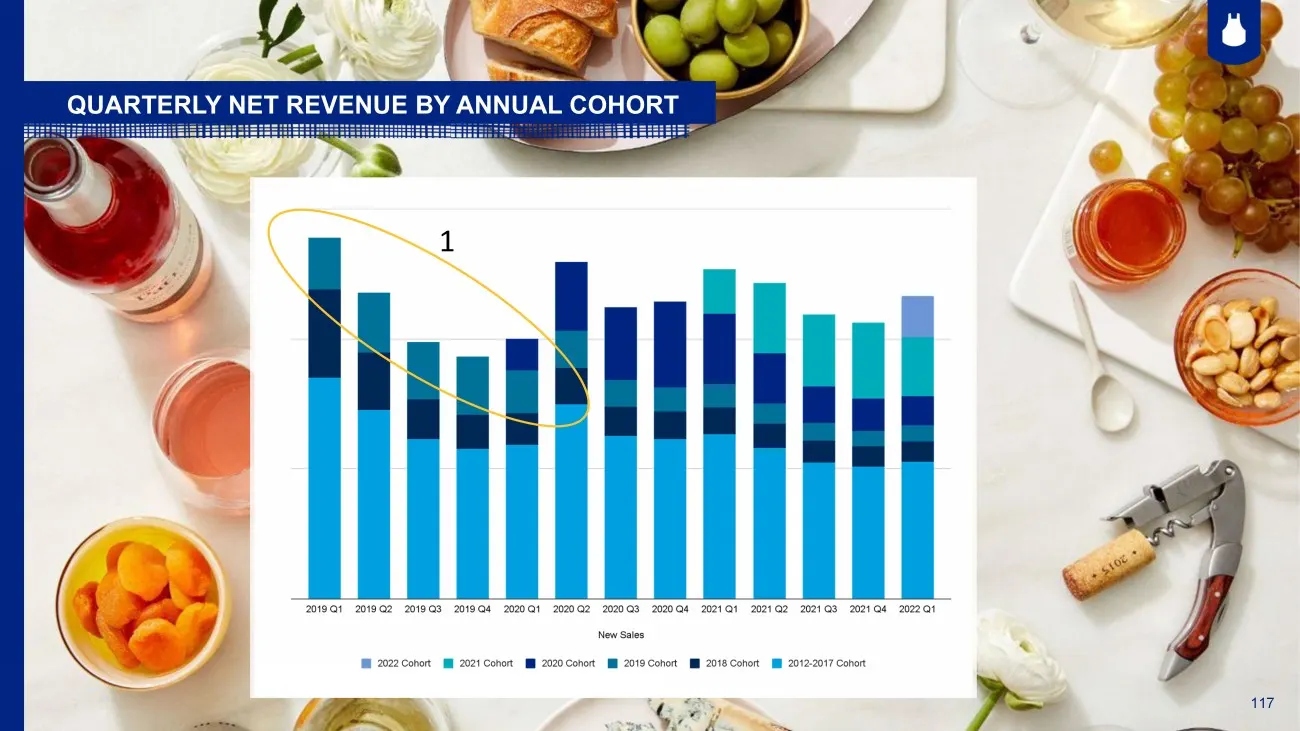
117 QUARTERLY NET REVENUE BY ANNUAL COHORT 1 117
Slide 118: Quarterly net revenue by annual cohort
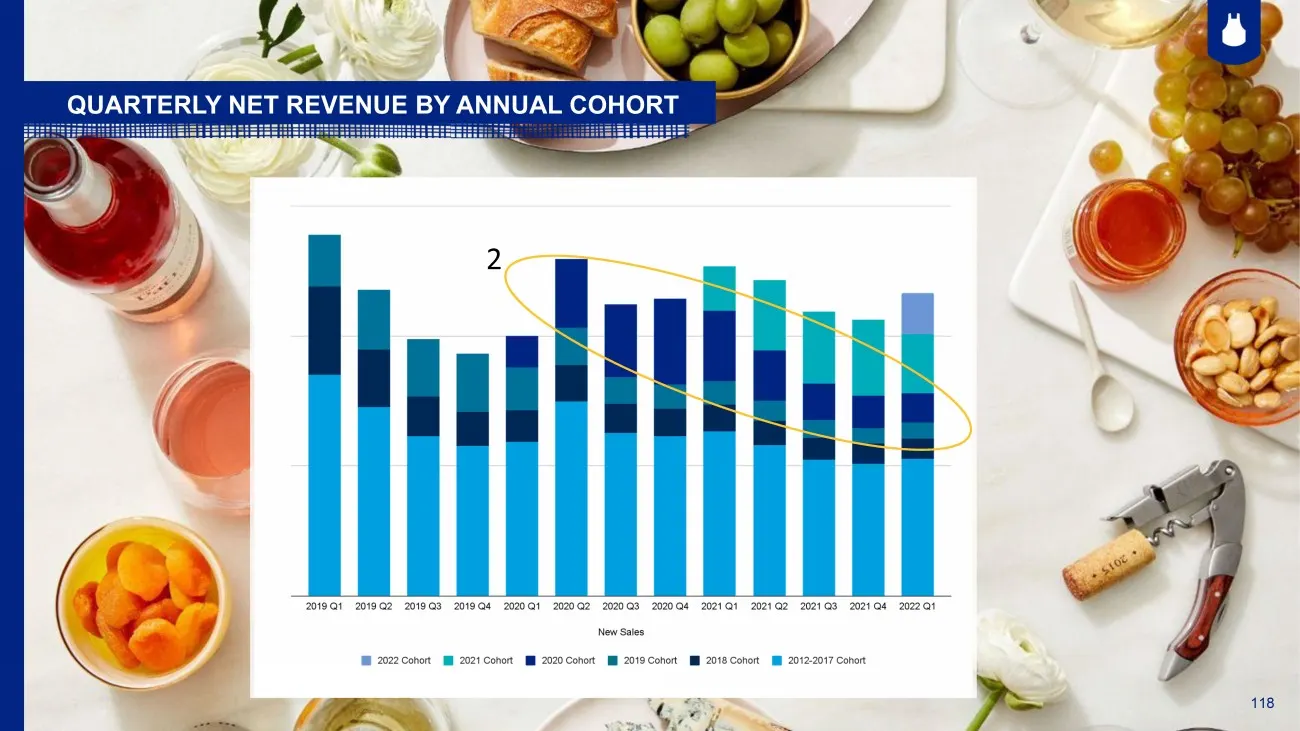
118 2 QUARTERLY NET REVENUE BY ANNUAL COHORT 118
Slide 119: Quarterly net revenue by annual cohort
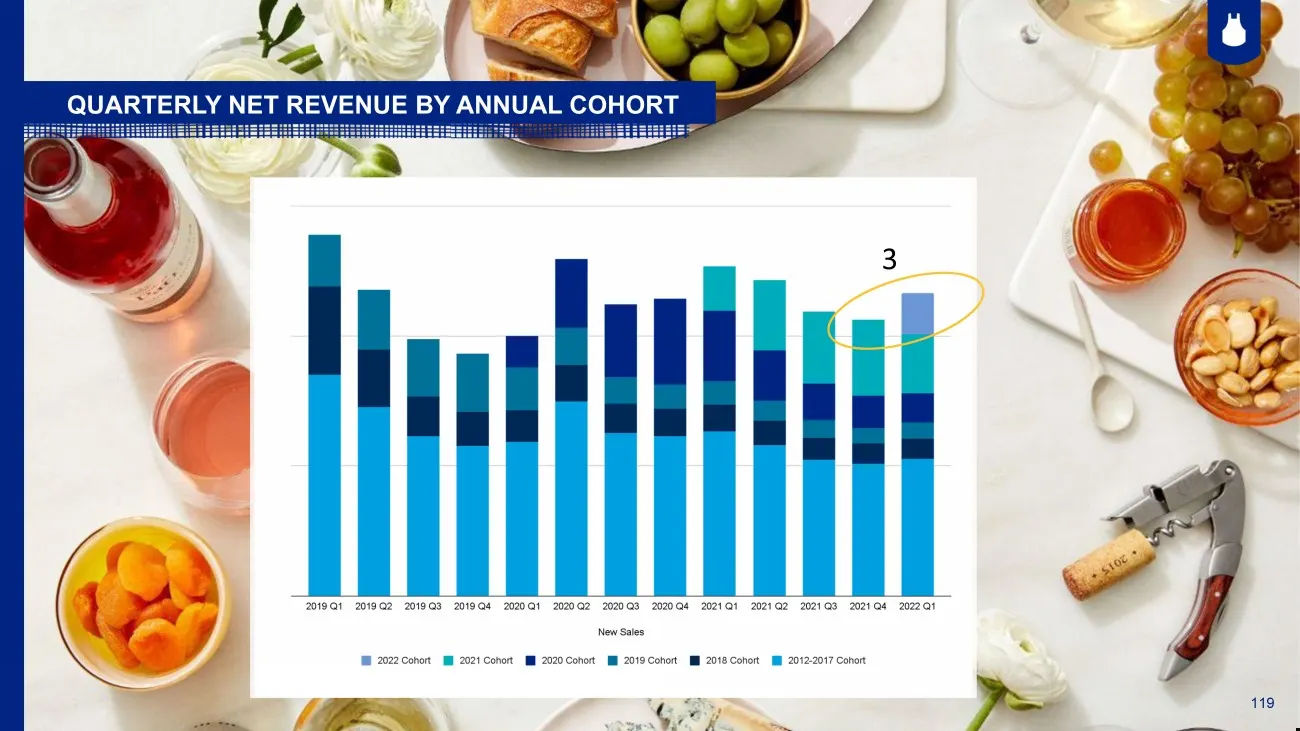
119 3 QUARTERLY NET REVENUE BY ANNUAL COHORT 119
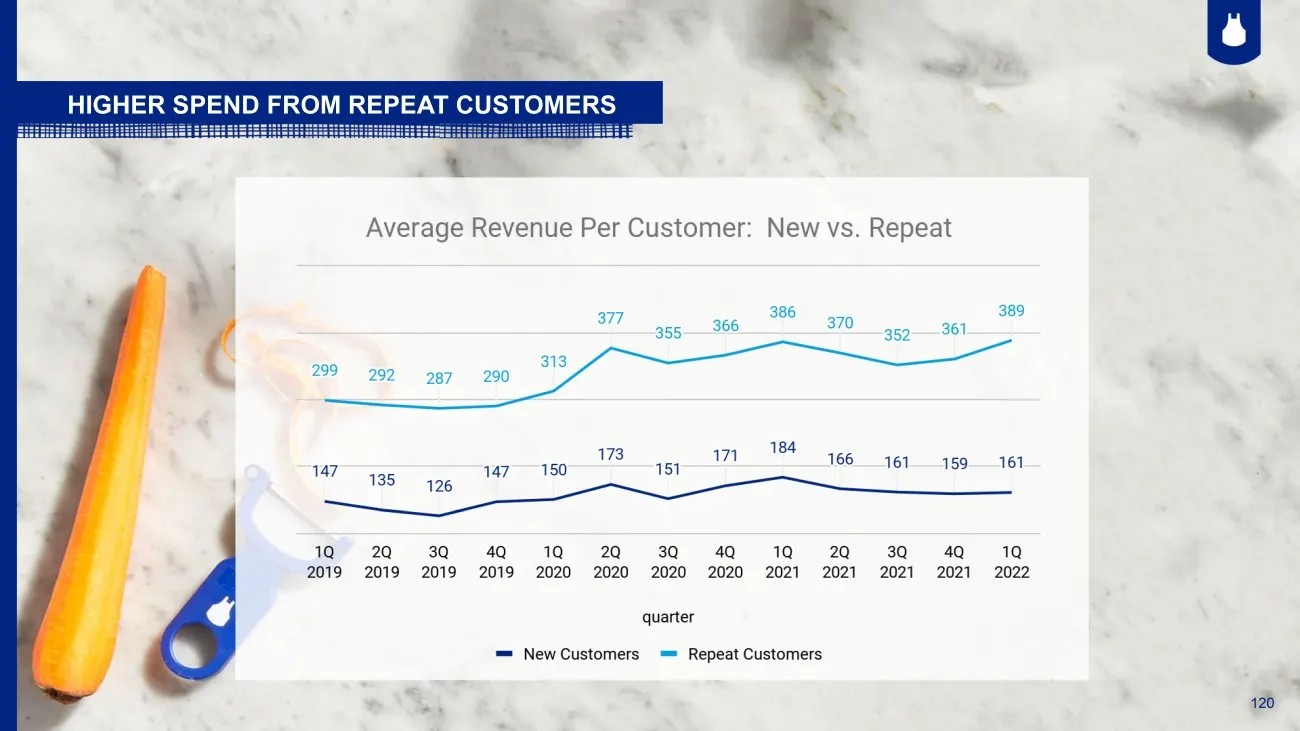
Slide 120: Higher spend from repeat customers
120 HIGHER SPEND FROM REPEAT CUSTOMERS 120
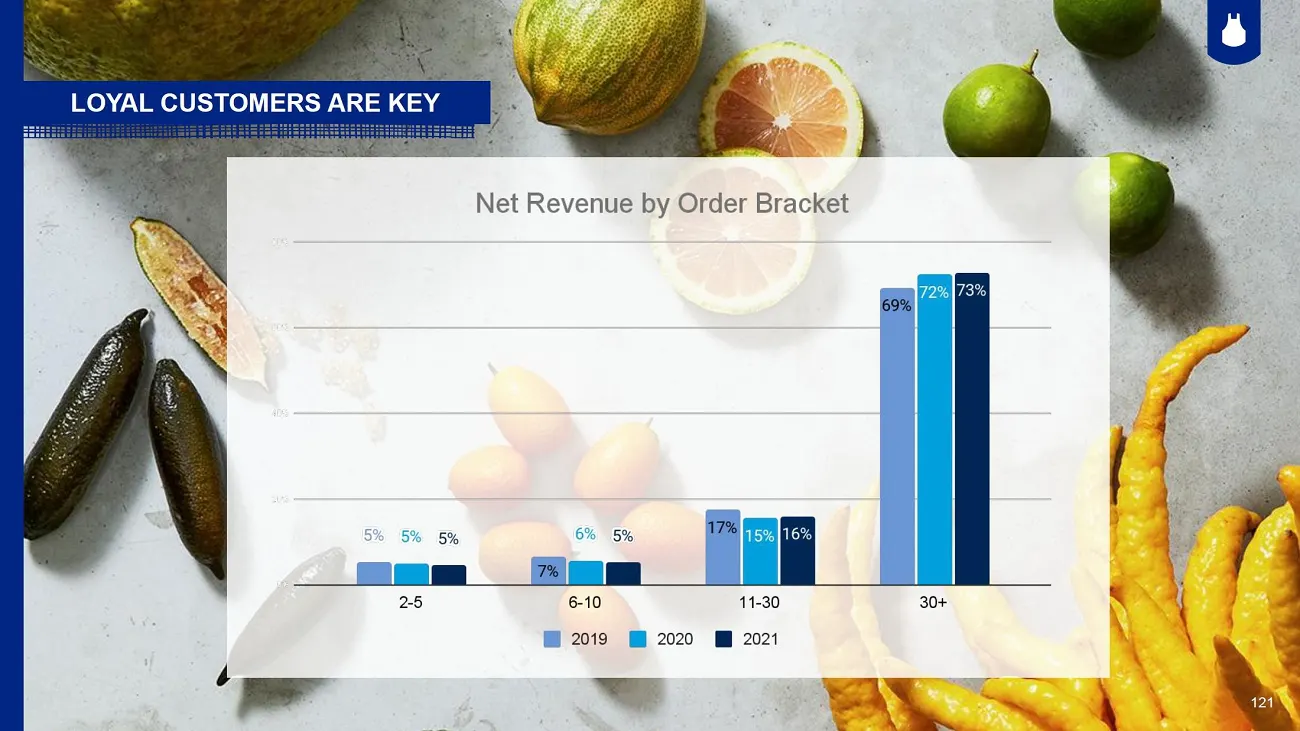
Slide 121: ari
ari 6-10 11-30 @ 2019 @ 2020 Mi 2021 . rr a
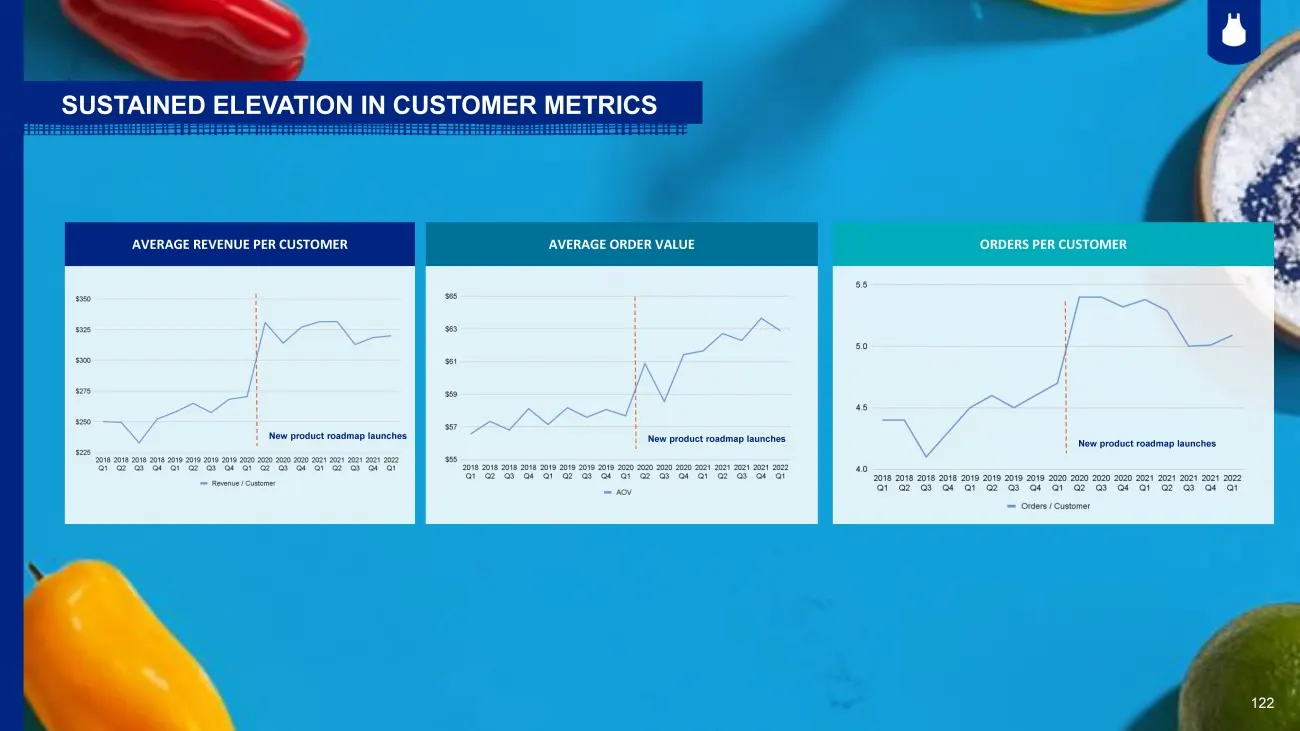
Slide 122: Sustained elevation in customer metrics
122 SUSTAINED ELEVATION IN CUSTOMER METRICS AVERAGE REVENUE PER CUSTOMER AVERAGE ORDER VALUE ORDERS PER CUSTOMER New product roadmap launches New product roadmap launches New product roadmap launches 122
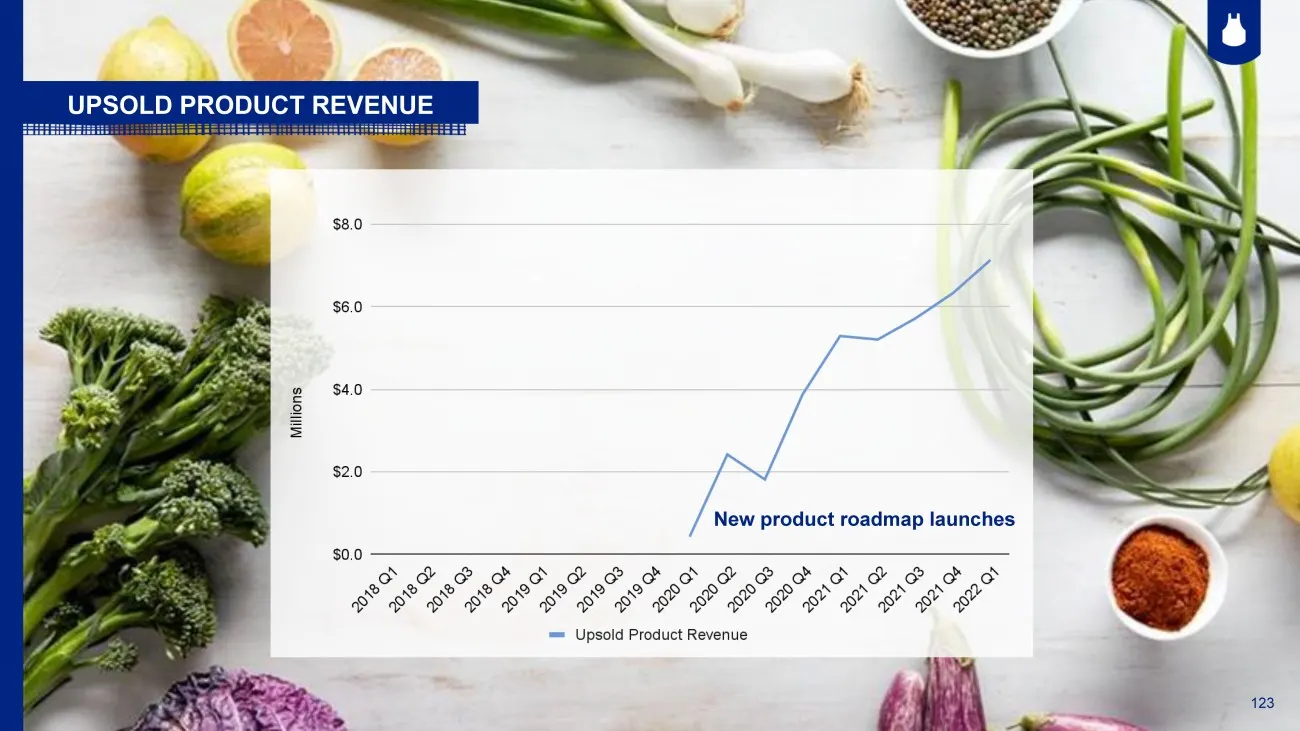
Slide 123: Upsold product revenue
123 UPSOLD PRODUCT REVENUE New product roadmap launches 123
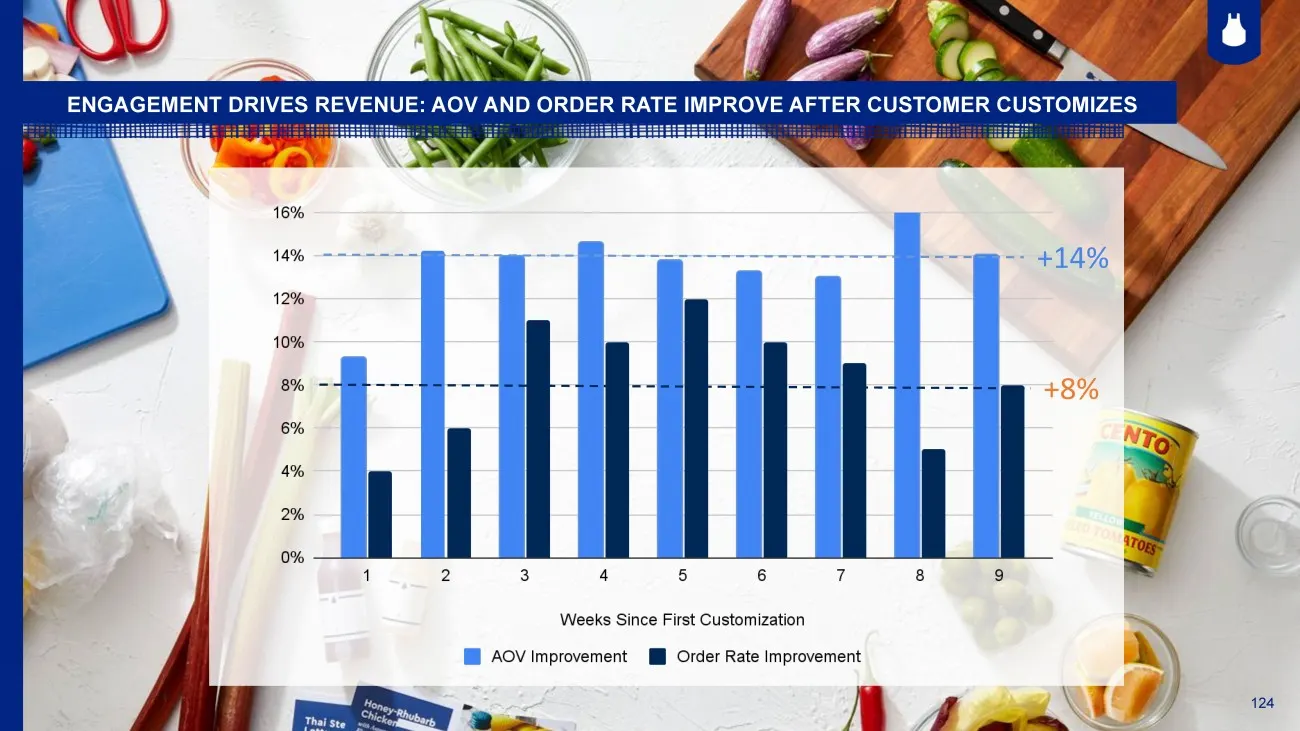
Slide 124: Engagement drives revenue: AOV and order rate improve after customization
124 ENGAGEMENT DRIVES REVENUE: AOV AND ORDER RATE IMPROVE AFTER CUSTOMER CUSTOMIZES +14% +8% 124
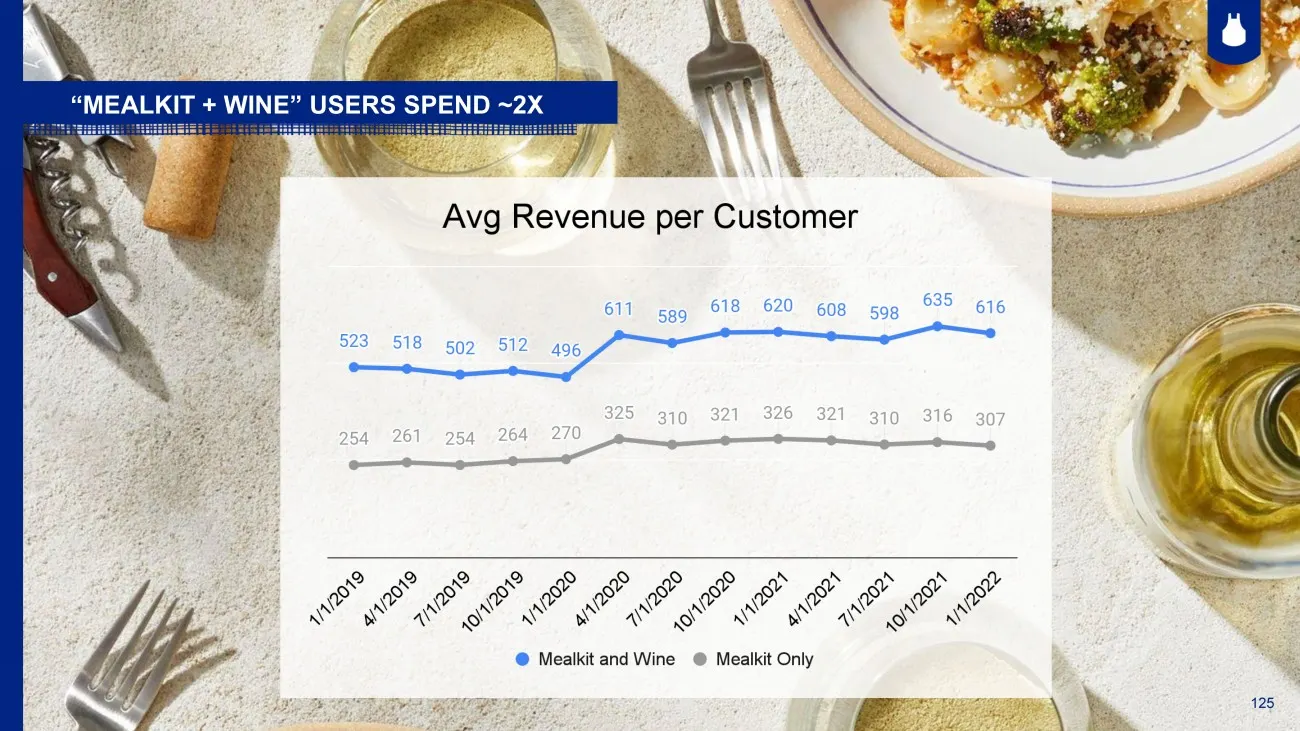
Slide 125: Mealkit + Wine users spend ~2x
125 “MEALKIT + WINE” USERS SPEND ~2X 125
Slide 126: Controlling input costs
126 TM CONTROLLING INPUT COSTS
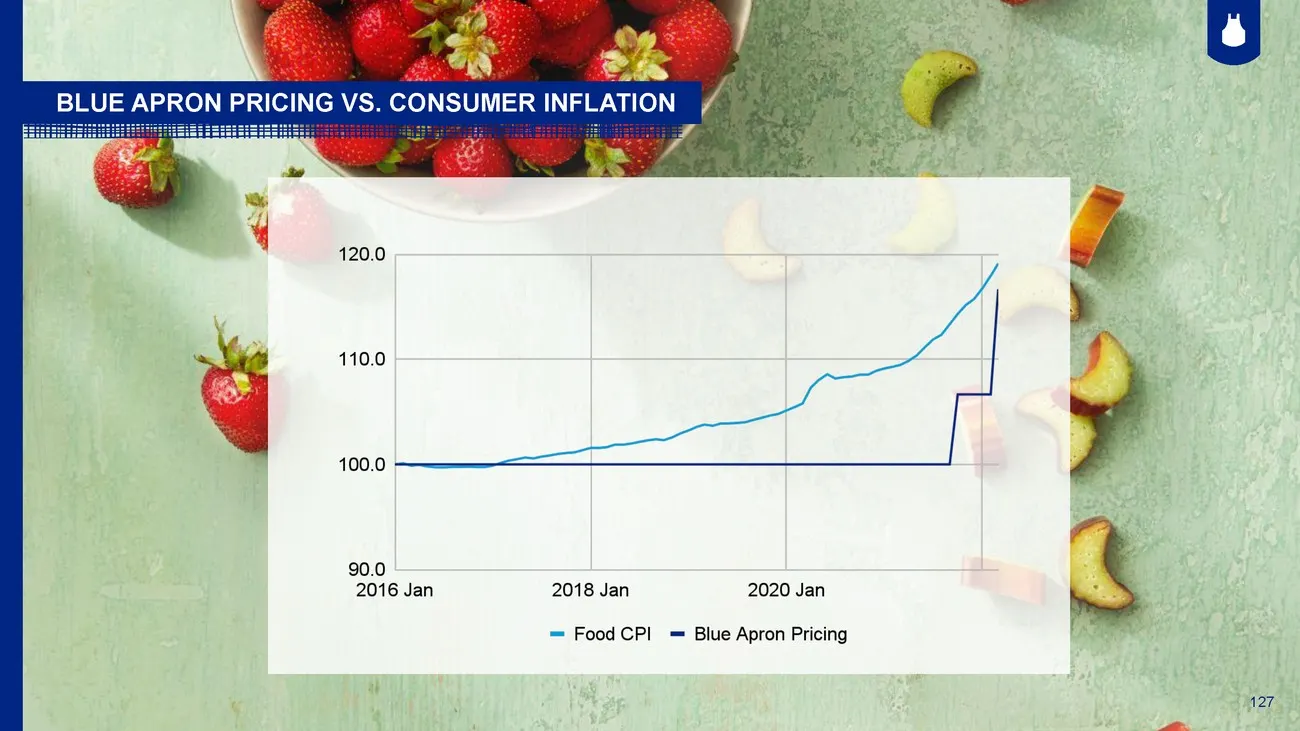
Slide 127: Blue Apron pricing vs. consumer inflation
127 BLUE APRON PRICING VS. CONSUMER INFLATION
Slide 128: Enhanced capital structure
128 TM ENHANCED CAPITAL STRUCTURE
Slide 129: Guidance assumptions
129 The anticipated consistent benefit to our business from the acceleration and execution of our strategic growth initiatives. The impact of the planned use of proceeds from the equity capital raises we completed last November, February and April, and the expected proceeds from the $20M equity comm
Slide 130: 2024 targets
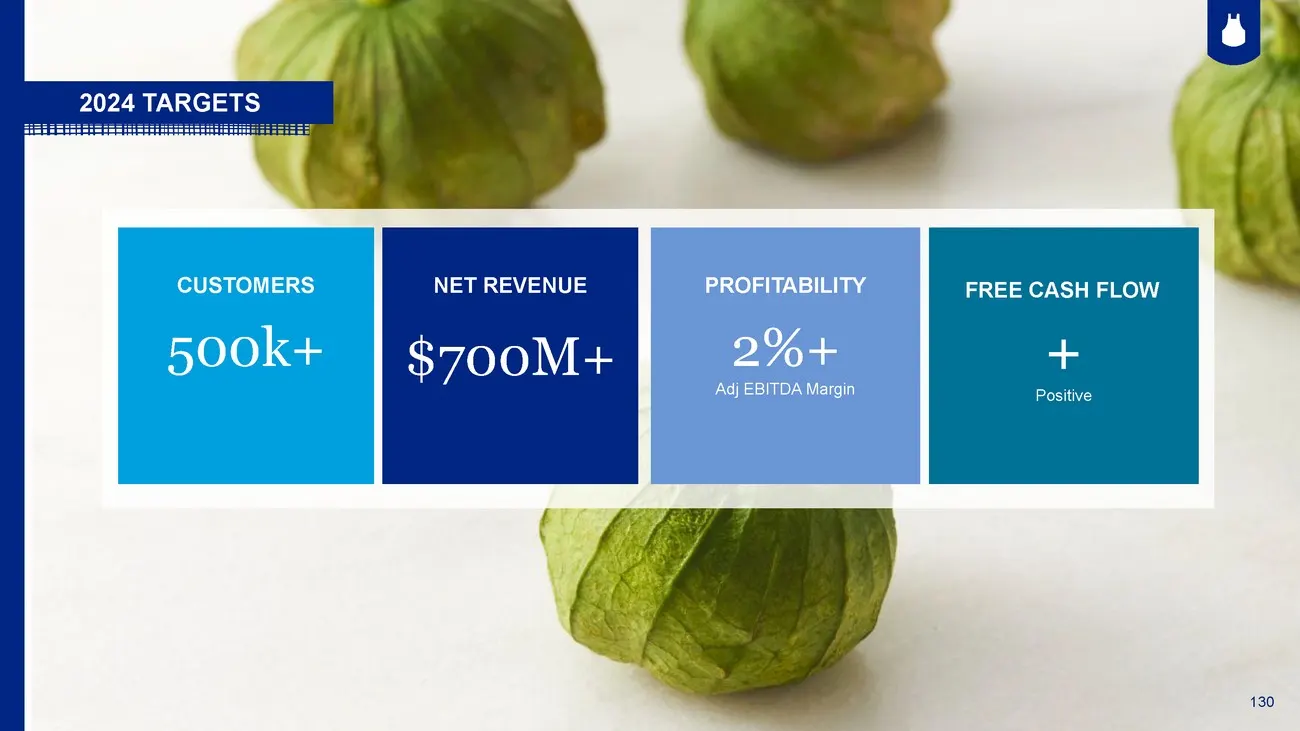
130 2024 TARGETS Reopening $700M+ 2%+ Adj EBITDA Margin + Positive 500k+ CUSTOMERS NET REVENUE PROFITABILITY FREE CASH FLOW
Slide 131: Long-term targets
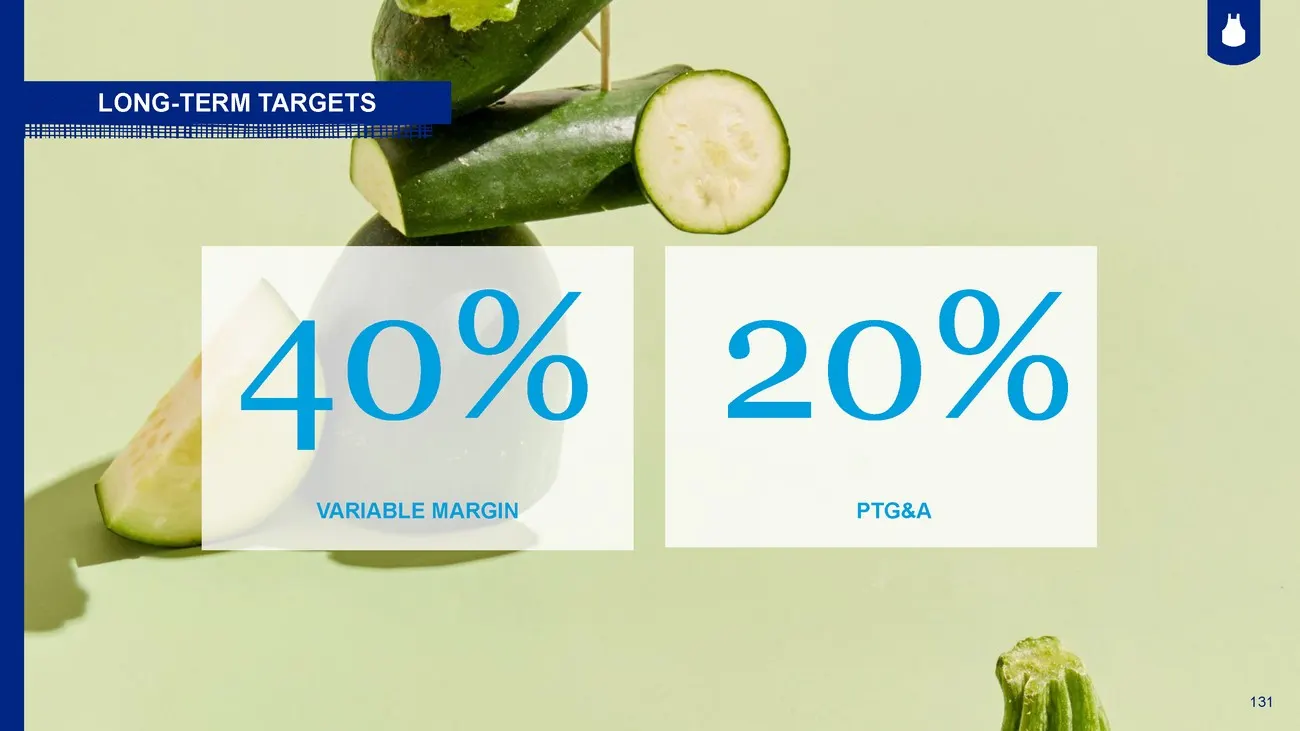
131 40% 20% VARIABLE MARGIN PTG&A LONG-TERM TARGETS
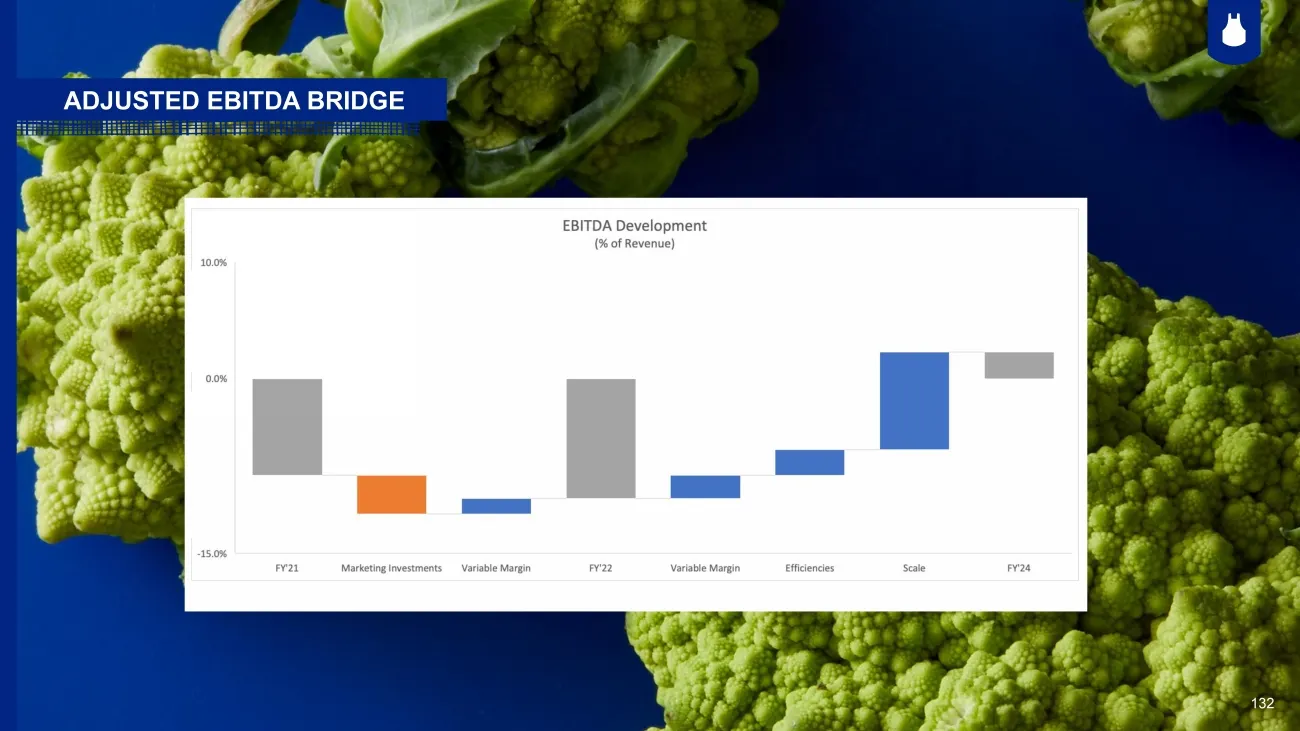
Slide 132: Adjusted EBITDA bridge
f f worl ADJUSTED EBITDA BRIDGE EBITDA Development (%6 of Revenue) 132

Slide 133: Q&A
Q∓A 133
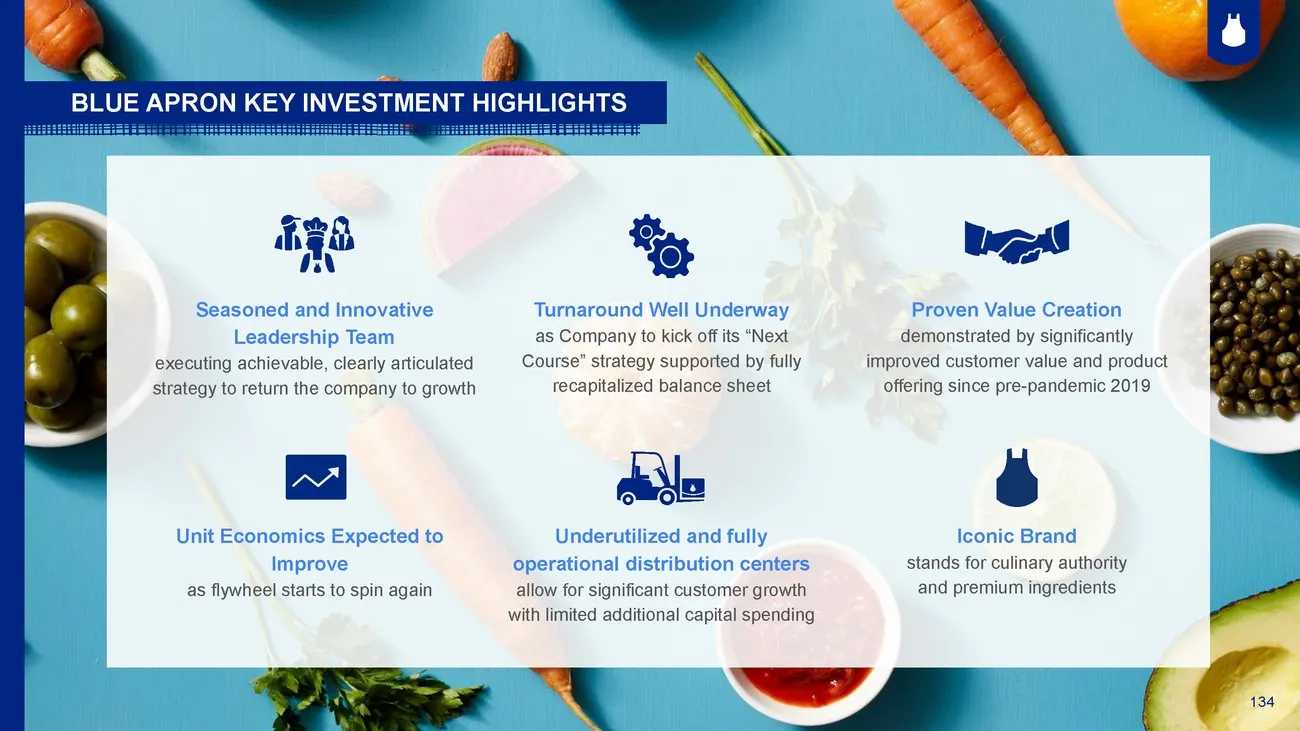
Slide 134: Blue Apron Key Investment Highlights
134 BLUE APRON KEY INVESTMENT HIGHLIGHTS Proven Value Creation demonstrated by significantly improved customer value and product offering since pre-pandemic 2019 Seasoned and Innovative Leadership Team executing achievable, clearly articulated strategy to return the company to growth Turnaround Well

Slide 135: 135
135
Source: SEC EDGAR · 8-K filed May 10, 2022
More decks from Blue Apron Holdings, Inc.
 Q2 2023 Earnings Presentation24 slides · Aug 9, 2023
 Q1 2023 Earnings Presentation21 slides · May 4, 2023
 Q4 2022 Earnings Presentation24 slides · Mar 16, 2023
 Q3 2022 Earnings Presentation17 slides · Nov 7, 2022
 Q2 2022 Earnings Presentation25 slides · Aug 8, 2022
 Q1 2022 Earnings Presentation23 slides · May 9, 2022