SeSa S.p.A. · MIL:SES
SeSa — Euronext Star Conference 2022
31 slides from SeSa's conference presentation, Mar 22, 2022
Slide 1: Group Presentation - Euronext Star Conference 2022
GROUP PRESENTATION Euronext Star Conference 2022 Milan March 22, 2022
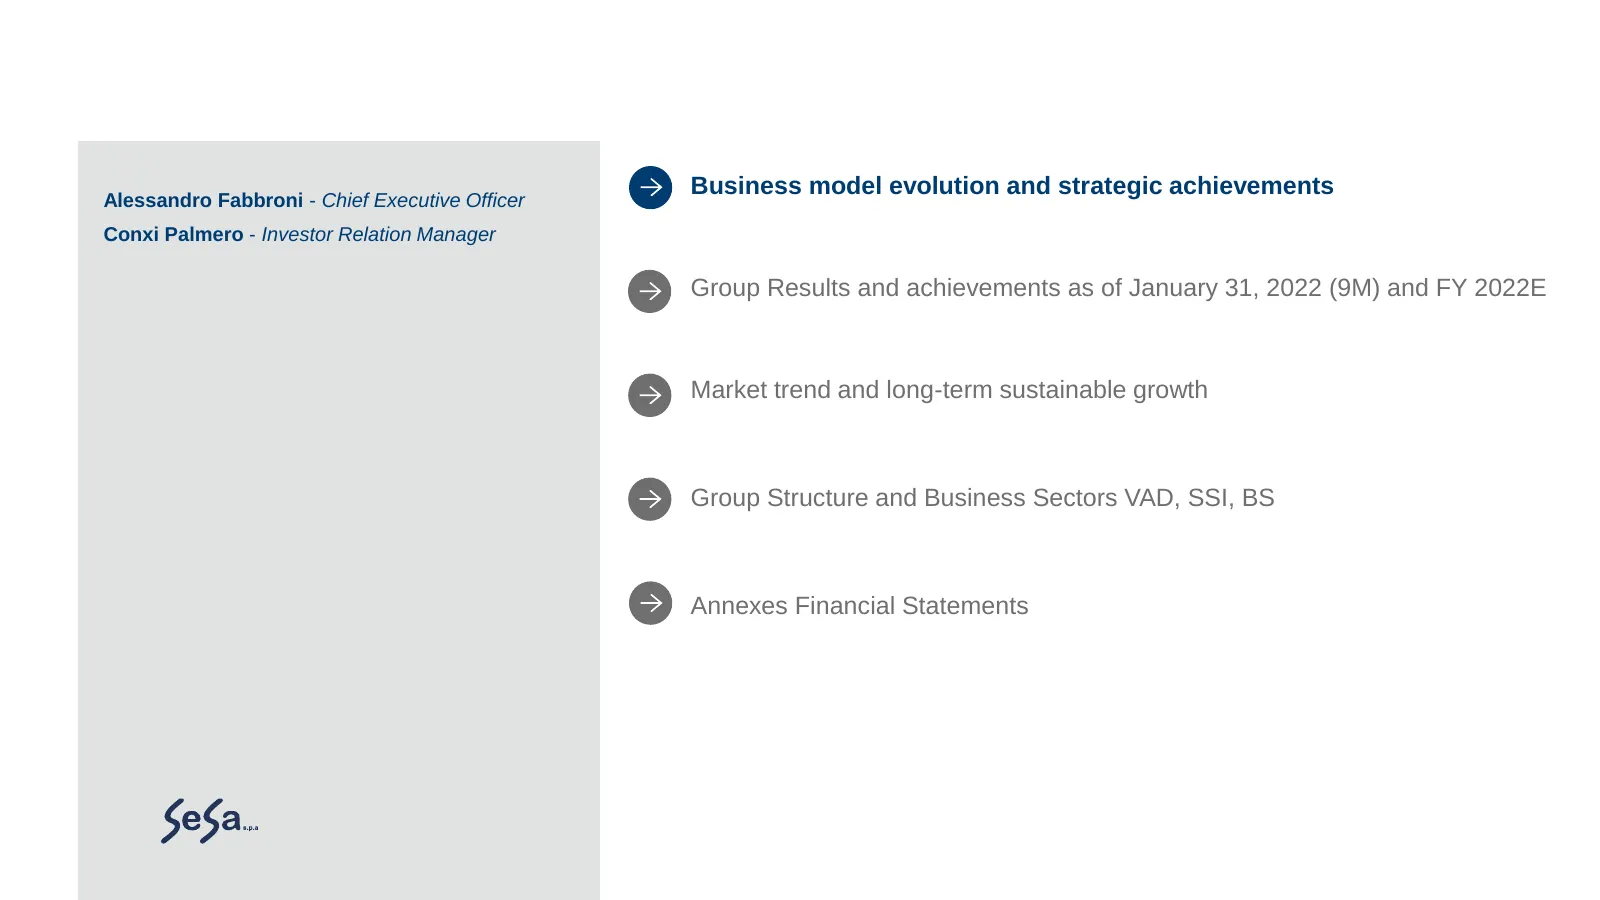
Slide 2: Business model evolution and strategic achievements
Business model evolution and strategic achievements Alessandro Fabbroni - Chief Executive Officer Conxi Palmero - Investor Relation Manager Group Results and achievements as of January 31, 2022 (9M) and FY 2022E Market trend and long-term sustainable growth Group Structure and Business Sectors VAD,
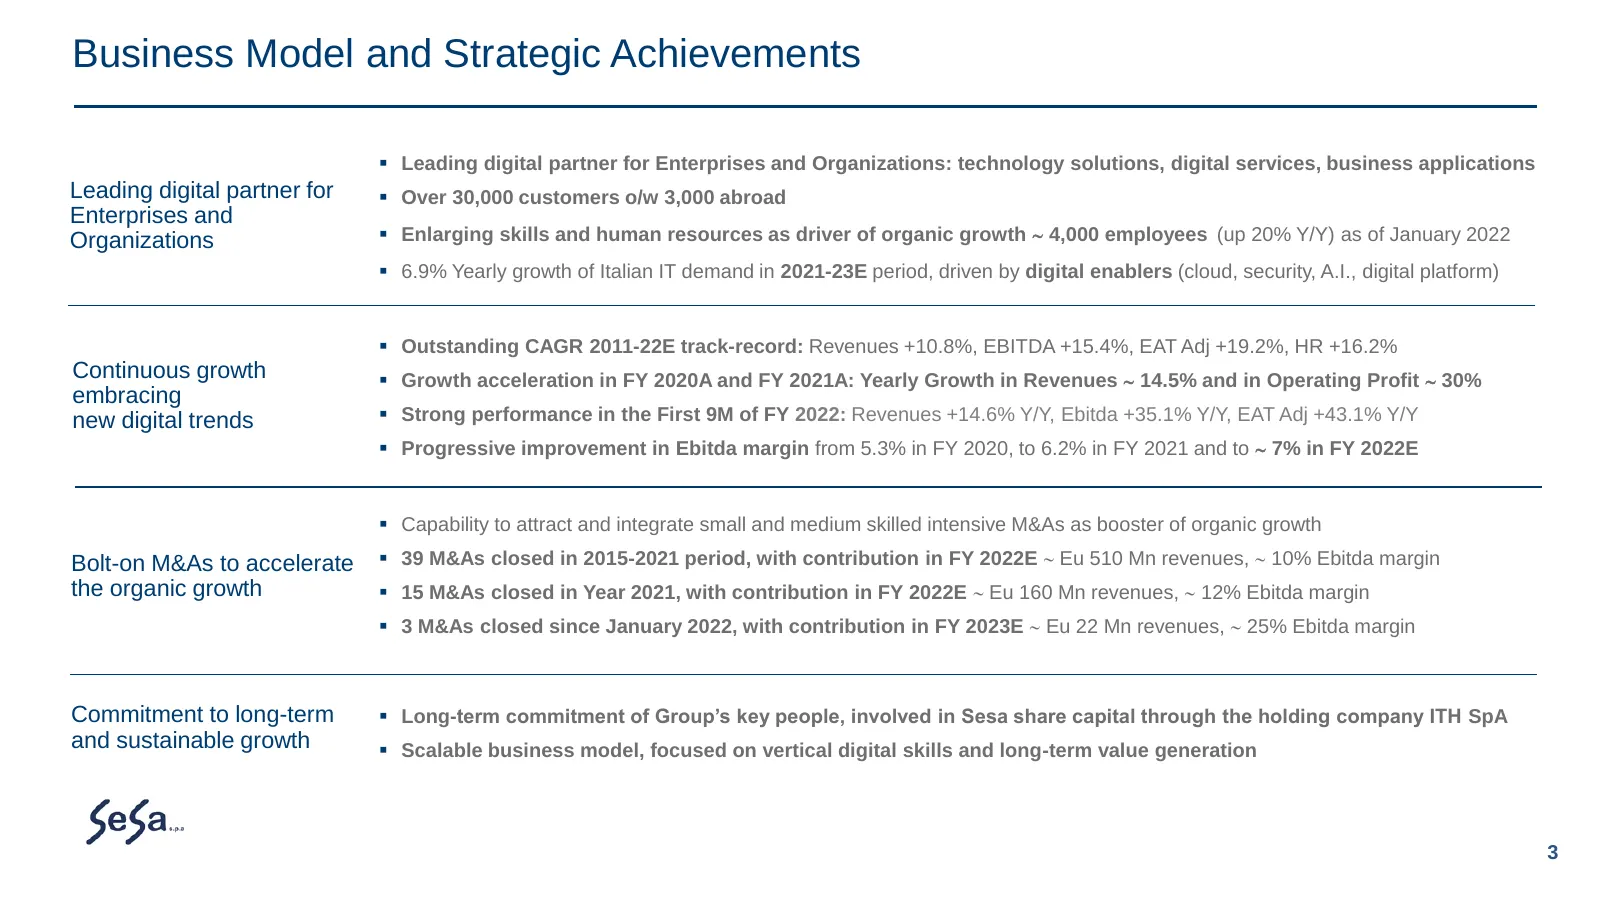
Slide 3: Business Model and Strategic Achievements
Business Model and Strategic Achievements ▪ Leading digital partner for Enterprises and Organizations: technology solutions, digital services, business applications Leading digital partner for ▪ Over 30,000 customers o/w 3,000 abroad Enterprises and Organizations ▪ Enlarging skills and human resourc
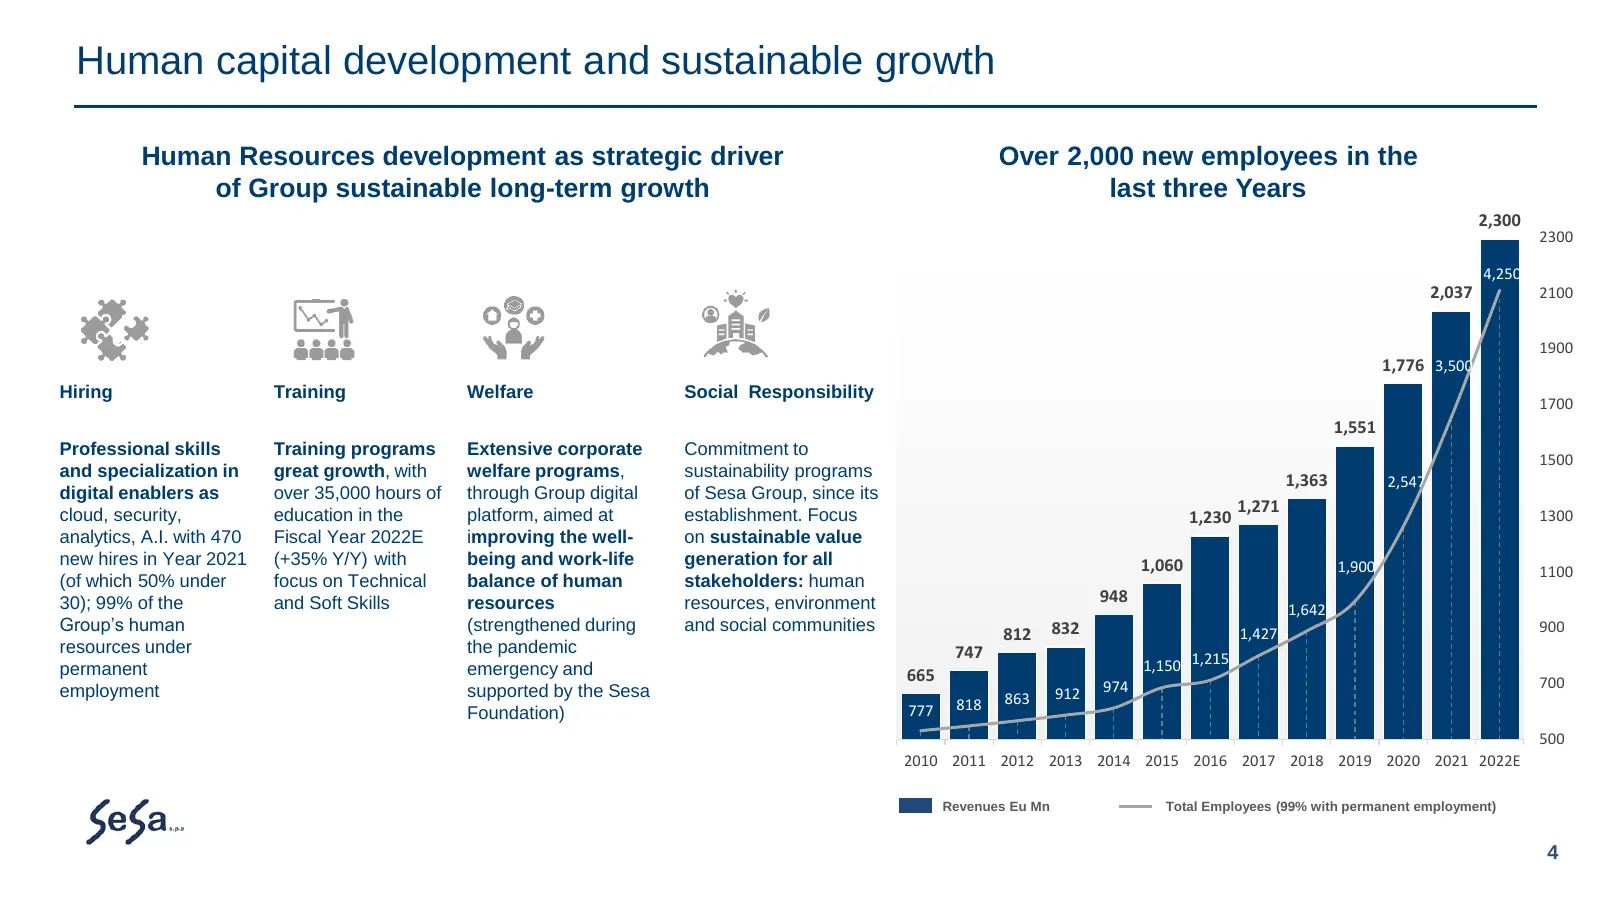
Slide 4: Human capital development and sustainable growth
Human capital development and sustainable growth Human Resources development as strategic driver Over 2,000 new employees in the of Group sustainable long-term growth last three Years 5200 2,300 2300 4700 4,250 2,037 2100 4200 1900 1,776 3,500 Hiring Training Welfare Social Responsibility 3700 1700
Slide 5: Vertical Digital Skills to enable business evolution
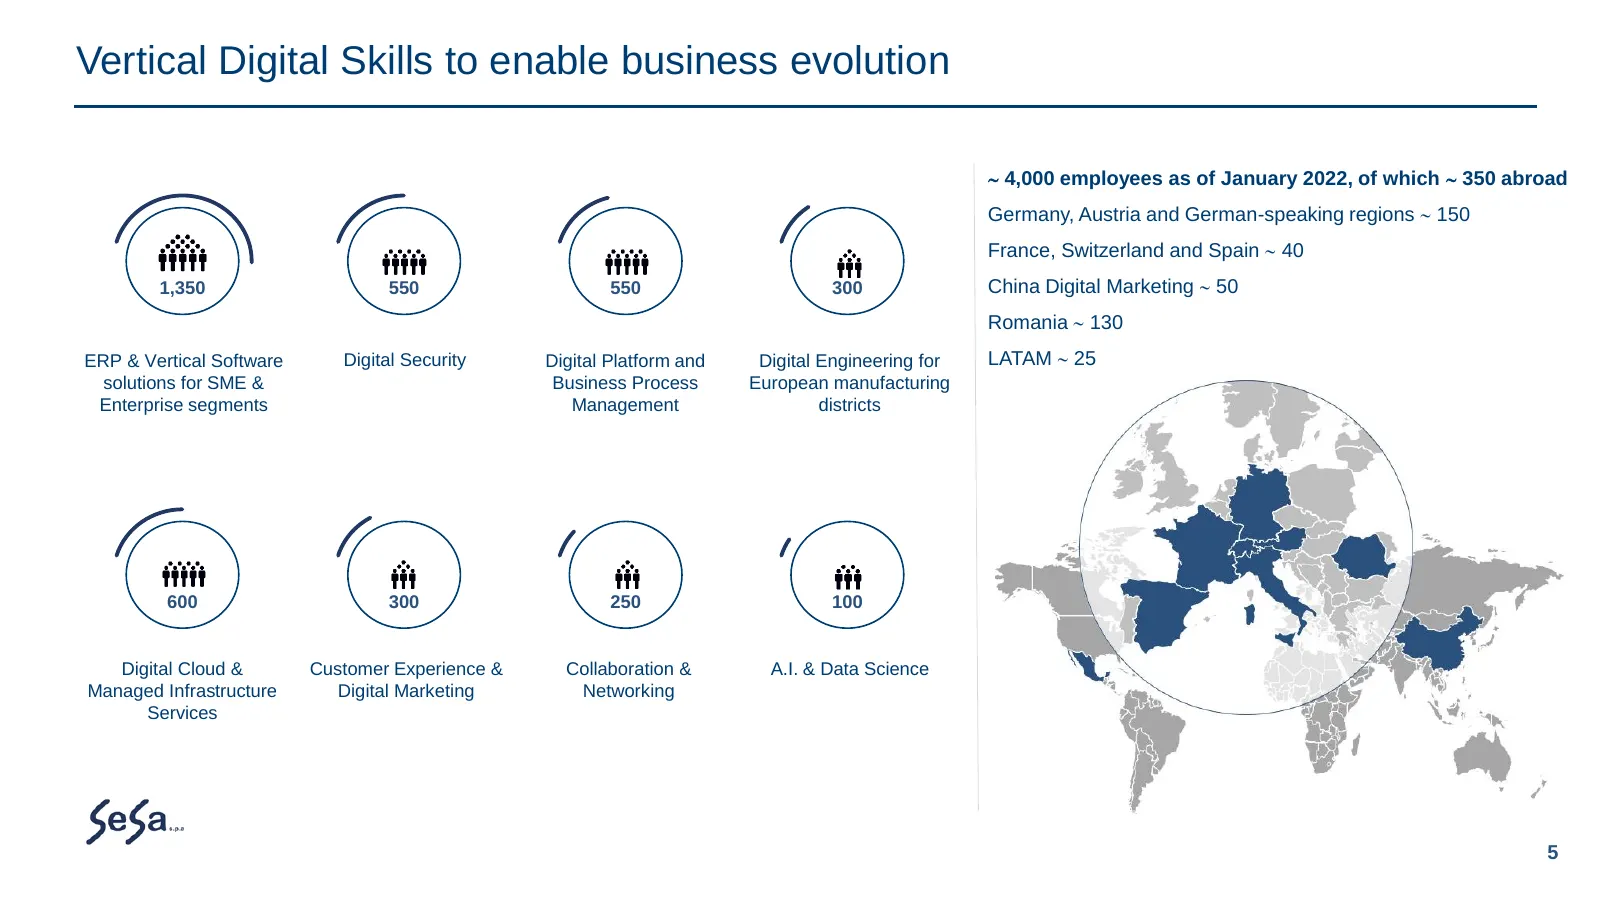
Vertical Digital Skills to enable business evolution 4,000 employees as of January 2022, of which 350 abroad Germany, Austria and German-speaking regions 150 France, Switzerland and Spain 40 1,350 550 550 300 China Digital Marketing 50 Romania 130 ERP & Vertical Software Digital Security
Slide 6: Bolt-on industrial M&As to accelerate organic growth
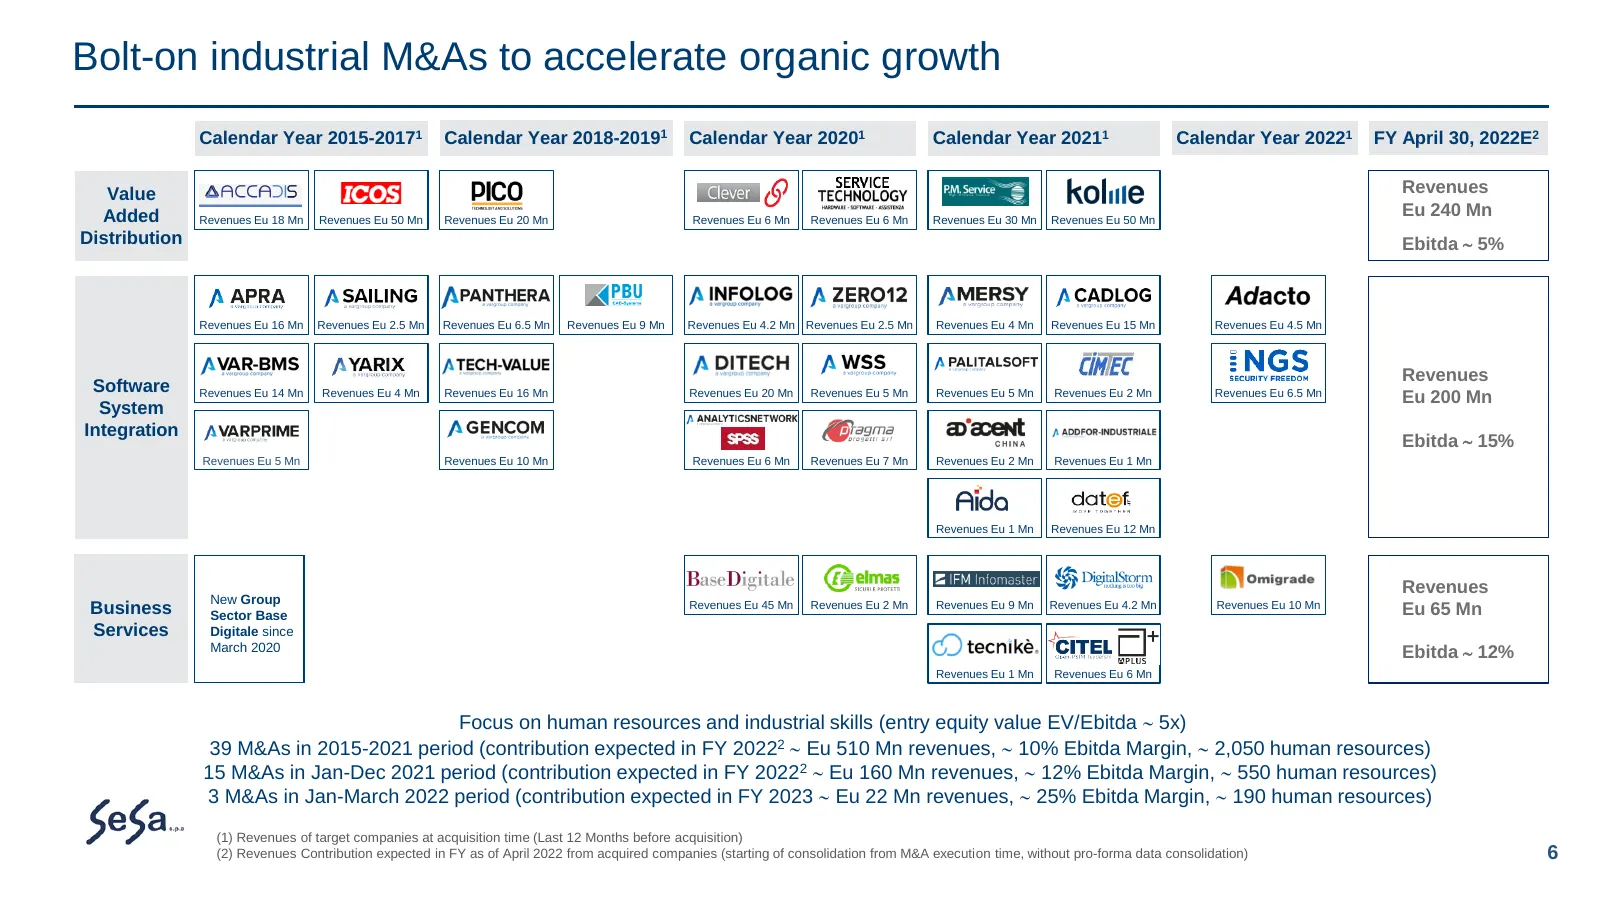
Bolt-on industrial M&As to accelerate organic growth Calendar Year 2015-20171 Calendar Year 2018-20191 Calendar Year 20201 Calendar Year 20211 Calendar Year 20221 FY April 30, 2022E2 Value Revenues Added Revenues Eu 18 Mn Revenues Eu 50 Mn Revenues Eu 20 Mn Revenues Eu 6 Mn Revenues Eu 6 Mn Revenues
Slide 7: Long-term commitment of key people and value generation
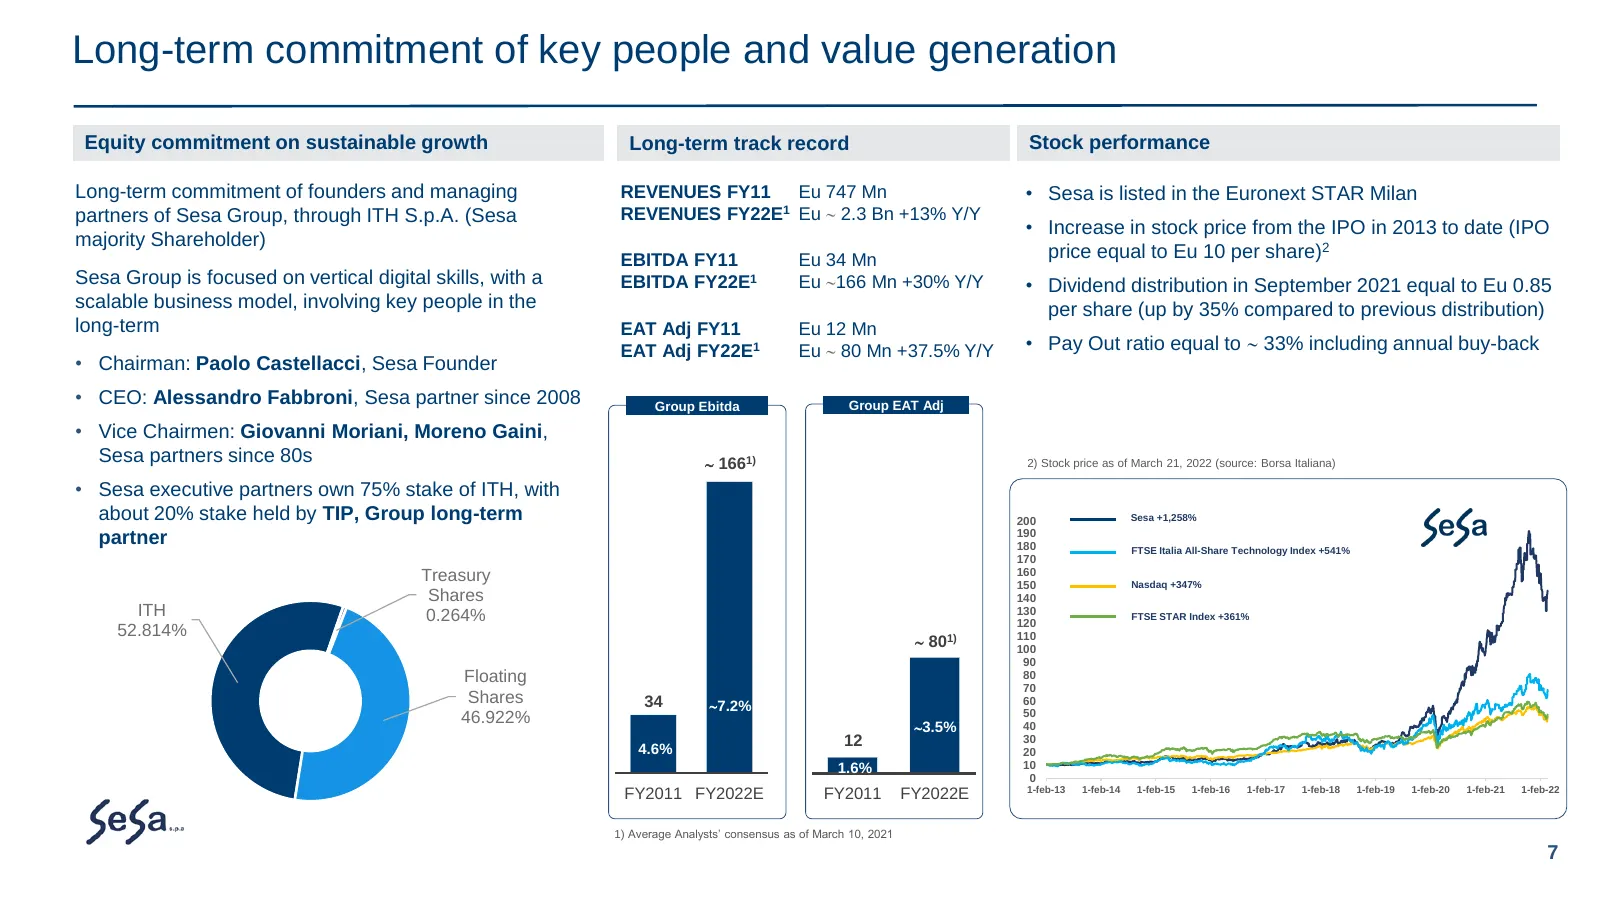
Long-term commitment of key people and value generation Equity commitment on sustainable growth Long-term track record Stock performance Long-term commitment of founders and managing REVENUES FY11 Eu 747 Mn • Sesa is listed in the Euronext STAR Milan partners of Sesa Group, through ITH S.p.A. (Sesa
Slide 8: Business model evolution and strategic achievements
Business model evolution and strategic achievements Alessandro Fabbroni - Chief Executive Officer Conxi Palmero - Investor Relation Manager Group Results and achievements as of January 31, 2022 (9M) and FY 2022E Market trend and long-term sustainable growth Group Structure and Business Sectors VAD,
Slide 9: 9M 2022 Group Financial Results
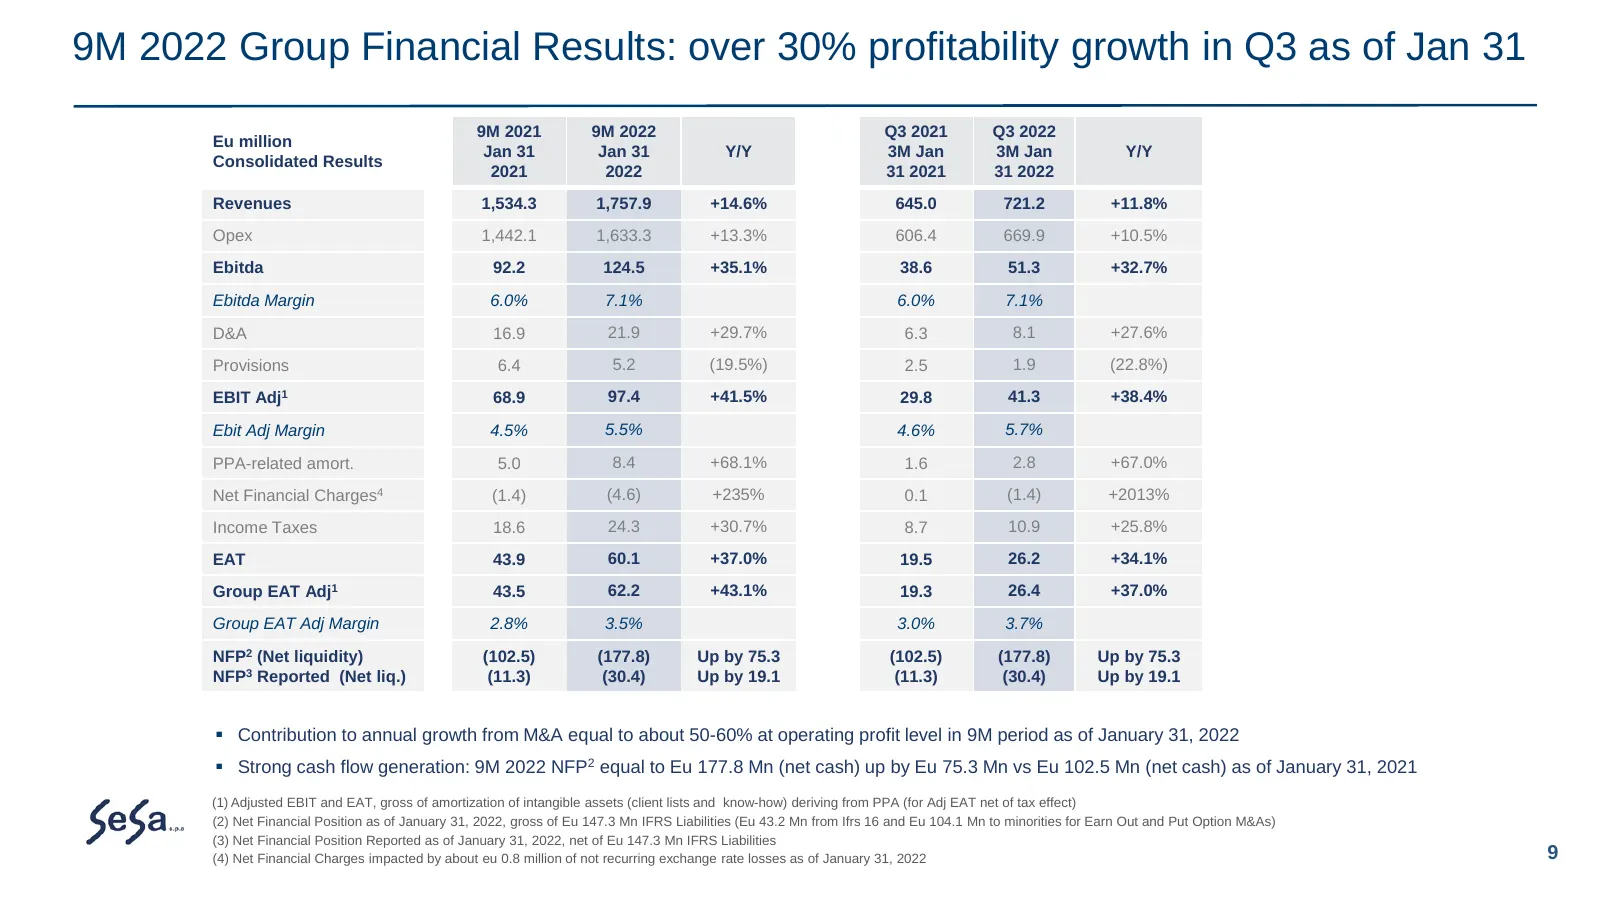
9M 2022 Group Financial Results: over 30% profitability growth in Q3 as of Jan 31 9M 2021 9M 2022 Q3 2021 Q3 2022 Eu million Jan 31 Jan 31 Y/Y 3M Jan 3M Jan Y/Y Consolidated Results 2021 2022 31 2021 31 2022 Revenues 1,534.3 1,757.9 +14.6% 645.0 721.2 +11.8% Opex 1,442.1 1,633.3 +13.3% 606.4 669.9 +
Slide 10: Positive Outlook for the FY 2022 and FY 2023
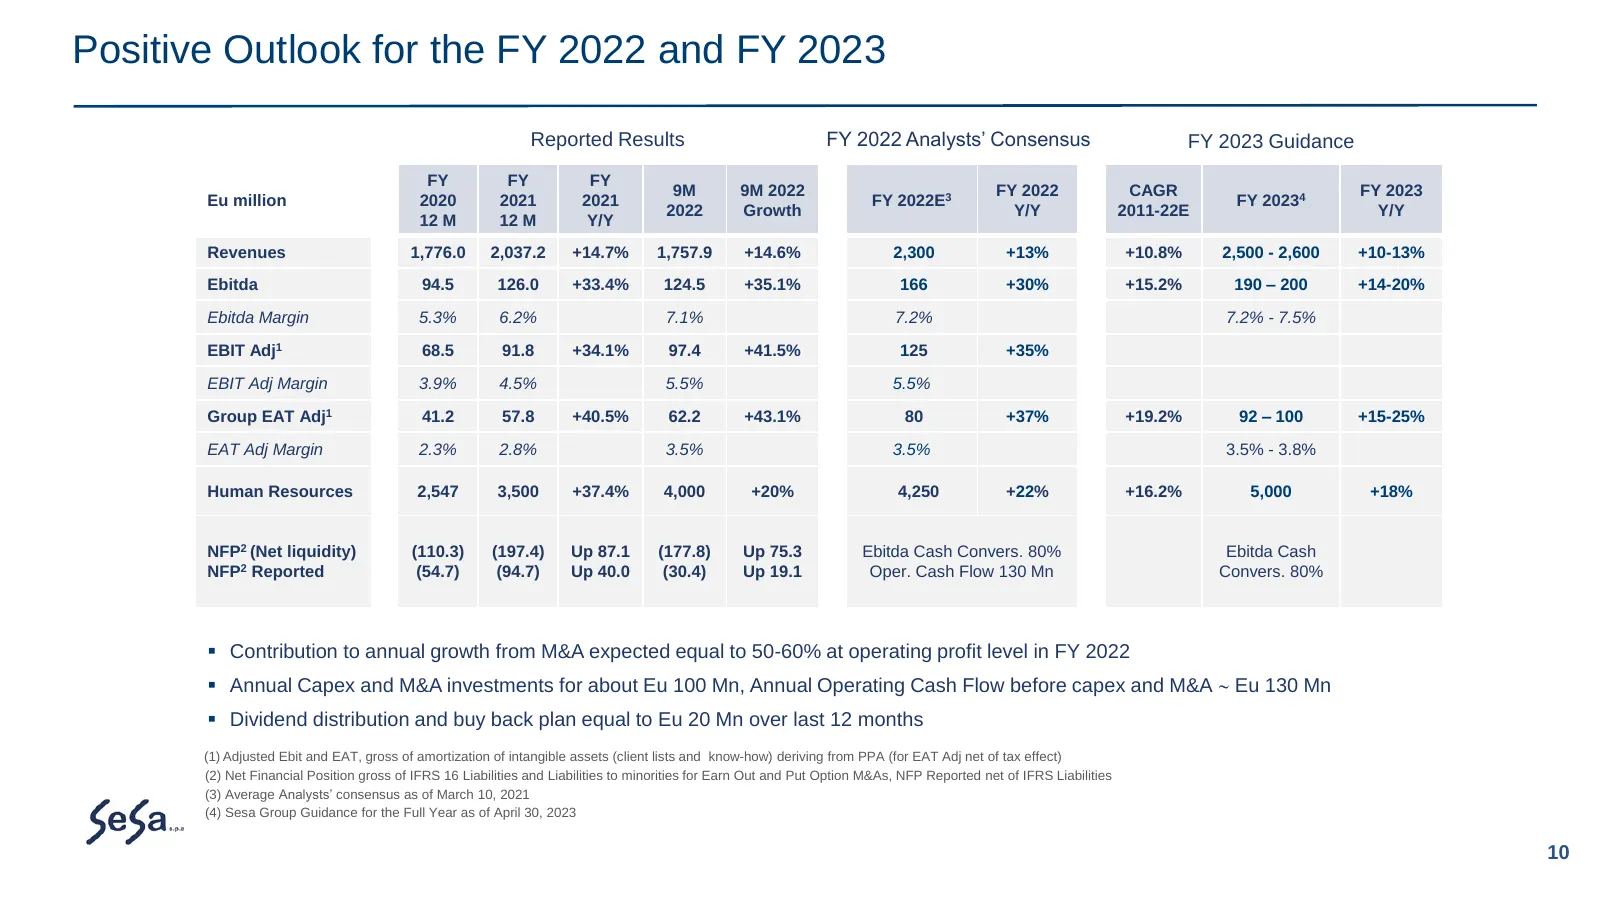
Positive Outlook for the FY 2022 and FY 2023 Reported Results FY 2022 Analysts’ Consensus FY 2023 Guidance FY FY FY 9M 9M 2022 FY 2022 CAGR FY 2023 Eu million 2020 2021 2021 FY 2022E3 FY 20234 2022 Growth Y/Y 2011-22E Y/Y 12 M 12 M Y/Y Revenues 1,776.0 2,037.2 +14.7% 1,757.9 +14.6% 2,300 +13% +10.8%
Slide 11: EBITDA and EAT margin improvement by segment (9M 2019-22)
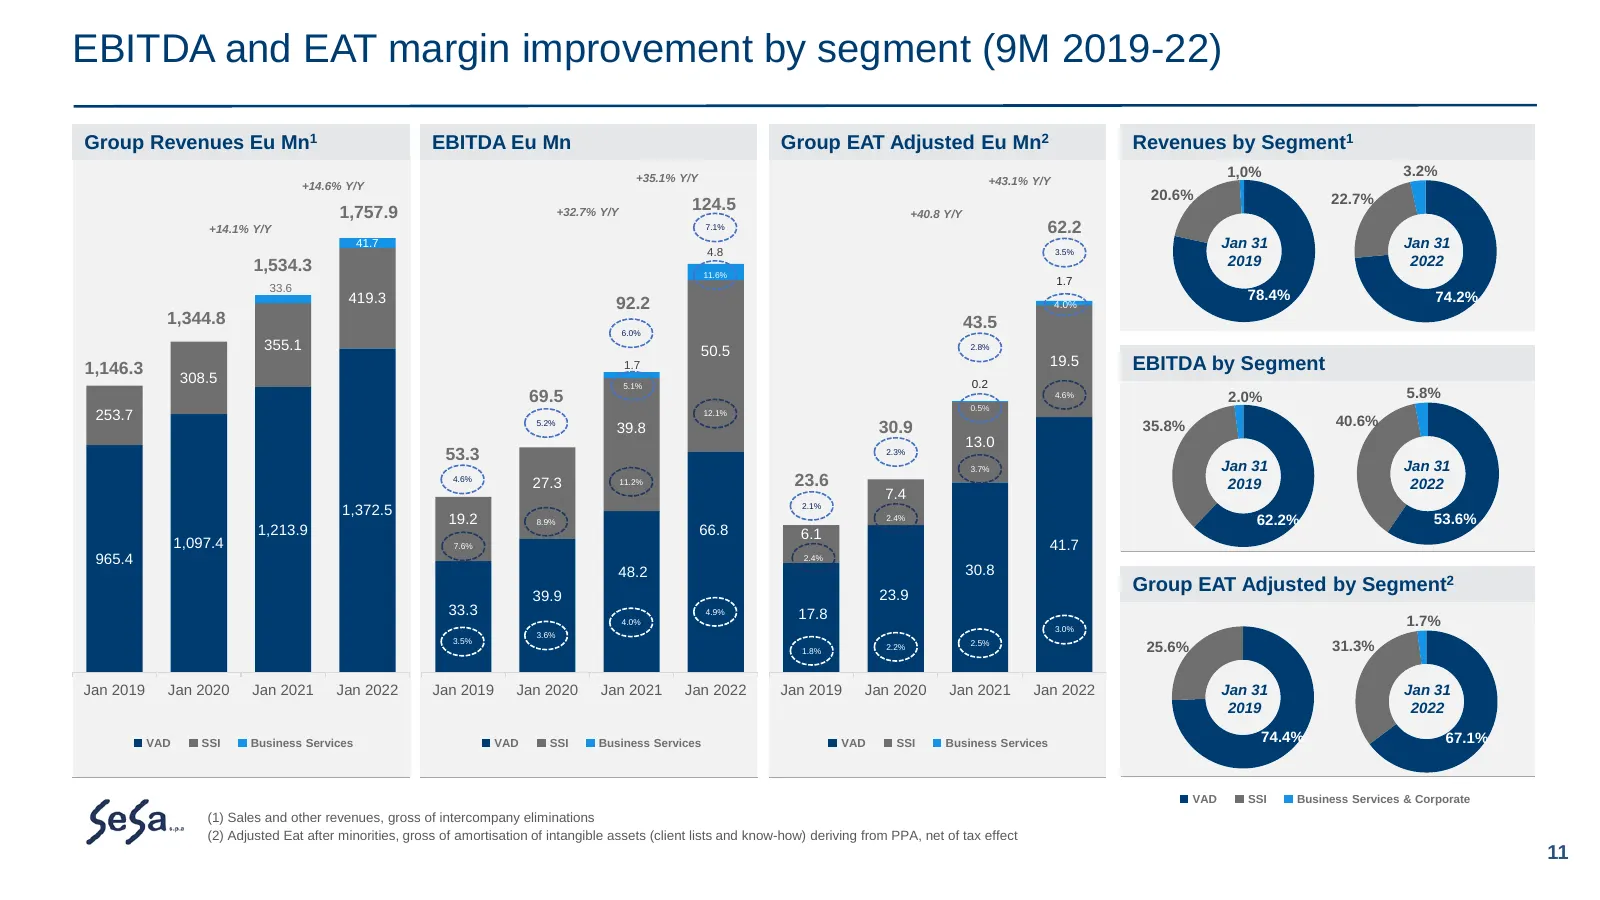
EBITDA and EAT margin improvement by segment (9M 2019-22) Group Revenues Eu Mn1 EBITDA Eu Mn Group EAT Adjusted Eu Mn2 Revenues by Segment1 +35.1% Y/Y 1,0% 3.2% +14.6% Y/Y +43.1% Y/Y 20.6% 22.7% 1,757.9 +32.7% Y/Y 124.5 +40.8 Y/Y +14.1% Y/Y 7.1% 62.2 41.7 Jan 31 Jan 31 4.8 3.5% 1,534.3 2019 2022 11.
Slide 12: EBITDA and EAT margin improvement by segment (FY 2018-22E)
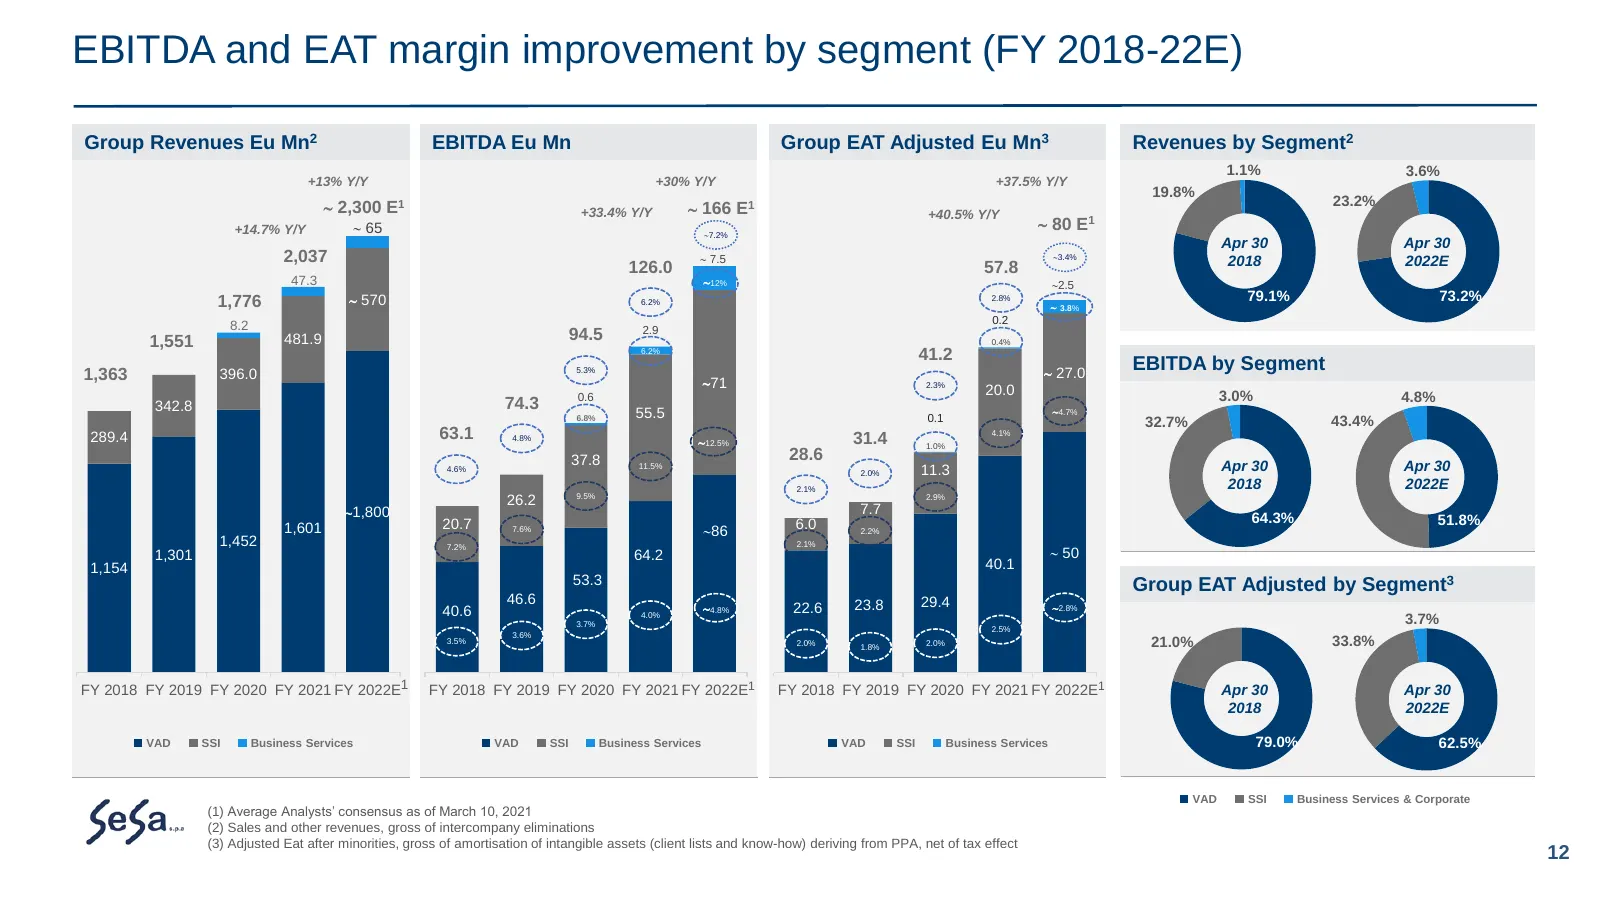
EBITDA and EAT margin improvement by segment (FY 2018-22E) Group Revenues Eu Mn2 EBITDA Eu Mn Group EAT Adjusted Eu Mn3 Revenues by Segment2 1.1% 3.6% +13% Y/Y +30% Y/Y +37.5% Y/Y 19.8% 2,300 E1 23.2% +33.4% Y/Y 166 E1 +40.5% Y/Y +14.7% Y/Y 65 7.2% 80 E1 Apr 30 Apr 30 2,037 7.5 3.4% 2018
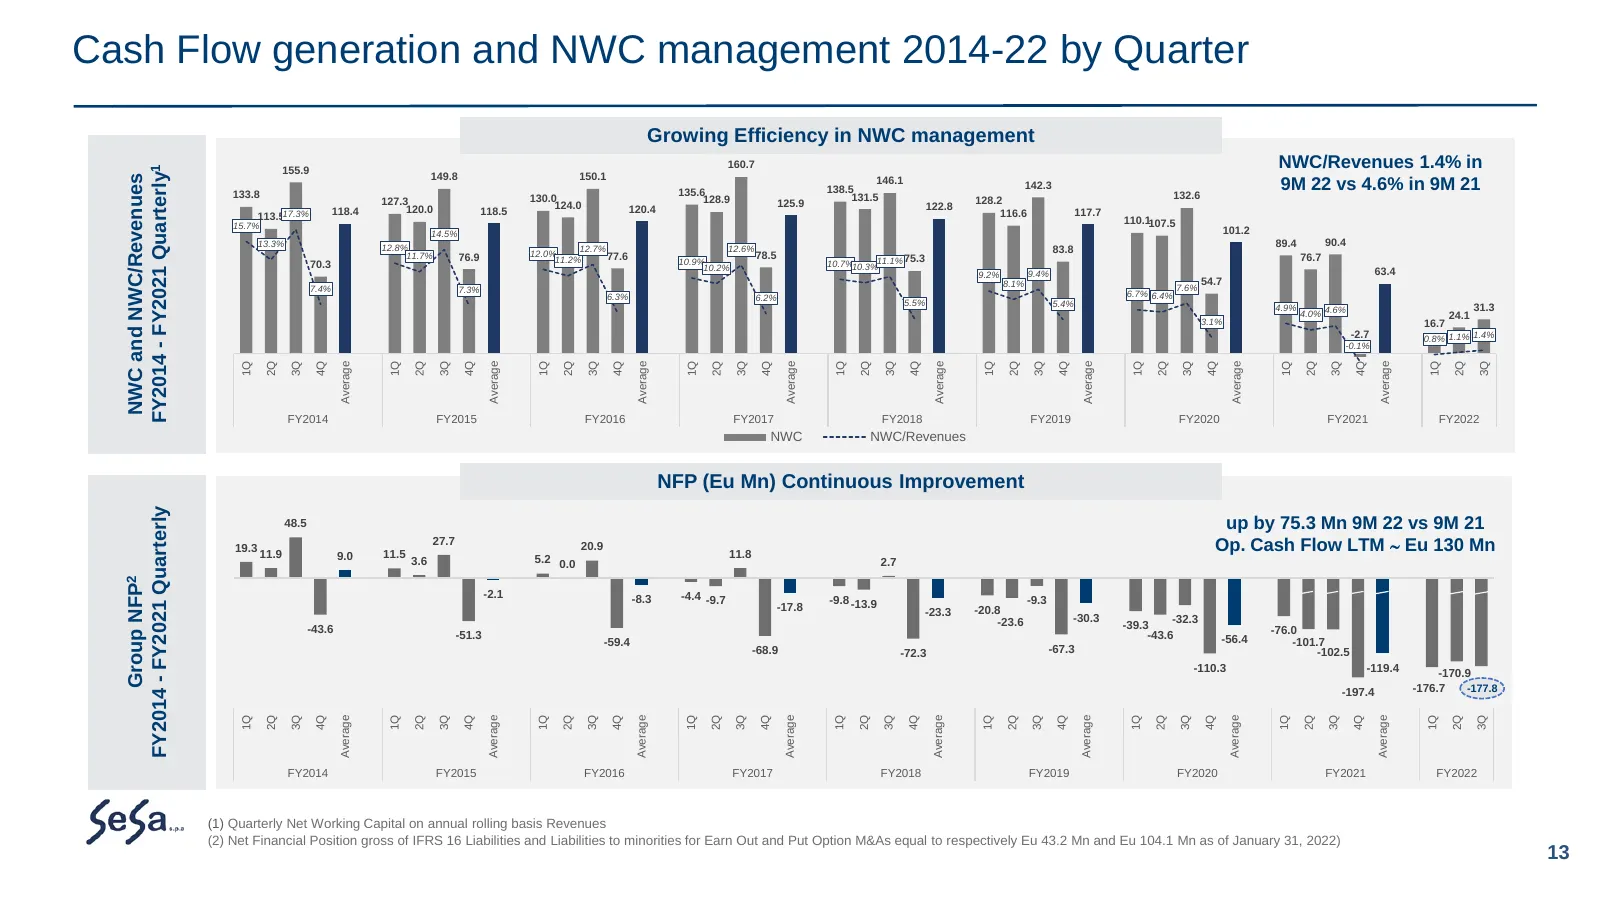
Slide 13: Cash Flow generation and NWC management
Cash Flow generation and NWC management 2014-22 by Quarter Growing Efficiency in NWC management FY2014 - FY2021 Quarterly1 155.9 160.7 NWC/Revenues 1.4% in 149.8 150.1 NWC and NWC/Revenues 146.1 133.8 135.6 138.5 142.3 132.6 9M 22 vs 4.6% in 9M 21 127.3 130.0 128.9 131.5 128.2 124.0 125.9 122.8 118.
Slide 14: Business model evolution and strategic achievements
Business model evolution and strategic achievements Alessandro Fabbroni - Chief Executive Officer Conxi Palmero - Investor Relation Manager Group Results and achievements as of January 31, 2022 (9M) and FY 2022E Market trend and long-term sustainable growth Group Structure and Business Sectors VAD,
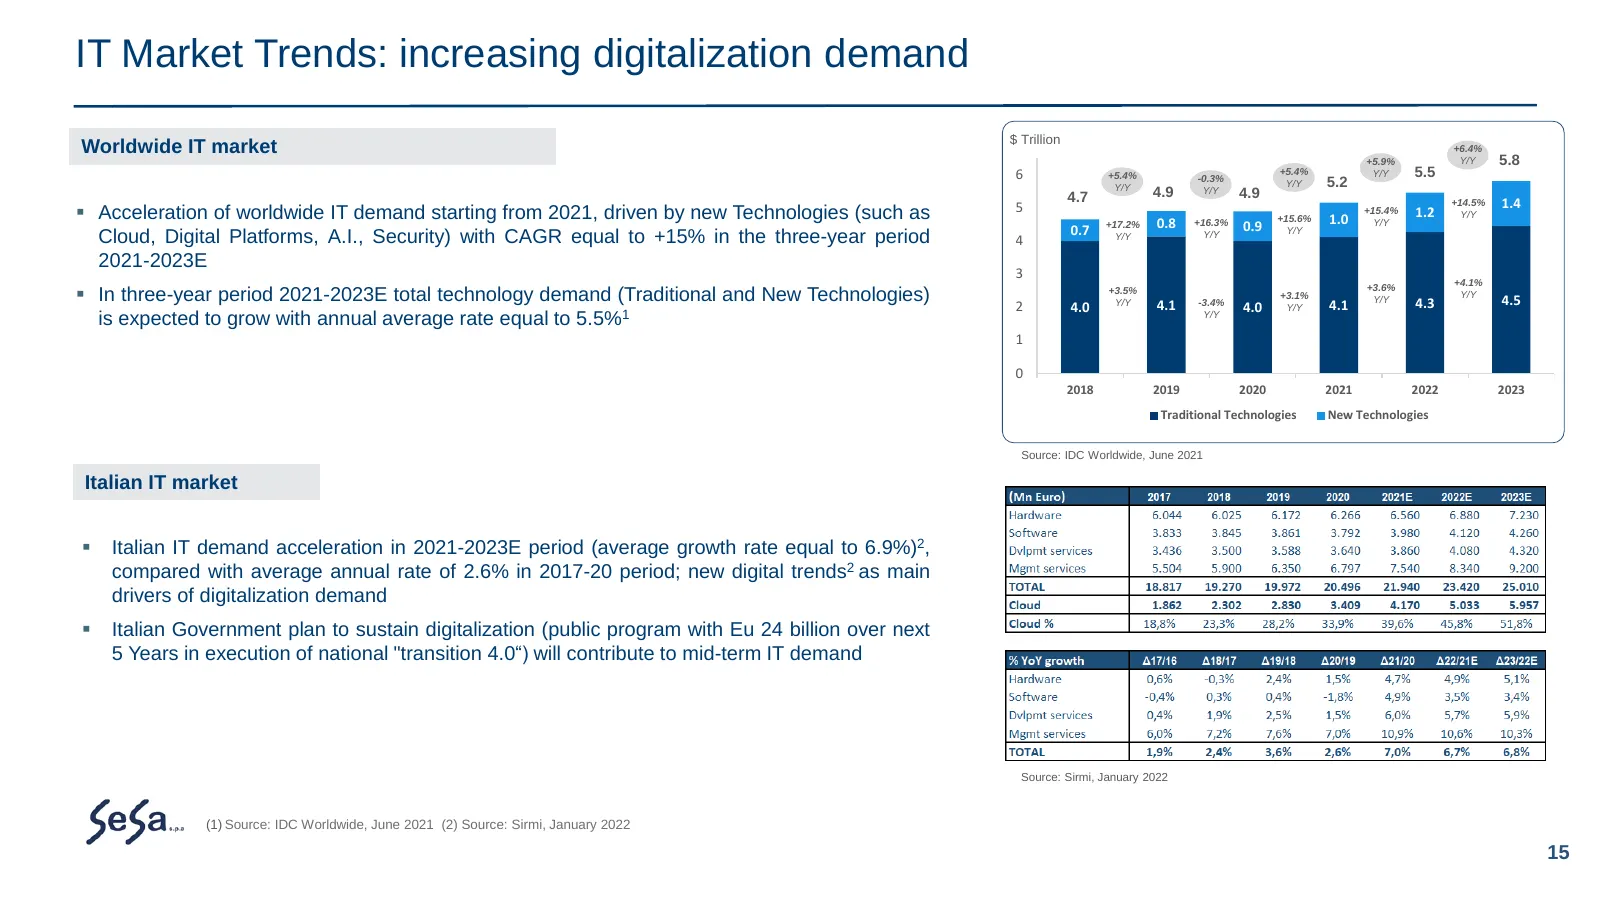
Slide 15: IT Market Trends: increasing digitalization demand
IT Market Trends: increasing digitalization demand $ Trillion Worldwide IT market +6.4% +5.9% Y/Y 5.8 6 +5.4% -0.3% +5.4% Y/Y 5.5 Y/Y Y/Y 5.2 4.7 4.9 Y/Y 4.9 5 +14.5% 1.4 ▪ Acceleration of worldwide IT demand starting from 2021, driven by new Technologies (such as 0.8 +16.3% +15.6% 1.0 +15.4% Y/Y 1.
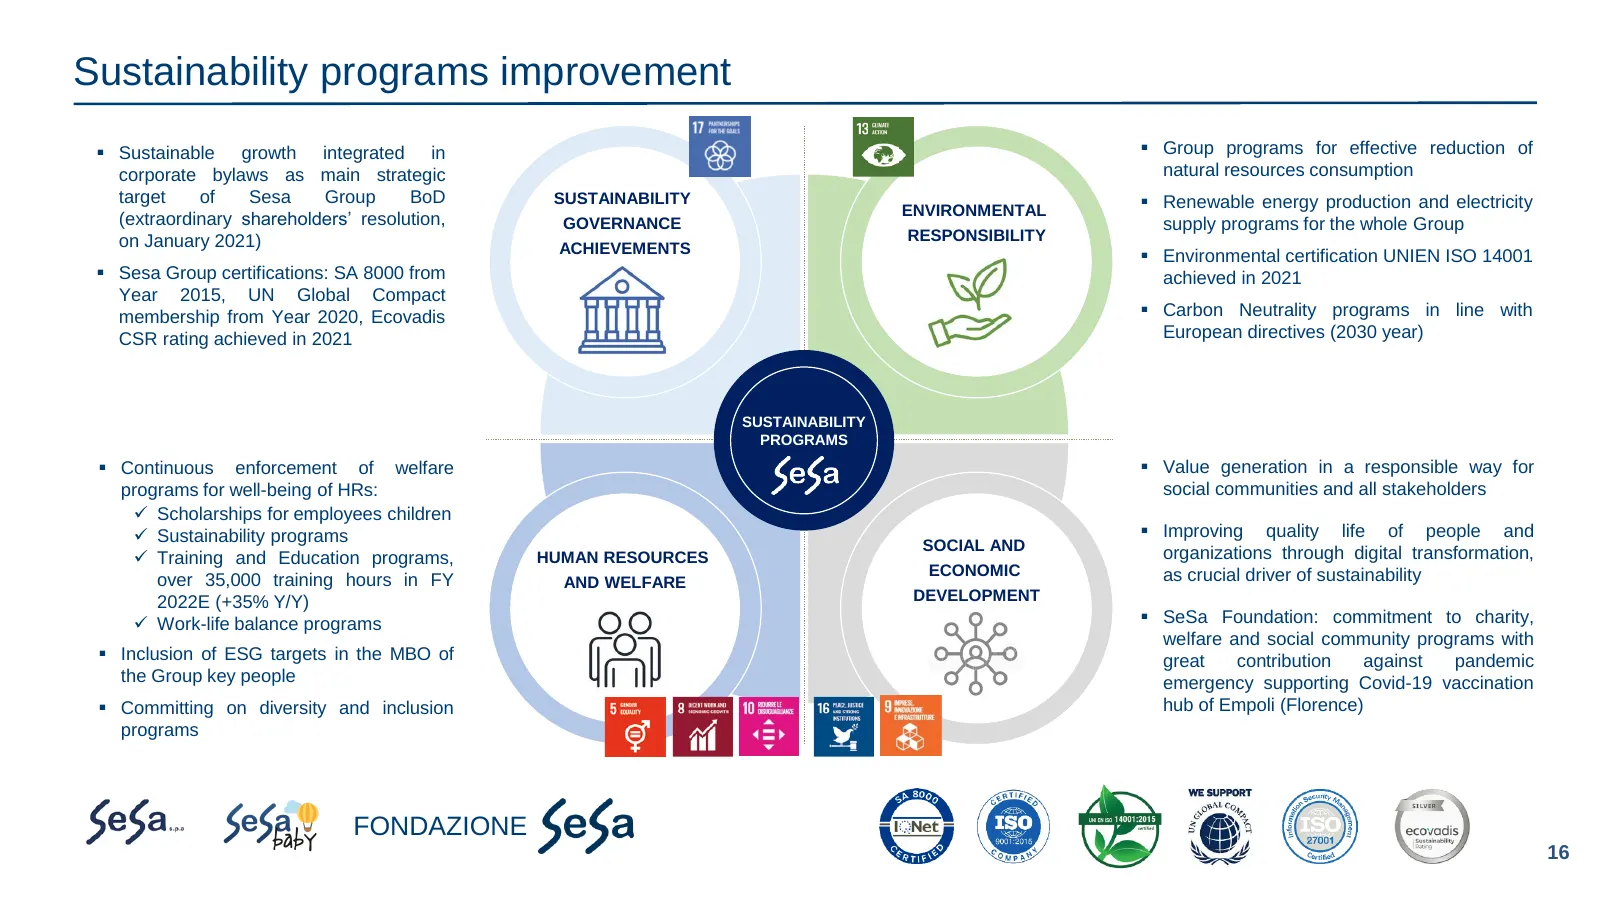
Slide 16: Sustainability programs improvement
Sustainability programs improvement ▪ Sustainable growth integrated in ▪ Group programs for effective reduction of corporate bylaws as main strategic natural resources consumption target of Sesa Group BoD SUSTAINABILITY ▪ Renewable energy production and electricity (extraordinary shareholders’ resol
Slide 17: Sustainable long-term growth FY 2011-23E
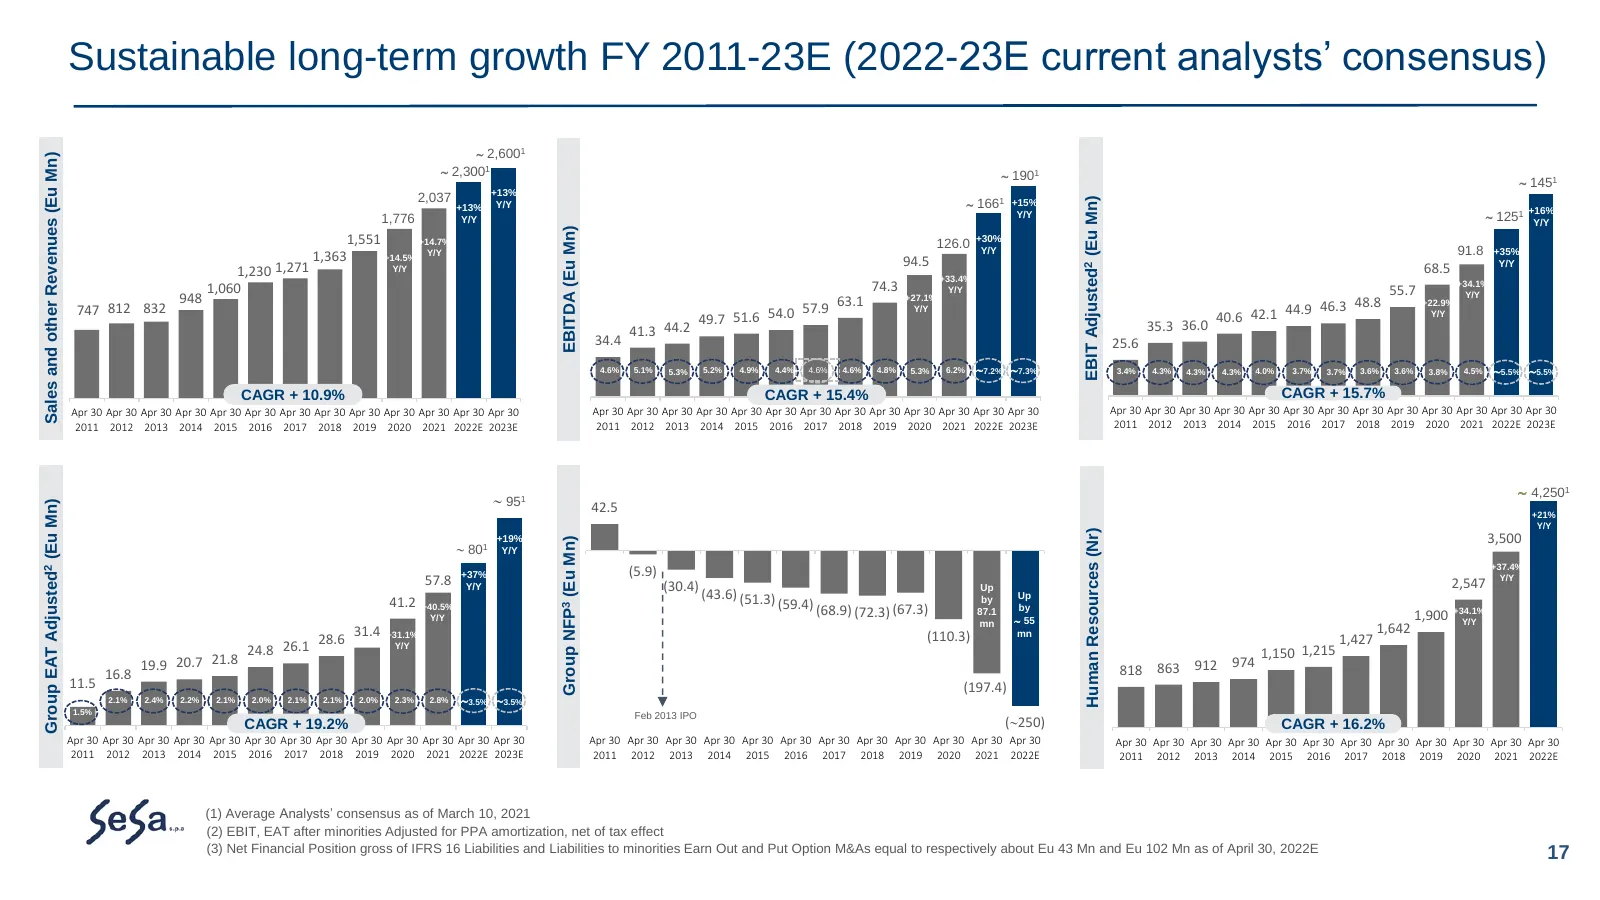
Sustainable long-term growth FY 2011-23E (2022-23E current analysts’ consensus) 2,6001 Sales and other Revenues (Eu Mn) 2,3001 1901 1451 +13% 2,037 1661 +15% EBIT Adjusted2 (Eu Mn) +13% Y/Y 1,776 Y/Y Y/Y 1251 +16% Y/Y EBITDA (Eu Mn) 1,551 +14.7% 126.0 +30% 1,363 +14.5% Y/Y Y/Y 91.8 +35%
Slide 18: Business model evolution and strategic achievements
Business model evolution and strategic achievements Alessandro Fabbroni - Chief Executive Officer Conxi Palmero - Investor Relation Manager Group Results and achievements as of January 31, 2022 (9M) and FY 2022E Market trend and long-term sustainable growth Group Structure and Business Sectors VAD,
Slide 19: Sesa Group, a scalable business model focused on vertical skills
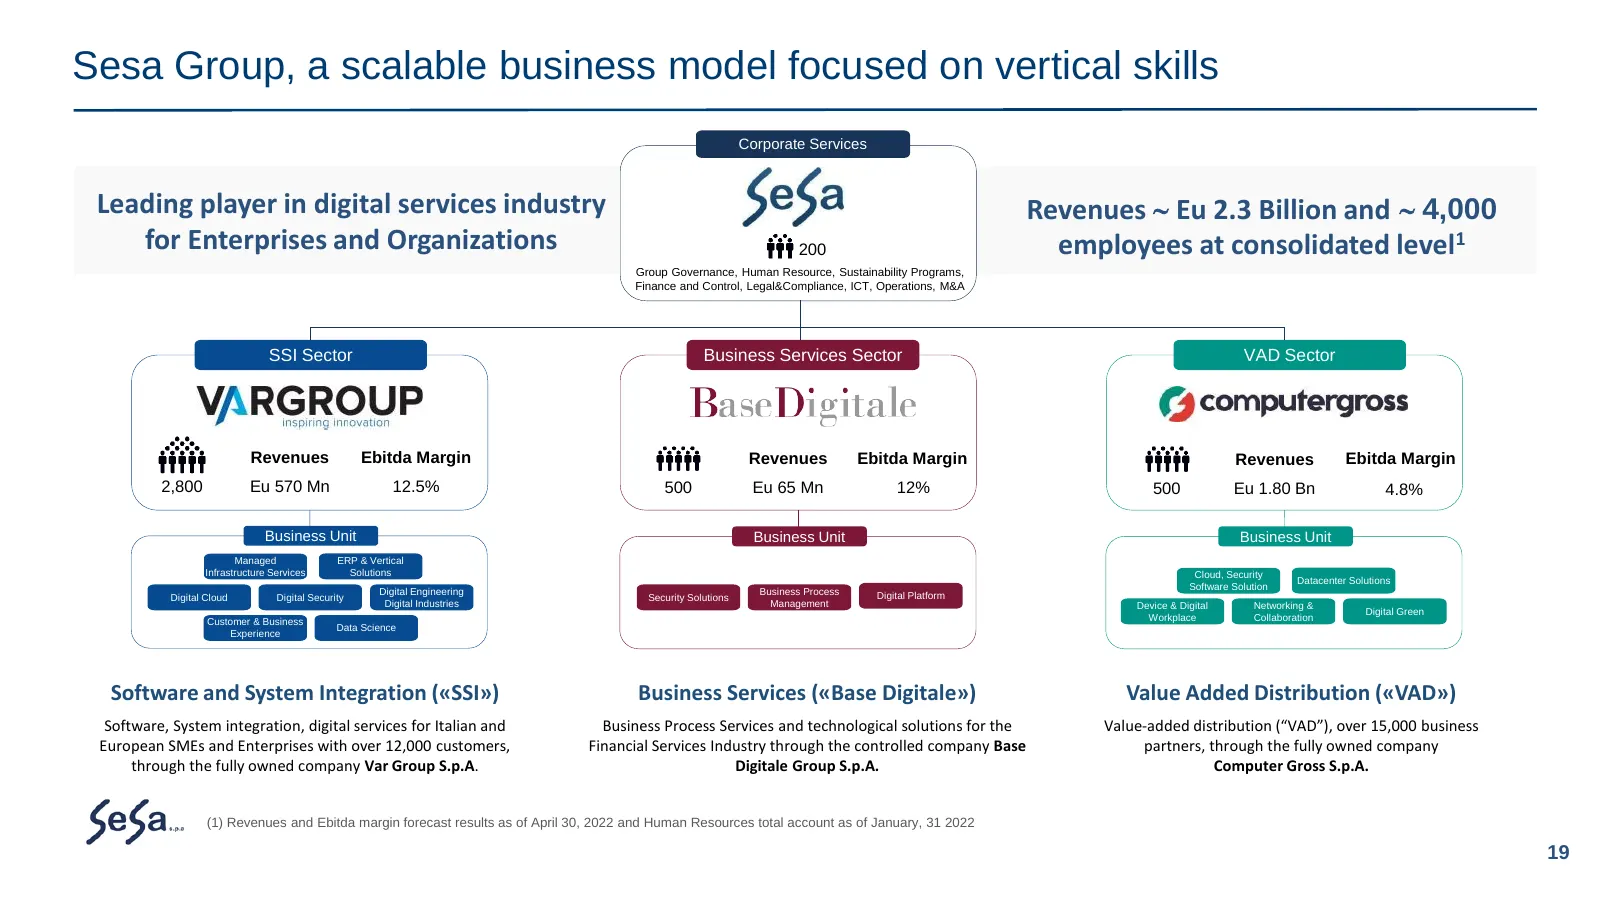
Sesa Group, a scalable business model focused on vertical skills Corporate Services Leading player in digital services industry Revenues Eu 2.3 Billion and 4,000 for Enterprises and Organizations 200 employees at consolidated level1 Group Governance, Human Resource, Sustainability Programs, Fina
Slide 20: VAD: leadership in Italy in Value Added Distribution
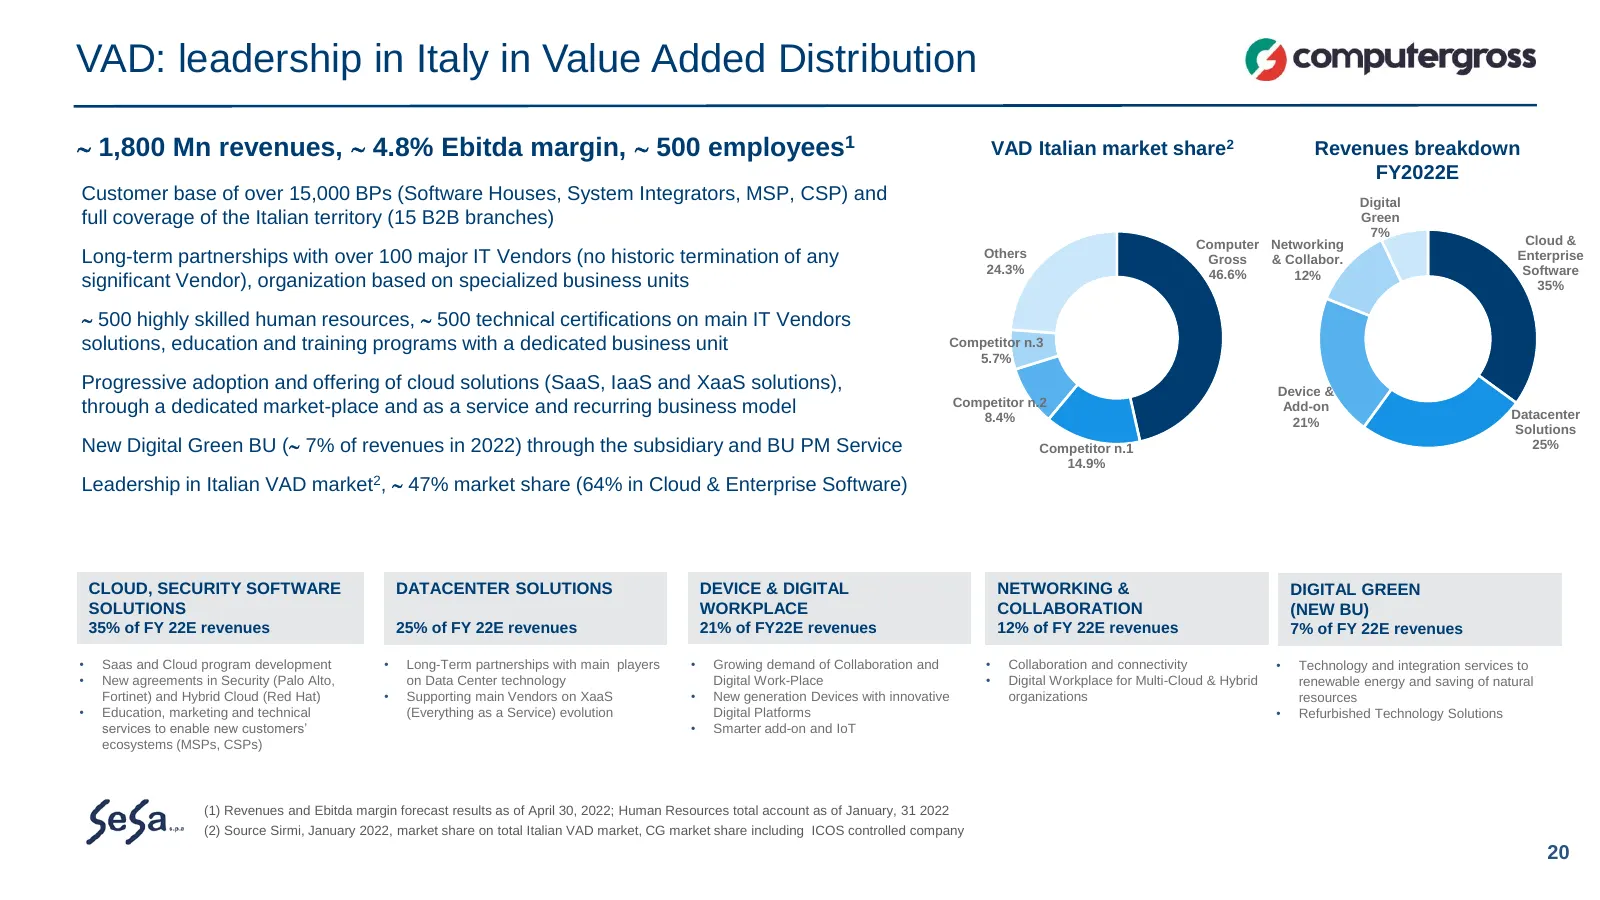
VAD: leadership in Italy in Value Added Distribution 1,800 Mn revenues, 4.8% Ebitda margin, 500 employees1 VAD Italian market share2 Revenues breakdown FY2022E Customer base of over 15,000 BPs (Software Houses, System Integrators, MSP, CSP) and Digital full coverage of the Italian territory (1
Slide 21: SSI: Digital and Innovation Partner for Enterprises and SMEs
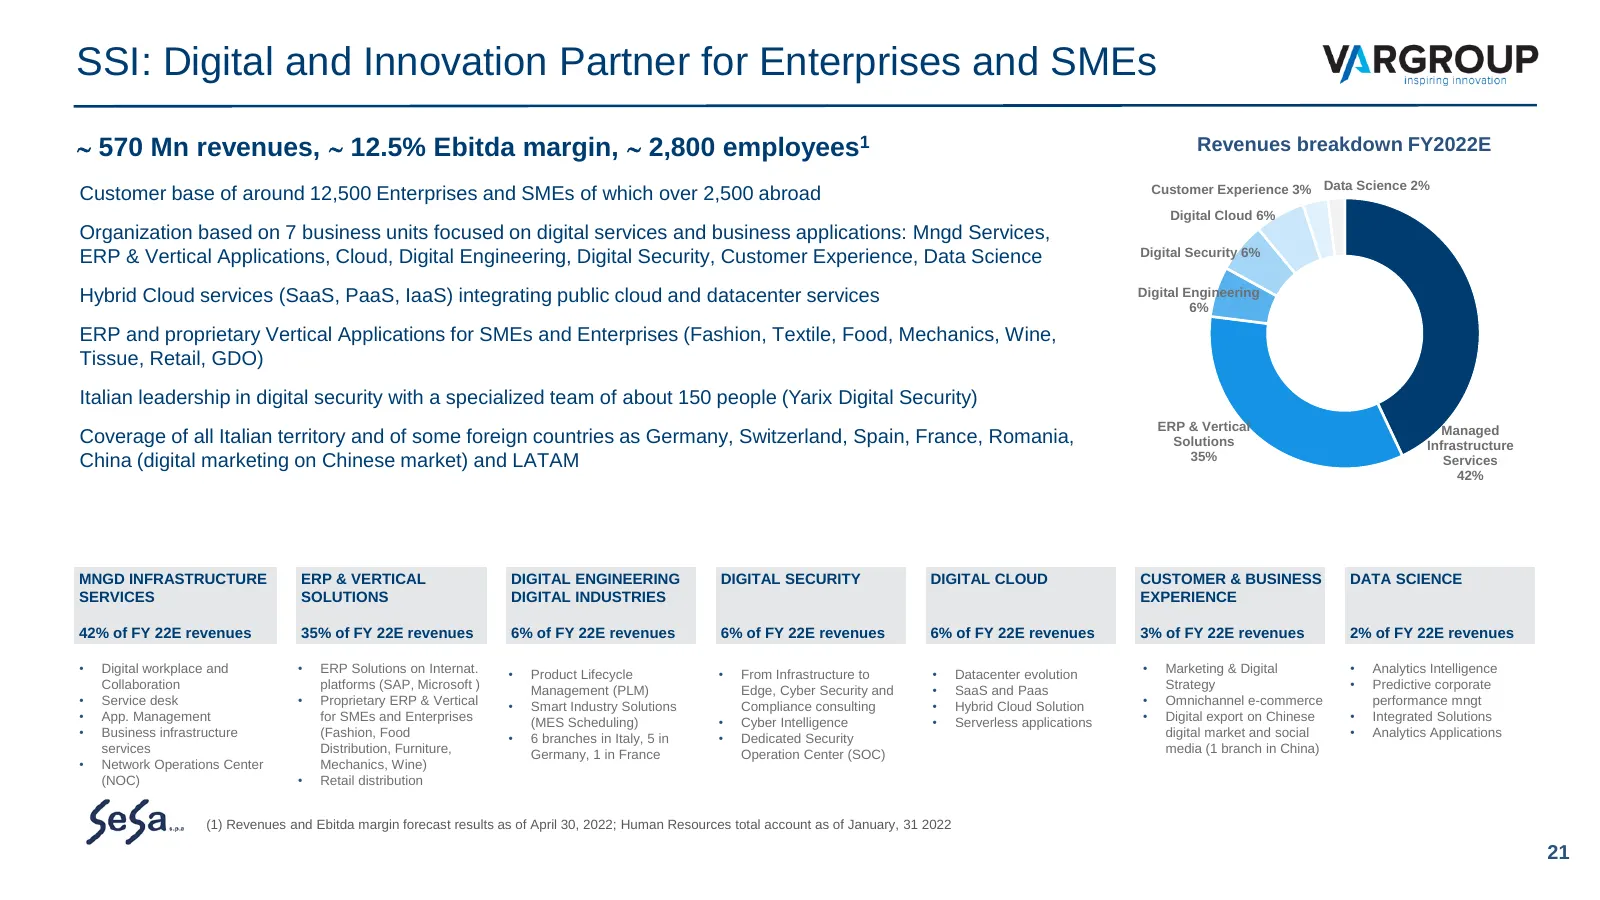
SSI: Digital and Innovation Partner for Enterprises and SMEs 570 Mn revenues, 12.5% Ebitda margin, 2,800 employees1 Revenues breakdown FY2022E Customer base of around 12,500 Enterprises and SMEs of which over 2,500 abroad Customer Experience 3% Data Science 2% Digital Cloud 6% Organization bas
Slide 22: Business Services: digital transformation for Financial Services
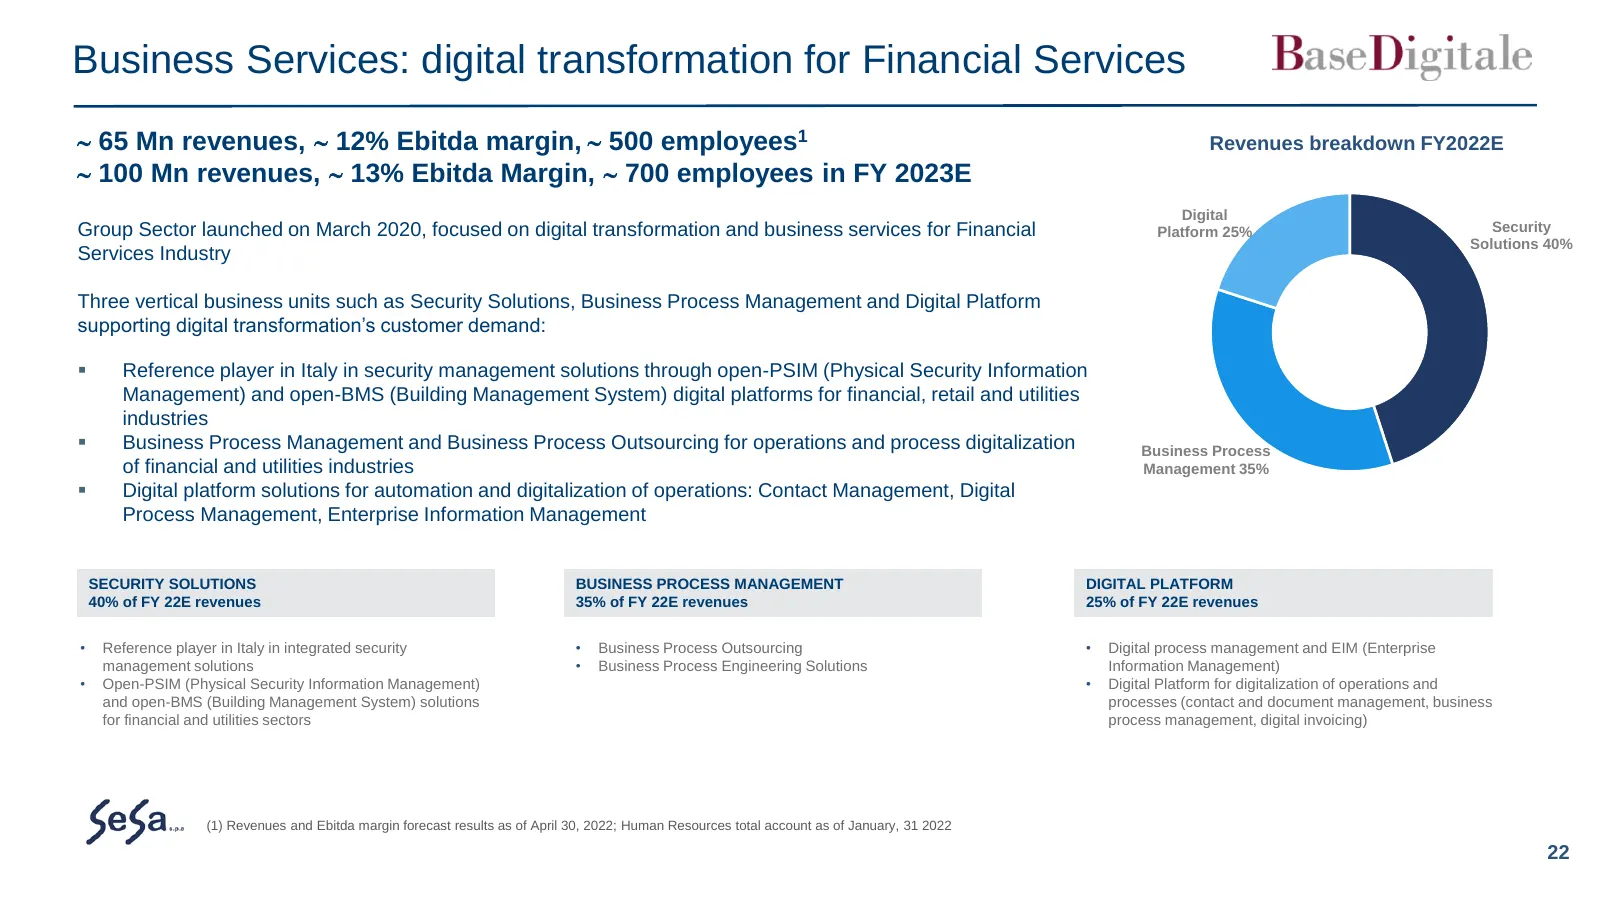
Business Services: digital transformation for Financial Services 65 Mn revenues, 12% Ebitda margin, 500 employees1 Revenues breakdown FY2022E 100 Mn revenues, 13% Ebitda Margin, 700 employees in FY 2023E Digital Group Sector launched on March 2020, focused on digital transformation and b
Slide 23: Business model evolution and strategic achievements
Business model evolution and strategic achievements Alessandro Fabbroni - Chief Executive Officer Conxi Palmero - Investor Relation Manager Group Results and achievements as of January 31, 2022 (9M) and FY 2022E Market trend and long-term sustainable growth Group Structure and Business Sectors VAD,
Slide 24: Group 9M Results as of January 31, 2022 by segment
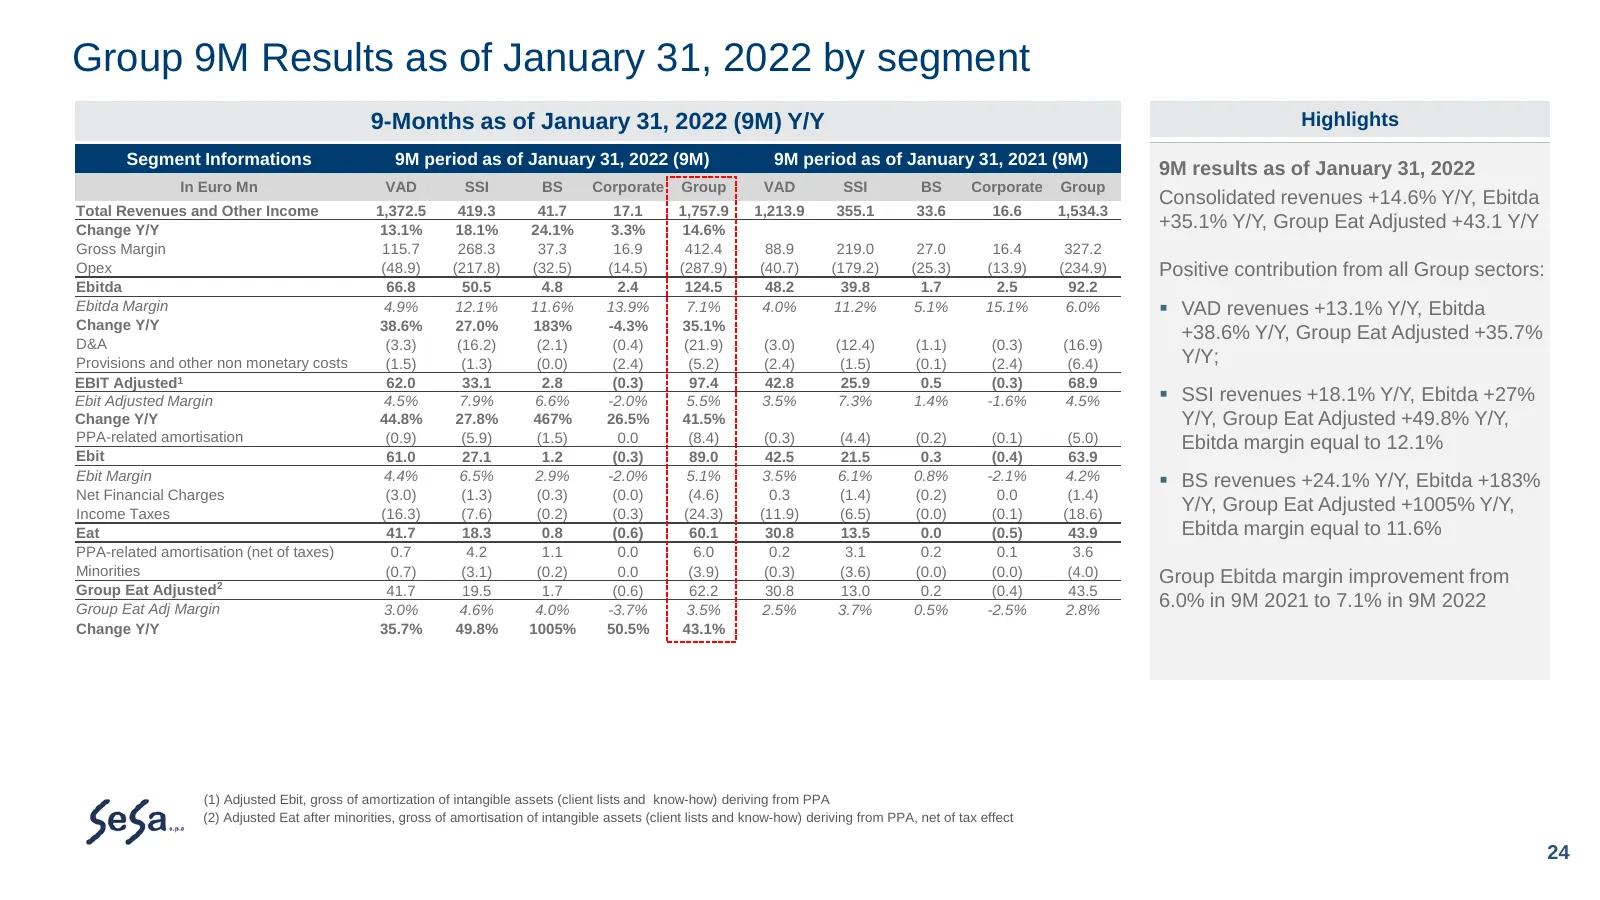
Group 9M Results as of January 31, 2022 by segment 9-Months as of January 31, 2022 (9M) Y/Y Highlights Segment Informations 9M period as of January 31, 2022 (9M) 9M period as of January 31, 2021 (9M) 9M results as of January 31, 2022 In Euro Mn VAD SSI BS Corporate Group VAD SSI BS Corporate Group C
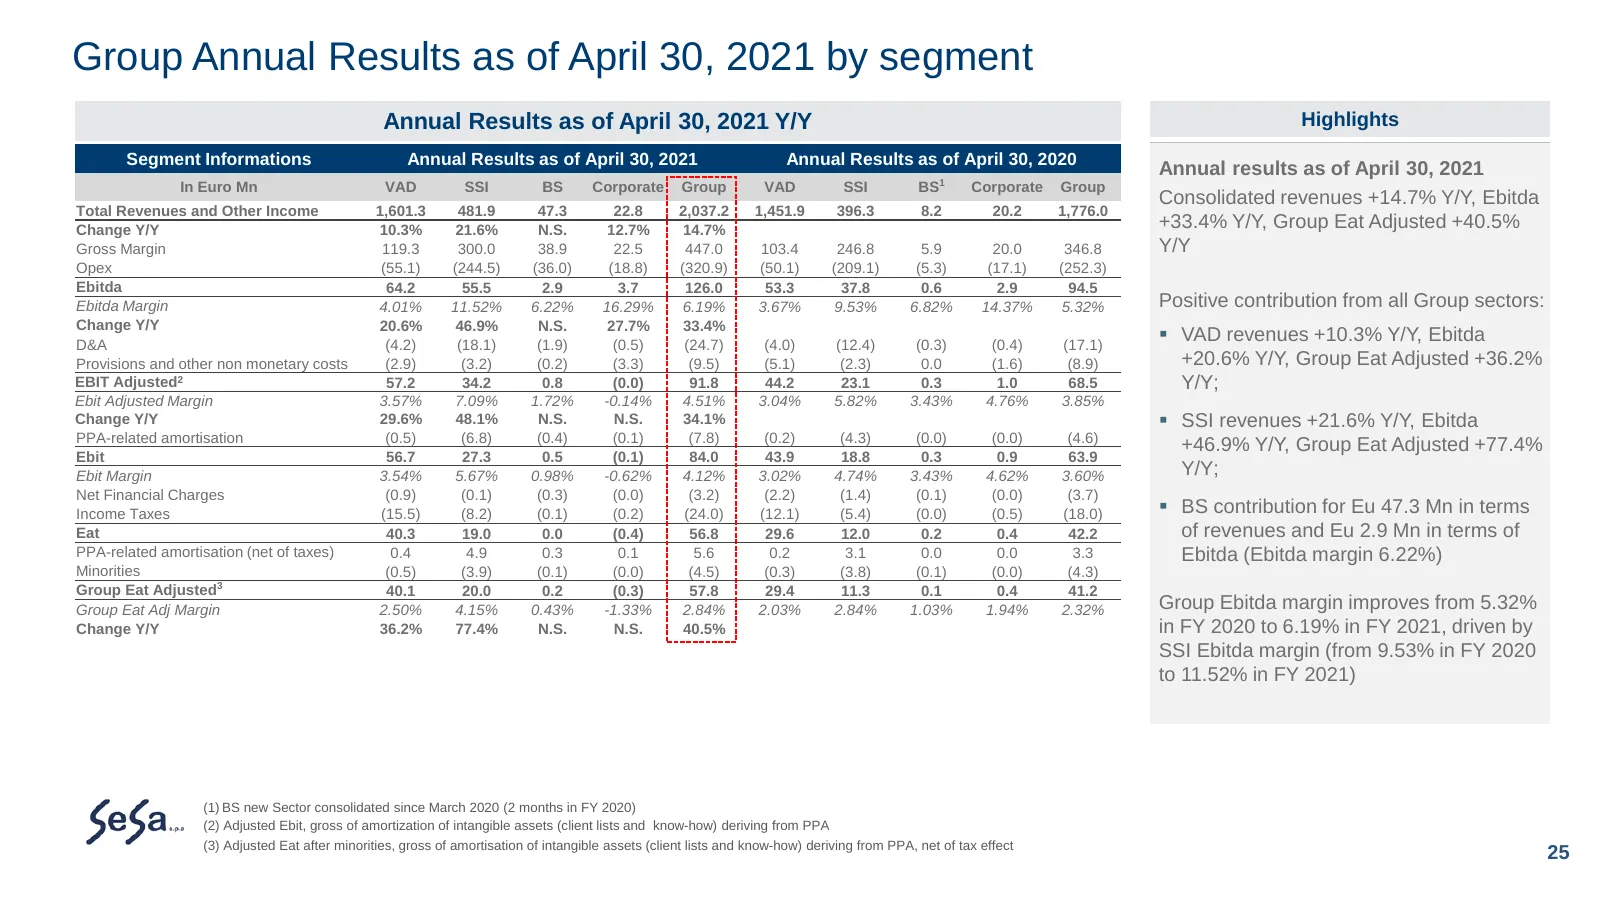
Slide 25: Group Annual Results as of April 30, 2021 by segment
Group Annual Results as of April 30, 2021 by segment Annual Results as of April 30, 2021 Y/Y Highlights Segment Informations Annual Results as of April 30, 2021 Annual Results as of April 30, 2020 Annual results as of April 30, 2021 In Euro Mn VAD SSI BS Corporate Group VAD SSI BS1 Corporate Group C
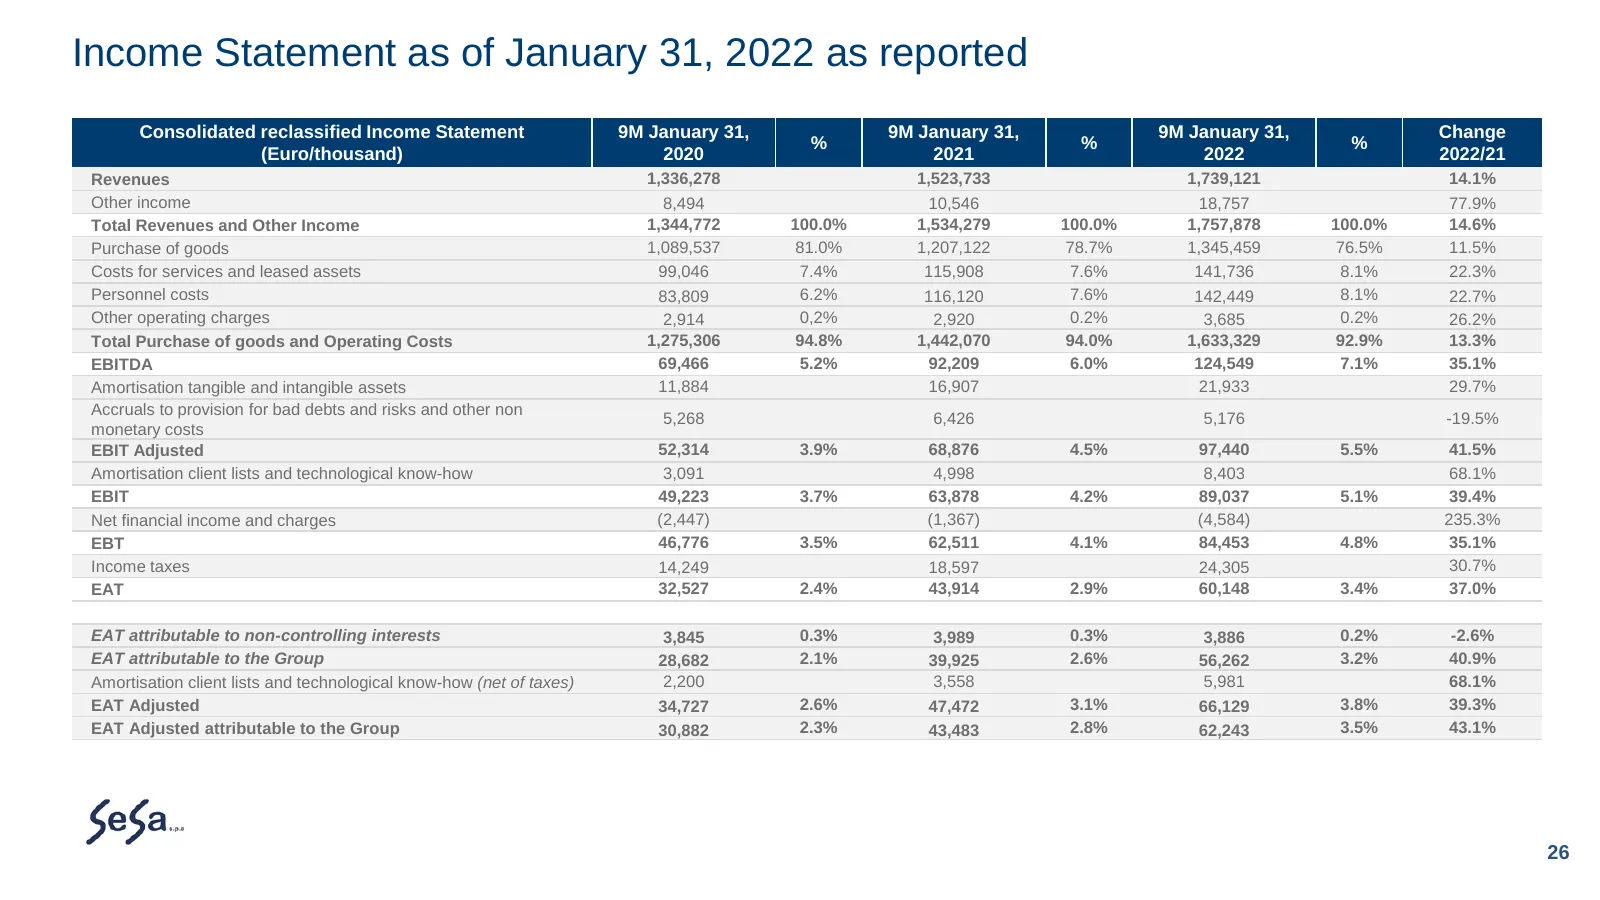
Slide 26: Income Statement as of January 31, 2022 as reported
Income Statement as of January 31, 2022 as reported Consolidated reclassified Income Statement 9M January 31, 9M January 31, 9M January 31, Change % % % (Euro/thousand) 2020 2021 2022 2022/21 Revenues 1,336,278 1,523,733 1,739,121 14.1% Other income 8,494 10,546 18,757 77.9% Total Revenues and Other
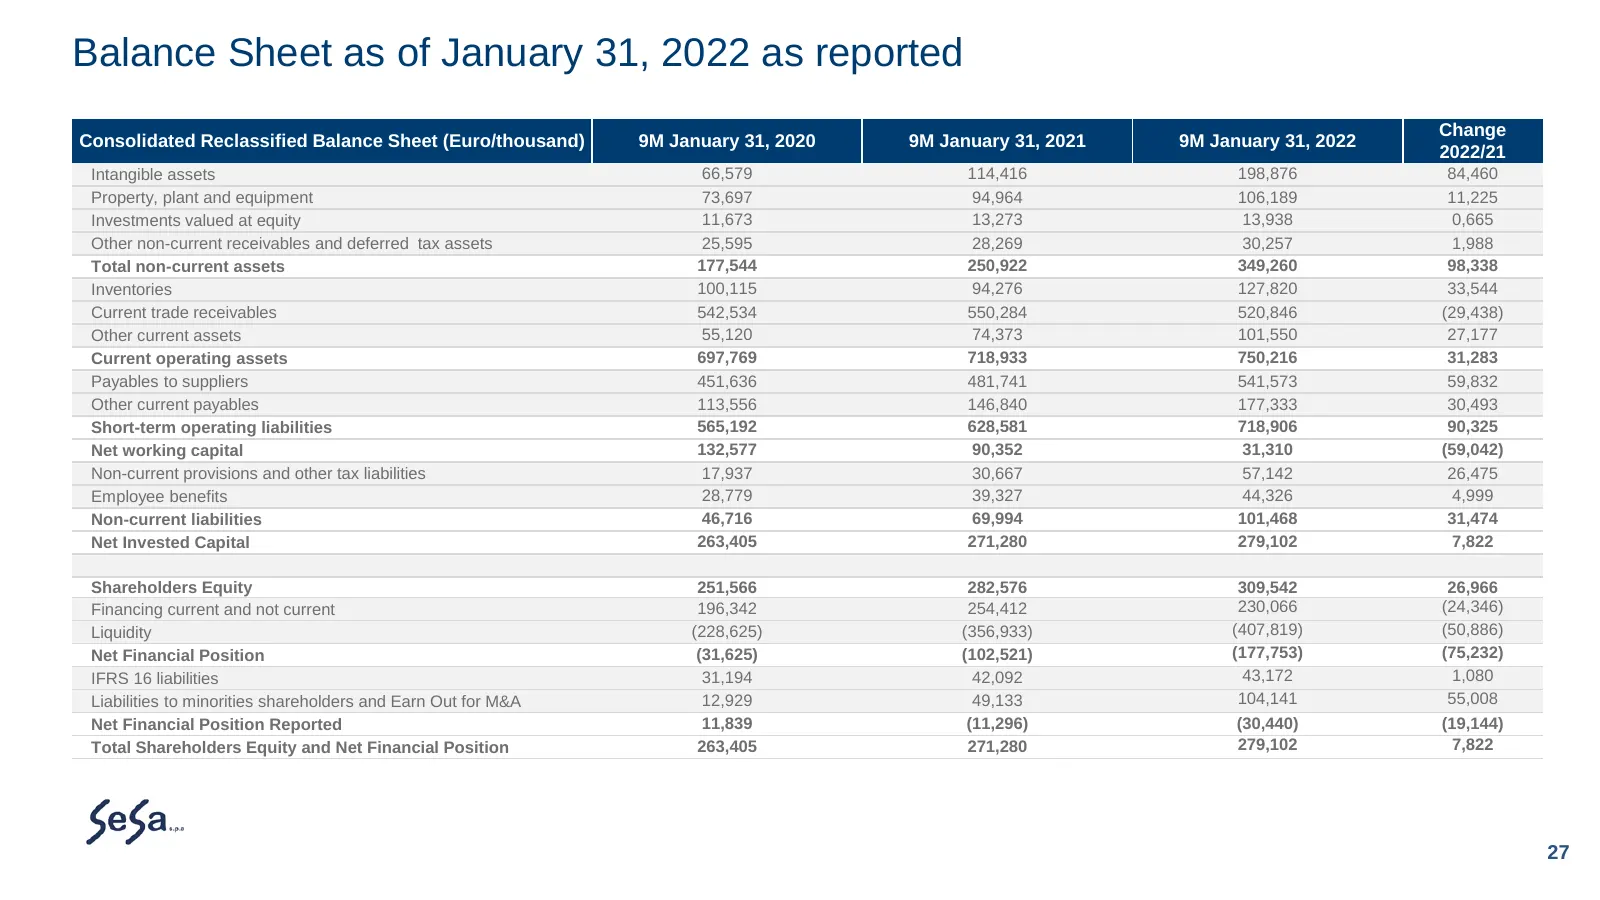
Slide 27: Balance Sheet as of January 31, 2022 as reported
Balance Sheet as of January 31, 2022 as reported Change Consolidated Reclassified Balance Sheet (Euro/thousand) 9M January 31, 2020 9M January 31, 2021 9M January 31, 2022 2022/21 Intangible assets 66,579 114,416 198,876 84,460 Property, plant and equipment 73,697 94,964 106,189 11,225 Investments v
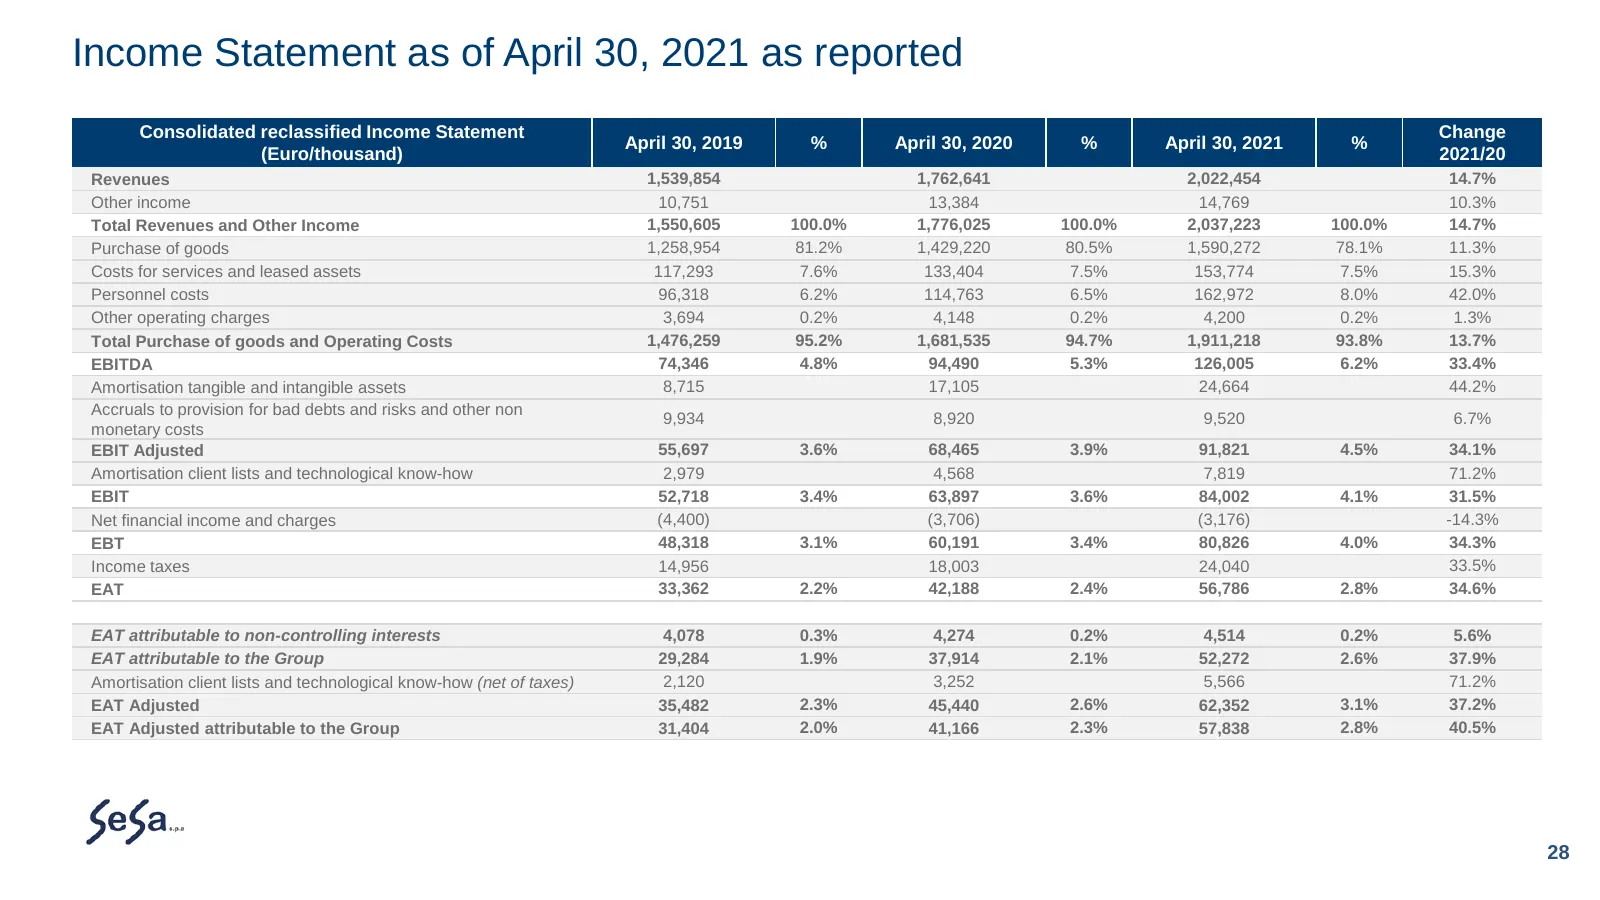
Slide 28: Income Statement as of April 30, 2021 as reported
Income Statement as of April 30, 2021 as reported Consolidated reclassified Income Statement Change April 30, 2019 % April 30, 2020 % April 30, 2021 % (Euro/thousand) 2021/20 Revenues 1,539,854 1,762,641 2,022,454 14.7% Other income 10,751 13,384 14,769 10.3% Total Revenues and Other Income 1,550,60
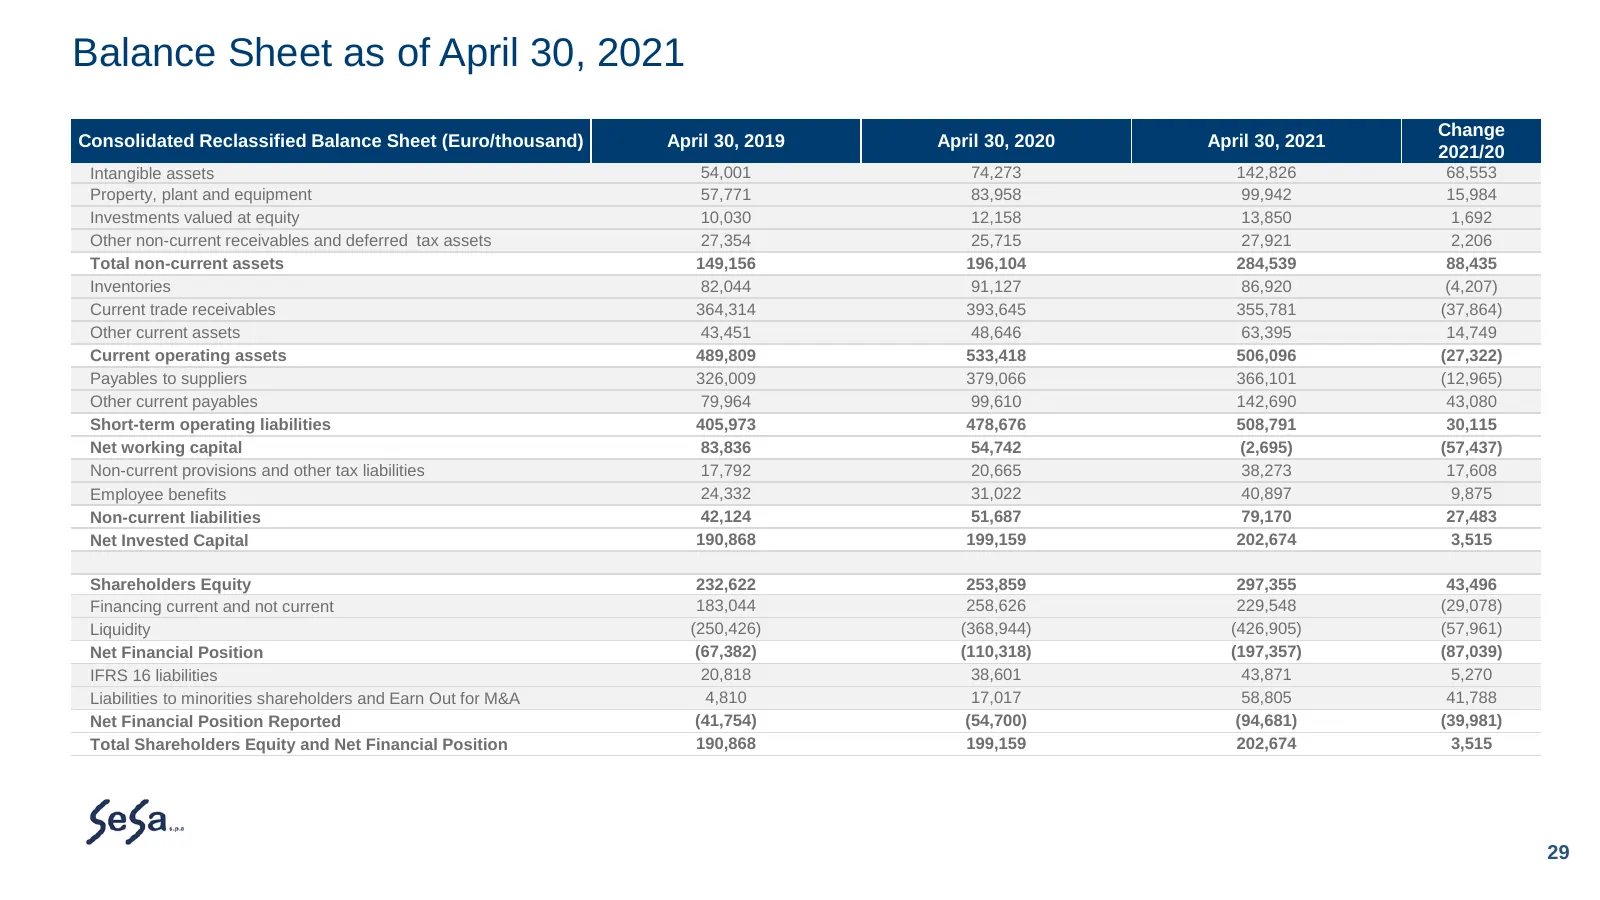
Slide 29: Balance Sheet as of April 30, 2021
Balance Sheet as of April 30, 2021 Change Consolidated Reclassified Balance Sheet (Euro/thousand) April 30, 2019 April 30, 2020 April 30, 2021 2021/20 Intangible assets 54,001 74,273 142,826 68,553 Property, plant and equipment 57,771 83,958 99,942 15,984 Investments valued at equity 10,030 12,158 1

Slide 30: Thank you for your kind attention
Thank you for your kind attention
Slide 31: www.sesa.it Sesa Spa
www.sesa.it Sesa Spa This document has been prepared by Sesa SpA (“SeSa” or the “Company”) or by its subsidiaries (hereinafter “SeSa Group”) solely for this presentation and does not represent any investment research, recommendation, consulting or suggestion, concerning the Company or its shares or
Source: Internet Archive copy of sesa.it
More decks from SeSa S.p.A.
 Le Eccellenze del Made in Italy (October 2026)32 slides · Oct 1, 2026
 1Q 2027 Earnings Presentation32 slides · Sep 14, 2026
 FY2026 Earnings Presentation30 slides · Jul 16, 2026
 AI Evolution Conference Lugano 202635 slides · Jun 10, 2026
 Italian Investment Conference 202635 slides · May 20, 2026
 9M 2026 Earnings Presentation38 slides · Mar 12, 2026