Sundance Energy — Sundance Energy Australia — Corporate Update (October 2018)
16 slides from Sundance Energy's corporate update, Oct 12, 2018
Slide 1: Disclaimers: Important Notice and Disclaimer
Disclaimers Important Notice and Disclaimer IMPORTANT: You are advised to read the following carefully before making any use of the information contained in this presentation. Except as required by law, no representation or warranty, express or implied, is made by Sundance or any of the Sundance Rel
Slide 2: Disclaimers: Industry data and forward-looking statements
Disclaimers Industry data Certain market and industry data used in connection with this presentation, including in relation to other companies in Sundance’s peer group, may have been obtained from public filings, research, surveys or studies conducted by third parties, including industry or general
Slide 3: Disclaimers: Proved and probable reserves
Disclaimers Proved and probable reserves Ryder Scott Company, L.P. (Ryder Scott) has prepared an independent estimate of the proved and probable reserves, future production and income attributable to leasehold interests within the recently closed acquisition of 21,900 net acres for sale by Pioneer N
Slide 4: A Leading Pure Play Eagle Ford Producer
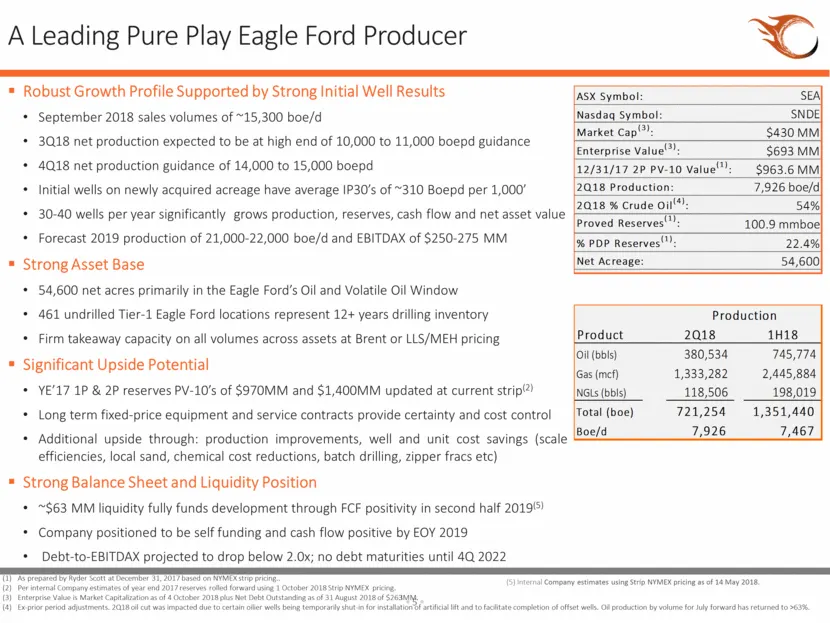
A Leading Pure Play Eagle Ford Producer Robust Growth Profile Supported by Strong Initial Well Results September 2018 sales volumes of ~15,300 boe/d 3Q18 net production expected to be at high end of 10,000 to 11,000 boepd guidance 4Q18 net production guidance of 14,000 to 15,000 boepd Initial wells
Slide 5: 2018 and 2019 Summary Guidance
2018 and 2019 Summary Guidance(1) Delivering Substantial Operational and Financial Growth Over the Next 18 Months Exceeded top end of First Half 2018 production guidance range Met or beat First Half 2018 EBITDAX, capital spending and cost guidance 2018 development plan is on track with 12 wells brou
Slide 6: Excellent Preliminary Well Results
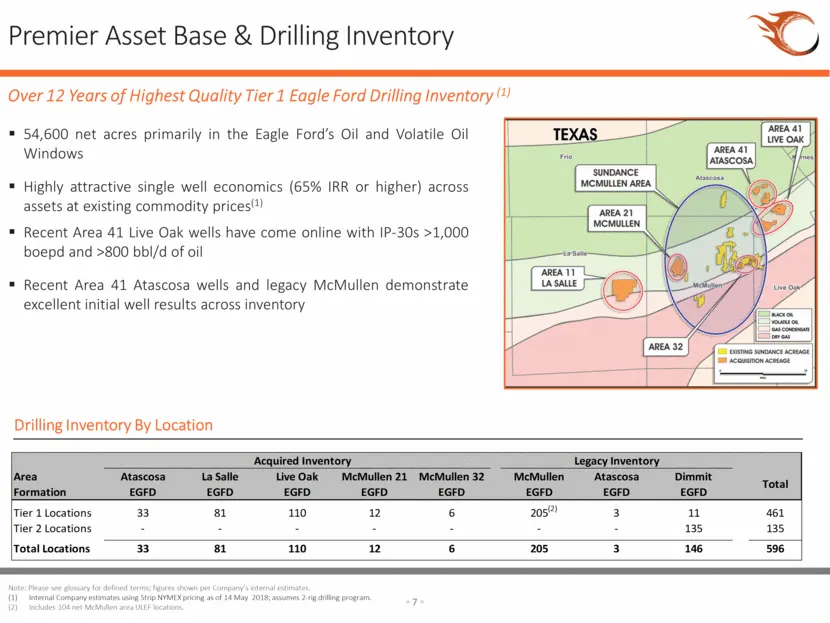
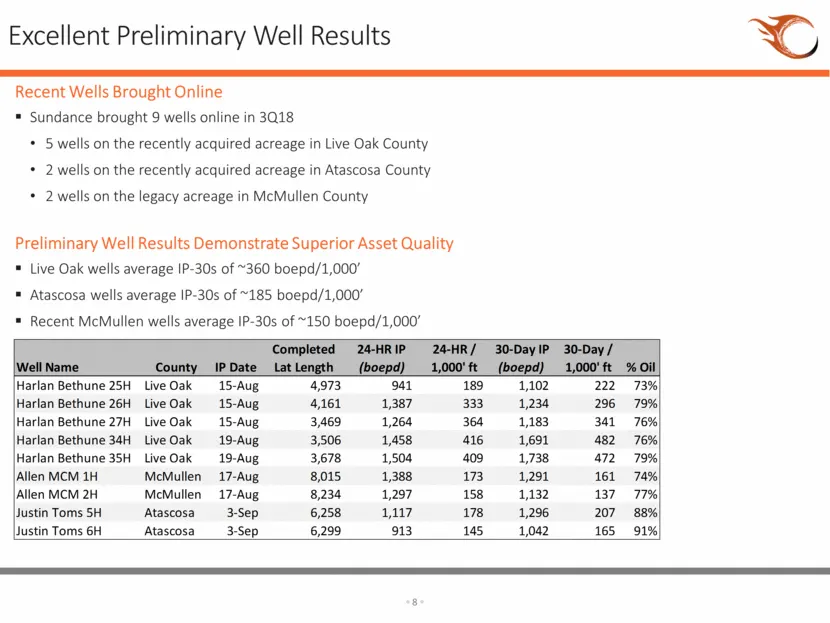
Excellent Preliminary Well Results Recent Wells Brought Online Sundance brought 9 wells online in 3Q18 5 wells on the recently acquired acreage in Live Oak County 2 wells on the recently acquired acreage in Atascosa County 2 wells on the legacy acreage in McMullen County Preliminary Well Results Dem
Slide 7: Successfully Executing Development Plan
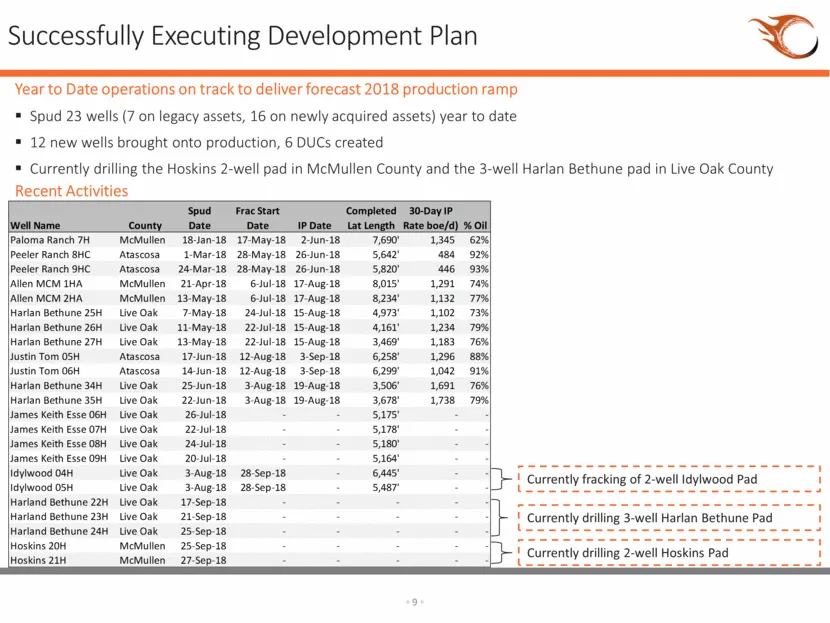
Successfully Executing Development Plan Year to Date operations on track to deliver forecast 2018 production ramp Spud 23 wells (7 on legacy assets, 16 on newly acquired assets) year to date 12 new wells brought onto production, 6 DUCs created Currently drilling the Hoskins 2-well pad in McMullen Co
Slide 8: Harlan Bethune Live Oak County Initial Well Performance vs Type Curve
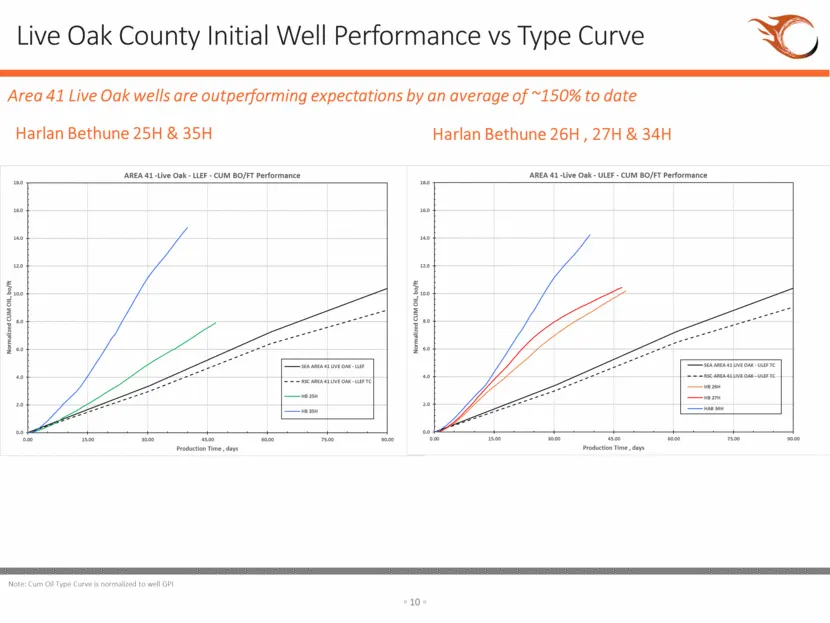
Harlan Bethune 25H & 35H Live Oak County Initial Well Performance vs Type Curve Harlan Bethune 26H , 27H & 34H Area 41 Live Oak wells are outperforming expectations by an average of ~150% to date Note: Cum Oil Type Curve is normalized to well GPI
Slide 9: Atascosa County Initial Well Performance vs Type Curve
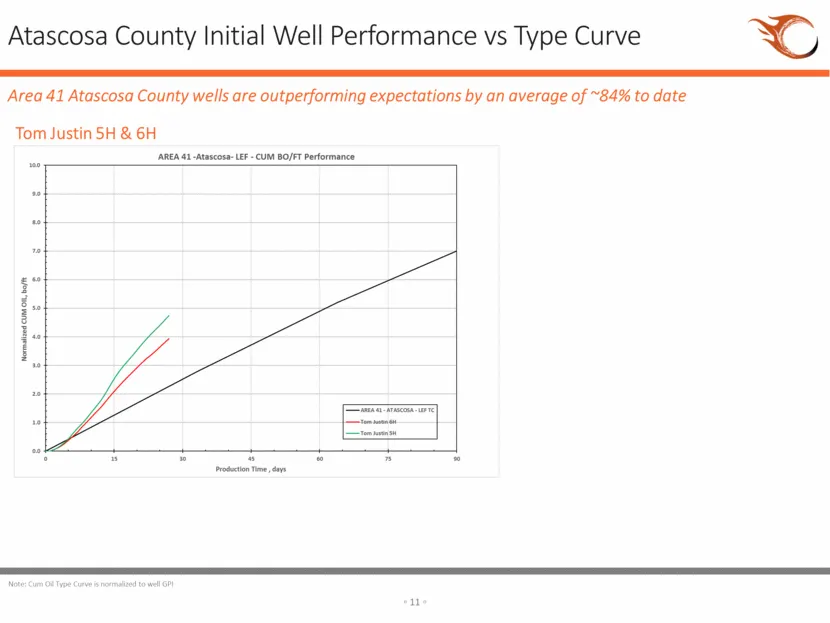
Atascosa County Initial Well Performance vs Type Curve Tom Justin 5H & 6H Area 41 Atascosa County wells are outperforming expectations by an average of ~84% to date Note: Cum Oil Type Curve is normalized to well GPI
Slide 10: McMullen County Initial Well Performance vs Type Curve
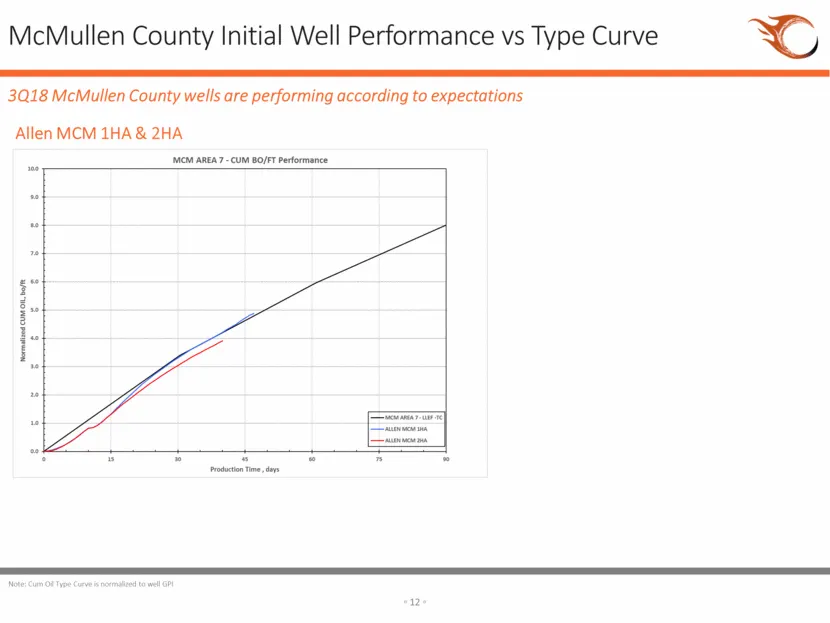
McMullen County Initial Well Performance vs Type Curve Allen MCM 1HA & 2HA 3Q18 McMullen County wells are performing according to expectations Note: Cum Oil Type Curve is normalized to well GPI
Slide 11: Sundance Initial Production Rates vs Peers
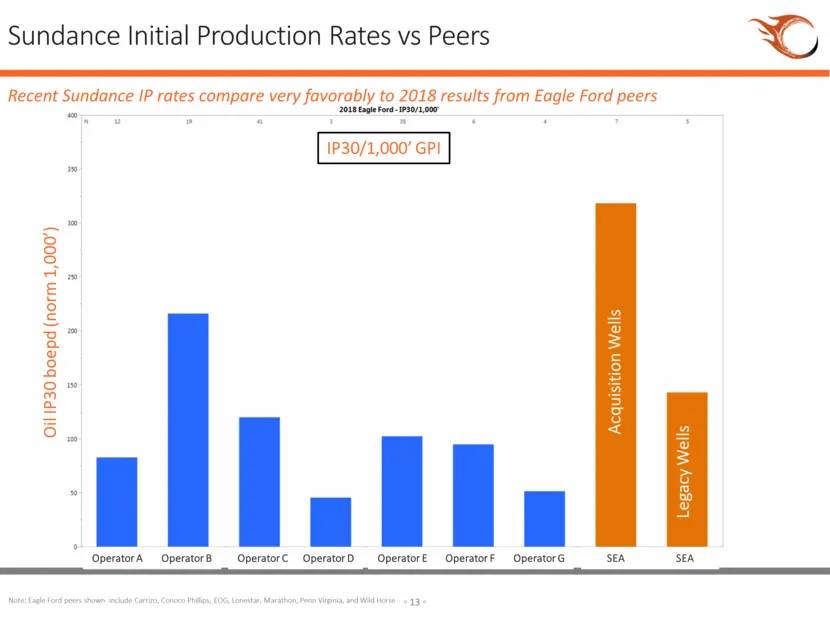
Sundance Initial Production Rates vs Peers Recent Sundance IP rates compare very favorably to 2018 results from Eagle Ford peers IP30/1,000’ GPI Oil IP30 boepd (norm 1,000’) Operator A Operator B Operator C Operator D Operator E Operator F Operator G SEA SEA Acquisition Wells Legacy Wells Note: Eagl
Slide 12: Year to Date 2018 Development – Legacy Acreage
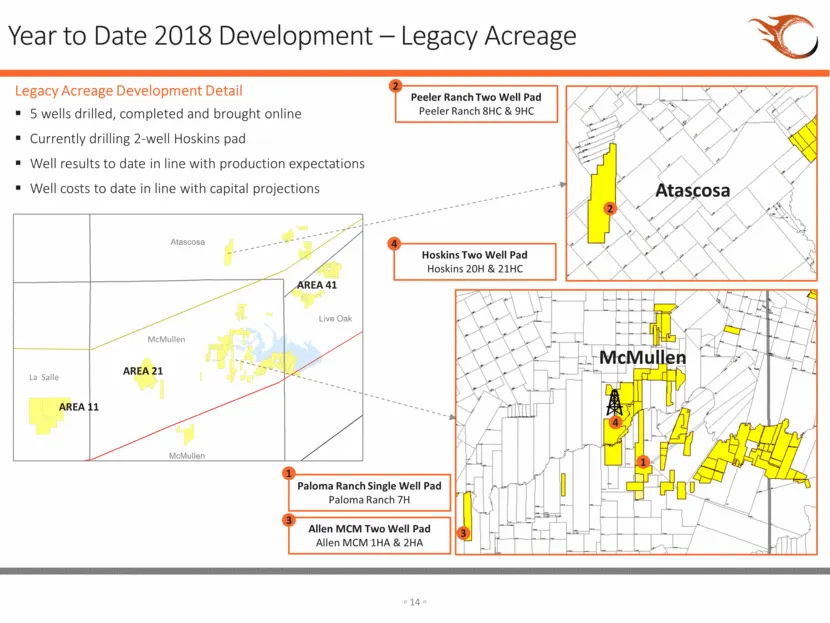
Year to Date 2018 Development – Legacy Acreage 3 1 2 Atascosa McMullen La Salle McMullen AREA 41 AREA 11 AREA 21 Paloma Ranch Single Well Pad Paloma Ranch 7H 1 Peeler Ranch Two Well Pad Peeler Ranch 8HC & 9HC 2 Allen MCM Two Well Pad Allen MCM 1HA & 2HA 3 Legacy Acreage Development Detail 5 wells dr
Slide 13: Year to Date 2018 Development – Newly Acquired Acreage
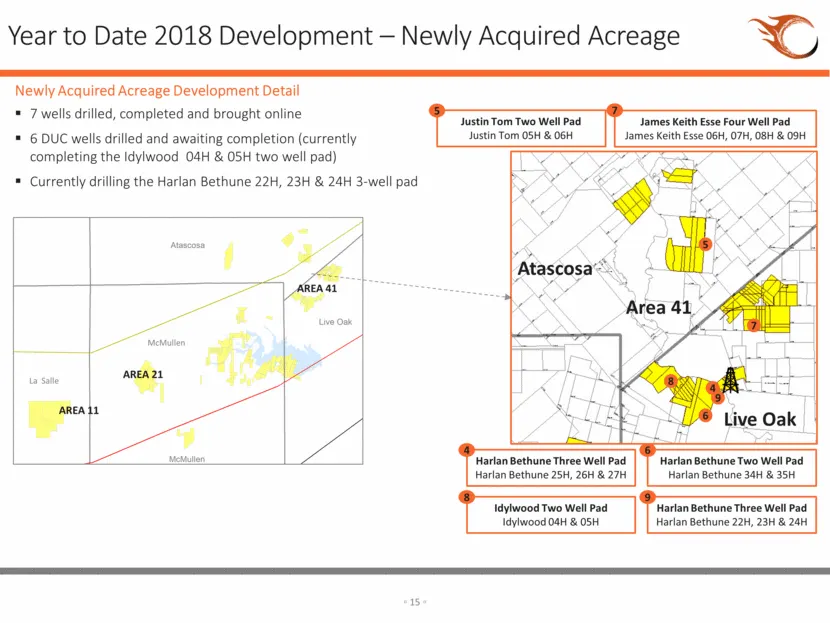
La Salle McMullen AREA 41 AREA 11 AREA 21 Year to Date 2018 Development – Newly Acquired Acreage 5 7 6 4 8 Atascosa Live Oak Harlan Bethune Three Well Pad Harlan Bethune 25H, 26H & 27H 4 Harlan Bethune Two Well Pad Harlan Bethune 34H & 35H 6 James Keith Esse Four Well Pad James Keith Esse 06H, 07H,
Slide 14: Crude and Gas Hedge Contracts
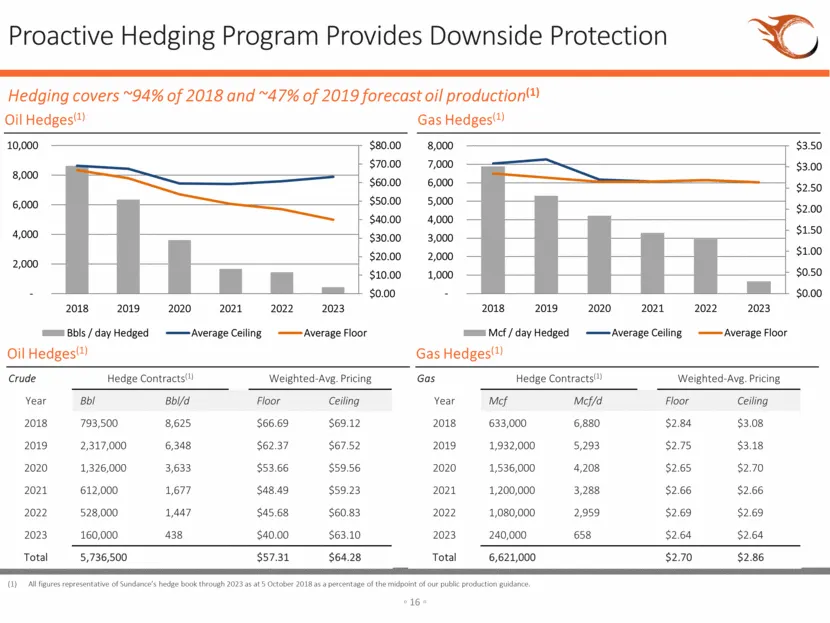
Crude Hedge Contracts(1) Weighted-Avg. Pricing Year Bbl Bbl/d Floor Ceiling 2018 793,500 8,625 $66.69 $69.12 2019 2,317,000 6,348 $62.37 $67.52 2020 1,326,000 3,633 $53.66 $59.56 2021 612,000 1,677 $48.49 $59.23 2022 528,000 1,447 $45.68 $60.83 2023 160,000 438 $40.00 $63.10 Total 5,736,500 $57.31 $
Slide 15: Pathway to Value
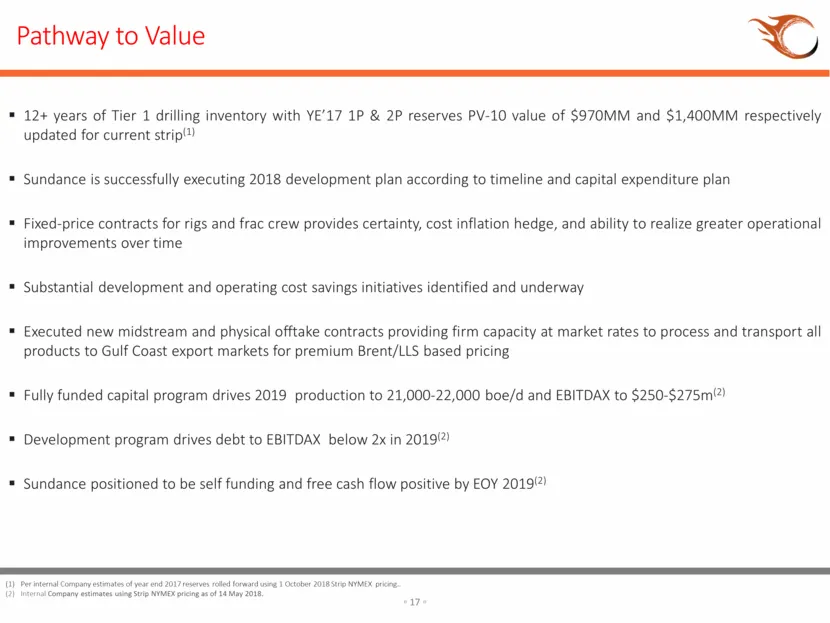
Pathway to Value 12+ years of Tier 1 drilling inventory with YE’17 1P & 2P reserves PV-10 value of $970MM and $1,400MM respectively updated for current strip(1) Sundance is successfully executing 2018 development plan according to timeline and capital expenditure plan Fixed-price contracts for rigs
Slide 16: Pathway to Value
Pathway to Value oe * 12+ years of Tier 1 drilling inventory with YE'17 1P & 2P reserves PV-10 value of $970MM and $1,400MM respectively updated for current strip" = Sundance is successfully executing 2018 development plan according to timeline and capital expenditure plan * Fixed-price contracts fo
Source: SEC EDGAR · 6-K filed Oct 12, 2018
More decks from Sundance Energy Inc
 Investor Presentation (February 2020)25 slides · Feb 10, 2020
 Sundance Energy Australia — Q3 2019 Earnings Presentation24 slides · Nov 18, 2019
 Sundance Energy Australia — Q2 2019 Earnings Presentation25 slides · Aug 16, 2019
 Sundance Energy Australia — Investor Presentation (July 2019)19 slides · Jul 24, 2019
 Sundance Energy Australia — Investor Presentation (June 2019)16 slides · Jun 3, 2019
 Sundance Energy Australia — Q1 2019 Earnings Presentation17 slides · May 21, 2019