National Financial Partners Corp
National Financial Partners — Q1 2009 Earnings Presentation
21 slides from National Financial Partners's earnings presentation, May 12, 2009
Slide 1: First Quarter Earnings Call Presentation
Exhibit 99.1 FIRST QUARTER EARNINGS CALL PRESENTATION th May 12 , 2009
Slide 2: Related to Forward-Looking Statements
RELATED TO FORWARD-LOOKING STATEMENTS Certain items in this presentation and in today’s discussion, including matters relating to revenue, net income, cash earnings and cash earnings per diluted share, and percentages or calculations using these measures, acquisitions, capital structure or growth ra
Slide 3: Related to Non-GAAP Financial Information
RELATED TO NON-GAAP FINANCIAL INFORMATION The Company analyzes its performance using historical and forward-looking non-GAAP measures called cash earnings and cash earnings per diluted share and percentages or calculations using these measures. The Company believes these non-GAAP measures provide ad
Slide 4: Reconciliation: Net Income to Cash Earnings
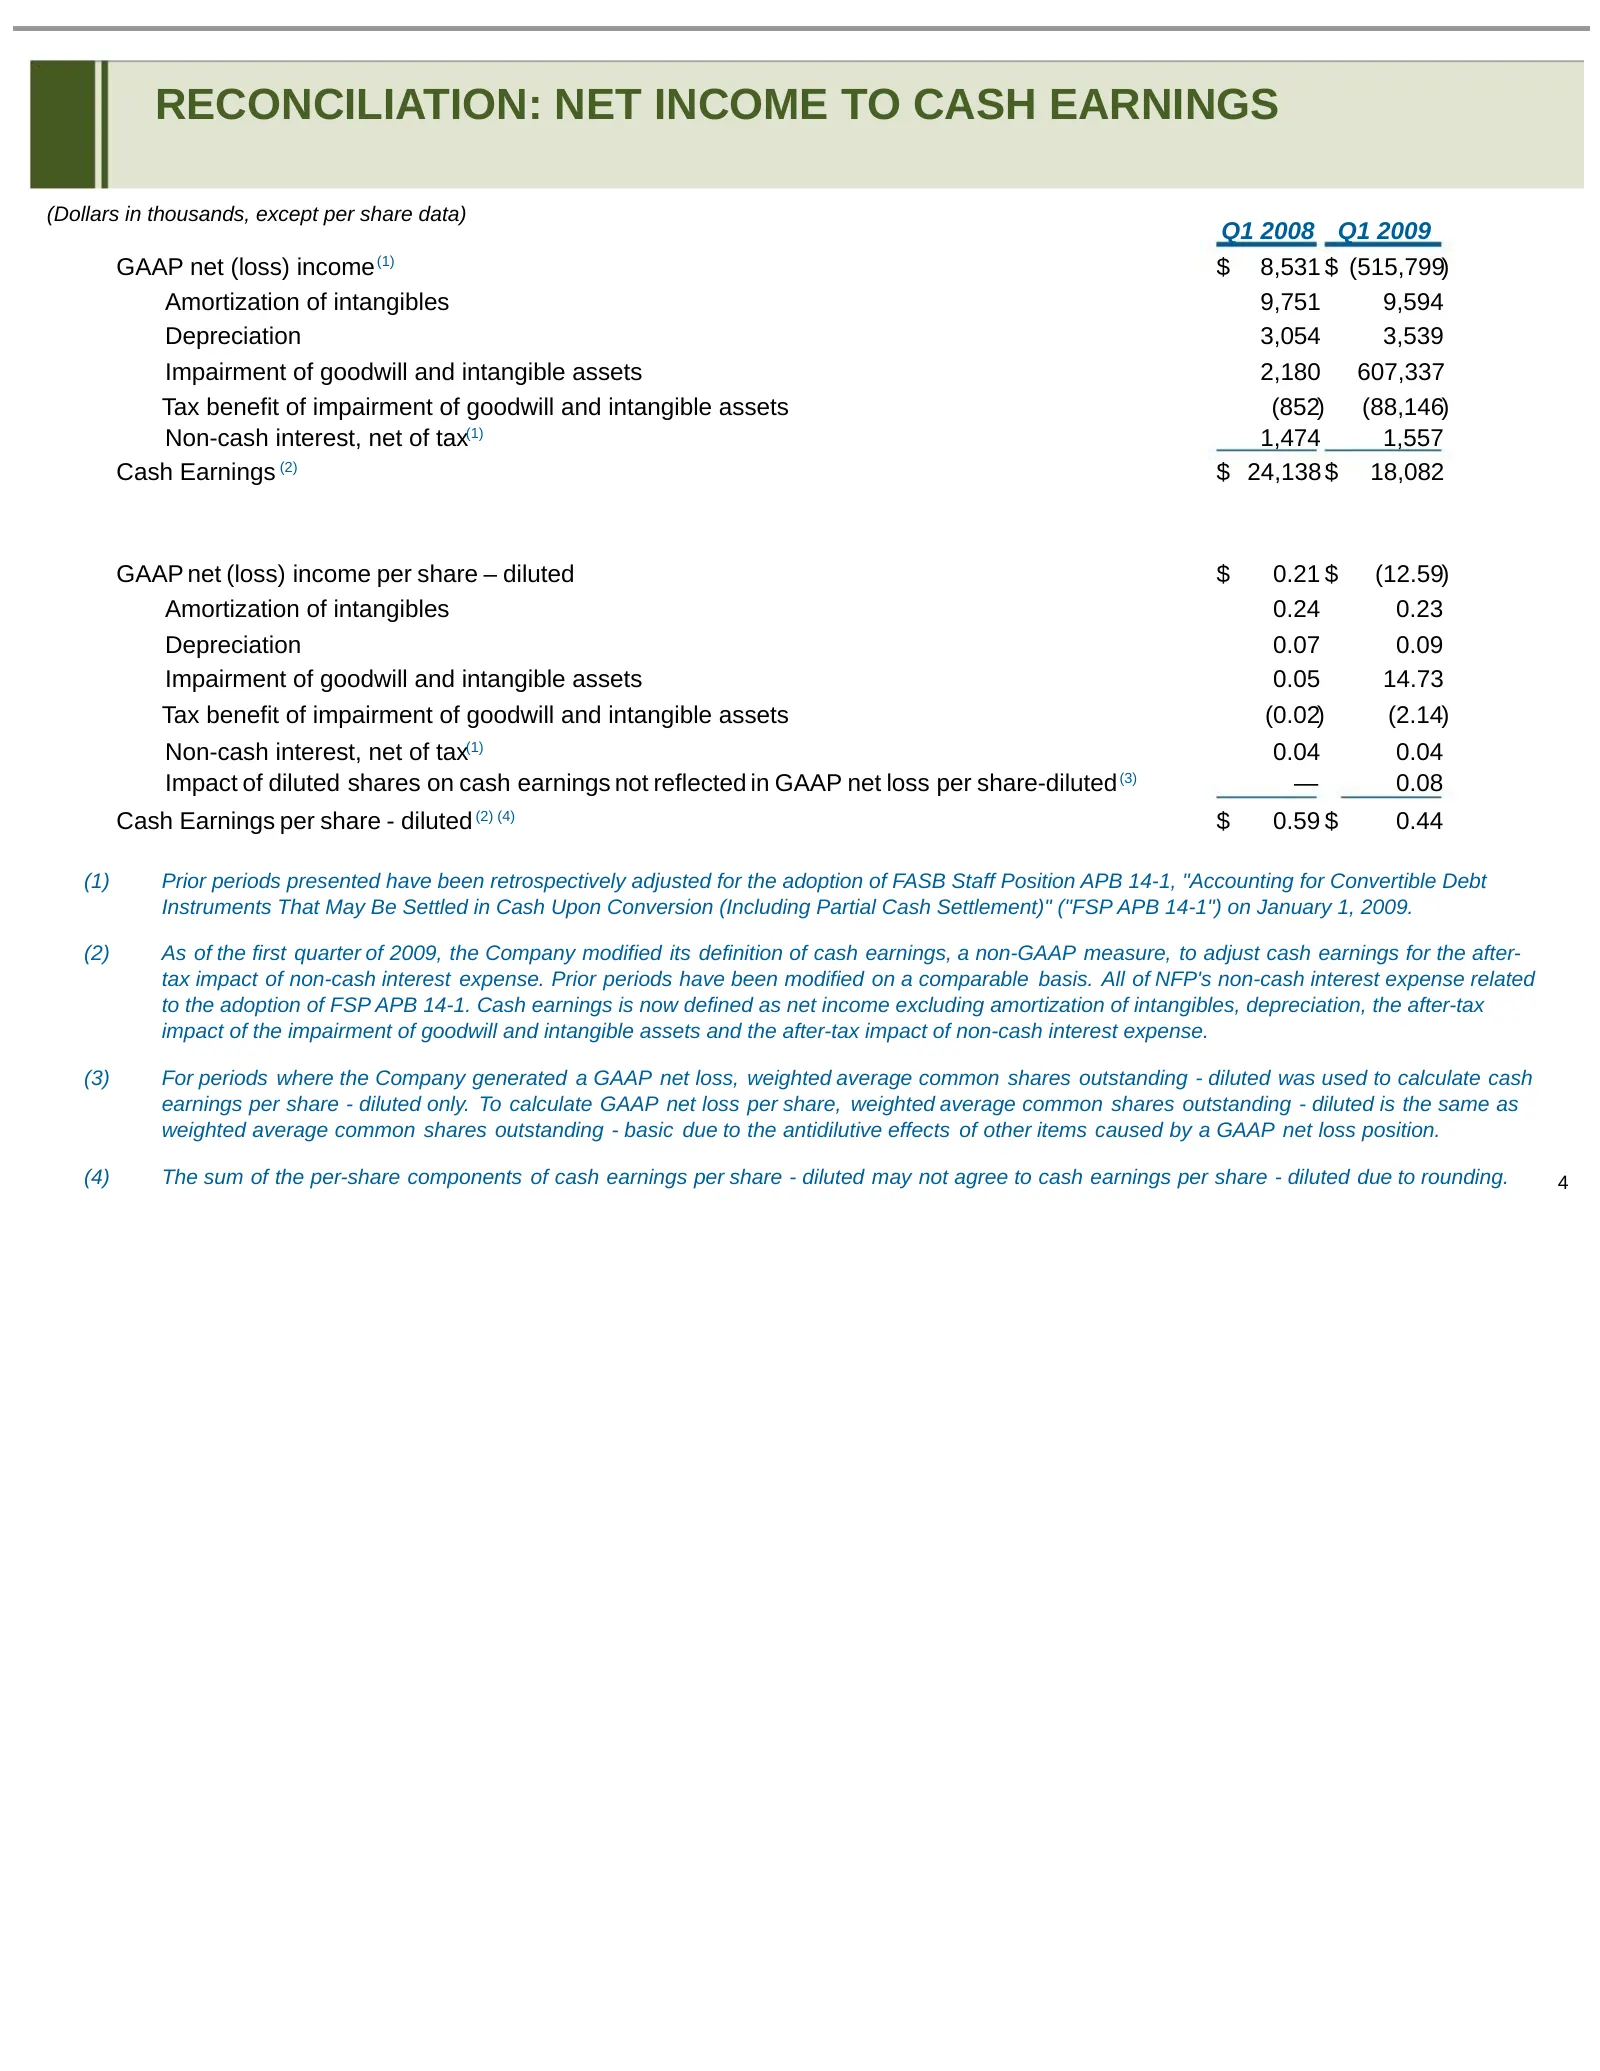
RECONCILIATION: NET INCOME TO CASH EARNINGS (Dollars in thousands, except per share data) Q1 2008 Q1 2009 GAAP net (loss) income (1) $ 8,531 $ (515,799) Amortization of intangibles 9,751 9,594 Depreciation 3,054 3,539 Impairment of goodwill and intangible assets 2,180 607,337 Tax benefit of impairme

Slide 5: NFP: First Quarter Earnings Conference Call - Jessica Bibliowicz
NFP: FIRST QUARTER EARNINGS CONFERENCE CALL JESSICA BIBLIOWICZ Chairman, President and Chief Executive Officer 5
Slide 6: First Quarter 2009 Results
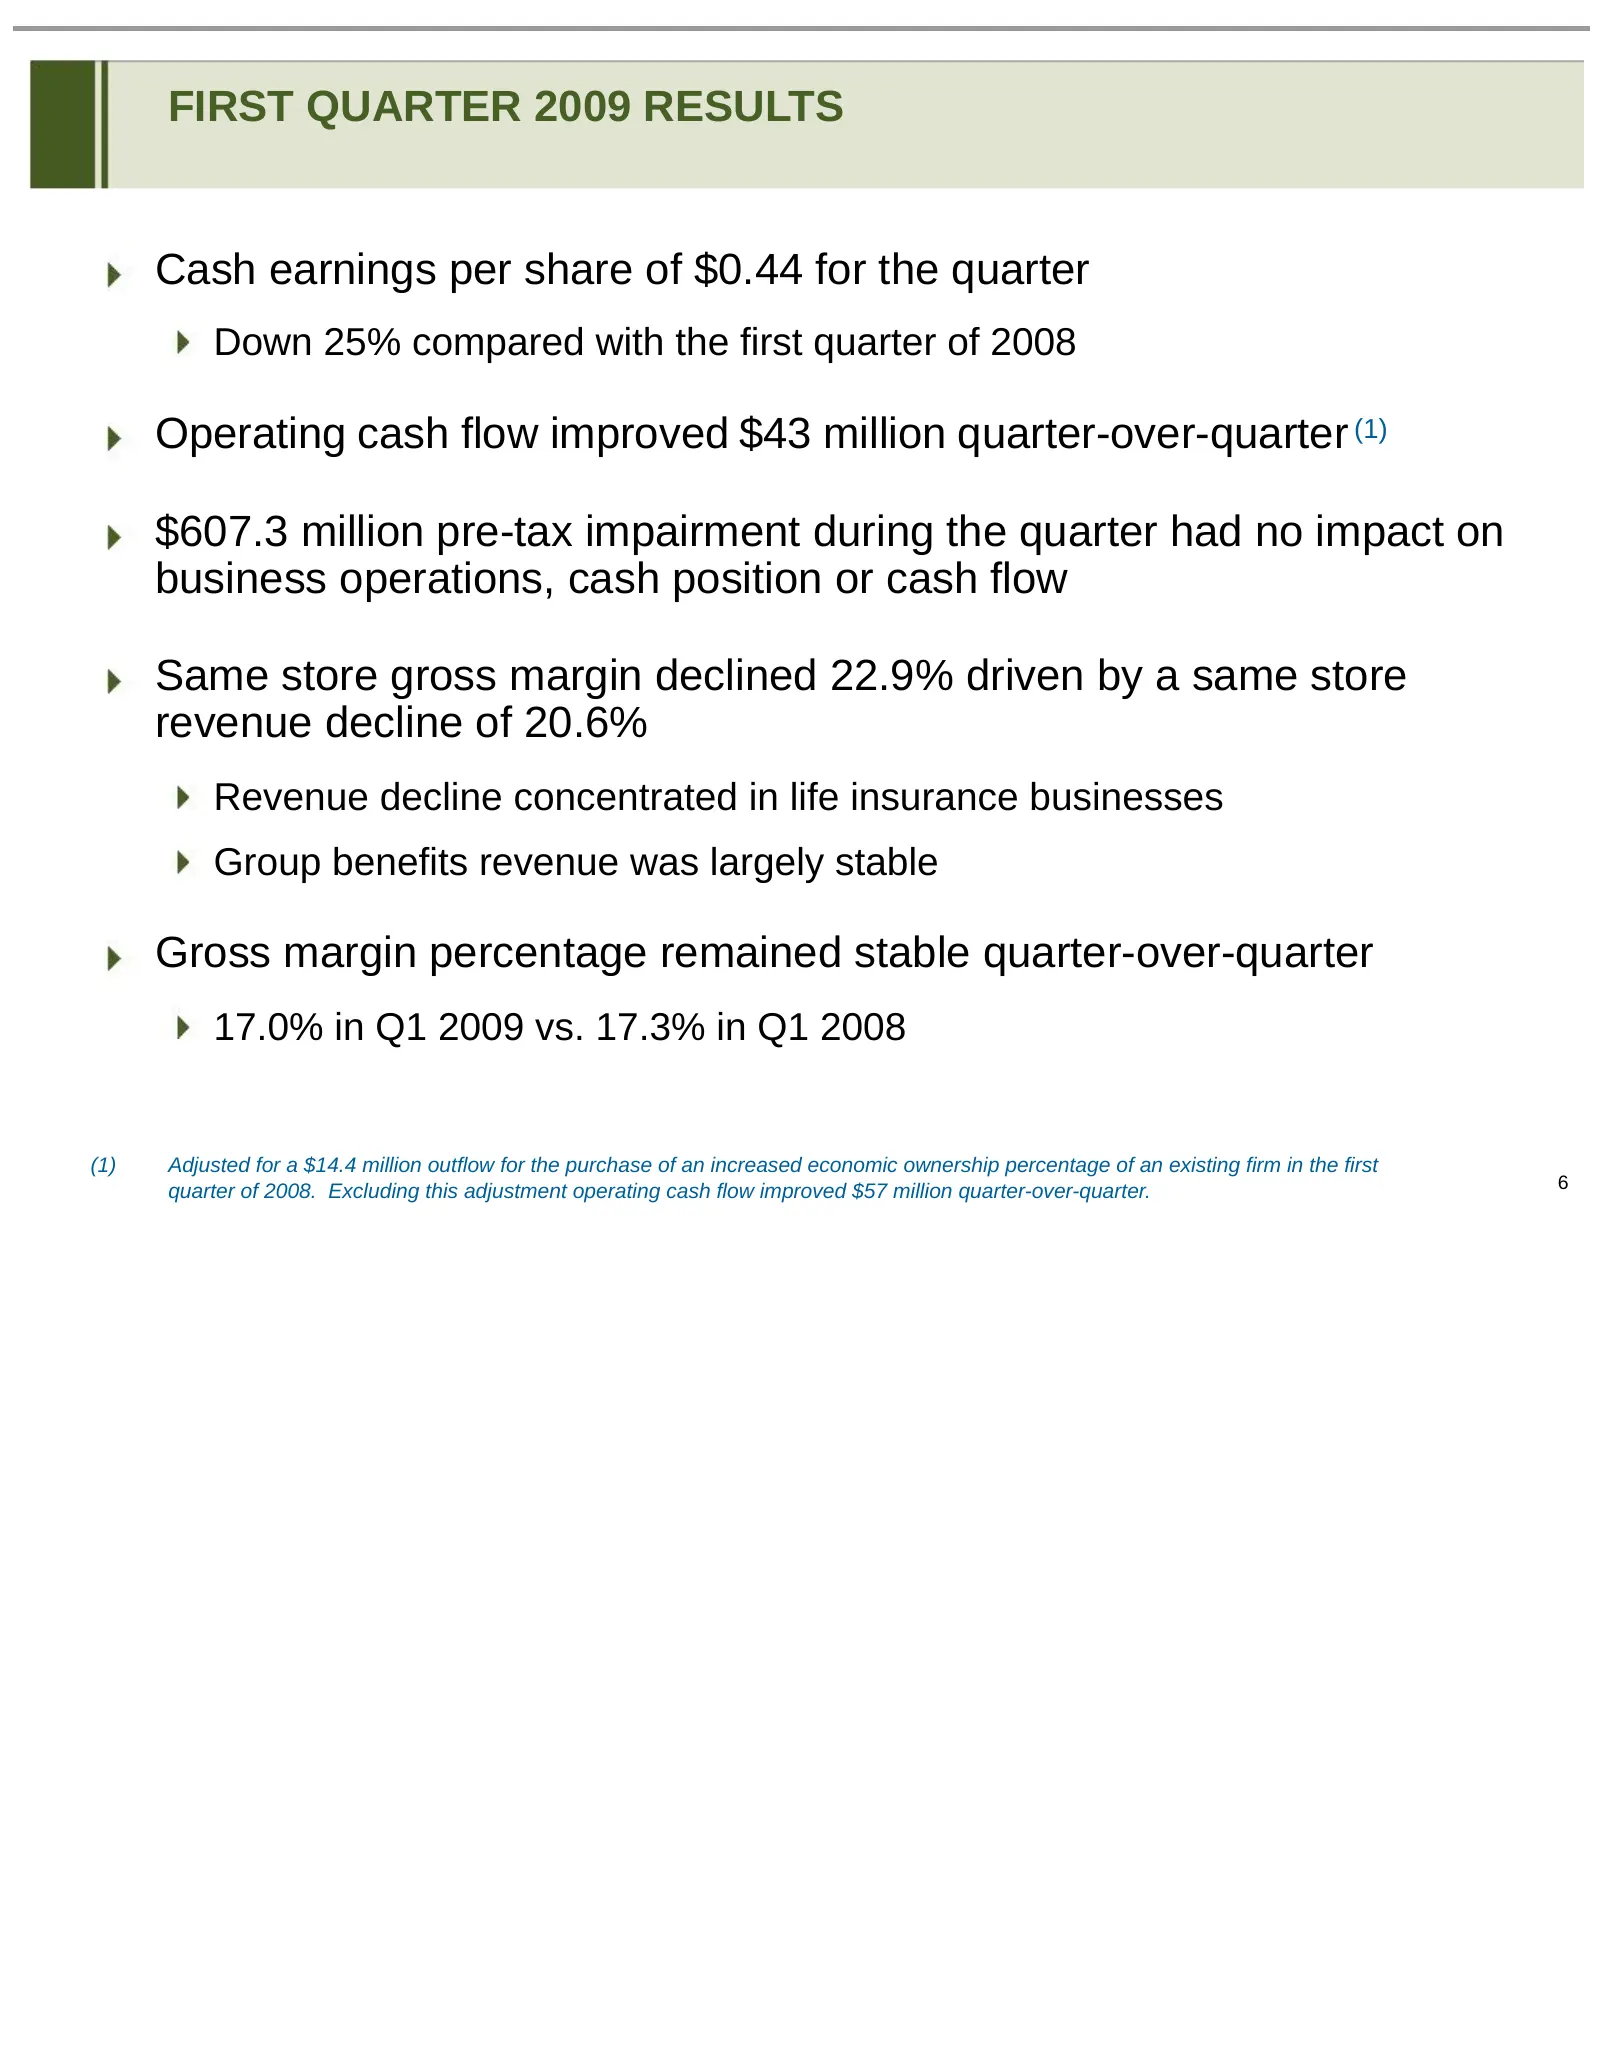
FIRST QUARTER 2009 RESULTS Cash earnings per share of $0.44 for the quarter Down 25% compared with the first quarter of 2008 Operating cash flow improved $43 million quarter-over-quarter (1) $607.3 million pre-tax impairment during the quarter had no impact on business operations, cash position or c
Slide 7: Executing on Key Objectives
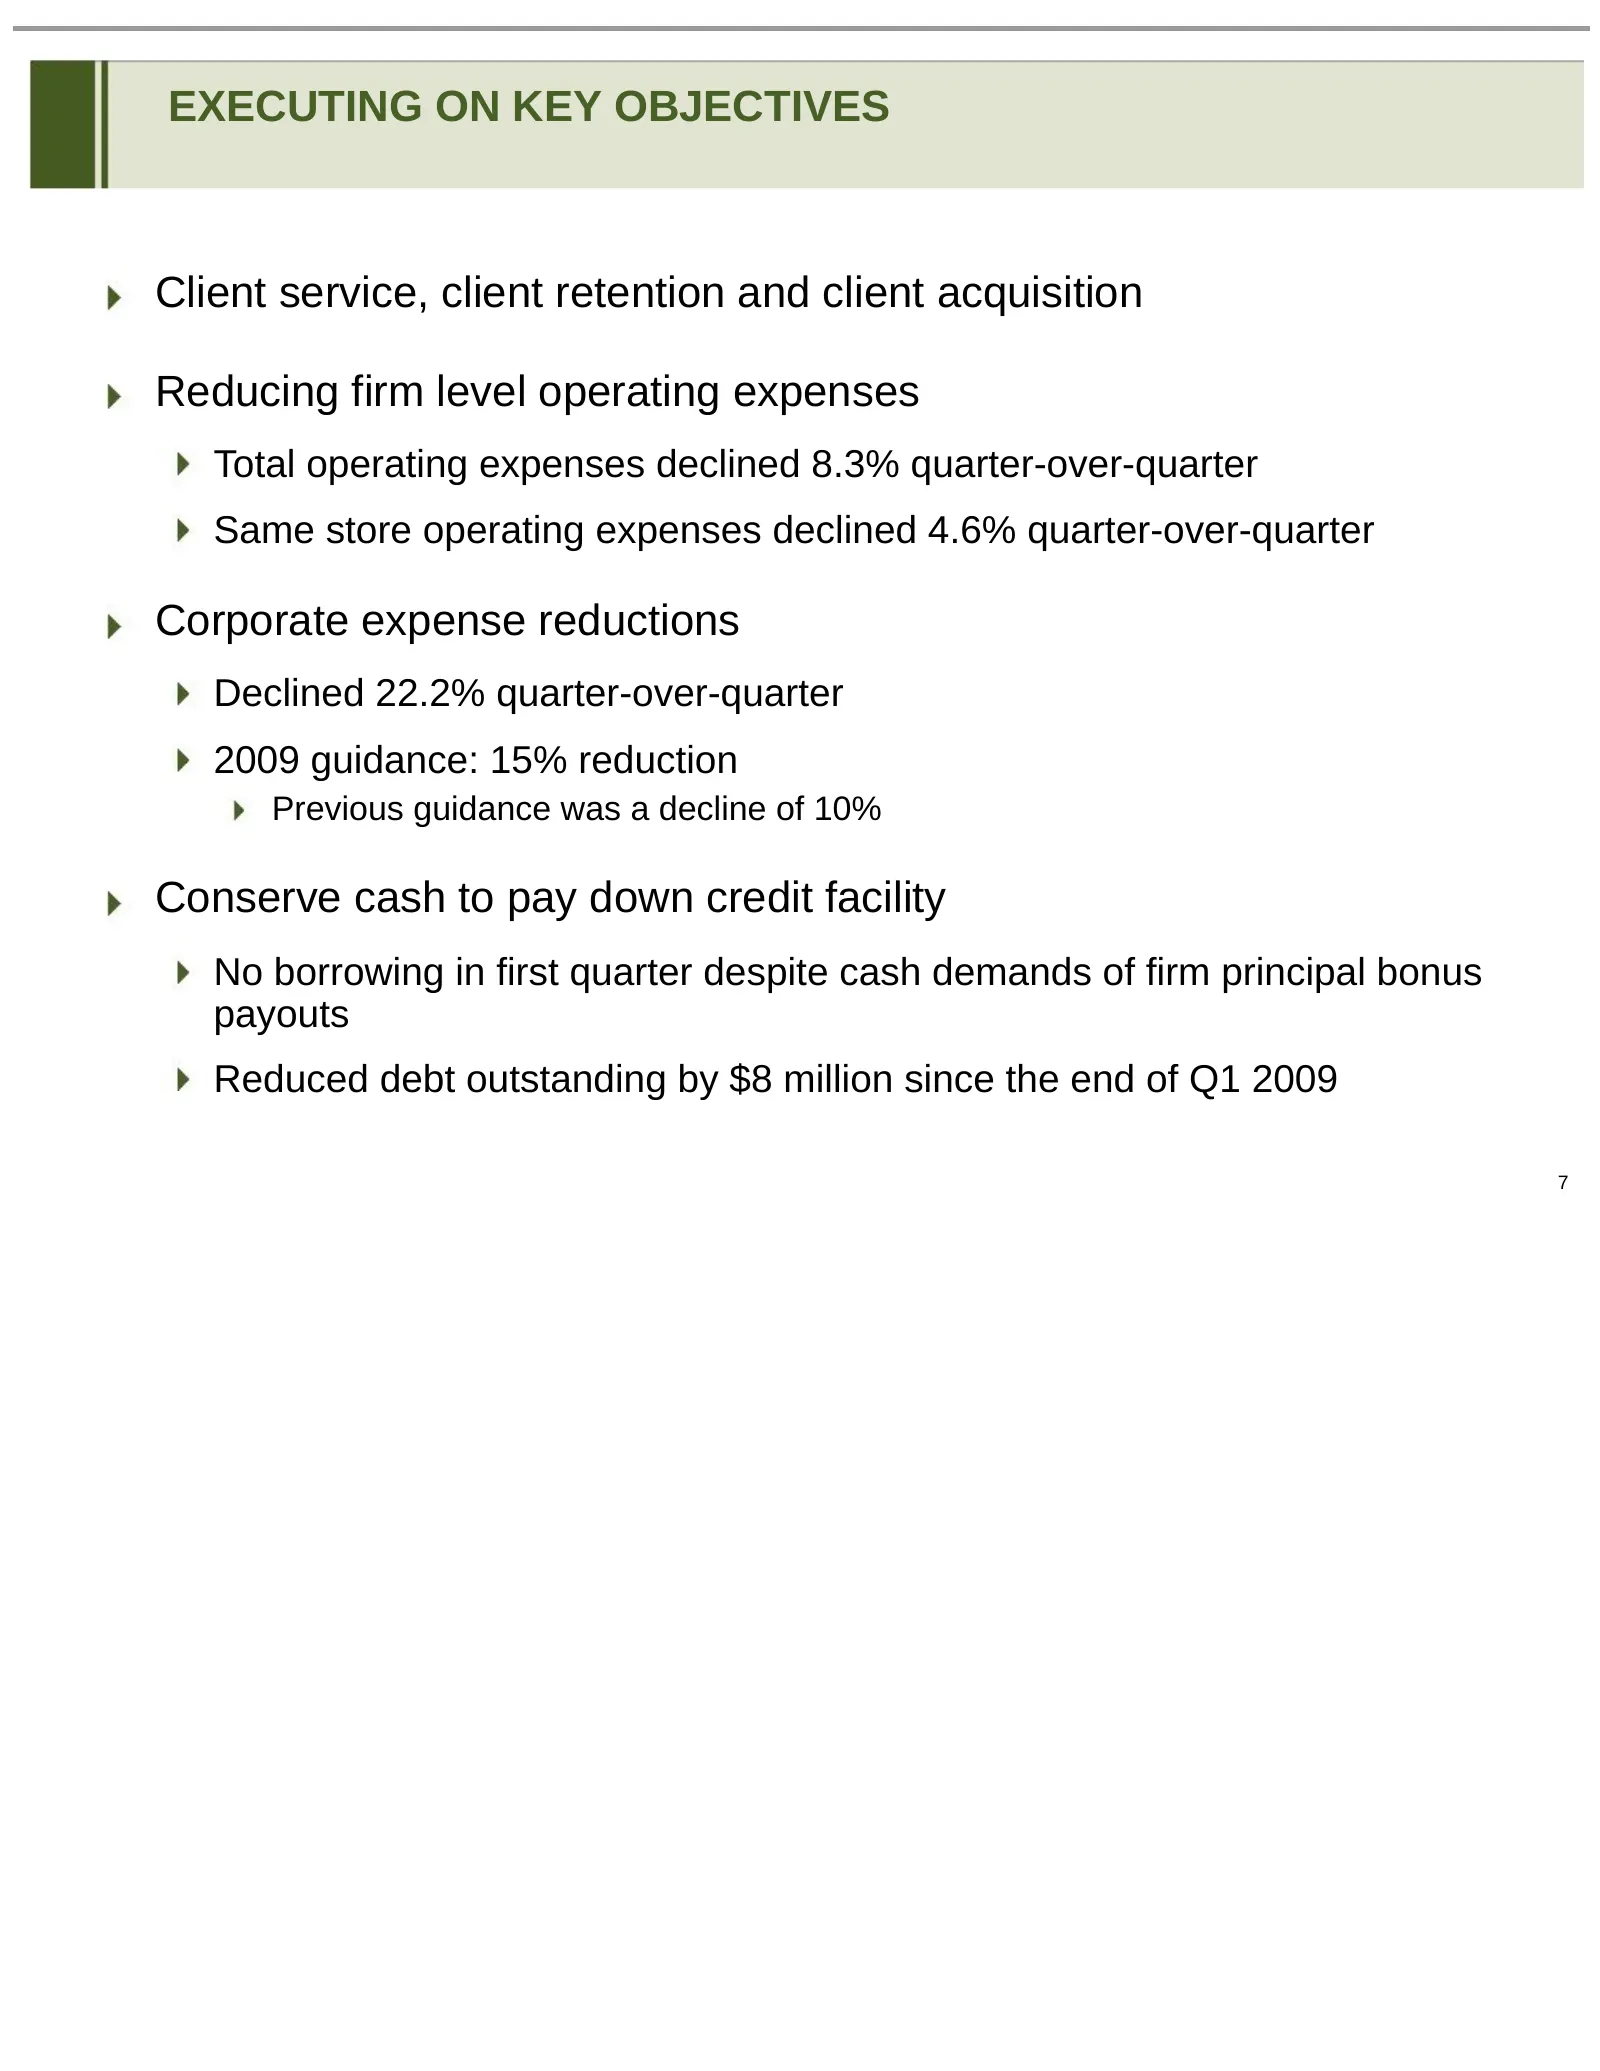
EXECUTING ON KEY OBJECTIVES Client service, client retention and client acquisition Reducing firm level operating expenses Total operating expenses declined 8.3% quarter-over-quarter Same store operating expenses declined 4.6% quarter-over-quarter Corporate expense reductions Declined 22.2% quarter-
Slide 8: Firm Performance Relative to Base & Target
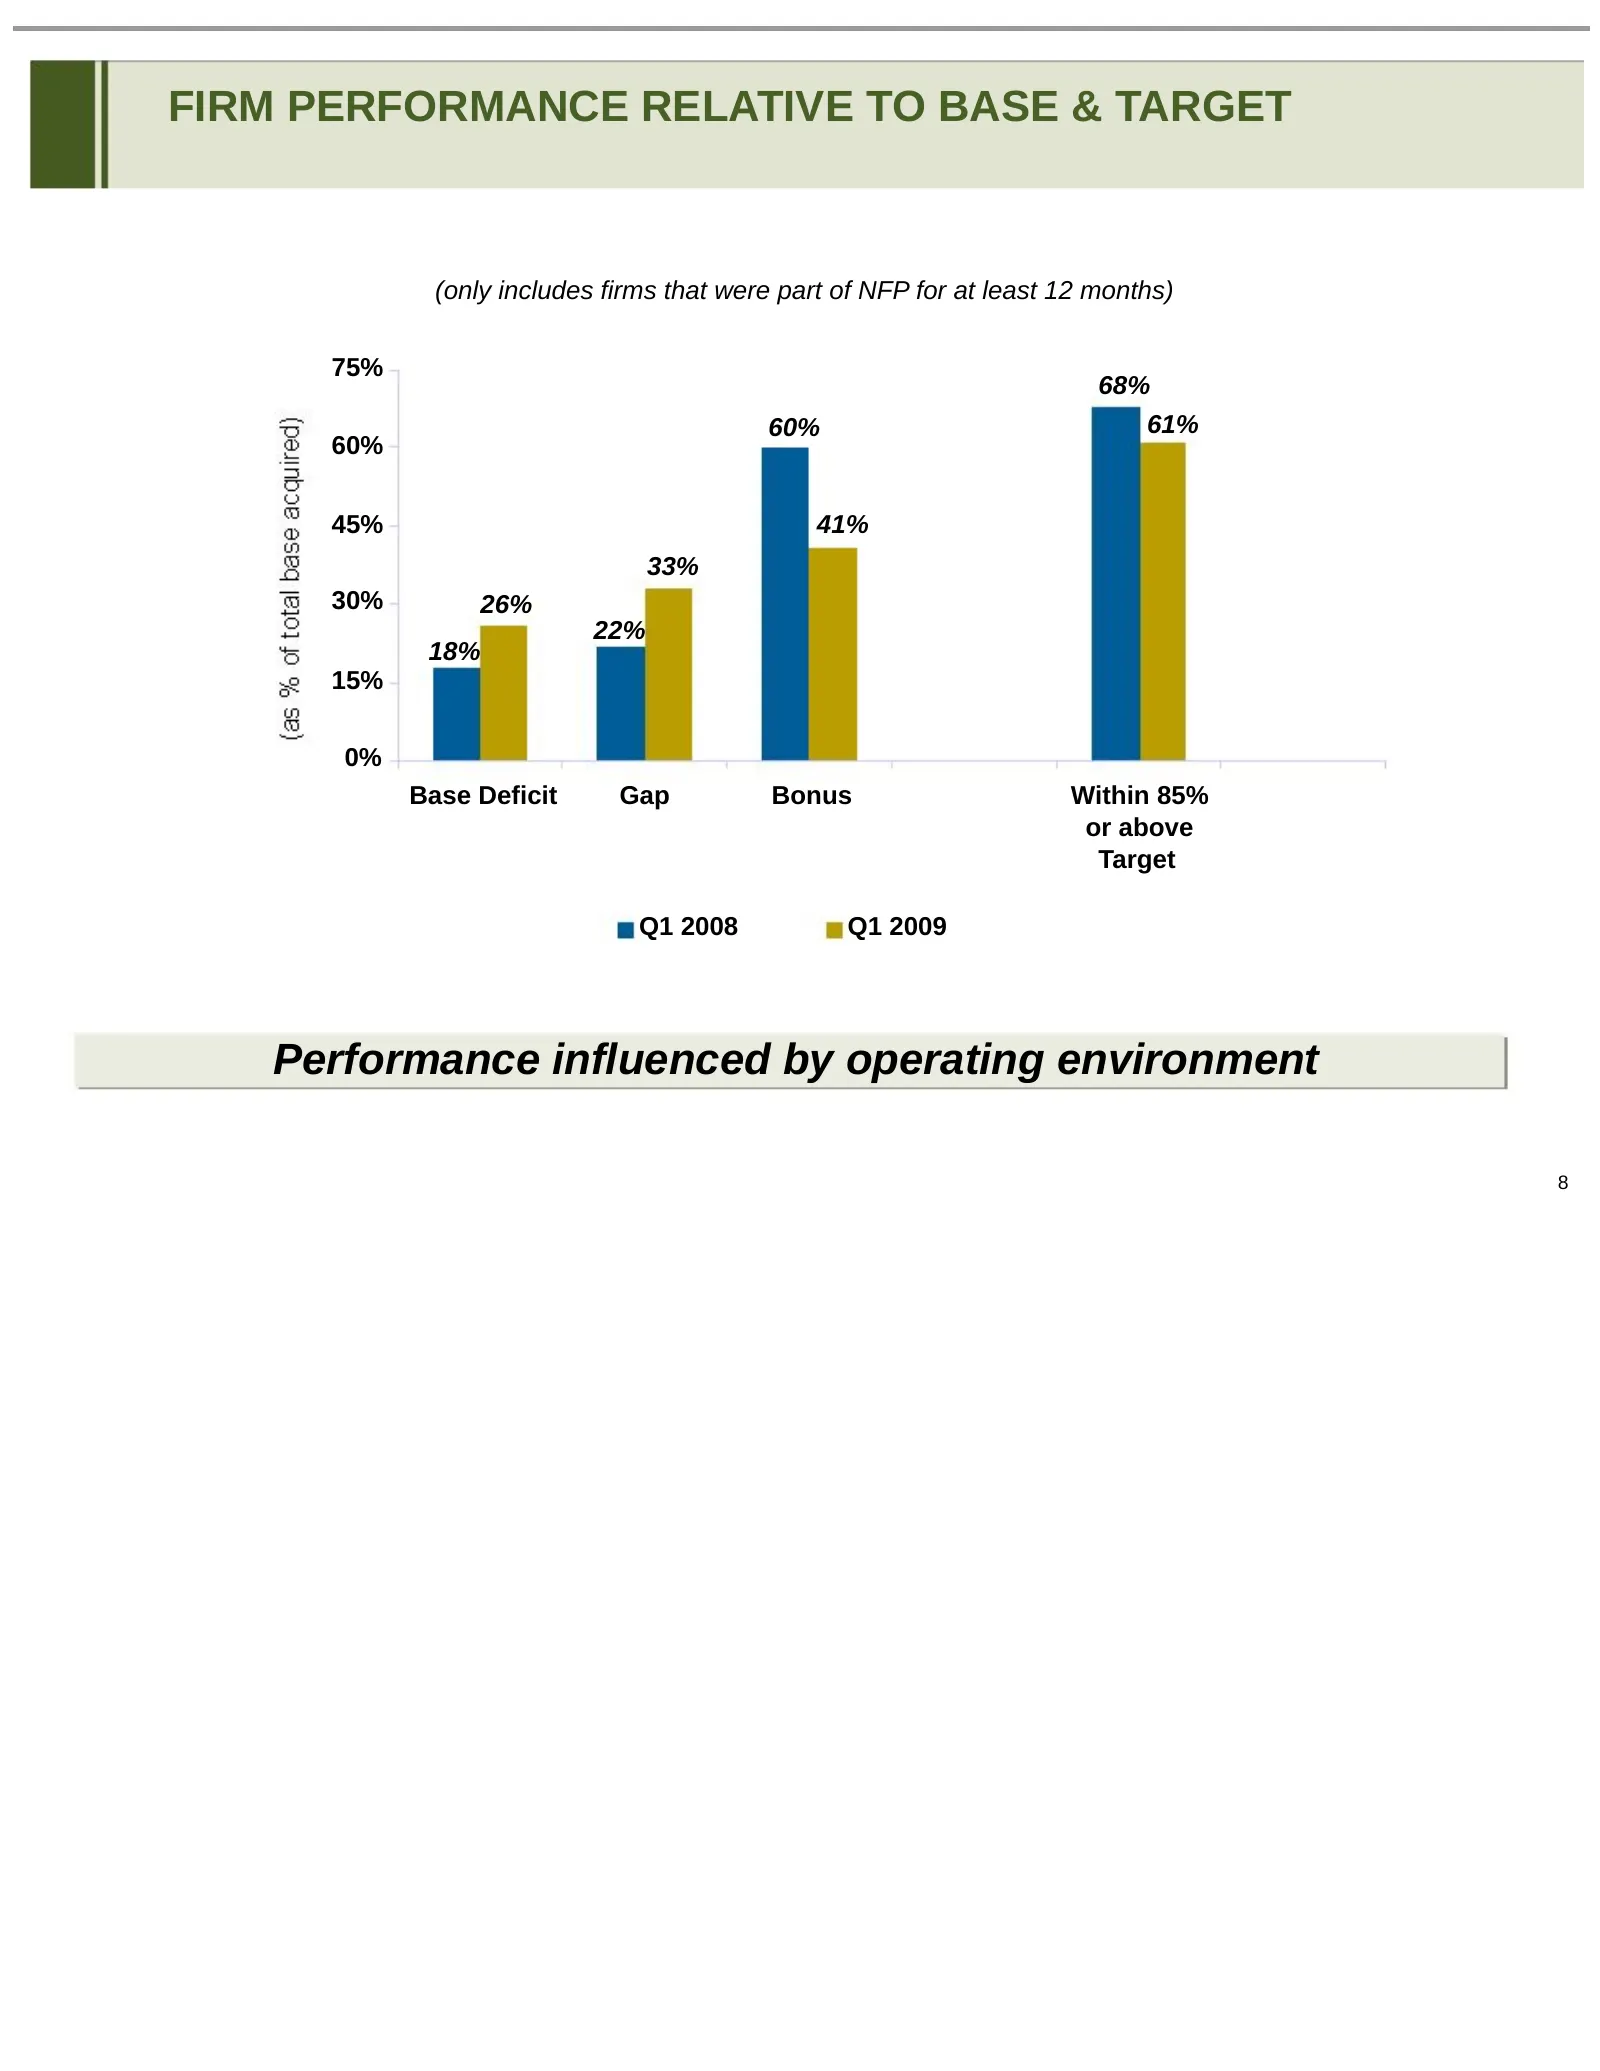
FIRM PERFORMANCE RELATIVE TO BASE & TARGET (only includes firms that were part of NFP for at least 12 months) 75% 68% 60% 61% 60% 45% 41% 33% 30% 26% 22% 18% 15% 0% Base Deficit Gap Bonus Within 85% or above Target Q1 2008 Q1 2009 Performance influenced by operating environment 8
Slide 9: Short-Term: Challenges, Long-Term: Growth
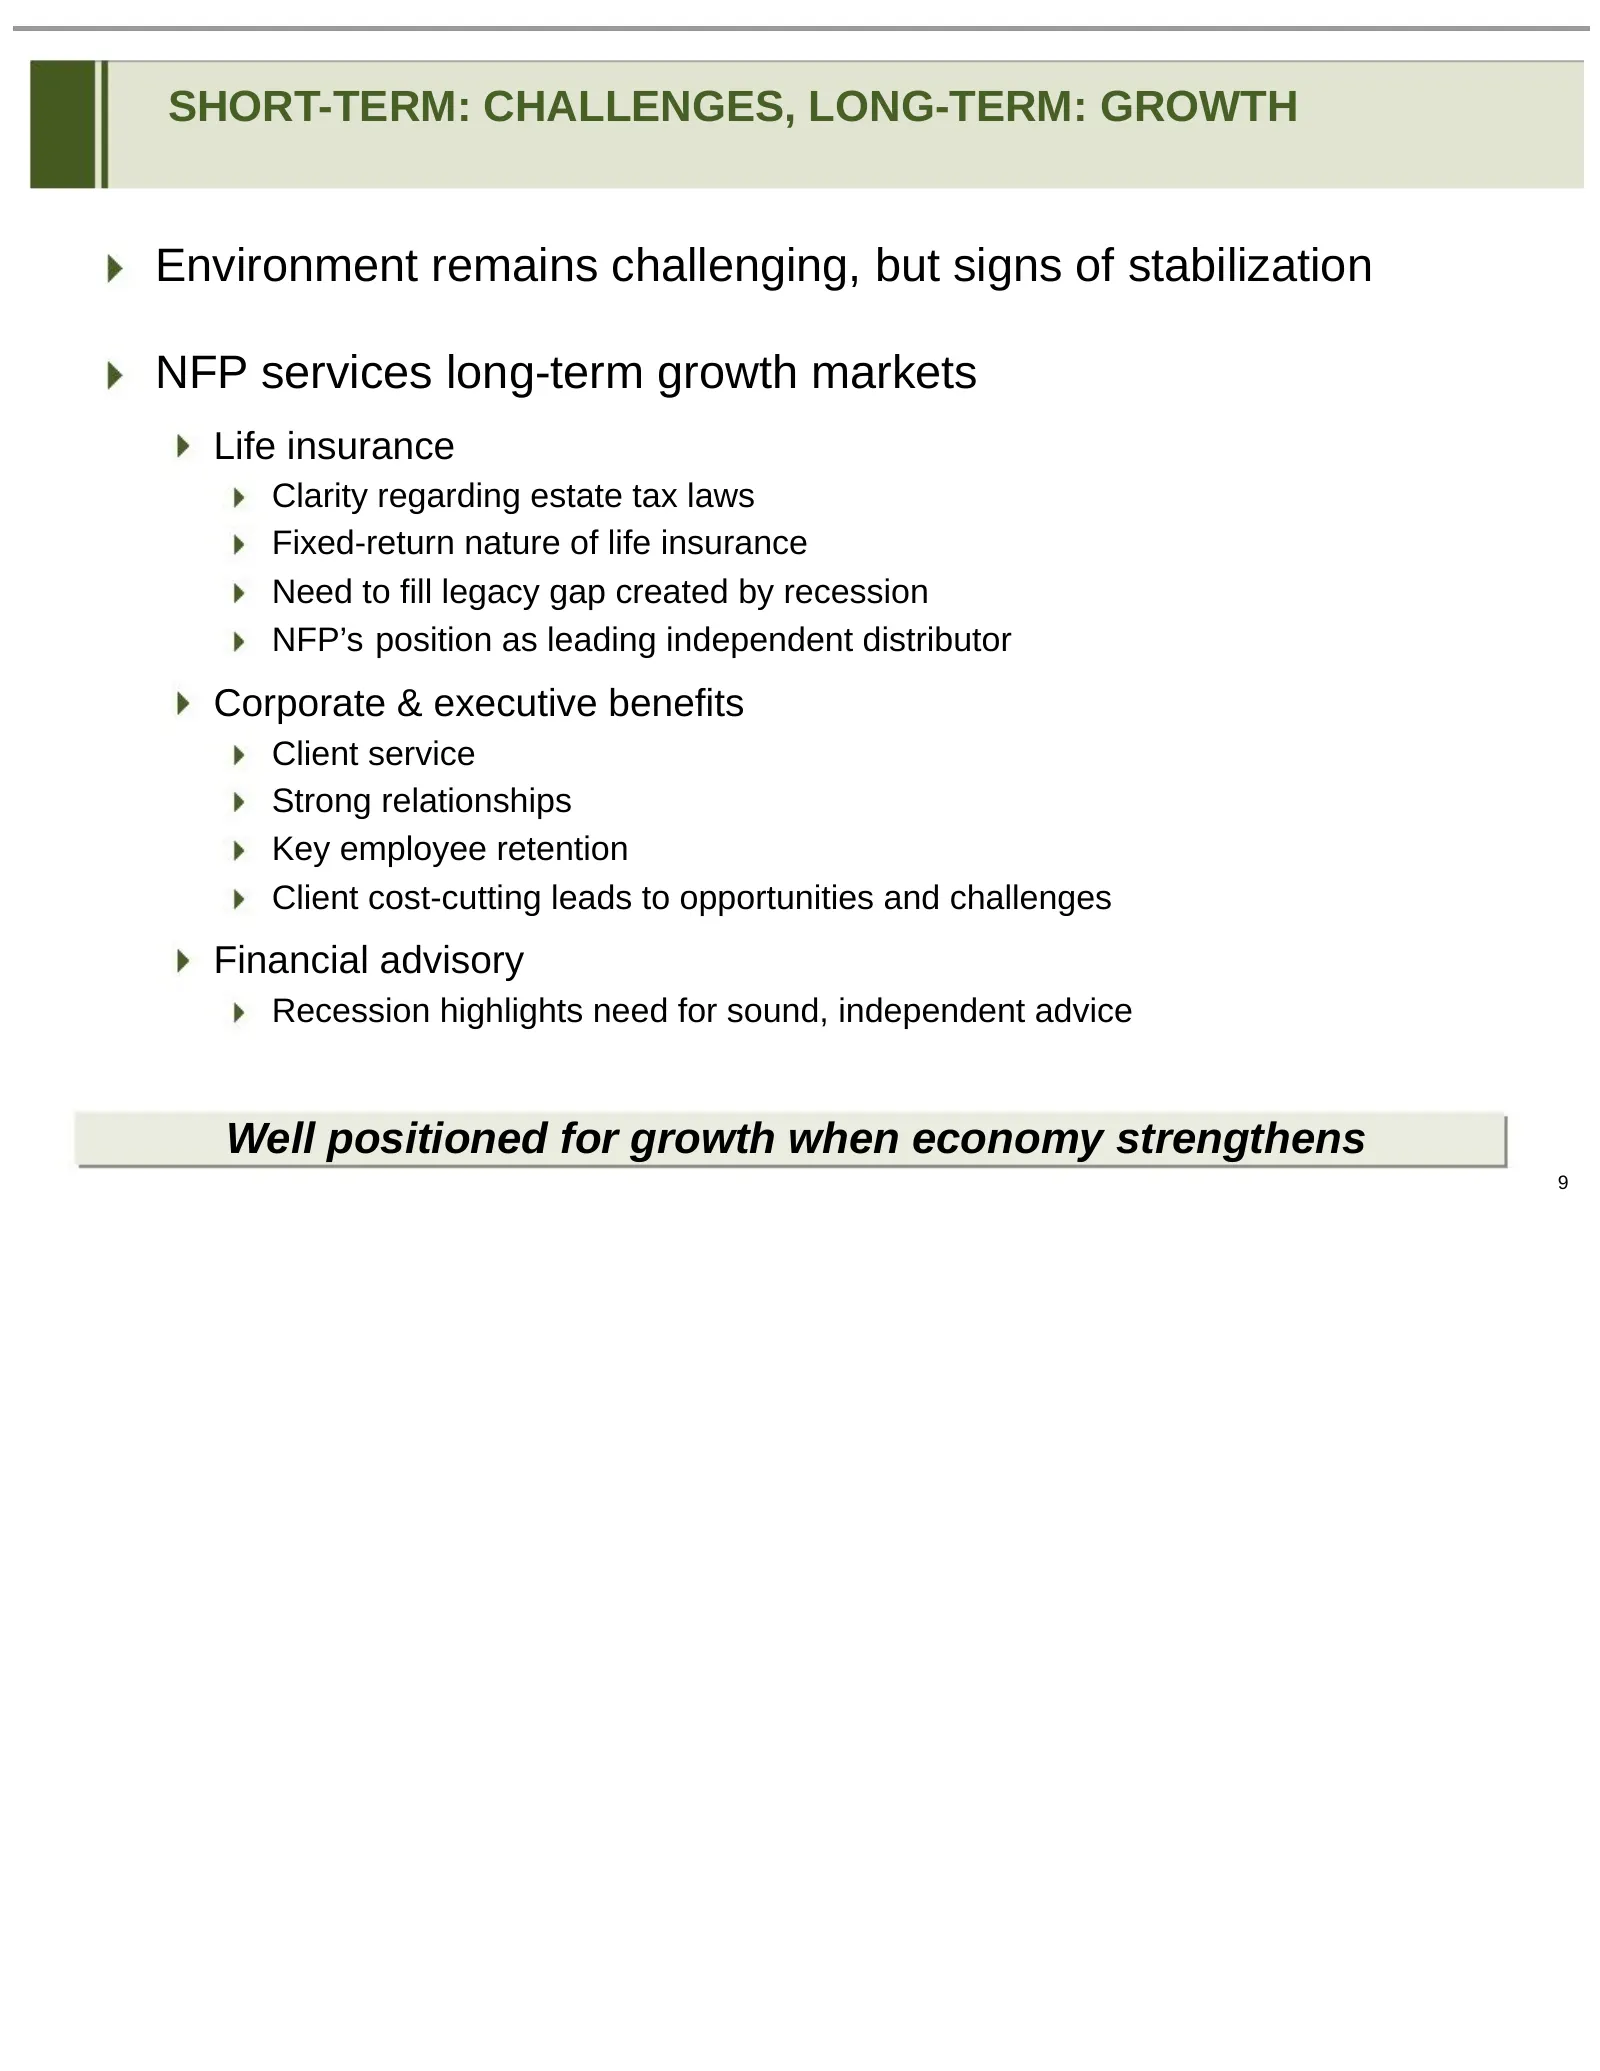
SHORT-TERM: CHALLENGES, LONG-TERM: GROWTH Environment remains challenging, but signs of stabilization NFP services long-term growth markets Life insurance Clarity regarding estate tax laws Fixed-return nature of life insurance Need to fill legacy gap created by recession NFP’s position as leading in
Slide 10: NFP: First Quarter Earnings Conference Call - Donna Blank
NFP: FIRST QUARTER EARNINGS CONFERENCE CALL DONNA BLANK Executive Vice President and Chief Financial Officer 10
Slide 11: Cash Flow & Credit Facility
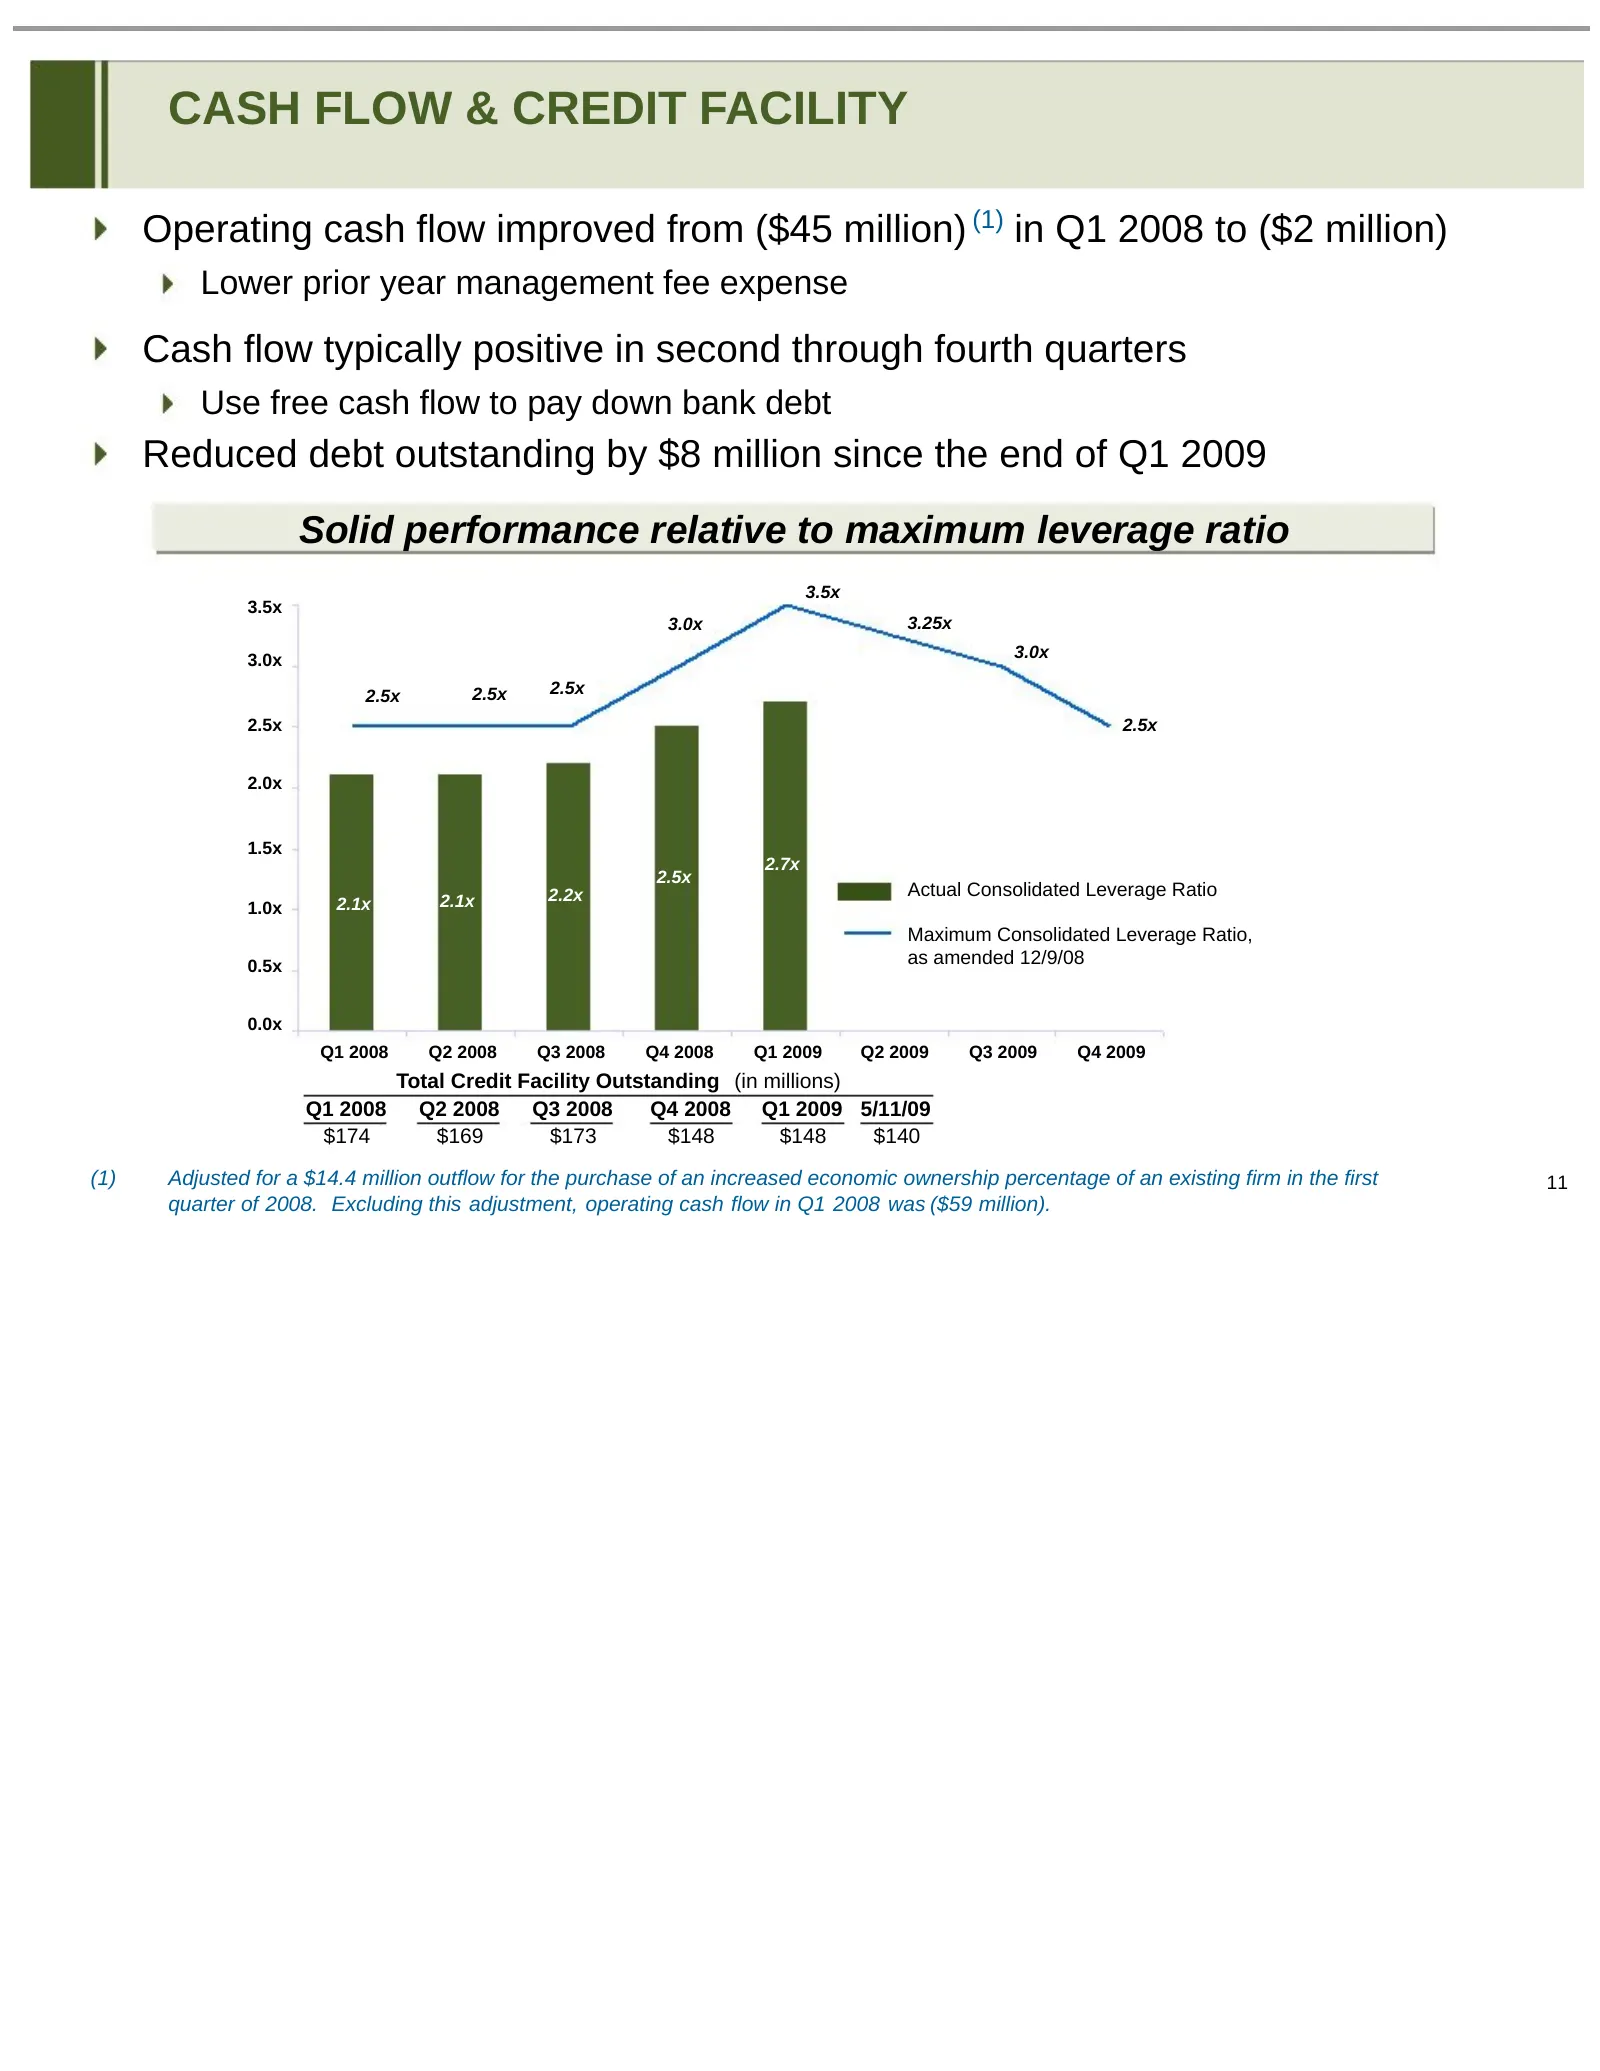
CASH FLOW & CREDIT FACILITY Operating cash flow improved from ($45 million) (1) in Q1 2008 to ($2 million) Lower prior year management fee expense Cash flow typically positive in second through fourth quarters Use free cash flow to pay down bank debt Reduced debt outstanding by $8 million since the
Slide 12: Same Store Revenue Decline Highly Concentrated in Life Insurance Businesses
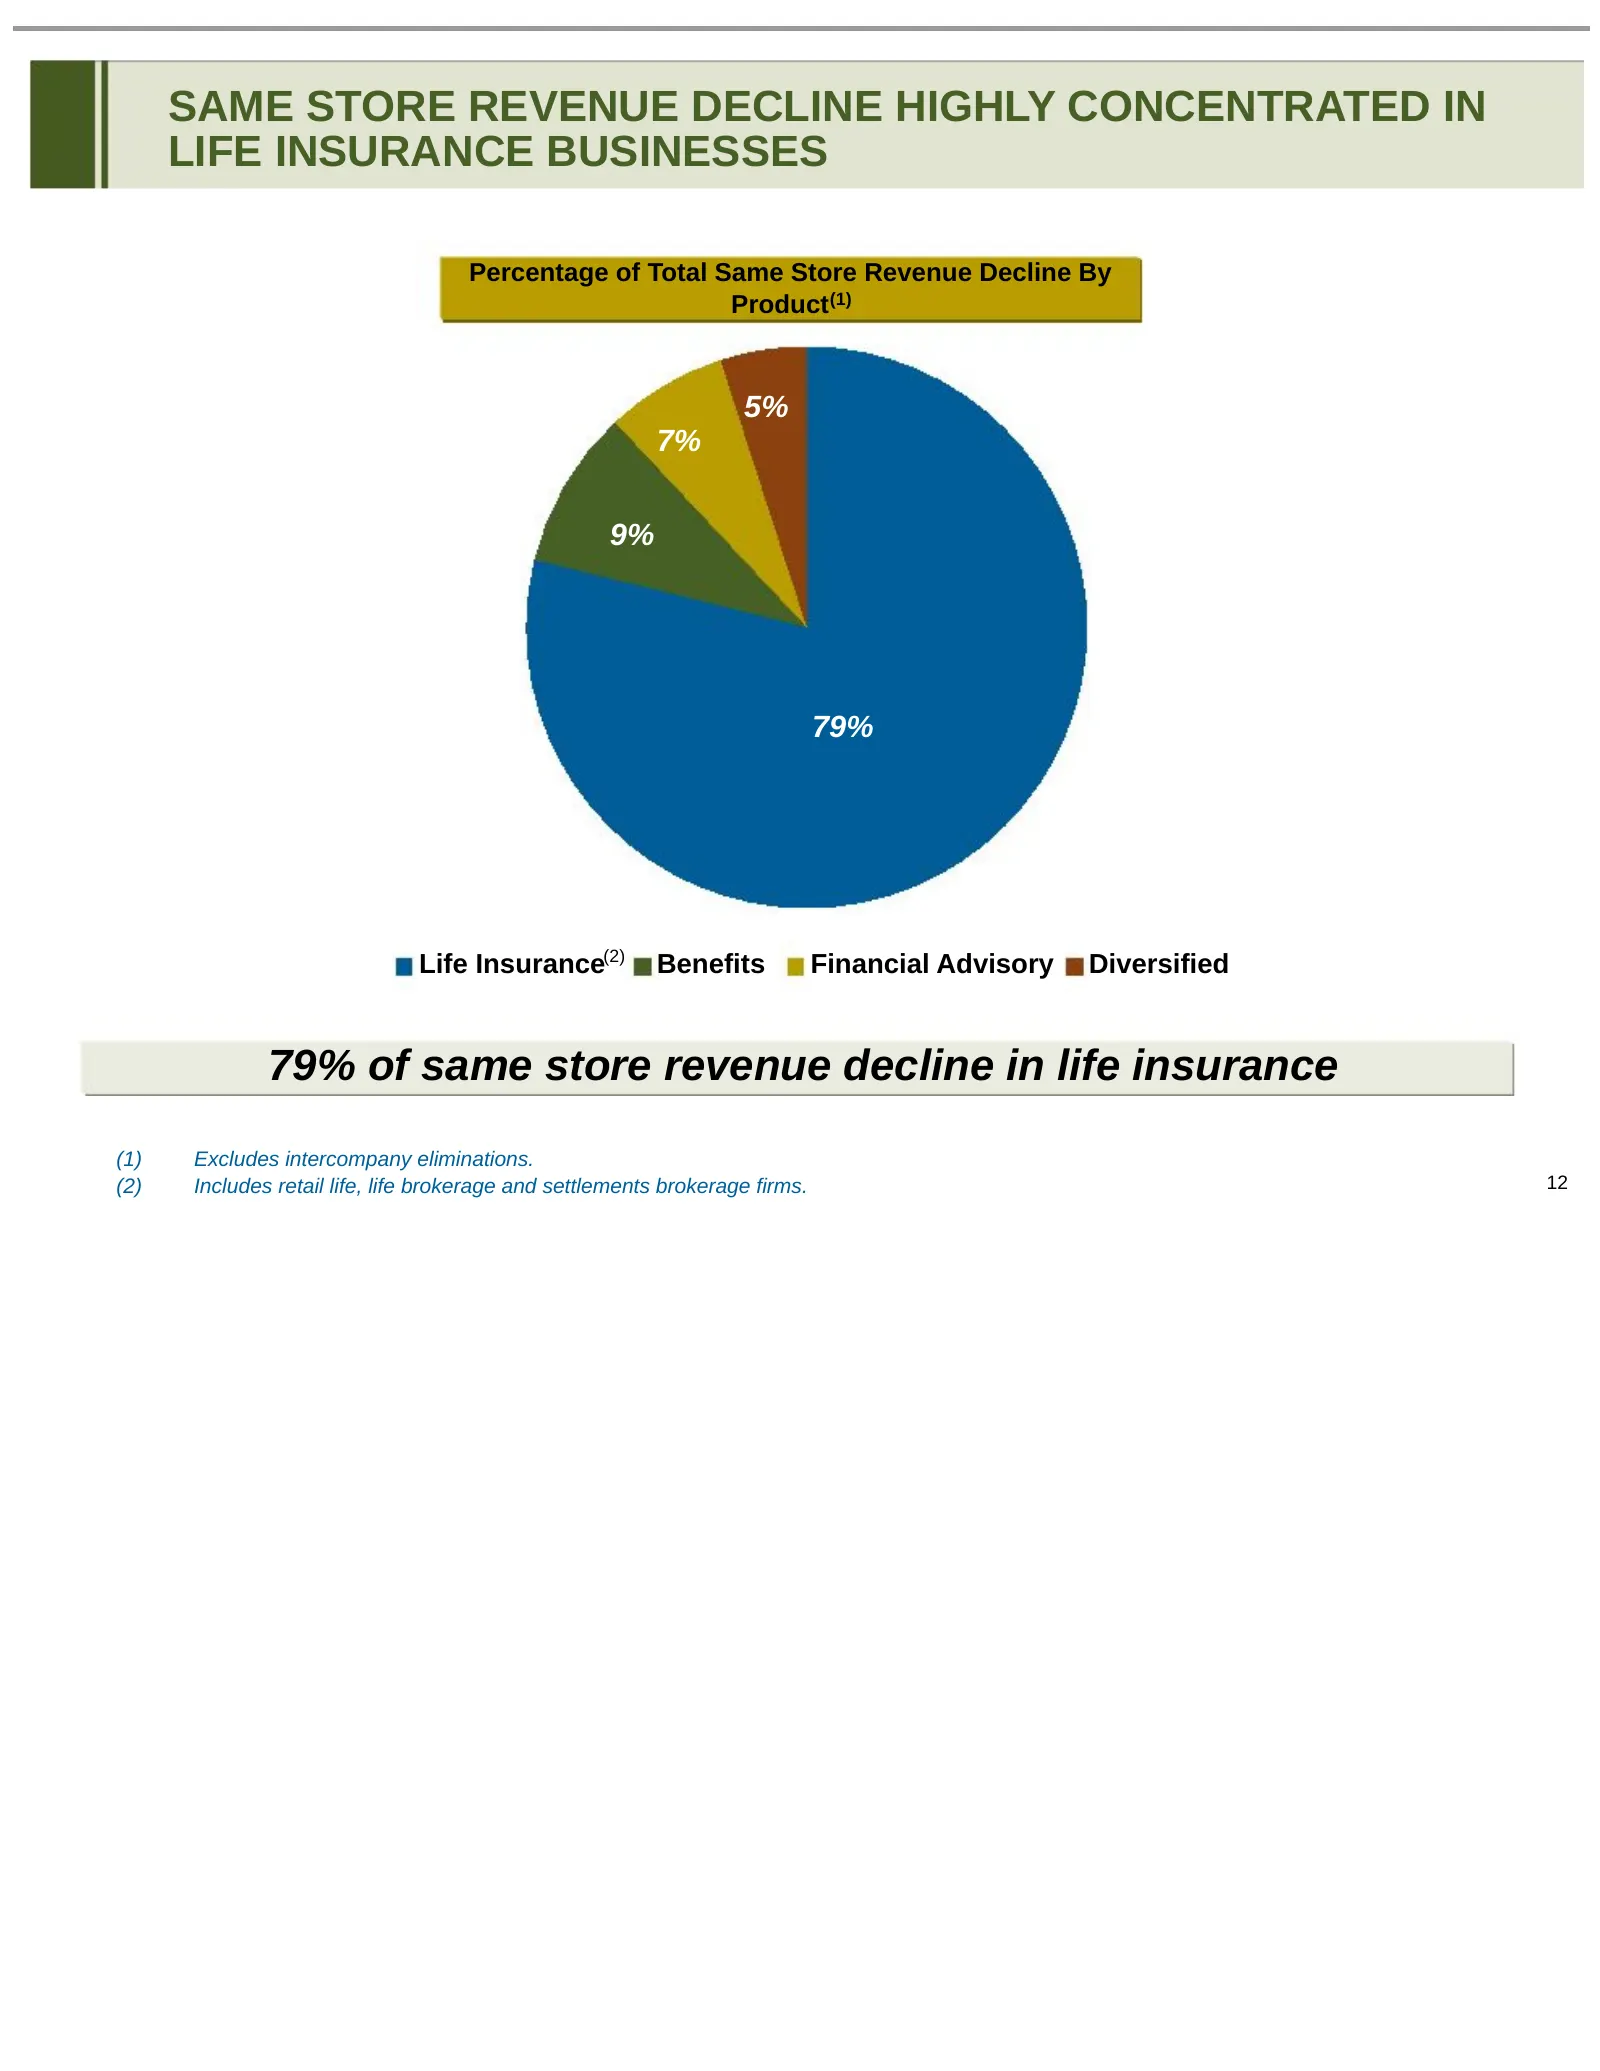
SAME STORE REVENUE DECLINE HIGHLY CONCENTRATED IN LIFE INSURANCE BUSINESSES Percentage of Total Same Store Revenue Decline By Product (1) 5% 7% 9% 79% Life Insurance(2) Benefits Financial Advisory Diversified 79% of same store revenue decline in life insurance (1) Excludes intercompany eliminations.
Slide 13: Stable Gross Margin Percentage
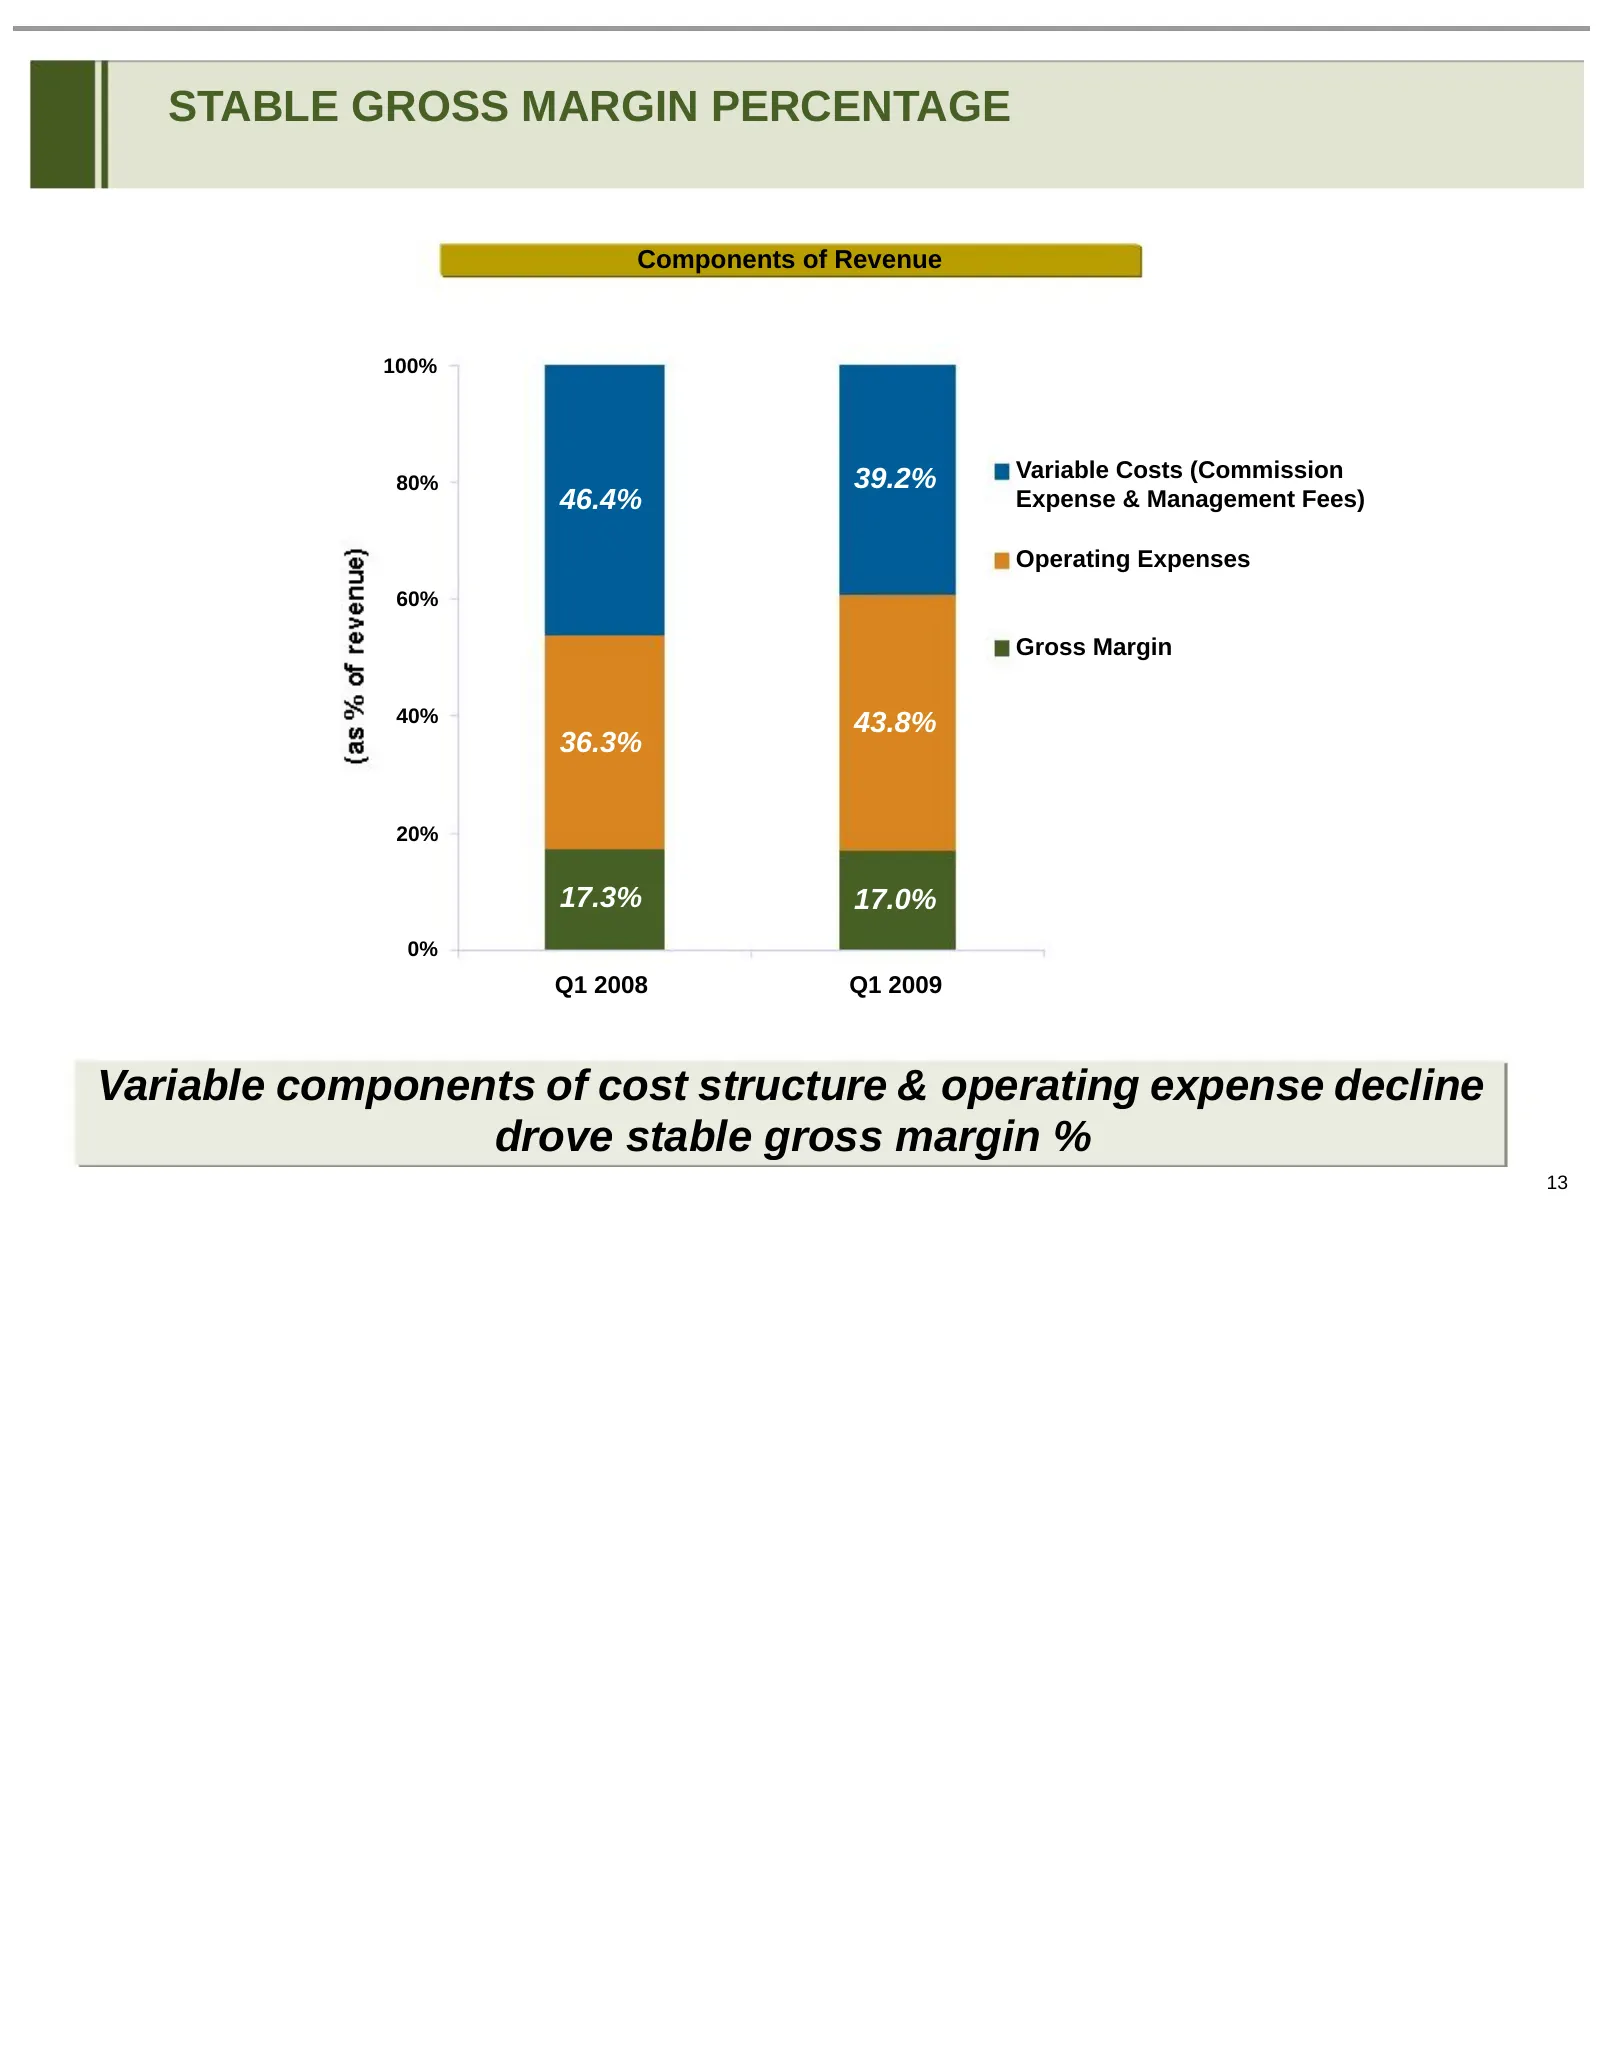
STABLE GROSS MARGIN PERCENTAGE Components of Revenue 100% 80% 39.2% Variable Costs (Commission 46.4% Expense & Management Fees) Operating Expenses 60% Gross Margin 40% 43.8% 36.3% 20% 17.3% 17.0% 0% Q1 2008 Q1 2009 Variable components of cost structure & operating expense decline drove stable gross
Slide 14: Other Financial Performance Highlights
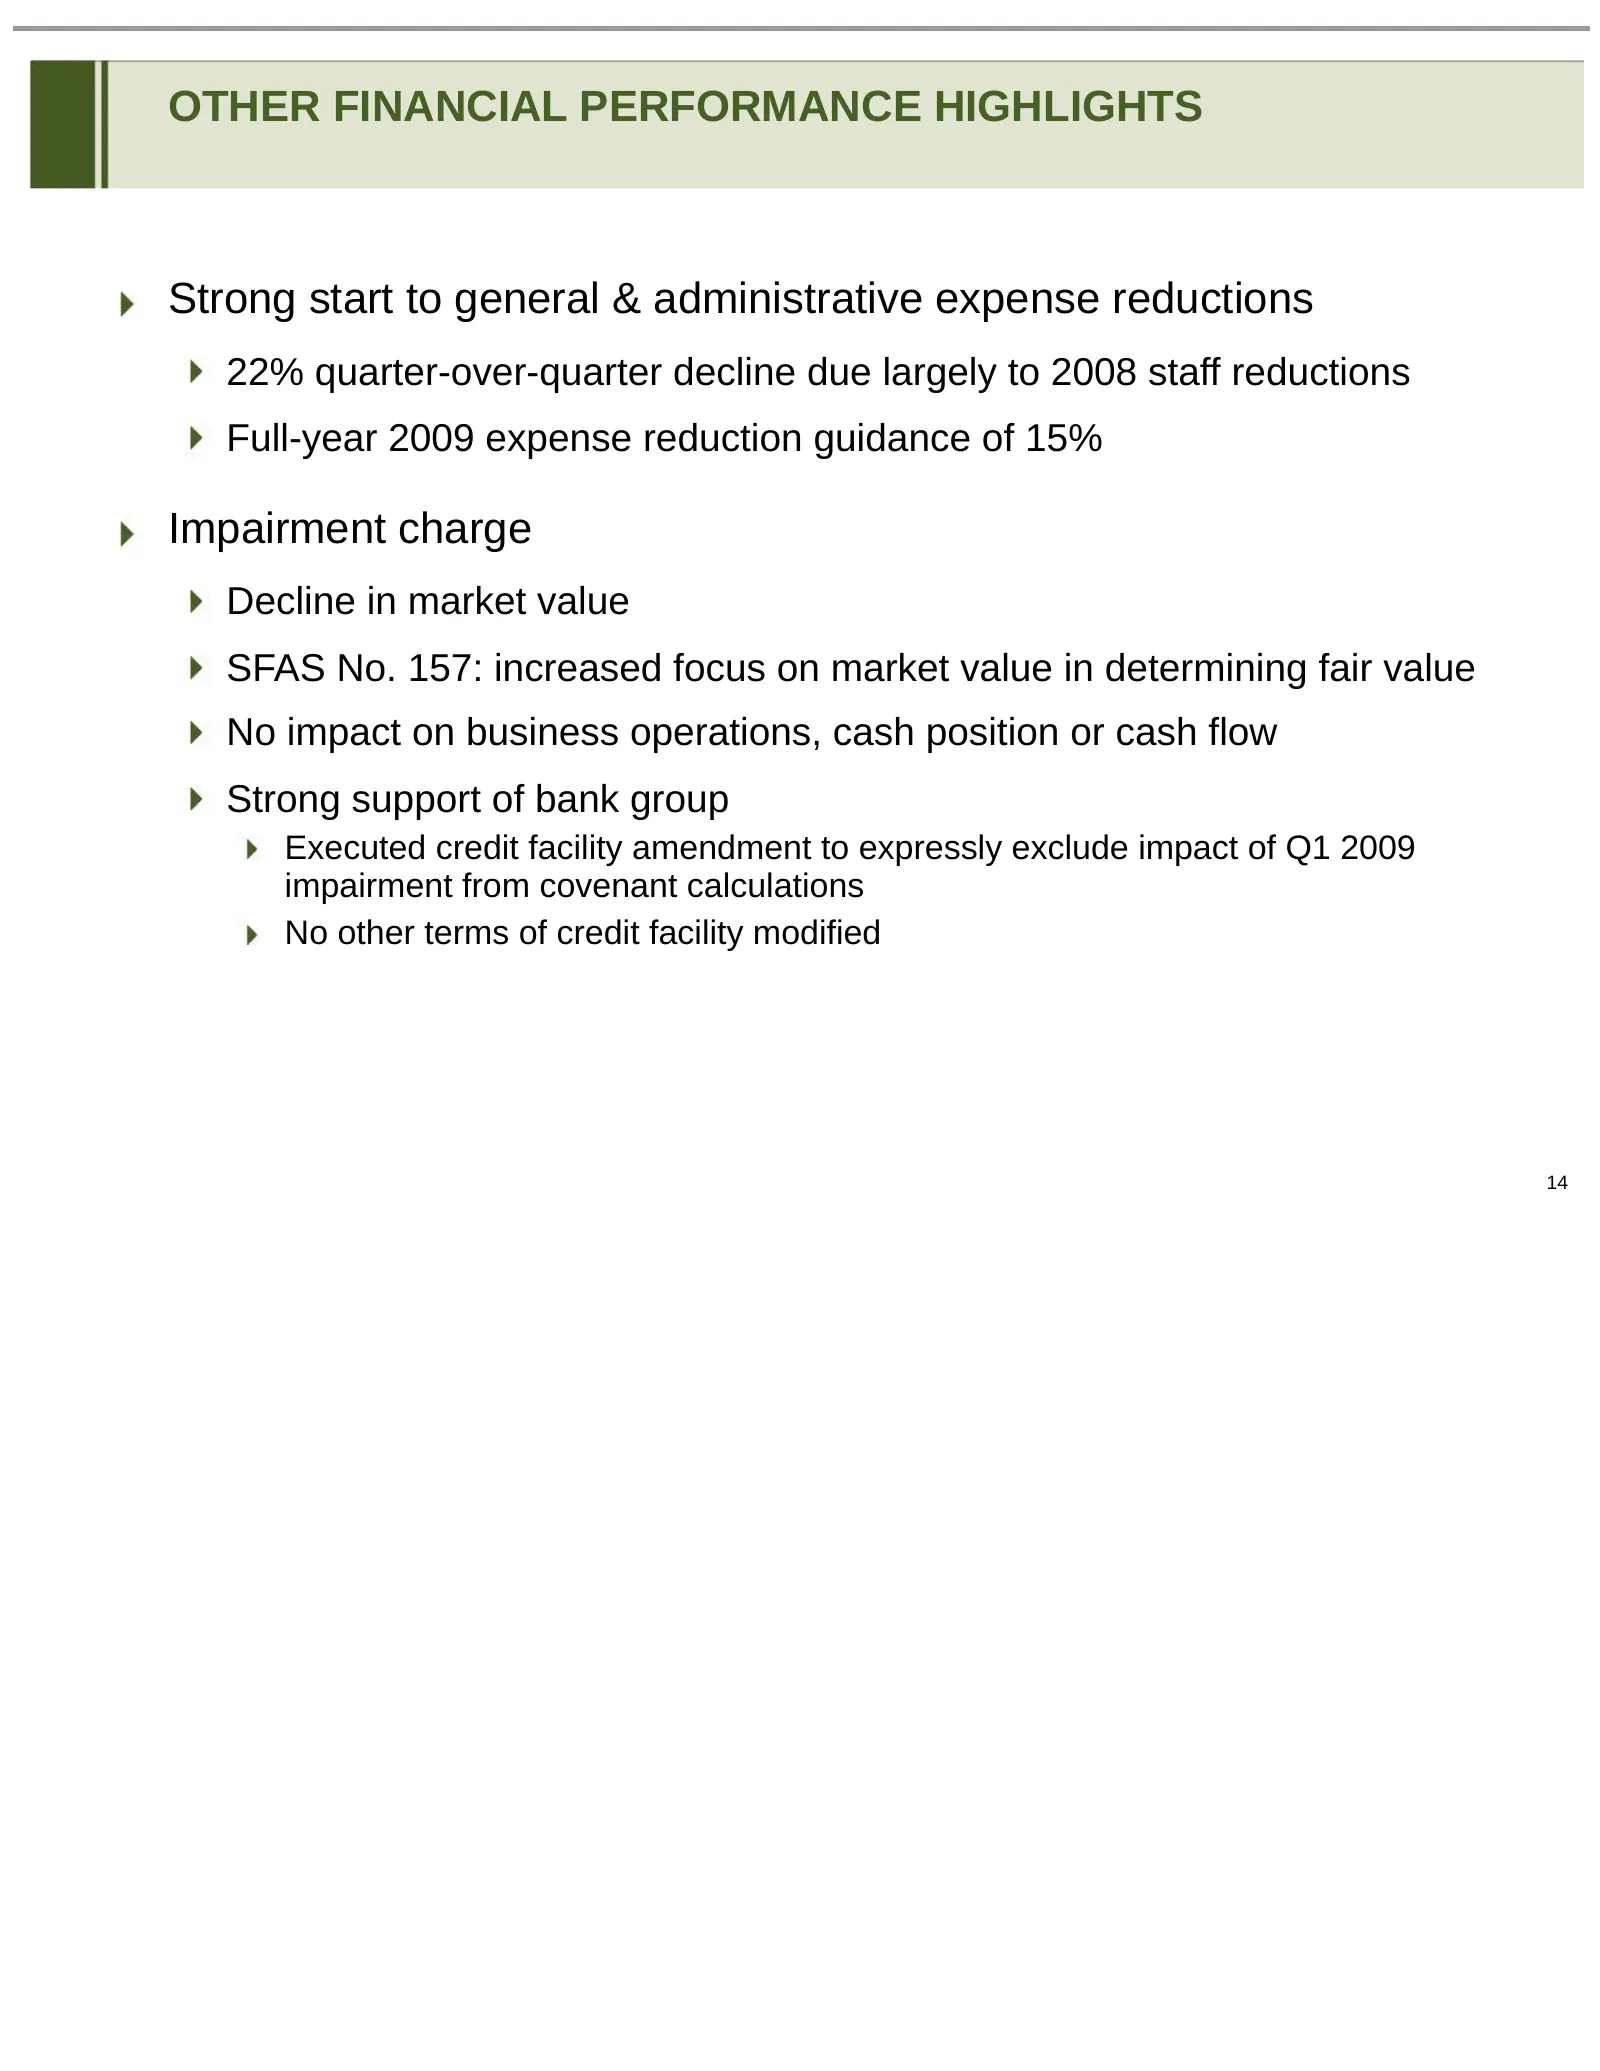
OTHER FINANCIAL PERFORMANCE HIGHLIGHTS Strong start to general & administrative expense reductions 22% quarter-over-quarter decline due largely to 2008 staff reductions Full-year 2009 expense reduction guidance of 15% Impairment charge Decline in market value SFAS No. 157: increased focus on market
Slide 15: Other Financial Performance Highlights: Taxes
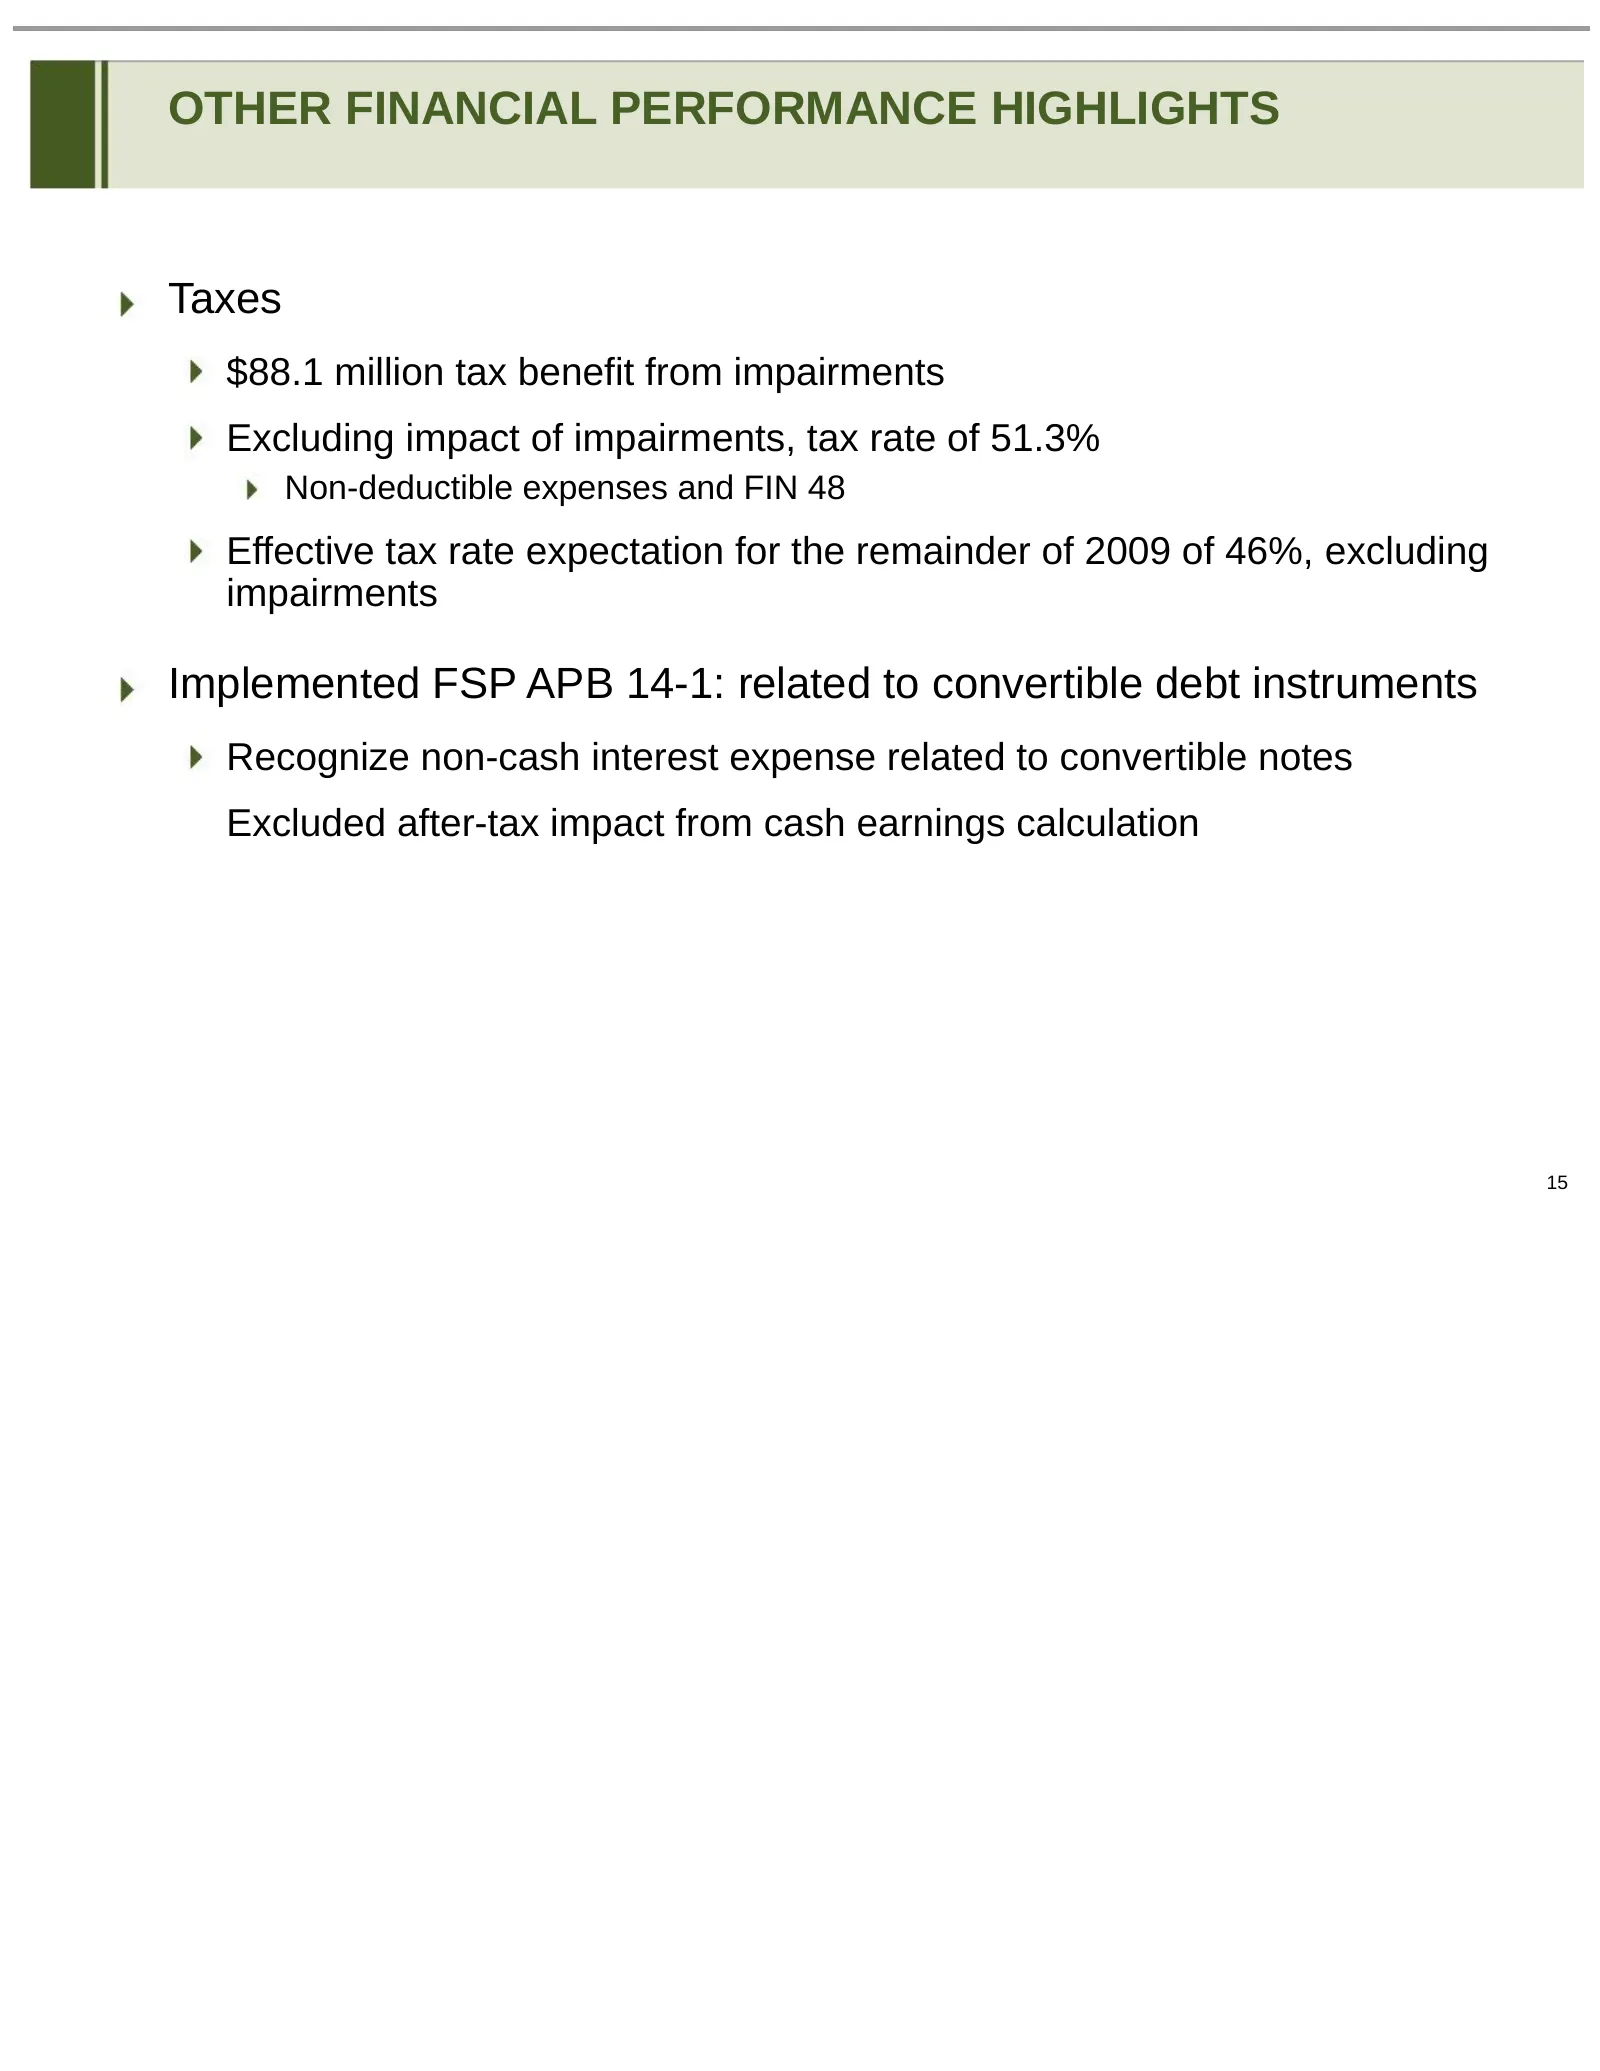
OTHER FINANCIAL PERFORMANCE HIGHLIGHTS Taxes $88.1 million tax benefit from impairments Excluding impact of impairments, tax rate of 51.3% Non-deductible expenses and FIN 48 Effective tax rate expectation for the remainder of 2009 of 46%, excluding impairments Implemented FSP APB 14-1: related to co
Slide 16: NFP: First Quarter Earnings Conference Call - Doug Hammond
NFP: FIRST QUARTER EARNINGS CONFERENCE CALL DOUG HAMMOND Executive Vice President and Chief Operating Officer 16
Slide 17: Strong Progress in Reducing Expenses
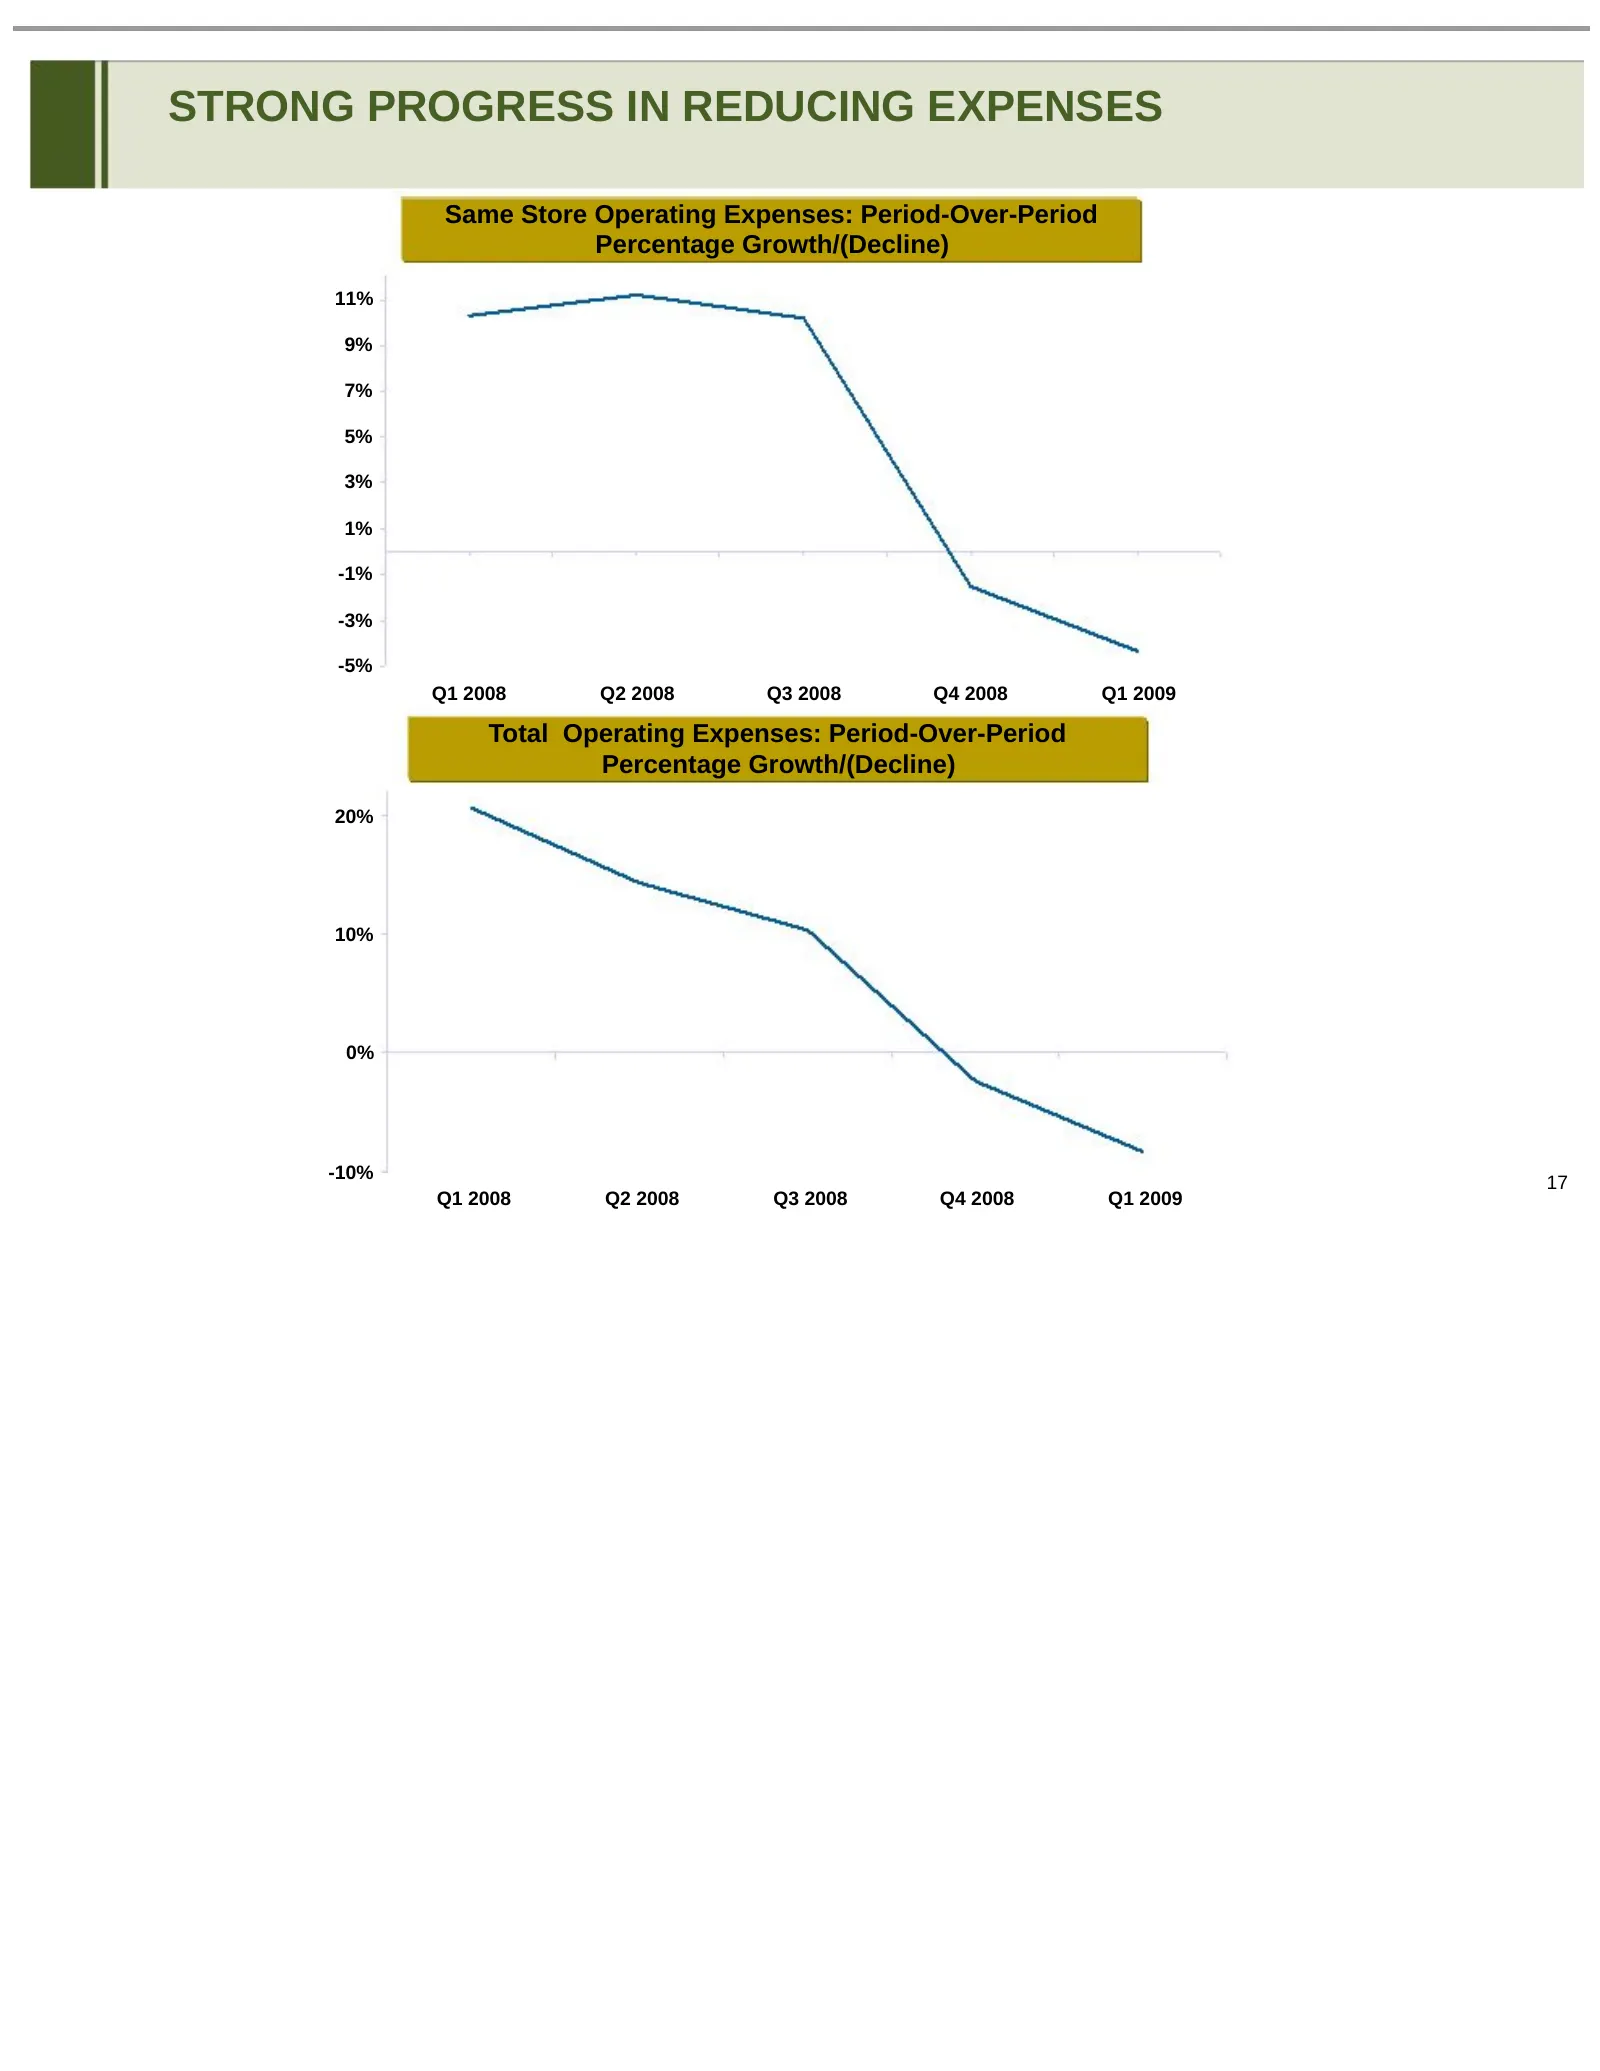
STRONG PROGRESS IN REDUCING EXPENSES Same Store Operating Expenses: Period-Over-Period Percentage Growth/(Decline) 11% 9% 7% 5% 3% 1% -1% -3% -5% Q1 2008 Q2 2008 Q3 2008 Q4 2008 Q1 2009 Total Operating Expenses: Period-Over-Period Percentage Growth/(Decline) 20% 10% 0% -10% 17 Q1 2008 Q2 2008 Q3 200
Slide 18: Addressing Current Environment
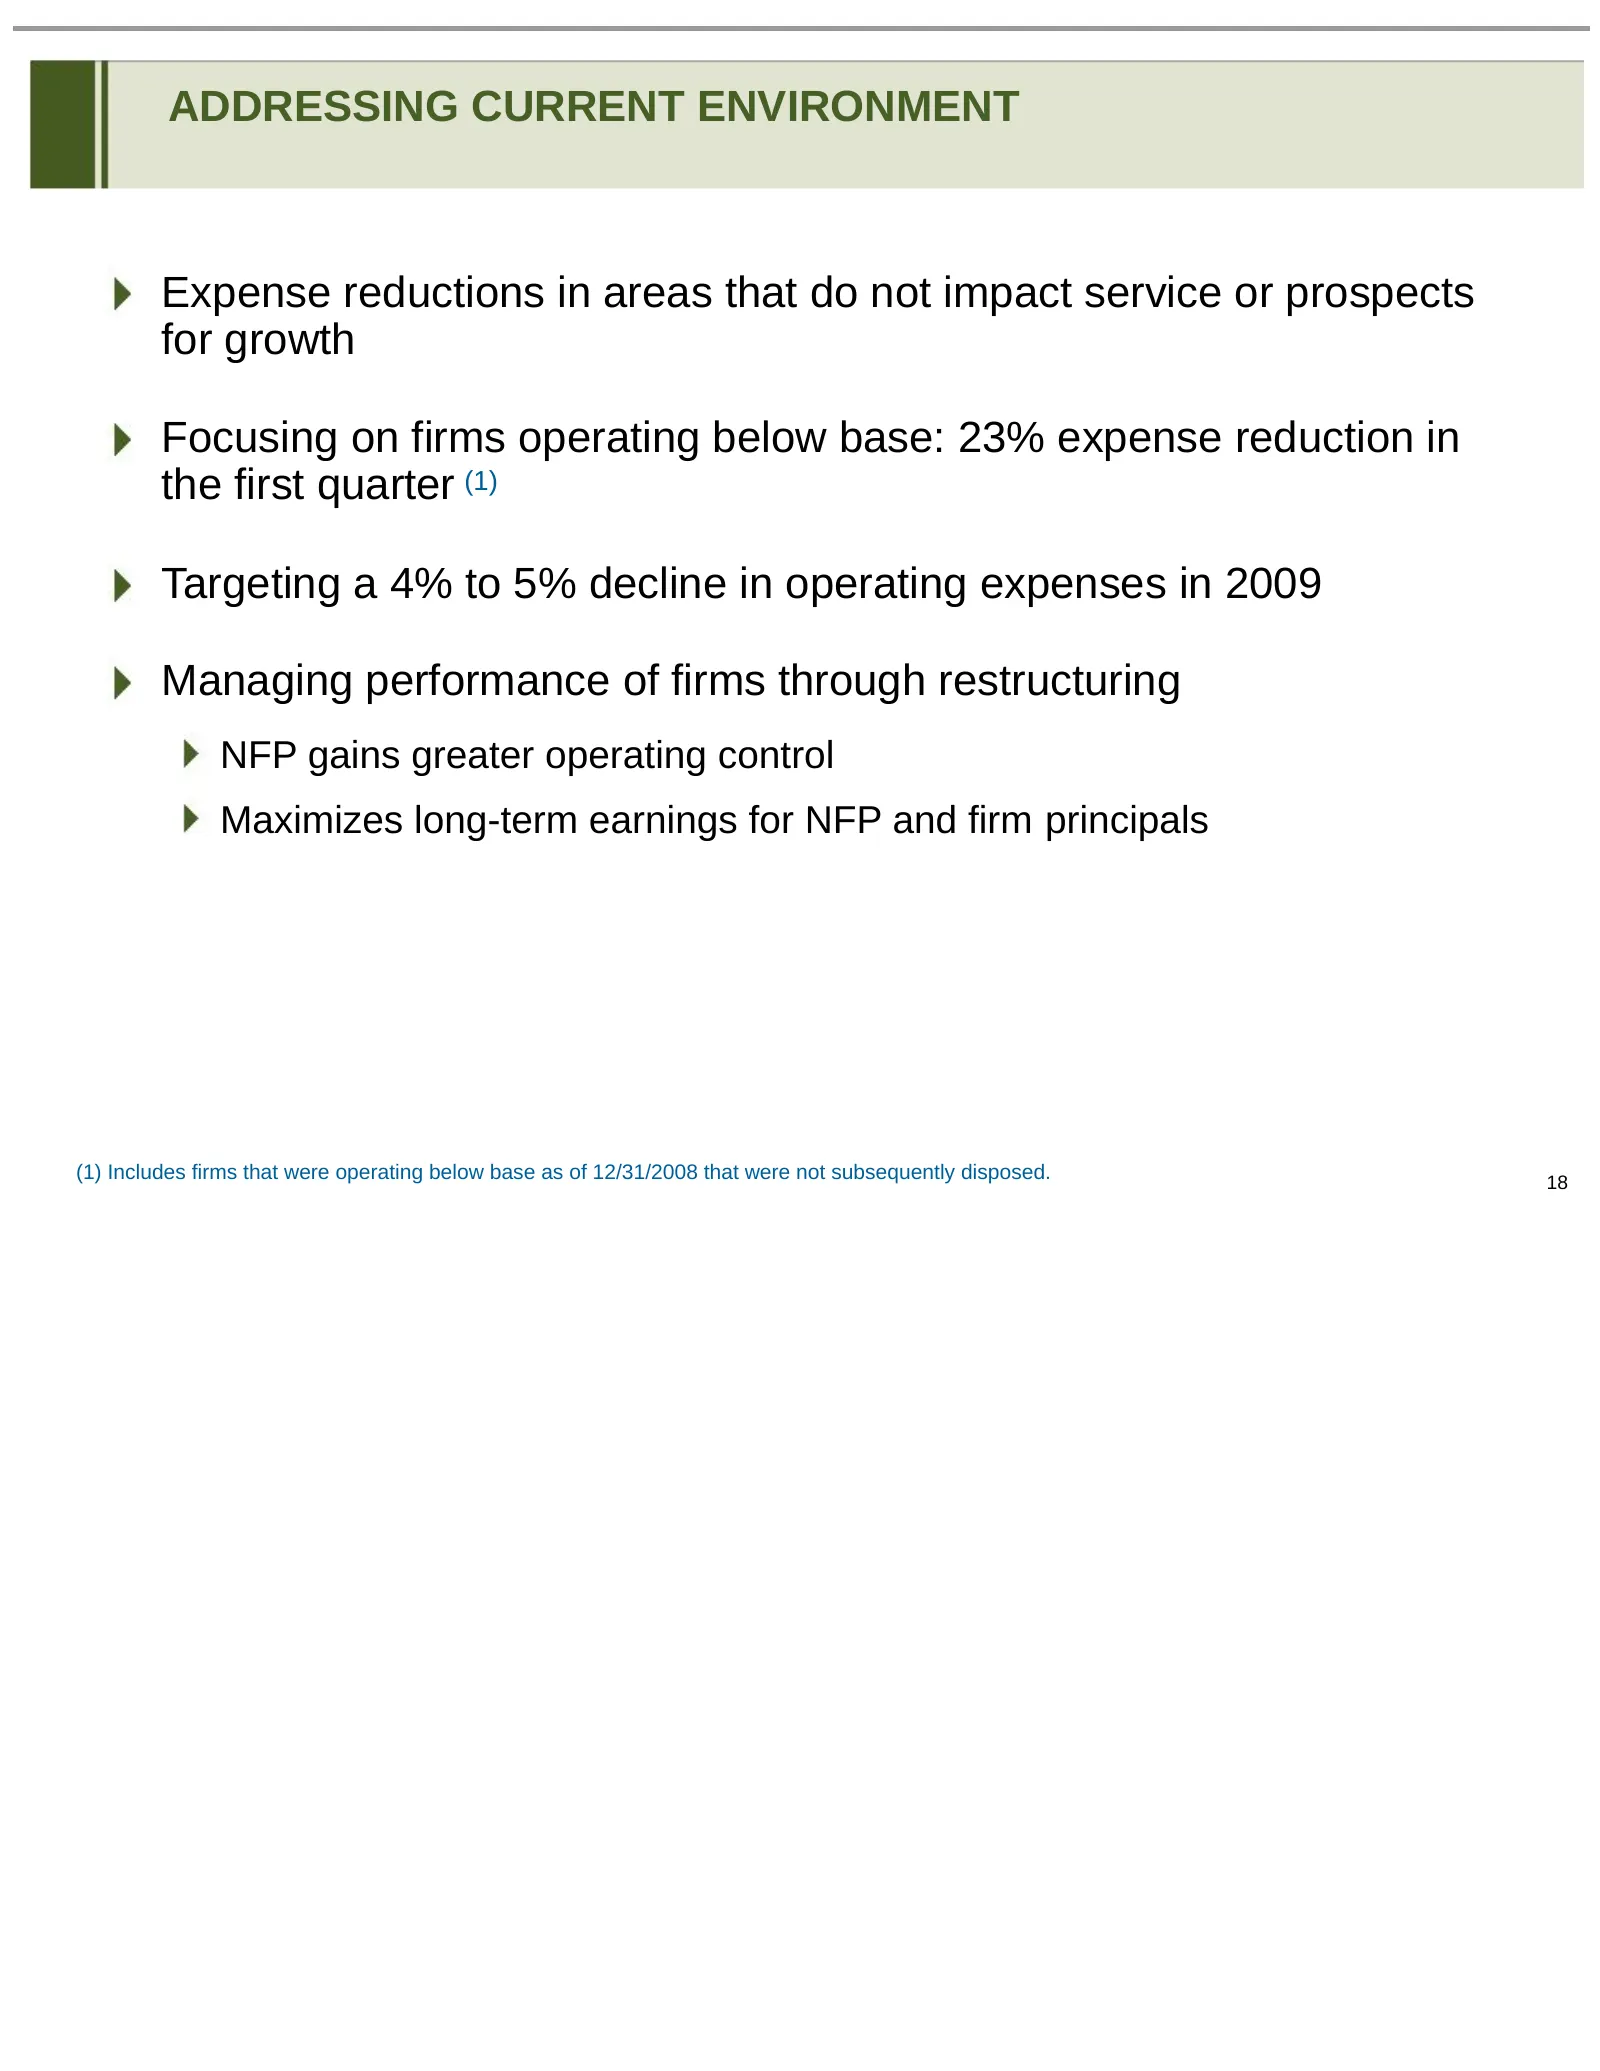
ADDRESSING CURRENT ENVIRONMENT Expense reductions in areas that do not impact service or prospects for growth Focusing on firms operating below base: 23% expense reduction in the first quarter (1) Targeting a 4% to 5% decline in operating expenses in 2009 Managing performance of firms through restru
Slide 19: Product Performance
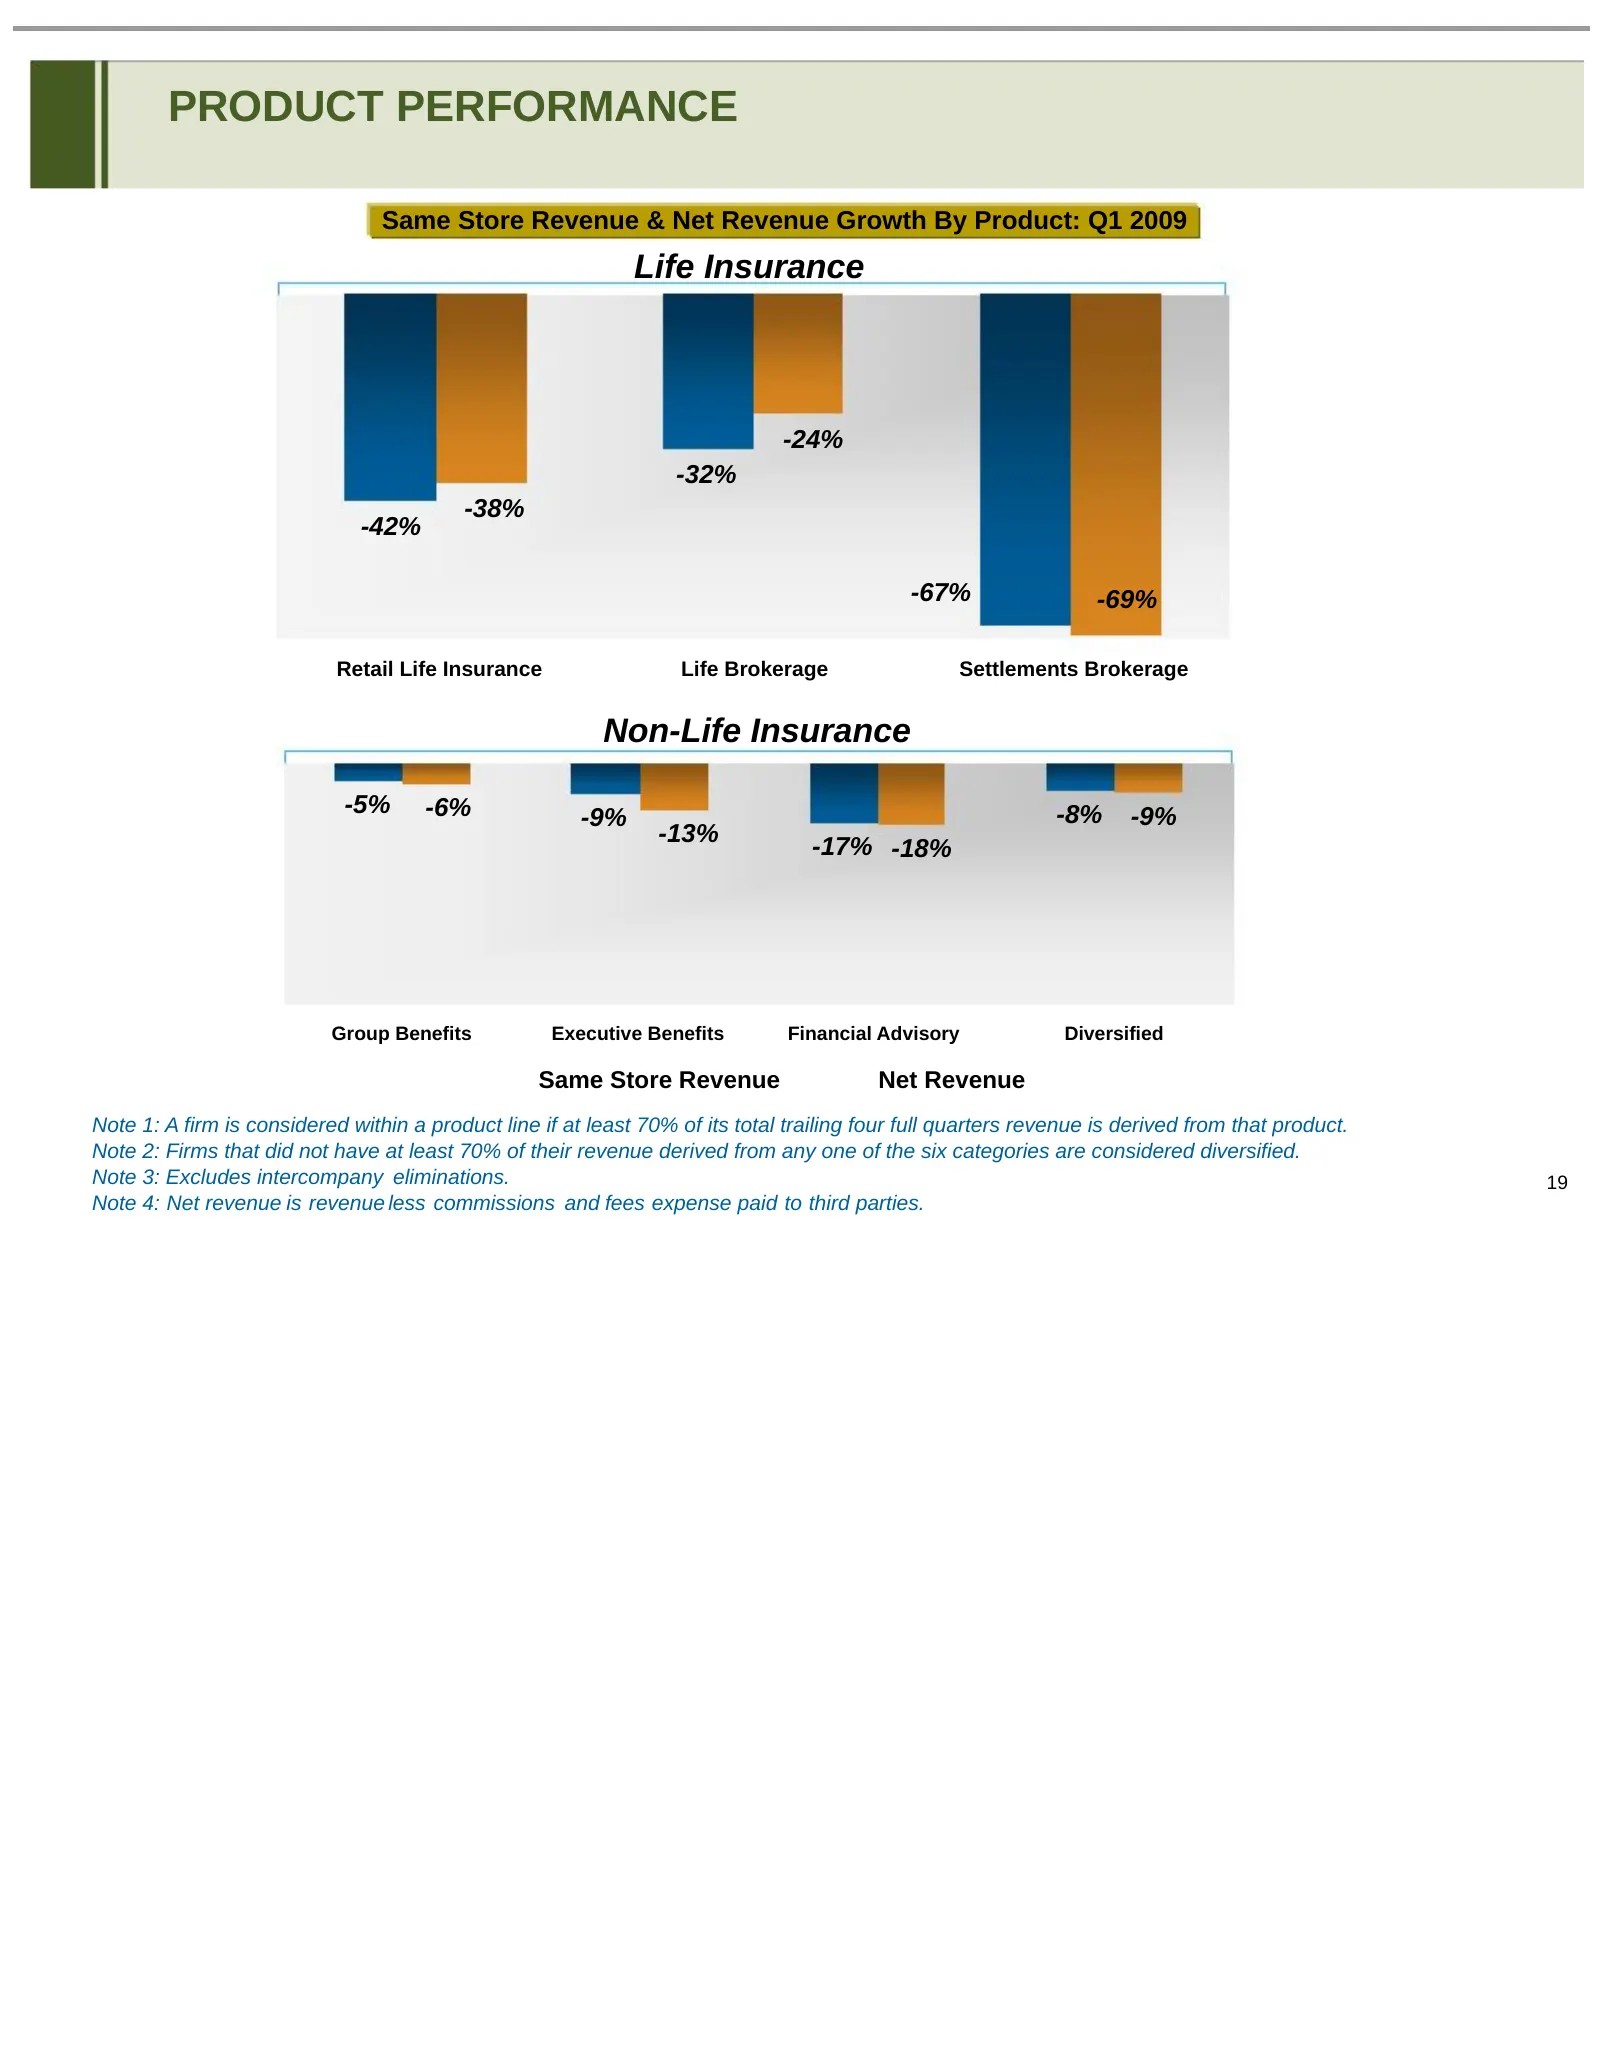
PRODUCT PERFORMANCE Same Store Revenue & Net Revenue Growth By Product: Q1 2009 Life Insurance -24% -32% -38% -42% -67% -69% Retail Life Insurance Life Brokerage Settlements Brokerage Non-Life Insurance -5% -6% -8% -9% -9% -13% -17% -18% Group Benefits Executive Benefits Financial Advisory Diversifi
Slide 20: Business Mix: Growing Benefits Presence
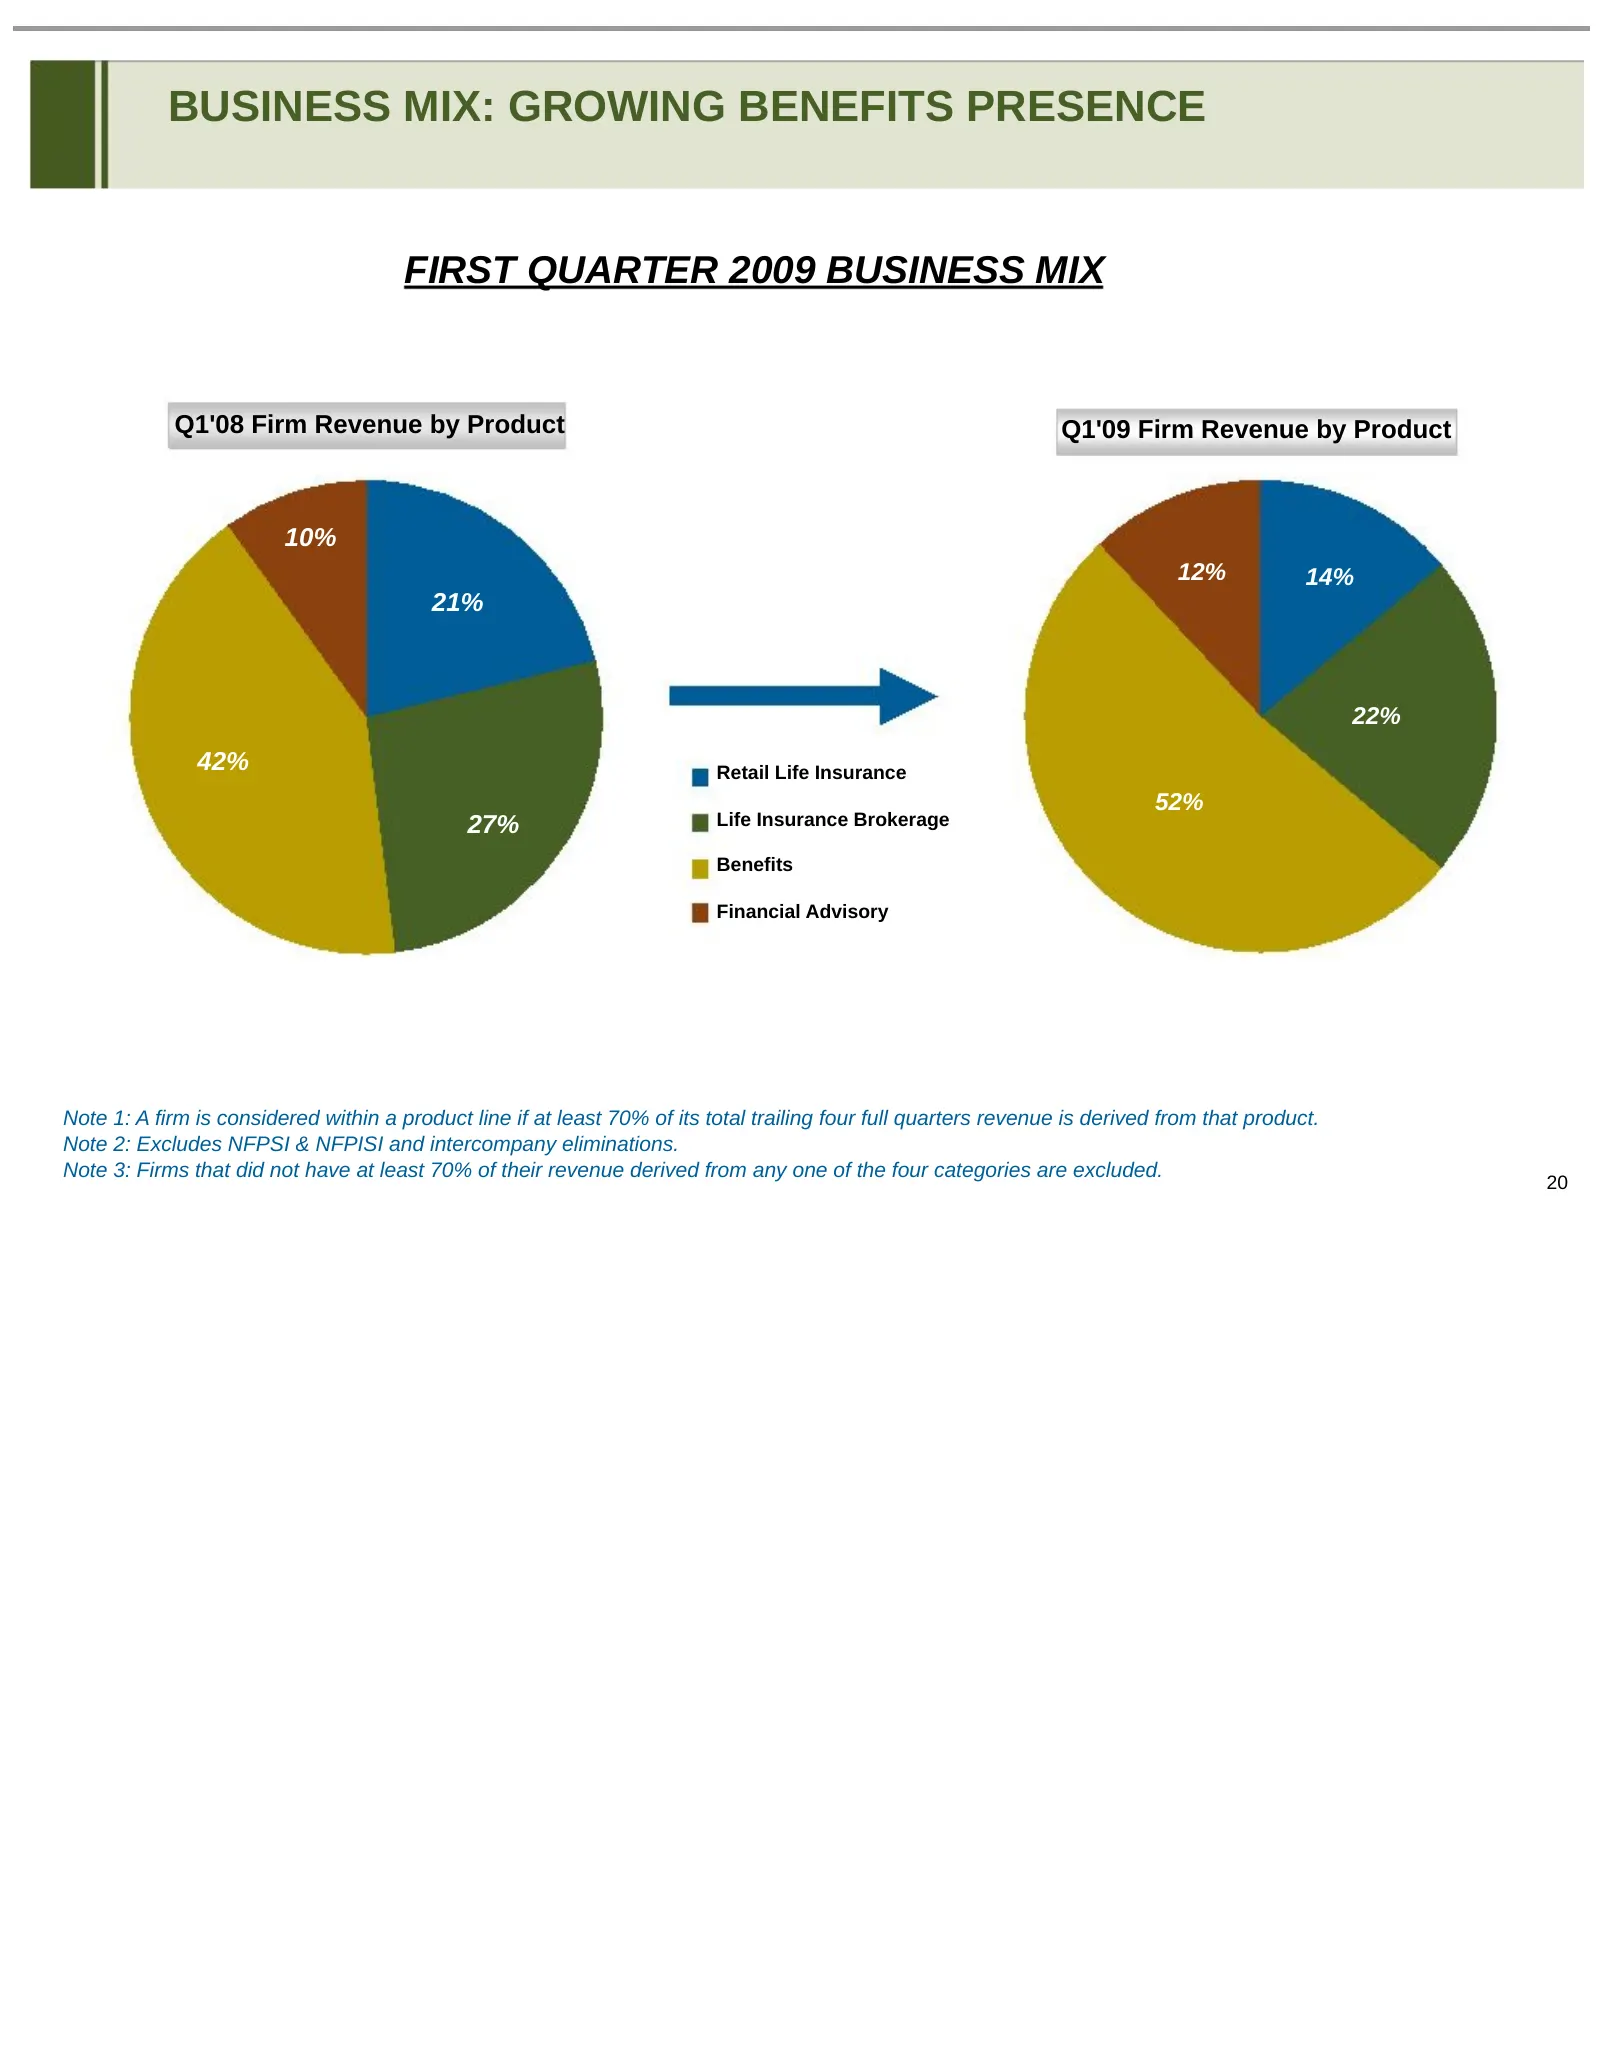
BUSINESS MIX: GROWING BENEFITS PRESENCE FIRST QUARTER 2009 BUSINESS MIX Q1'08 Firm Revenue by Product Q1'09 Firm Revenue by Product 10% 12% 14% 21% 22% 42% Retail Life Insurance 52% 27% Life Insurance Brokerage Benefits Financial Advisory Note 1: A firm is considered within a product line if at leas

Slide 21: Cra
Cra NATIONAL FINANCIAL PARTNERS
Source: SEC EDGAR · 8-K filed May 12, 2009
More decks from National Financial Partners Corp
 Q4 2012 Earnings Presentation19 slides · Feb 15, 2013
 Q3 2012 Earnings Presentation18 slides · Oct 31, 2012
 Q2 2012 Earnings Presentation19 slides · Jul 31, 2012
 Q1 2012 Earnings Presentation19 slides · Apr 27, 2012
 Q4 2011 Earnings Presentation18 slides · Feb 8, 2012
 Q3 2011 Earnings Presentation19 slides · Oct 28, 2011