Flutter Entertainment plc · NYSE:FLUT
Flutter Entertainment — Paddy Power — H1 2009 Earnings Presentation
32 slides from Flutter Entertainment's earnings presentation, 2009

Slide 1: Paddy Power plc 2009 Interim Results
Paddy Power pic 2009 Interim Results x & paddypower.com
Slide 2: Introduction
Introduction Introduction Financial Performance Operational Review Strategy & Outlook Page 1
Slide 3: Highlights
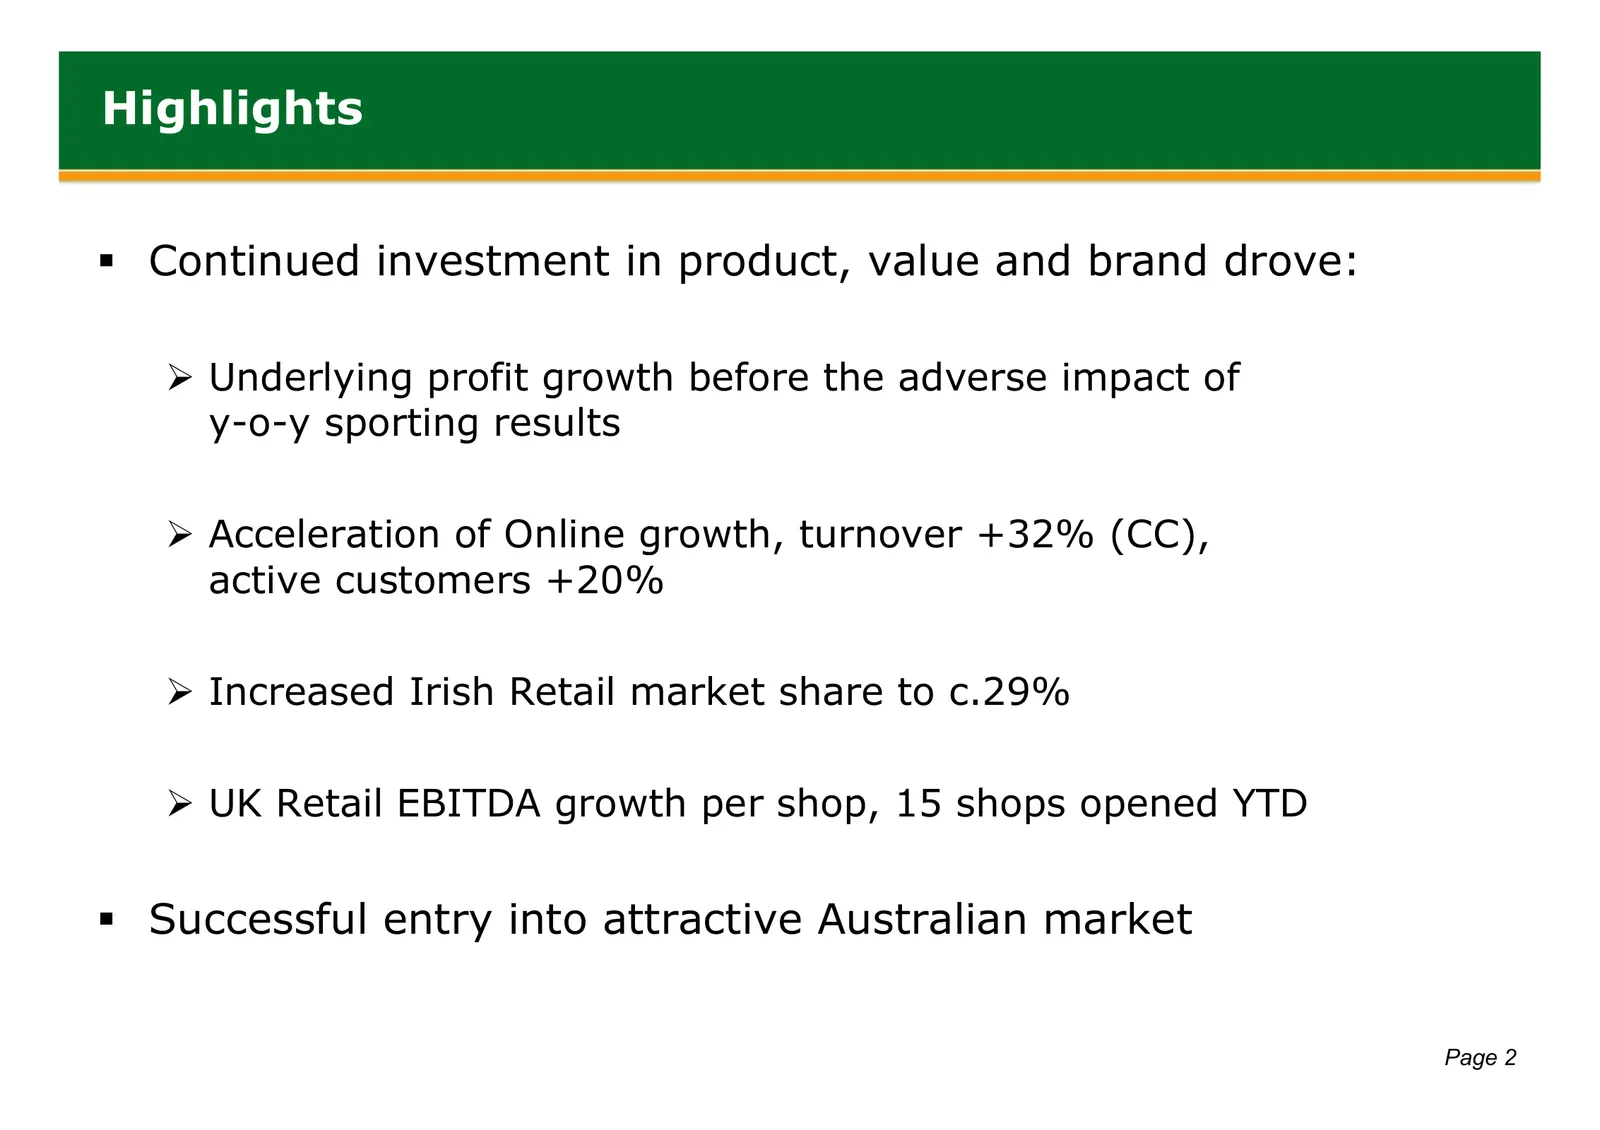
Highlights Continued investment in product, value and brand drove: ¾ Underlying profit growth before the adverse impact of y-o-y sporting results ¾ Acceleration of Online growth, turnover +32% (CC), active customers +20% ¾ Increased Irish Retail market share to c.29% ¾ UK Retail EBITDA growth per
Slide 4: Financial Performance
Financial Performance Introduction Financial Performance Operational Review Strategy & Outlook Page 3
Slide 5: Operating Profit Bridge
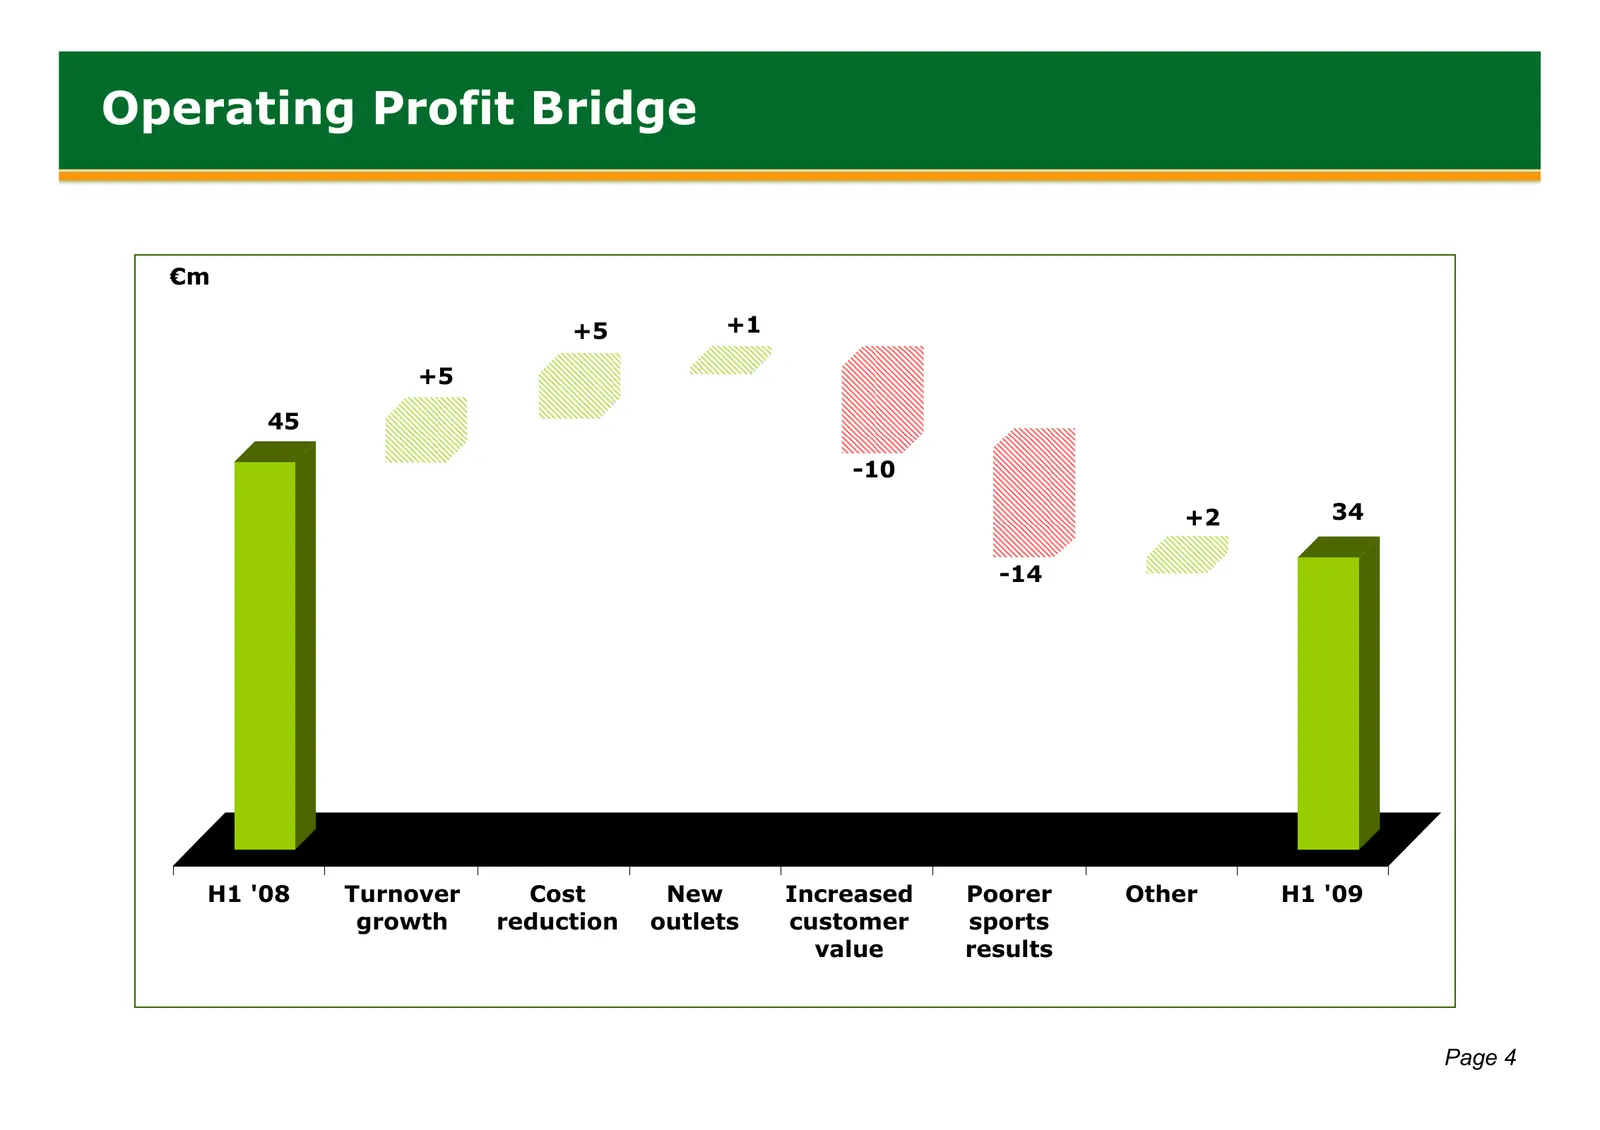
Operating Profit Bridge €m +5 +1 +5 45 -10 +2 34 -14 H1 '08 Turnover Cost New Increased Poorer Other H1 '09 growth reduction outlets customer sports value results Page 4
Slide 6: Financial Highlights
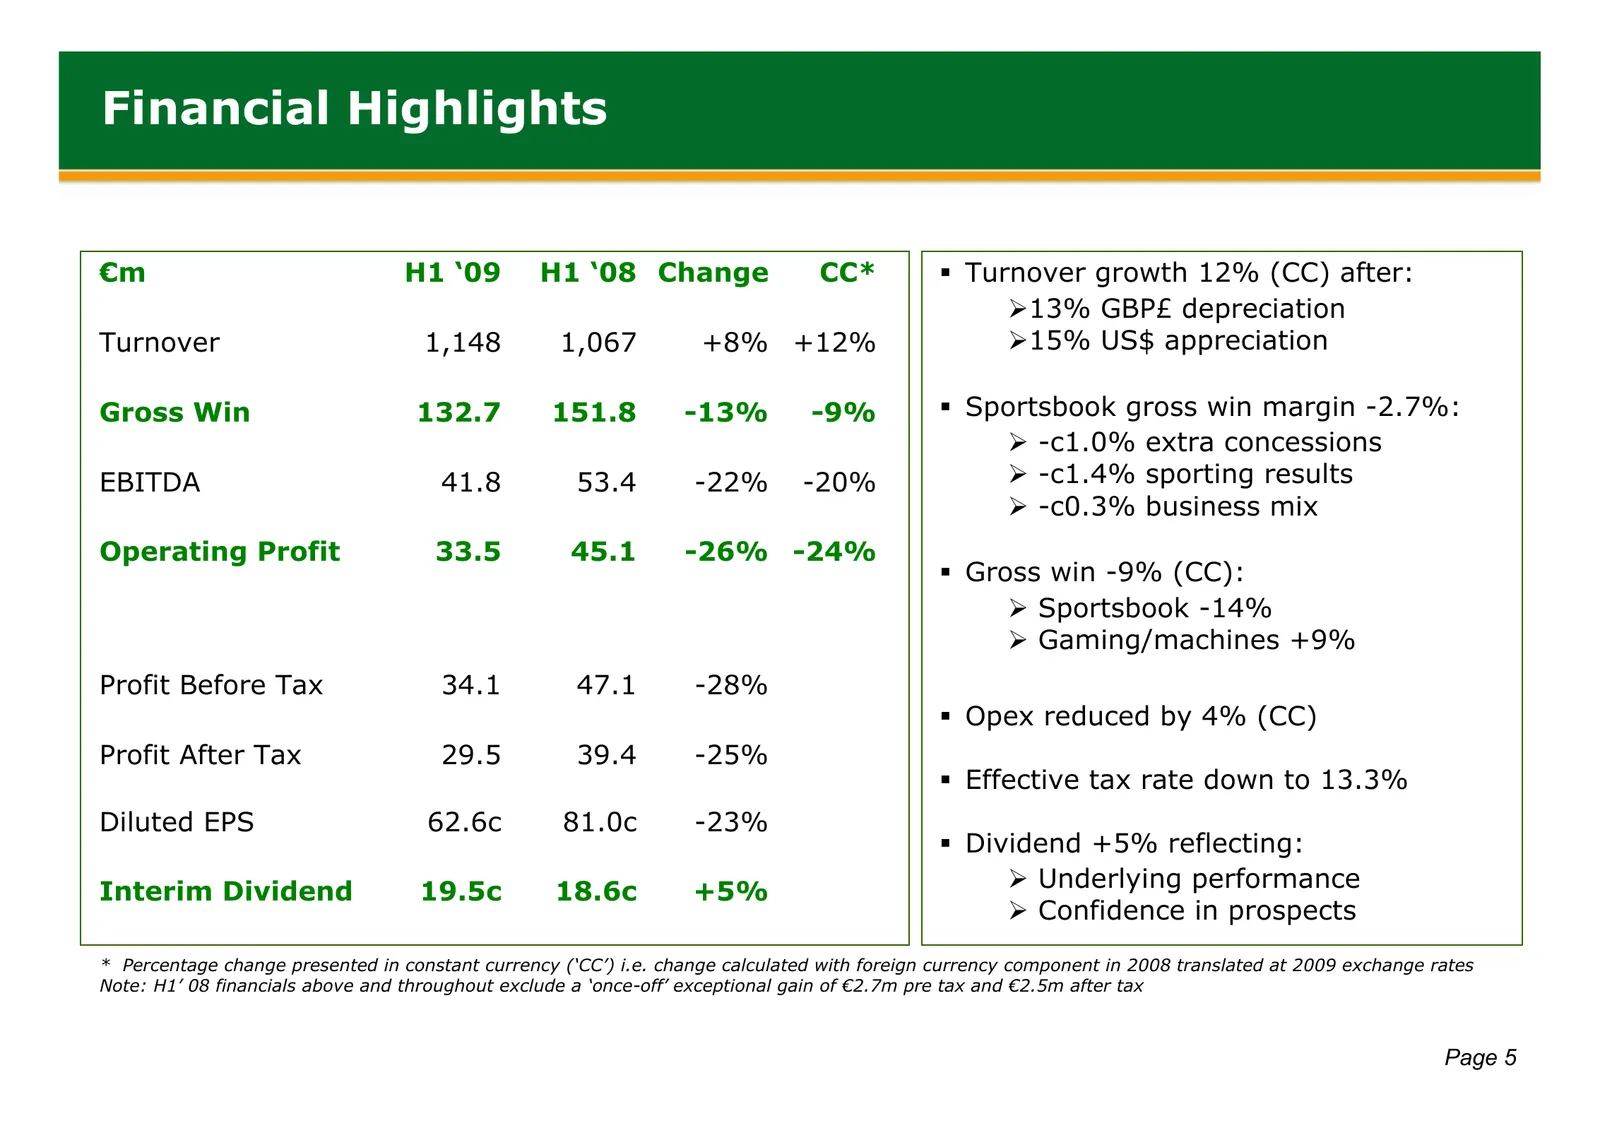
Financial Highlights €m H1 ‘09 H1 ‘08 Change CC* Turnover growth 12% (CC) after: ¾13% GBP£ depreciation Turnover 1,148 1,067 +8% +12% ¾15% US$ appreciation Gross Win 132.7 151.8 -13% -9% Sportsbook gross win margin -2.7%: ¾ -c1.0% extra concessions EBITDA 41.8 53.4 -22% -20% ¾ -c1.4% sporting re
Slide 7: Gross Win to Gross Profit
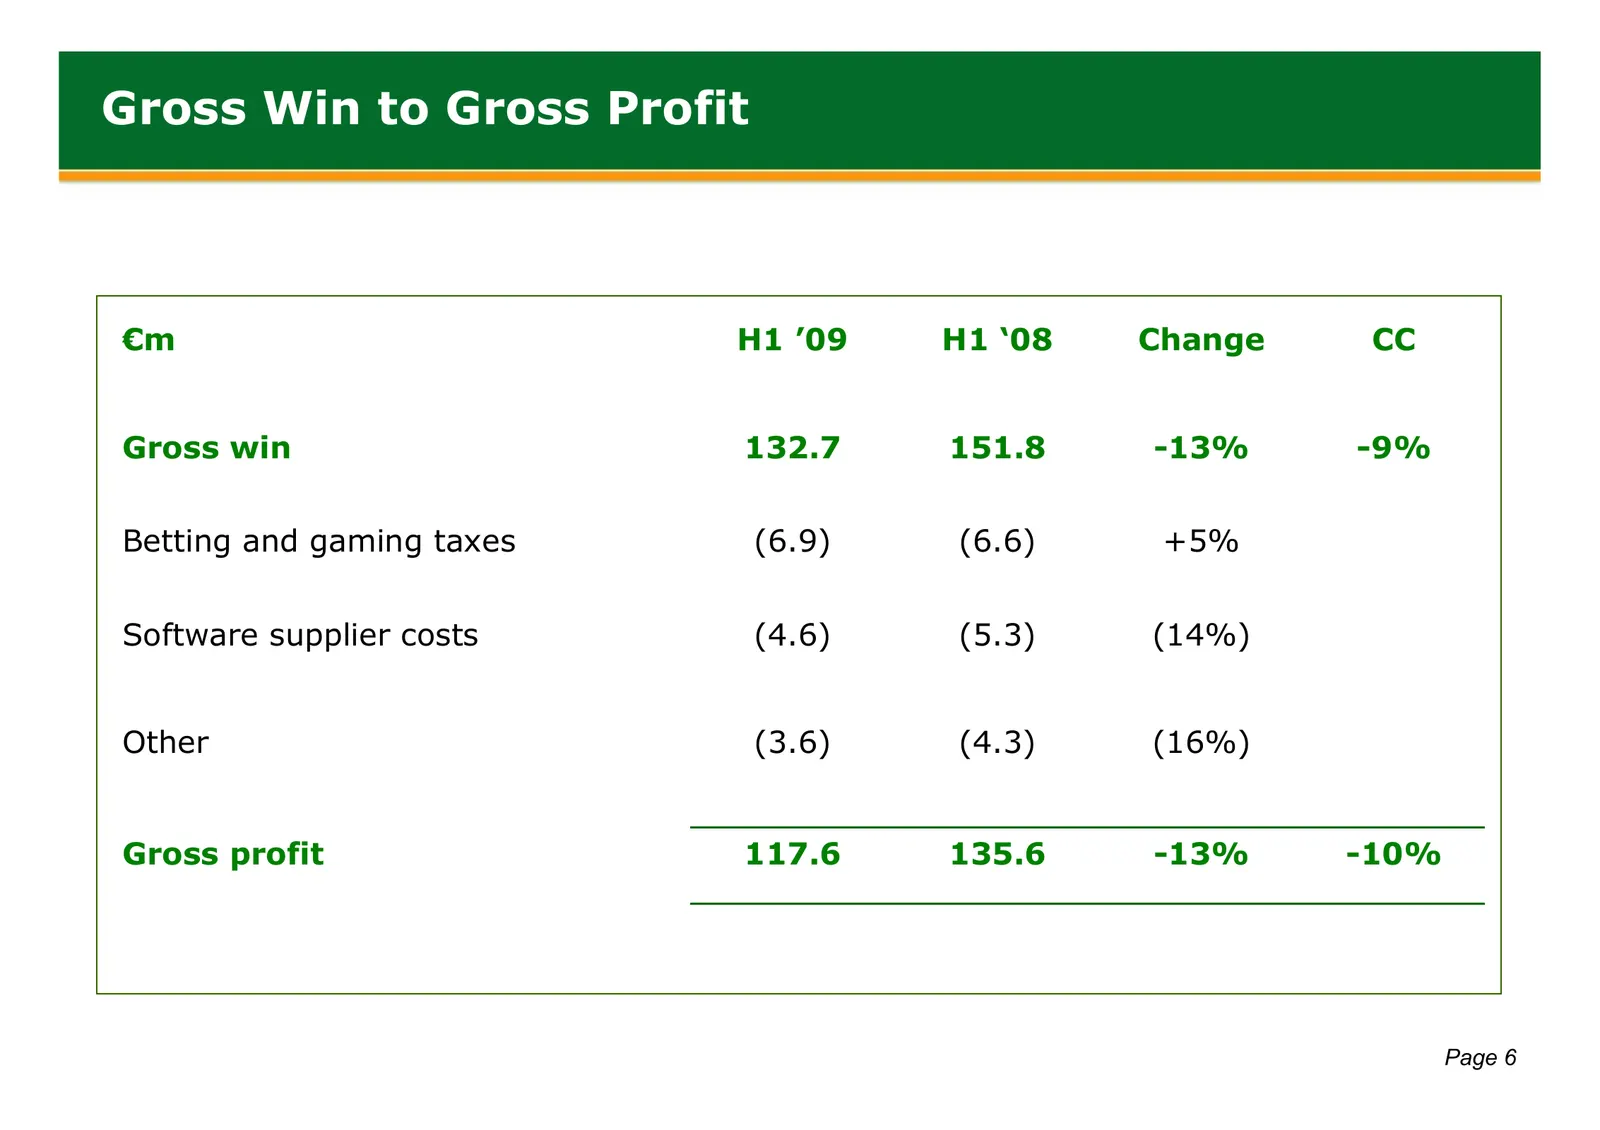
Gross Win to Gross Profit €m H1 ’09 H1 ‘08 Change CC Gross win 132.7 151.8 -13% -9% Betting and gaming taxes (6.9) (6.6) +5% Software supplier costs (4.6) (5.3) (14%) Other (3.6) (4.3) (16%) Gross profit 117.6 135.6 -13% -10% Page 6
Slide 8: Cash Flow
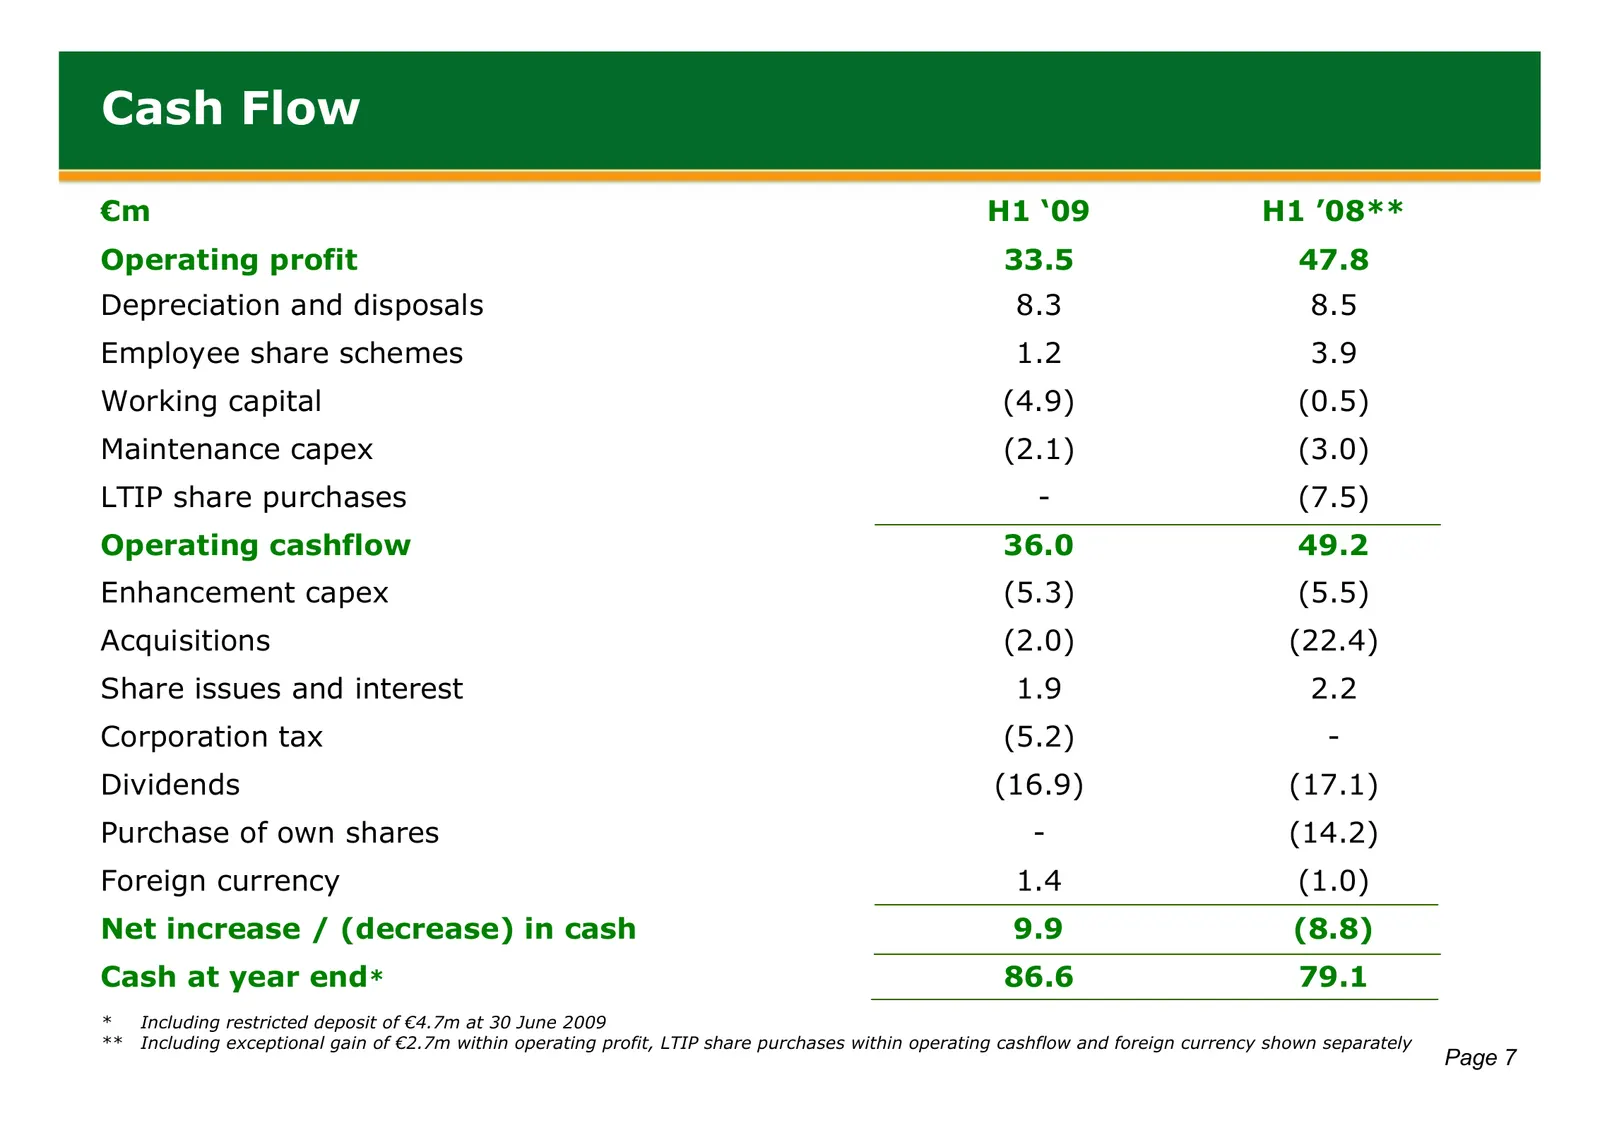
Cash Flow €m H1 ‘09 H1 ’08** Operating profit 33.5 47.8 Depreciation and disposals 8.3 8.5 Employee share schemes 1.2 3.9 Working capital (4.9) (0.5) Maintenance capex (2.1) (3.0) LTIP share purchases - (7.5) Operating cashflow 36.0 49.2 Enhancement capex (5.3) (5.5) Acquisitions (2.0) (22.4) Share
Slide 9: Capital Expenditure
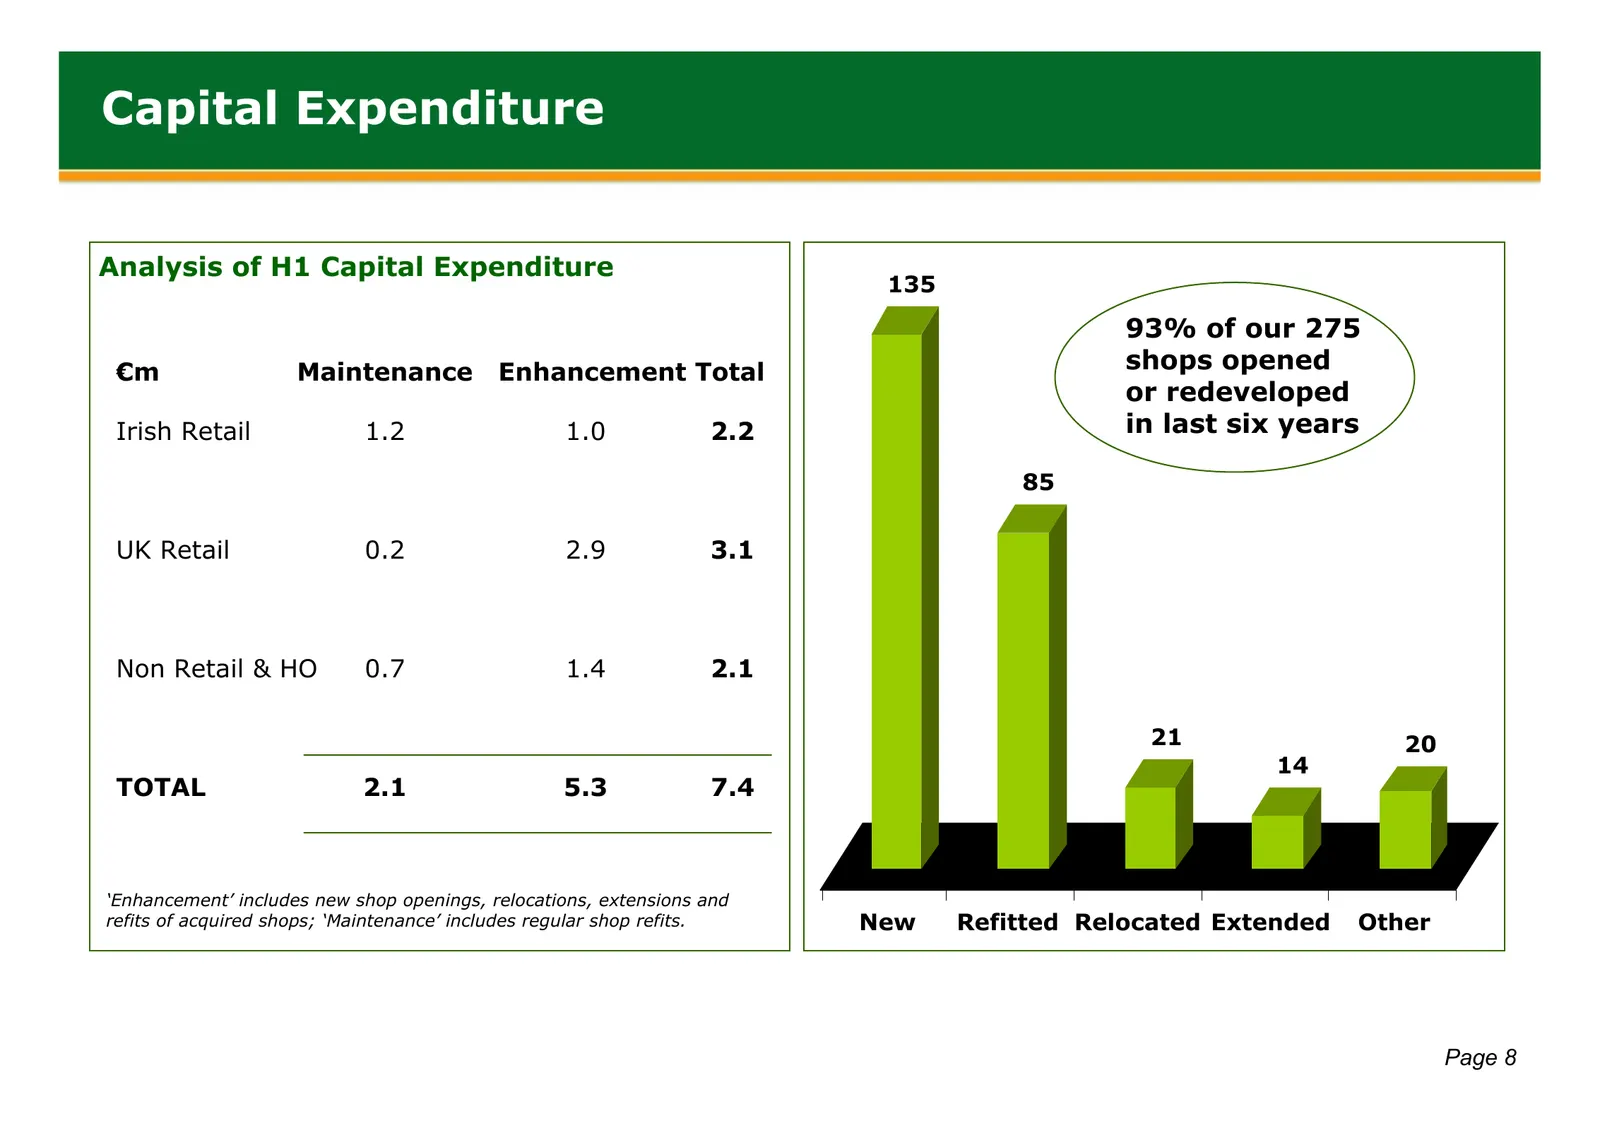
Capital Expenditure Analysis of H1 Capital Expenditure 135 93% of our 275 €m Maintenance Enhancement Total shops opened or redeveloped Irish Retail 1.2 1.0 2.2 in last six years 85 UK Retail 0.2 2.9 3.1 Non Retail & HO 0.7 1.4 2.1 21 20 14 TOTAL 2.1 5.3 7.4 ‘Enhancement’ includes new shop openings,
Slide 10: Operational Review
Operational Review Introduction Financial Performance Operational Review Strategy & Outlook Page 9
Slide 11: H1'09 Sporting Results
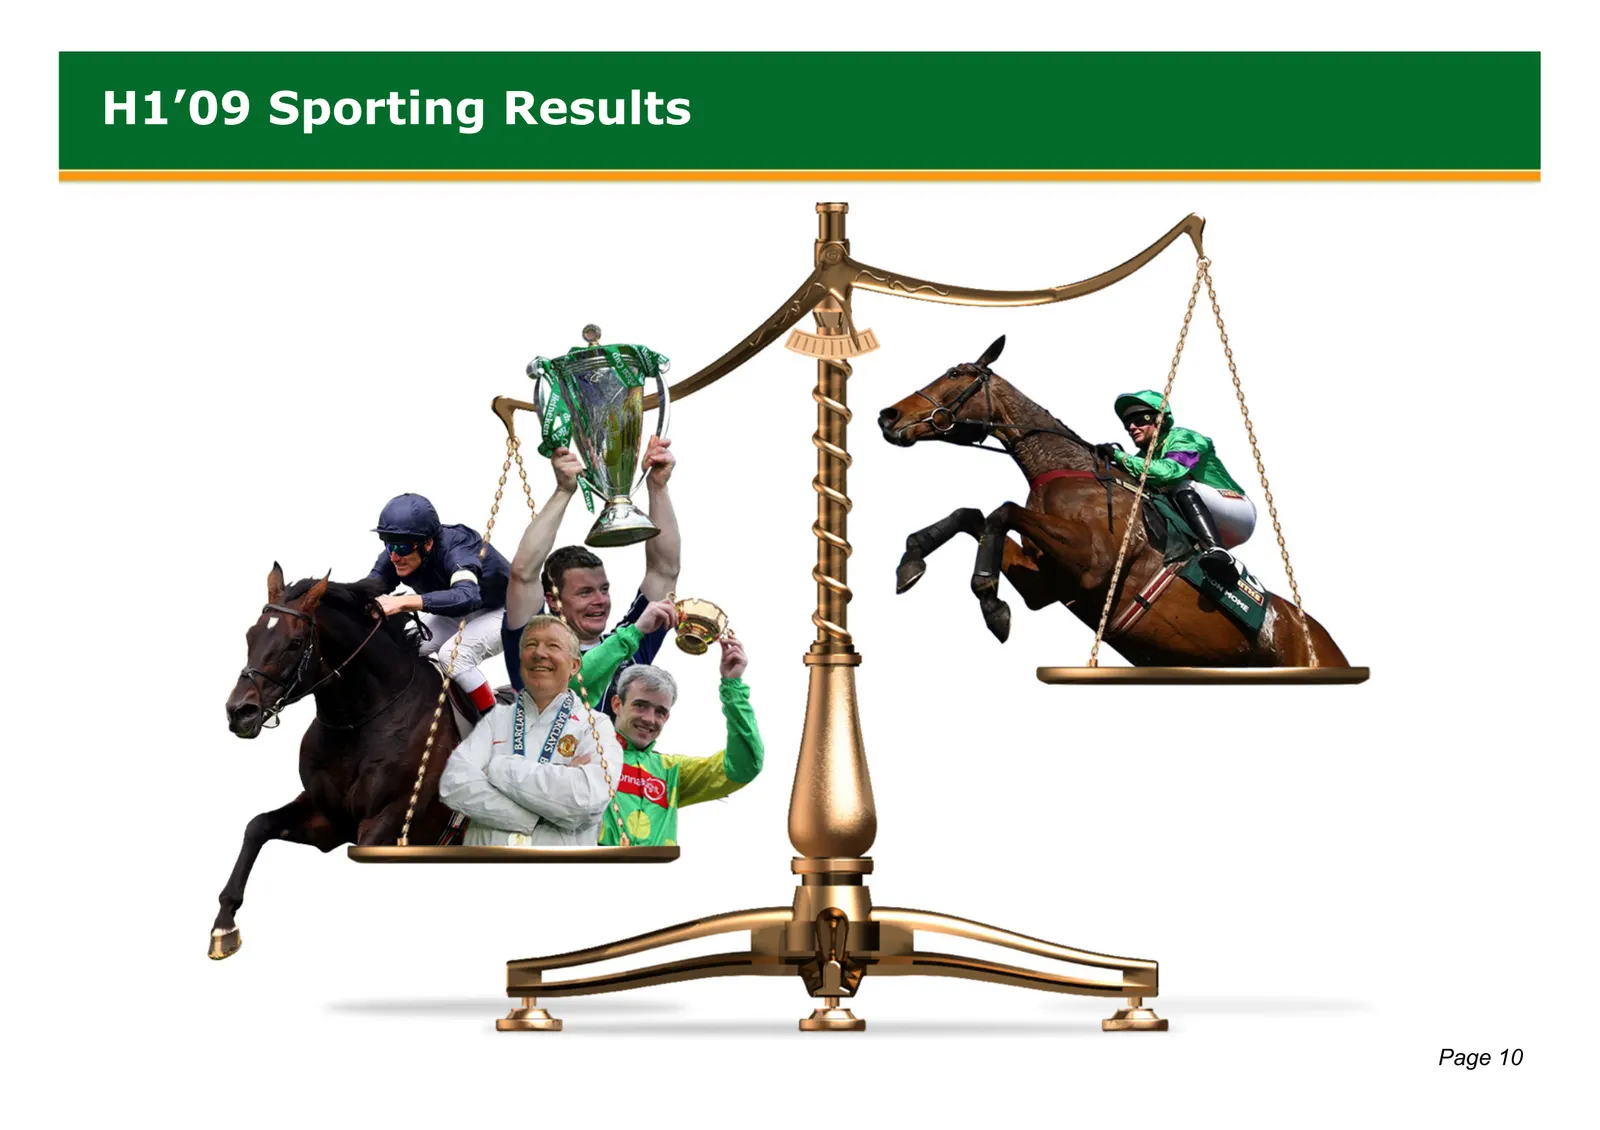
H1’09 Sporting Results Page 10
Slide 12: Divisional Summary
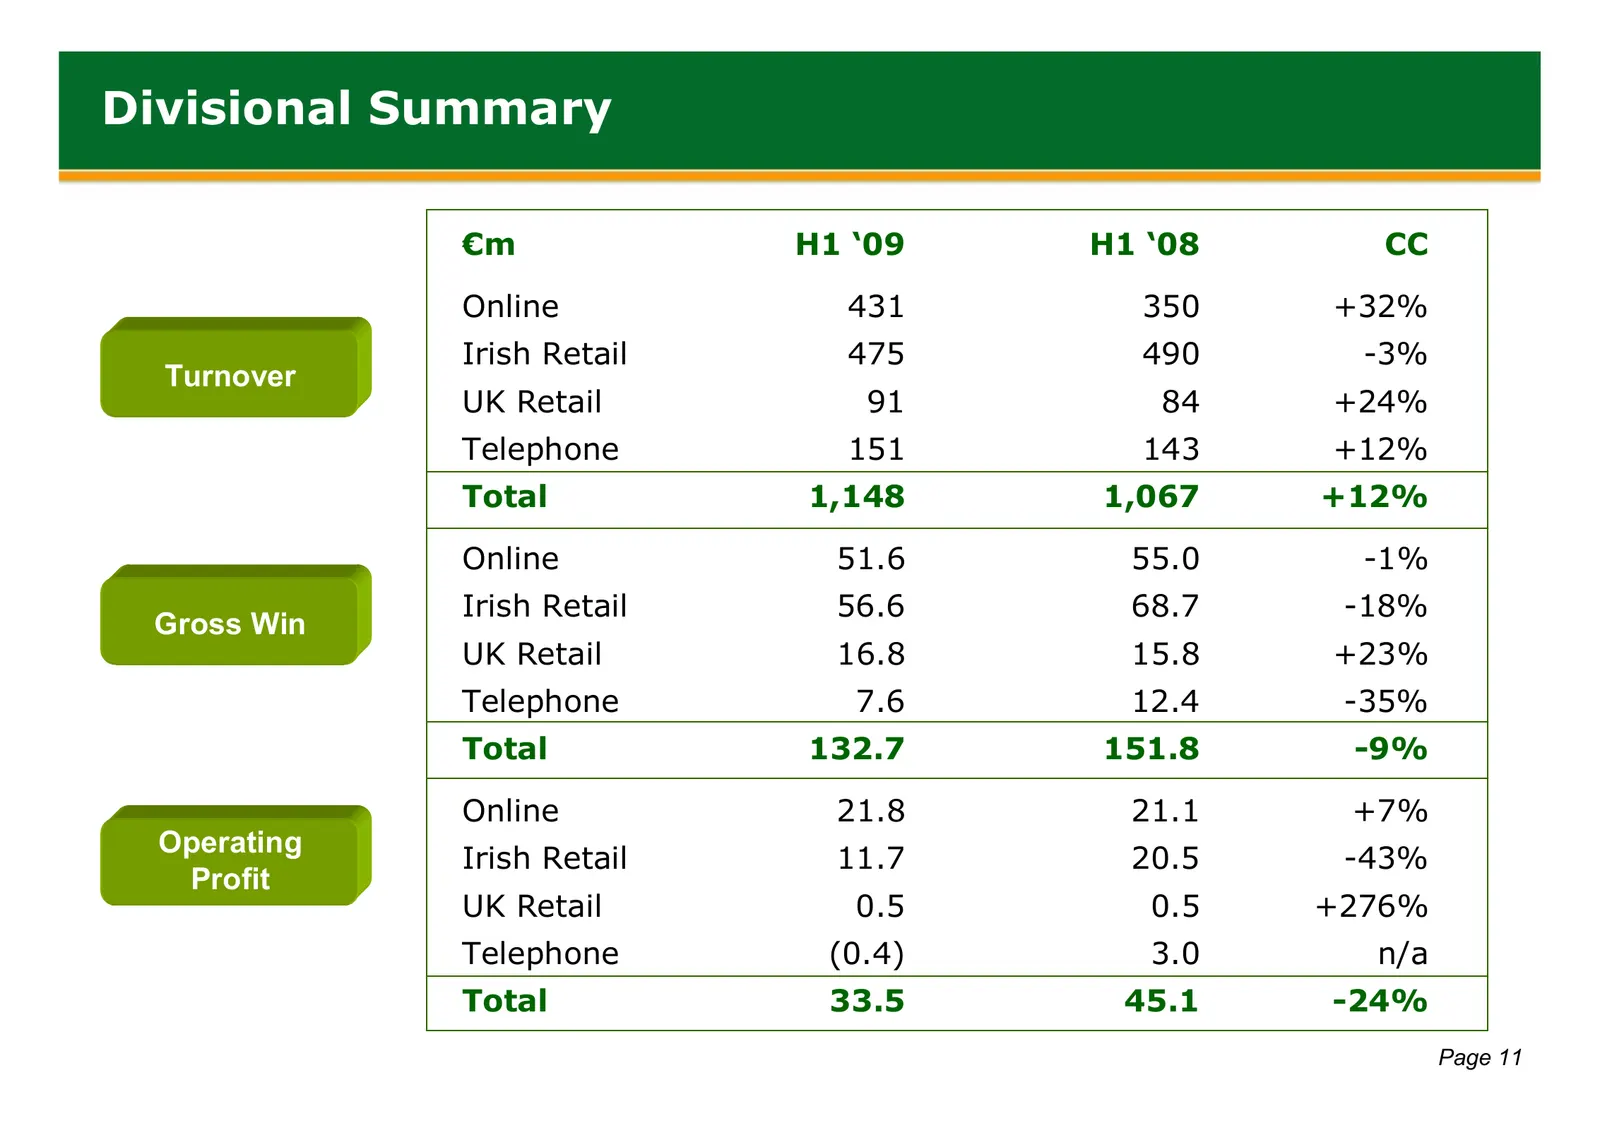
Divisional Summary €m H1 ‘09 H1 ‘08 CC Online 431 350 +32% Irish Retail 475 490 -3% Turnover UK Retail 91 84 +24% Telephone 151 143 +12% Total 1,148 1,067 +12% Online 51.6 55.0 -1% Irish Retail 56.6 68.7 -18% Gross Win UK Retail 16.8 15.8 +23% Telephone 7.6 12.4 -35% Total 132.7 151.8 -9% Online 21.
Slide 13: Online
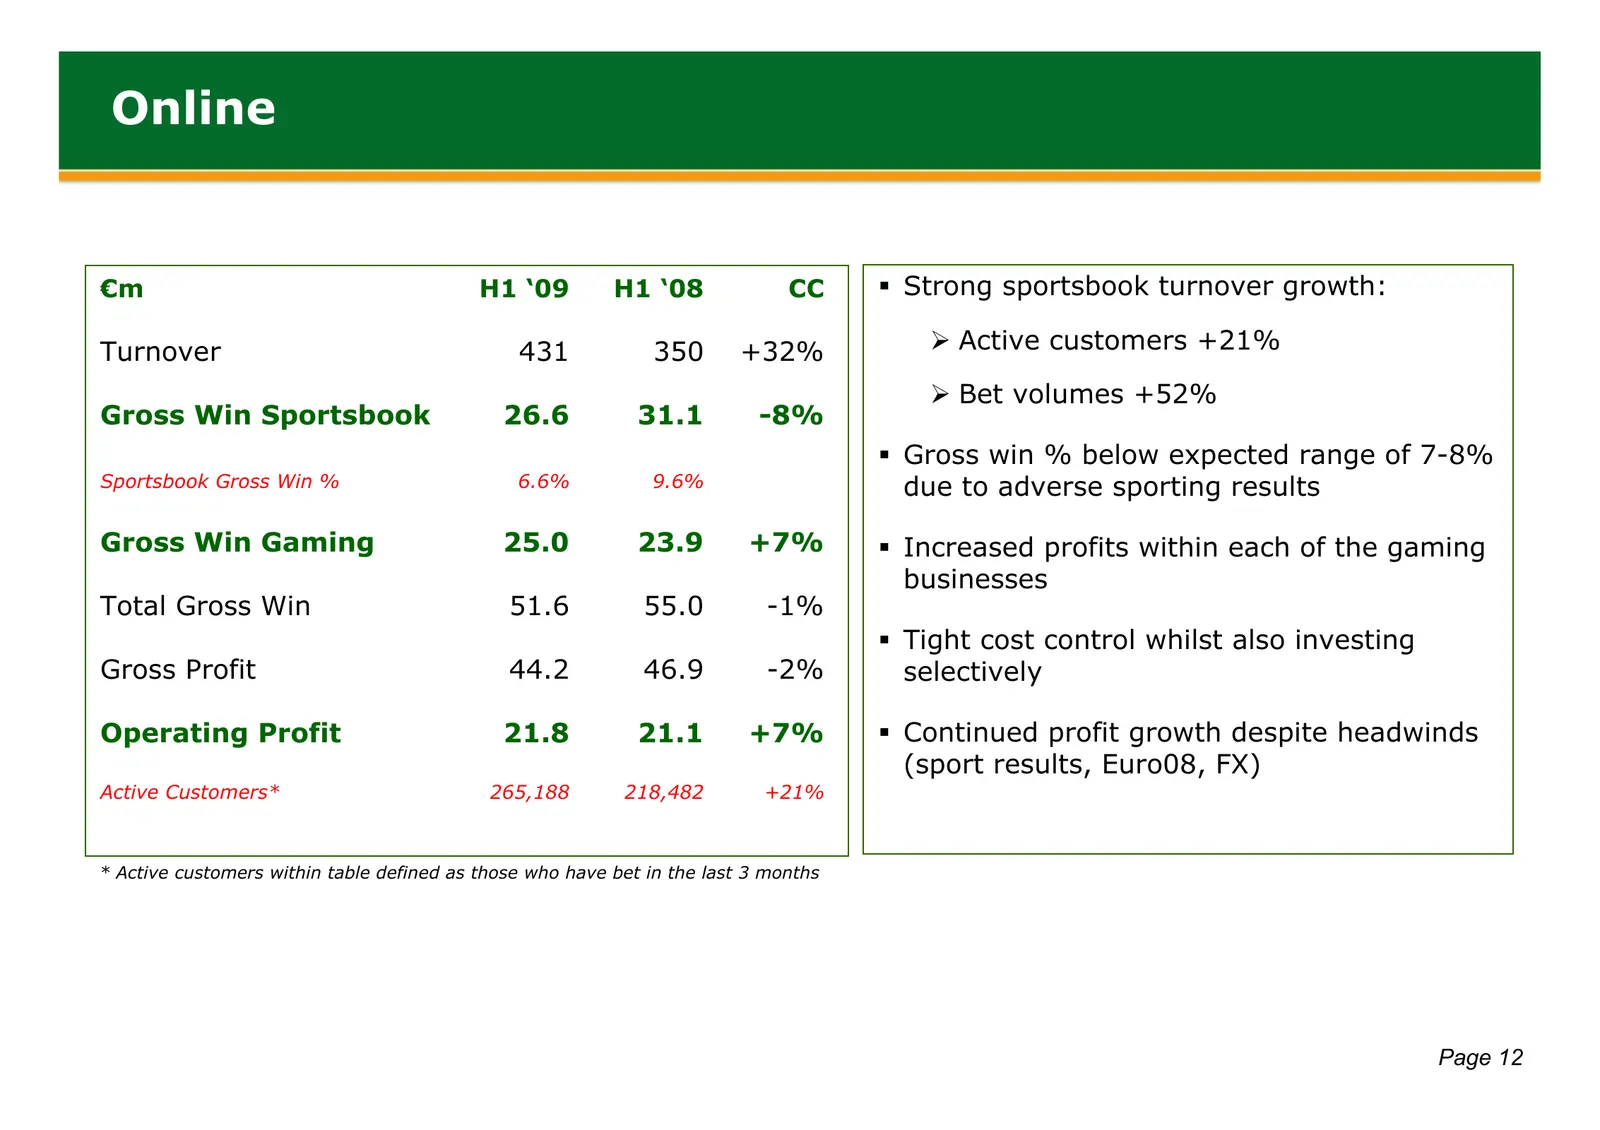
Online €m H1 ‘09 H1 ‘08 CC Strong sportsbook turnover growth: Turnover 431 350 +32% ¾ Active customers +21% ¾ Bet volumes +52% Gross Win Sportsbook 26.6 31.1 -8% Gross win % below expected range of 7-8% Sportsbook Gross Win % 6.6% 9.6% due to adverse sporting results Gross Win Gaming 25.0 23.9 +
Slide 14: Online: Structural Growth
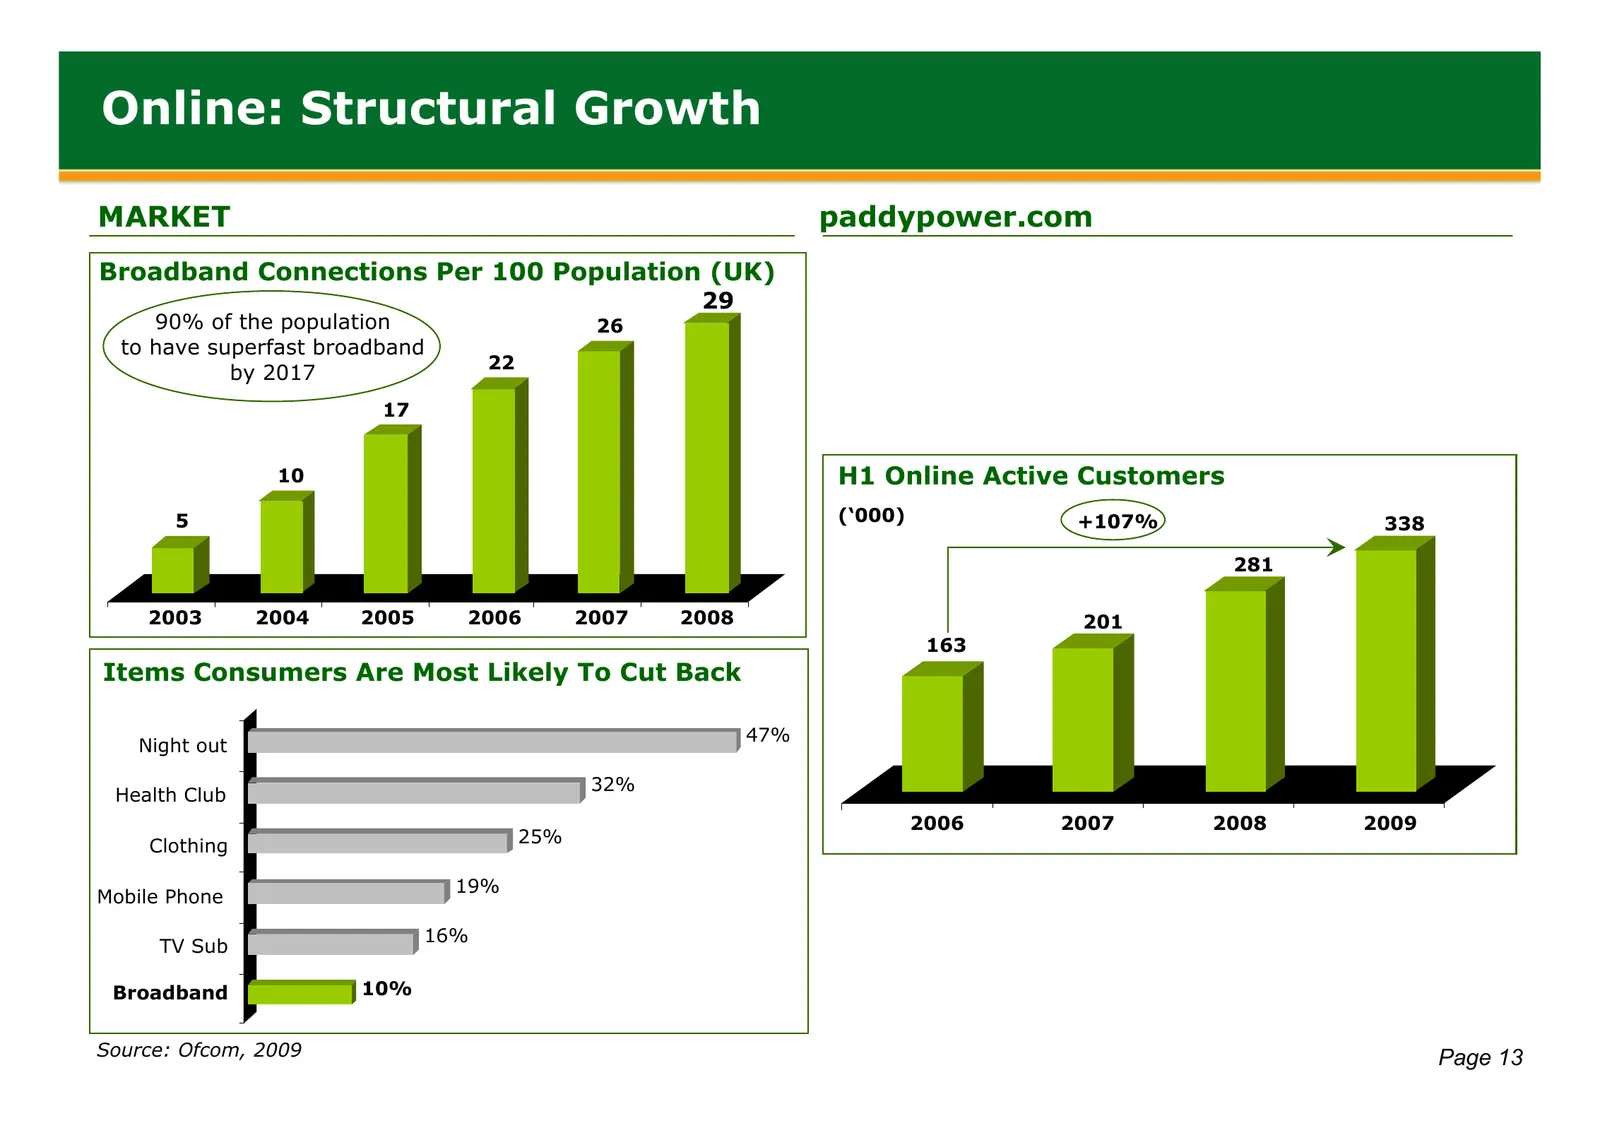
Online: Structural Growth MARKET paddypower.com Broadband Connections Per 100 Population (UK) 29 90% of the population 26 to have superfast broadband 22 by 2017 17 10 H1 Online Active Customers 5 (‘000) +107% 338 281 2003 2004 2005 2006 2007 2008 201 163 Items Consumers Are Most Likely To Cut Back 4
Slide 15: Paddy Power Online Growth Momentum
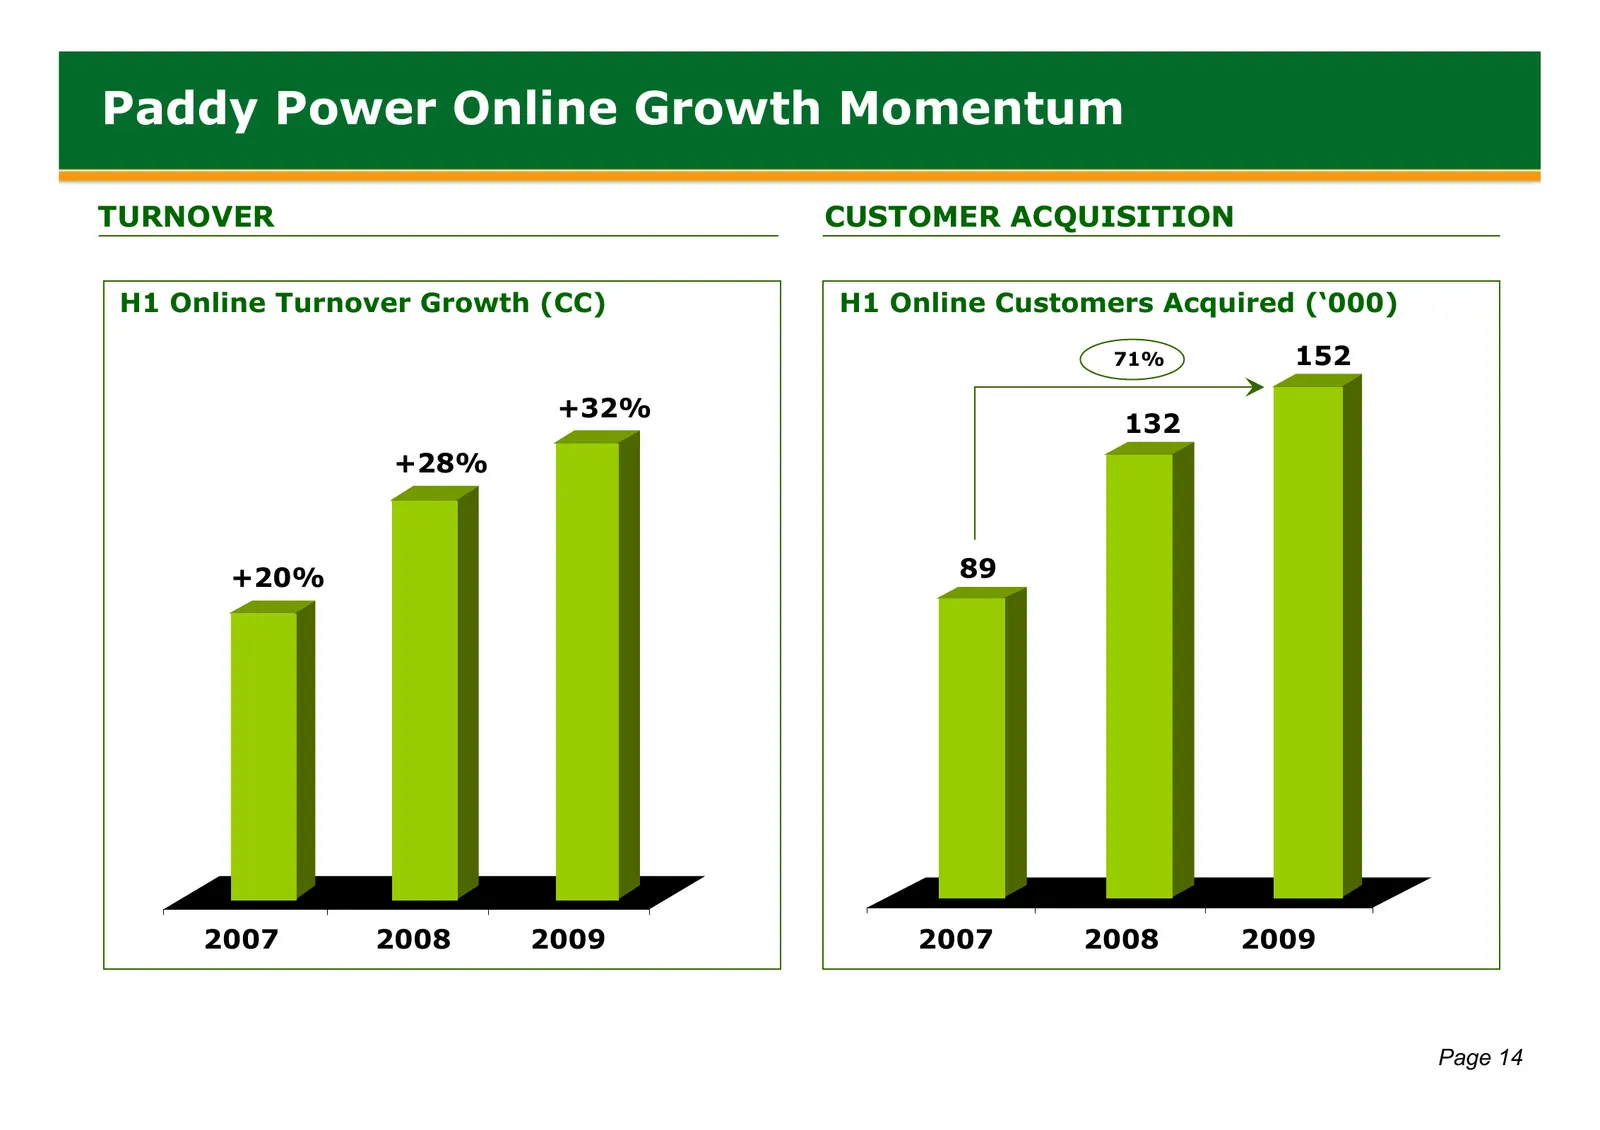
Paddy Power Online Growth Momentum TURNOVER CUSTOMER ACQUISITION H1 Online Turnover Growth (CC) H1 Online Customers Acquired (‘000) 71% 152 +32% 132 +28% +20% 89 2007 2008 2009 2007 2008 2009 Page 14
Slide 16: Paddy Power Continues To Take UK Online Market Share
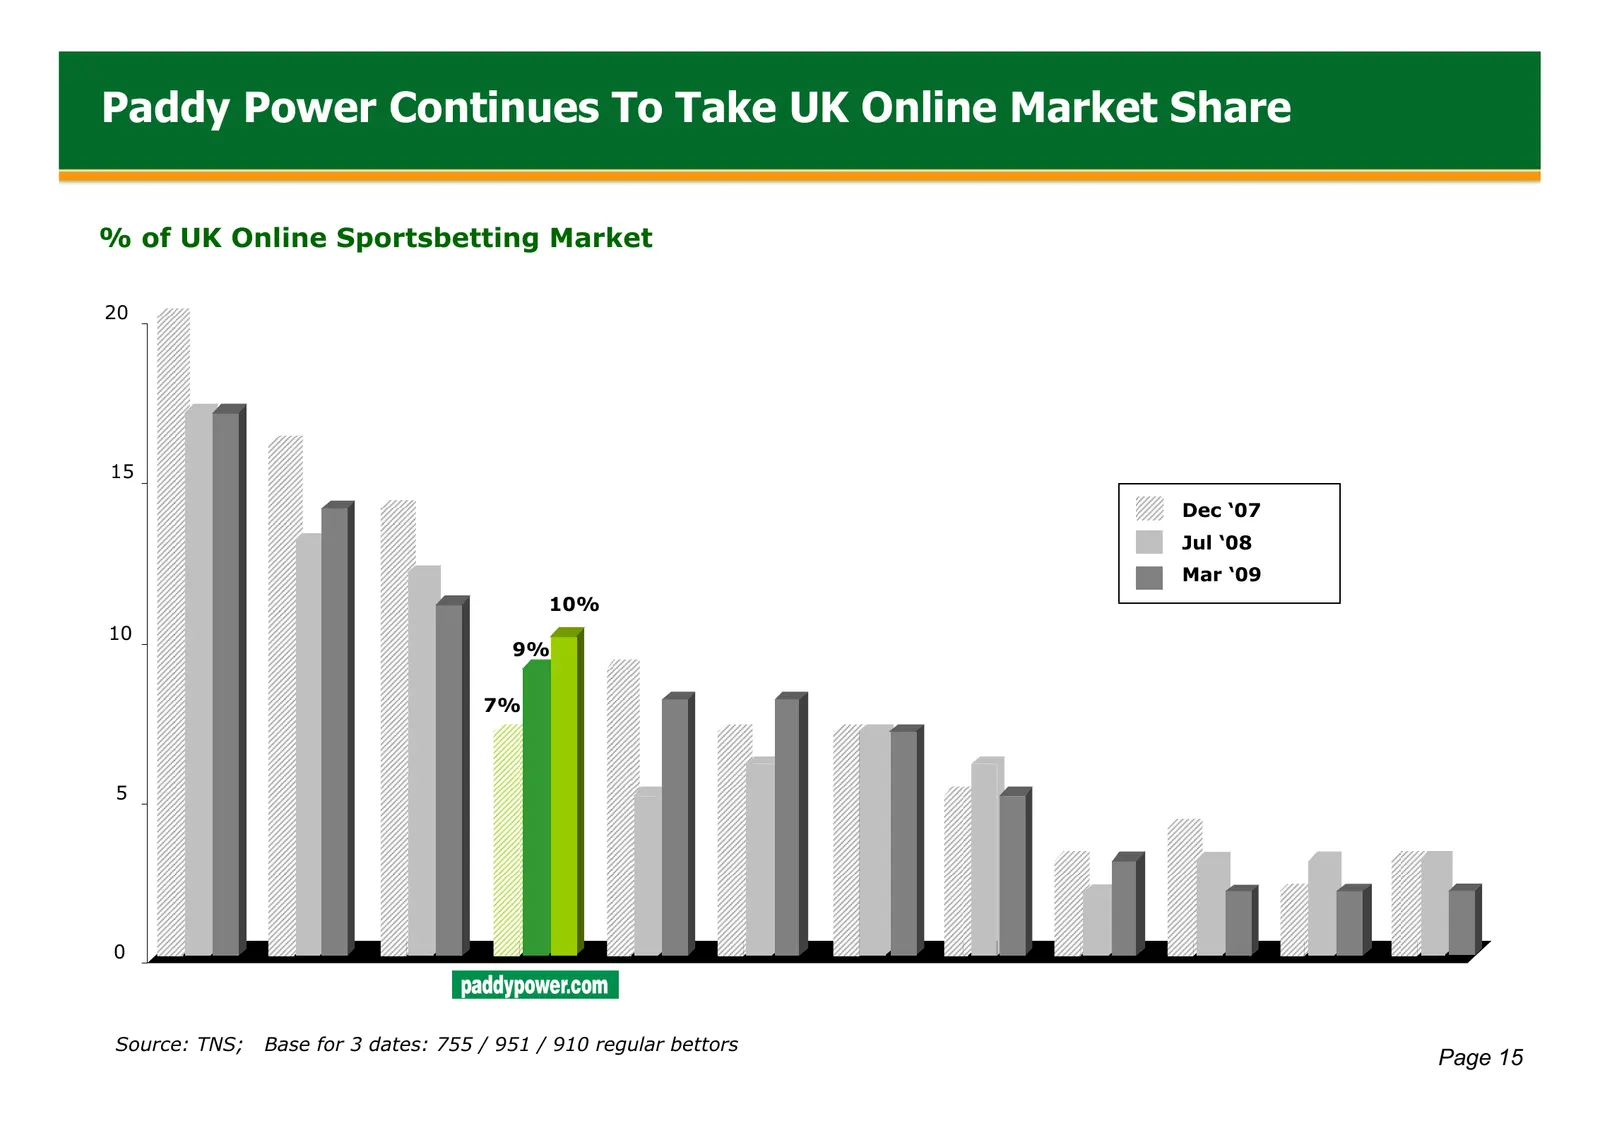
Paddy Power Continues To Take UK Online Market Share % of UK Online Sportsbetting Market 20 15 Dec ‘07 Jul ‘08 Mar ‘09 10% 10 9% 7% 5 0 Source: TNS; Base for 3 dates: 755 / 951 / 910 regular bettors Page 15
Slide 17: Irish Retail
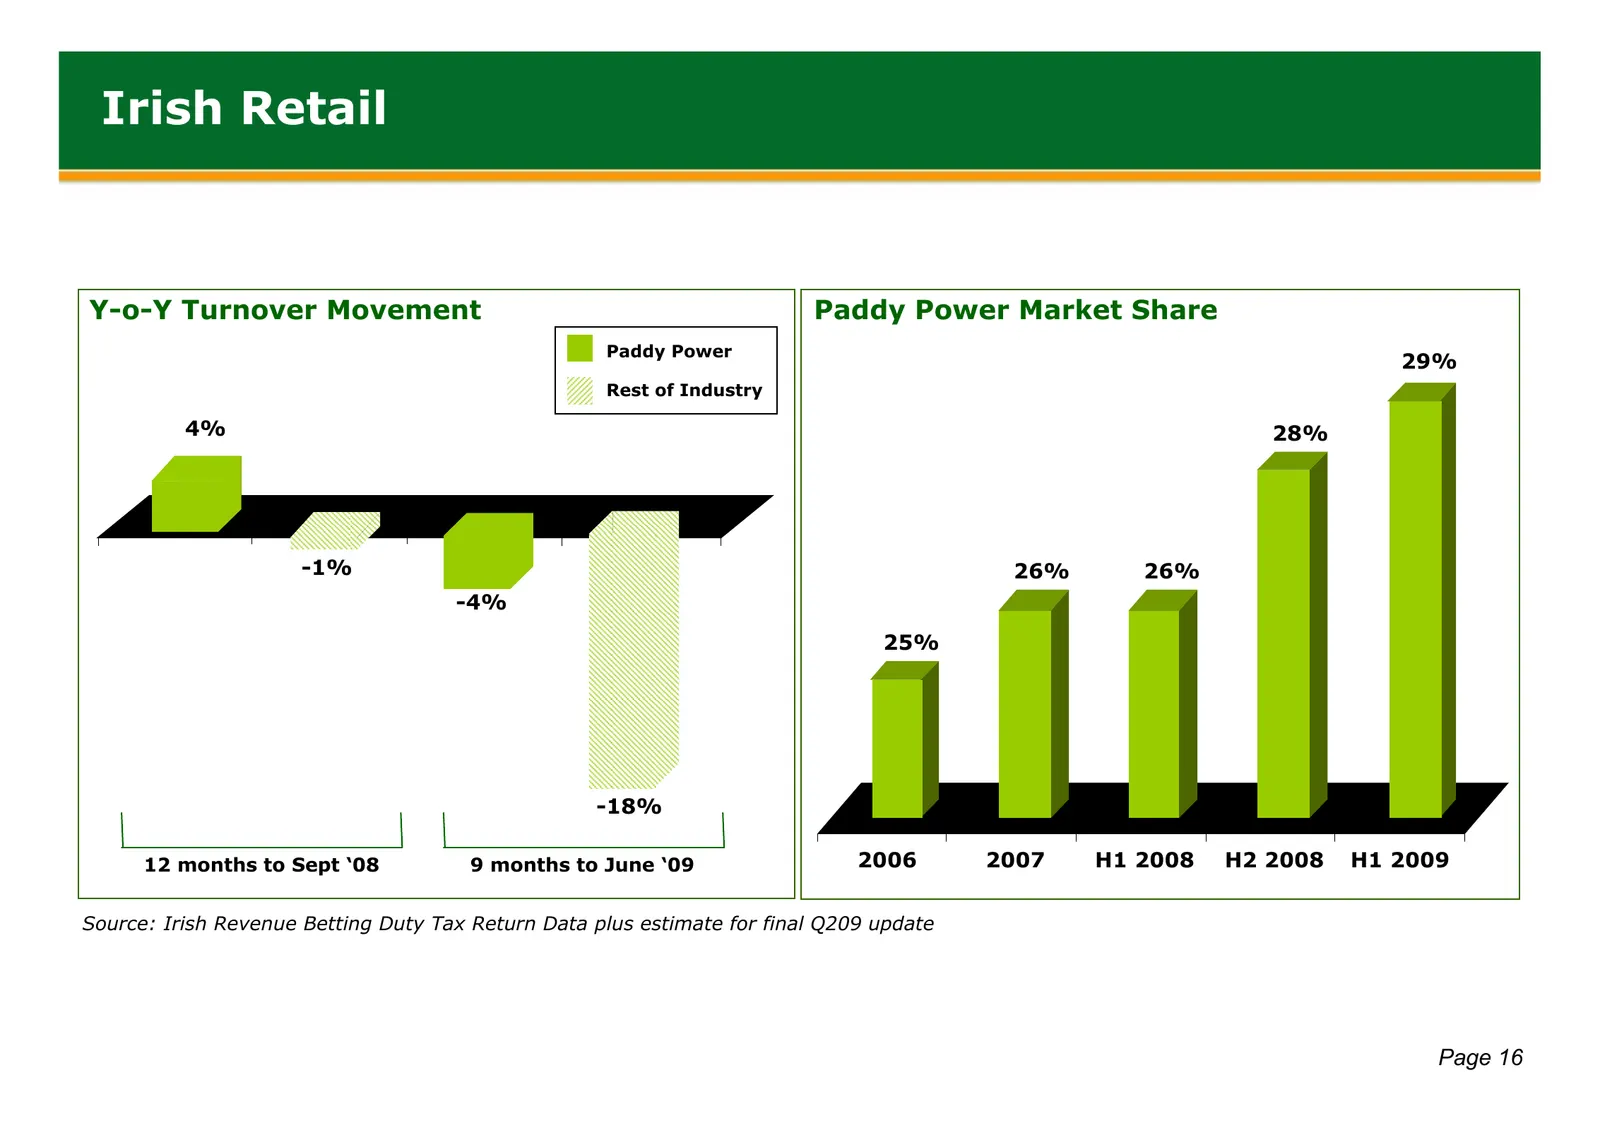
Irish Retail Y-o-Y Turnover Movement Paddy Power Market Share Paddy Power 29% Rest of Industry 4% 28% -1% 26% 26% -4% 25% -18% 12 months to Sept ‘08 9 months to June ‘09 2006 2007 H1 2008 H2 2008 H1 2009 Source: Irish Revenue Betting Duty Tax Return Data plus estimate for final Q209 update Page 16
Slide 18: Irish Retail
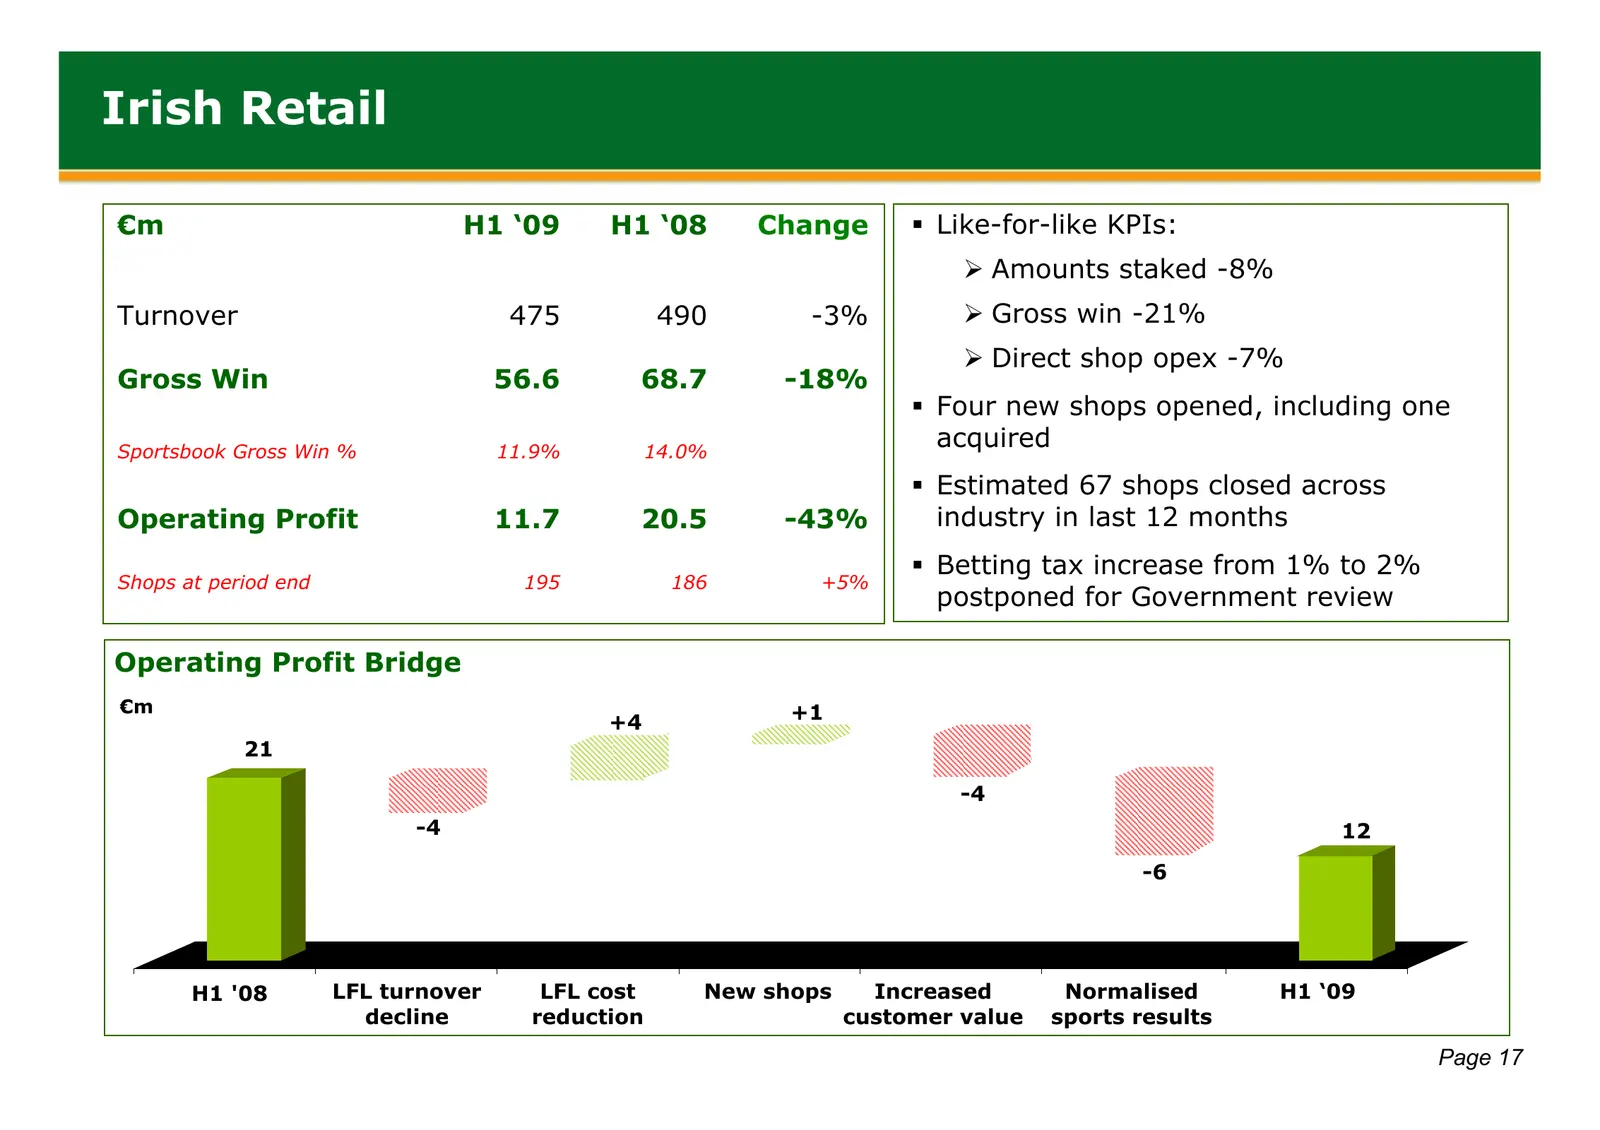
Irish Retail €m H1 ‘09 H1 ‘08 Change Like-for-like KPIs: ¾ Amounts staked -8% Turnover 475 490 -3% ¾ Gross win -21% ¾ Direct shop opex -7% Gross Win 56.6 68.7 -18% Four new shops opened, including one Sportsbook Gross Win % 11.9% 14.0% acquired Estimated 67 shops closed across Operating Profit
Slide 19: UK Retail
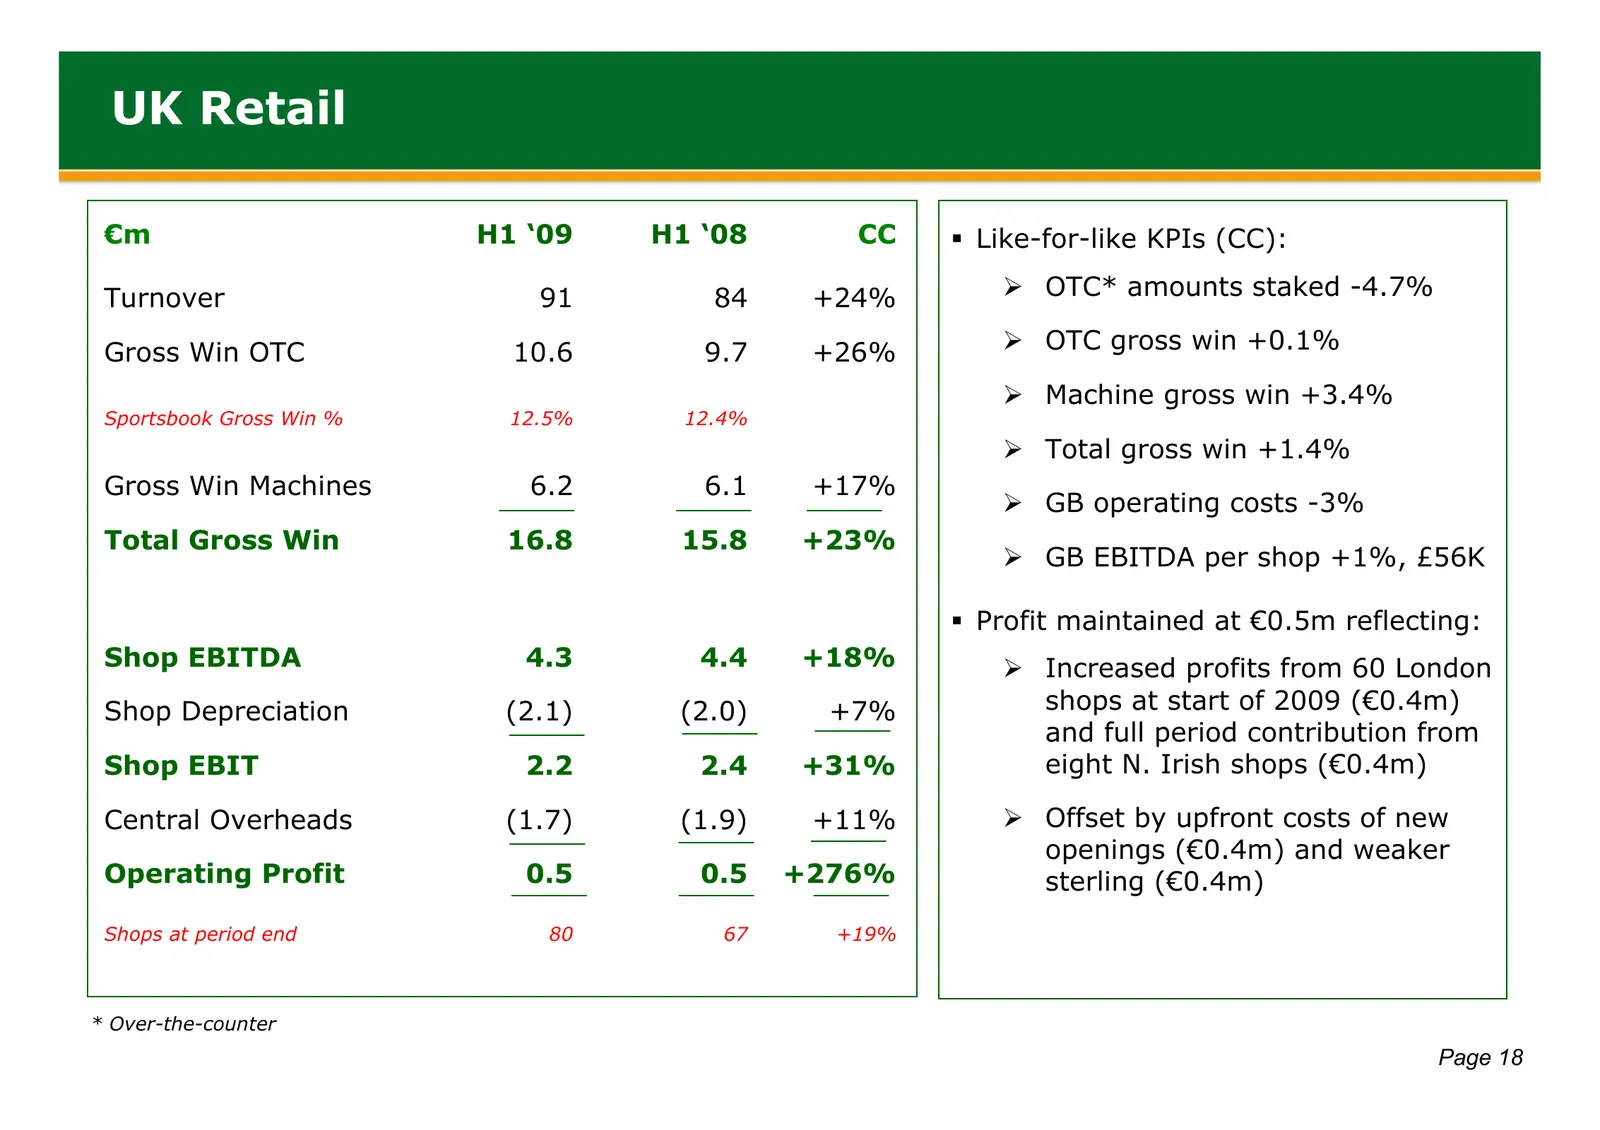
UK Retail €m H1 ‘09 H1 ‘08 CC Like-for-like KPIs (CC): Turnover 91 84 +24% ¾ OTC* amounts staked -4.7% Gross Win OTC 10.6 9.7 +26% ¾ OTC gross win +0.1% ¾ Machine gross win +3.4% Sportsbook Gross Win % 12.5% 12.4% ¾ Total gross win +1.4% Gross Win Machines 6.2 6.1 +17% ¾ GB operating costs -3% Tot
Slide 20: UK Retail: Openings Year to Date
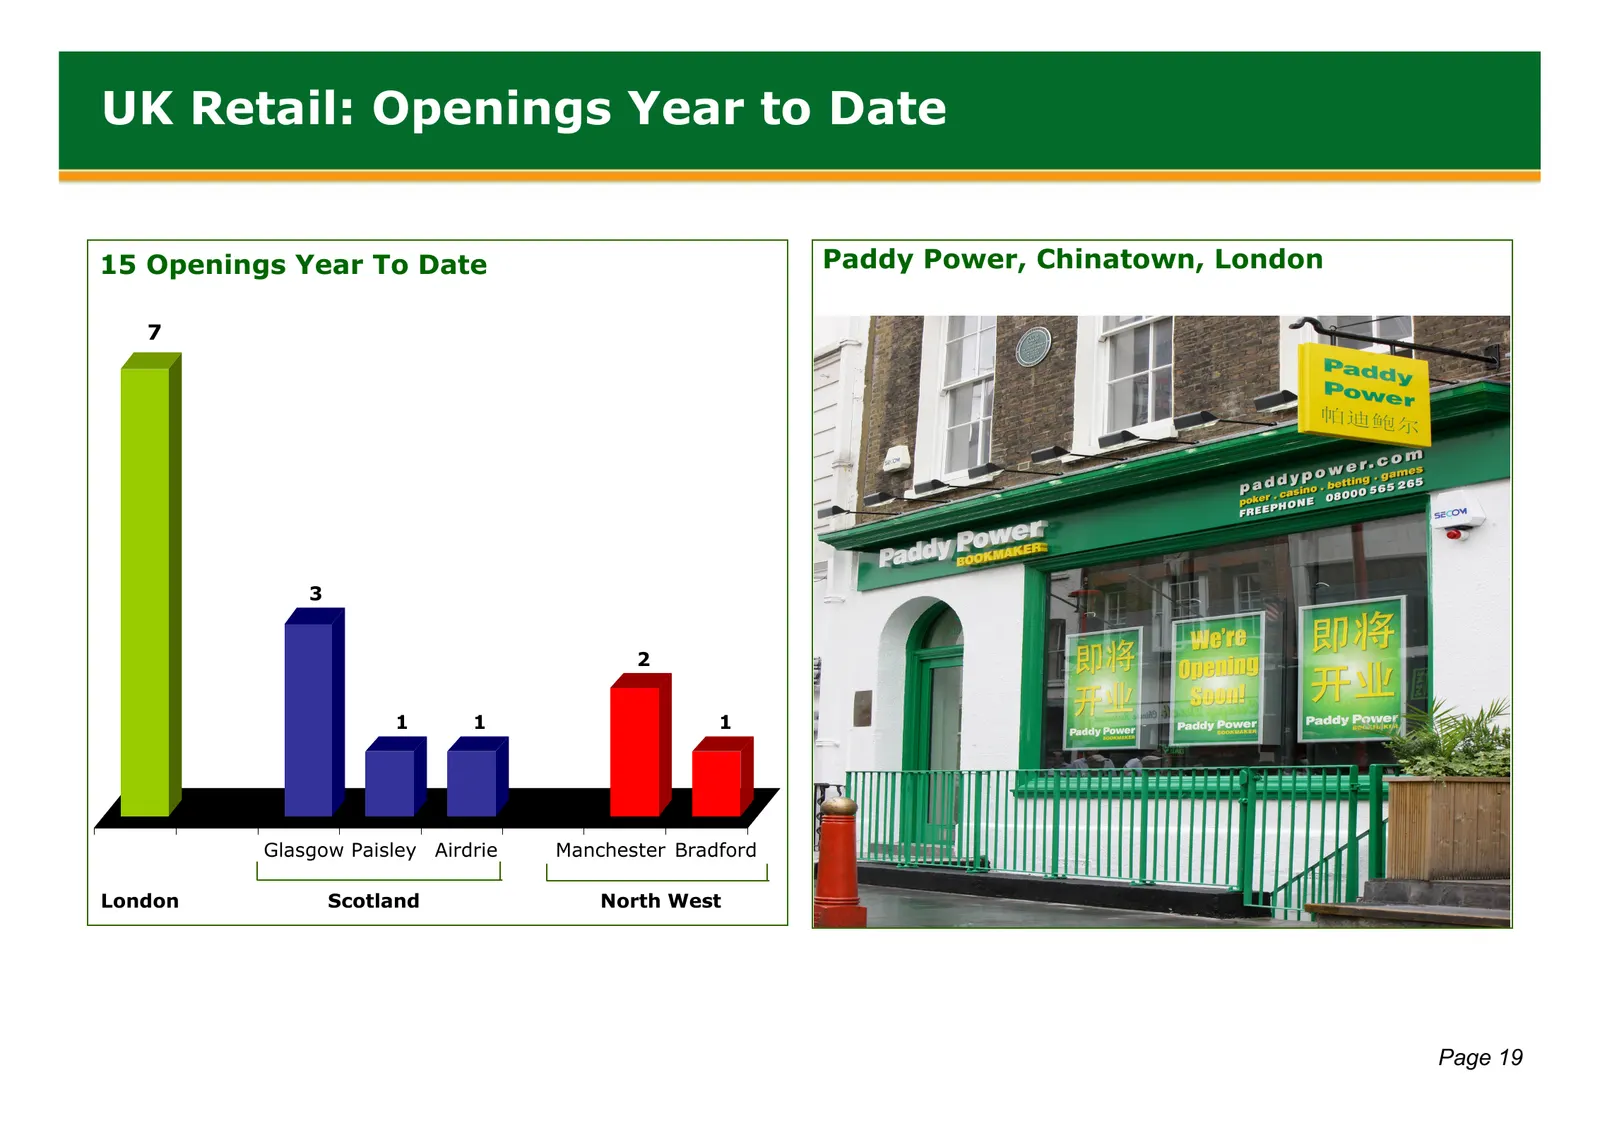
UK Retail: Openings Year to Date 15 Openings Year To Date Paddy Power, Chinatown, London 7 3 2 1 1 1 Glasgow Paisley Airdrie Manchester Bradford London Scotland North West Page 19
Slide 21: GB Retail: Return on Capital
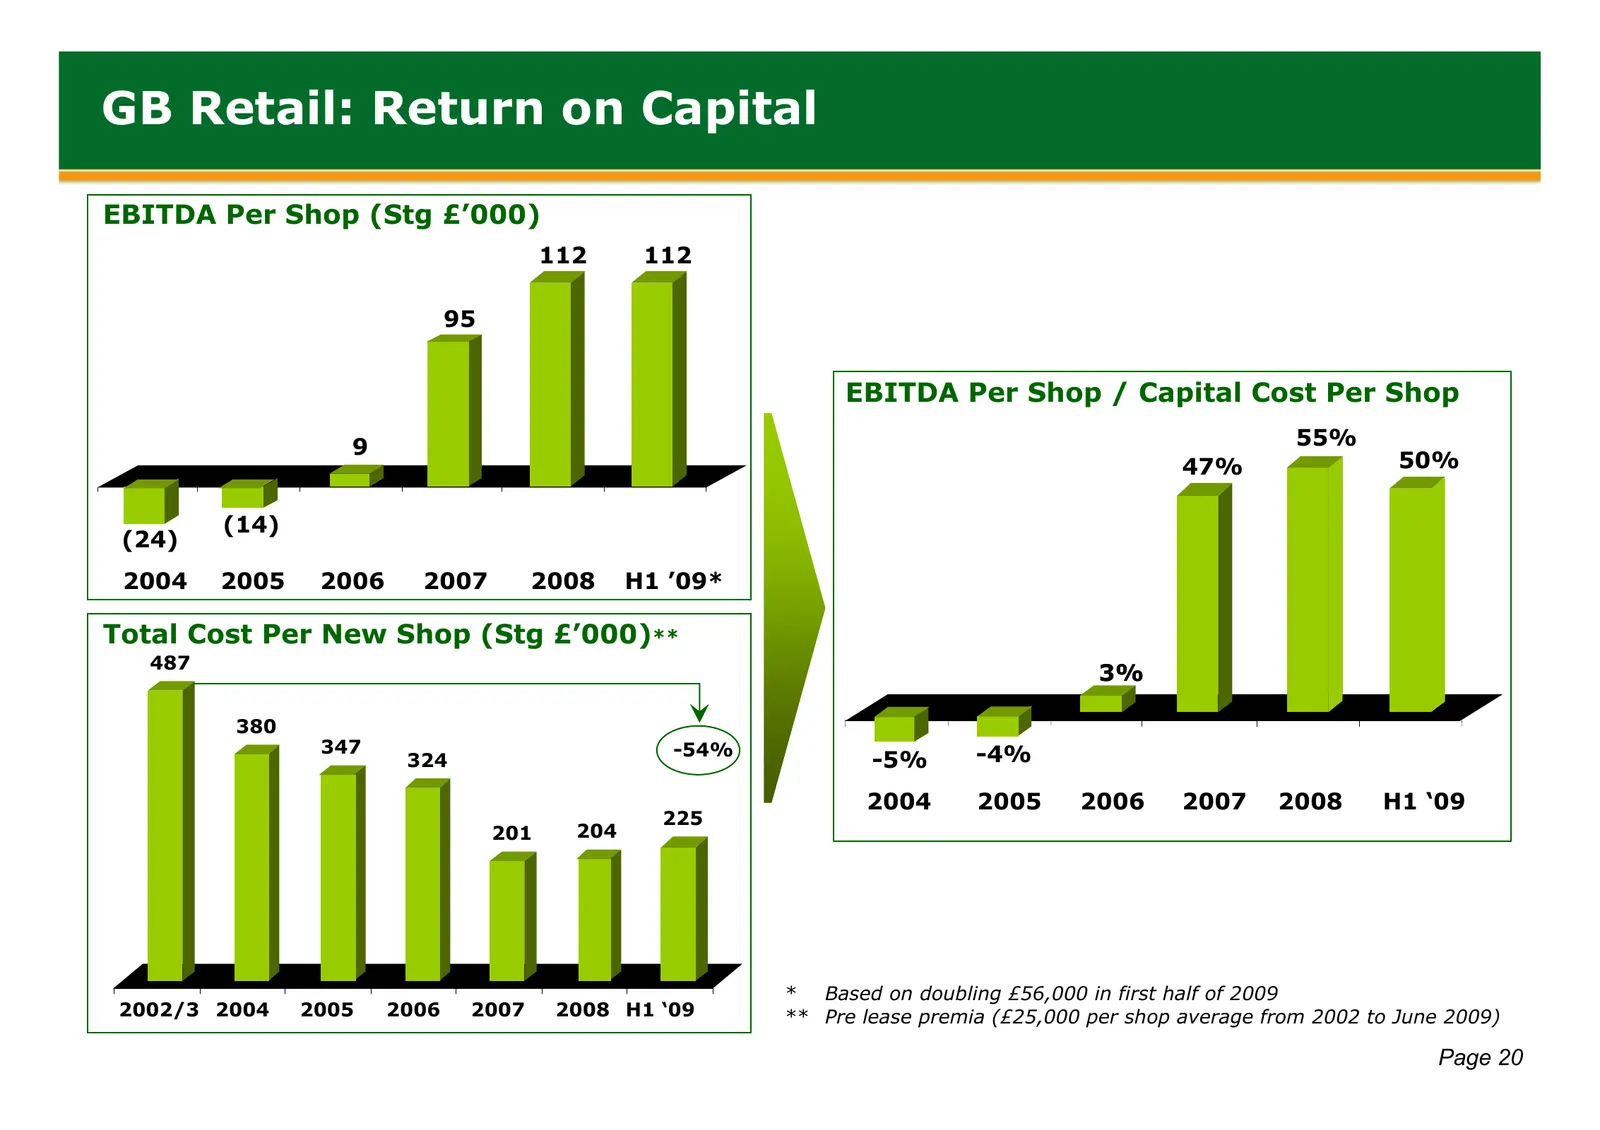
GB Retail: Return on Capital EBITDA Per Shop (Stg £’000) 112 112 95 EBITDA Per Shop / Capital Cost Per Shop 9 55% 47% 50% (14) (24) 2004 2005 2006 2007 2008 H1 ’09* Total Cost Per New Shop (Stg £’000)** 487 3% 380 347 -54% -4% 324 -5% 2004 2005 2006 2007 2008 H1 ‘09 225 201 204 * Based on doubling £
Slide 22: Telephone
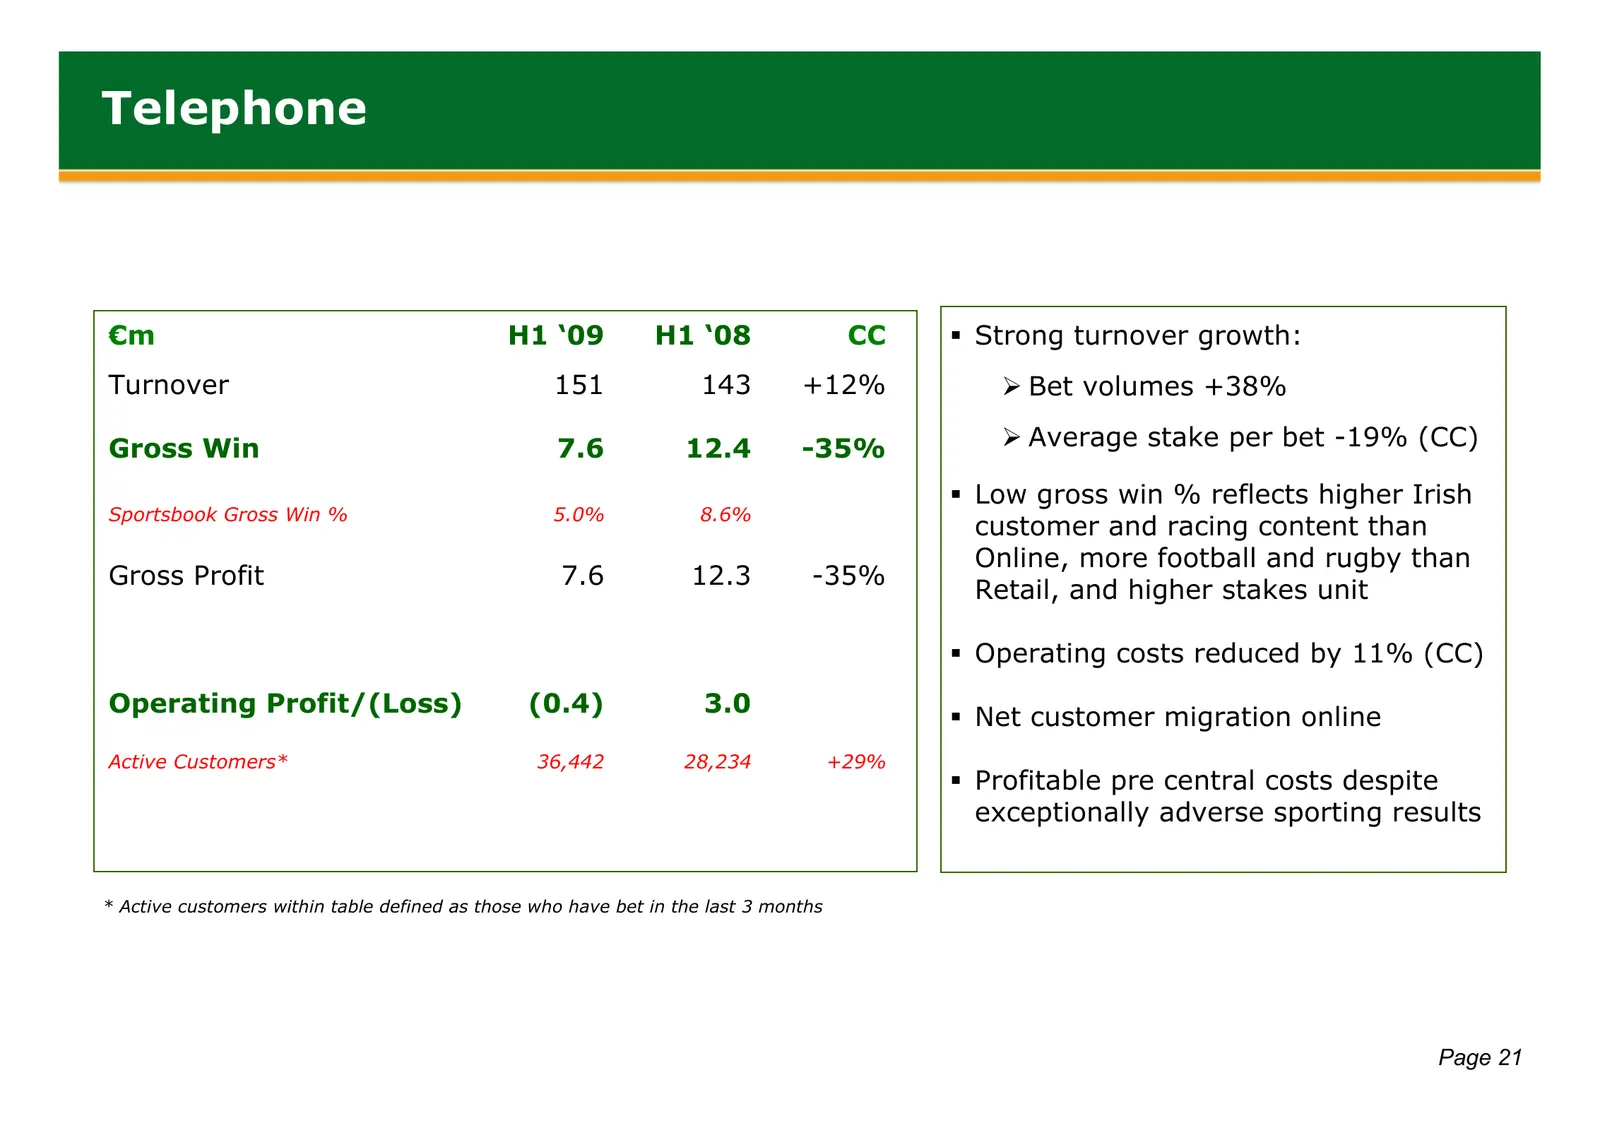
Telephone €m H1 ‘09 H1 ‘08 CC Strong turnover growth: Turnover 151 143 +12% ¾ Bet volumes +38% Gross Win 7.6 12.4 -35% ¾ Average stake per bet -19% (CC) Low gross win % reflects higher Irish Sportsbook Gross Win % 5.0% 8.6% customer and racing content than Online, more football and rugby than Gr
Slide 23: Strategy & Outlook
Strategy & Outlook Introduction Financial Performance Operational Review Strategy & Outlook Page 22
Slide 24: Reason to bet with paddypower.com
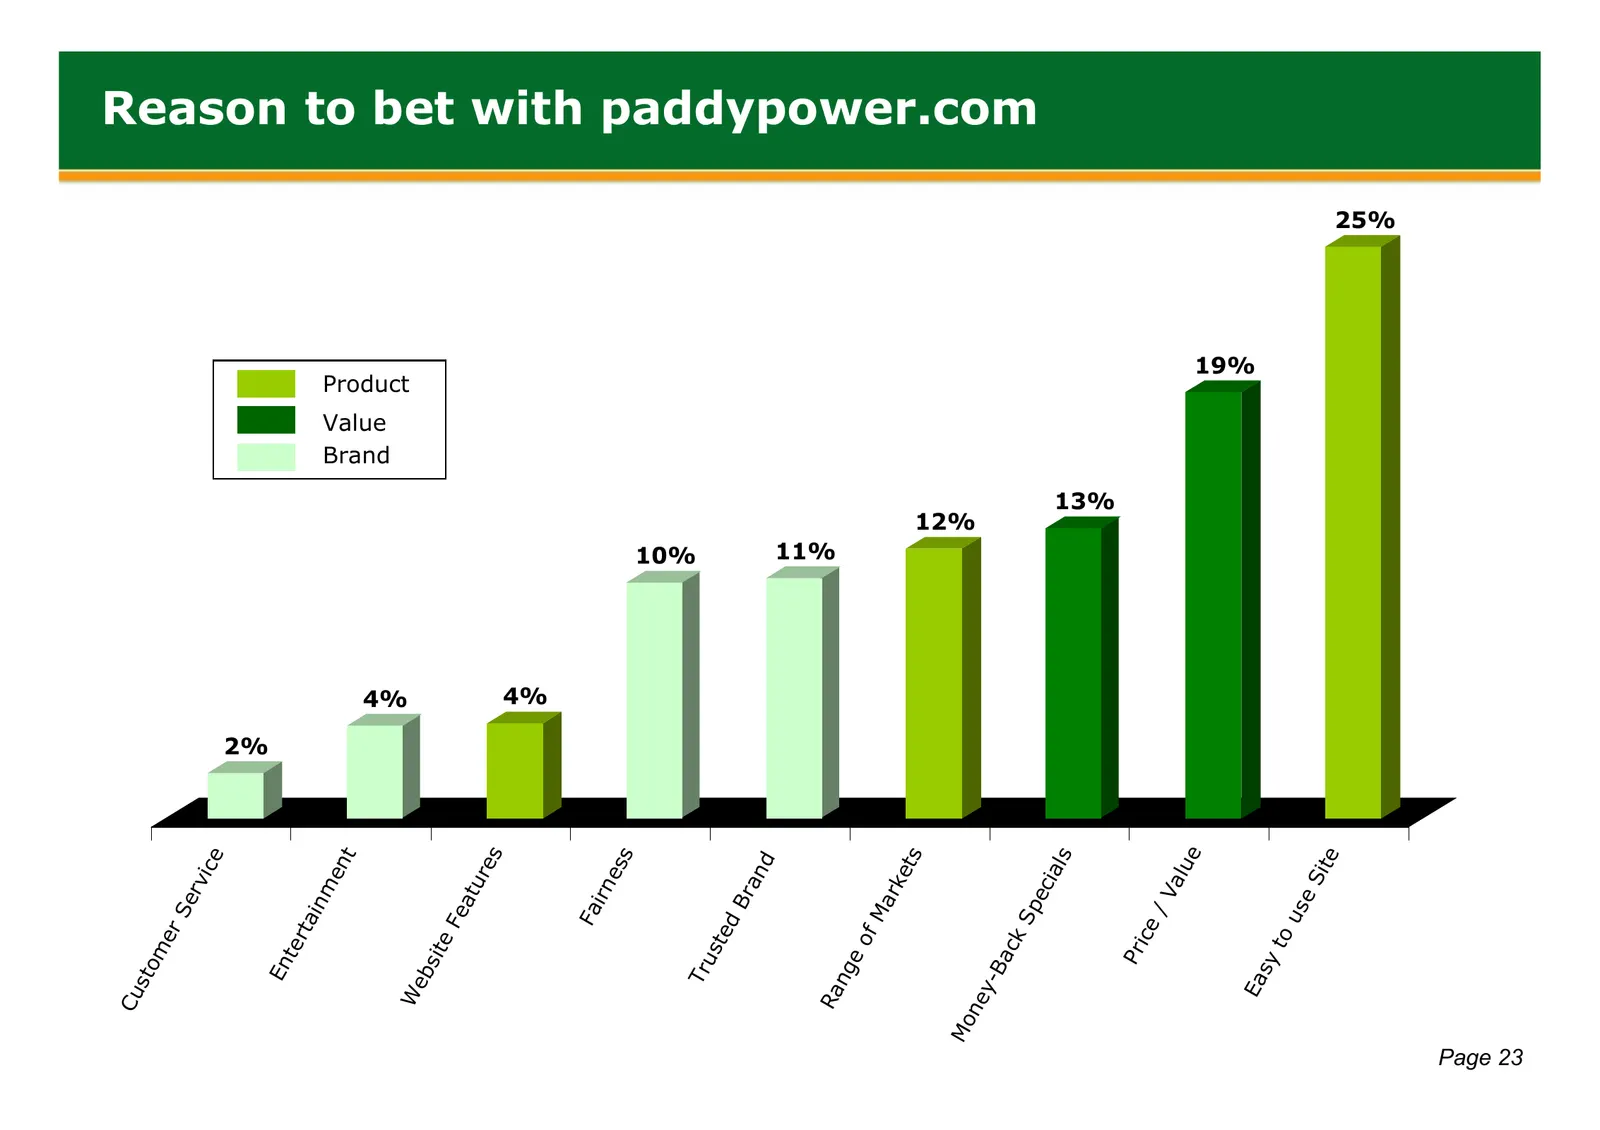
Cu sto me r Se rv ice 2% En ter tai nm en t Value Brand 4% Product We bs ite Fe atu re s 4% Fa ir n es s 10% Tr us ted Br an d 11% Ra ng eo fM ar ke ts 12% Mo ne y -B ac kS Reason to bet with paddypower.com pe cia ls 13% Pr ice / Va lue 19% Ea sy to u se Sit e 25% Page 23
Slide 25: Value: Early, Extra and Justice Payouts
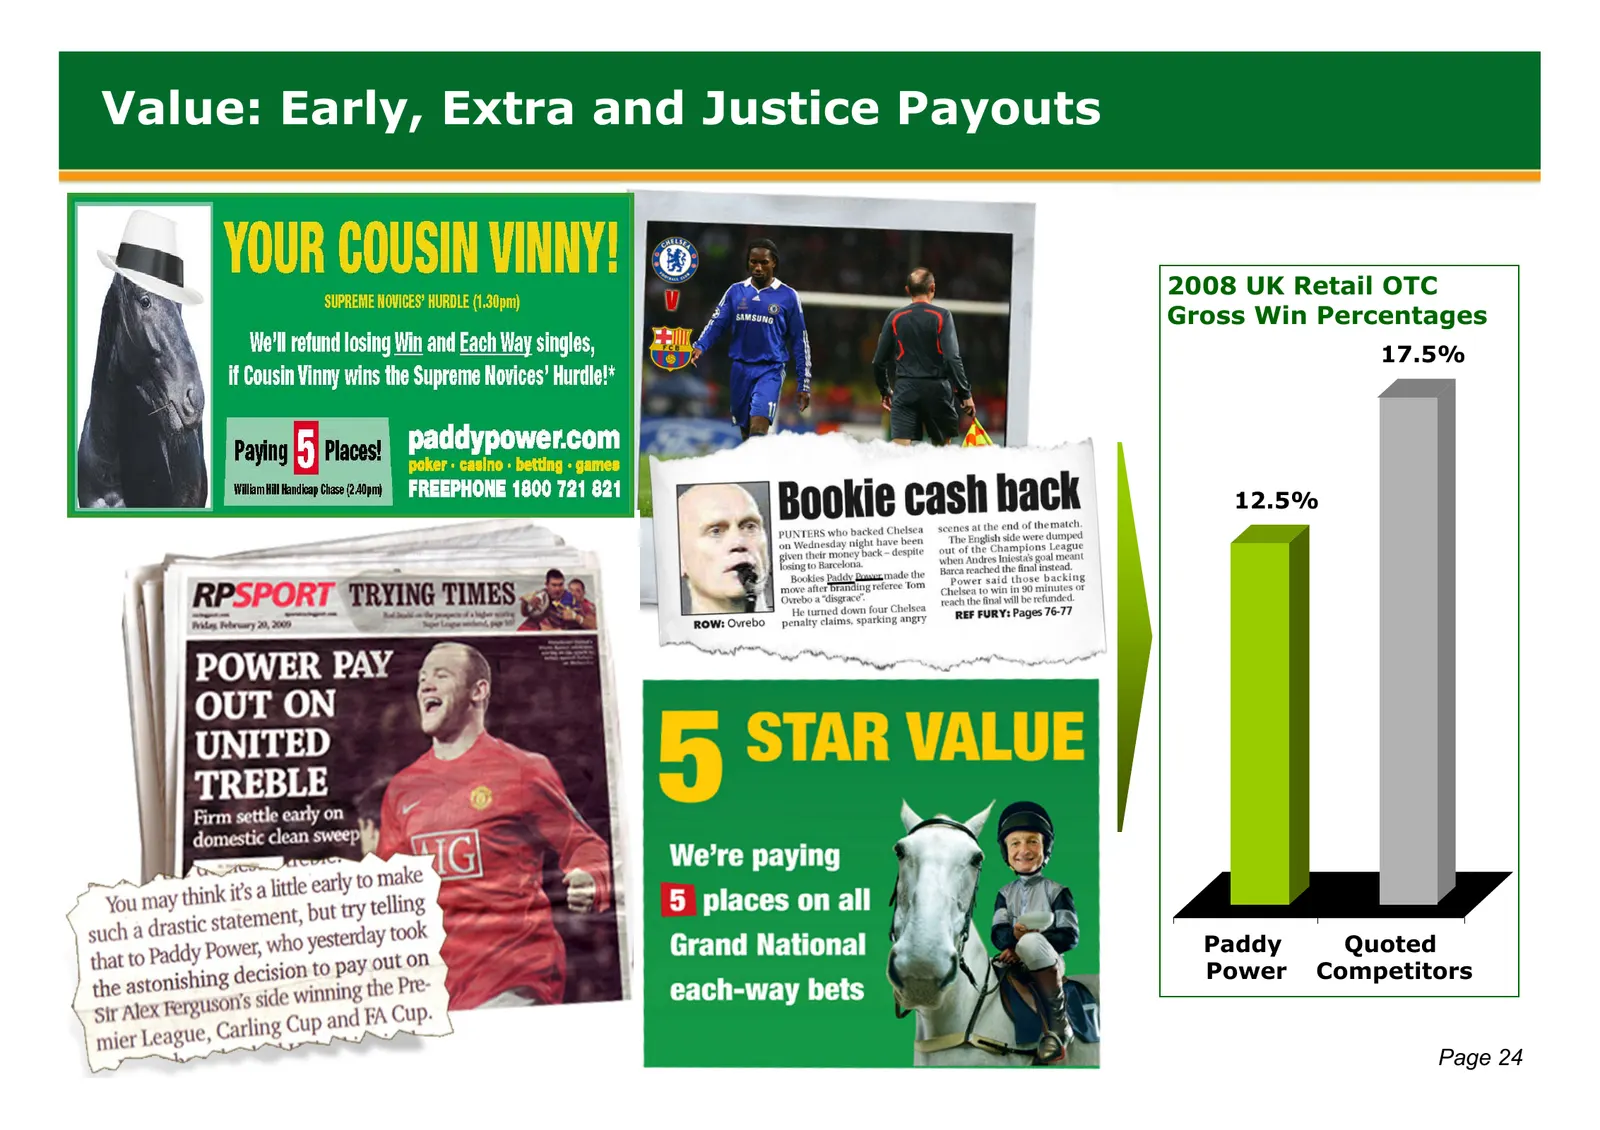
Value: Early, Extra and Justice Payouts 2008 UK Retail OTC Gross Win Percentages 17.5% 12.5% Paddy Quoted Power Competitors Page 24
Slide 26: Product: Event and Market Expansion
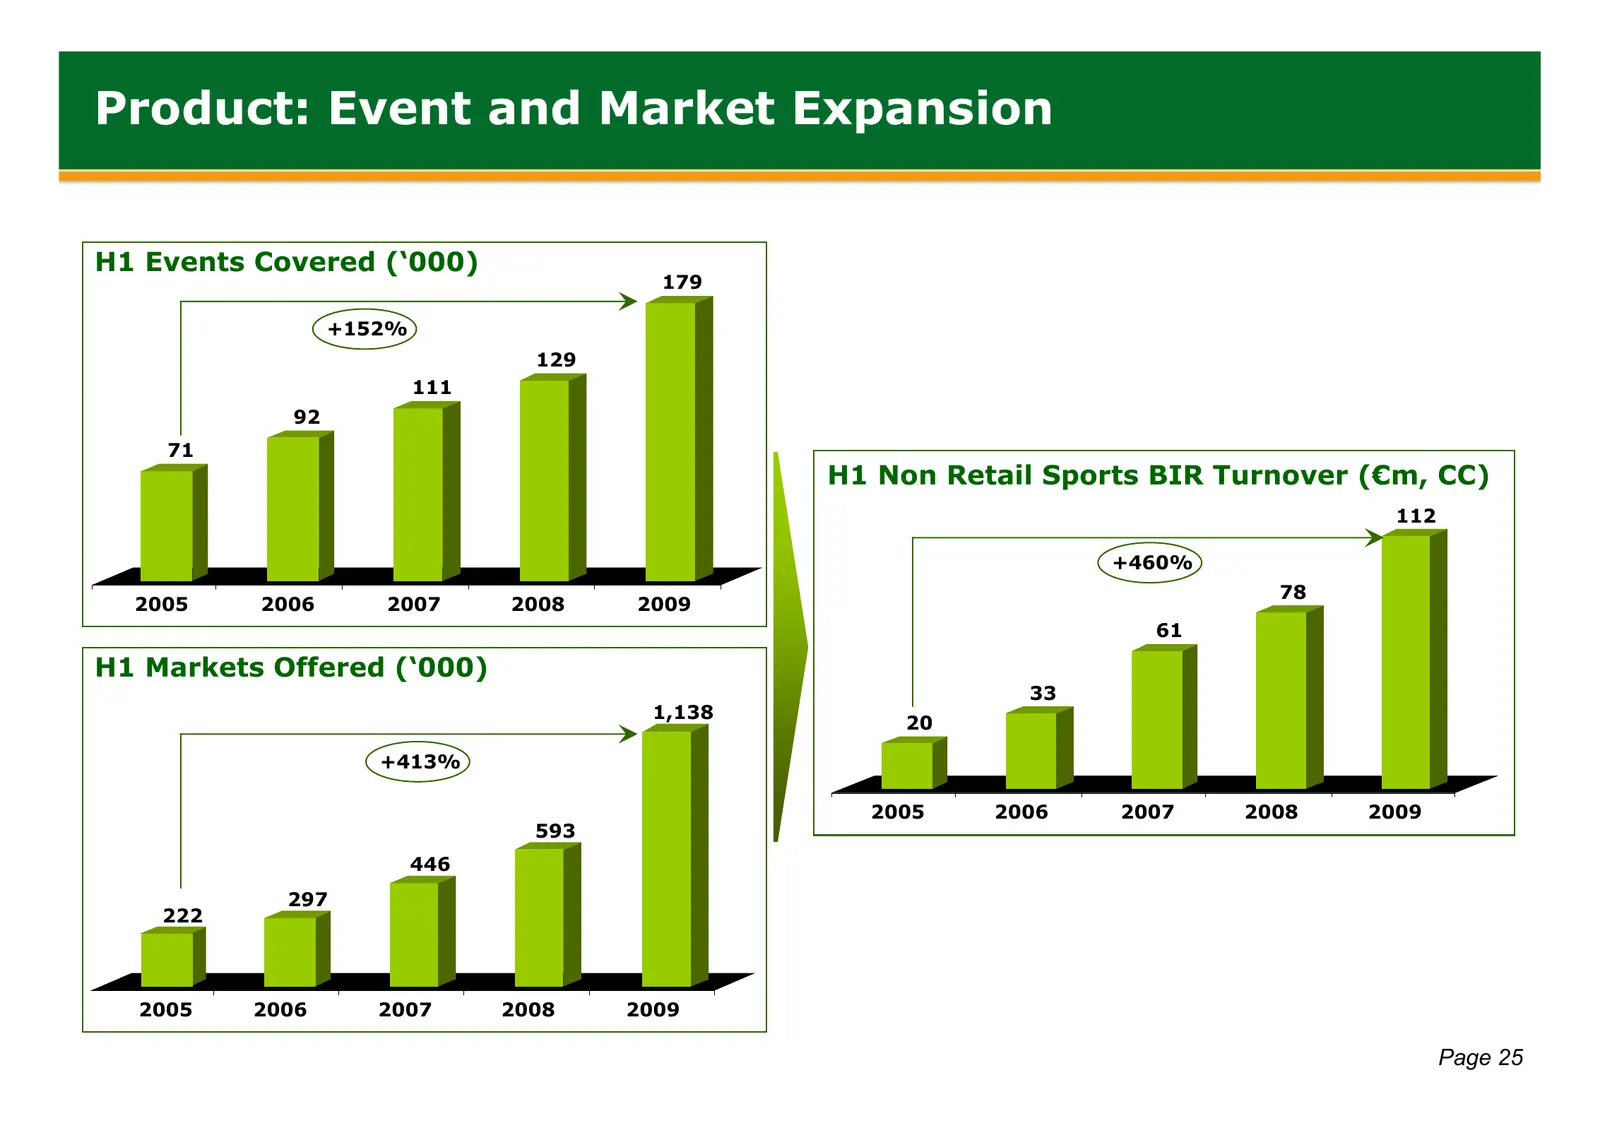
Product: Event and Market Expansion H1 Events Covered (‘000) 179 +152% 129 111 92 7 71 H1 Non Retail Sports BIR Turnover (€m, CC) 112 +460% 78 2005 2006 2007 2008 2009 61 H1 Markets Offered (‘000) 33 1,138 20 +413% 2005 2006 2007 2008 2009 593 446 297 222 2005 2006 2007 2008 2009 Page 25

Slide 27: Brand
Brand Next Labour Shamrock Rovers Leader v Real Madrid TV Campaign Dip In The Nip! Page 26
Slide 28: Australian Expansion
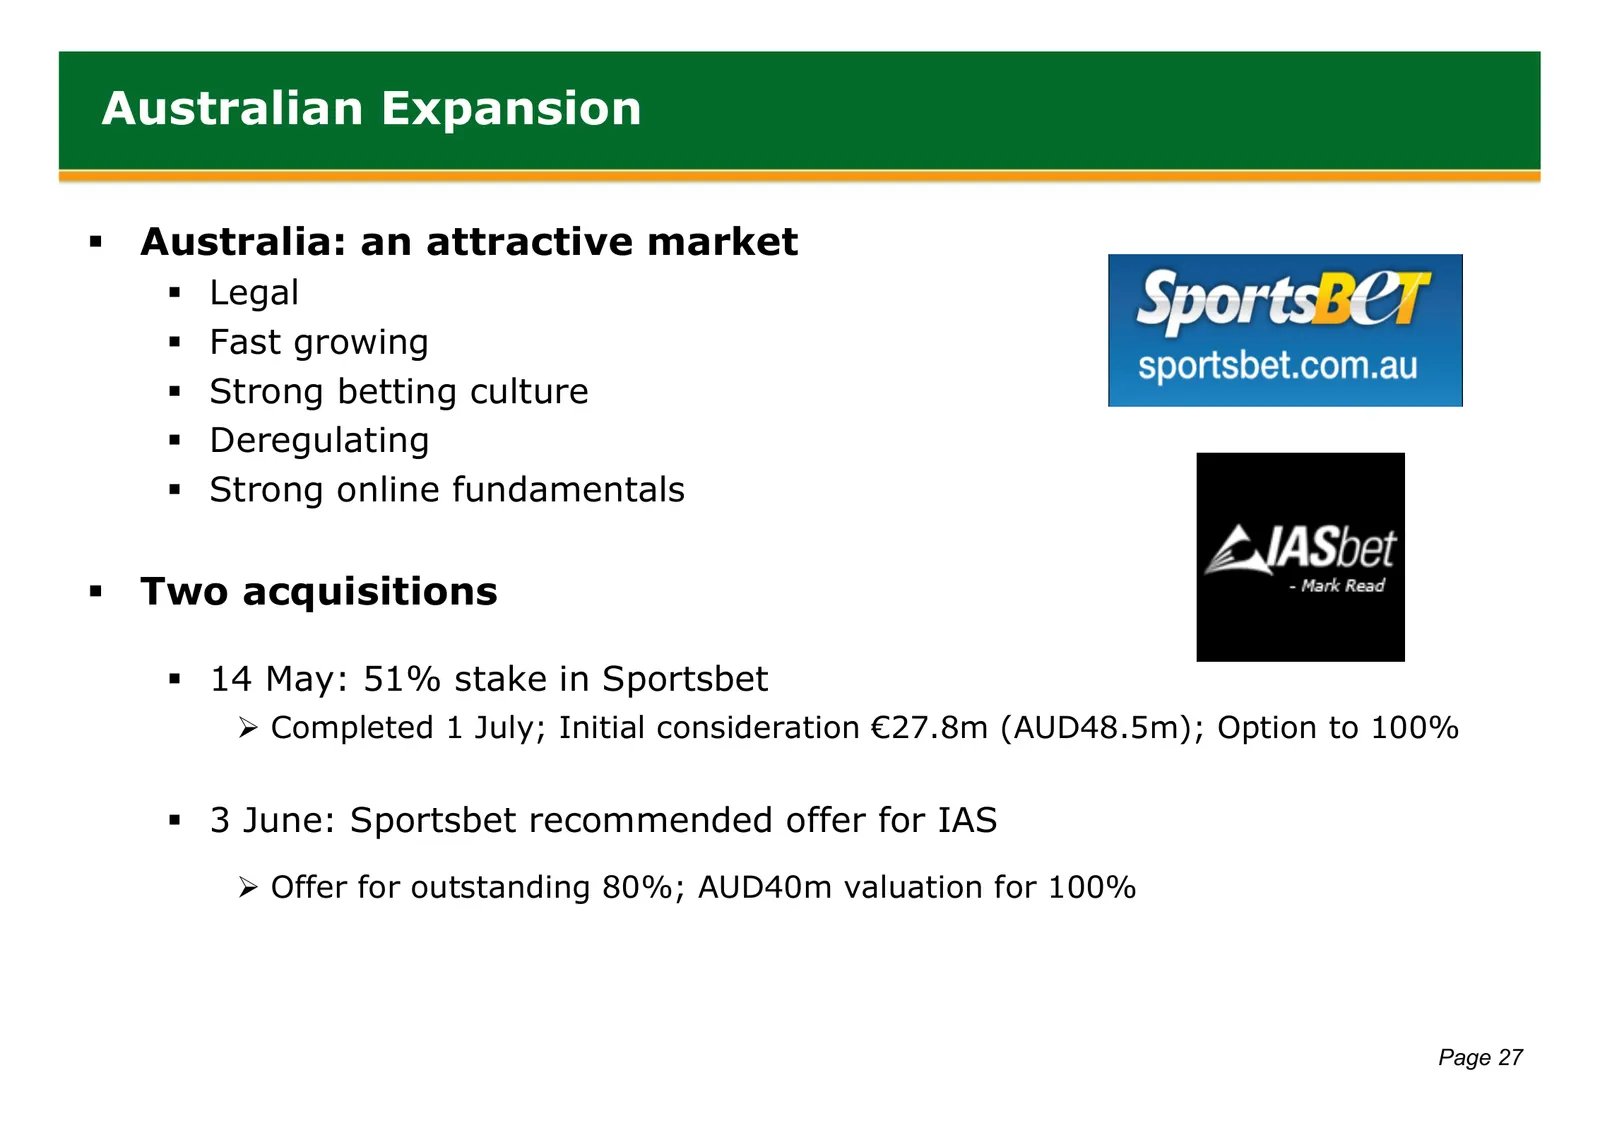
Australian Expansion Australia: an attractive market Legal Fast growing Strong betting culture Deregulating Strong online fundamentals Two acquisitions 14 May: 51% stake in Sportsbet ¾ Completed 1 July; Initial consideration €27.8m (AUD48.5m); Option to 100% 3 June: Sportsbet recom
Slide 29: Update
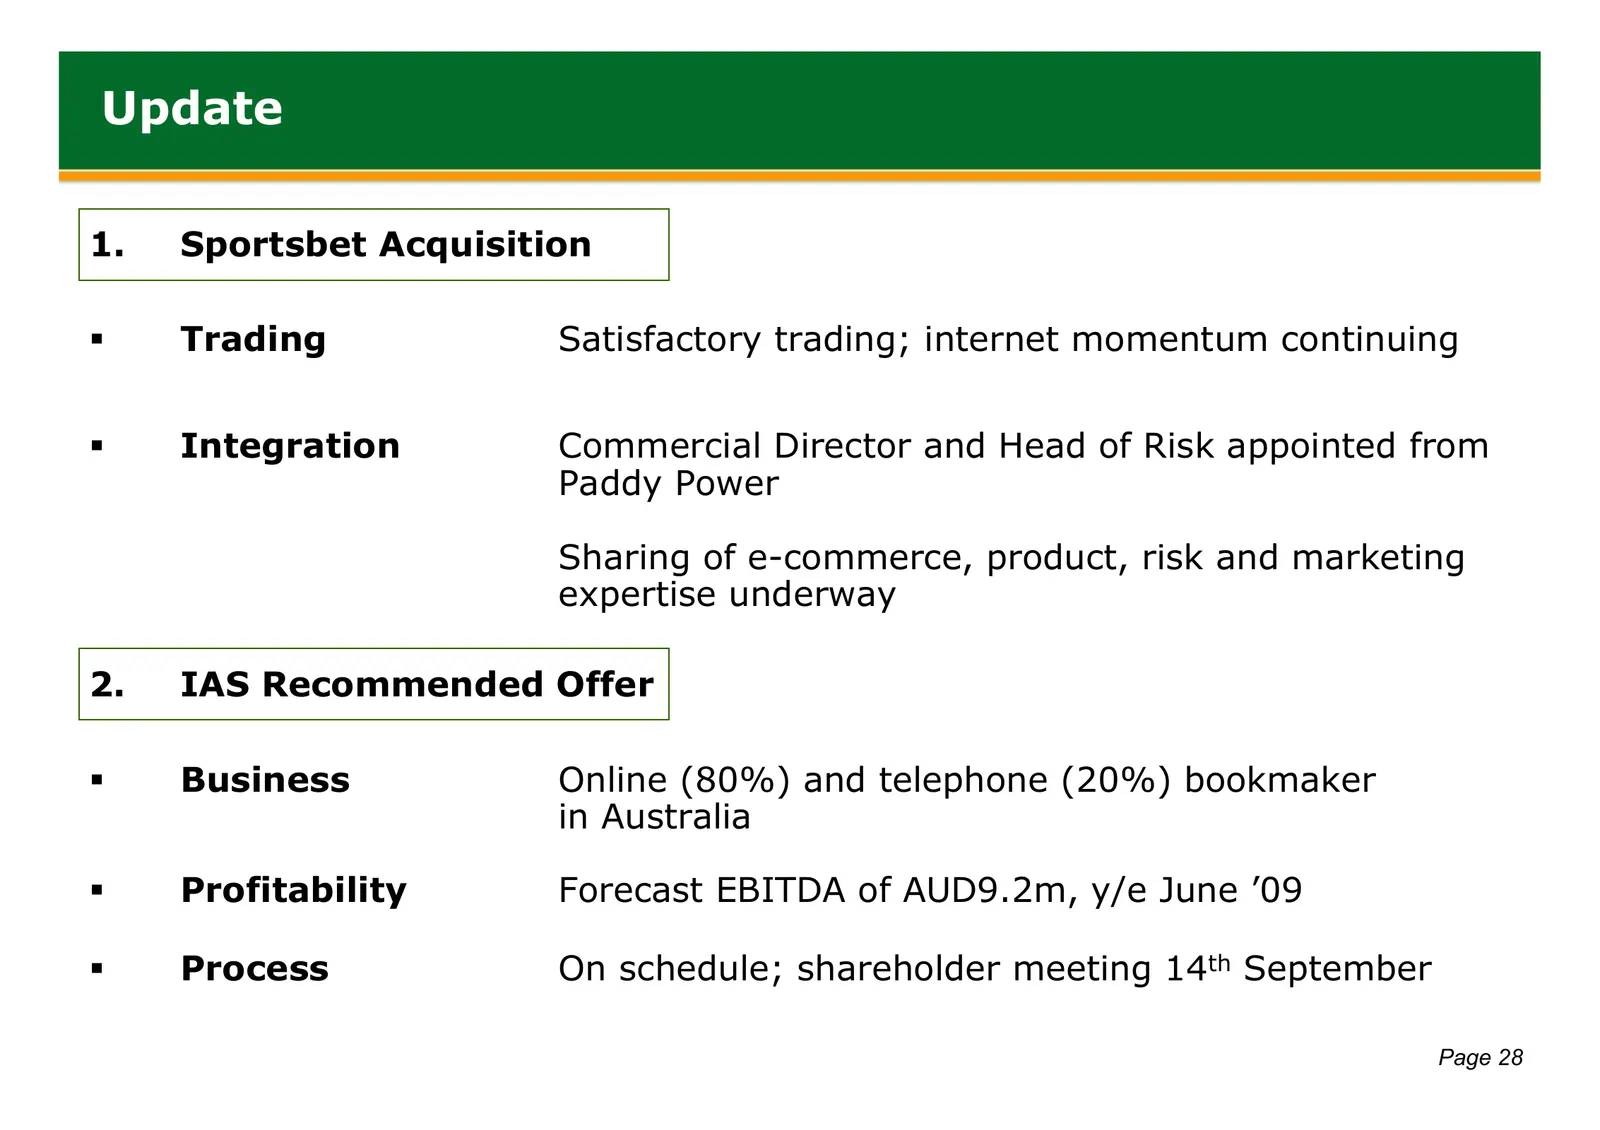
Update 1. Sportsbet Acquisition Trading Satisfactory trading; internet momentum continuing Integration Commercial Director and Head of Risk appointed from Paddy Power Sharing of e-commerce, product, risk and marketing expertise underway 2. IAS Recommended Offer Business Online (80%) and teleph
Slide 30: Australian Online Betting Market
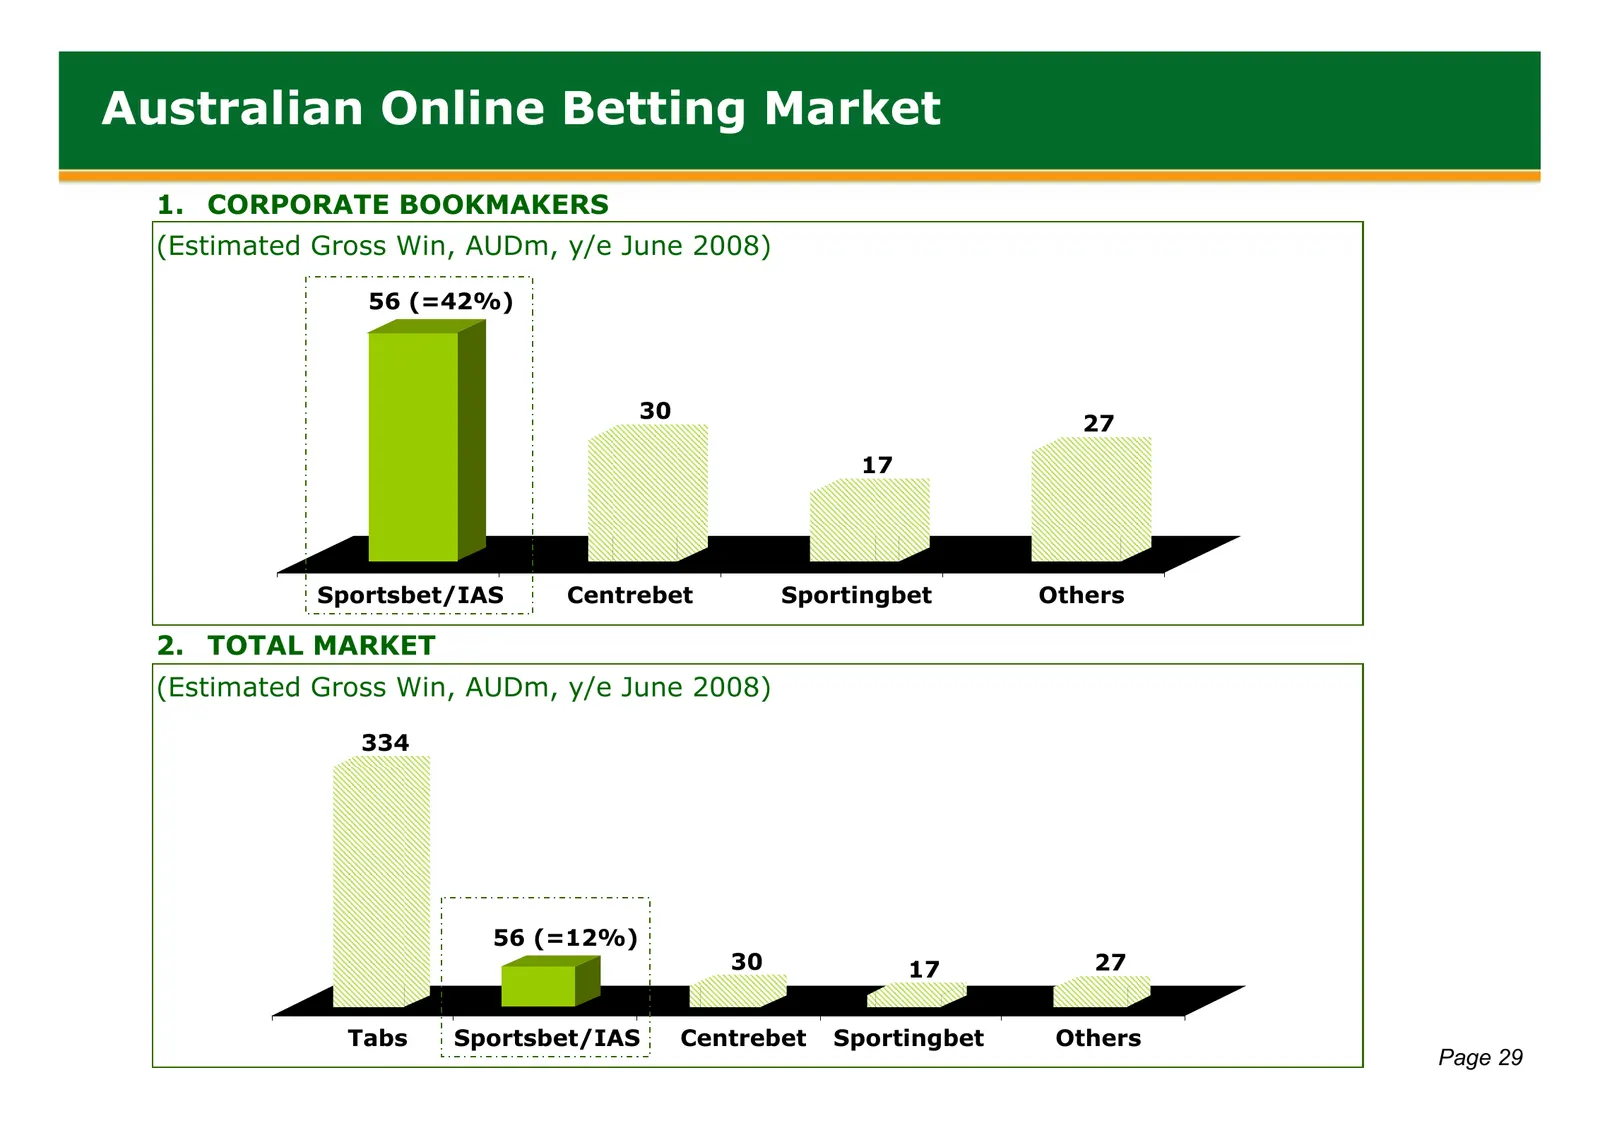
Australian Online Betting Market 1. CORPORATE BOOKMAKERS (Estimated Gross Win, AUDm, y/e June 2008) 56 (=42%) 30 27 17 Sportsbet/IAS Centrebet Sportingbet Others 2. TOTAL MARKET (Estimated Gross Win, AUDm, y/e June 2008) 334 56 (=12%) 30 17 27 Tabs Sportsbet/IAS Centrebet Sportingbet Others Page 29
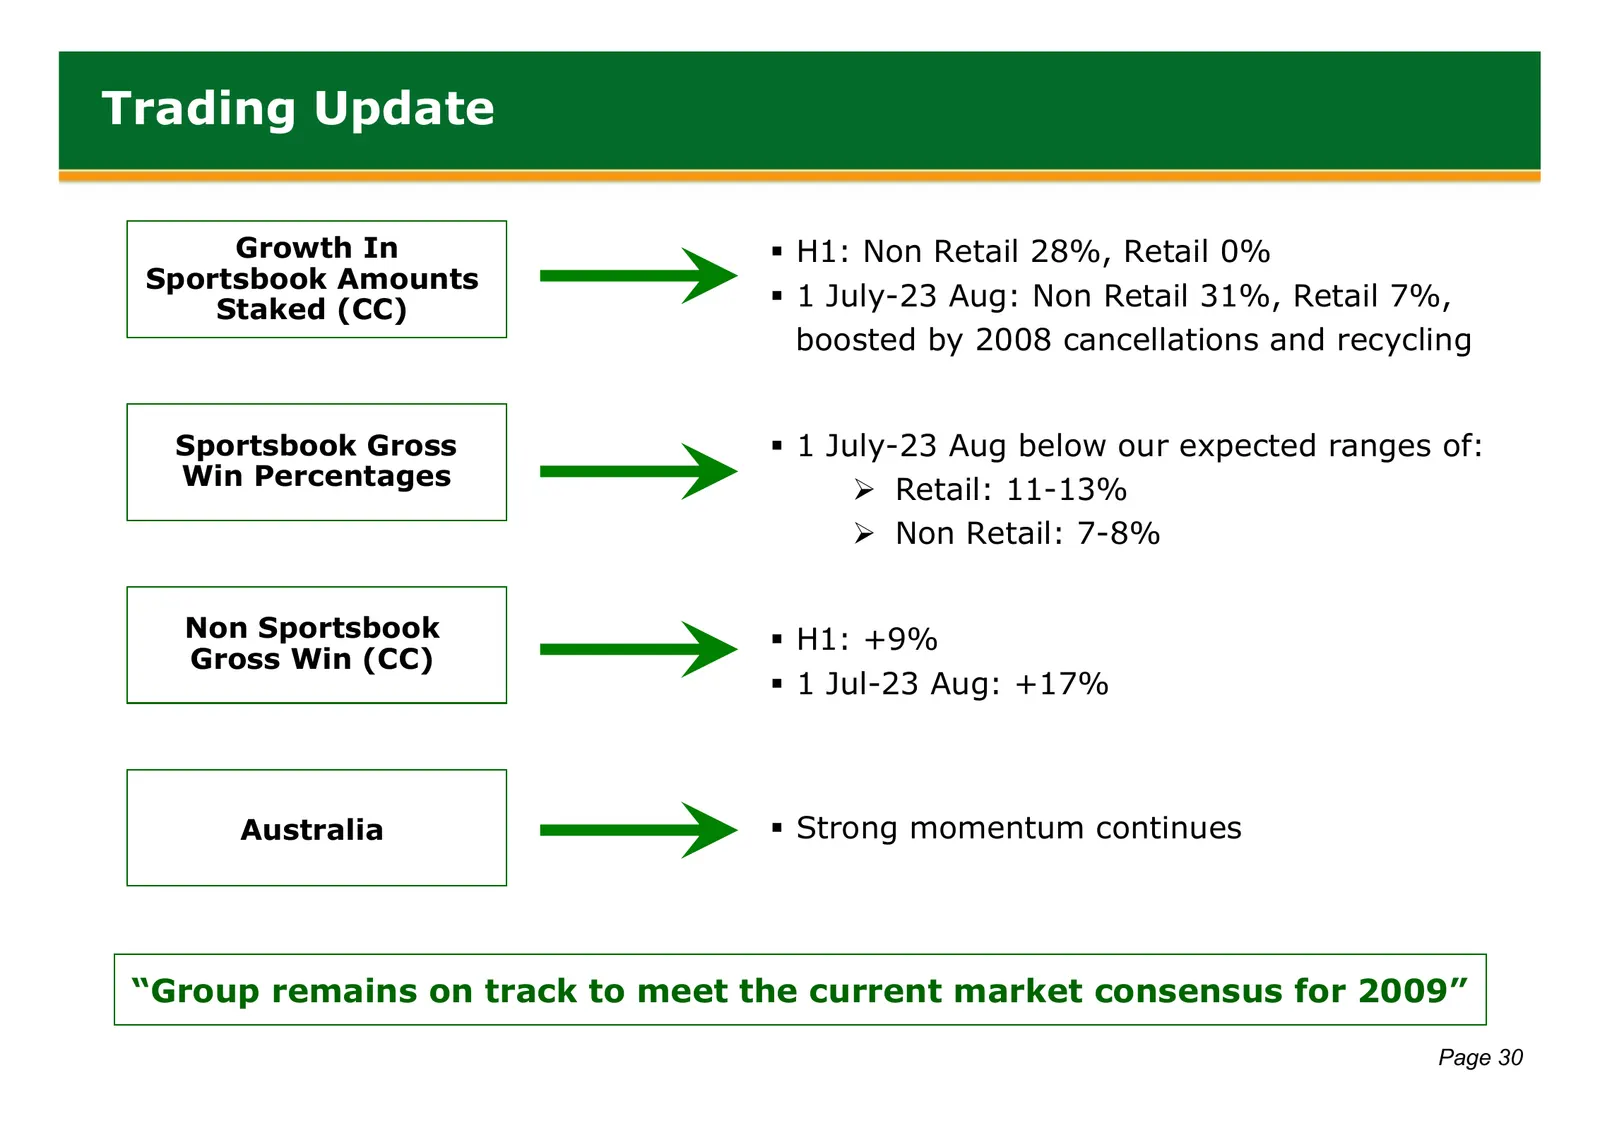
Slide 31: Trading Update
Trading Update Growth In H1: Non Retail 28%, Retail 0% Sportsbook Amounts Staked (CC) 1 July-23 Aug: Non Retail 31%, Retail 7%, boosted by 2008 cancellations and recycling Sportsbook Gross 1 July-23 Aug below our expected ranges of: Win Percentages ¾ Retail: 11-13% ¾ Non Retail: 7-8% Non Sport
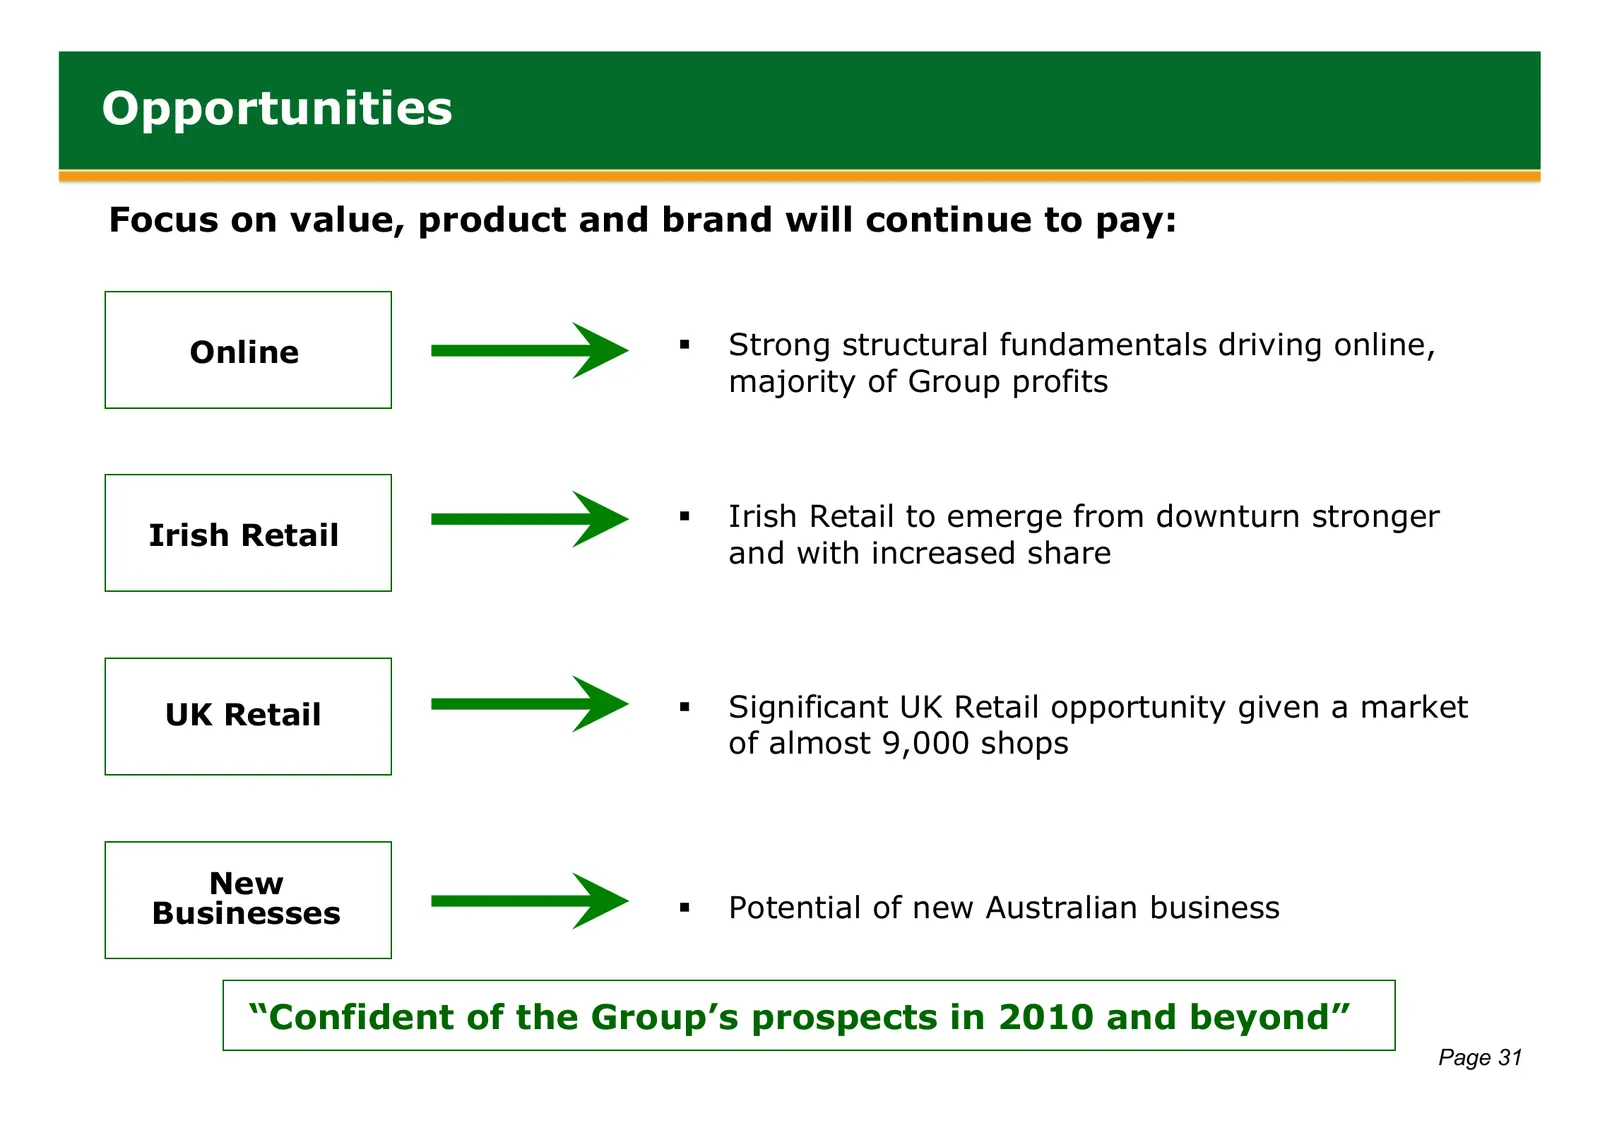
Slide 32: Opportunities
Opportunities Focus on value, product and brand will continue to pay: Online Strong structural fundamentals driving online, majority of Group profits Irish Retail to emerge from downturn stronger Irish Retail and with increased share UK Retail Significant UK Retail opportunity given a market o
Source: Internet Archive copy of flutter.com
More decks from Flutter Entertainment plc
 Q3 2026 Earnings Presentation15 slides · Nov 4, 2026
 Q2 2026 Earnings Presentation14 slides · Aug 5, 2026
 Investor Day (September 2024)152 slides · Sep 25, 2024
 Q2 2024 Earnings Presentation20 slides · Aug 13, 2024
 Q1 2024 Earnings Presentation20 slides · May 14, 2024
 FY2023 Earnings Presentation36 slides · Mar 26, 2024