Azenta, Inc. · NASDAQ:AZTA
Azenta — 26th Annual Needham Growth Conference 2024
25 slides from Azenta's conference presentation, Jan 18, 2024

Slide 1: Azenta Life Sciences 26th Annual Needham Growth Conference
Azenta Life Sciences 26th Annual Needham Growth Conference January 18, 2024 1 © 2024 Azenta, Inc. • Proprietary Information
Slide 2: Safe Harbor Statement
Safe Harbor Statement “Safe Harbor” Statement under the U.S. Private Securities Litigation Reform Act of 1995; certain matters in this presentation, including forecasts of future demand and future Company performance, are forward-looking statements that are subject to risks and uncertainties that co
Slide 3: Agenda: Unique High Value Portfolio for Sample Management
AGENDA Unique High Value Portfolio for Sample Management An Established Life Sciences Company with a Strong Track Record Developing and Serving Attractive High Growth End Markets Creating Value – On the Path to Sustained Growth and Higher Profitability 3 © 2024 Azenta, Inc. • Proprietary Information
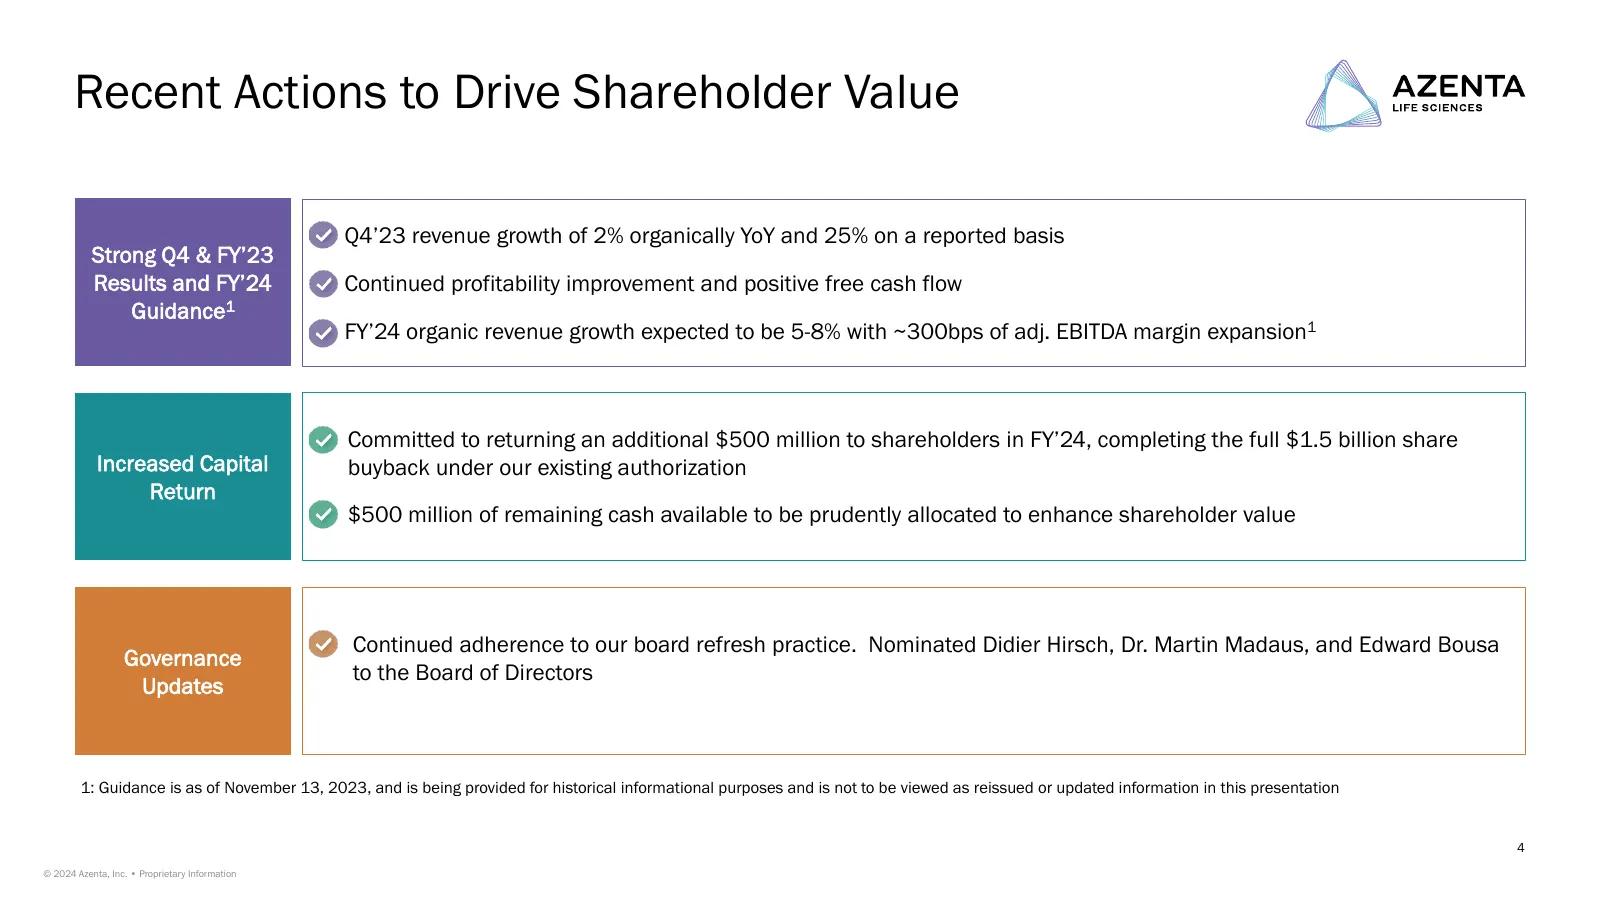
Slide 4: Recent Actions to Drive Shareholder Value
Recent Actions to Drive Shareholder Value • Q4’23 revenue growth of 2% organically YoY and 25% on a reported basis Strong Q4 & FY’23 Results and FY’24 • Continued profitability improvement and positive free cash flow Guidance1 • FY’24 organic revenue growth expected to be 5-8% with ~300bps of adj. E
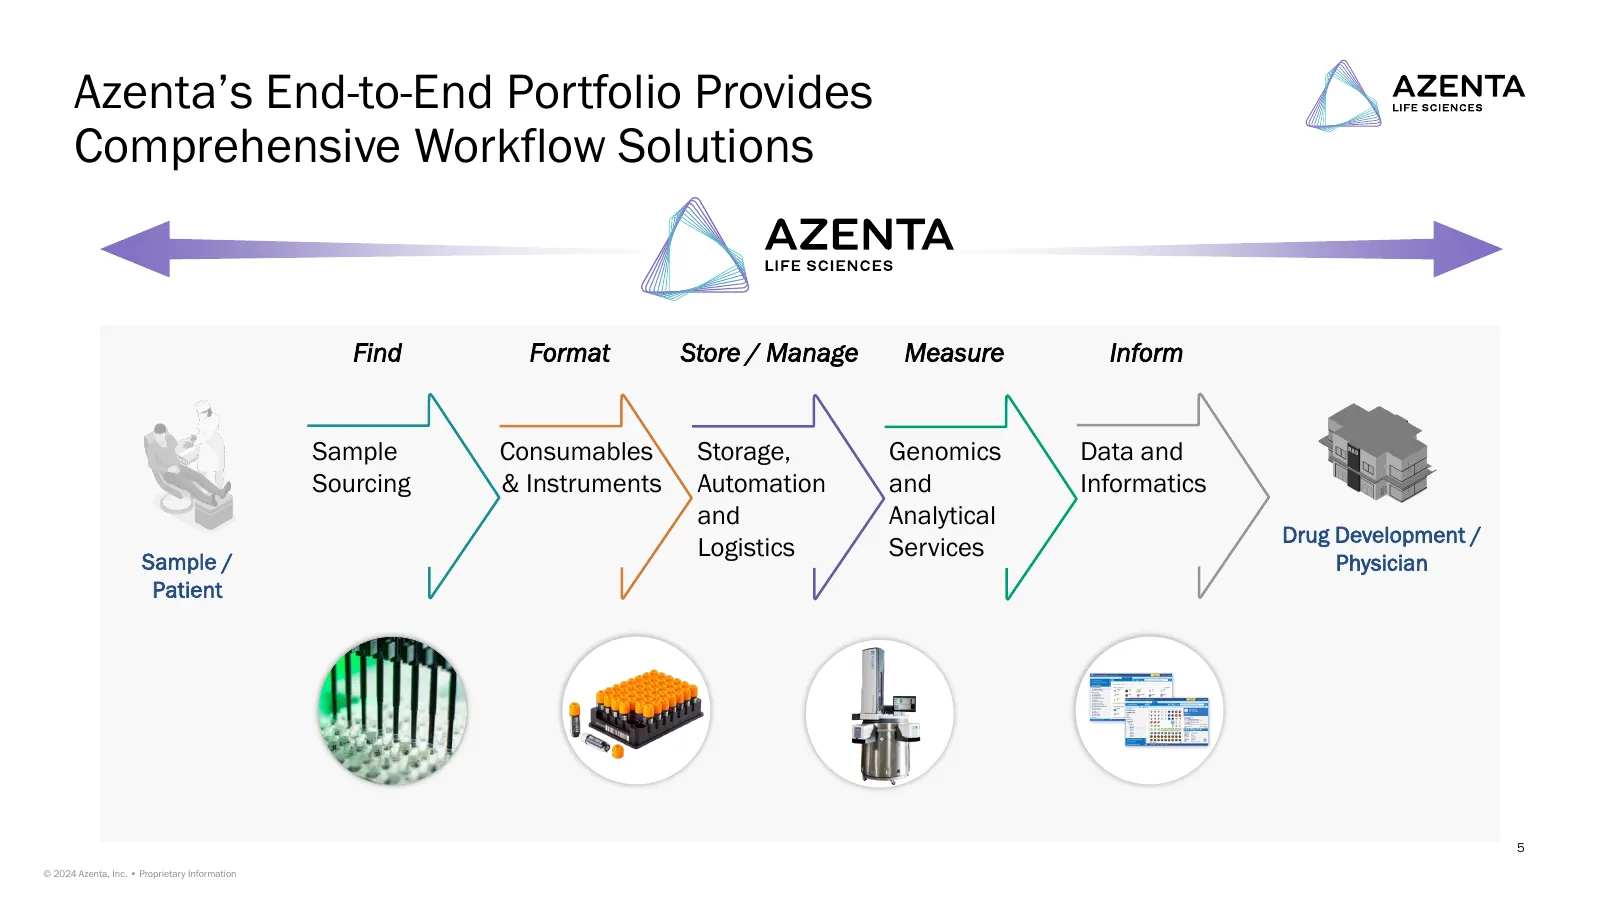
Slide 5: Azenta's End-to-End Portfolio Provides Comprehensive Workflow Solutions
Azenta’s End-to-End Portfolio Provides Comprehensive Workflow Solutions Find Format Store / Manage Measure Inform Sample Consumables Storage, Genomics Data and Sourcing & Instruments Automation and Informatics and Analytical Drug Development / Sample / Logistics Services Physician Patient 5 © 2024 A
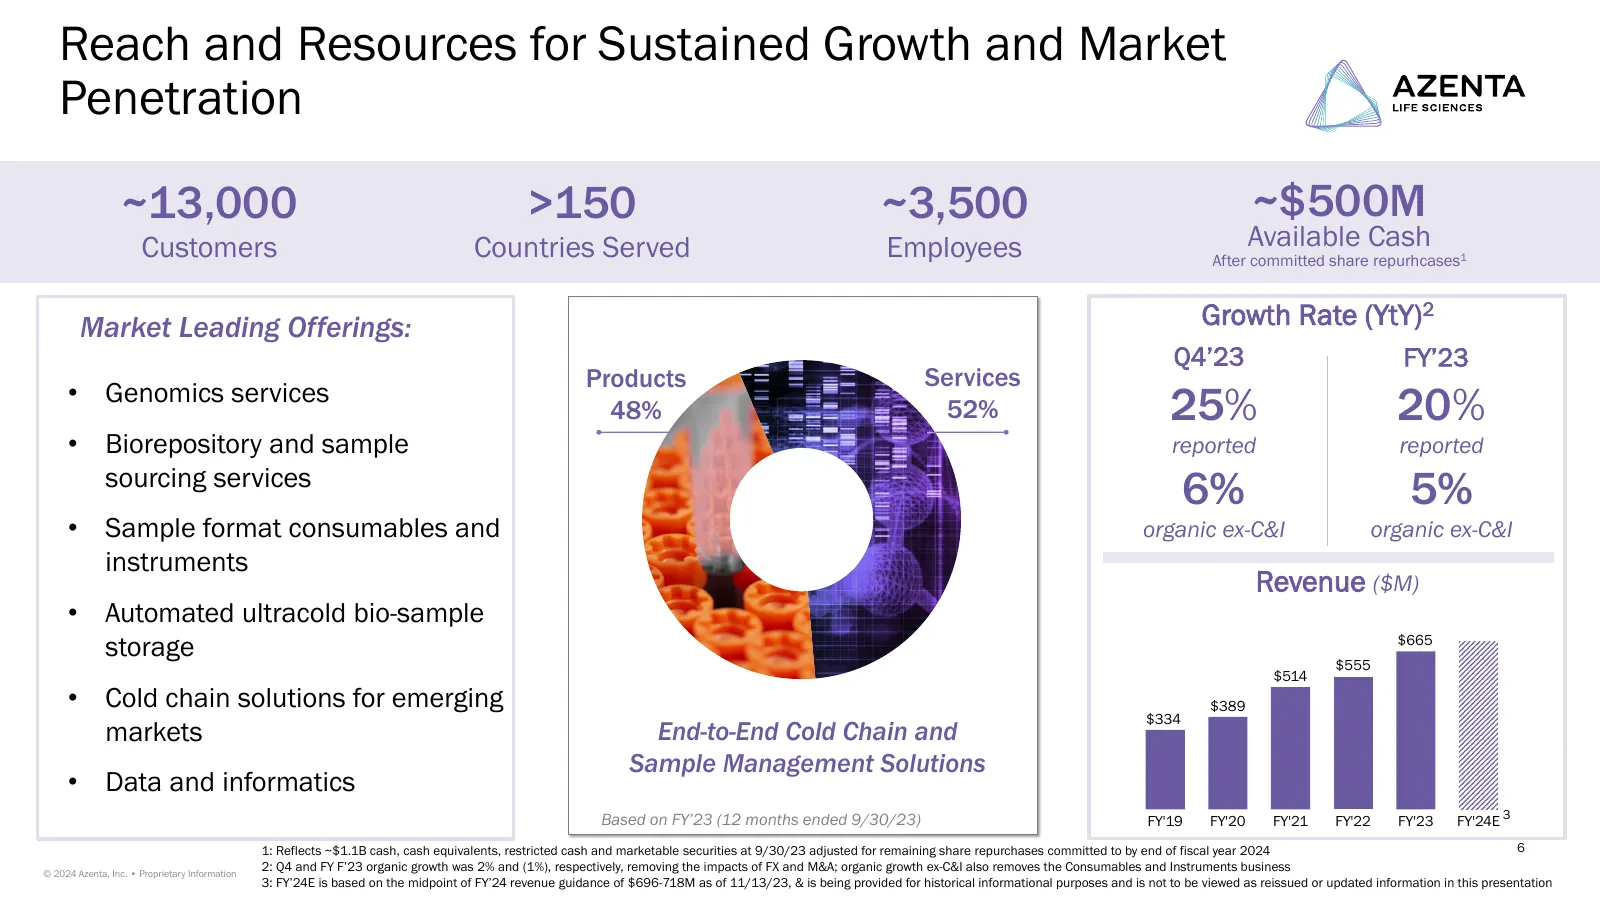
Slide 6: Reach and Resources for Sustained Growth and Market Penetration
Reach and Resources for Sustained Growth and Market Penetration ~13,000 >150 ~3,500 ~$500M Customers Countries Served Employees Available Cash After committed share repurhcases1 Market Leading Offerings: Growth Rate (YtY)2 Q4’23 FY’23 Products Services • Genomics services 48% 52% 25% 20% • Bioreposi
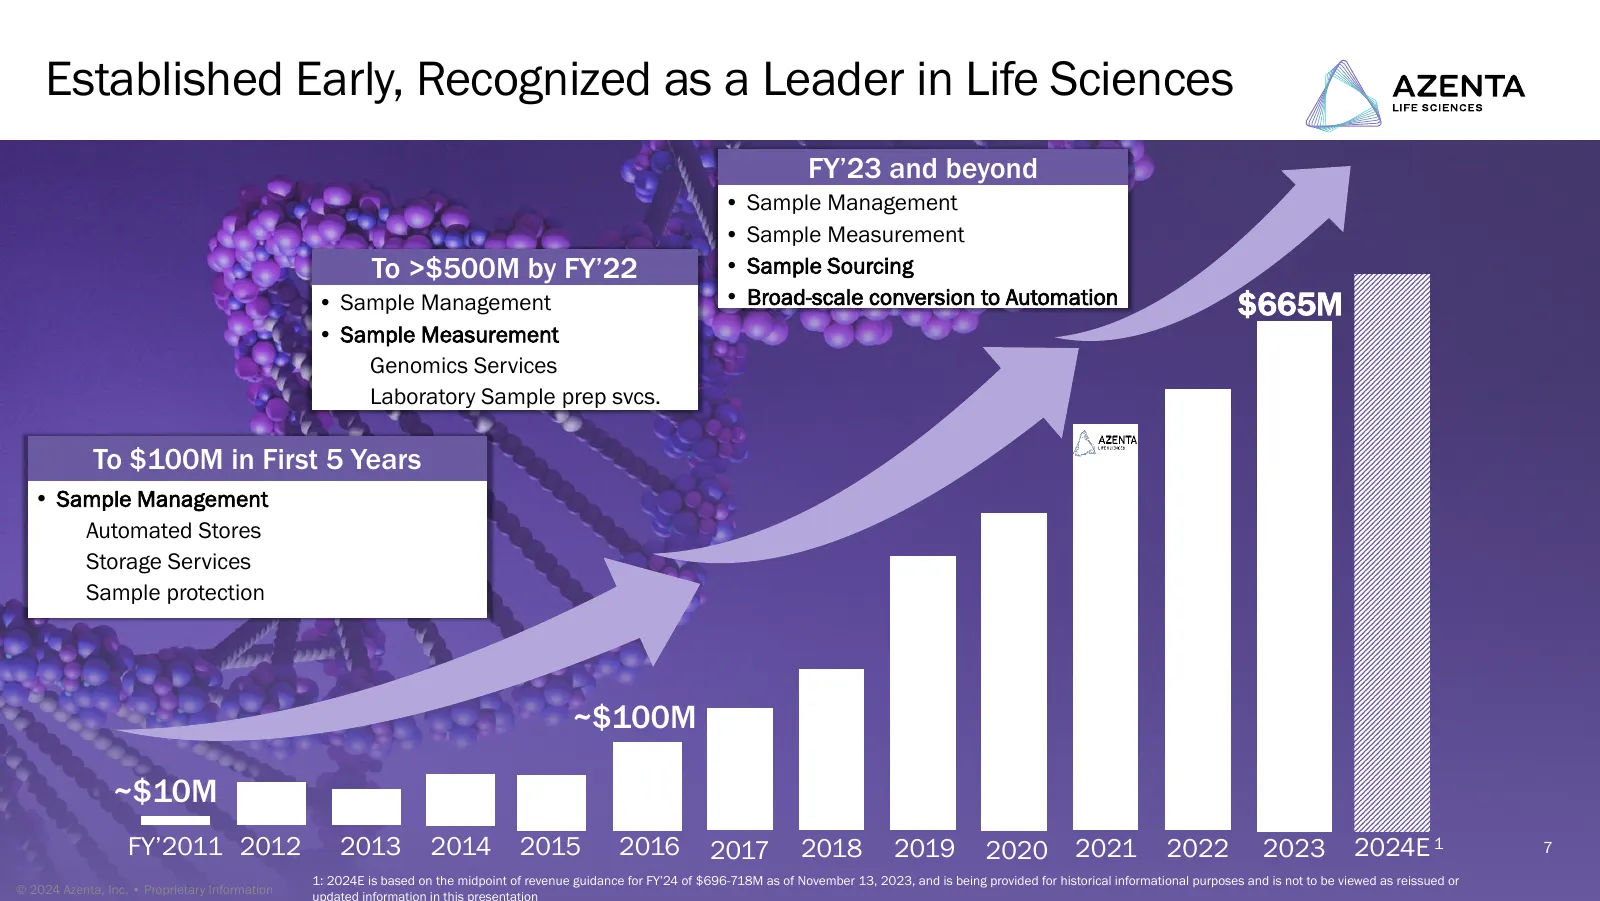
Slide 7: Established Early, Recognized as a Leader in Life Sciences
Established Early, Recognized as a Leader in Life Sciences FY’23 and beyond • Sample Management • Sample Measurement To >$500M by FY’22 • Sample Sourcing • Sample Management • Broad-scale conversion to Automation $665M • Sample Measurement Genomics Services Laboratory Sample prep svcs. To $100M in F
Slide 8: Agenda: An Established Life Sciences Company
AGENDA Unique High Value Portfolio for Sample Management An Established Life Sciences Company with a Strong Track Record Developing and Serving Attractive High Growth End Markets Creating Value – On the Path to Sustained Growth and Higher Profitability 8 © 2024 Azenta, Inc. • Proprietary Information
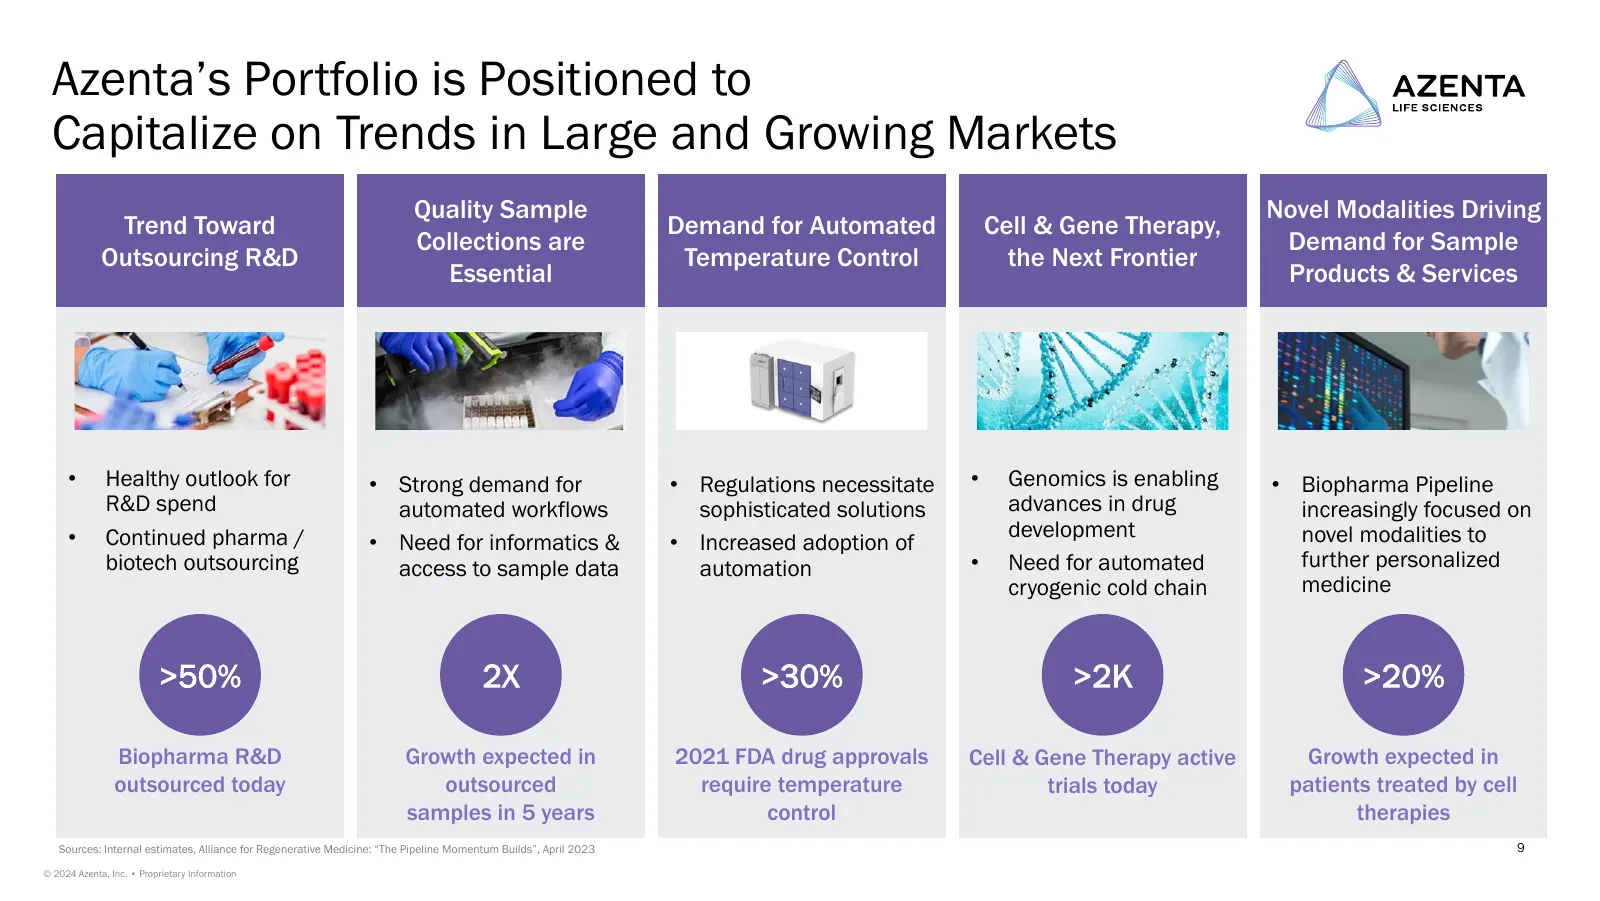
Slide 9: Azenta's Portfolio is Positioned to Capitalize on Trends in Large and Growing Markets
Azenta’s Portfolio is Positioned to Capitalize on Trends in Large and Growing Markets Quality Sample Novel Modalities Driving Trend Toward Demand for Automated Cell & Gene Therapy, Collections are Demand for Sample Outsourcing R&D Temperature Control the Next Frontier Essential Products & Services •
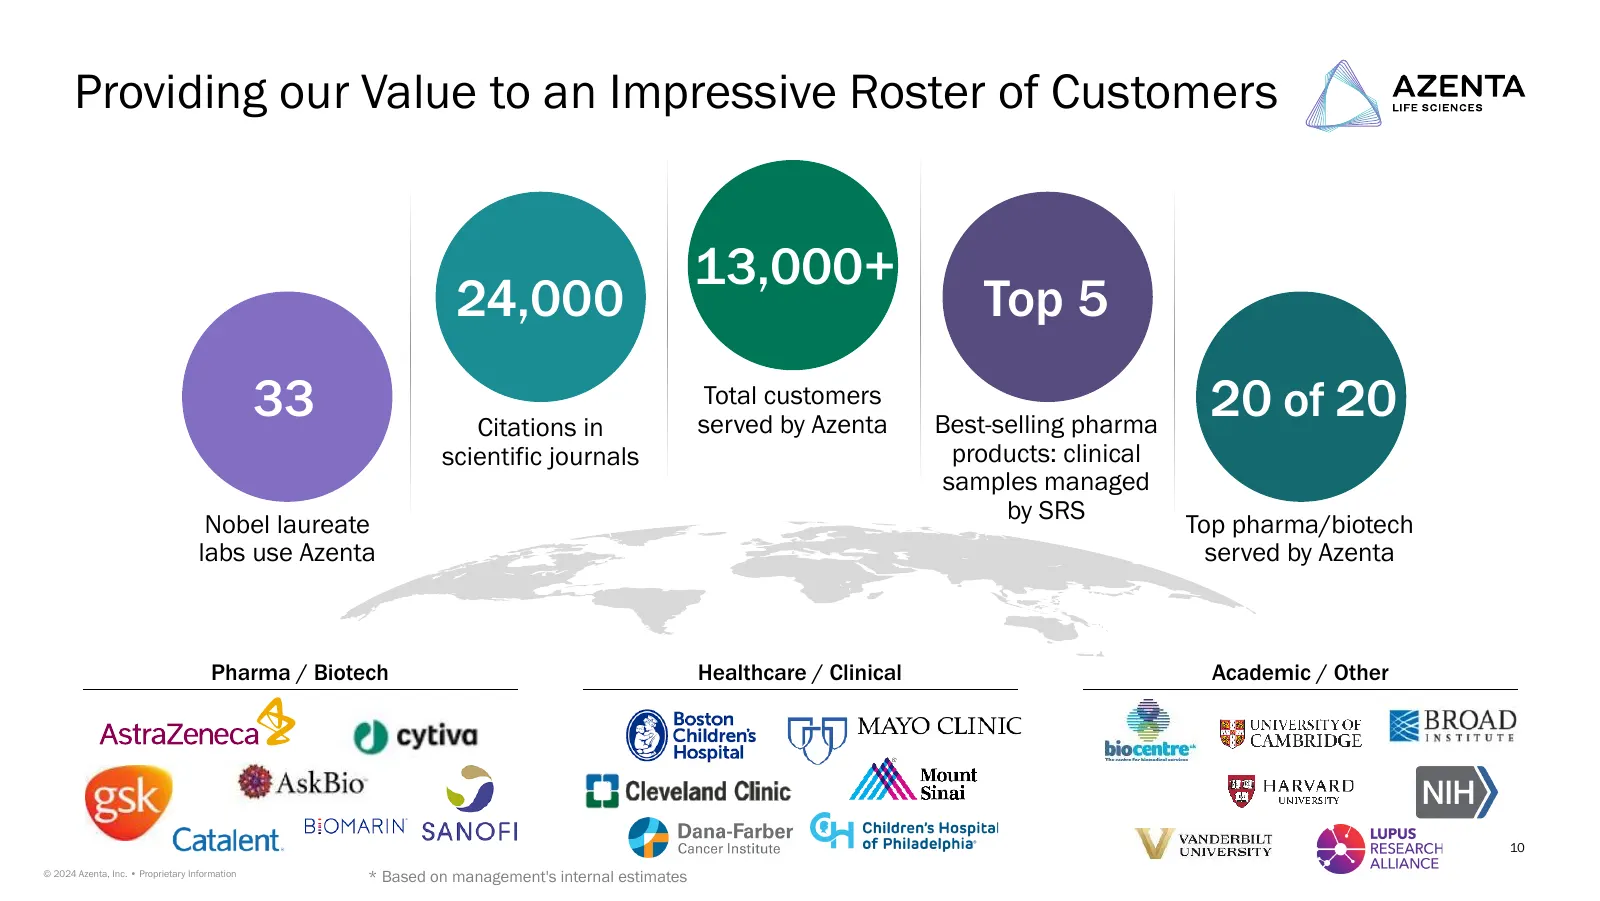
Slide 10: Providing our Value to an Impressive Roster of Customers
Providing our Value to an Impressive Roster of Customers 13,000+ 24,000 Top 5 33 Citations in Total customers served by Azenta Best-selling pharma 20 of 20 scientific journals products: clinical samples managed by SRS Nobel laureate Top pharma/biotech labs use Azenta served by Azenta Pharma / Biotec
Slide 11: Agenda: Creating Value
AGENDA Unique High Value Portfolio for Sample Management An Established Life Sciences Company with a Strong Track Record Developing and Serving Attractive High Growth End Markets Creating Value – On the Path to Sustained Growth and Higher Profitability 11 © 2024 Azenta, Inc. • Proprietary Informatio
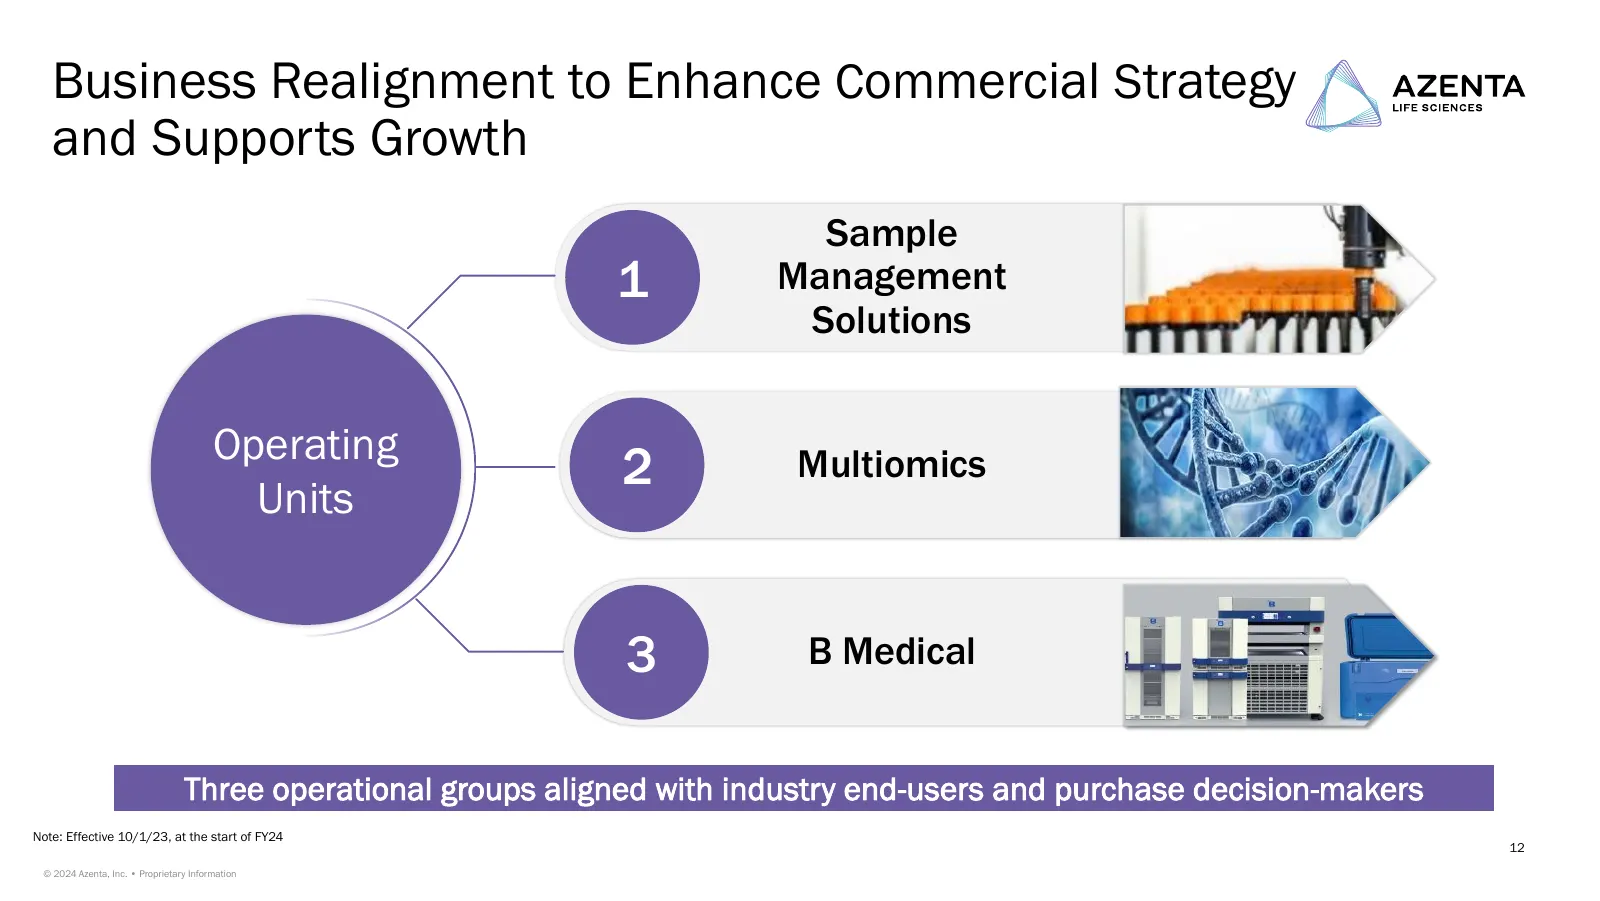
Slide 12: Business Realignment to Enhance Commercial Strategy and Supports Growth
Business Realignment to Enhance Commercial Strategy and Supports Growth Sample 1 Management Solutions Operating 2 Multiomics Units 3 B Medical Three operational groups aligned with industry end-users and purchase decision-makers Note: Effective 10/1/23, at the start of FY24 12 © 2024 Azenta, Inc. •
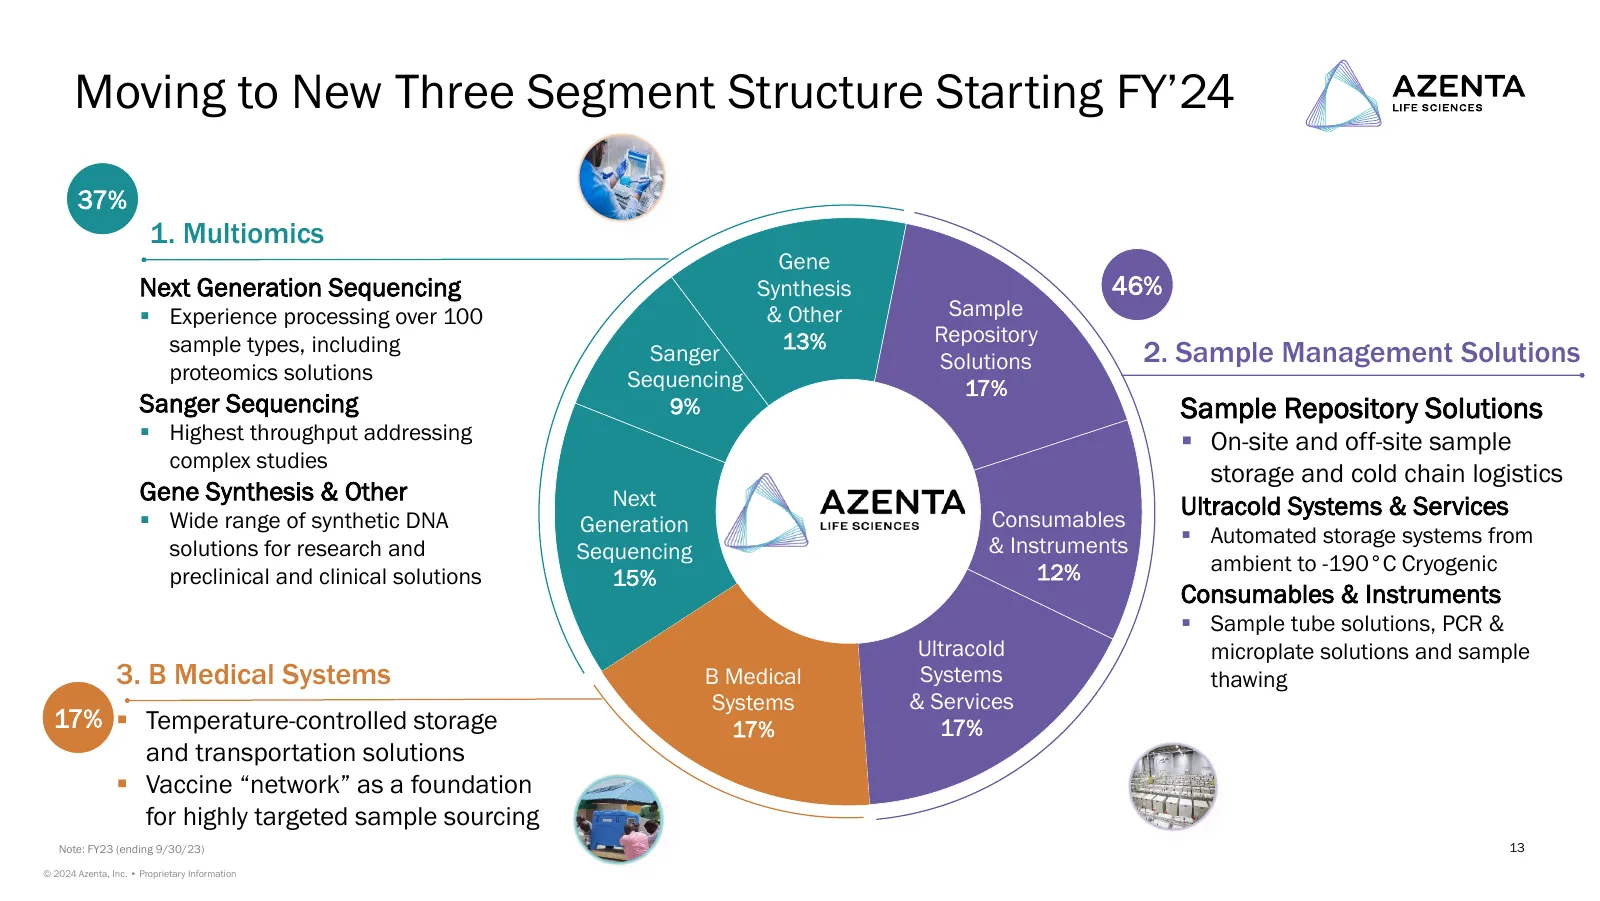
Slide 13: Moving to New Three Segment Structure Starting FY'24
Moving to New Three Segment Structure Starting FY’24 37% 1. Multiomics Gene Next Generation Sequencing Synthesis 46% ▪ Experience processing over 100 & Other Sample sample types, including 13% Repository Sanger Solutions 2. Sample Management Solutions proteomics solutions Sequencing 17% Sanger Seque
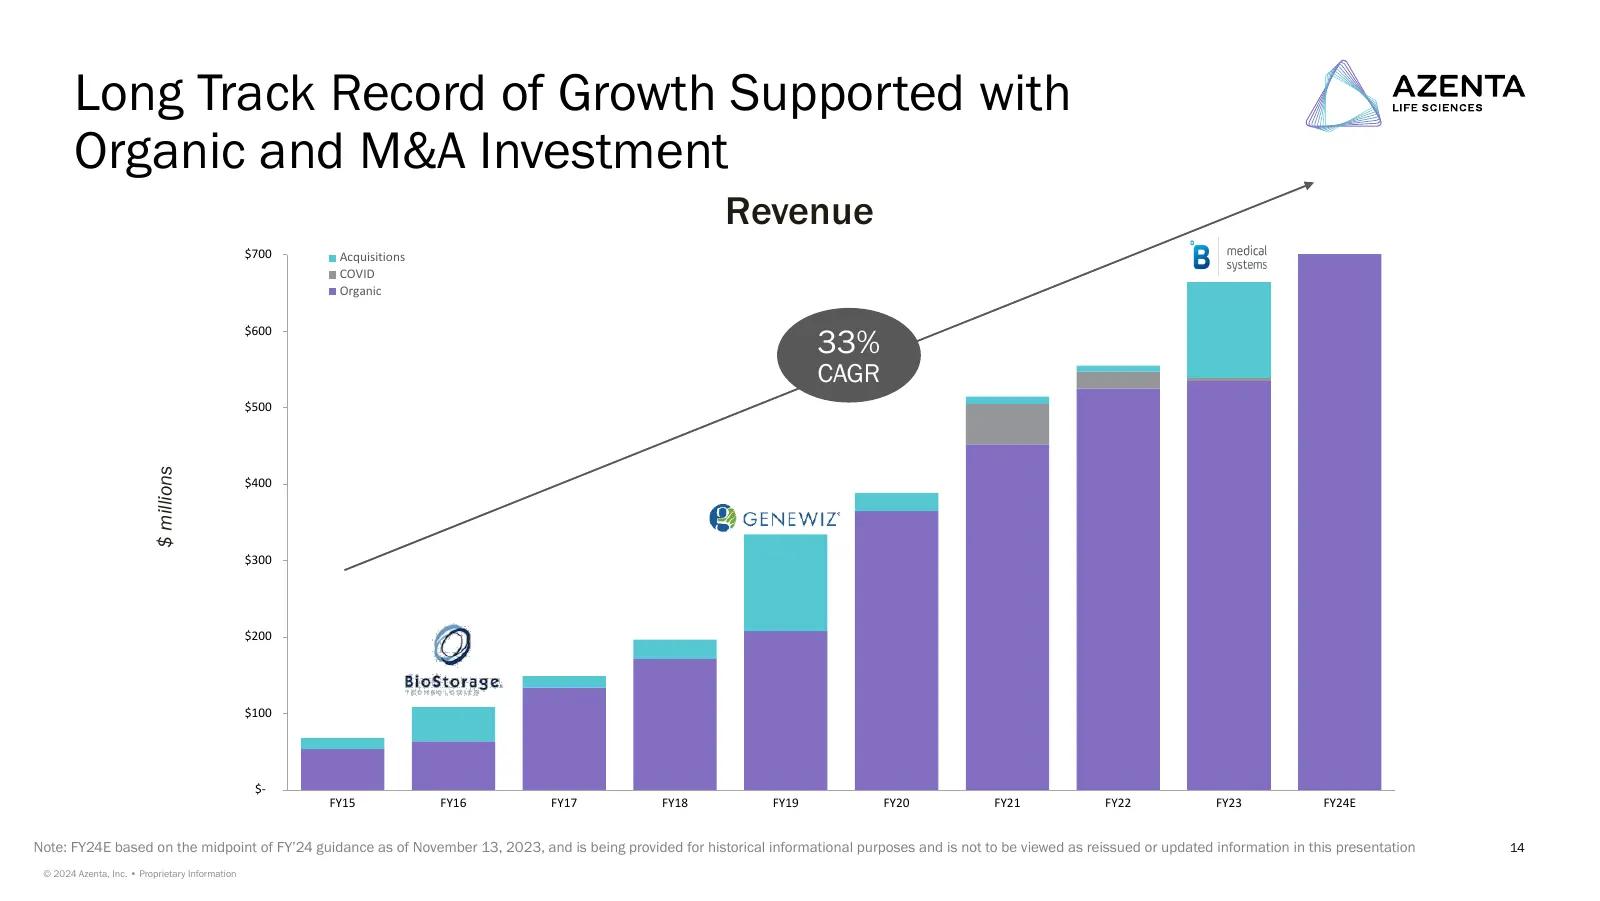
Slide 14: Long Track Record of Growth Supported with Organic and M&A Investment
Long Track Record of Growth Supported with Organic and M&A Investment Revenue $700 Acquisitions COVID Organic 33% $600 CAGR $500 $ millions $400 $300 $200 $100 $- FY15 FY16 FY17 FY18 FY19 FY20 FY21 FY22 FY23 FY24E Note: FY24E based on the midpoint of FY’24 guidance as of November 13, 2023, and is be
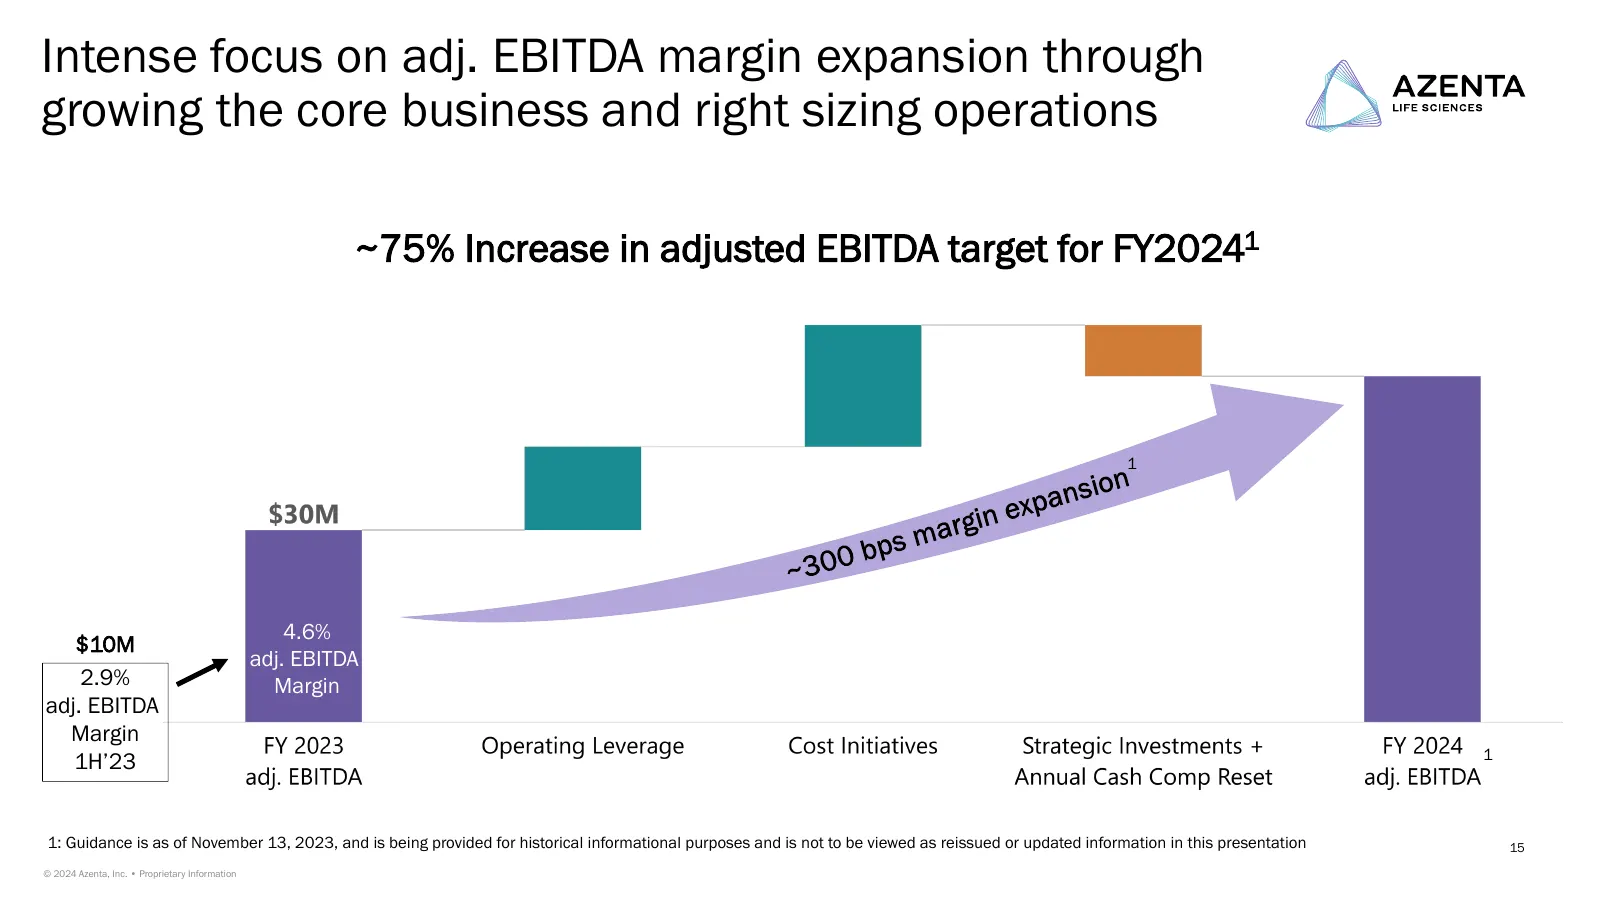
Slide 15: Intense focus on adj. EBITDA margin expansion
Intense focus on adj. EBITDA margin expansion through growing the core business and right sizing operations ~75% Increase in adjusted EBITDA target for FY20241 1 4.6% $10M adj. EBITDA 2.9% Margin adj. EBITDA Margin 1 1H’23 1: Guidance is as of November 13, 2023, and is being provided for historical
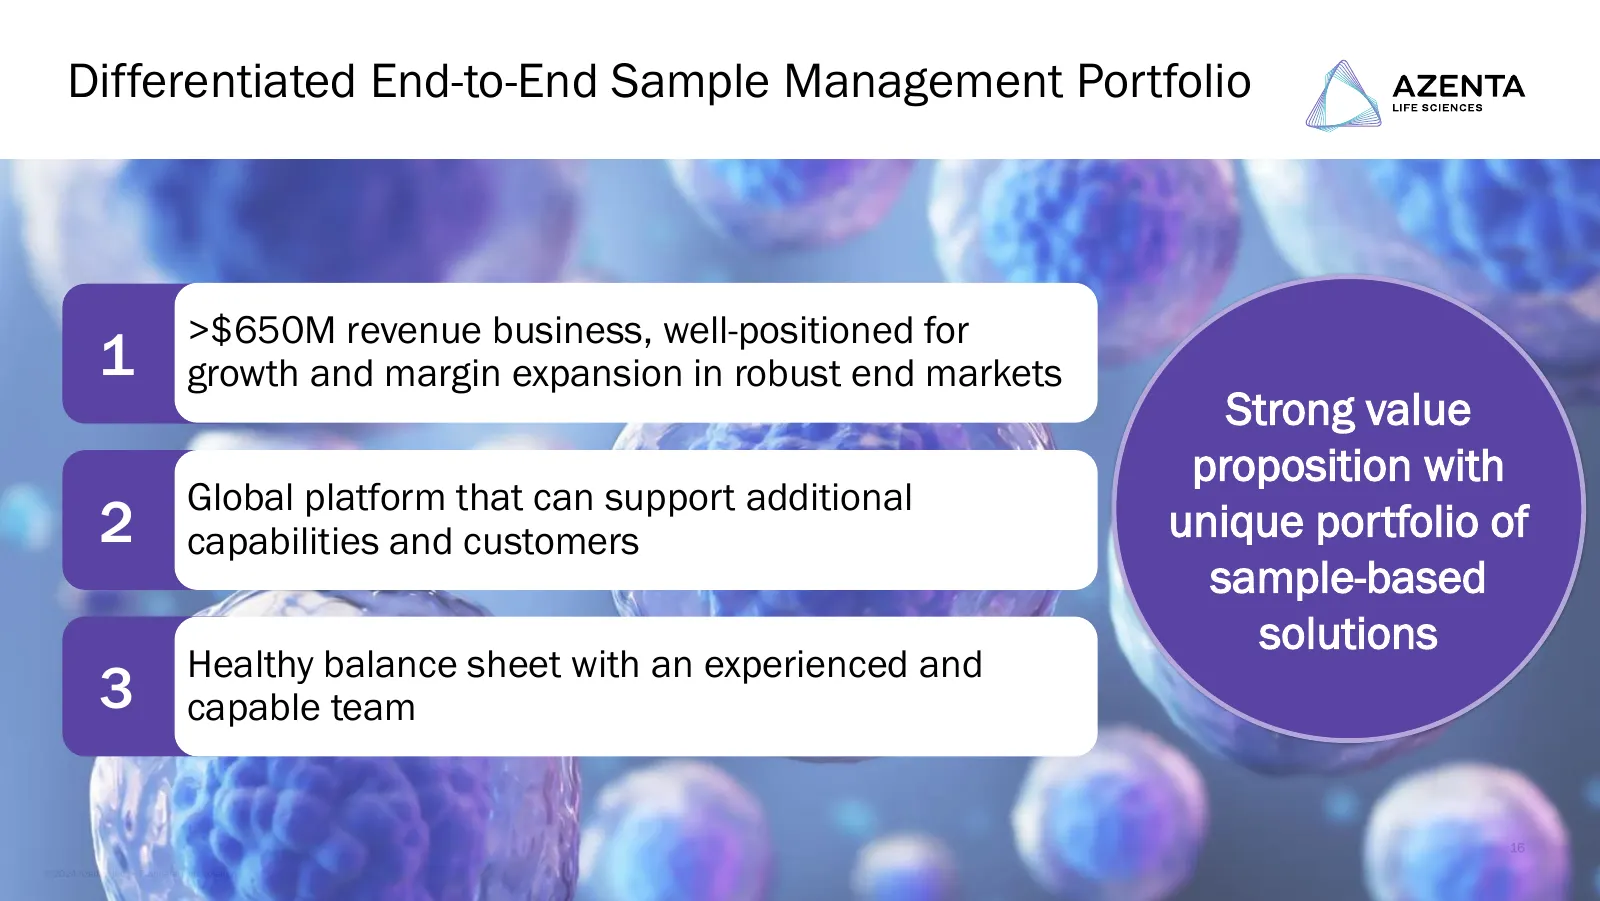
Slide 16: Differentiated End-to-End Sample Management Portfolio
16 Differentiated End-to-End Sample Management Portfolio >$650M revenue business, well-positioned for 1 growth and margin expansion in robust end markets Strong value proposition with Global platform that can support additional 2 capabilities and customers unique portfolio of sample-based solutions
Slide 17: Azenta to Host 2024 Investor Day
Azenta to Host 2024 Investor Day March 14, 2024 9:00 AM – 12:00 PM ET New York City & Live Webcast Azenta Life Sciences | Proprietary and confidential. 17 17 © 2024 Azenta, Inc. • Proprietary Information

Slide 18: Appendix
Appendix 18 © 2024 Azenta, Inc. • Proprietary Information
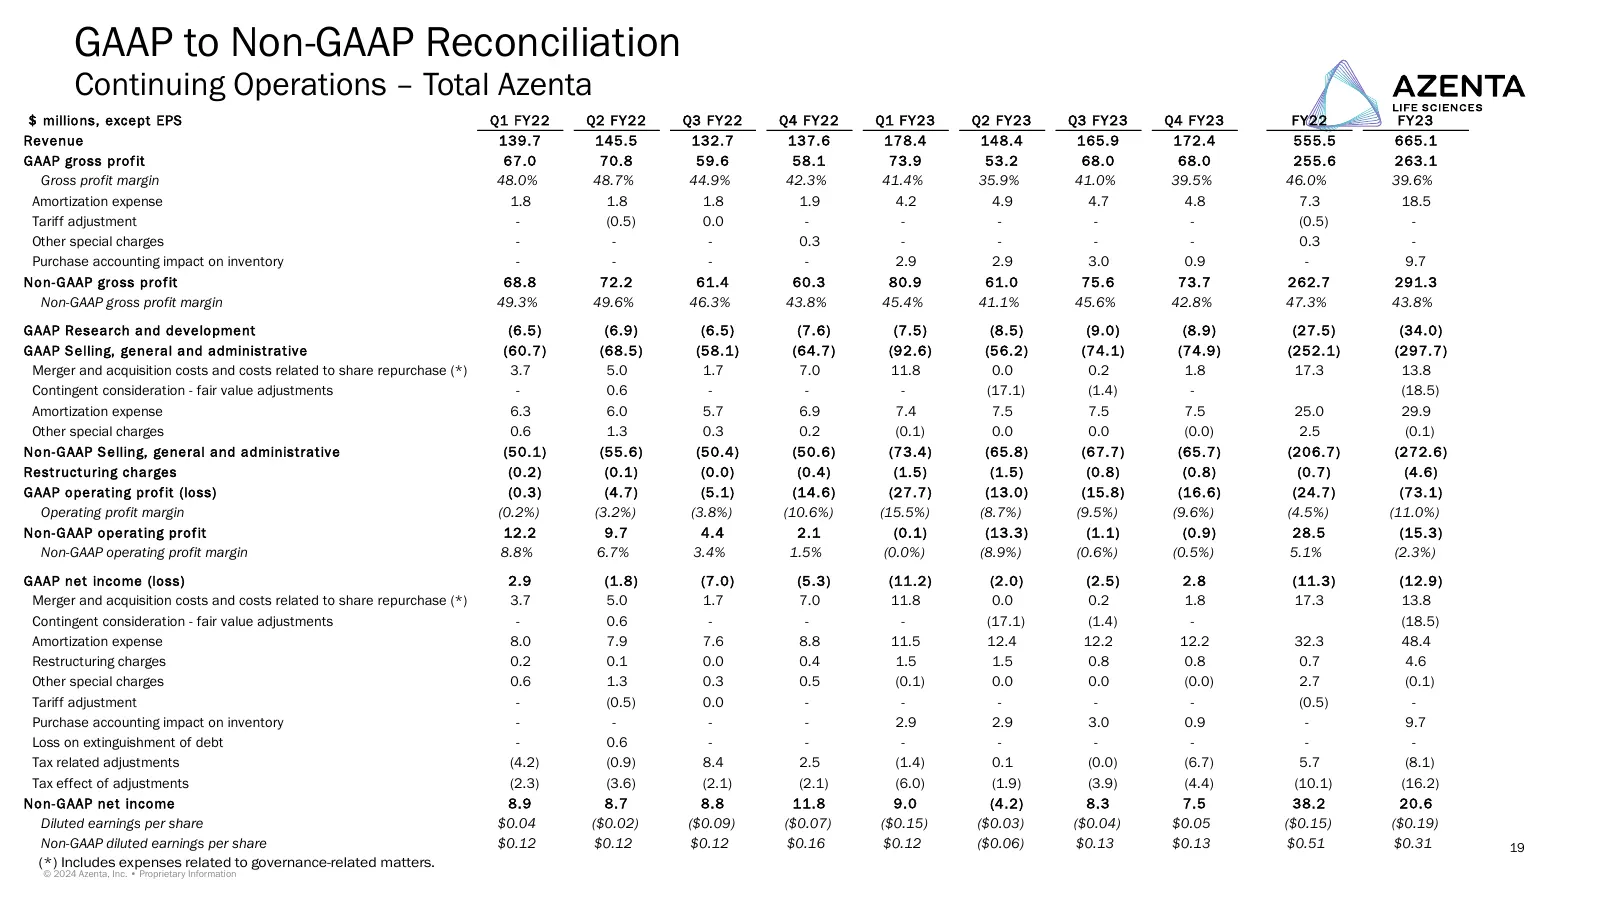
Slide 19: GAAP to Non-GAAP Reconciliation
GAAP to Non-GAAP Reconciliation Continuing Operations – Total Azenta $ millions, except EPS Q1 FY22 Q2 FY22 Q3 FY22 Q4 FY22 Q1 FY23 Q2 FY23 Q3 FY23 Q4 FY23 FY22 FY23 Revenue 139.7 145.5 132.7 137.6 178.4 148.4 165.9 172.4 555.5 665.1 GAAP gross profit 67.0 70.8 59.6 58.1 73.9 53.2 68.0 68.0 255.6 26
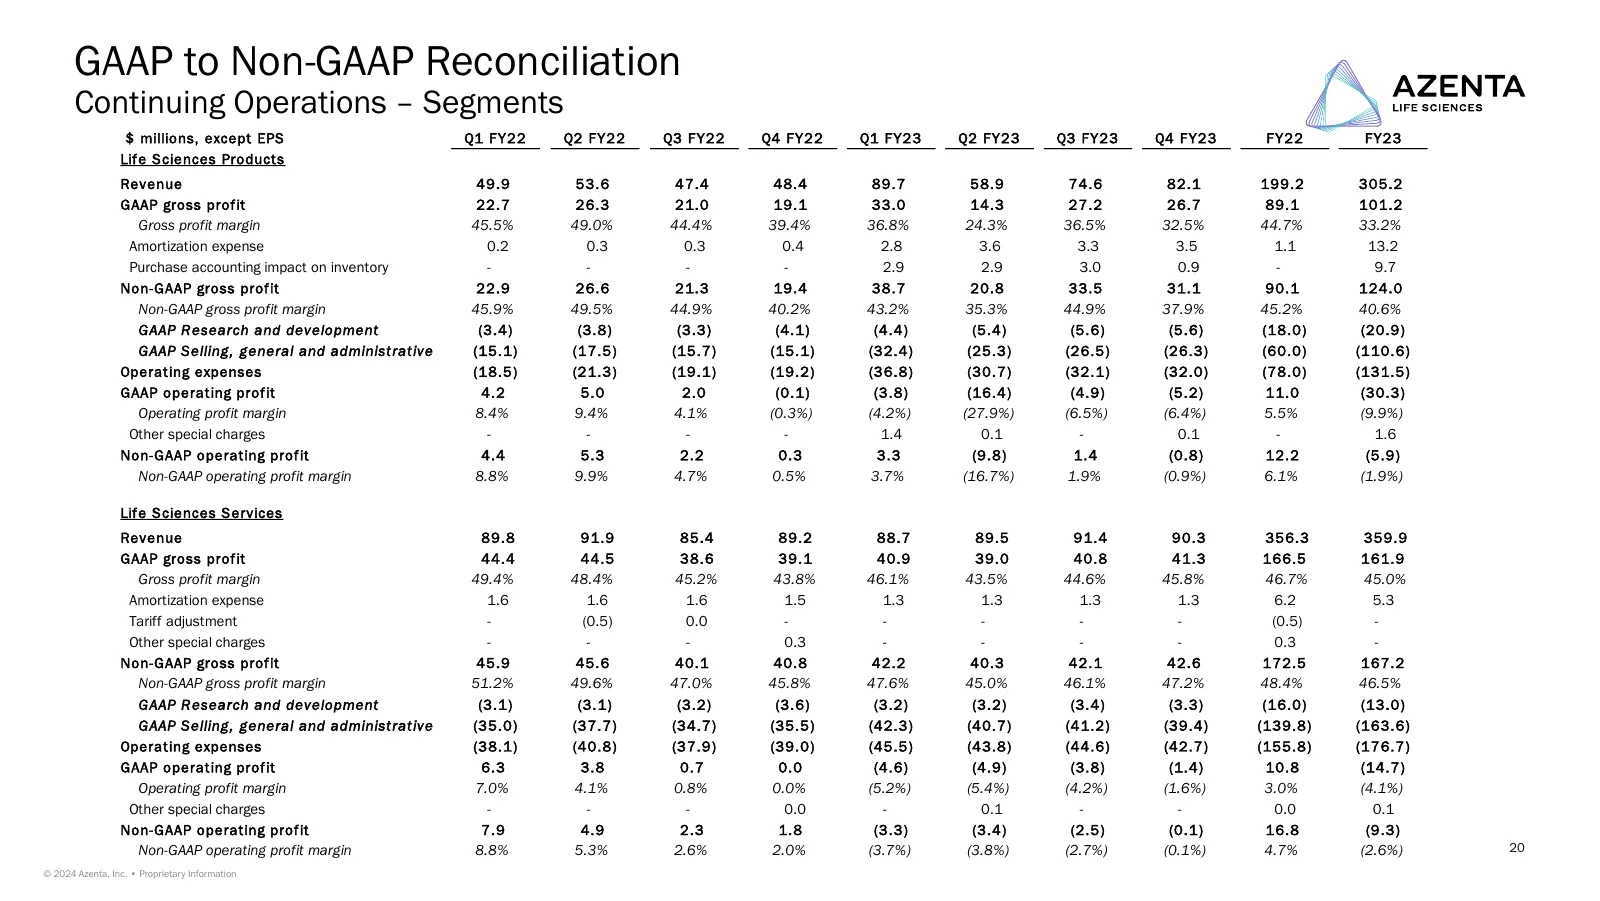
Slide 20: GAAP to Non-GAAP Reconciliation
GAAP to Non-GAAP Reconciliation Continuing Operations – Segments $ millions, except EPS Q1 FY22 Q2 FY22 Q3 FY22 Q4 FY22 Q1 FY23 Q2 FY23 Q3 FY23 Q4 FY23 FY22 FY23 Life Sciences Products Revenue 49.9 53.6 47.4 48.4 89.7 58.9 74.6 82.1 199.2 305.2 GAAP gross profit 22.7 26.3 21.0 19.1 33.0 14.3 27.2 26
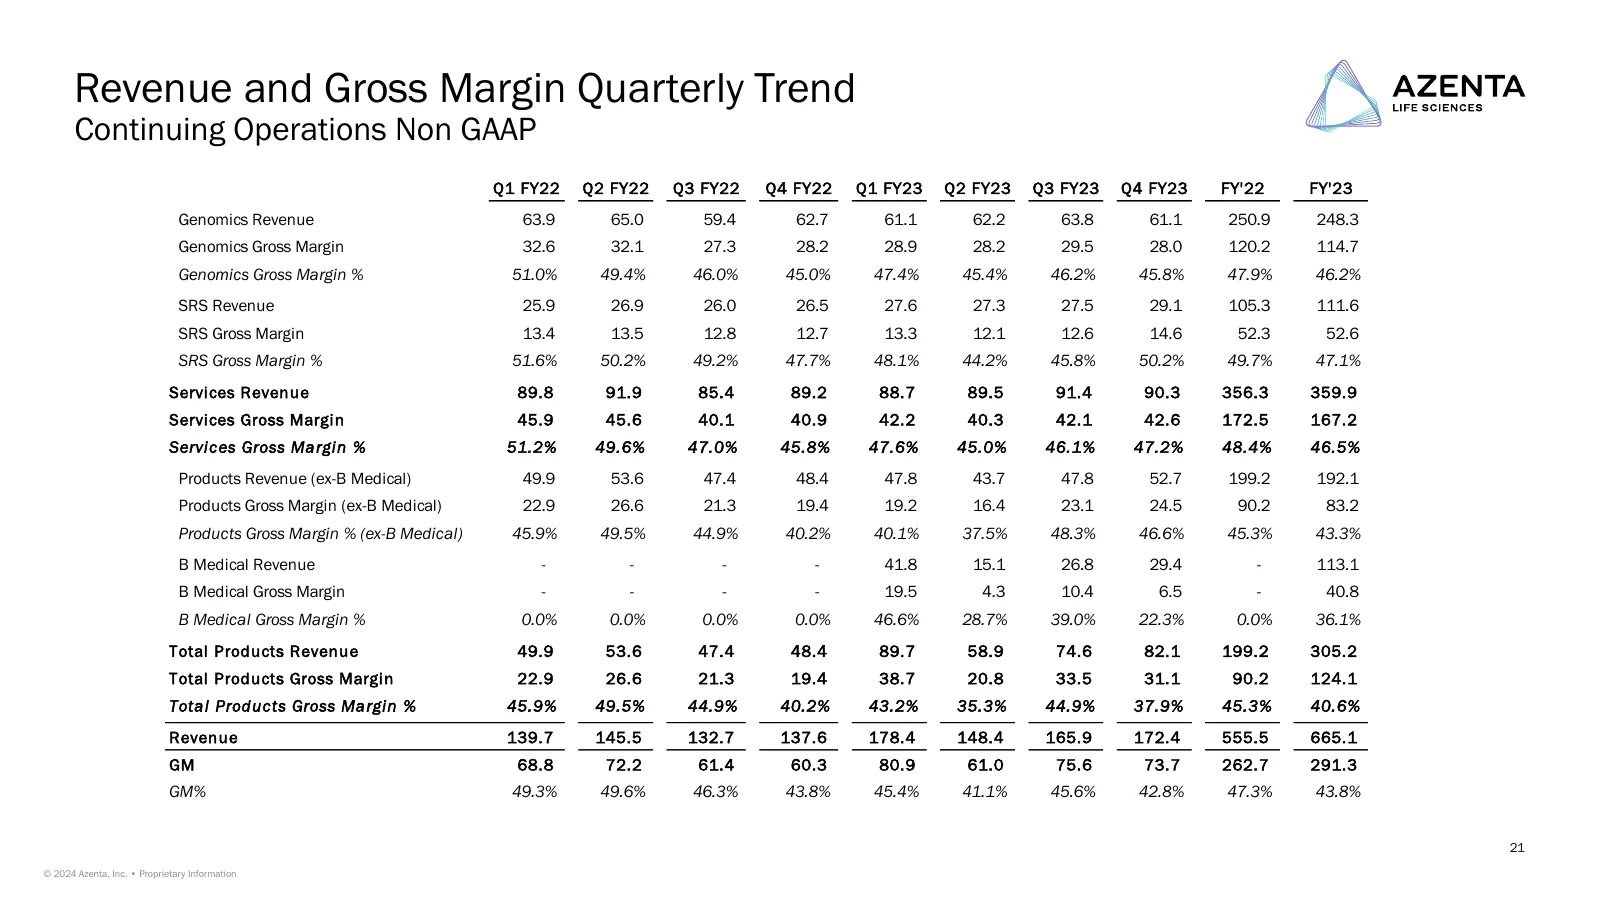
Slide 21: Revenue and Gross Margin Quarterly Trend
Revenue and Gross Margin Quarterly Trend Continuing Operations Non GAAP Q1 FY22 Q2 FY22 Q3 FY22 Q4 FY22 Q1 FY23 Q2 FY23 Q3 FY23 Q4 FY23 FY'22 FY'23 Genomics Revenue 63.9 65.0 59.4 62.7 61.1 62.2 63.8 61.1 250.9 248.3 Genomics Gross Margin 32.6 32.1 27.3 28.2 28.9 28.2 29.5 28.0 120.2 114.7 Genomics
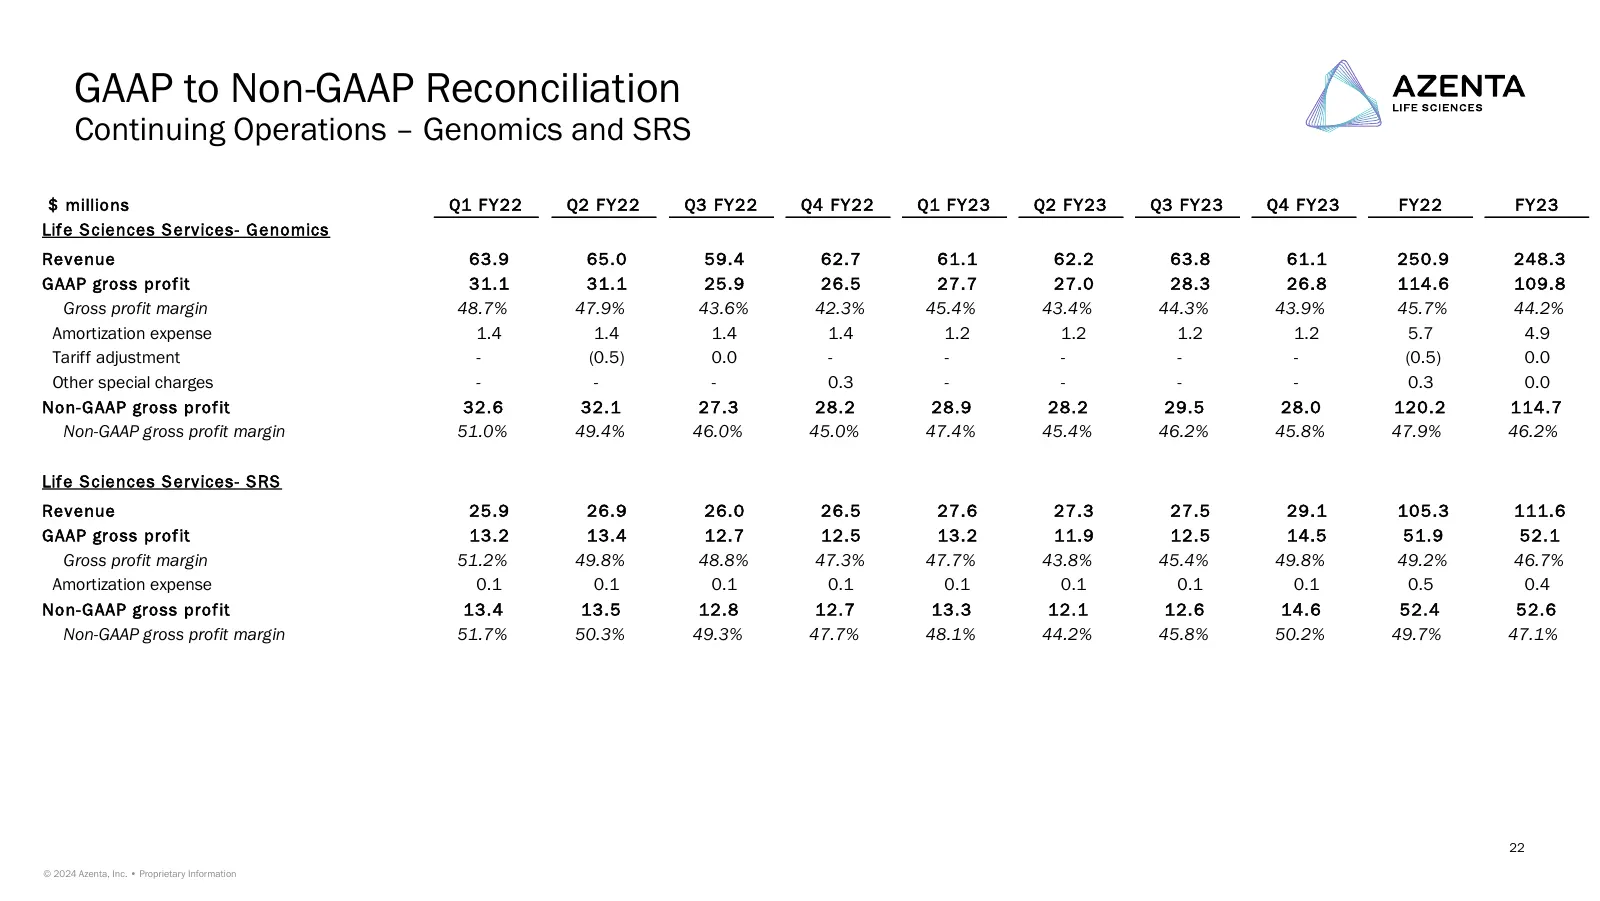
Slide 22: GAAP to Non-GAAP Reconciliation
GAAP to Non-GAAP Reconciliation Continuing Operations – Genomics and SRS $ millions Q1 FY22 Q2 FY22 Q3 FY22 Q4 FY22 Q1 FY23 Q2 FY23 Q3 FY23 Q4 FY23 FY22 FY23 Life Sciences Services- Genomics Revenue 63.9 65.0 59.4 62.7 61.1 62.2 63.8 61.1 250.9 248.3 GAAP gross profit 31.1 31.1 25.9 26.5 27.7 27.0 2
Slide 23: GAAP to Non-GAAP Reconciliation
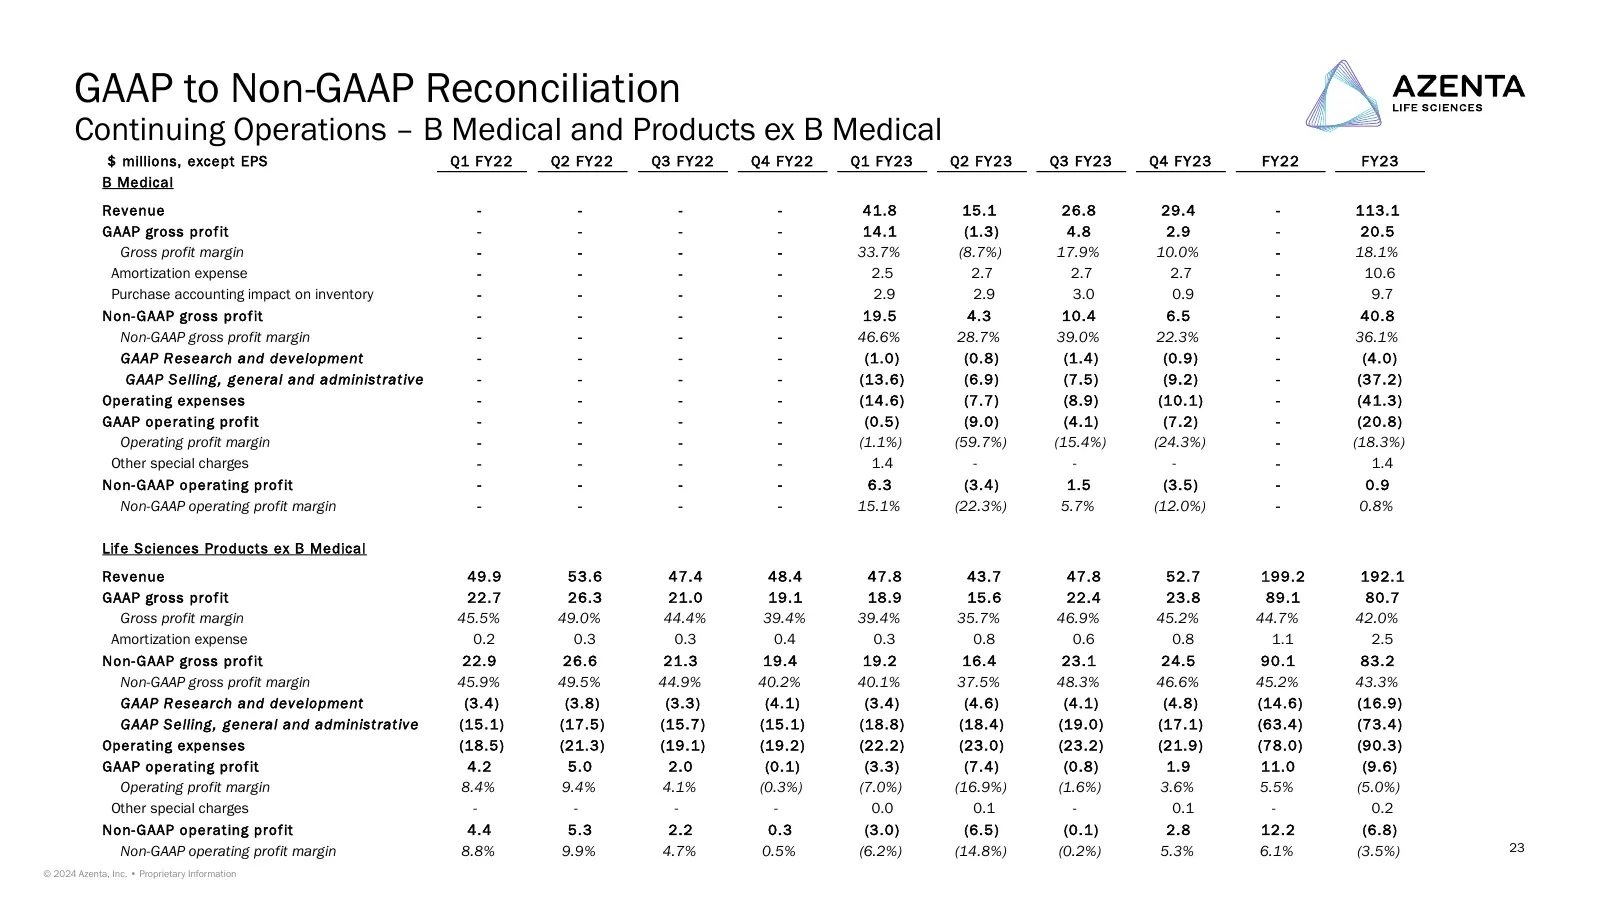
GAAP to Non-GAAP Reconciliation Continuing Operations – B Medical and Products ex B Medical $ millions, except EPS Q1 FY22 Q2 FY22 Q3 FY22 Q4 FY22 Q1 FY23 Q2 FY23 Q3 FY23 Q4 FY23 FY22 FY23 B Medical Revenue - - - - 41.8 15.1 26.8 29.4 - 113.1 GAAP gross profit - - - - 14.1 (1.3) 4.8 2.9 - 20.5 Gross
Slide 24: Net Income to Adjusted EBITDA Reconciliation
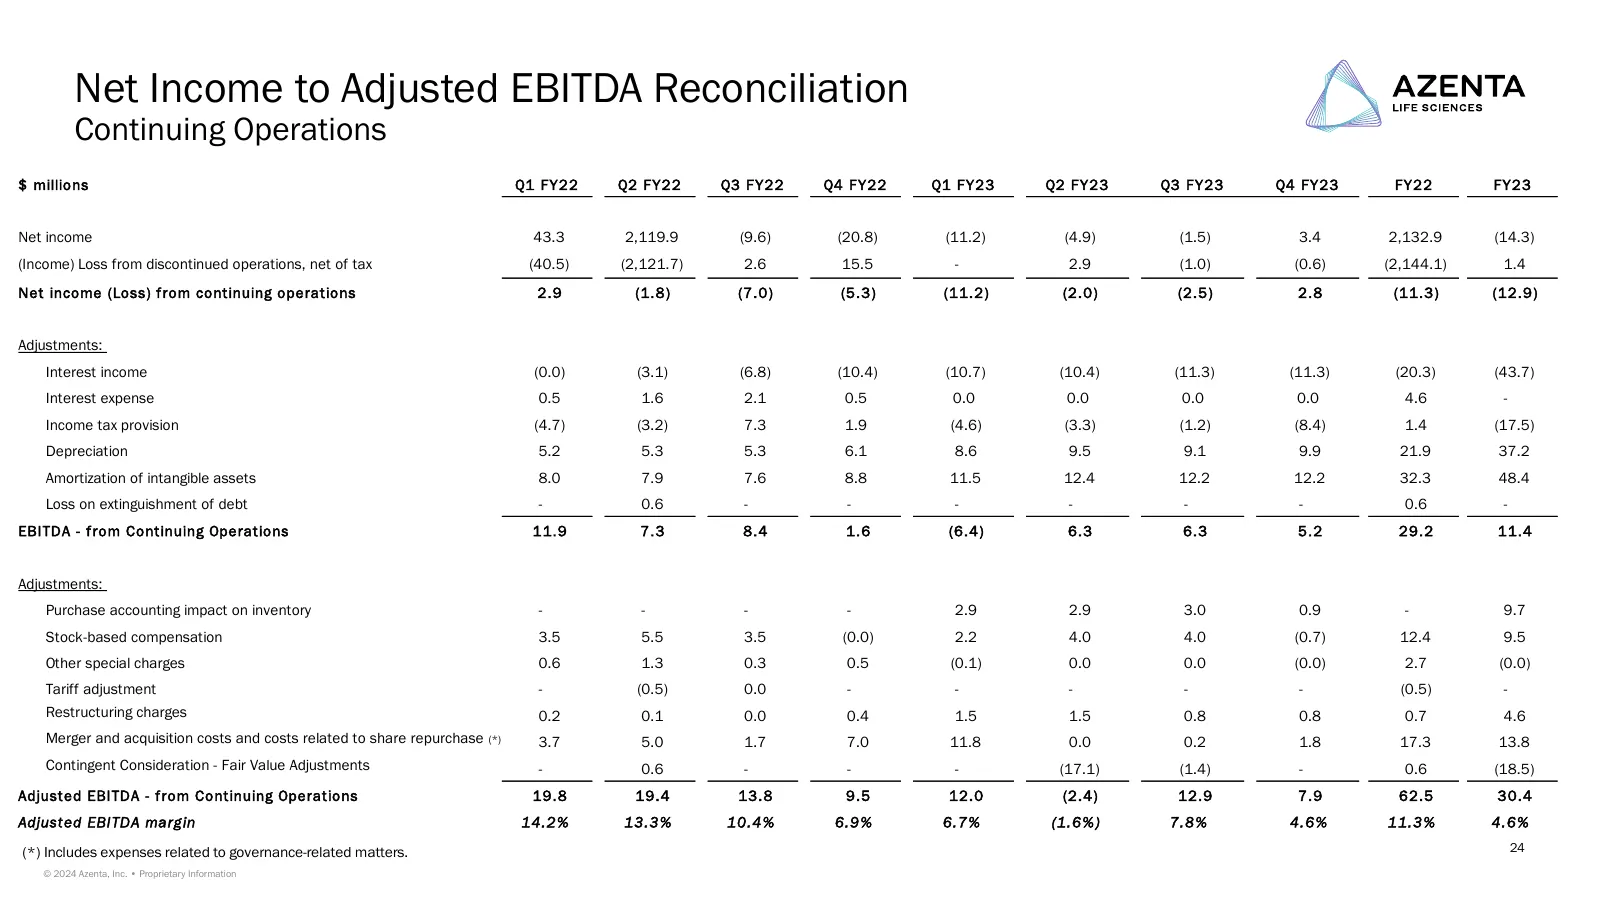
Net Income to Adjusted EBITDA Reconciliation Continuing Operations $ millions Q1 FY22 Q2 FY22 Q3 FY22 Q4 FY22 Q1 FY23 Q2 FY23 Q3 FY23 Q4 FY23 FY22 FY23 Net income 43.3 2,119.9 (9.6) (20.8) (11.2) (4.9) (1.5) 3.4 2,132.9 (14.3) (Income) Loss from discontinued operations, net of tax (40.5) (2,121.7) 2
Slide 25: Calculation of Organic Revenue Excluding COVID
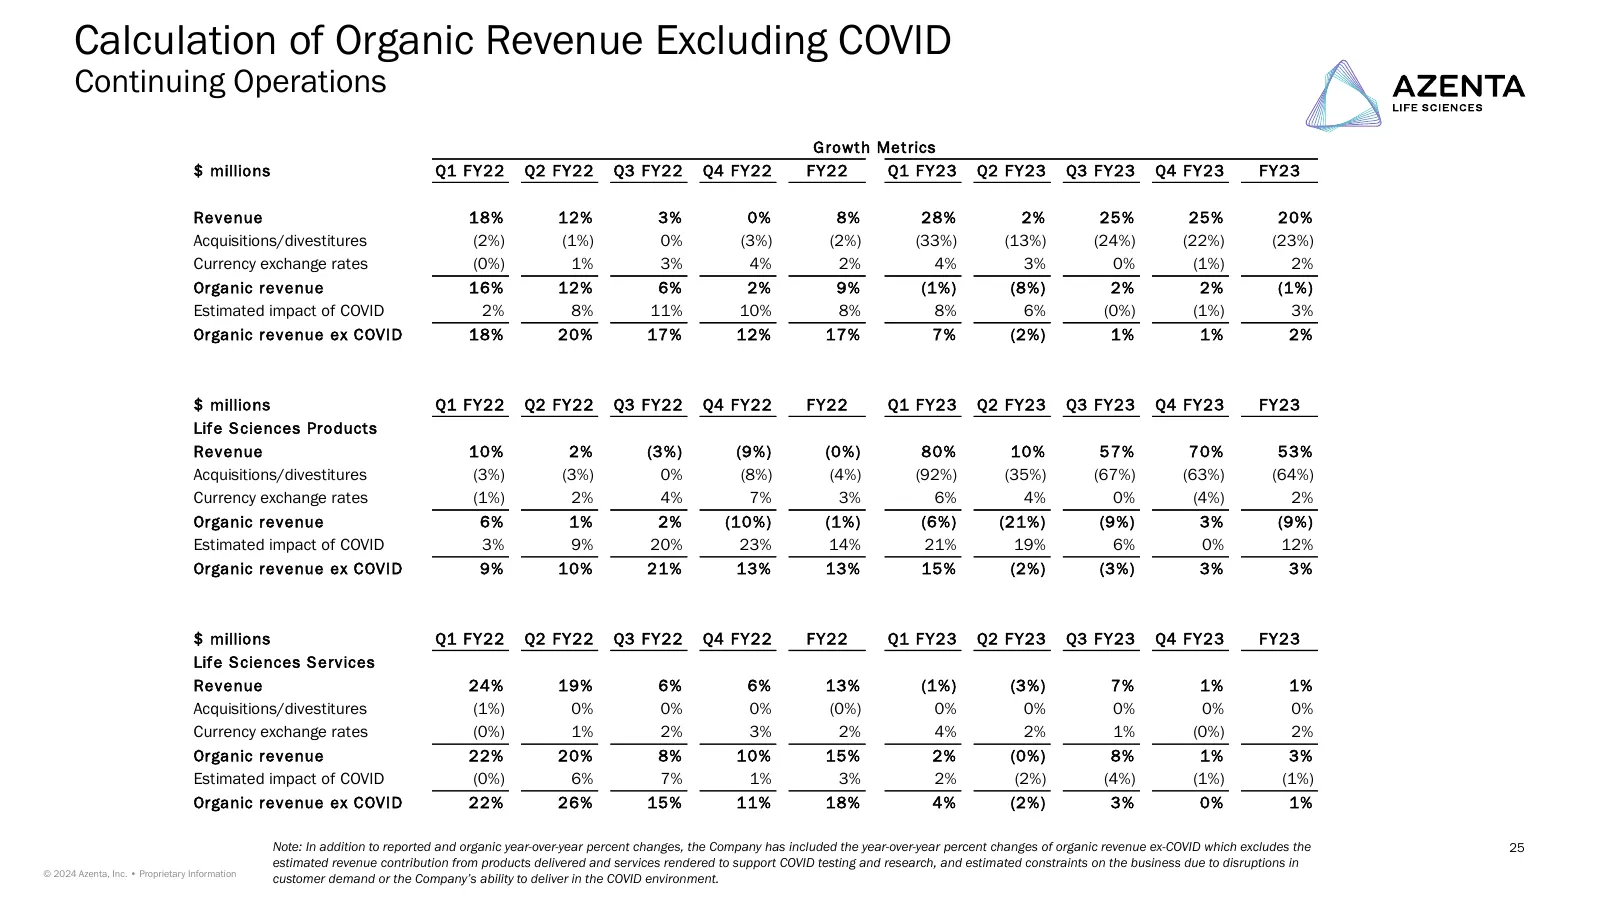
Calculation of Organic Revenue Excluding COVID Continuing Operations Growth Metrics $ millions Q1 FY22 Q2 FY22 Q3 FY22 Q4 FY22 FY22 Q1 FY23 Q2 FY23 Q3 FY23 Q4 FY23 FY23 Revenue 18% 12% 3% 0% 8% 28% 2% 25% 25% 20% Acquisitions/divestitures (2%) (1%) 0% (3%) (2%) (33%) (13%) (24%) (22%) (23%) Currency
Source: company website
More decks from Azenta, Inc.
 Q4 2026 Earnings Presentation14 slides · Nov 11, 2026
 Q4 2026 Earnings Presentation14 slides · Nov 11, 2026
 Q3 2026 Earnings Presentation13 slides · Aug 5, 2026
 Q2 2026 Earnings Presentation13 slides · May 6, 2026
 Q1 2026 Earnings Presentation13 slides · Feb 4, 2026
 Investor Day (December 2025)67 slides · Dec 10, 2025