Atlas Financial — Q1 2016 Earnings Presentation
24 slides from Atlas Financial's earnings presentation, May 9, 2016
Slide 1: 2016 First Quarter Conference Call
2016 First Quarter Conference Call May 10, 2016
Slide 2: Forward-looking statements
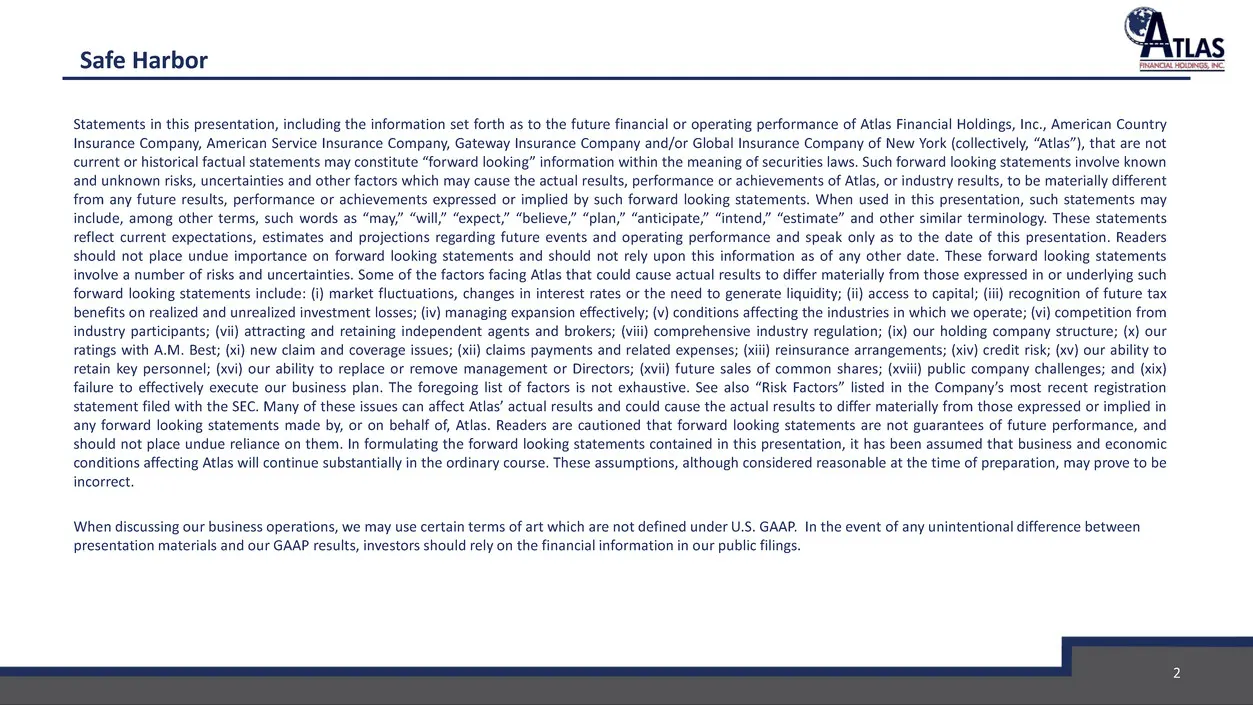
Statements in this presentation, including the information set forth as to the future financial or operating performance of Atlas Financial Holdings, Inc., American Country Insurance Company, American Service Insurance Company, Gateway Insurance Company and/or Global Insurance Company of New York (c
Slide 3: Atlas Snapshot
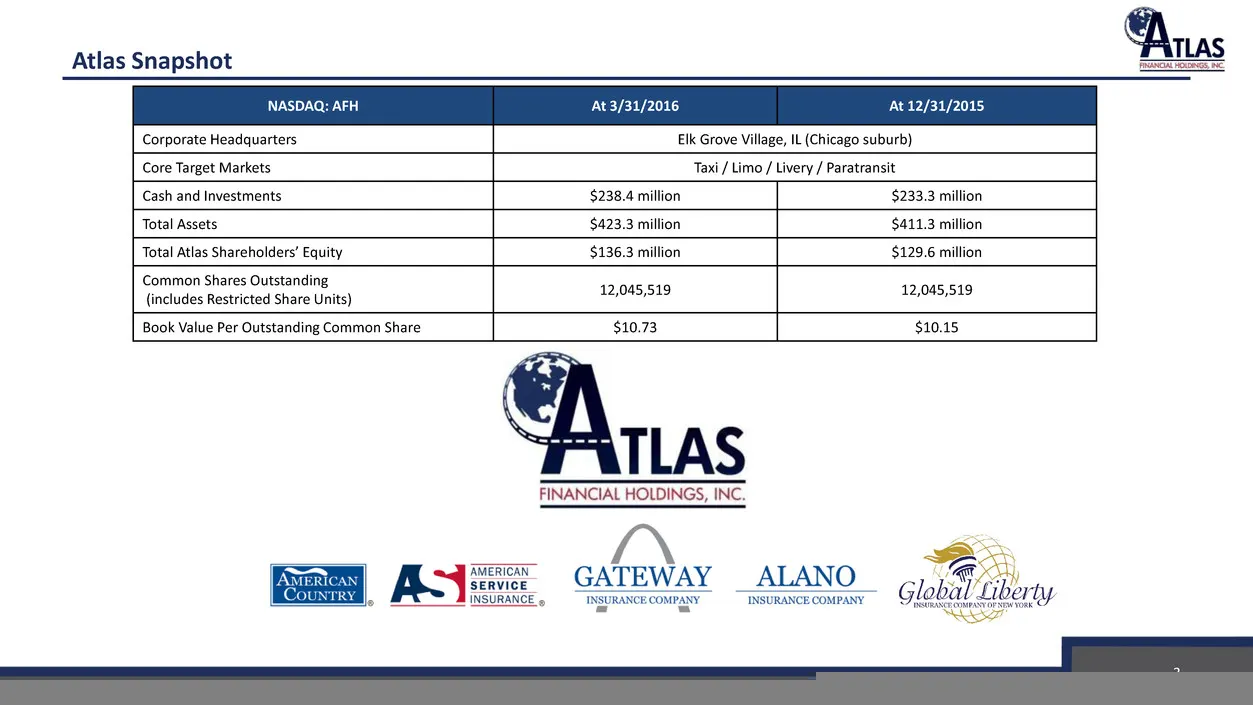
Atlas Snapshot 3 NASDAQ: AFH At 3/31/2016 At 12/31/2015 Corporate Headquarters Elk Grove Village, IL (Chicago suburb) Core Target Markets Taxi / Limo / Livery / Paratransit Cash and Investments $238.4 million $233.3 million Total Assets $423.3 million $411.3 million Total Atlas Shareholders’ Equity
Slide 4: 2016 Q1 Financial and Operating Highlights
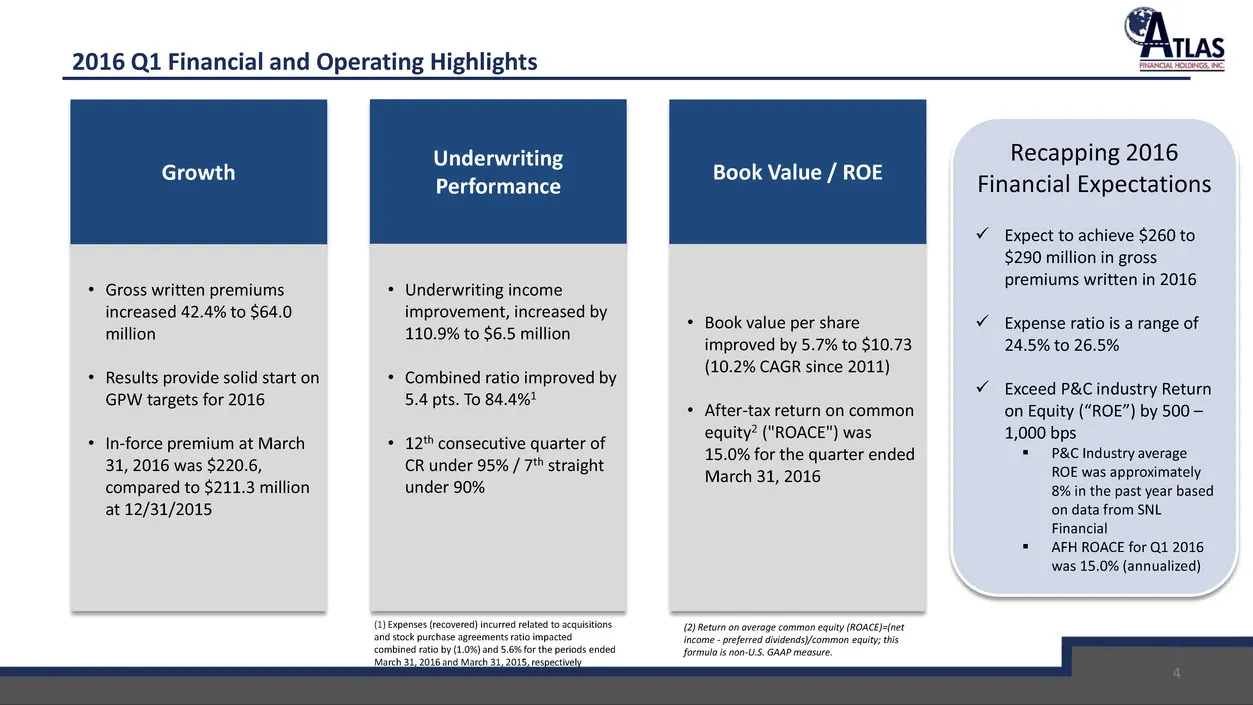
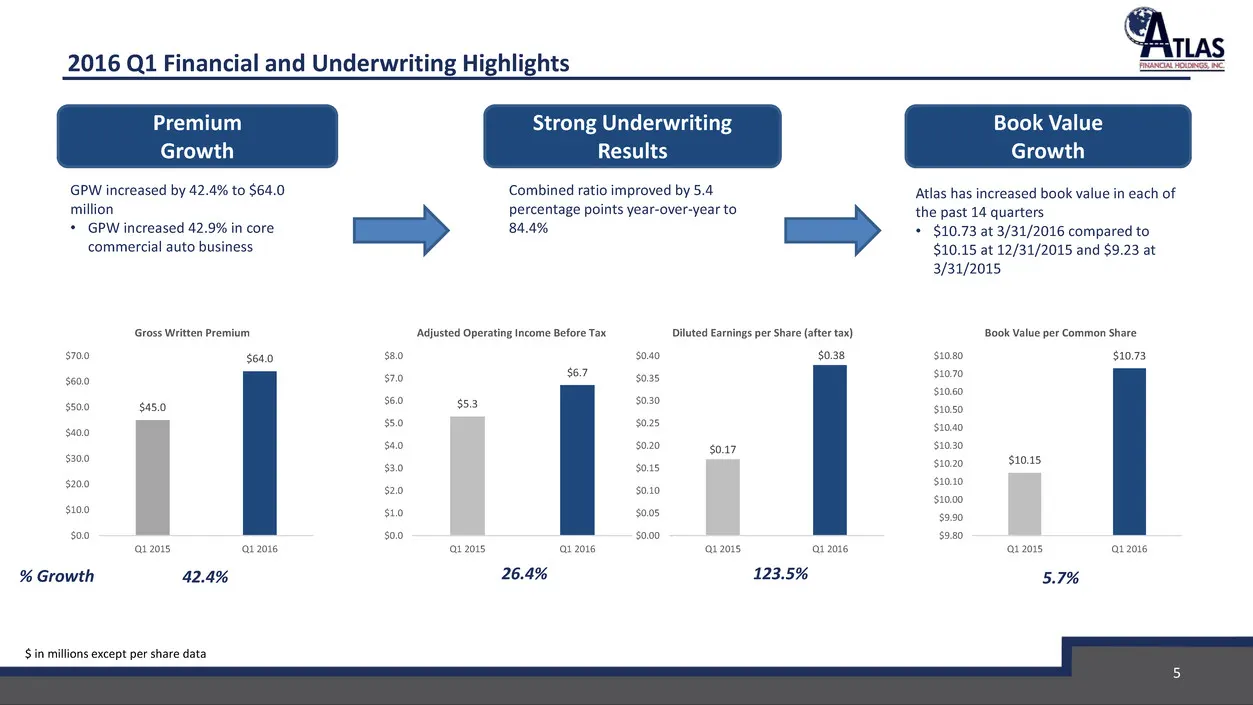
• Gross written premiums increased 42.4% to $64.0 million • Results provide solid start on GPW targets for 2016 • In-force premium at March 31, 2016 was $220.6, compared to $211.3 million at 12/31/2015 Growth Recapping 2016 Financial Expectations Expect to achieve $260 to $290 million in gross pre
Slide 5: 2016 Q1 Financial and Underwriting Highlights
5 % Growth 42.4% 26.4% 5.7% 2016 Q1 Financial and Underwriting Highlights $45.0 $64.0 $0.0 $10.0 $20.0 $30.0 $40.0 $50.0 $60.0 $70.0 Q1 2015 Q1 2016 Gross Written Premium $5.3 $6.7 $0.0 $1.0 $2.0 $3.0 $4.0 $5.0 $6.0 $7.0 $8.0 Q1 2015 Q1 2016 Adjusted Operating Income Before Tax $0.17 $0.38 $0.00 $0.
Slide 6: Consistent Quarterly Year/Year Margin Improvement Since 2013 U.S. IPO
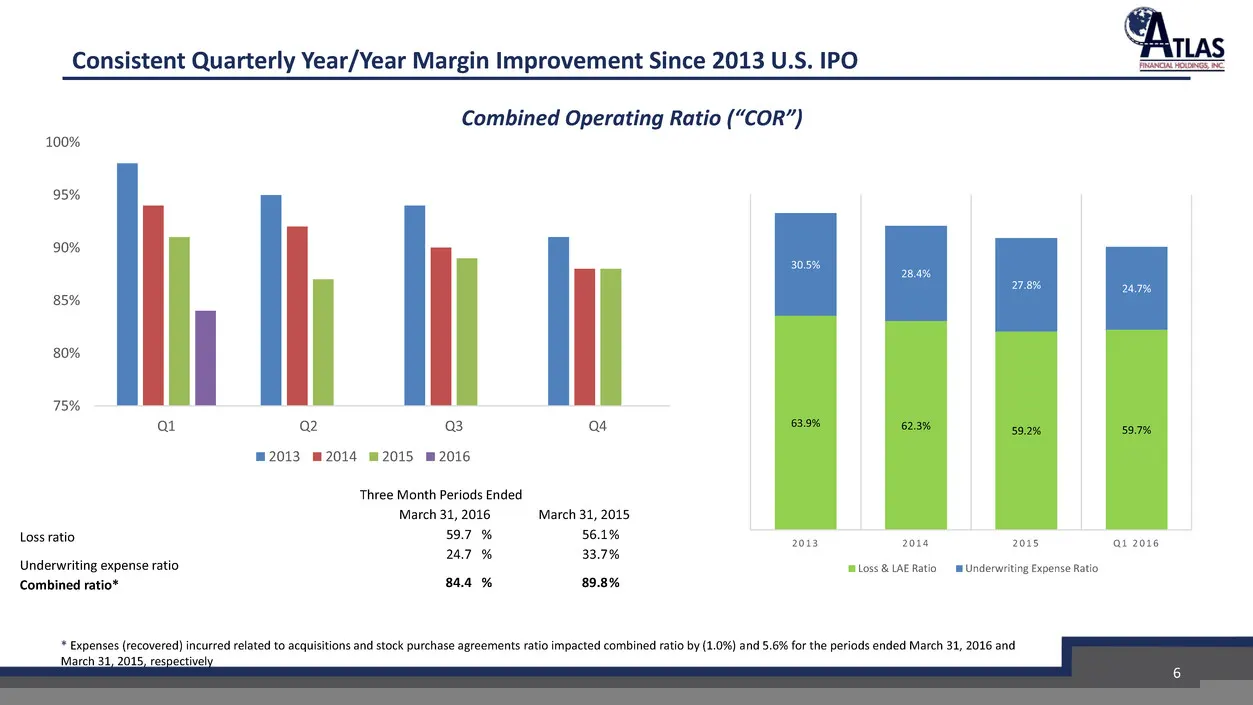
Consistent Quarterly Year/Year Margin Improvement Since 2013 U.S. IPO 6 Combined Operating Ratio (“COR”) Three Month Periods Ended March 31, 2016 March 31, 2015 Loss ratio 59.7 % 56.1 % Underwriting expense ratio 24.7 % 33.7 % Combined ratio* 84.4 % 89.8 % 63.9% 62.3% 59.2% 59.7% 30.5% 28.4% 27.8% 2
Slide 7: Gross Written Premium: Inforce
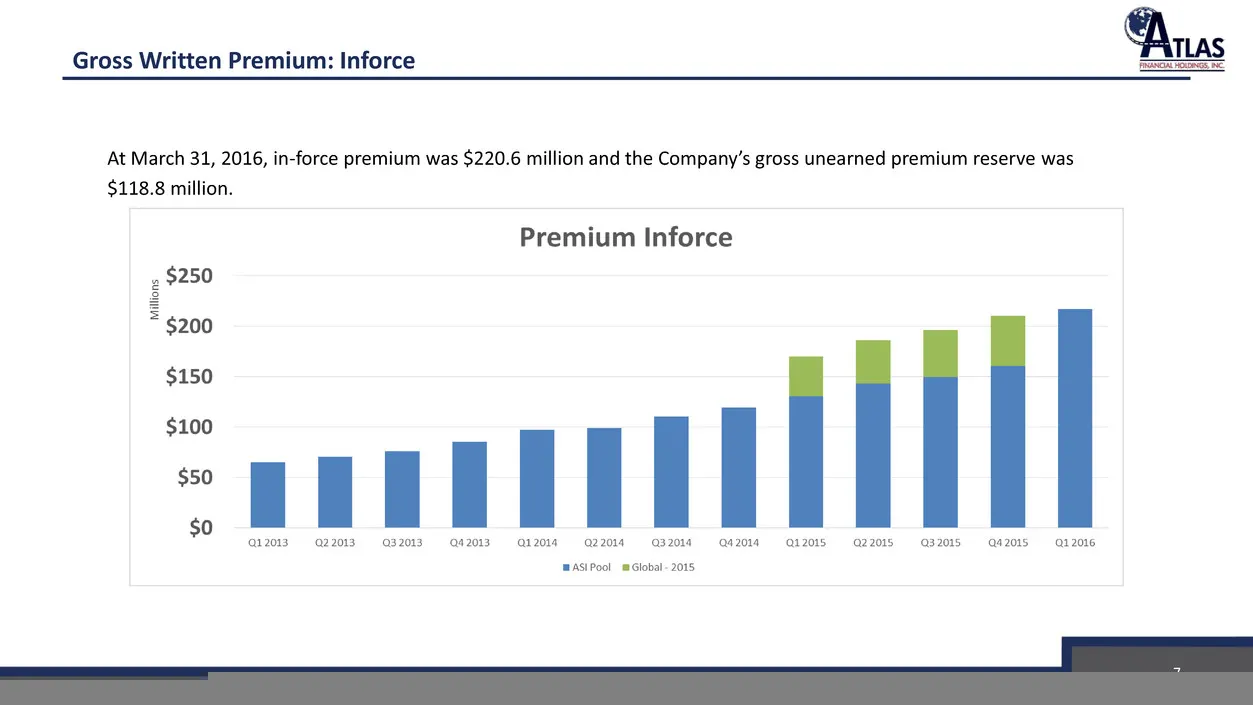
Gross Written Premium: Inforce 7 At March 31, 2016, in-force premium was $220.6 million and the Company’s gross unearned premium reserve was $118.8 million.
Slide 8: Geographic Diversification
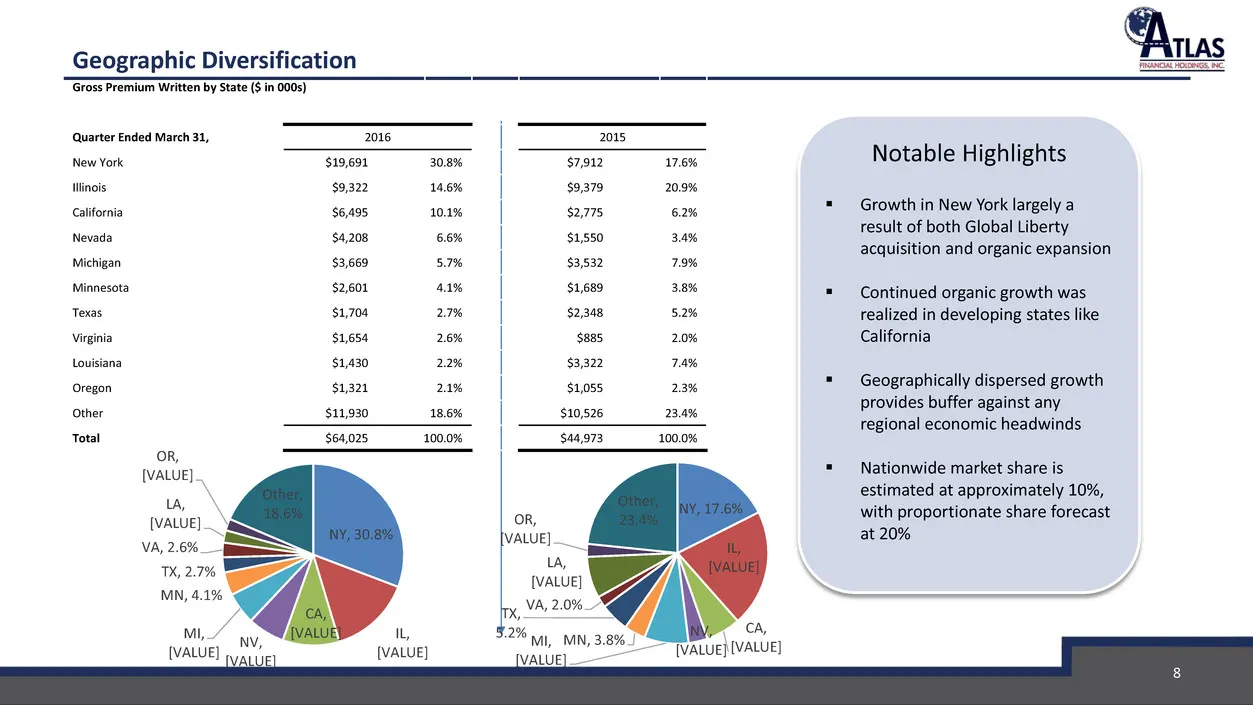
Geographic Diversification 8 Notable Highlights Growth in New York largely a result of both Global Liberty acquisition and organic expansion Continued organic growth was realized in developing states like California Geographically dispersed growth provides buffer against any regional economic
Slide 9: Operating Activities: Underwriting - Bound/Application Ratio
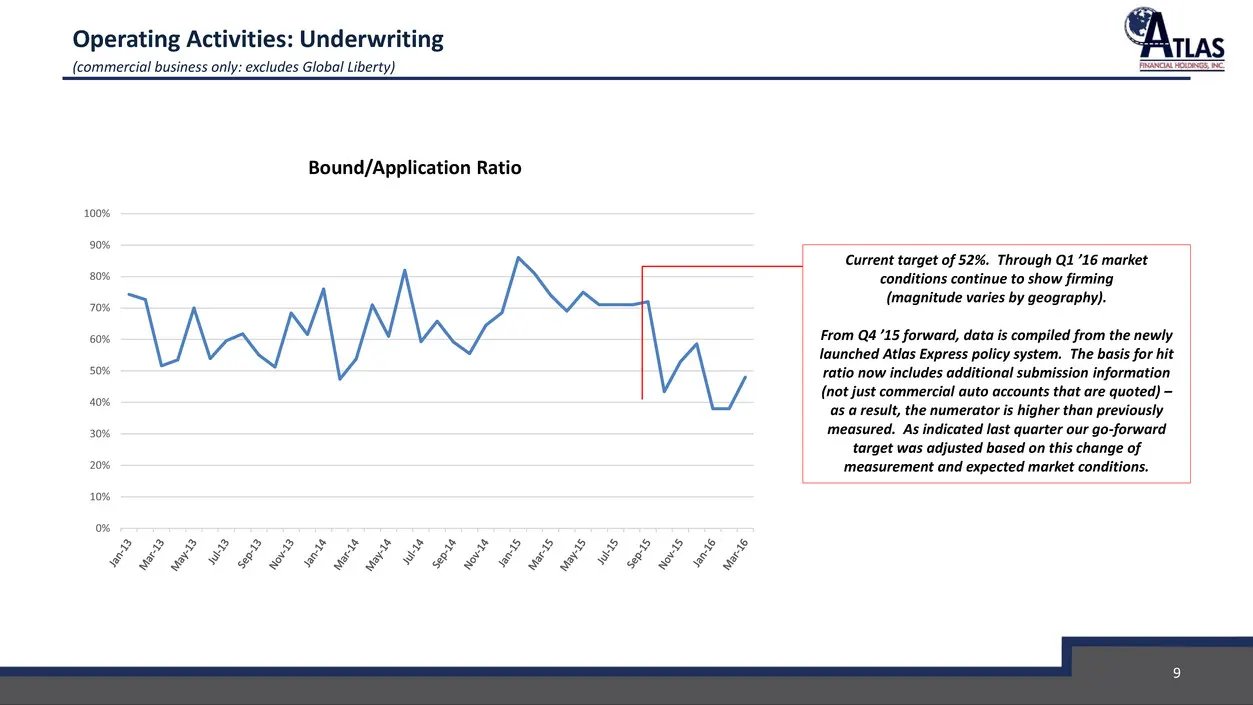
Operating Activities: Underwriting (commercial business only: excludes Global Liberty) 9 Bound/Application Ratio Current target of 52%. Through Q1 ’16 market conditions continue to show firming (magnitude varies by geography). From Q4 ’15 forward, data is compiled from the newly launched Atlas Expre
Slide 10: Operating Activities: Underwriting - Renewal Retention
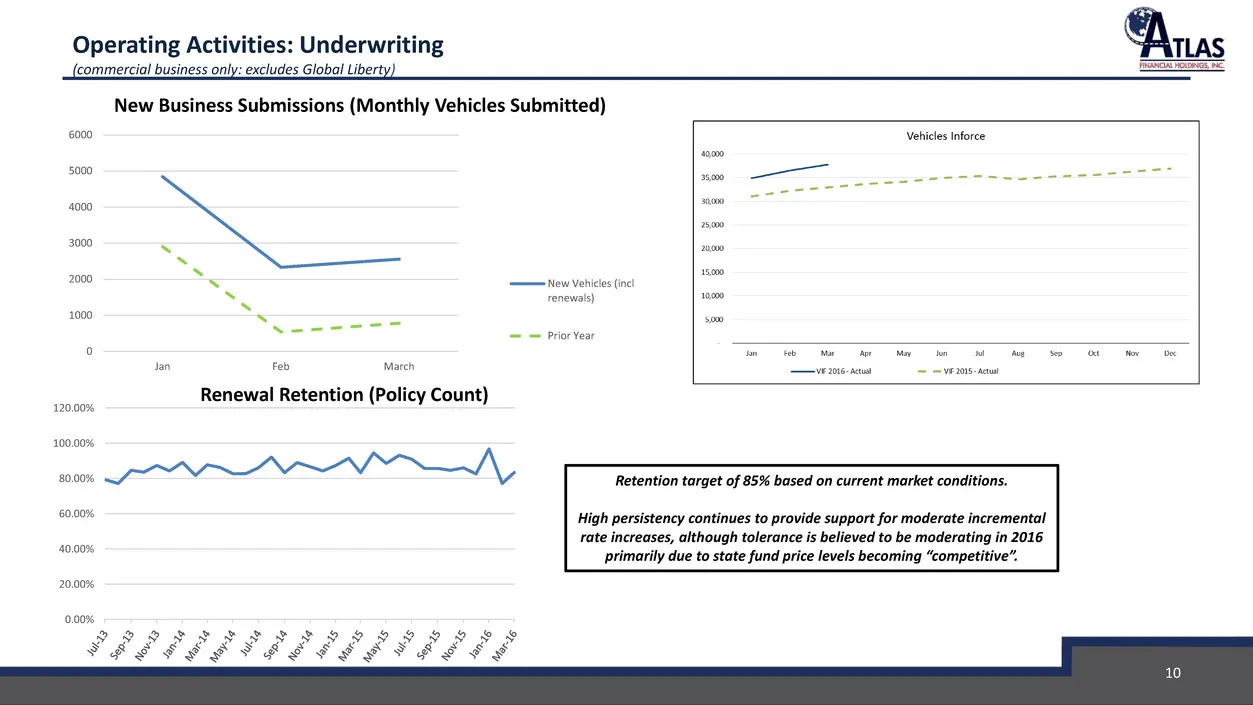
Operating Activities: Underwriting (commercial business only: excludes Global Liberty) 10 Renewal Retention (Policy Count) Retention target of 85% based on current market conditions. High persistency continues to provide support for moderate incremental rate increases, although tolerance is believed
Slide 11: Operating Leverage
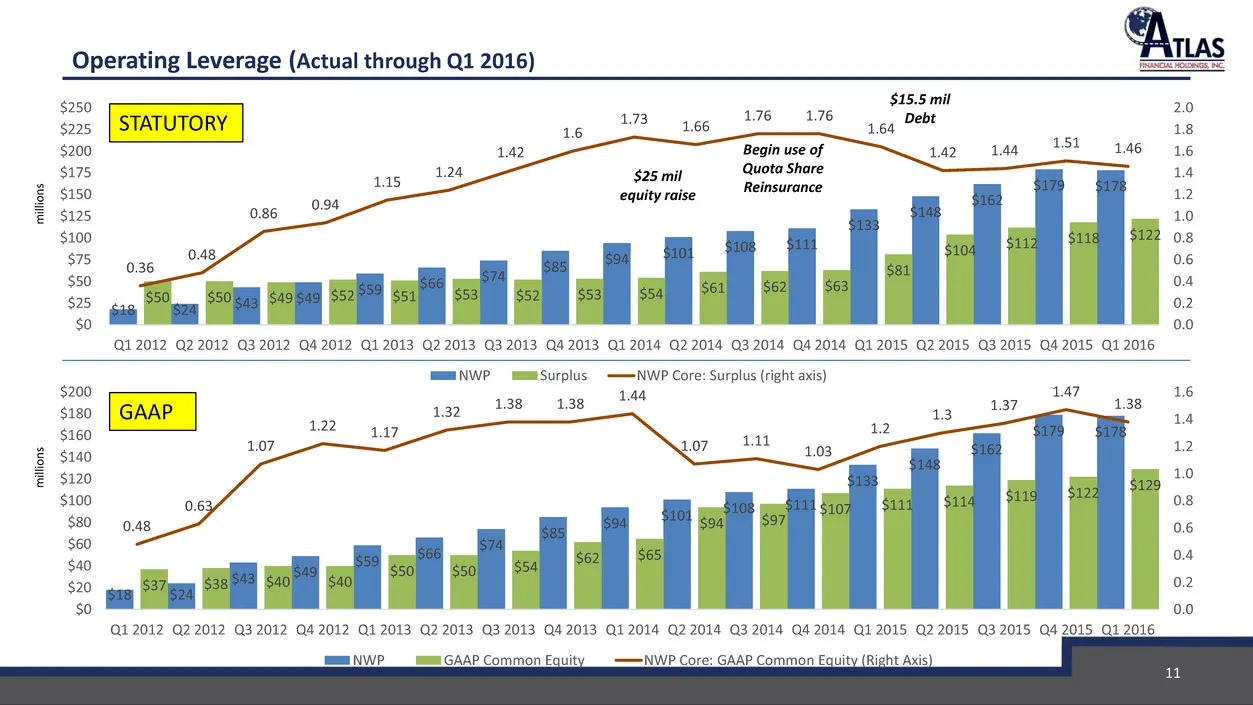
Operating Leverage (Actual through Q1 2016) $25 mil equity raise 11 $15.5 mil Debt Begin use of Quota Share Reinsurance $18 $24 $43 $49 $59 $66 $74 $85 $94 $101 $108 $111 $133 $148 $162 $179 $178 $50 $50 $49 $52 $51 $53 $52 $53 $54 $61 $62 $63 $81 $104 $112 $118 $122 0.36 0.48 0.86 0.94 1.15 1.24 1.
Slide 12: Financial Highlights
Financial Highlights Diras FINANCIAL HOLDINGS, INC. S
Slide 13: Q1 2016 Financial Highlights
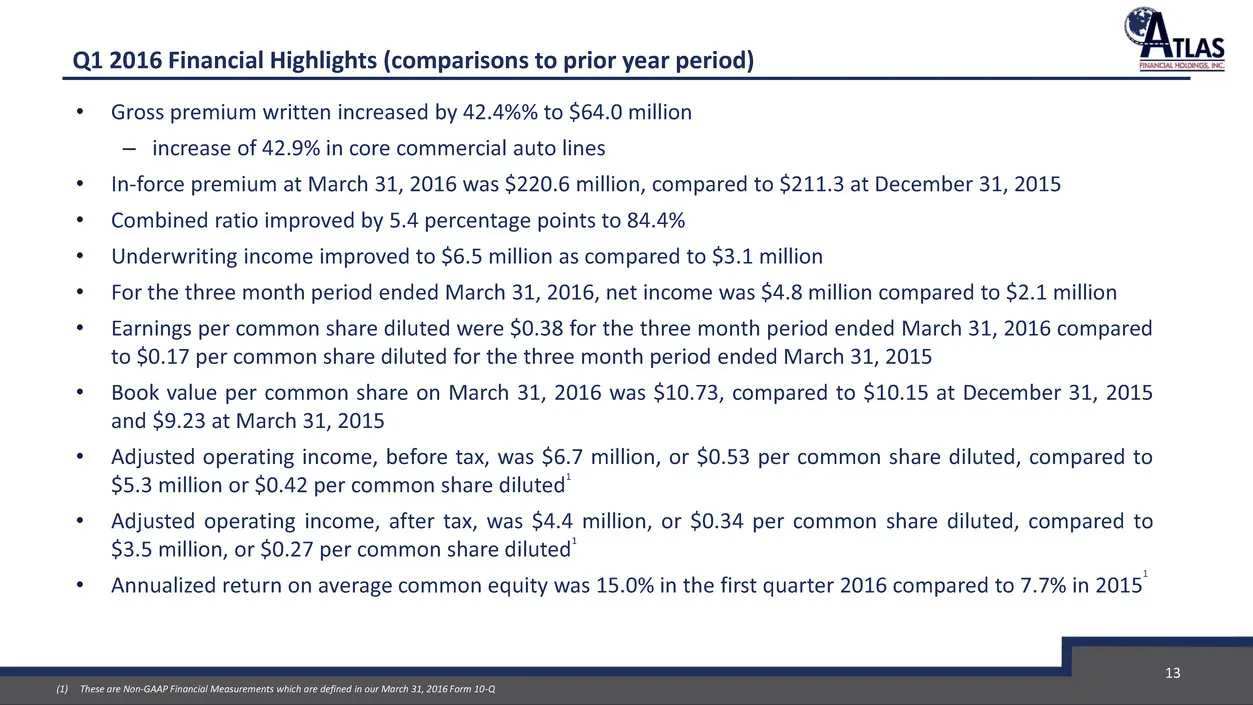
Q1 2016 Financial Highlights (comparisons to prior year period) • Gross premium written increased by 42.4%% to $64.0 million – increase of 42.9% in core commercial auto lines • In-force premium at March 31, 2016 was $220.6 million, compared to $211.3 at December 31, 2015 • Combined ratio improved by
Slide 14: 2016 Q1 Adjusted Operating Income
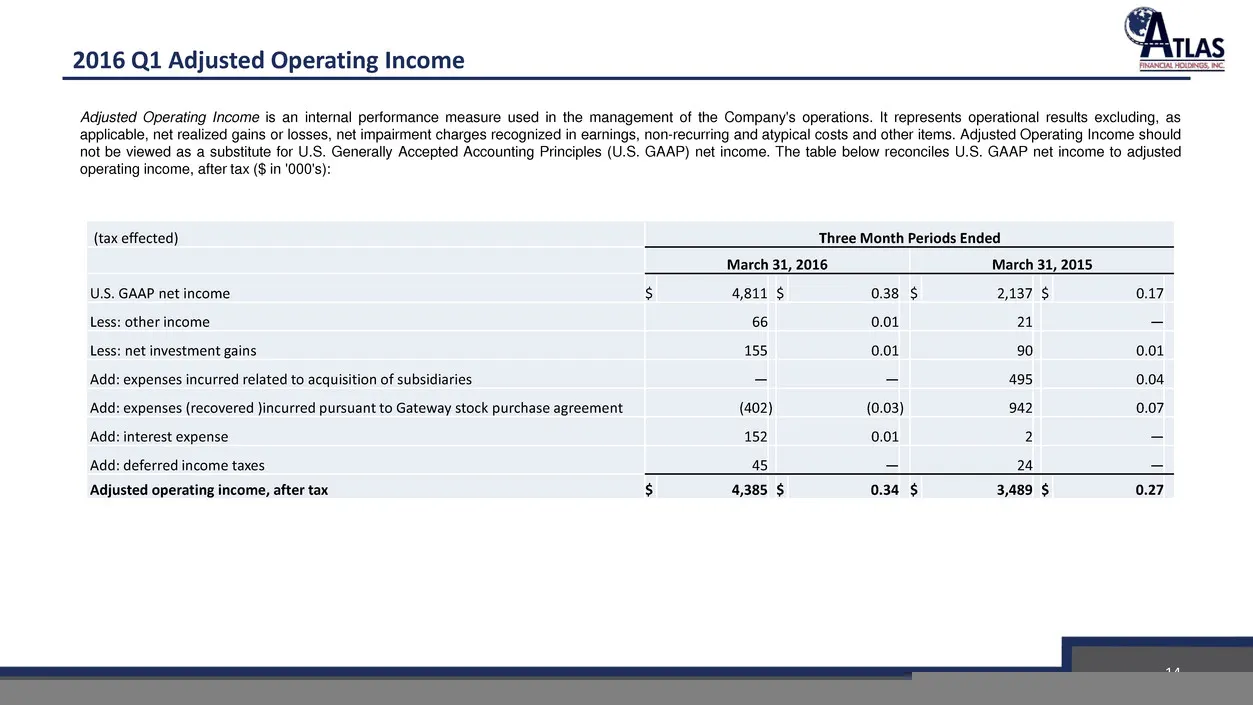
2016 Q1 Adjusted Operating Income Adjusted Operating Income is an internal performance measure used in the management of the Company's operations. It represents operational results excluding, as applicable, net realized gains or losses, net impairment charges recognized in earnings, non-recurring an
Slide 15: Detailed Impact of Changes to Book Value per Common Share
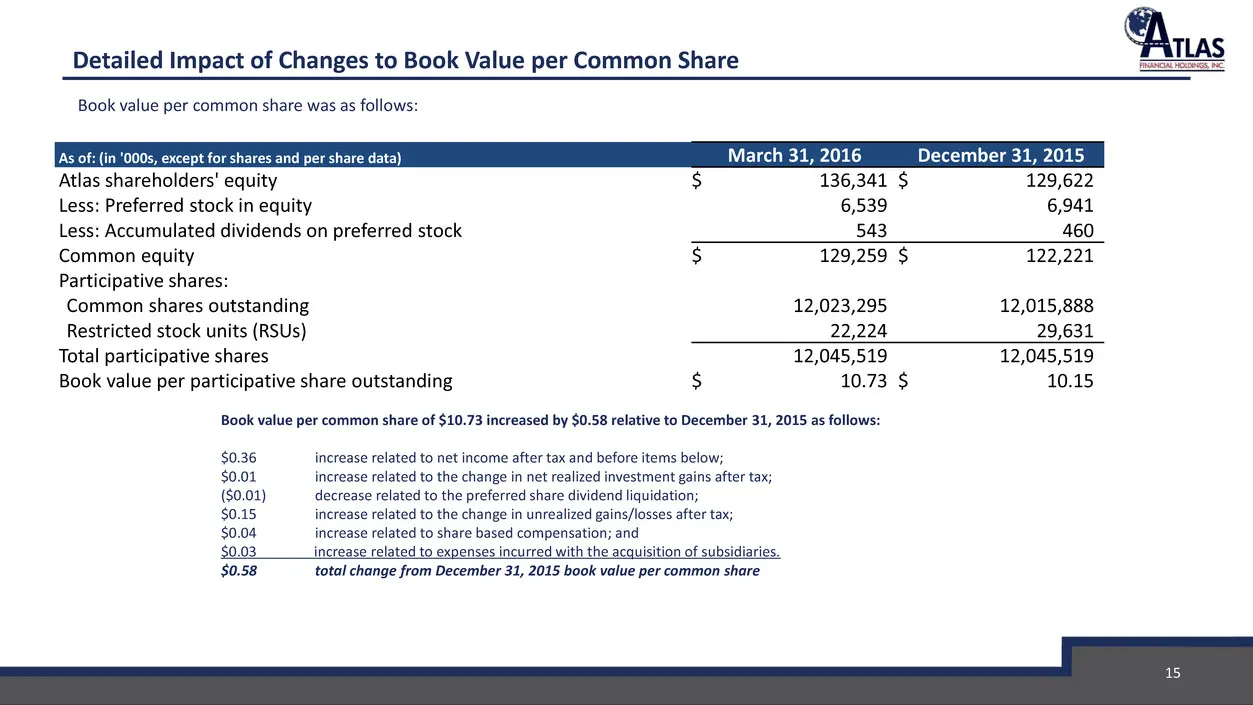
15 Detailed Impact of Changes to Book Value per Common Share Book value per common share was as follows: Book value per common share of $10.73 increased by $0.58 relative to December 31, 2015 as follows: $0.36 increase related to net income after tax and before items below; $0.01 increase related to
Slide 16: Attractive investment leverage and credit facility
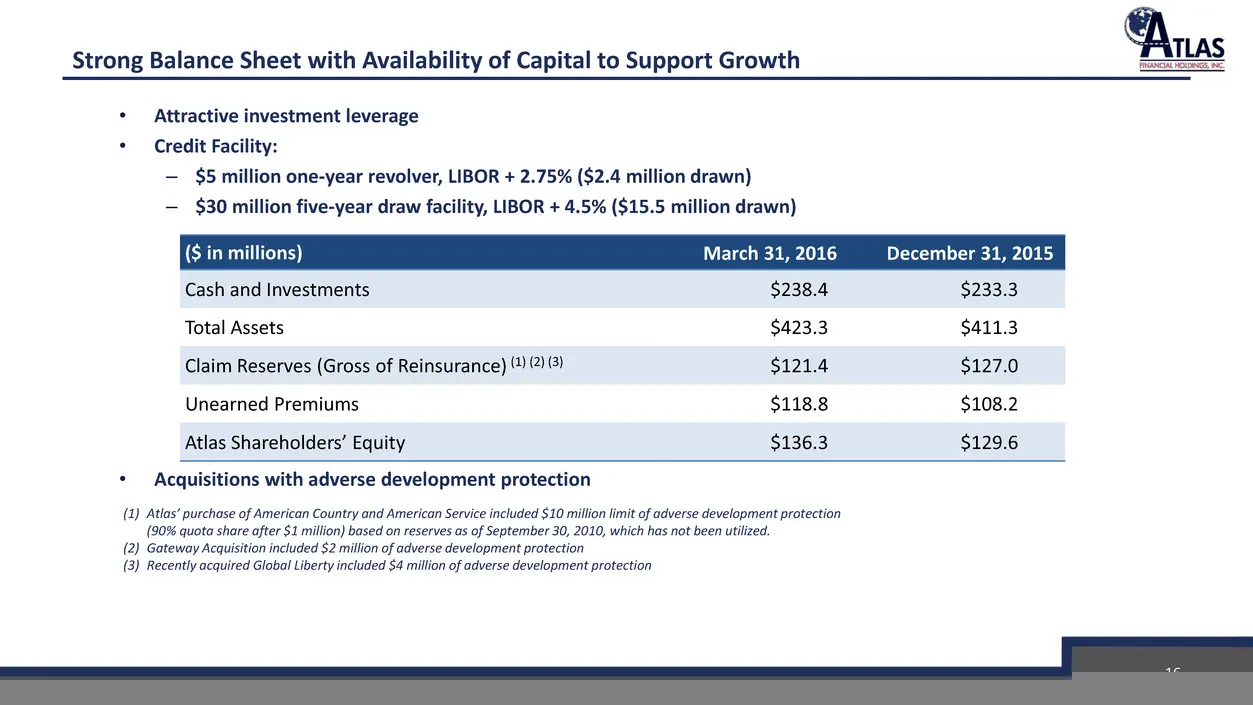
• Attractive investment leverage • Credit Facility: – $5 million one-year revolver, LIBOR + 2.75% ($2.4 million drawn) – $30 million five-year draw facility, LIBOR + 4.5% ($15.5 million drawn) • Acquisitions with adverse development protection ($ in millions) March 31, 2016 December 31, 2015 Cash an
Slide 17: Investment Portfolio
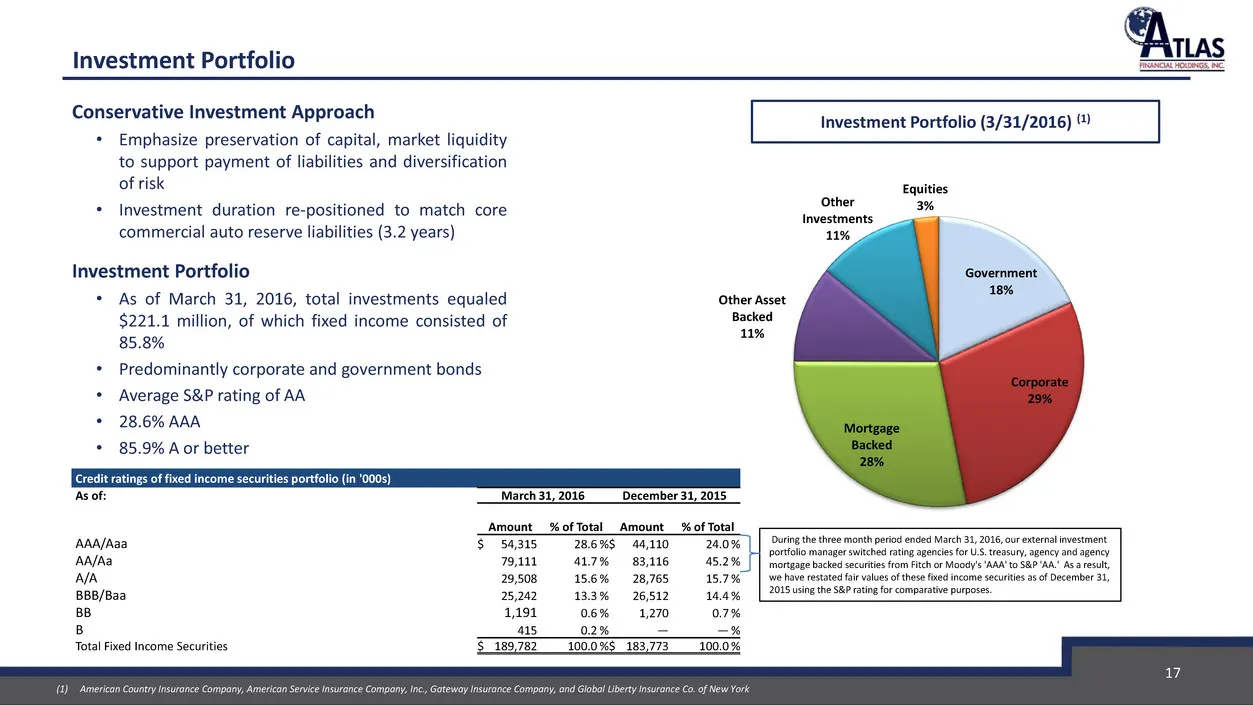
Investment Portfolio Conservative Investment Approach • Emphasize preservation of capital, market liquidity to support payment of liabilities and diversification of risk • Investment duration re-positioned to match core commercial auto reserve liabilities (3.2 years) Investment Portfolio • As of Mar
Slide 18: Outlook / Market Overview
Outlook / Market Overview Diras FINANCIAL HOLDINGS, INC. S
Slide 19: Commercial Auto vs. P&C
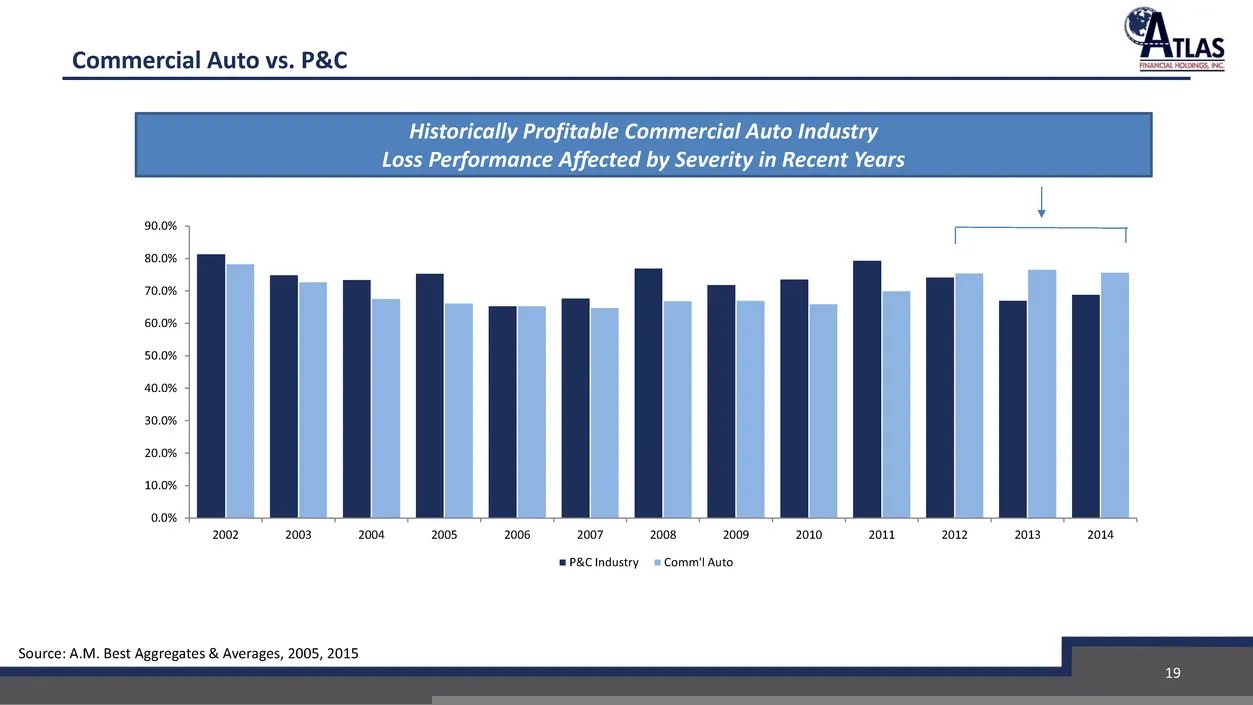
Commercial Auto vs. P&C 19 Historically Profitable Commercial Auto Industry Loss Performance Affected by Severity in Recent Years 0.0% 10.0% 20.0% 30.0% 40.0% 50.0% 60.0% 70.0% 80.0% 90.0% 2002 2003 2004 2005 2006 2007 2008 2009 2010 2011 2012 2013 2014 P&C Industry Comm'l Auto Source: A.M. Best Agg
Slide 20: Operating Activities: Market Conditions - Commercial Pricing Trend
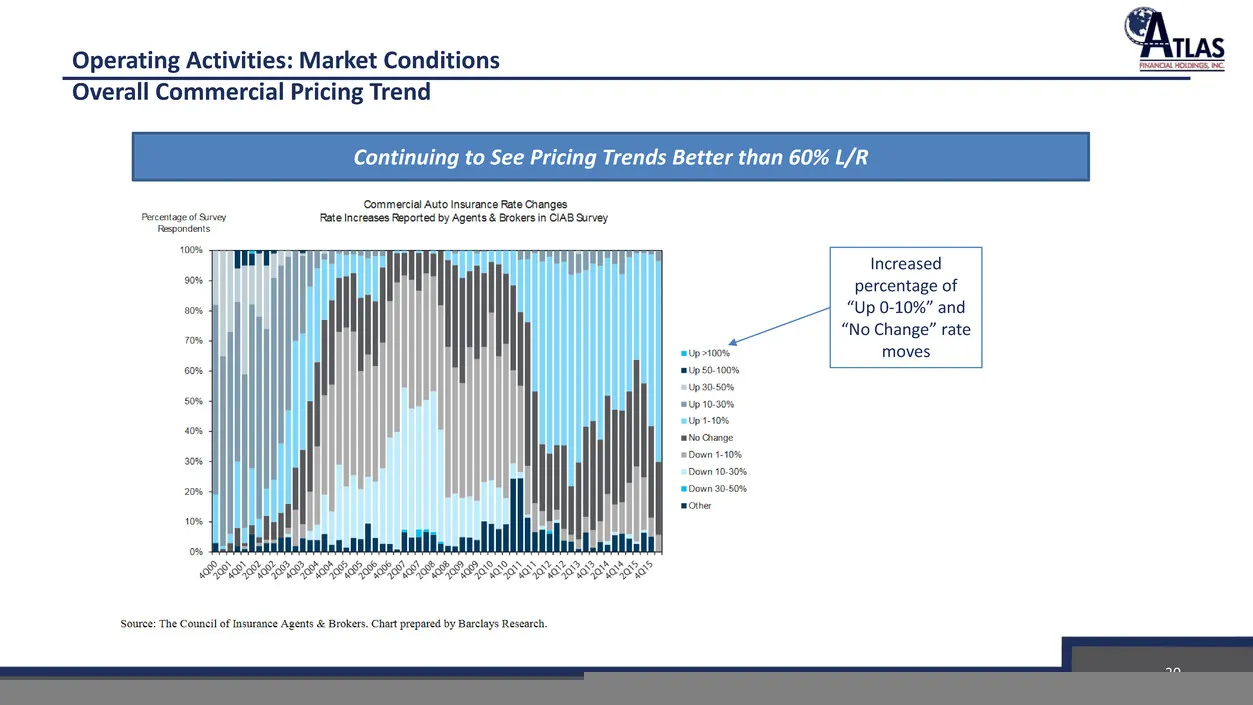
Operating Activities: Market Conditions Overall Commercial Pricing Trend 20 Continuing to See Pricing Trends Better than 60% L/R Increased percentage of “Up 0-10%” and “No Change” rate moves * As of May 3, 2016
Slide 21: Operating Activities: Market Conditions - Commercial Pricing Trend
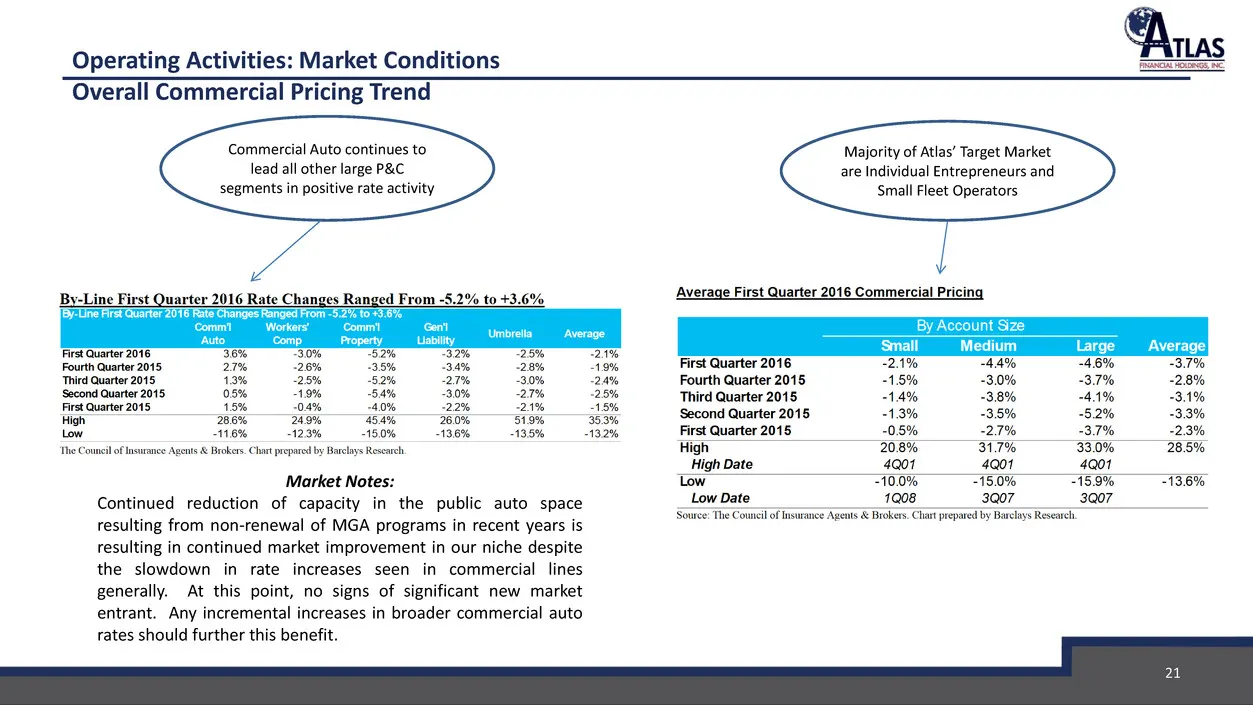
Operating Activities: Market Conditions Overall Commercial Pricing Trend Majority of Atlas’ Target Market are Individual Entrepreneurs and Small Fleet Operators Market Notes: Continued reduction of capacity in the public auto space resulting from non-renewal of MGA programs in recent years is result
Slide 22: Outlook for 2016
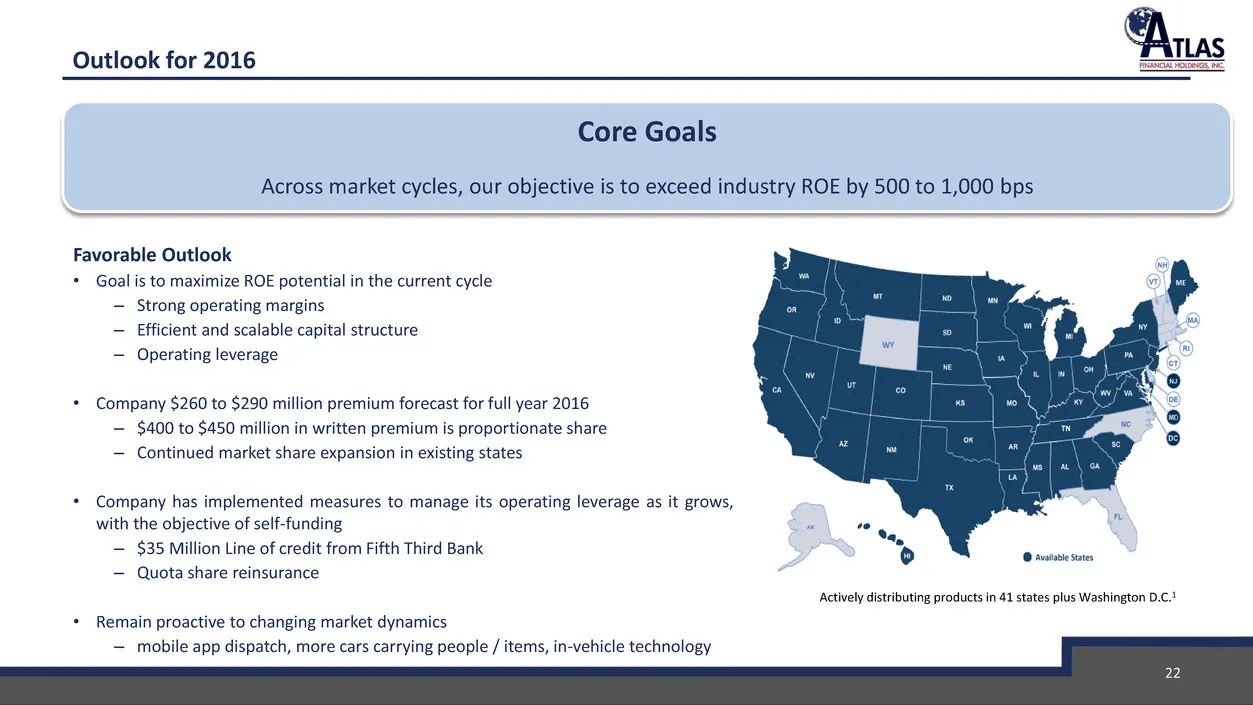
Outlook for 2016 Favorable Outlook • Goal is to maximize ROE potential in the current cycle – Strong operating margins – Efficient and scalable capital structure – Operating leverage • Company $260 to $290 million premium forecast for full year 2016 – $400 to $450 million in written premium is propo
Slide 23: AFH Investor Day
Monday, May 16, 2016 Time: Check in 12:00 PM (Approximate time – 3 hours) Atlas Headquarters 150 Northwest Point Boulevard Elk Grove Village, IL 60007 (about 20 miles from downtown Chicago / 5 miles from ORD) Please RSVP if you have not done so already: The Equity Group Adam Prior 212-836-9606, apri
Slide 24: For Additional Information
Nasdaq: AFH For Additional Information At the Company: Scott Wollney Chief Executive Officer swollney@atlas-fin.com 847-700-8600 Investor Relations: The Equity Group Inc. Adam Prior Senior Vice President APrior@equityny.com 212-836-9606 24
Source: SEC EDGAR · 8-K filed May 9, 2016
More decks from Atlas Financial Holdings Inc
 Investor Presentation (November 2022)20 slides · Nov 14, 2022
 Investor Presentation (August 2022)21 slides · Aug 12, 2022
 Investor Presentation (May 2022)20 slides · May 23, 2022
 Investor Presentation (April 2022)18 slides · Apr 4, 2022
 Investor Presentation (November 2021)28 slides · Nov 8, 2021
 Q2 2021 Earnings Presentation26 slides · Aug 10, 2021