CleanSpark, Inc. · NASDAQ:CLSK
CleanSpark — Q3 FY2022 Earnings Presentation
31 slides from CleanSpark's earnings presentation, September 2022
Slide 1: Investor Presentation September 2022
® Investor Presentation September 2022
Slide 2: Disclaimer
Disclaimer CleanSpark cautions you that statements in this presentation that are not a description of historical facts are forward-looking statements. These statements are based on CleanSpark’s current beliefs and expectations. The inclusion of forward-looking statements should not be regarded as a
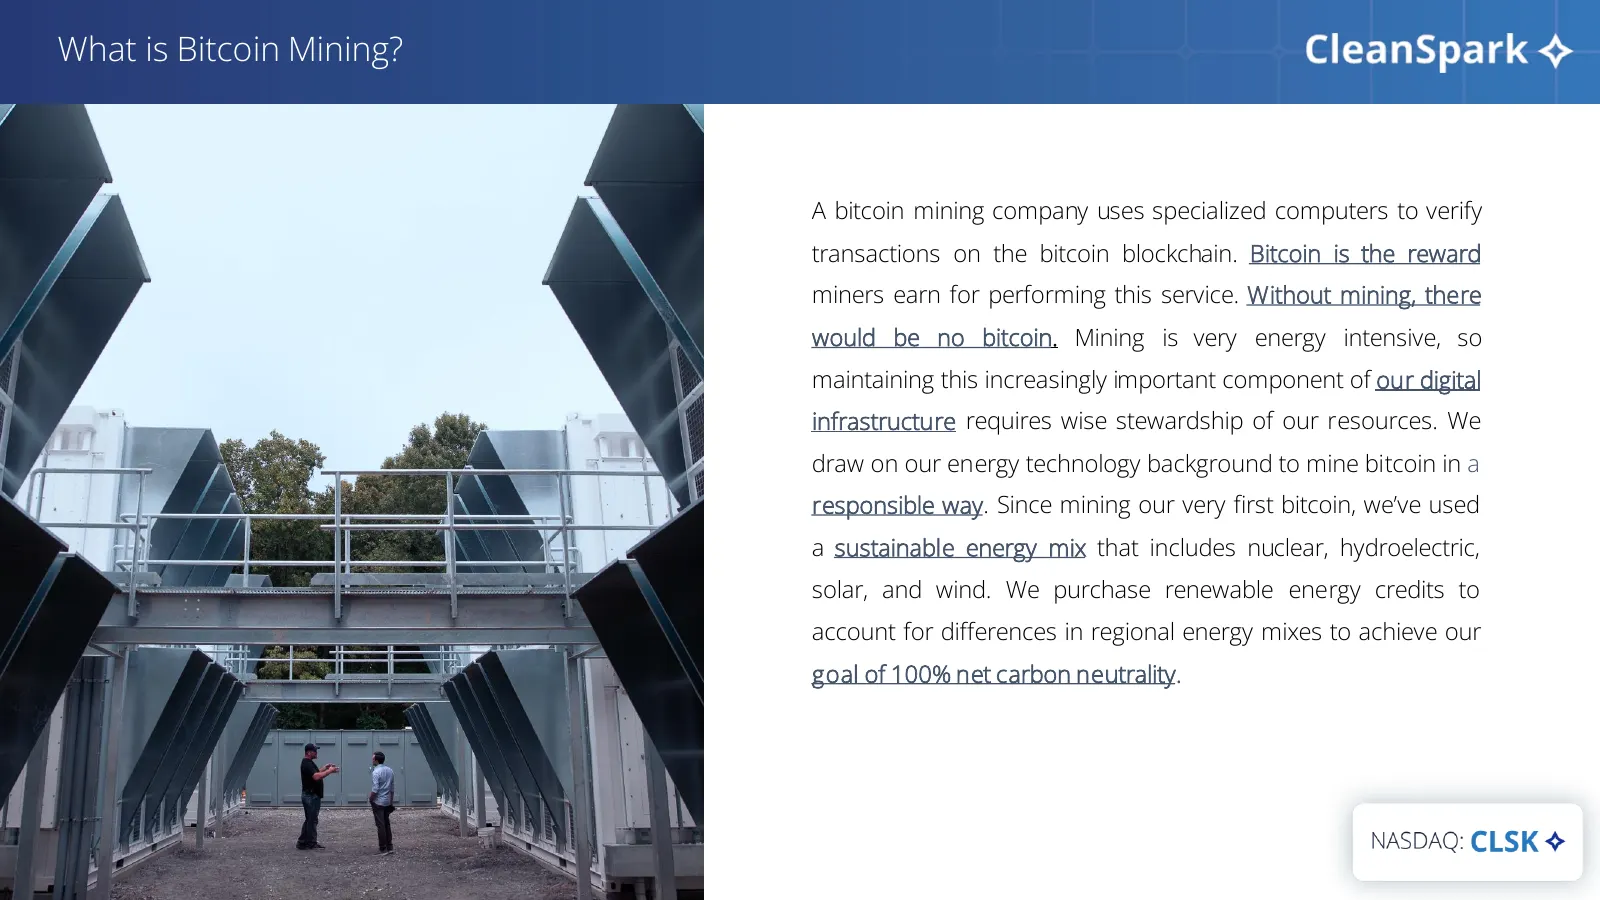
Slide 3: What is Bitcoin Mining?
What is Bitcoin Mining? A bitcoin mining company uses specialized computers to verify transactions on the bitcoin blockchain. Bitcoin is the reward miners earn for performing this service. Without mining, there would be no bitcoin. Mining is very energy intensive, so maintaining this increasingly im
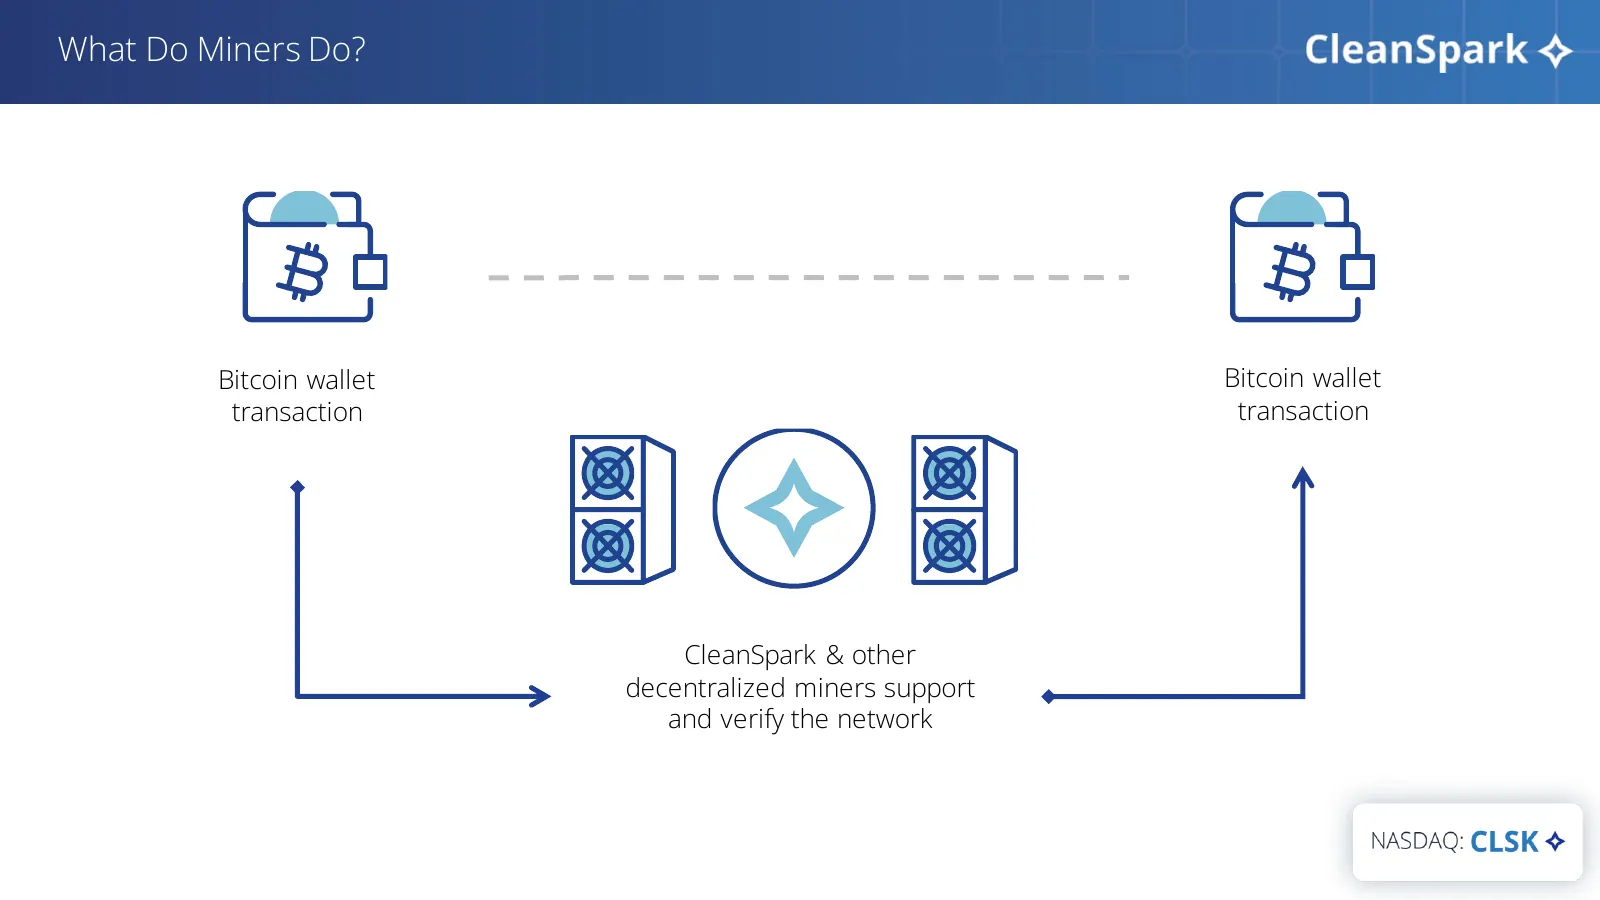
Slide 4: What Do Miners Do?
What Do Miners Do? Bitcoin wallet Bitcoin wallet transaction transaction CleanSpark & other decentralized miners support and verify the network
Slide 5: What are Block Rewards?
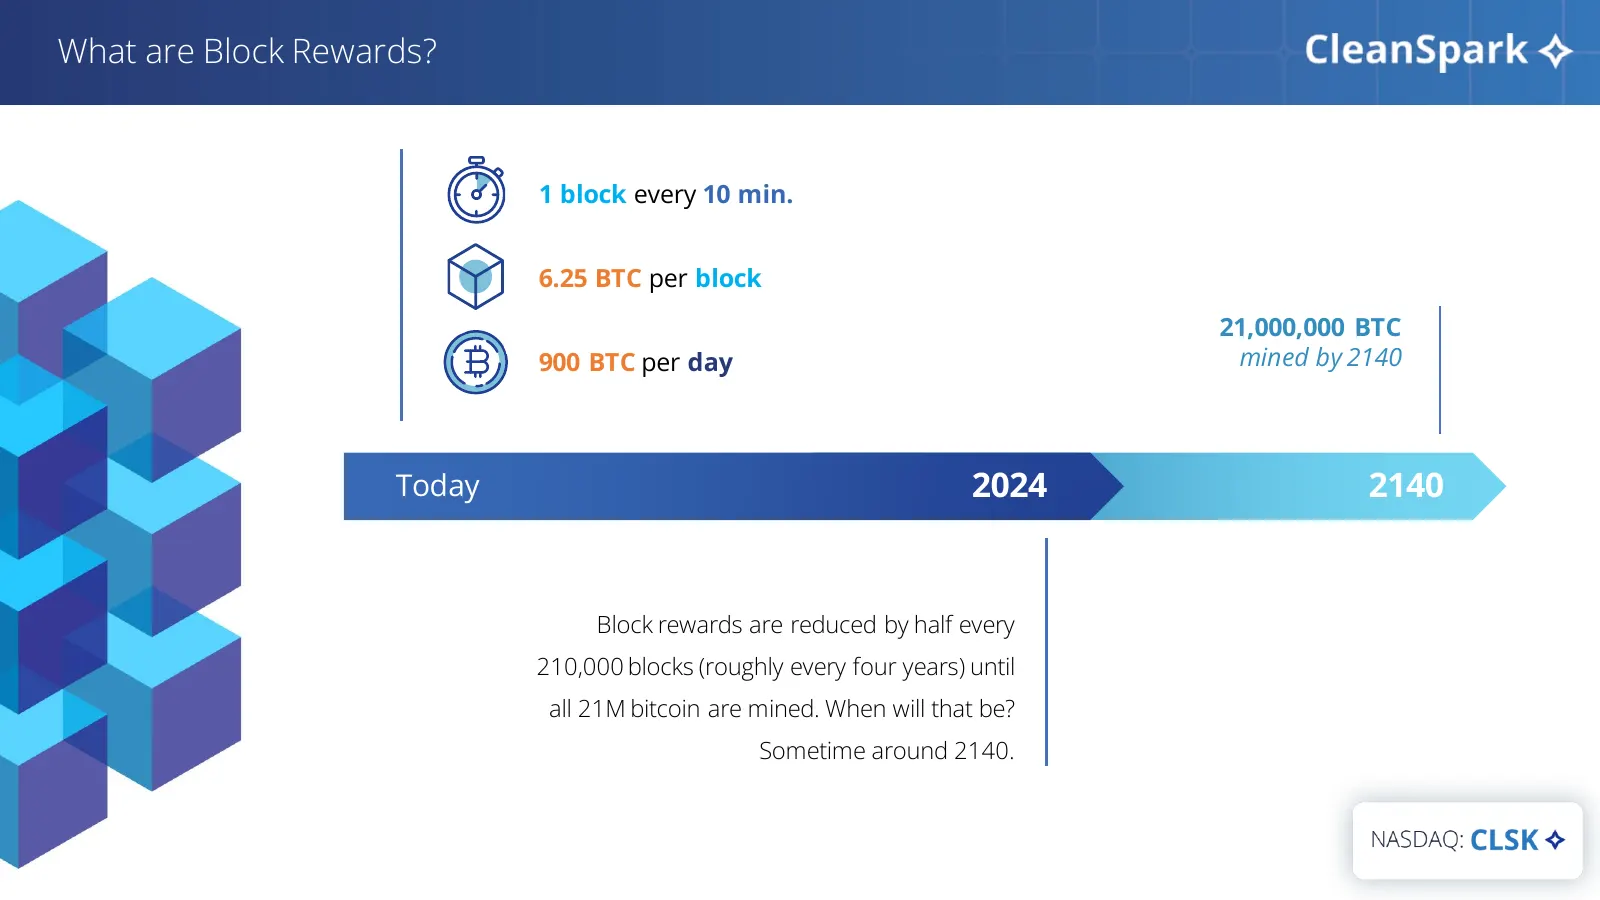
What are Block Rewards? 1 block every 10 min. 6.25 BTC per block 21,000,000 BTC 900 BTC per day mined by 2140 Today 2024 2140 Block rewards are reduced by half every 210,000 blocks (roughly every four years) until all 21M bitcoin are mined. When will that be? Sometime around 2140.
Slide 6: Top 5 North American Bitcoin Miner: Metrics That Matter
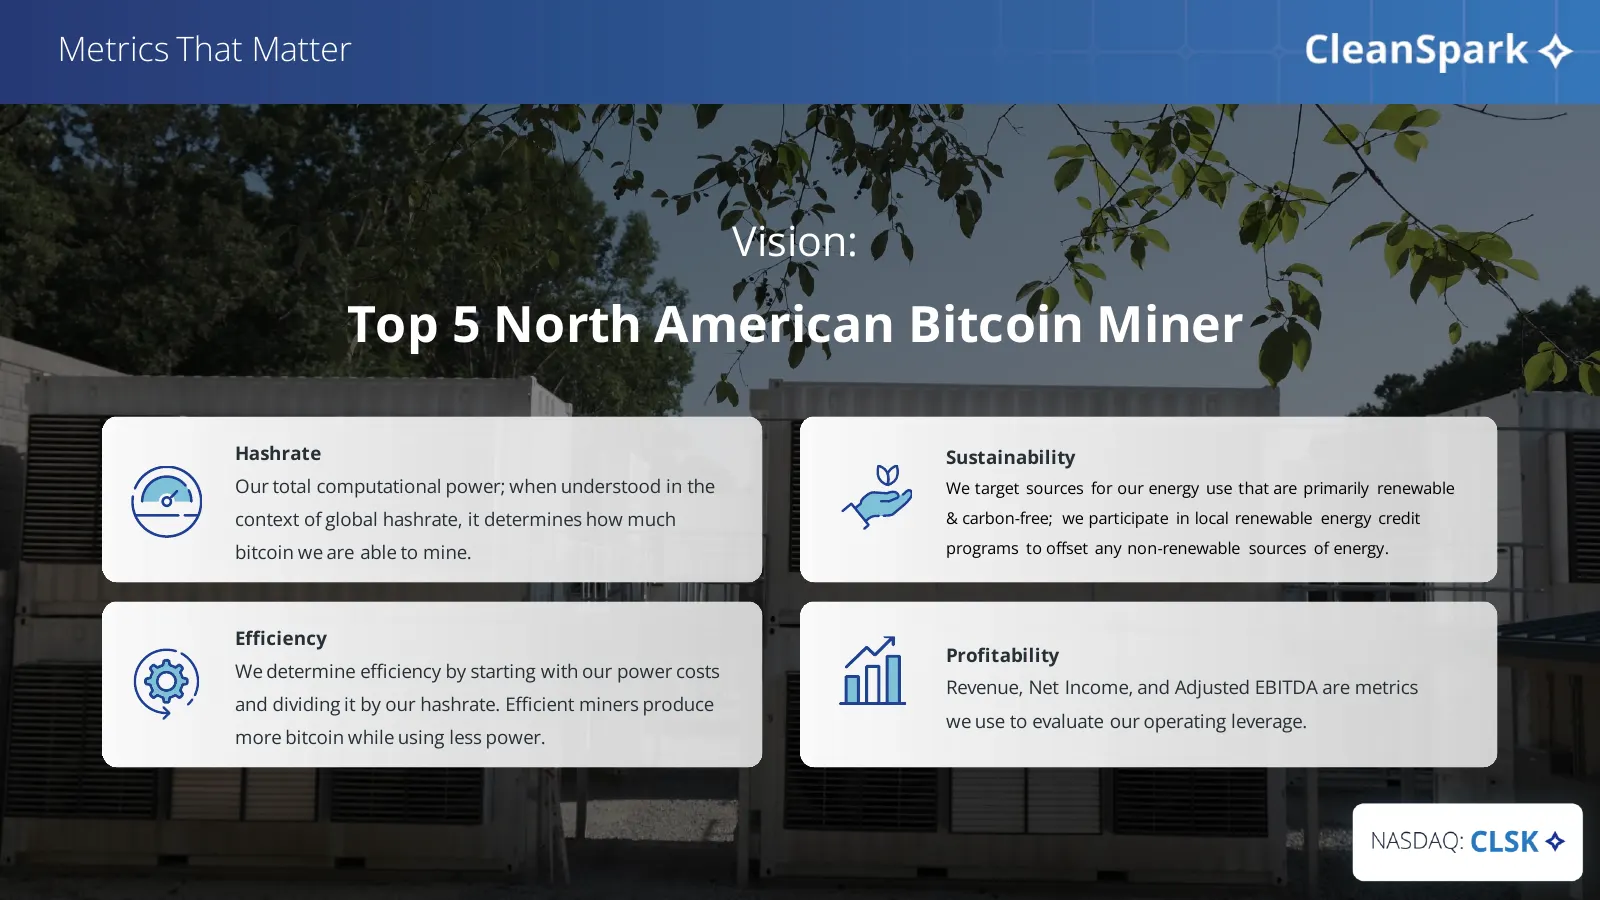
Metrics That Matter Vision: Top 5 North American Bitcoin Miner Hashrate Sustainability Our total computational power; when understood in the We target sources for our energy use that are primarily renewable context of global hashrate, it determines how much & carbon-free; we participate in local ren
Slide 7: Key Indicators
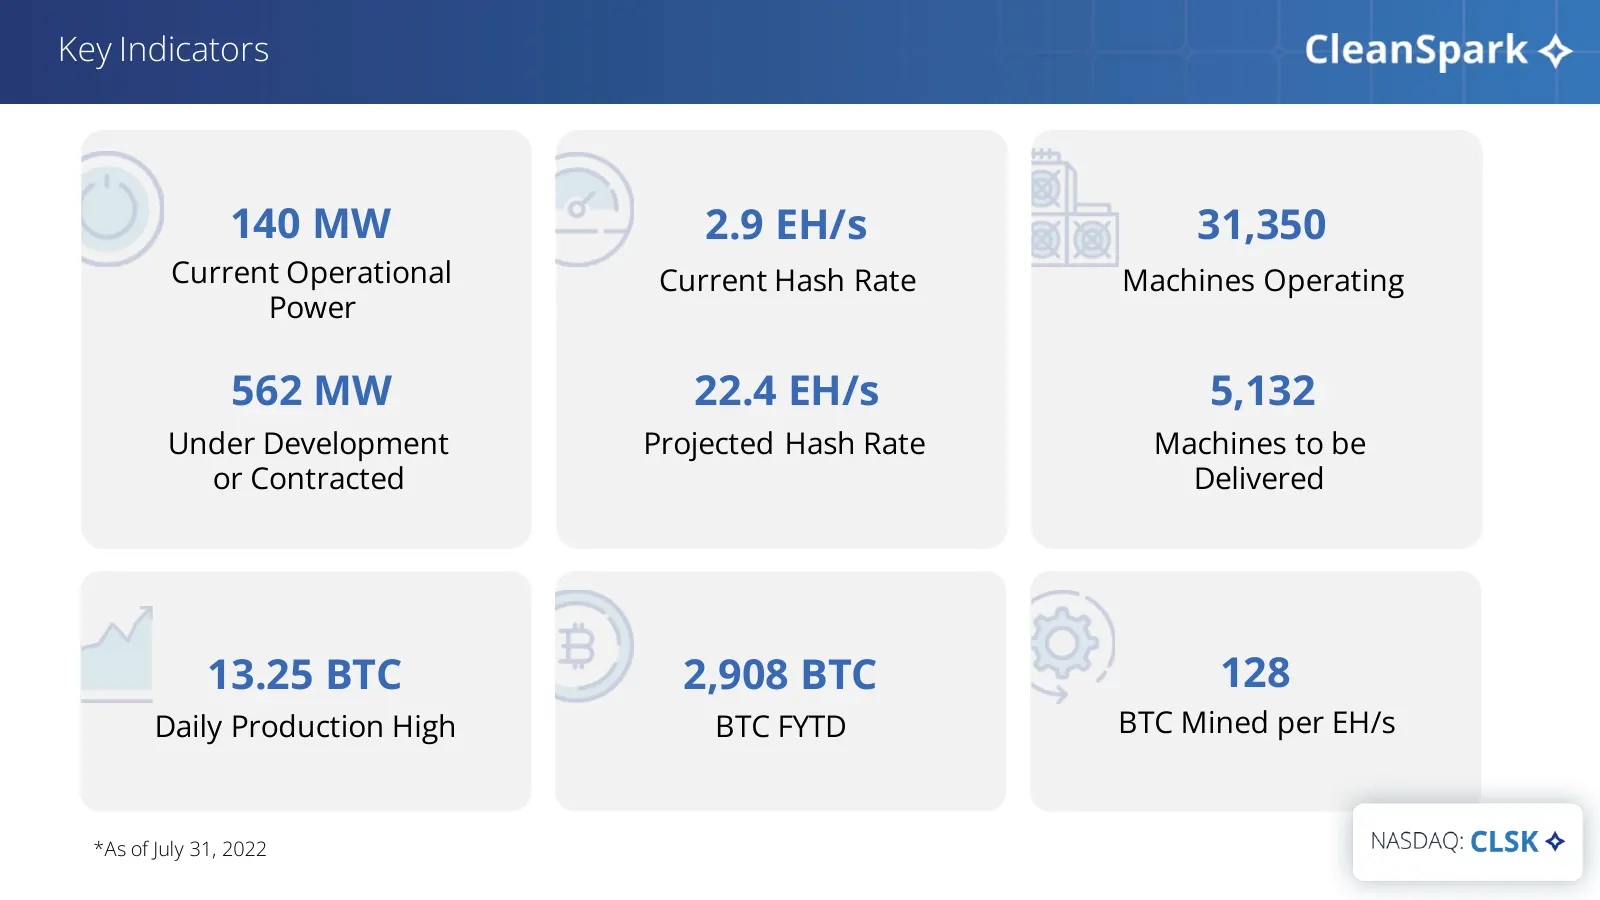
Key Indicators 140 MW 2.9 EH/s 31,350 Current Operational Current Hash Rate Machines Operating Power 562 MW 22.4 EH/s 5,132 Under Development Projected Hash Rate Machines to be or Contracted Delivered 13.25 BTC 2,908 BTC 128 Daily Production High BTC FYTD BTC Mined per EH/s *As of July 31, 2022
Slide 8: What Makes CleanSpark Different?
What Makes CleanSpark Different? Leave the world better than we found it. Build the infrastructure of the future. Value growth for the greater good.
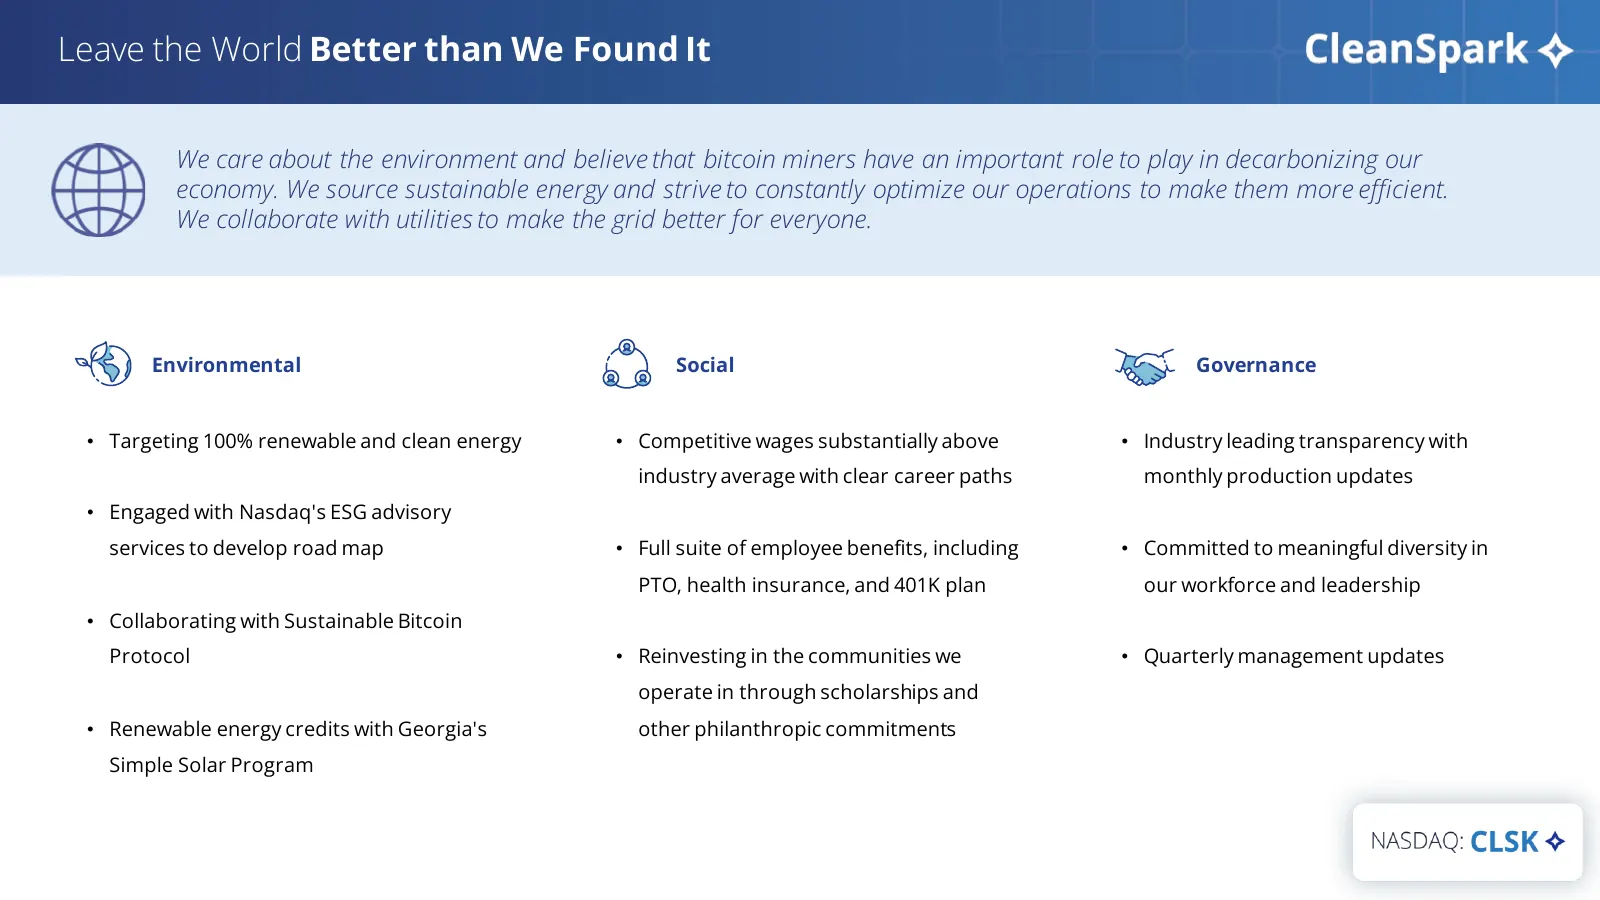
Slide 9: Leave the World Better than We Found It
Leave the World Better than We Found It We care about the environment and believe that bitcoin miners have an important role to play in decarbonizing our economy. We source sustainable energy and strive to constantly optimize our operations to make them more efficient. We collaborate with utilities
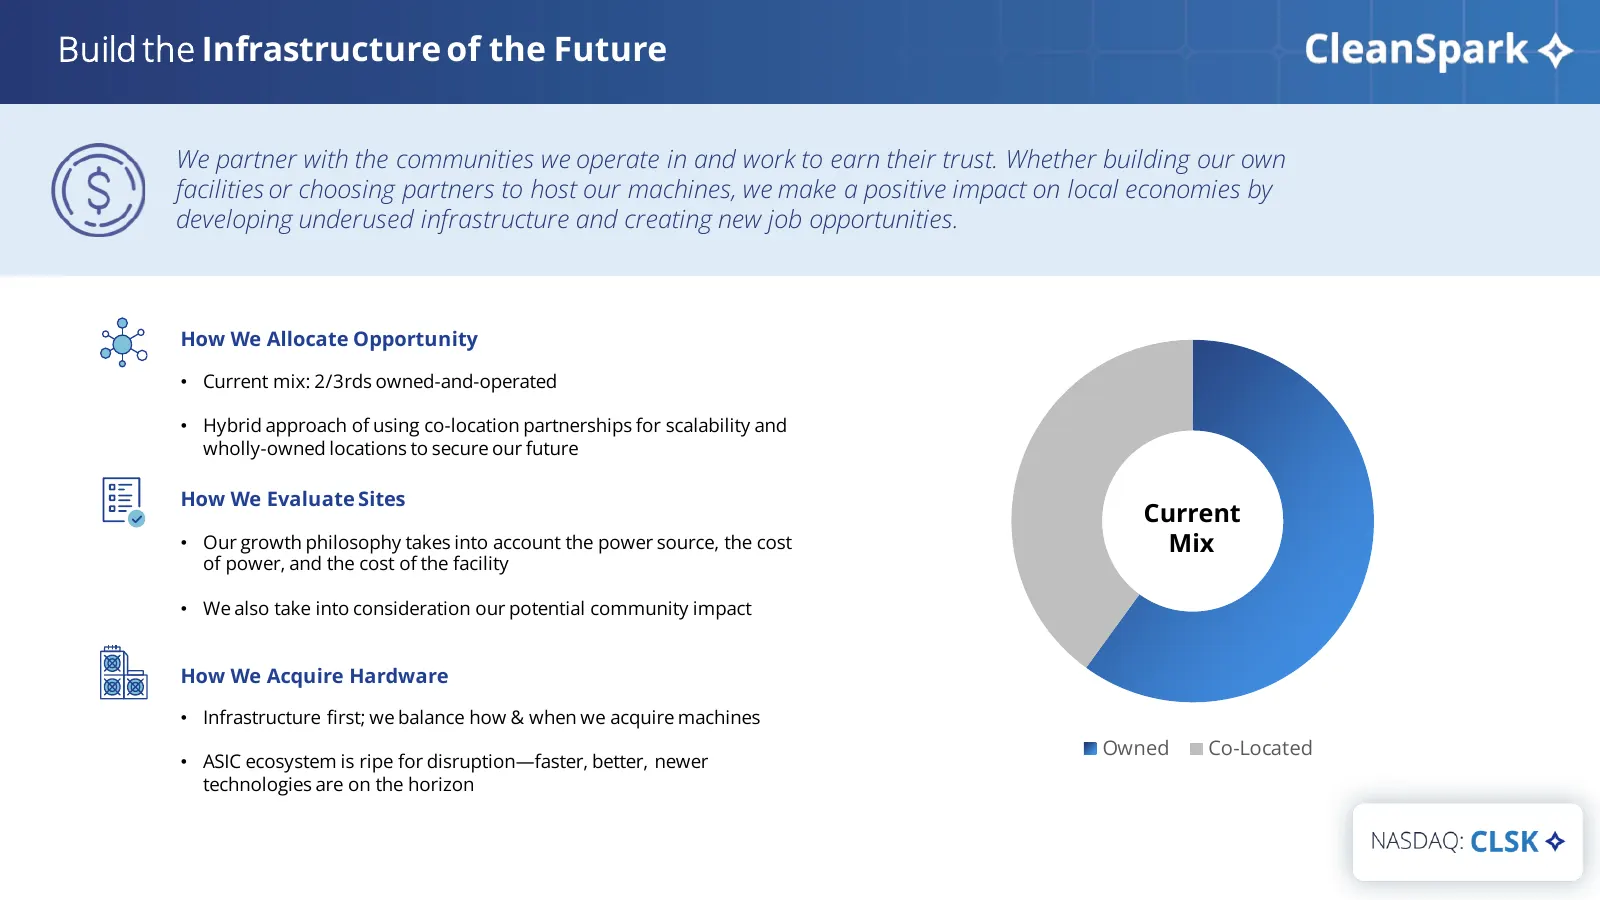
Slide 10: Build the Infrastructure of the Future
Build the Infrastructure of the Future We partner with the communities we operate in and work to earn their trust. Whether building our own facilities or choosing partners to host our machines, we make a positive impact on local economies by developing underused infrastructure and creating new job o
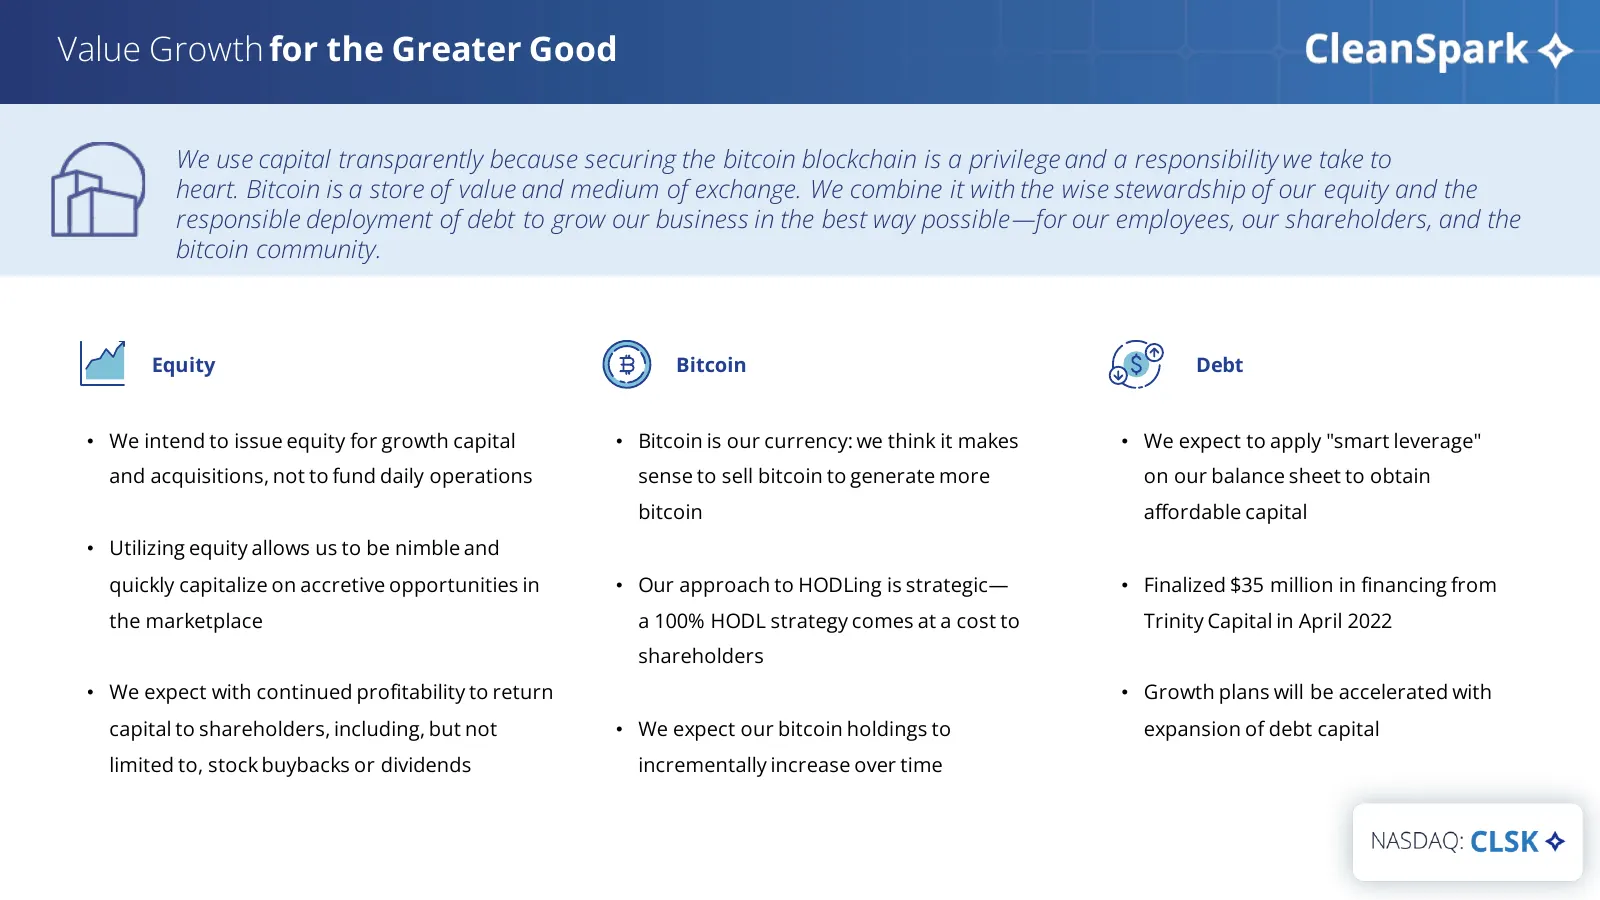
Slide 11: Value Growth for the Greater Good
Value Growth for the Greater Good We use capital transparently because securing the bitcoin blockchain is a privilege and a responsibility we take to heart. Bitcoin is a store of value and medium of exchange. We combine it with the wise stewardship of our equity and the responsible deployment of deb
Slide 12: Current and Future Performance
Current and Future Performance
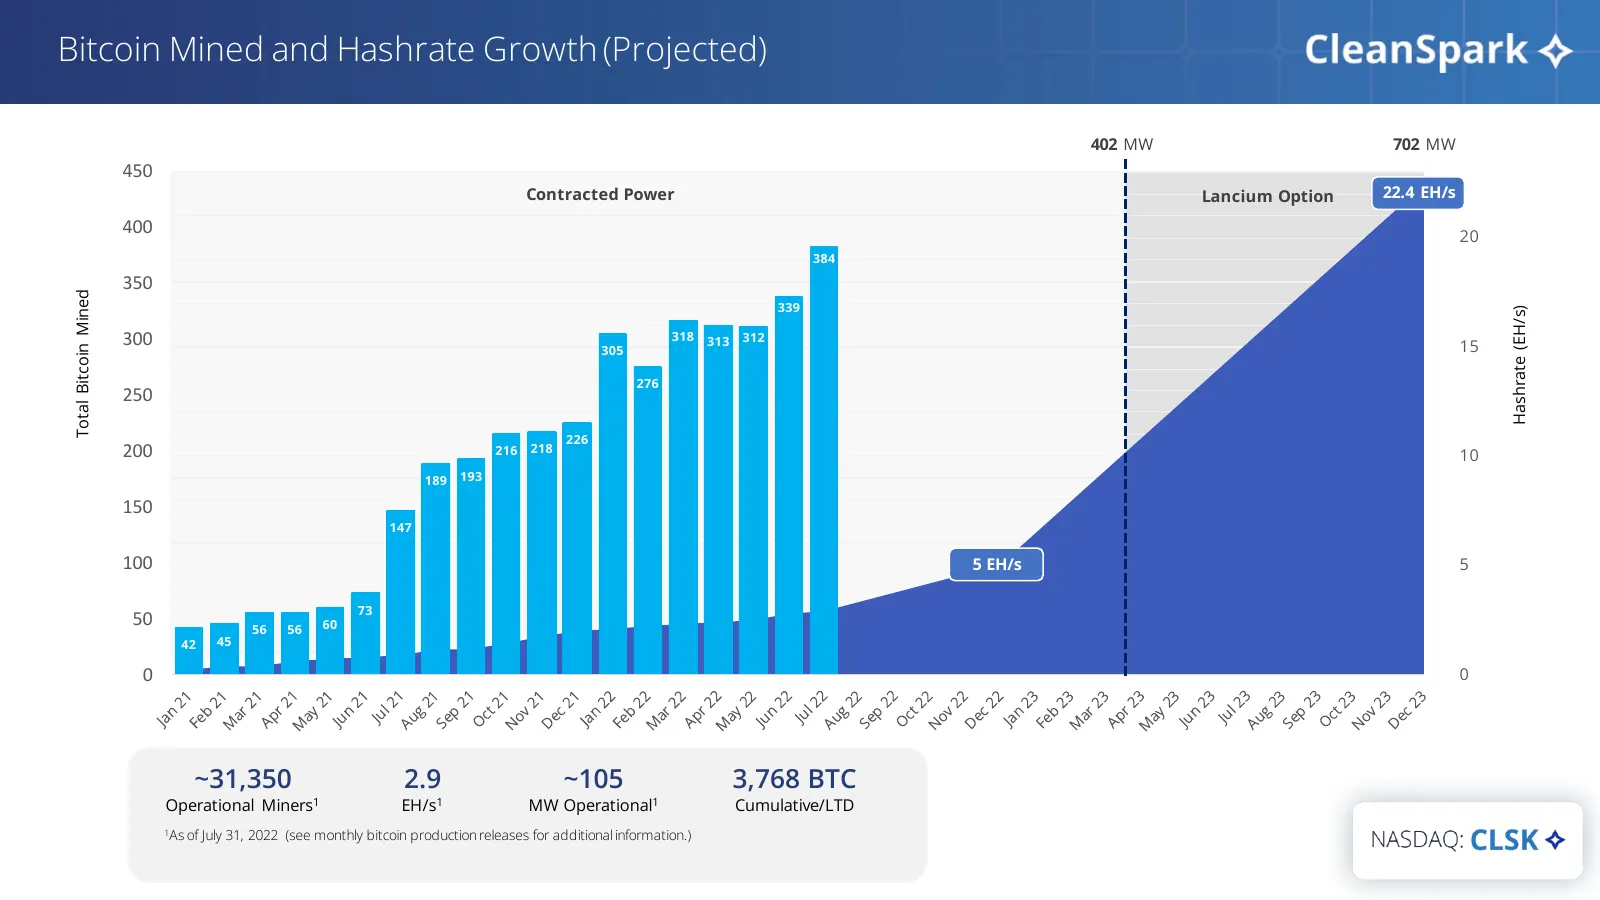
Slide 13: Bitcoin Mined and Hashrate Growth (Projected)
Bitcoin Mined and Hashrate Growth (Projected) 402 MW 702 MW 450 Contracted Power Lancium Option 22.4 EH/s 400 20 384 350 Total Bitcoin Mined 339 Hashrate (EH/s) 300 318 313 312 305 15 276 250 226 200 216 218 10 189 193 150 147 100 5 EH/s 5 73 50 56 56 60 42 45 0 0 ~31,350 2.9 ~105 3,768 BTC Operatio
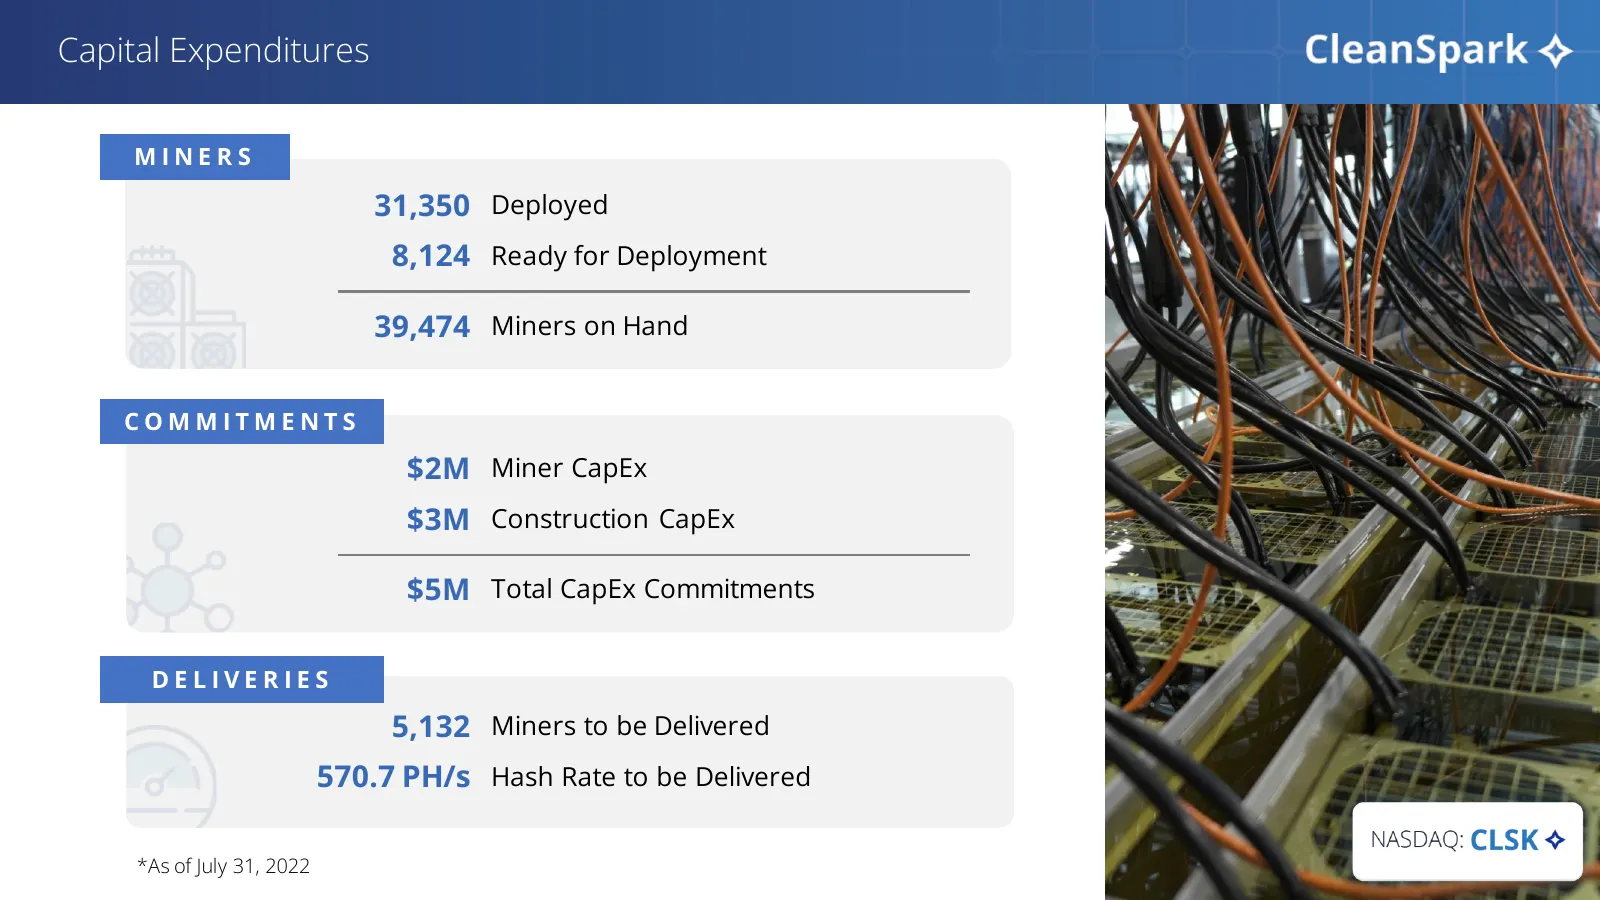
Slide 14: Capital Expenditures
Capital Expenditures MINERS 31,350 Deployed 8,124 Ready for Deployment 39,474 Miners on Hand COMMITMENTS $2M Miner CapEx $3M Construction CapEx $5M Total CapEx Commitments DELIVERIES 5,132 Miners to be Delivered 570.7 PH/s Hash Rate to be Delivered *As of July 31, 2022
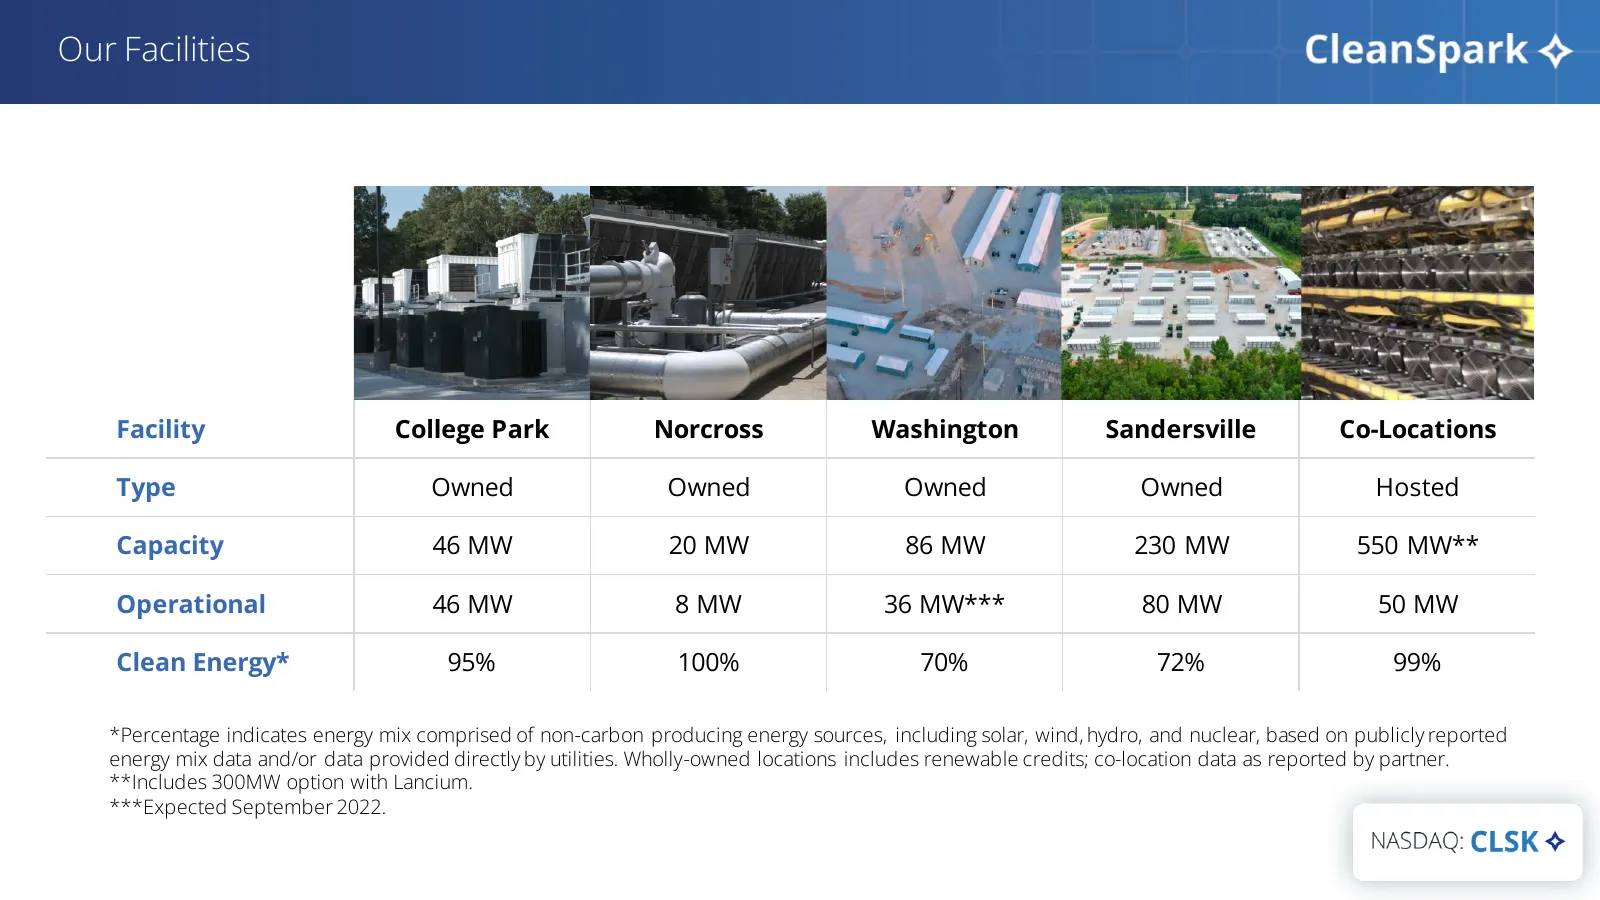
Slide 15: Our Facilities
Our Facilities Facility College Park Norcross Washington Sandersville Co-Locations Type Owned Owned Owned Owned Hosted Capacity 46 MW 20 MW 86 MW 230 MW 550 MW** Operational 46 MW 8 MW 36 MW*** 80 MW 50 MW Clean Energy* 95% 100% 70% 72% 99% *Percentage indicates energy mix comprised of non-carbon pr
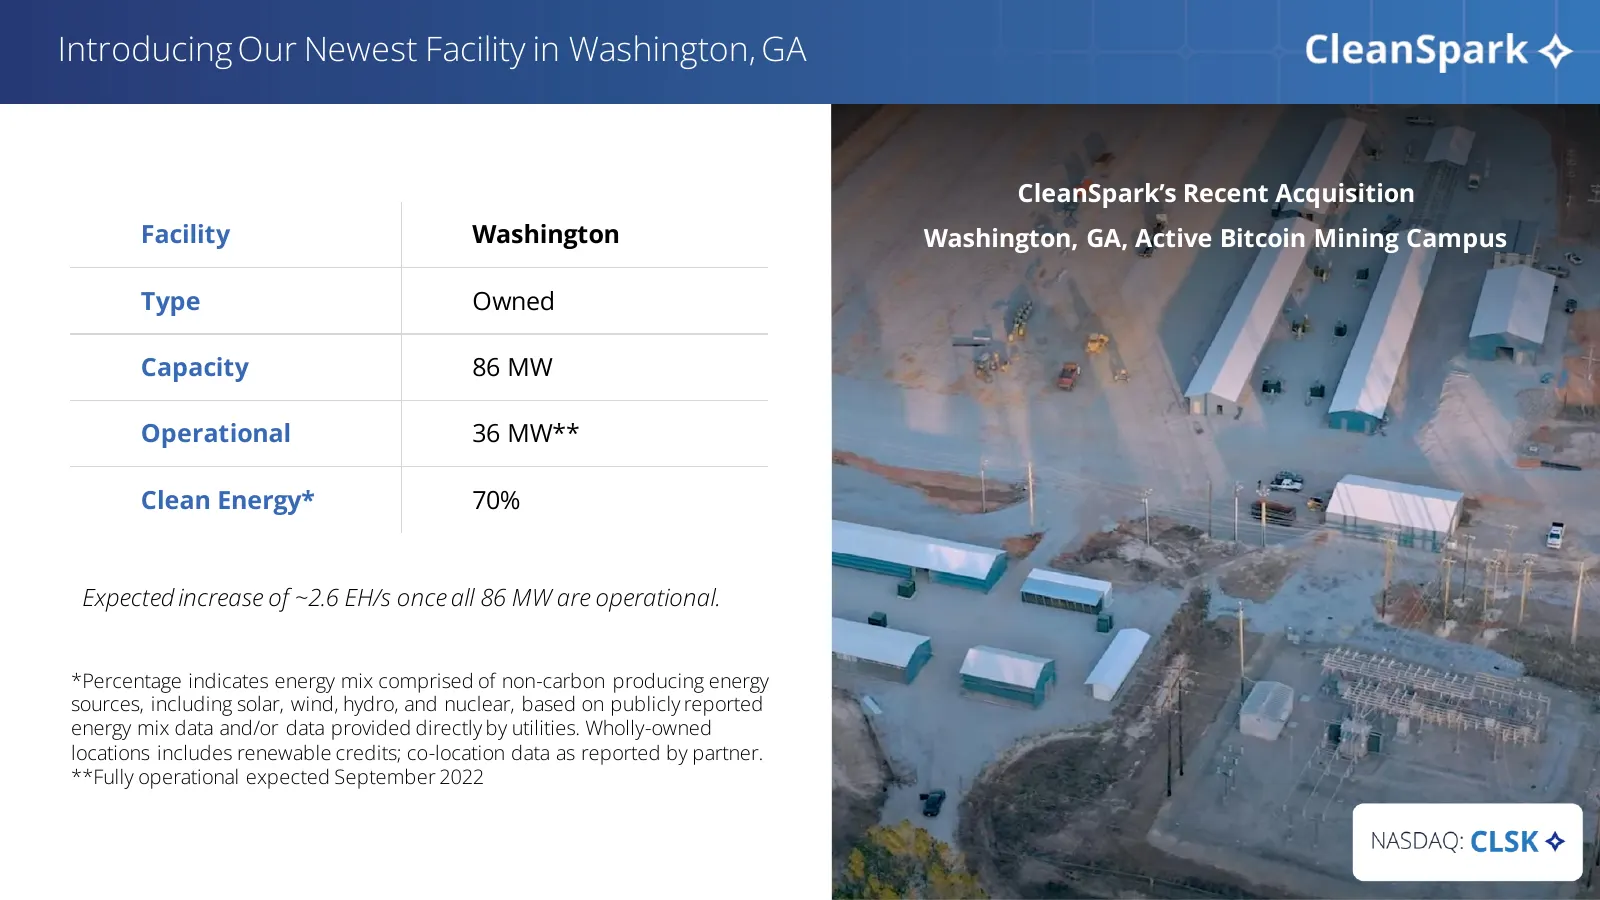
Slide 16: Introducing Our Newest Facility in Washington, GA
Introducing Our Newest Facility in Washington, GA CleanSpark’s Recent Acquisition Facility Washington Washington, GA, Active Bitcoin Mining Campus Type Owned Capacity 86 MW Operational 36 MW** Clean Energy* 70% Expected increase of ~2.6 EH/s once all 86 MW are operational. *Percentage indicates ener
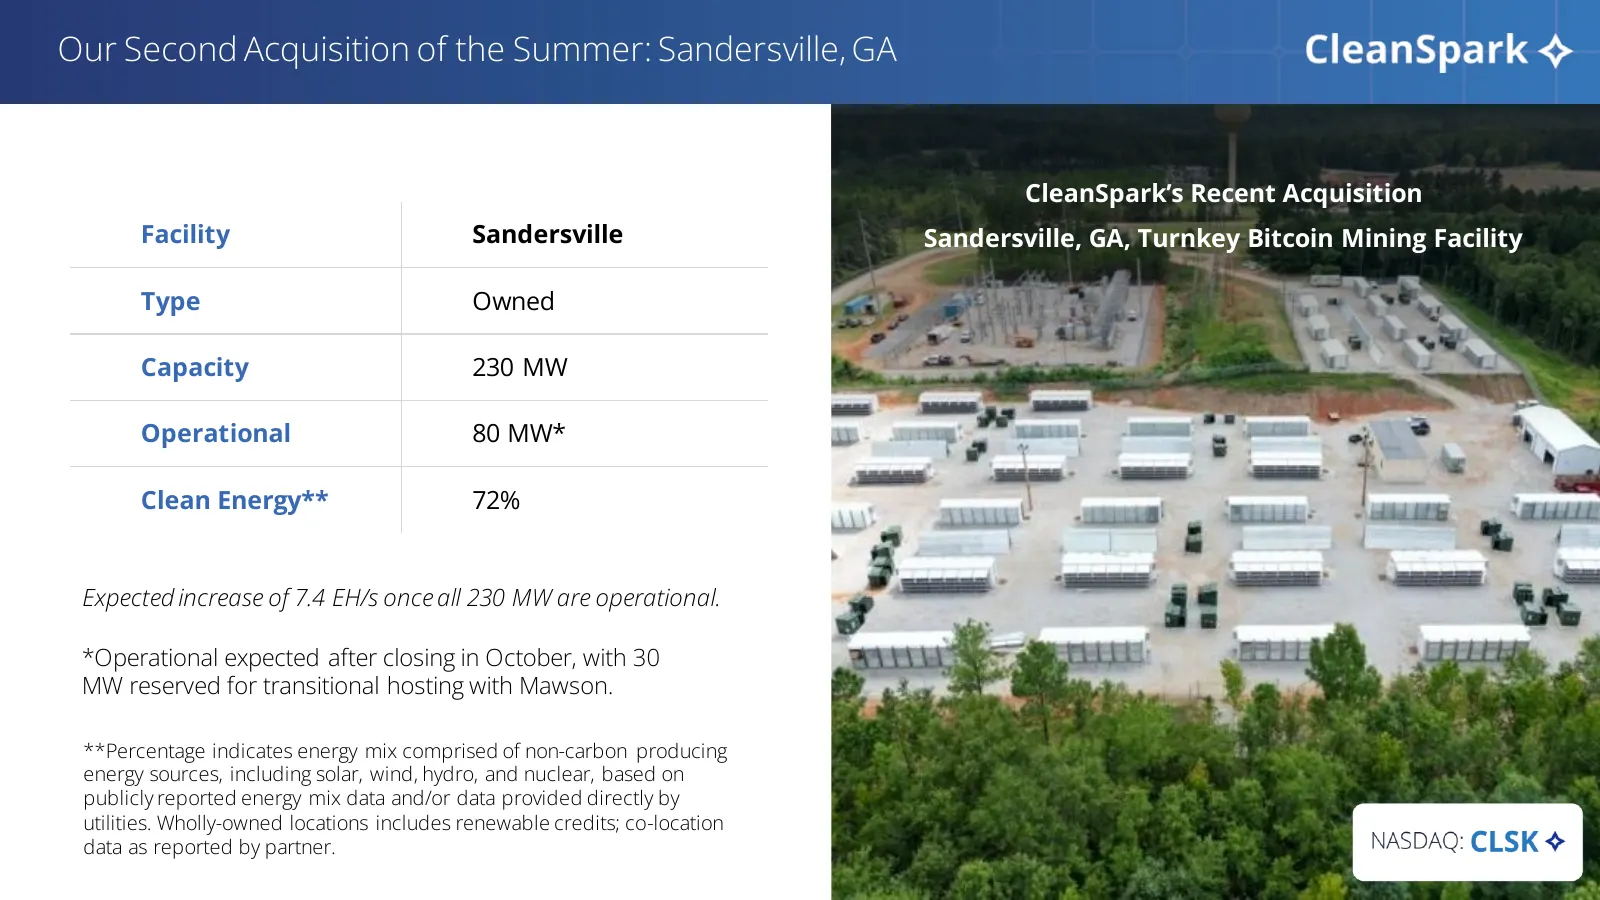
Slide 17: Our Second Acquisition of the Summer: Sandersville, GA
Our Second Acquisition of the Summer: Sandersville, GA CleanSpark’s Recent Acquisition Facility Sandersville Sandersville, GA, Turnkey Bitcoin Mining Facility Type Owned Capacity 230 MW Operational 80 MW* Clean Energy** 72% Expected increase of 7.4 EH/s once all 230 MW are operational. *Operational
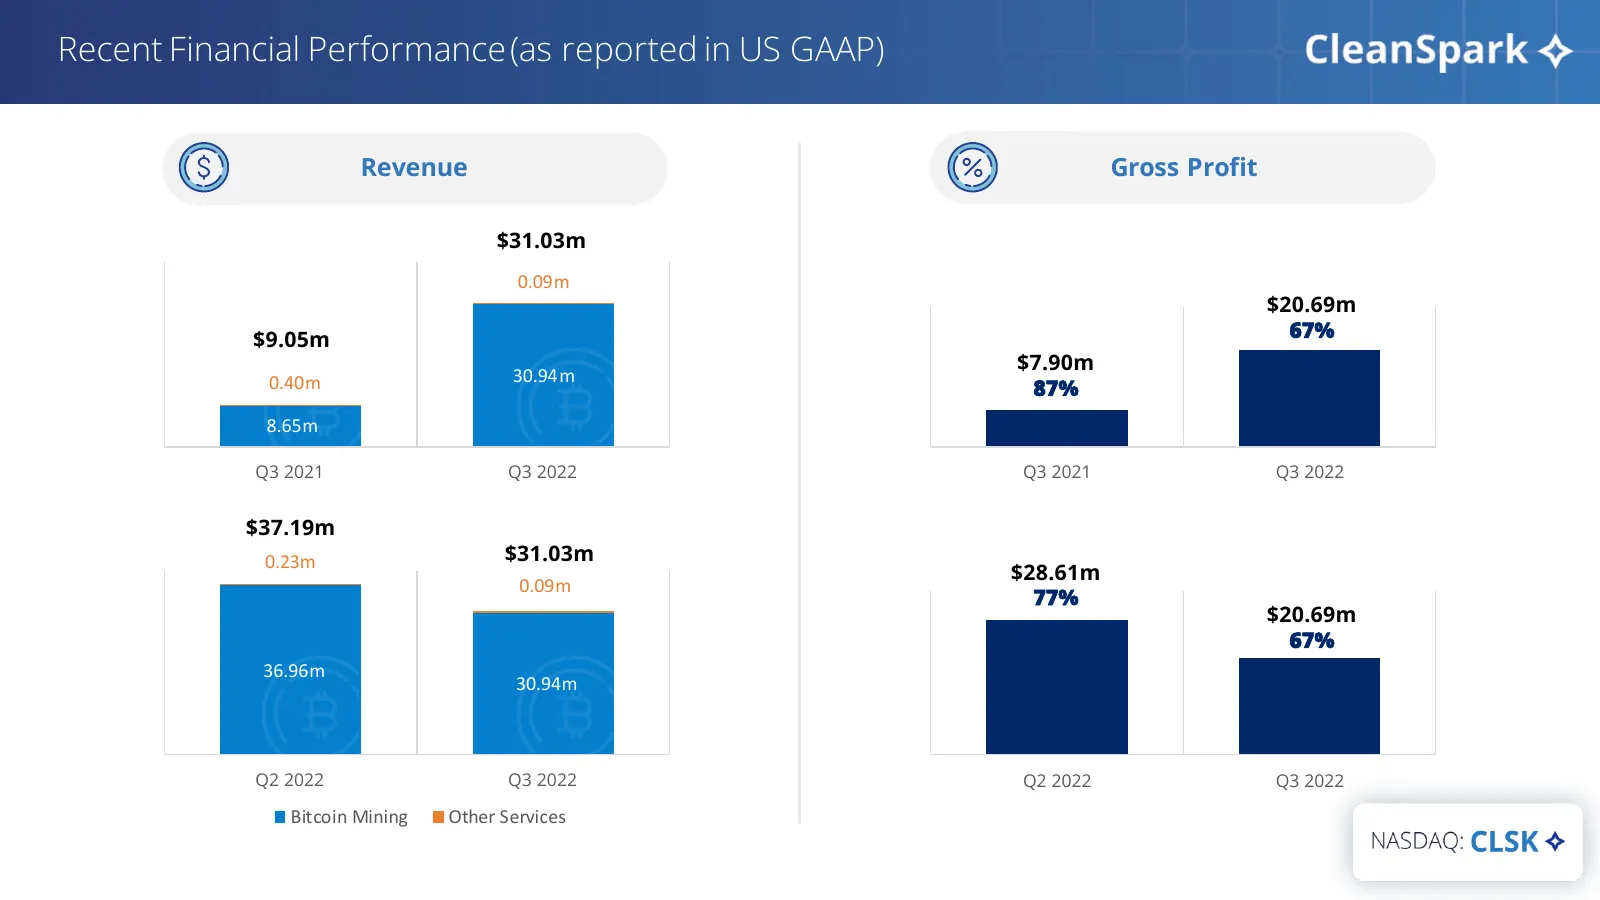
Slide 18: Recent Financial Performance (as reported in US GAAP)
Recent Financial Performance (as reported in US GAAP) Revenue Gross Profit $31.03m 0.09 m $20.69m $9.05m 67% $7.90m 30.94 m 0.40 m 87% 8.65m Q3 2021 Q3 2022 Q3 2021 Q3 2022 $37.19m 0.23m $31.03m $28.61m 0.09 m 77% $20.69m 67% 36.96 m 30.94m Q2 2022 Q3 2022 Q2 2022 Q3 2022 Bitcoin Mining Other Servic
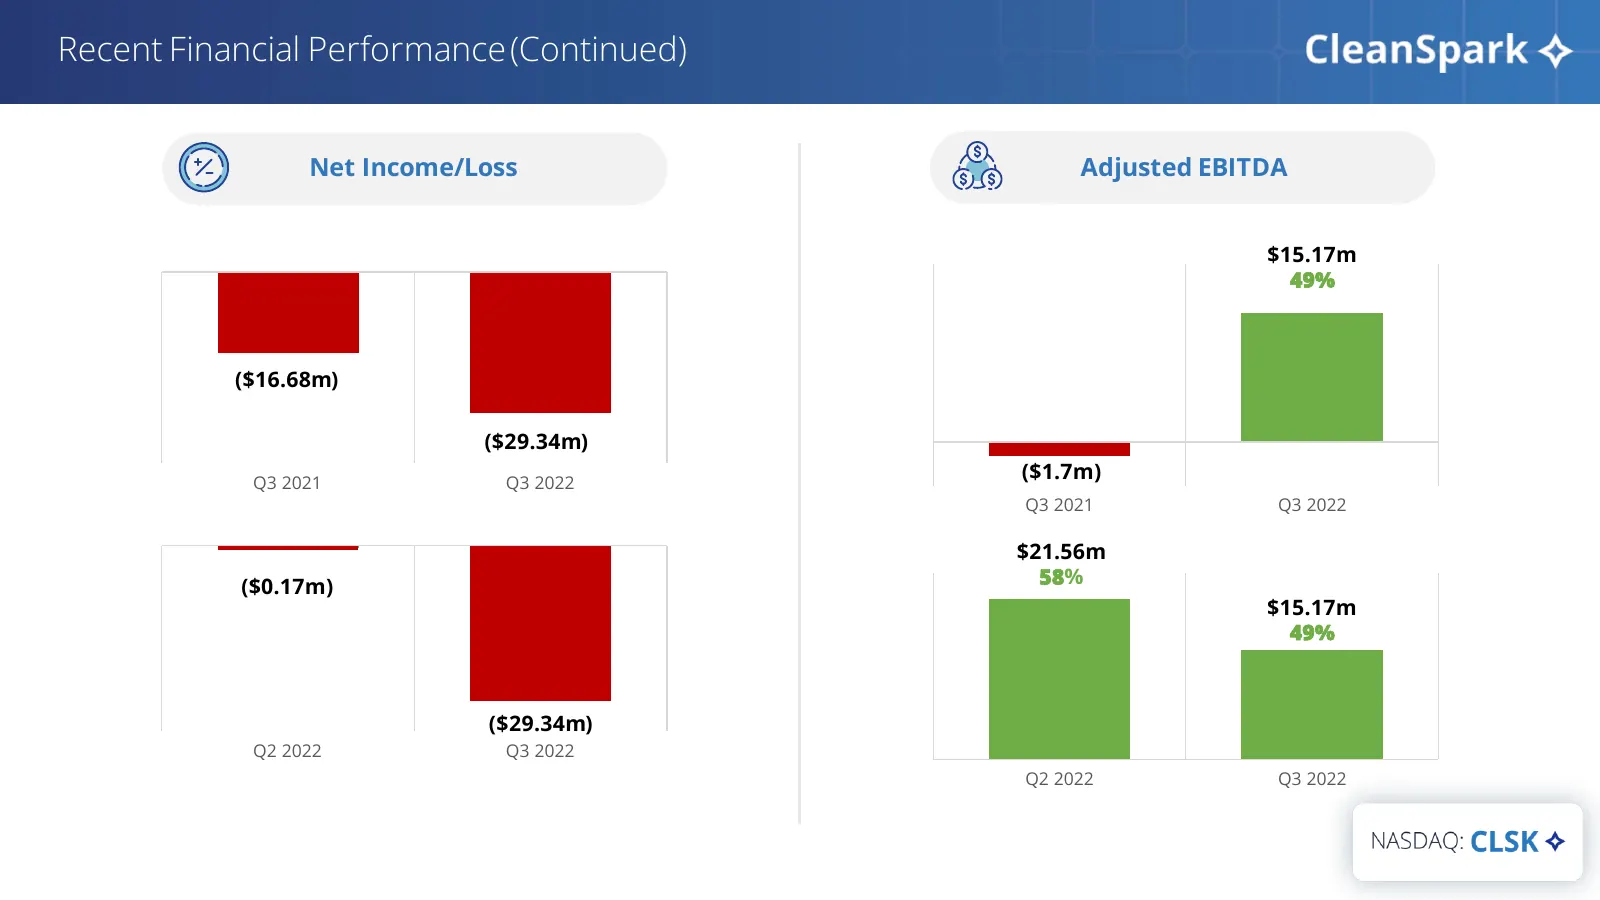
Slide 19: Recent Financial Performance (Continued)
Recent Financial Performance (Continued) Net Income/Loss Adjusted EBITDA $15.17m 49% ($16.68m) ($29.34m) Q3 2021 Q3 2022 ($1.7m) Q3 2021 Q3 2022 $21.56m ($0.17m) 58% $15.17m 49% ($29.34m) Q2 2022 Q3 2022 Q2 2022 Q3 2022 NASDAQ: CLSK
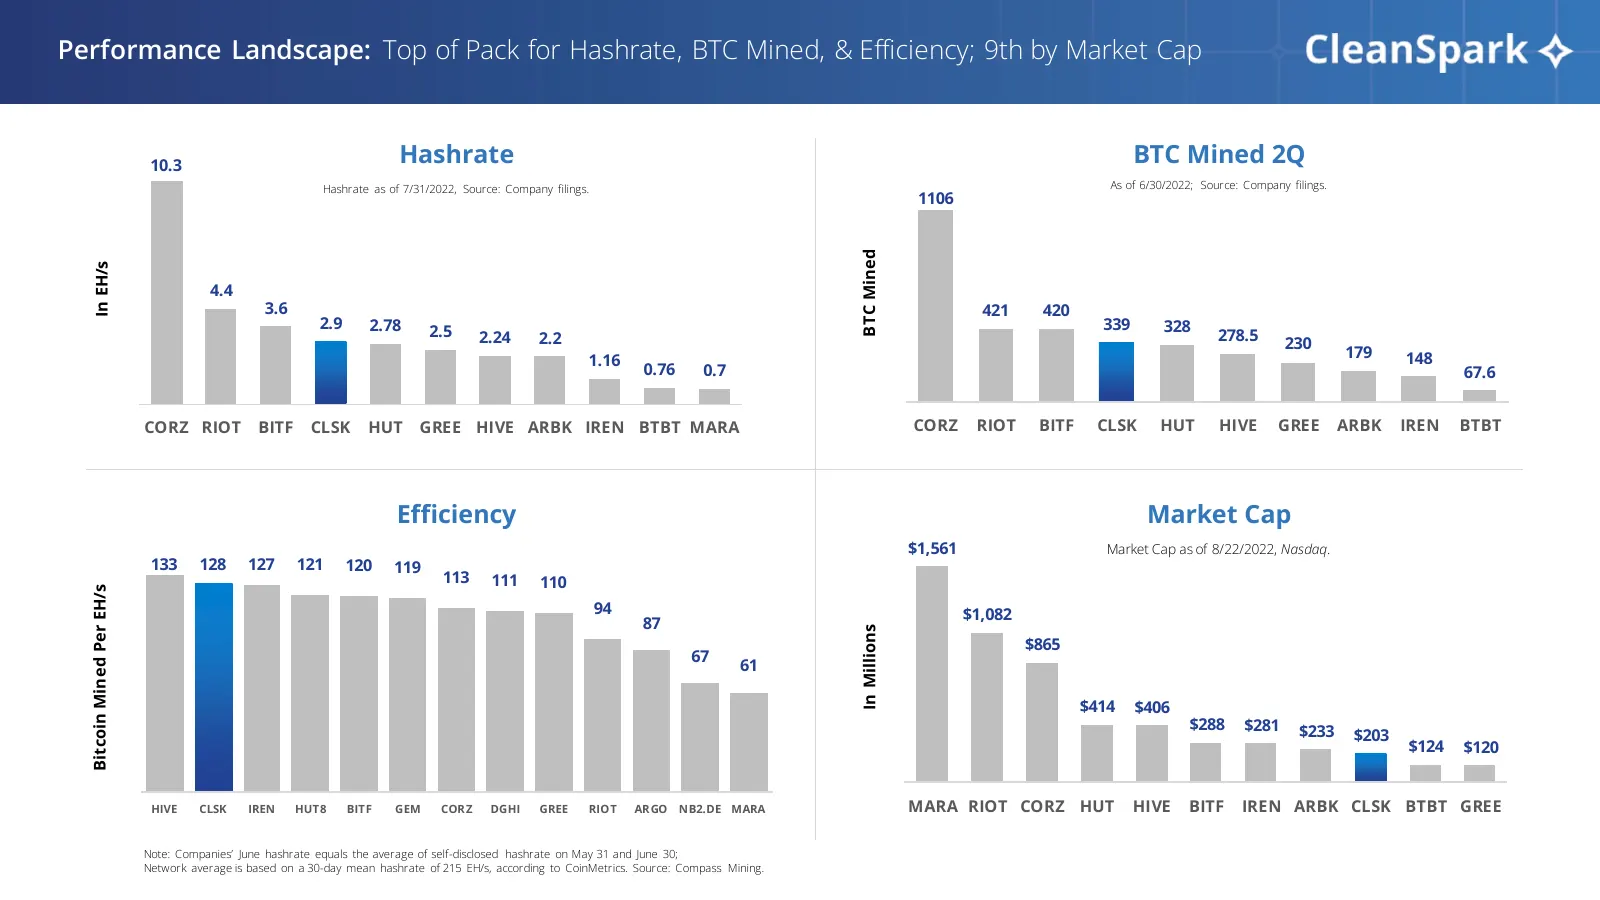
Slide 20: Performance Landscape: Top of Pack for Hashrate, BTC Mined, & Efficiency
Performance Landscape: Top of Pack for Hashrate, BTC Mined, & Efficiency; 9th by Market Cap 10.3 Hashrate BTC Mined 2Q Hashrate as of 7/31/2022, Source: Company filings. As of 6/30/2022; Source: Company filings. 1106 BTC Mined In EH/s 4.4 3.6 421 420 2.9 2.78 339 328 2.5 2.24 2.2 278.5 230 1.16 179
Slide 21: CleanSpark is a sustainable bitcoin miner
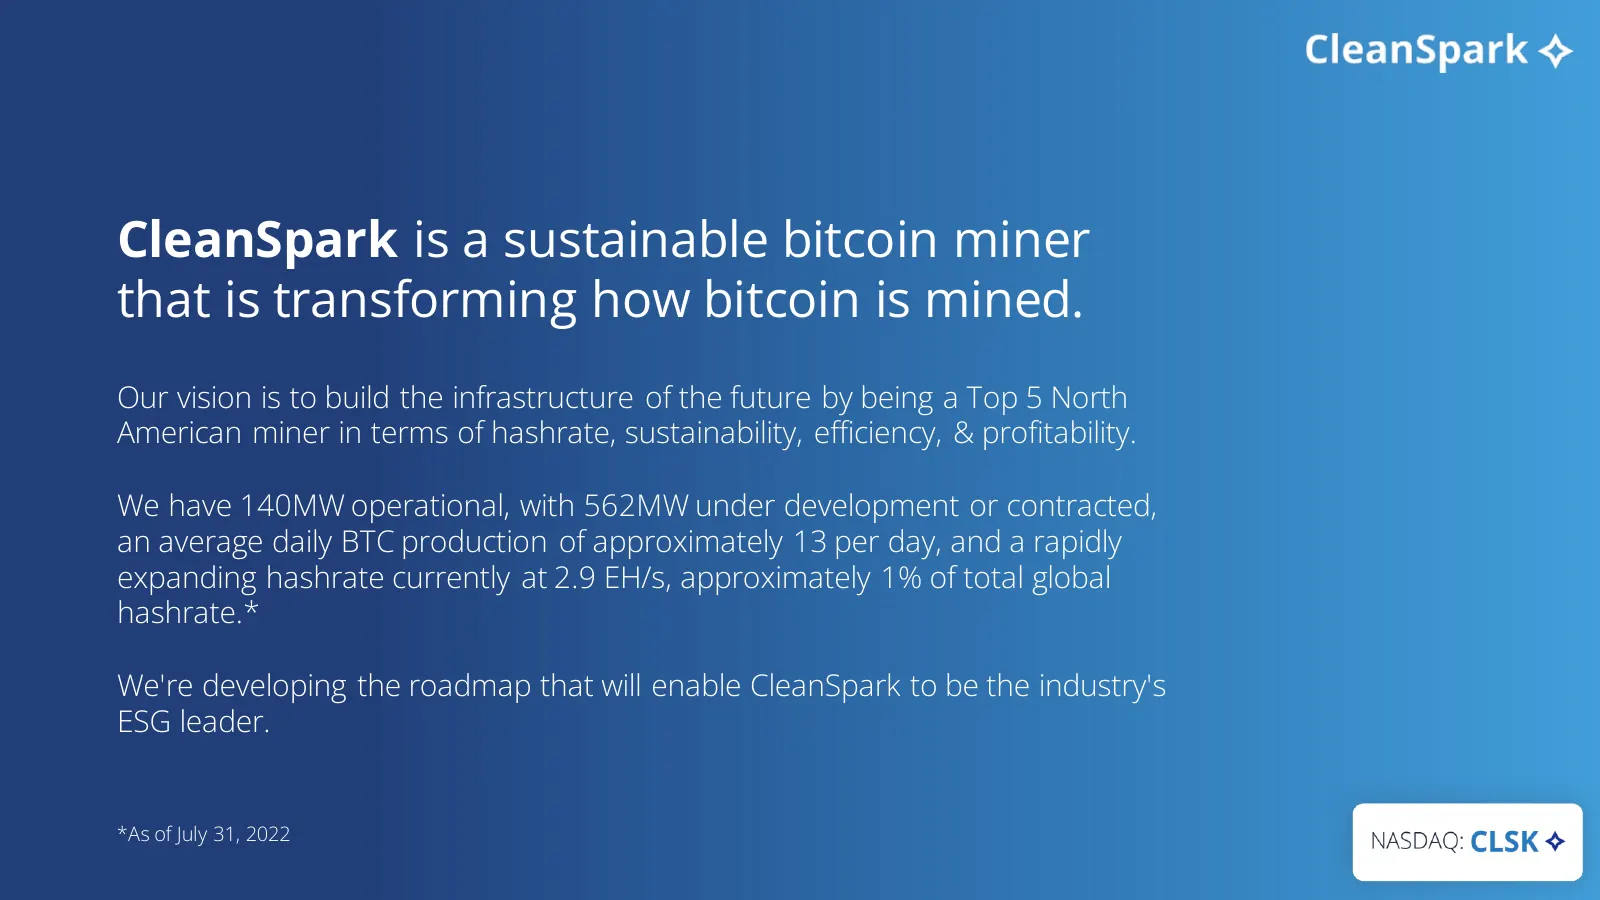
CleanSpark is a sustainable bitcoin miner that is transforming how bitcoin is mined. Our vision is to build the infrastructure of the future by being a Top 5 North American miner in terms of hashrate, sustainability, efficiency, & profitability. We have 140MW operational, with 562MW under developmen
Slide 22: Appendix
Appendix
Slide 23: Management Team
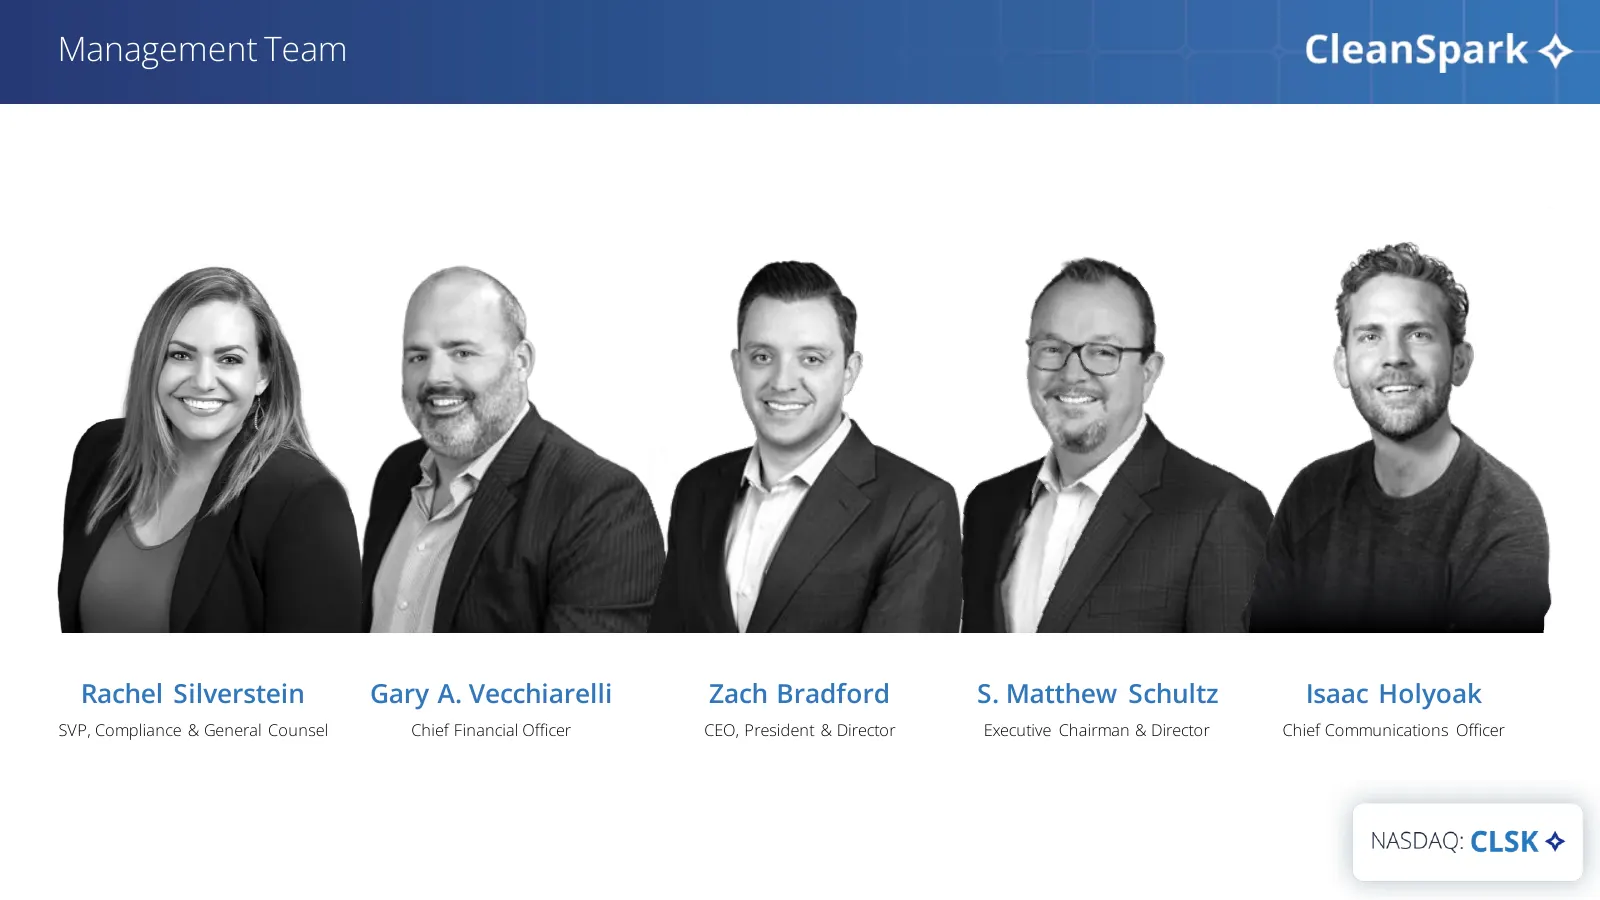
Management Team Rachel Silverstein Gary A. Vecchiarelli Zach Bradford S. Matthew Schultz Isaac Holyoak SVP, Compliance & General Counsel Chief Financial Officer CEO, President & Director Executive Chairman & Director Chief Communications Officer
Slide 24: Income Statement FY22
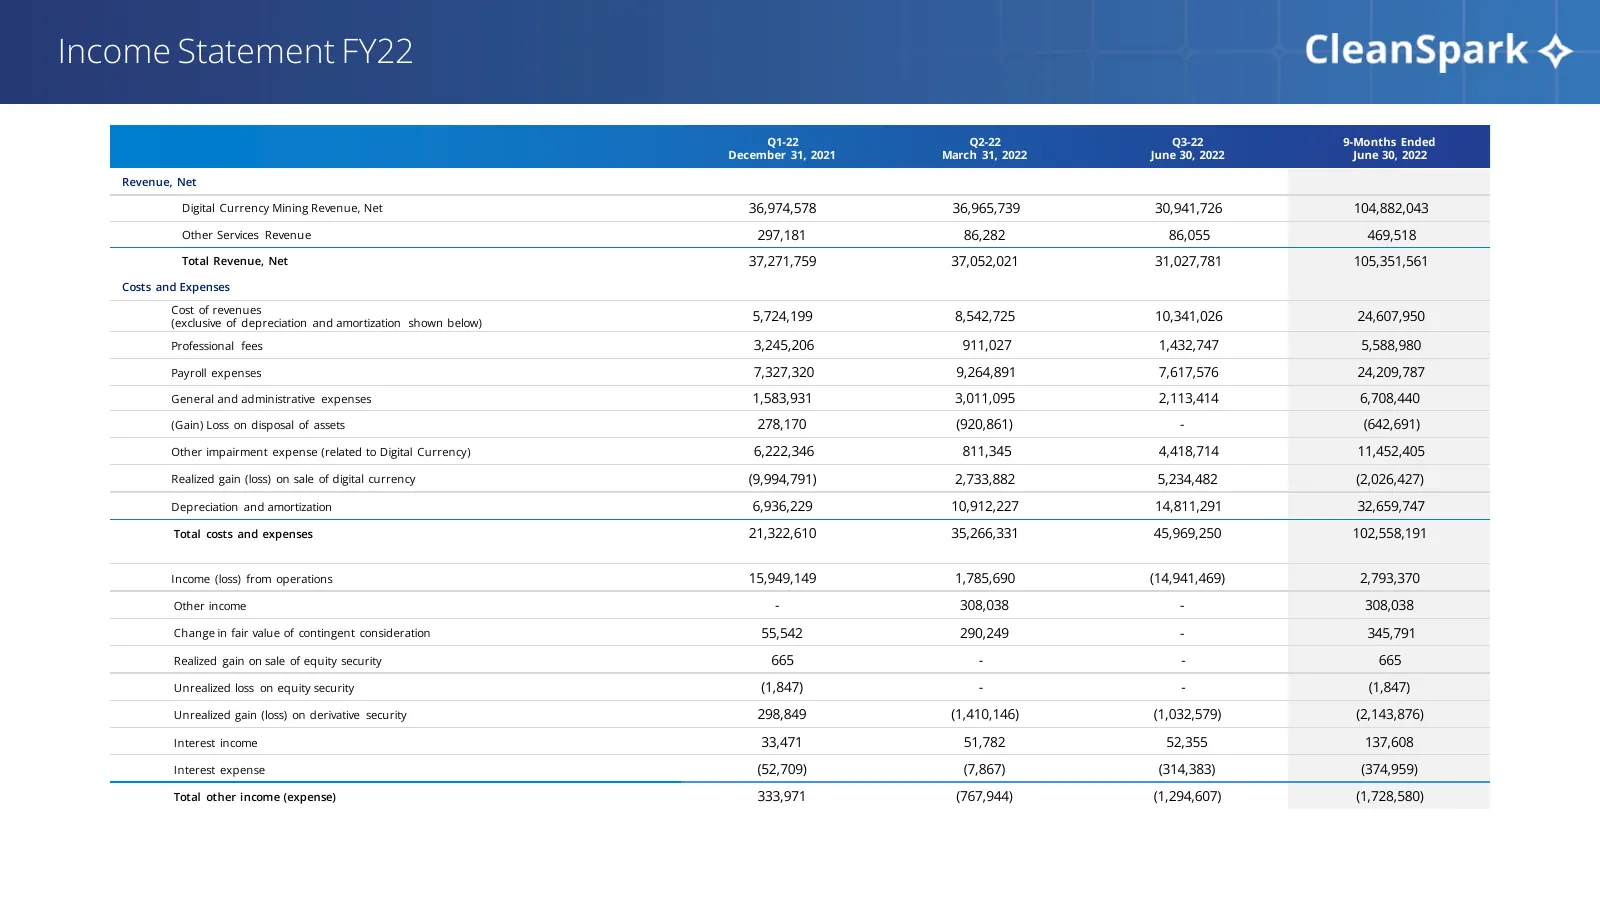
Income Statement FY22 Q1-22 Q2-22 Q3-22 9-Months Ended December 31, 2021 March 31, 2022 June 30, 2022 June 30, 2022 Revenue, Net Digital Currency Mining Revenue, Net 36,974,578 36,965,739 30,941,726 104,882,043 Other Services Revenue 297,181 86,282 86,055 469,518 Total Revenue, Net 37,271,759 37,052
Slide 25: Income Statement FY22 (cont’d)
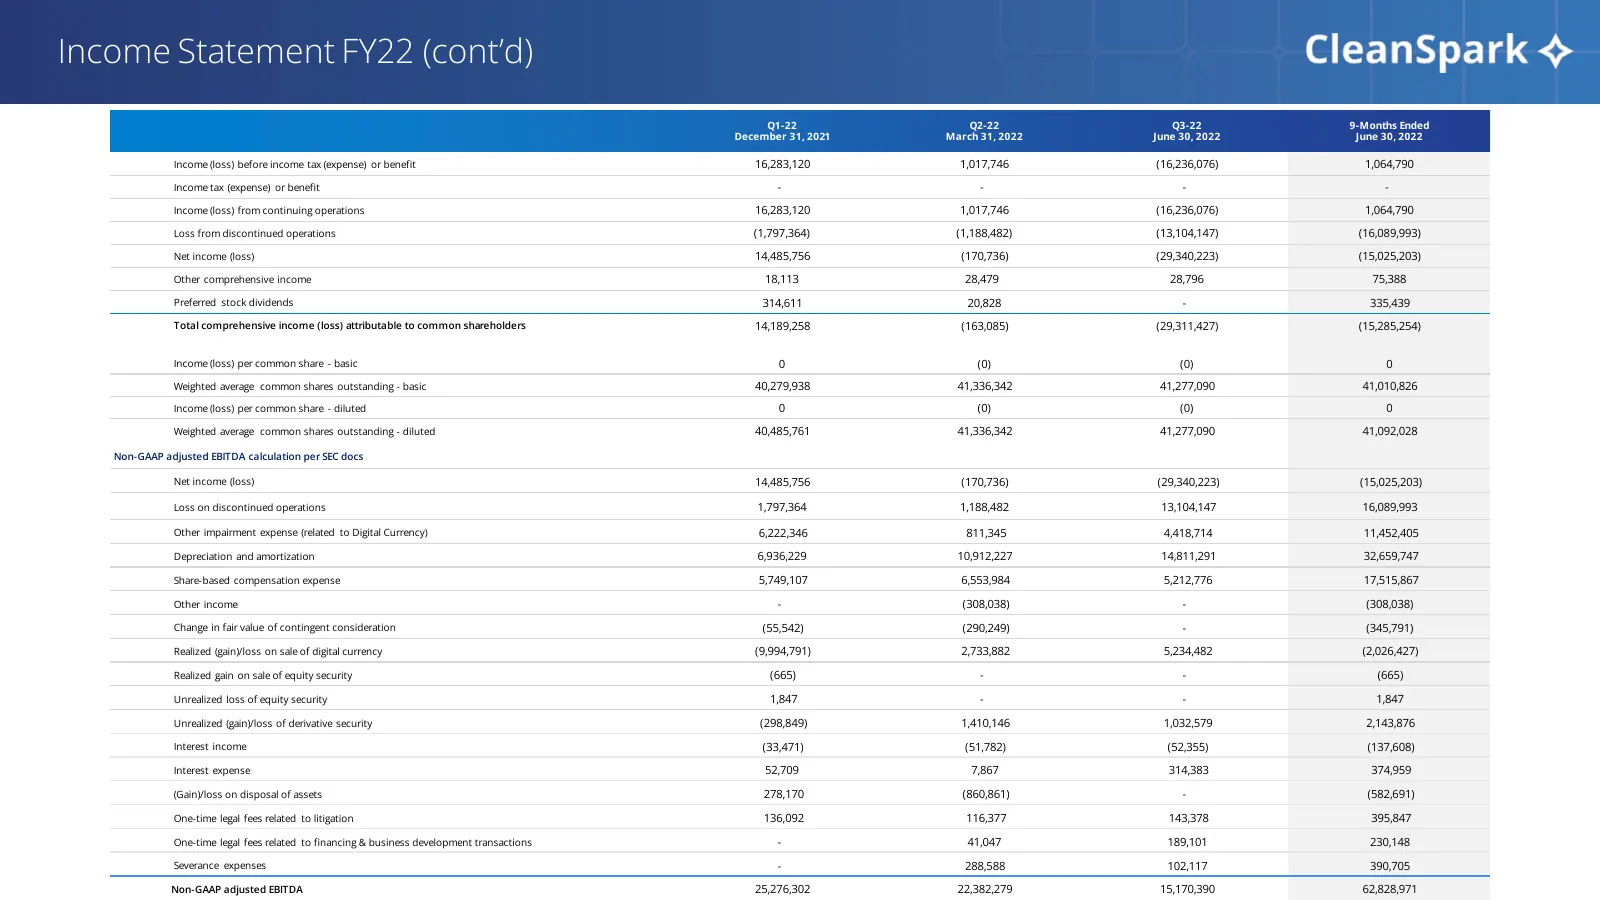
Income Statement FY22 (cont’d) Q1-22 Q2-22 Q3-22 9-Months Ended December 31, 2021 March 31, 2022 June 30, 2022 June 30, 2022 Income (loss) before income tax (expense) or benefit 16,283,120 1,017,746 (16,236,076) 1,064,790 Income tax (expense) or benefit - - - - Income (loss) from continuing operatio
Slide 26: Income Statement FY21
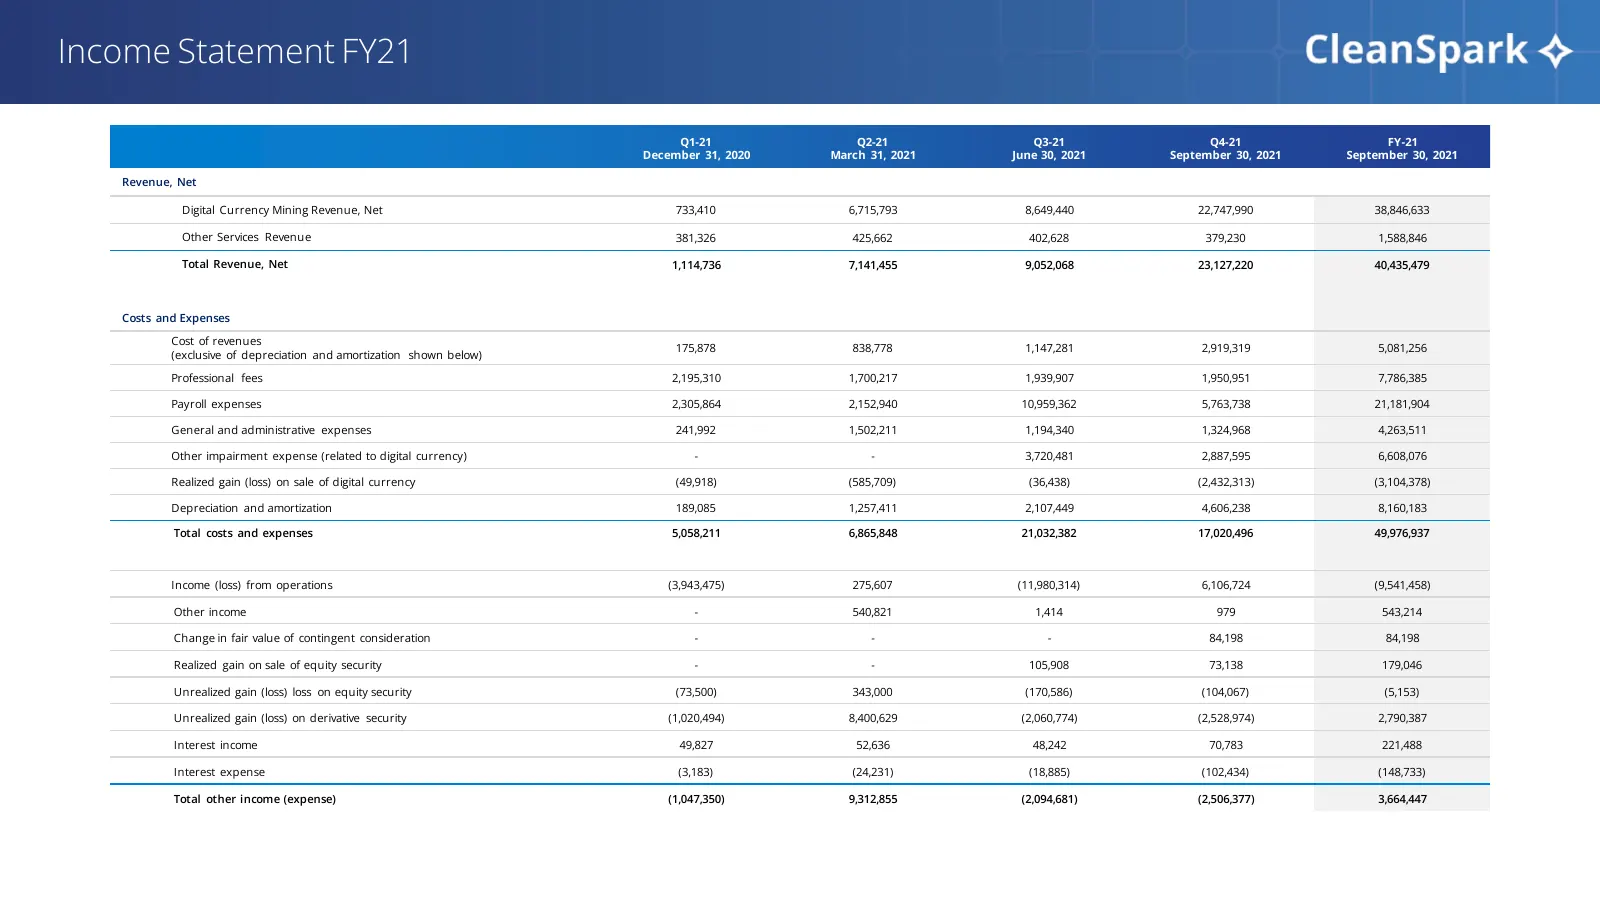
Income Statement FY21 Q1-21 Q2-21 Q3-21 Q4-21 FY-21 December 31, 2020 March 31, 2021 June 30, 2021 September 30, 2021 September 30, 2021 Revenue, Net Digital Currency Mining Revenue, Net 733,410 6,715,793 8,649,440 22,747,990 38,846,633 Other Services Revenue 381,326 425,662 402,628 379,230 1,588,84
Slide 27: Income Statement FY21 (cont’d)
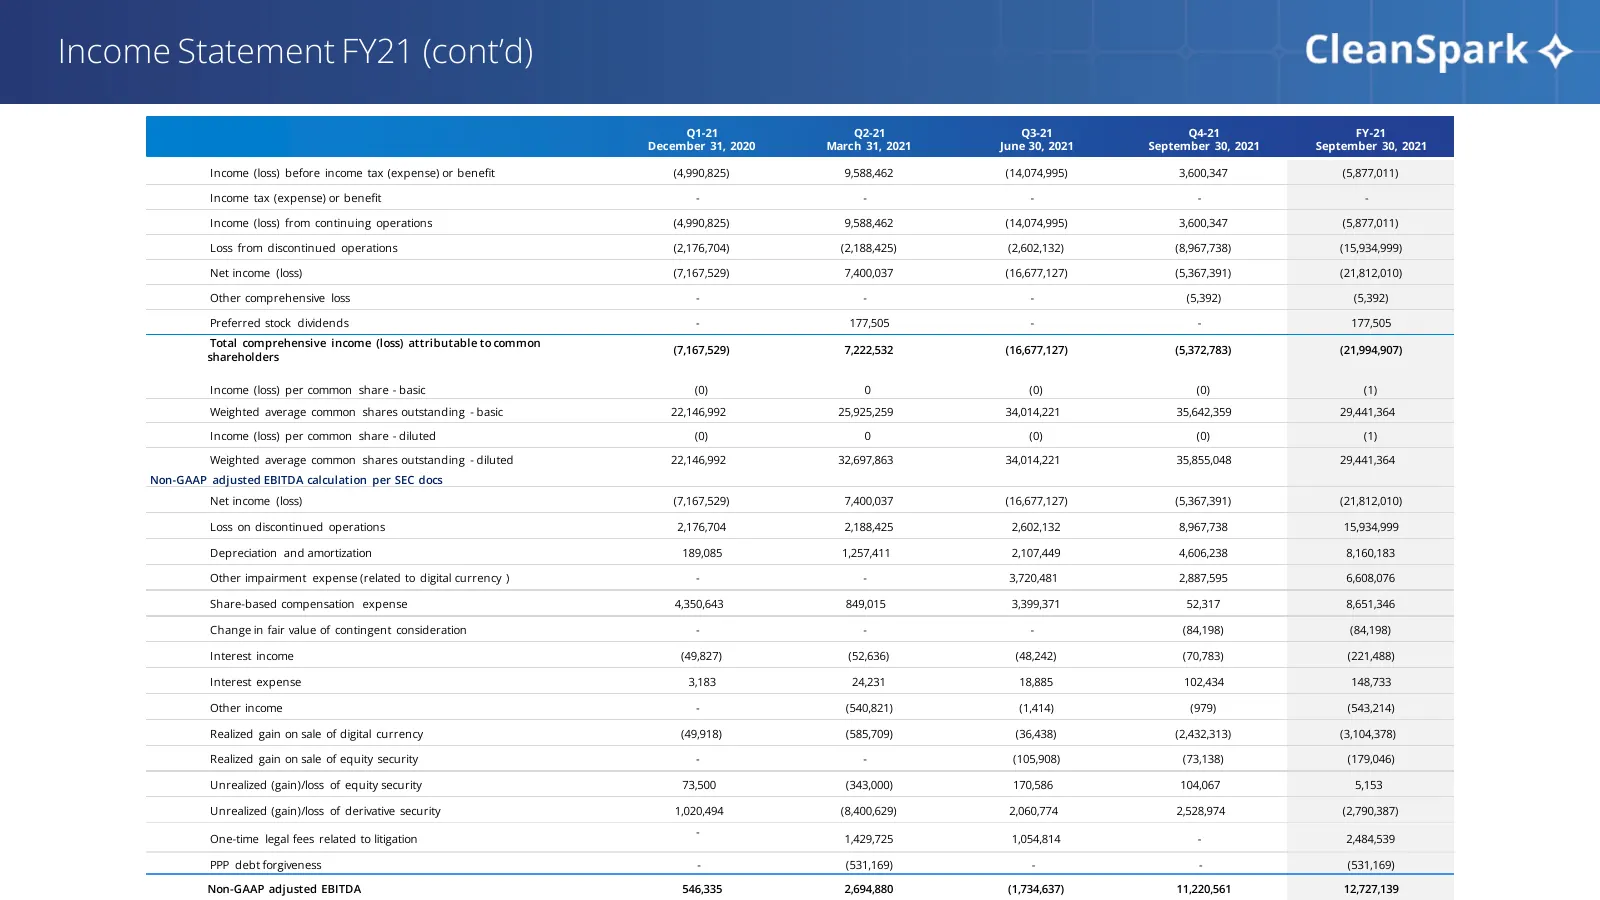
Income Statement FY21 (cont’d) Q1-21 Q2-21 Q3-21 Q4-21 FY-21 December 31, 2020 March 31, 2021 June 30, 2021 September 30, 2021 September 30, 2021 Income (loss) before income tax (expense) or benefit (4,990,825) 9,588,462 (14,074,995) 3,600,347 (5,877,011) Income tax (expense) or benefit - - - - - In
Slide 28: Balance Sheet
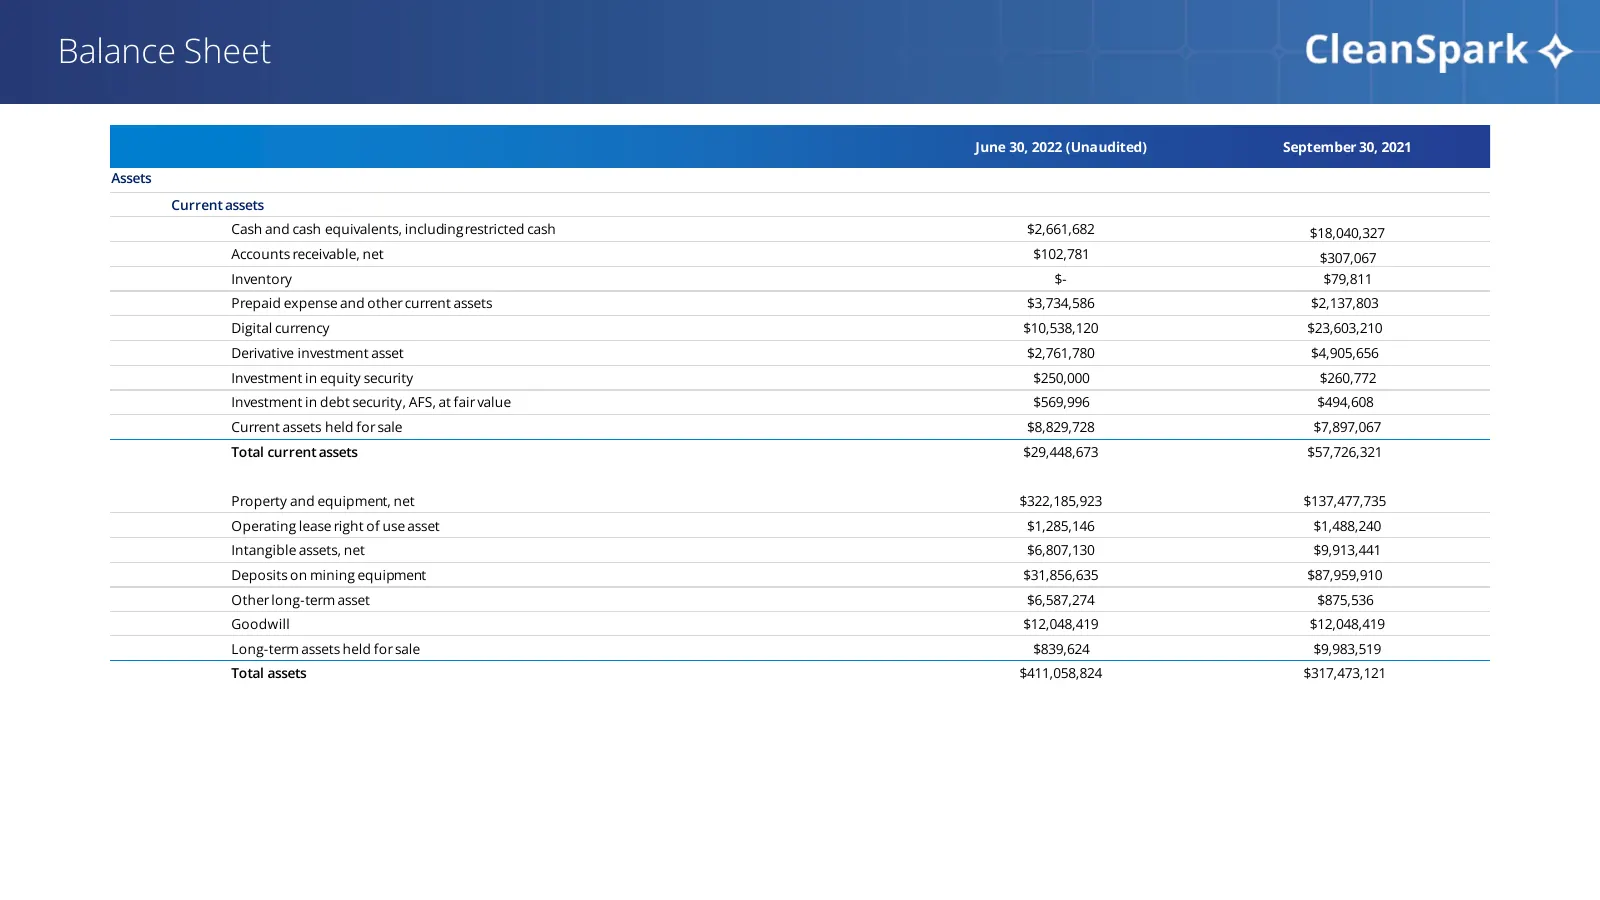
Balance Sheet June 30, 2022 (Unaudited) September 30, 2021 Assets Current assets Cash and cash equivalents, including restricted cash $2,661,682 $18,040,327 Accounts receivable, net $102,781 $307,067 Inventory $- $79,811 Prepaid expense and other current assets $3,734,586 $2,137,803 Digital currency
Slide 29: Balance Sheet (cont’d)
Balance Sheet (cont’d) June 30, 2022 (Unaudited) September 30, 2021 Liabilities and stockholders' equity Current liabilities Accounts payable and accrued liabilities $12,995,578 $6,982,517 Operating lease liability $323,951 $256,195 Finance lease liability $274,222 $403,410 Acquisition liability - $
Slide 30: Non-GAAP Measures
Non-GAAP Measures Adjust ed EBITDA is not a measurement of financial performance under generally accept ed accounting principles in the Unit ed St ates (“ GAAP”). Because of varying available valuation methodologies, subjective assumptions and the variety of equity instruments that can impact a comp
Slide 31: America’s Bitcoin Miner™
CleanSpark + America’s Bitcoin Miner™
Source: Internet Archive copy of cleanspark.com
More decks from CleanSpark, Inc.
 Q3 2026 Earnings Presentation12 slides · Aug 6, 2026
 Q2 2026 Earnings Presentation14 slides · May 11, 2026
 Q1 2026 Earnings Presentation17 slides · Feb 5, 2026
 Q4 2025 Earnings Presentation18 slides · Nov 25, 2025
 Q1 2025 Earnings Presentation6 slides · Feb 6, 2025
 Q4 2024 Earnings Presentation6 slides · Dec 2, 2024