Argo Group International Holdings Ltd
Argo Group International — Q3 2014 Earnings Presentation
22 slides from Argo Group International's earnings presentation, Nov 17, 2014
Slide 1: 3Q 2014 Investor Presentation
Exhibit 99.1 3Q 2014 Investor Presentation November 2014
Slide 2: Forward-Looking Statements
Forward-Looking Statements This presentation contains “forward-looking statements” which are made pursuant to the safe harbor provisions of the Private Securities Litigation Reform Act of 1995. The forward-looking statements are based on the Company's current expectations and beliefs concerning futu
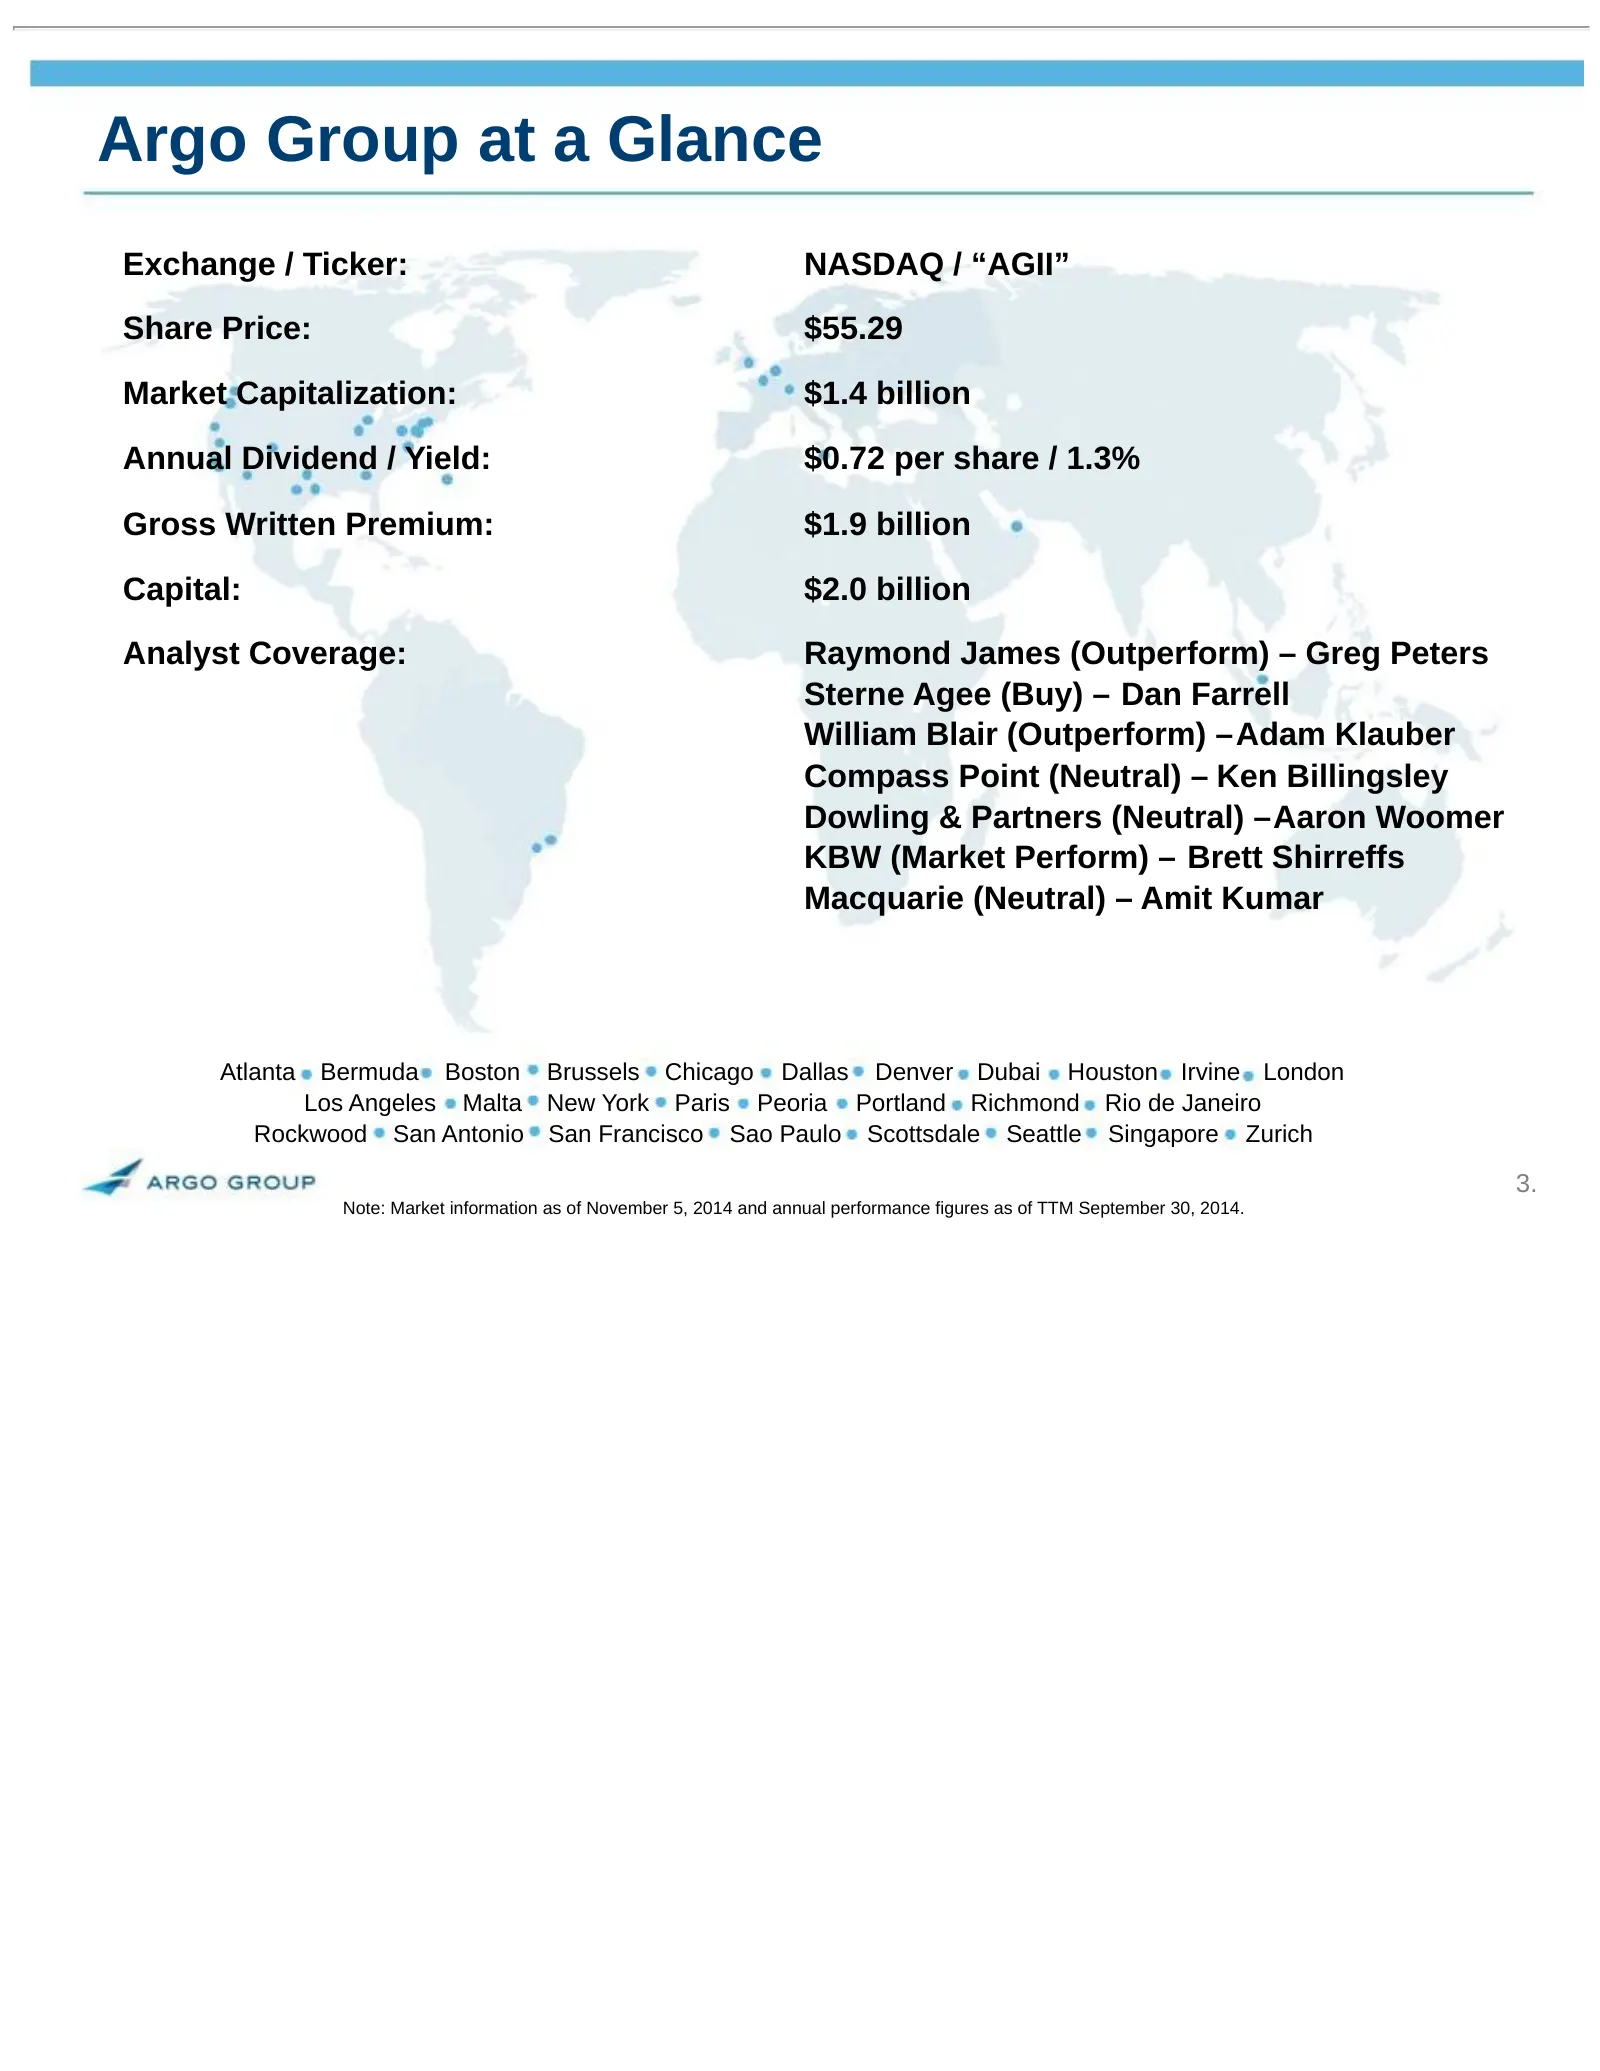
Slide 3: Argo Group at a Glance
Argo Group at a Glance Exchange / Ticker: NASDAQ / “AGII” Share Price: $55.29 Market Capitalization: $1.4 billion Annual Dividend / Yield: $0.72 per share / 1.3% Gross Written Premium: $1.9 billion Capital: $2.0 billion Analyst Coverage: Raymond James (Outperform) – Greg Peters Sterne Agee (Buy) – D
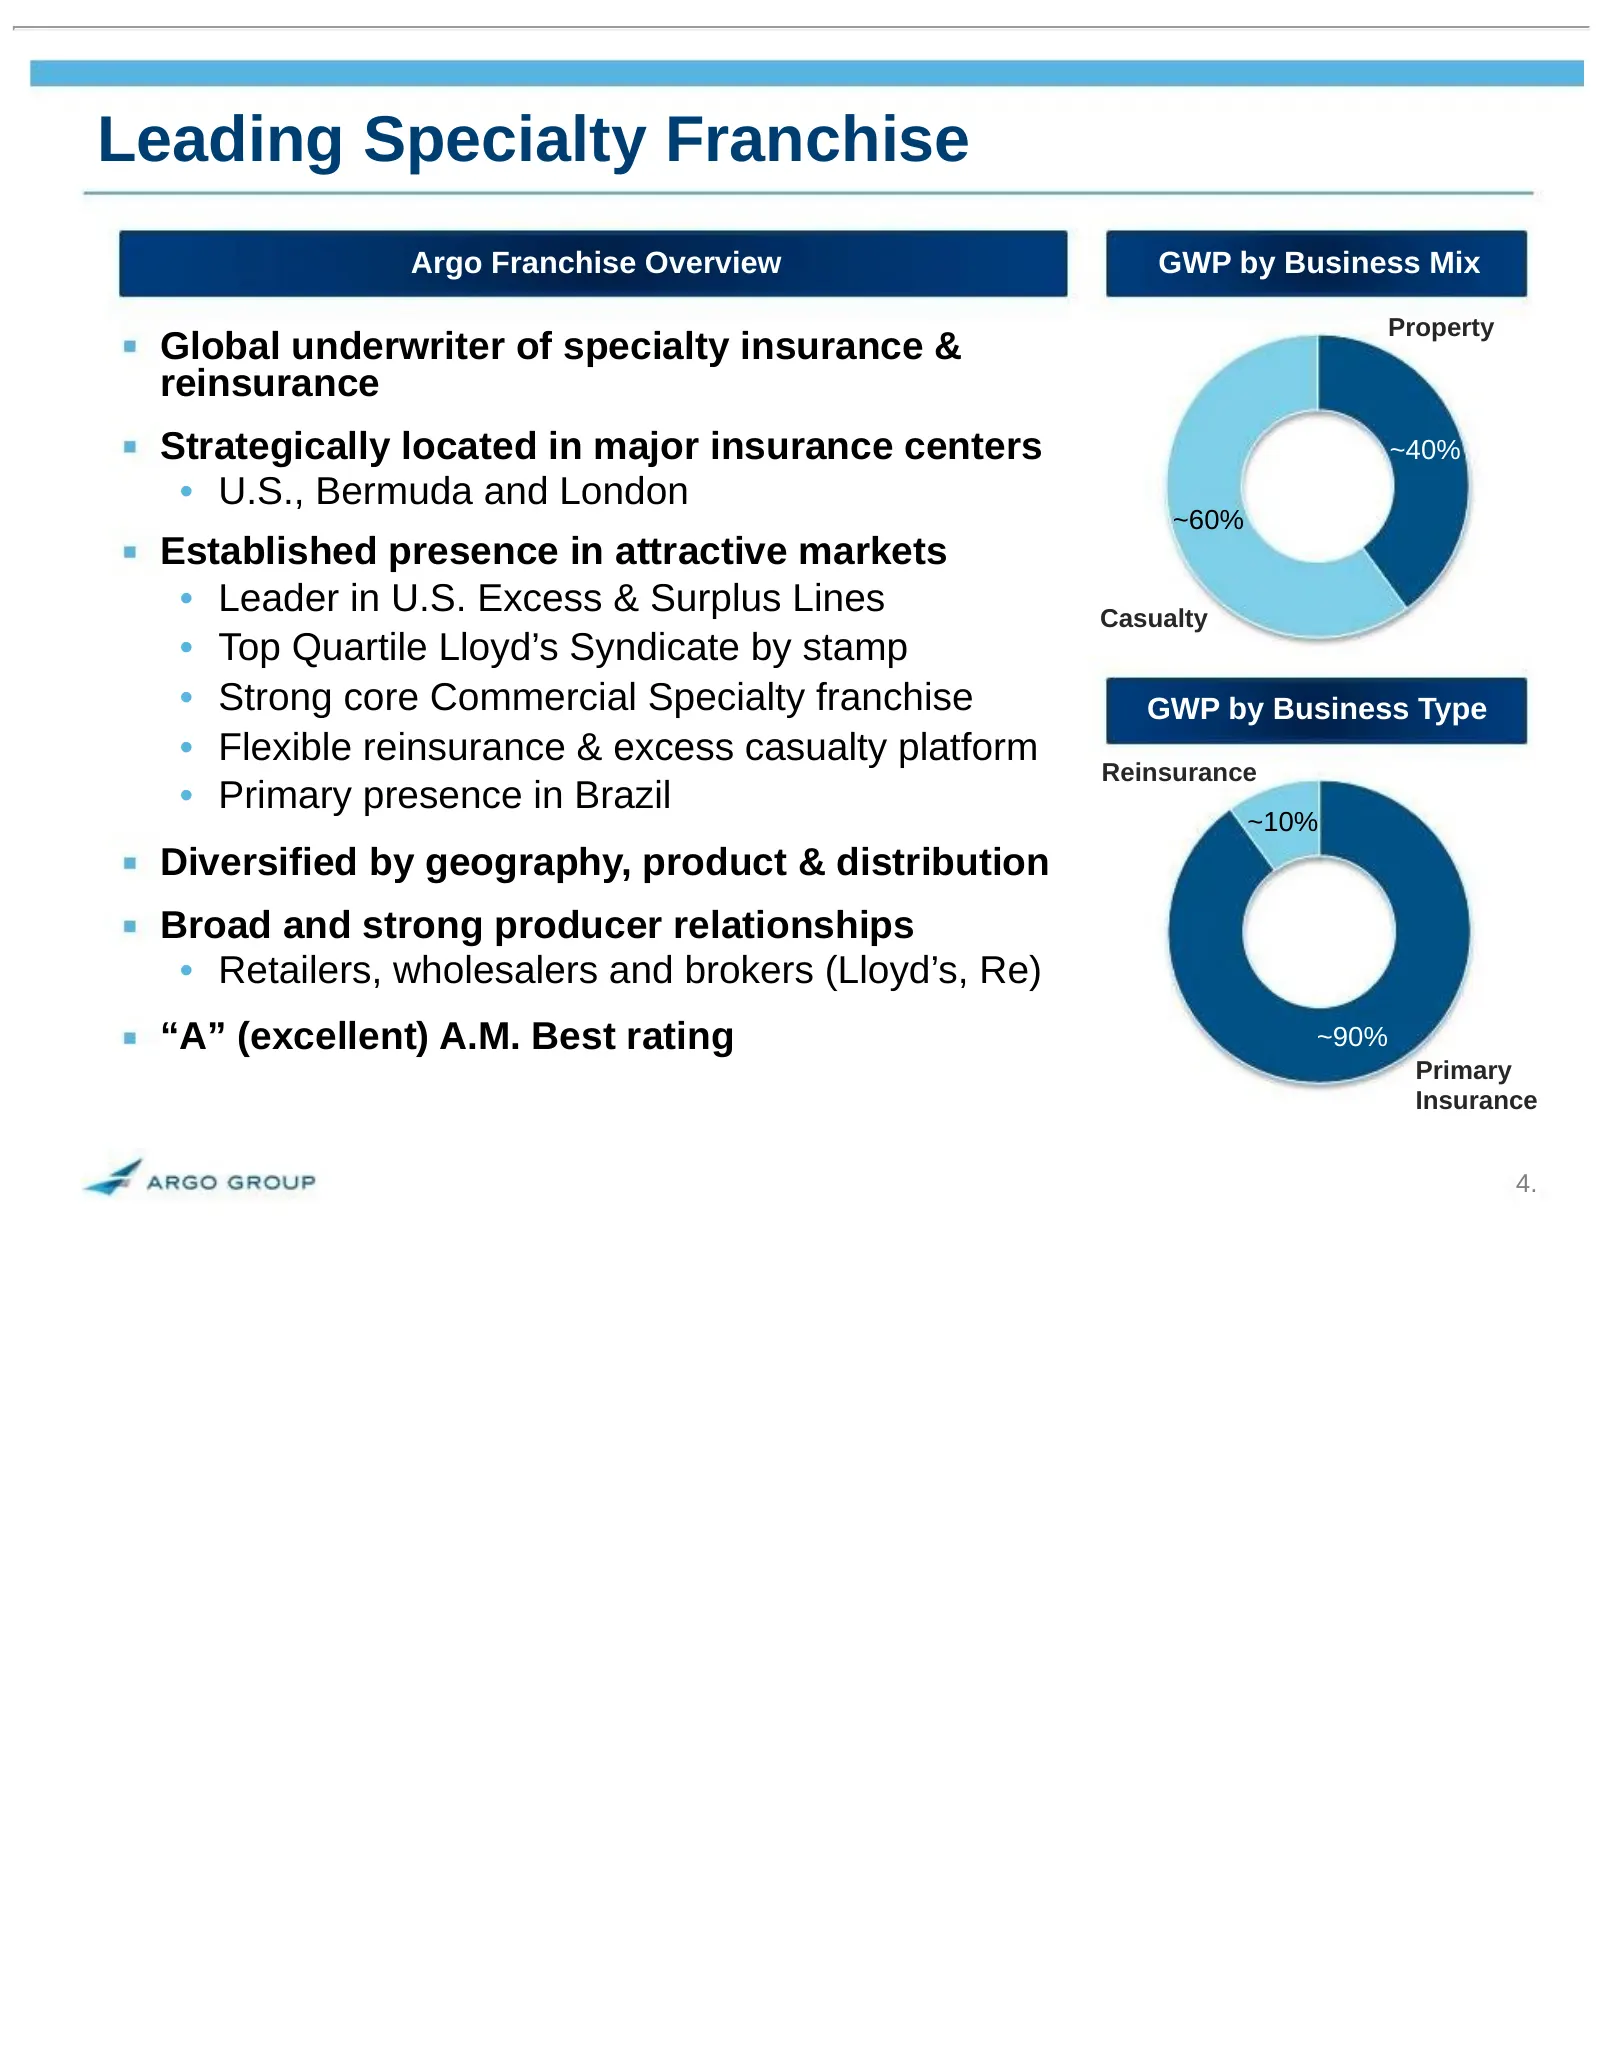
Slide 4: Leading Specialty Franchise
Leading Specialty Franchise Argo Franchise Overview GWP by Business Mix Property Global underwriter of specialty insurance & reinsurance Strategically located in major insurance centers ~40% • U.S., Bermuda and London ~60% Established presence in attractive markets • Leader in U.S. Excess & Surplus
Slide 5: Strategy Aligned Toward Shareholder Value
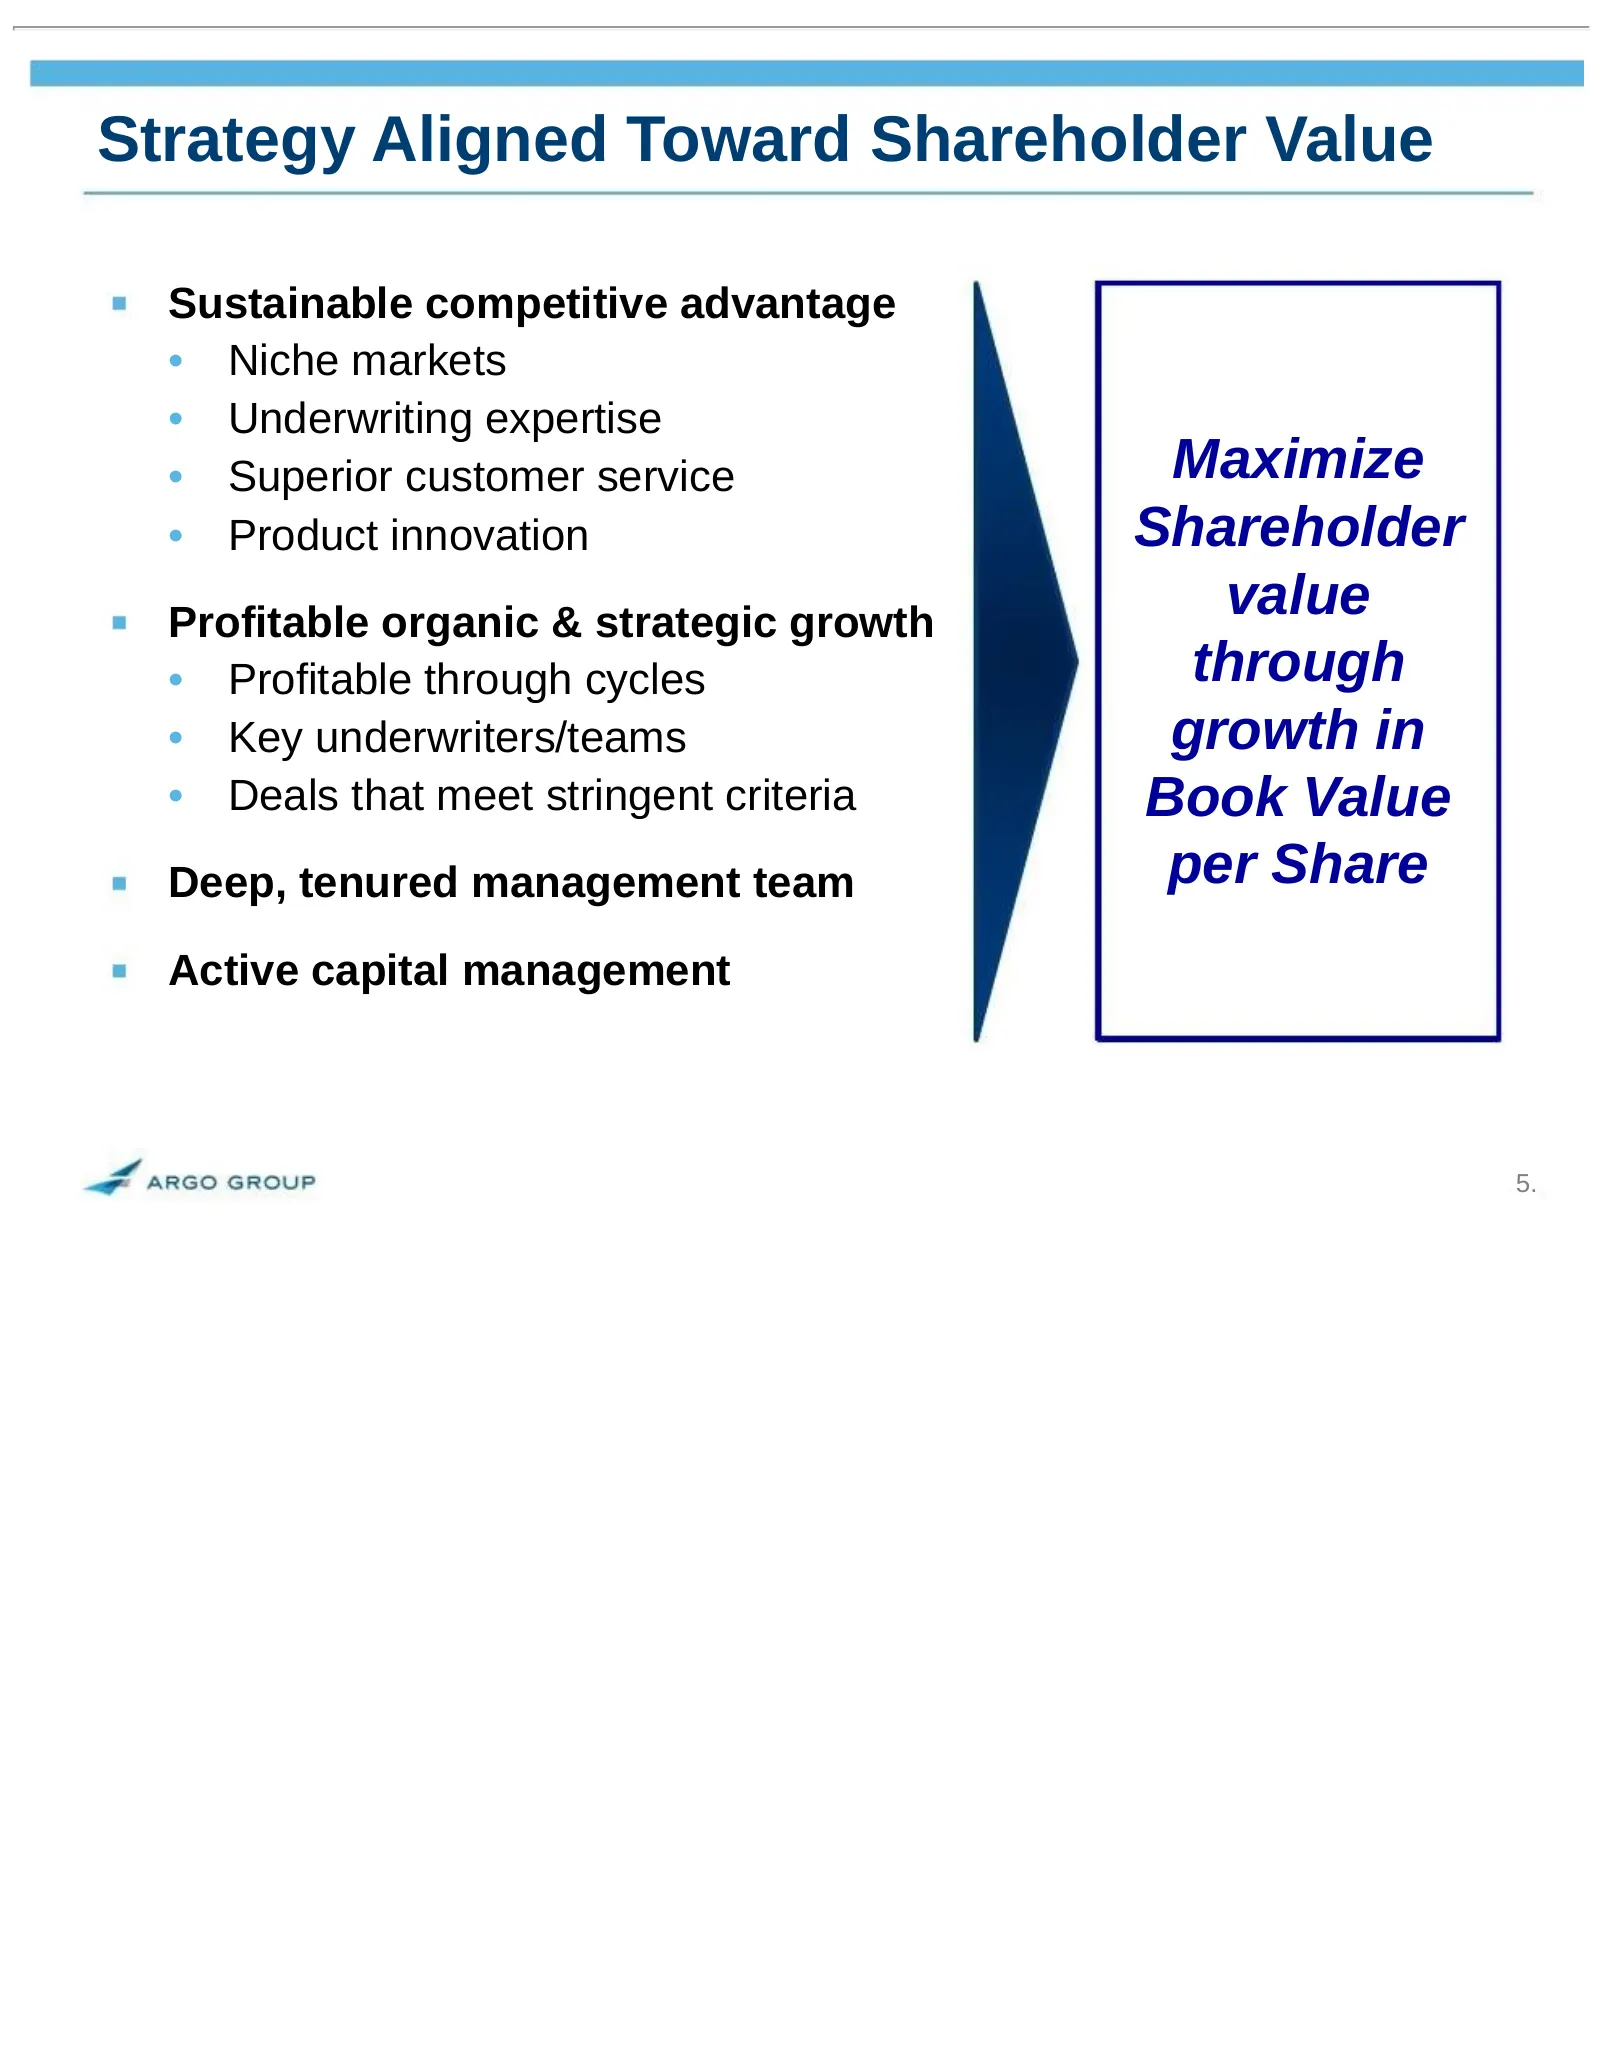
Strategy Aligned Toward Shareholder Value Sustainable competitive advantage • Niche markets • Underwriting expertise • Superior customer service Maximize • Product innovation Shareholder Profitable organic & strategic growth value • Profitable through cycles through • Key underwriters/teams growth i
Slide 6: Evolution of Growth and Diversification
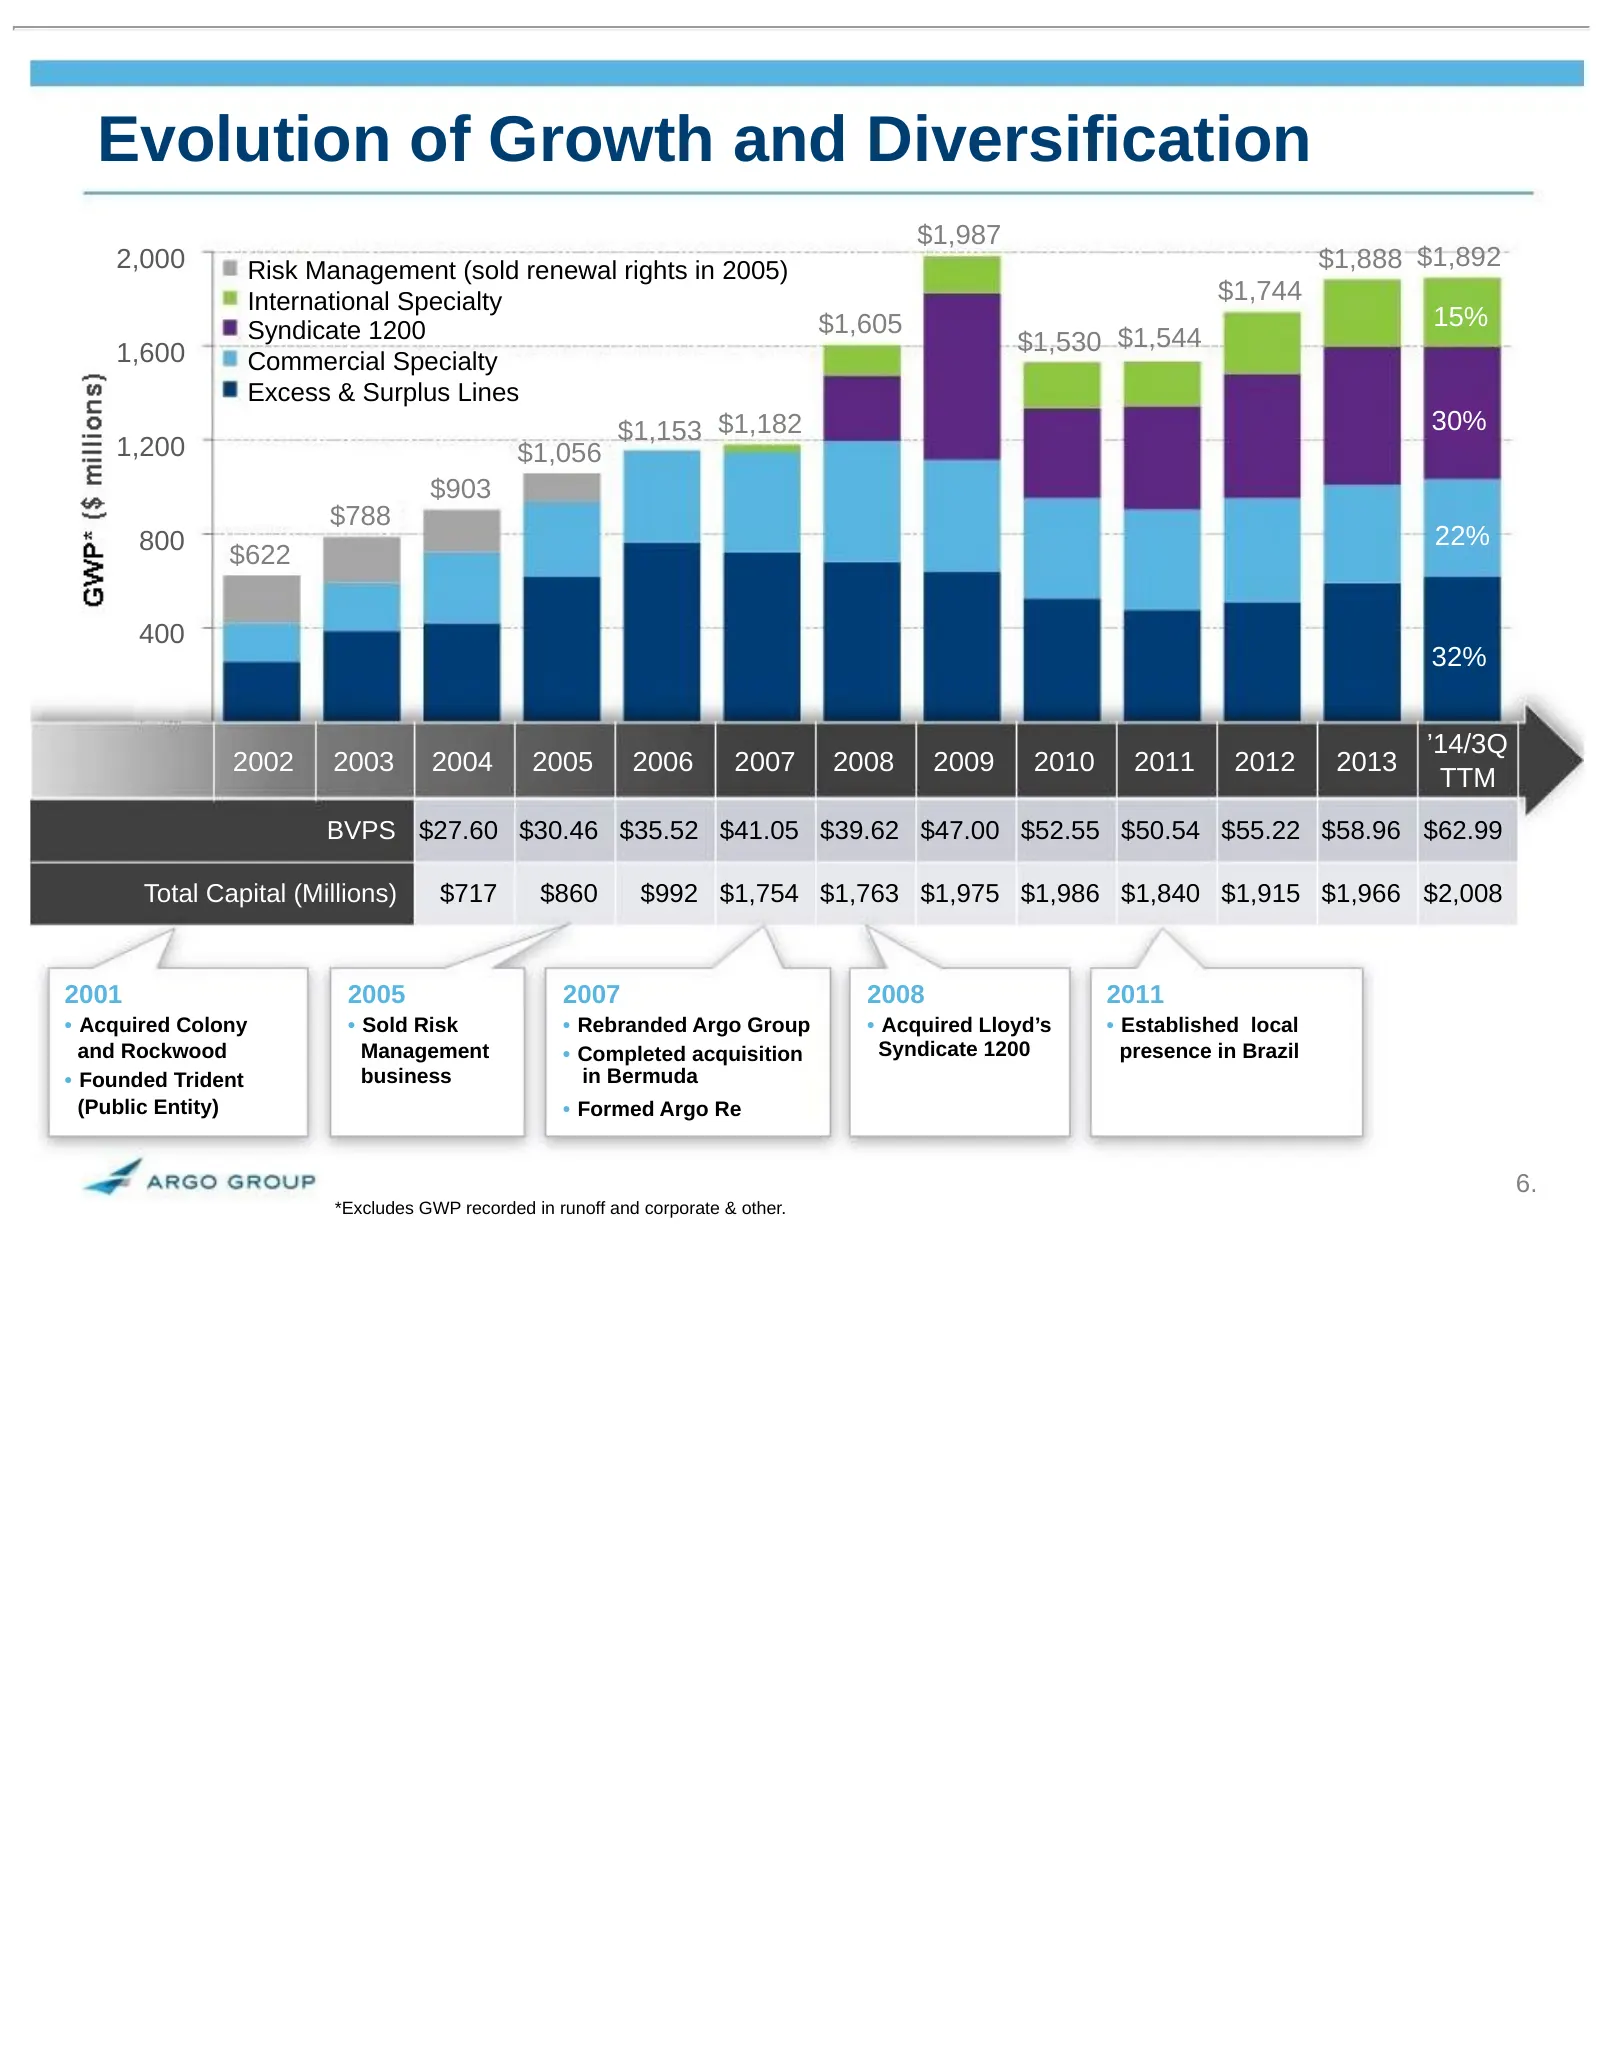
Evolution of Growth and Diversification Total $1,987 2,000 Risk Management (sold renewal rights in 2005) $1,888 $1,892 International Specialty $1,744 Syndicate 1200 $1,605 15% 1,600 $1,530 $1,544 Commercial Specialty Excess & Surplus Lines $1,153 $1,182 30% 1,200 $1,056 $903 $788 800 22% $622 400 32
Slide 7: Argo Group Business Mix ($1.9B in GWP)
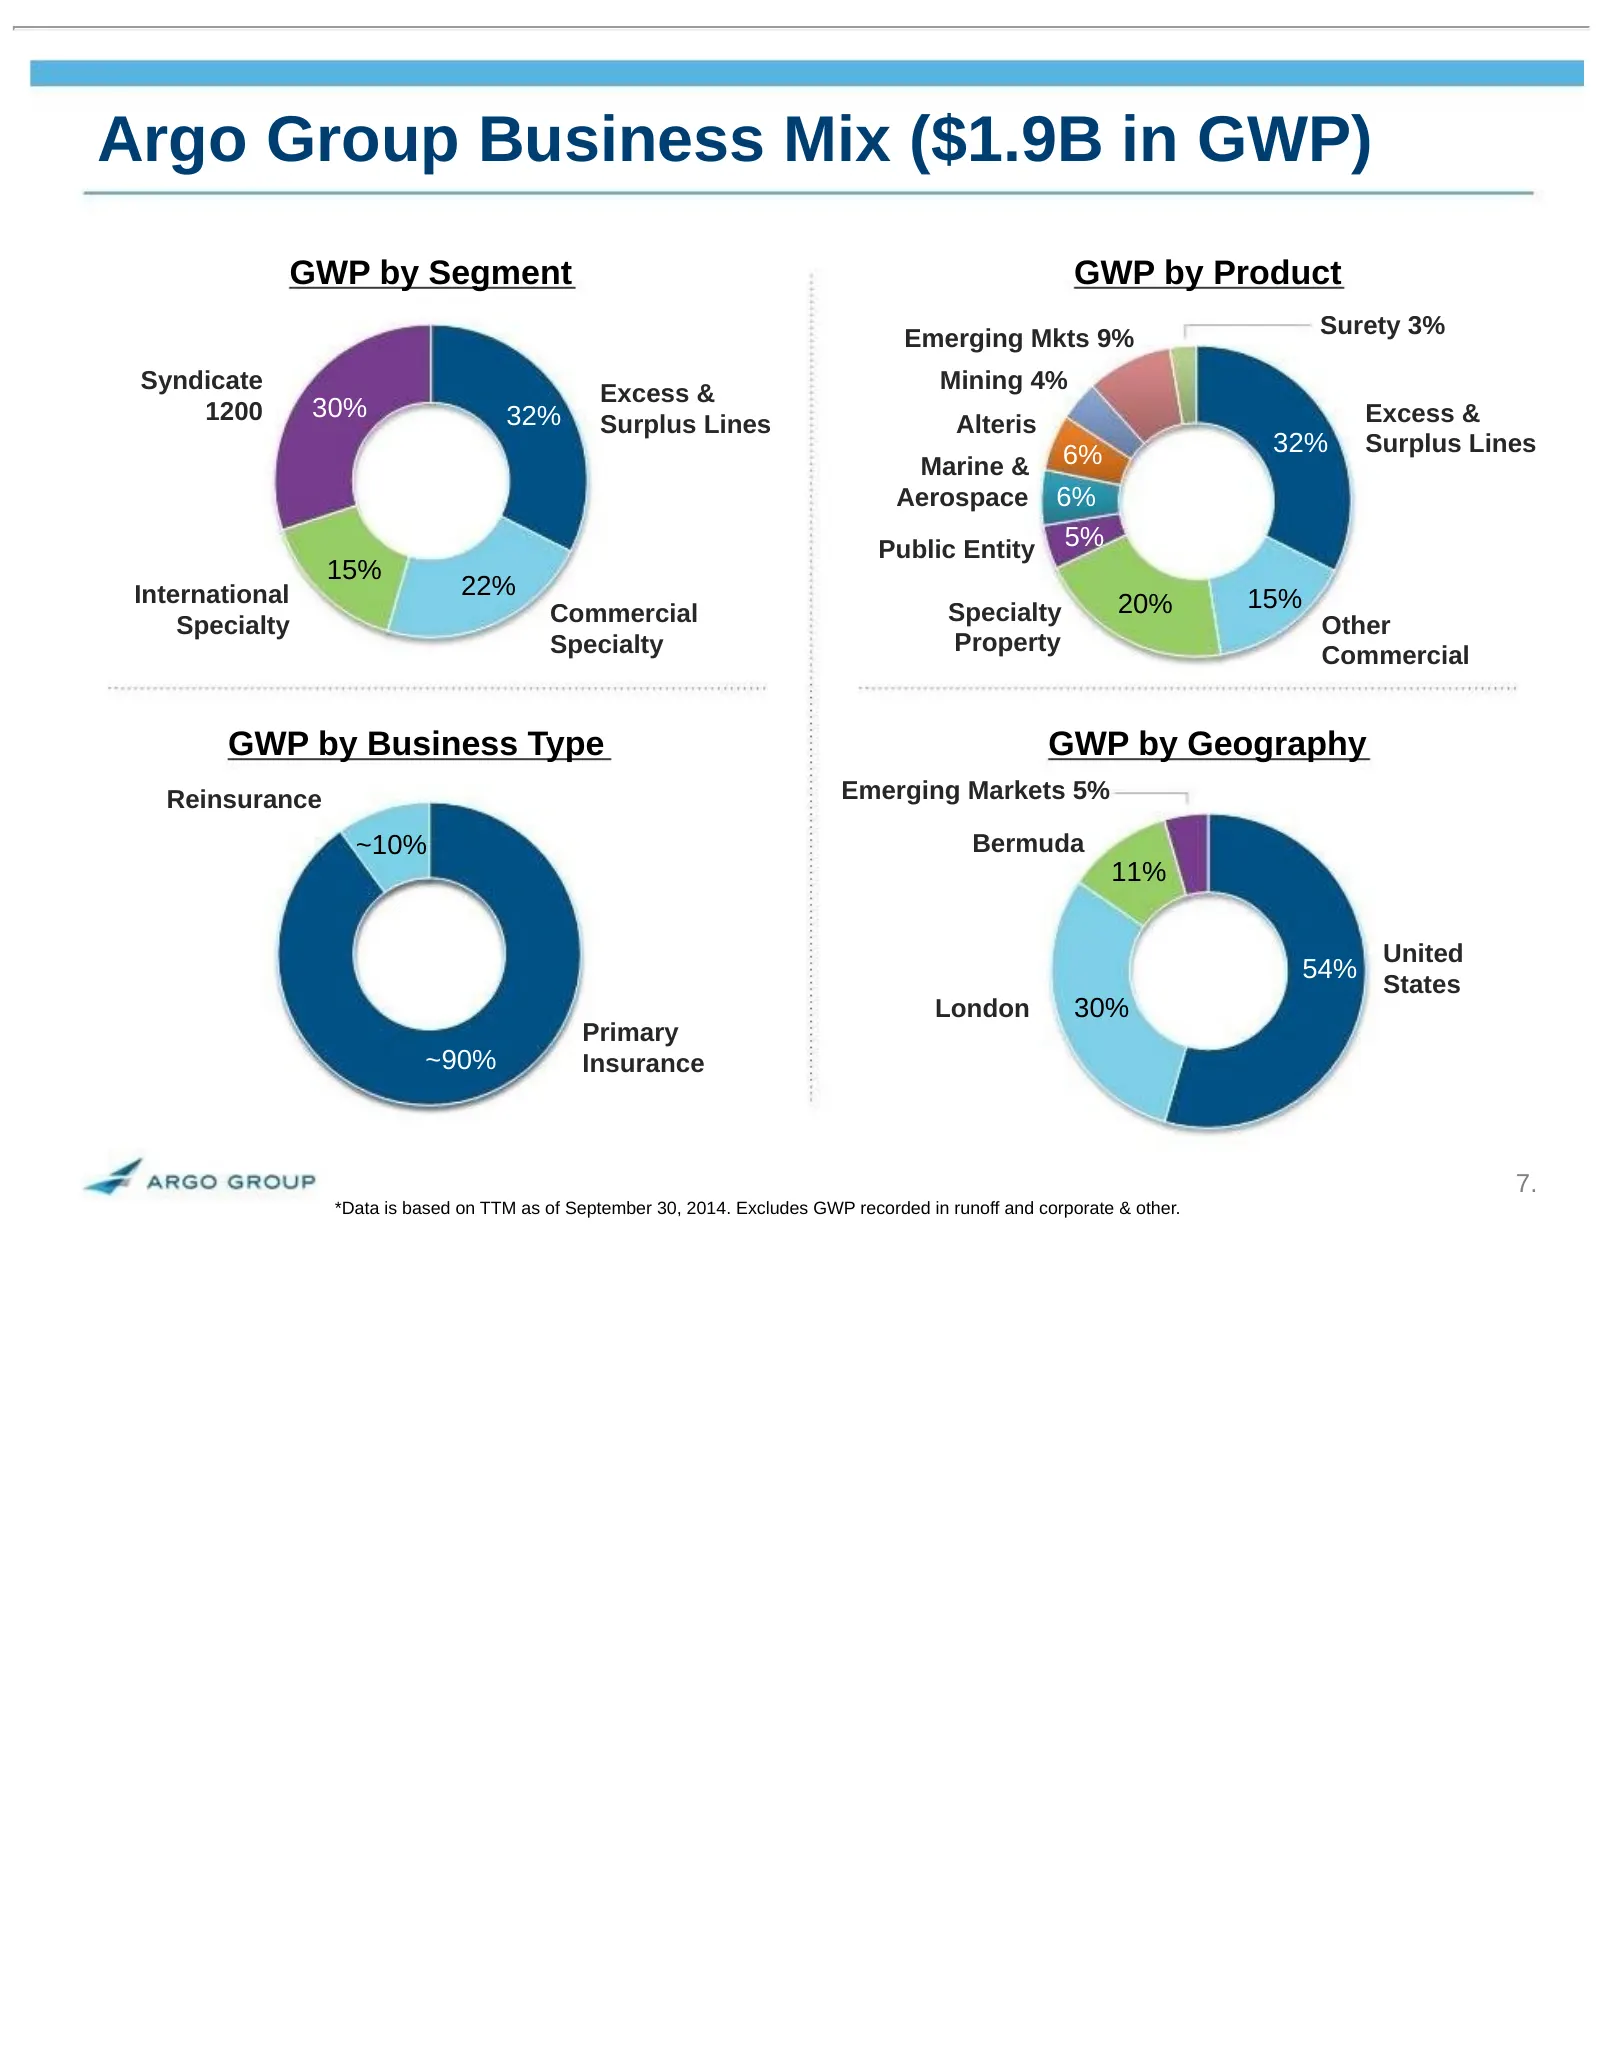
Argo Group Business Mix ($1.9B in GWP) GWP by Segment GWP by Product Emerging Mkts 9% Surety 3% Syndicate Excess & Mining 4% 1200 30% 32% Excess & Surplus Lines Alteris 6% 32% Surplus Lines Marine & Aerospace 6% Public Entity 5% 15% International 22% 15% Commercial Specialty 20% Specialty Other Spec
Slide 8: Multi-Channel Distribution Strategy
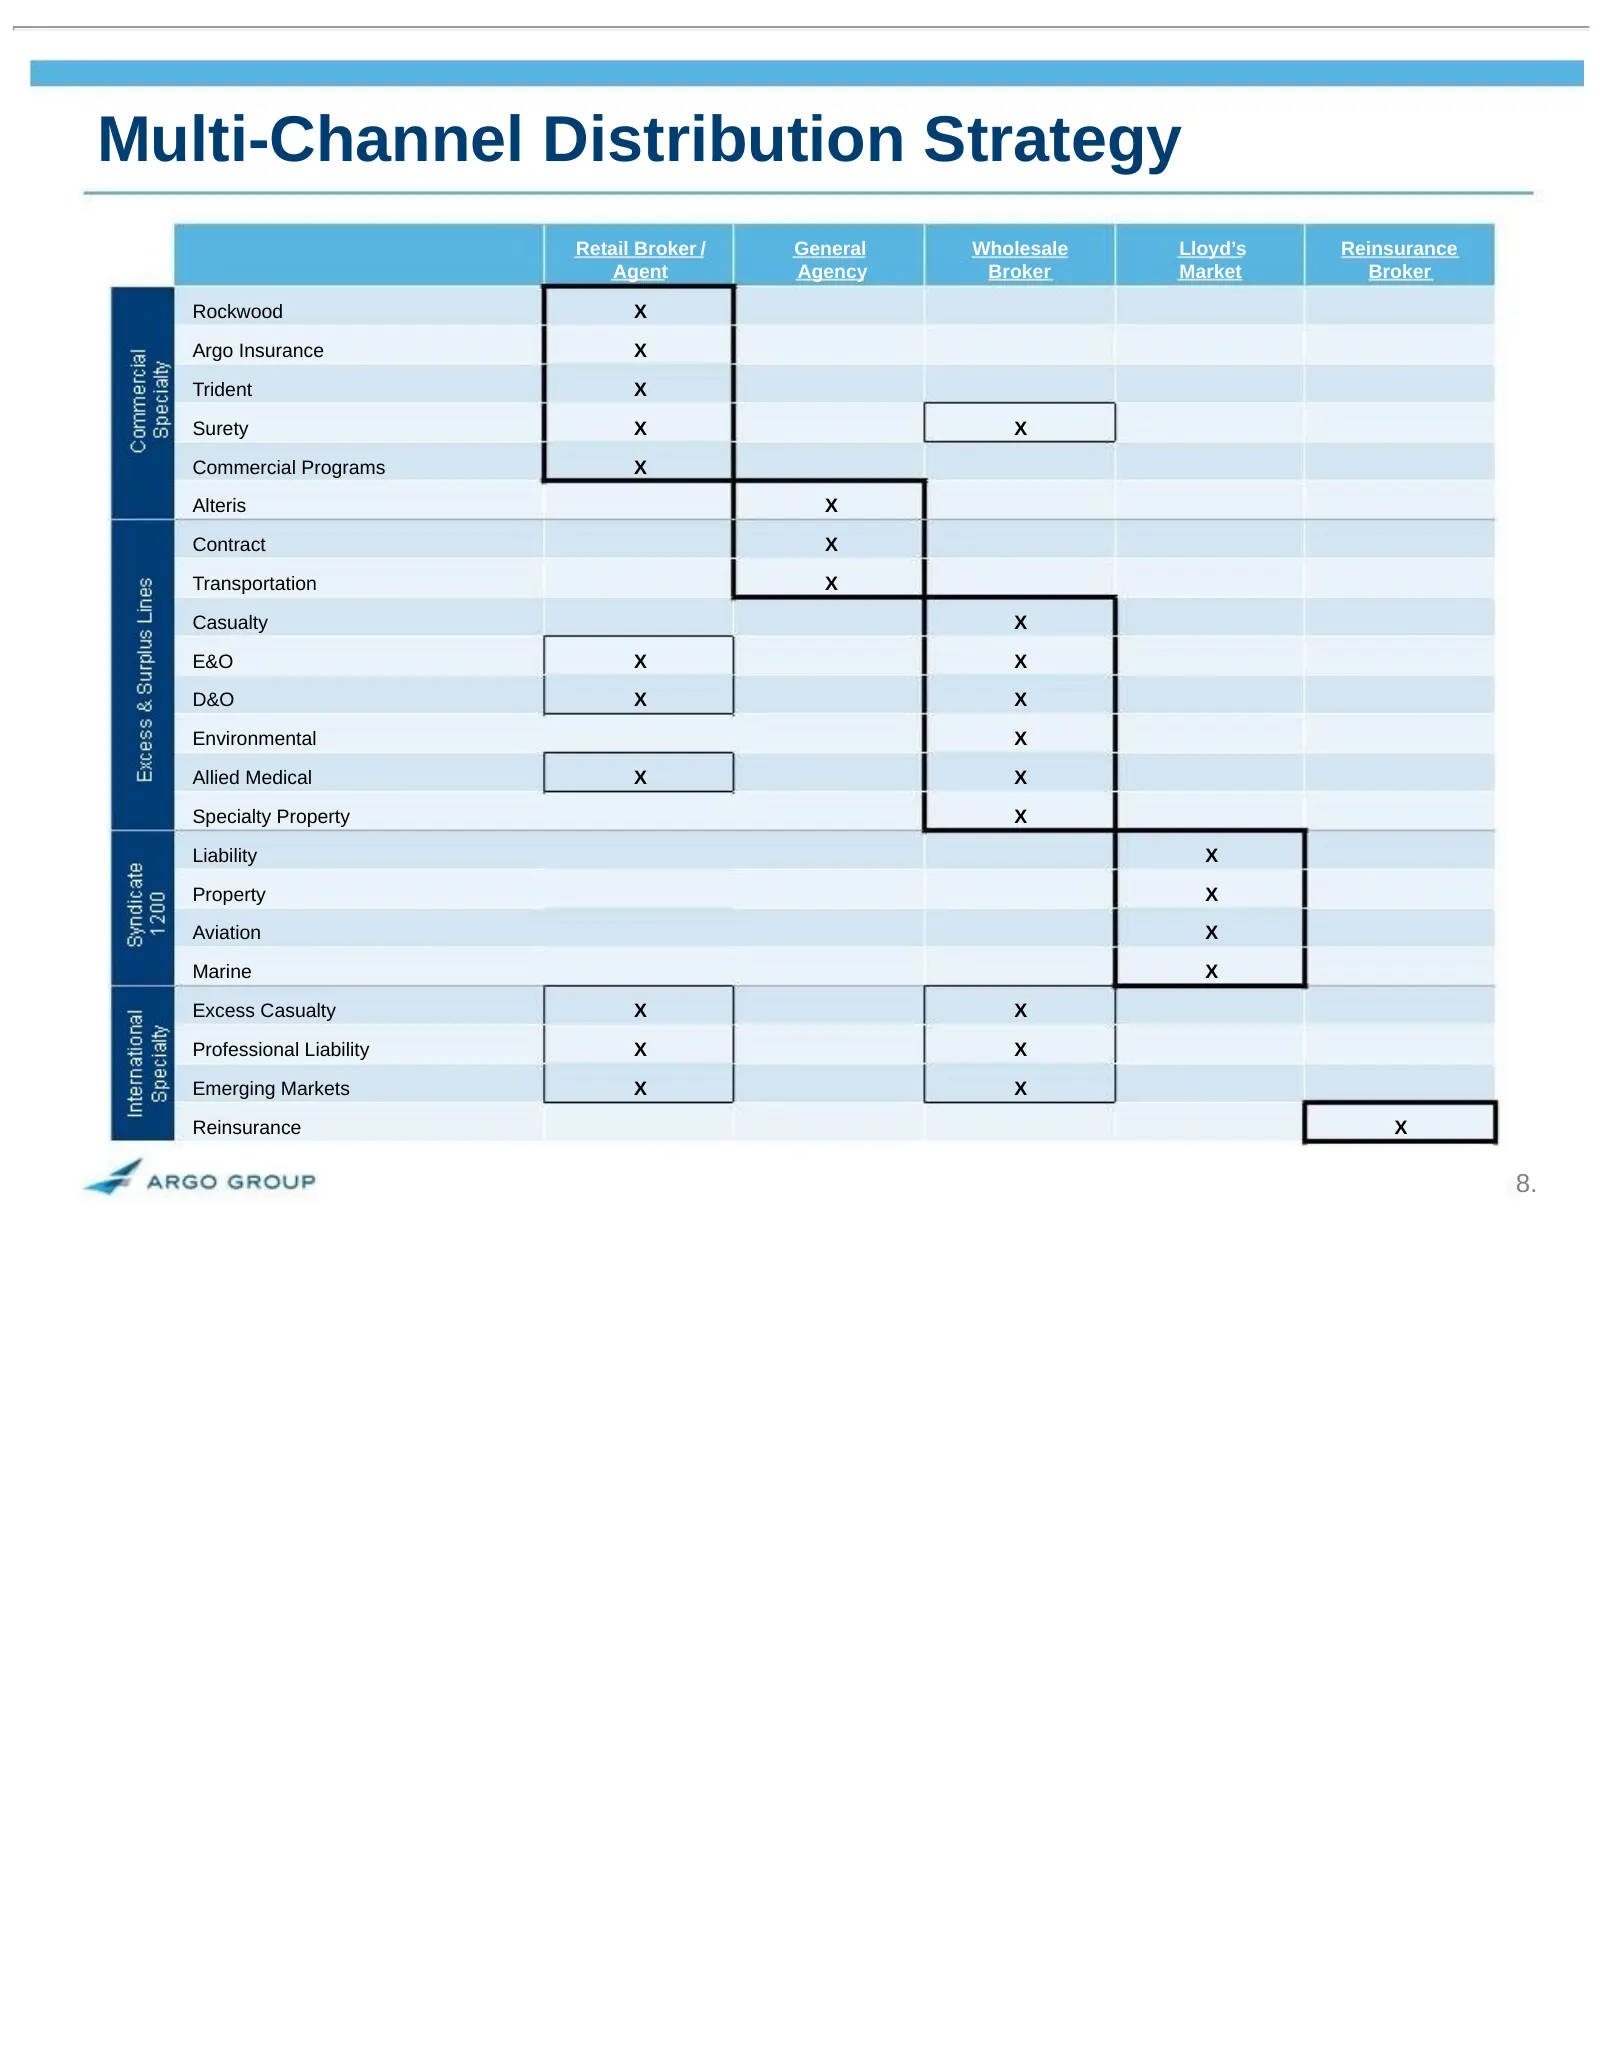
Multi-Channel Distribution Strategy Retail Broker / General Wholesale Lloyd’s Reinsurance Agent Agency Broker Market Broker Rockwood X Argo Insurance X Trident X Surety X X Commercial Programs X Alteris X Contract X Transportation X Casualty X E&O X X D&O X X Environmental X Allied Medical X X Speci
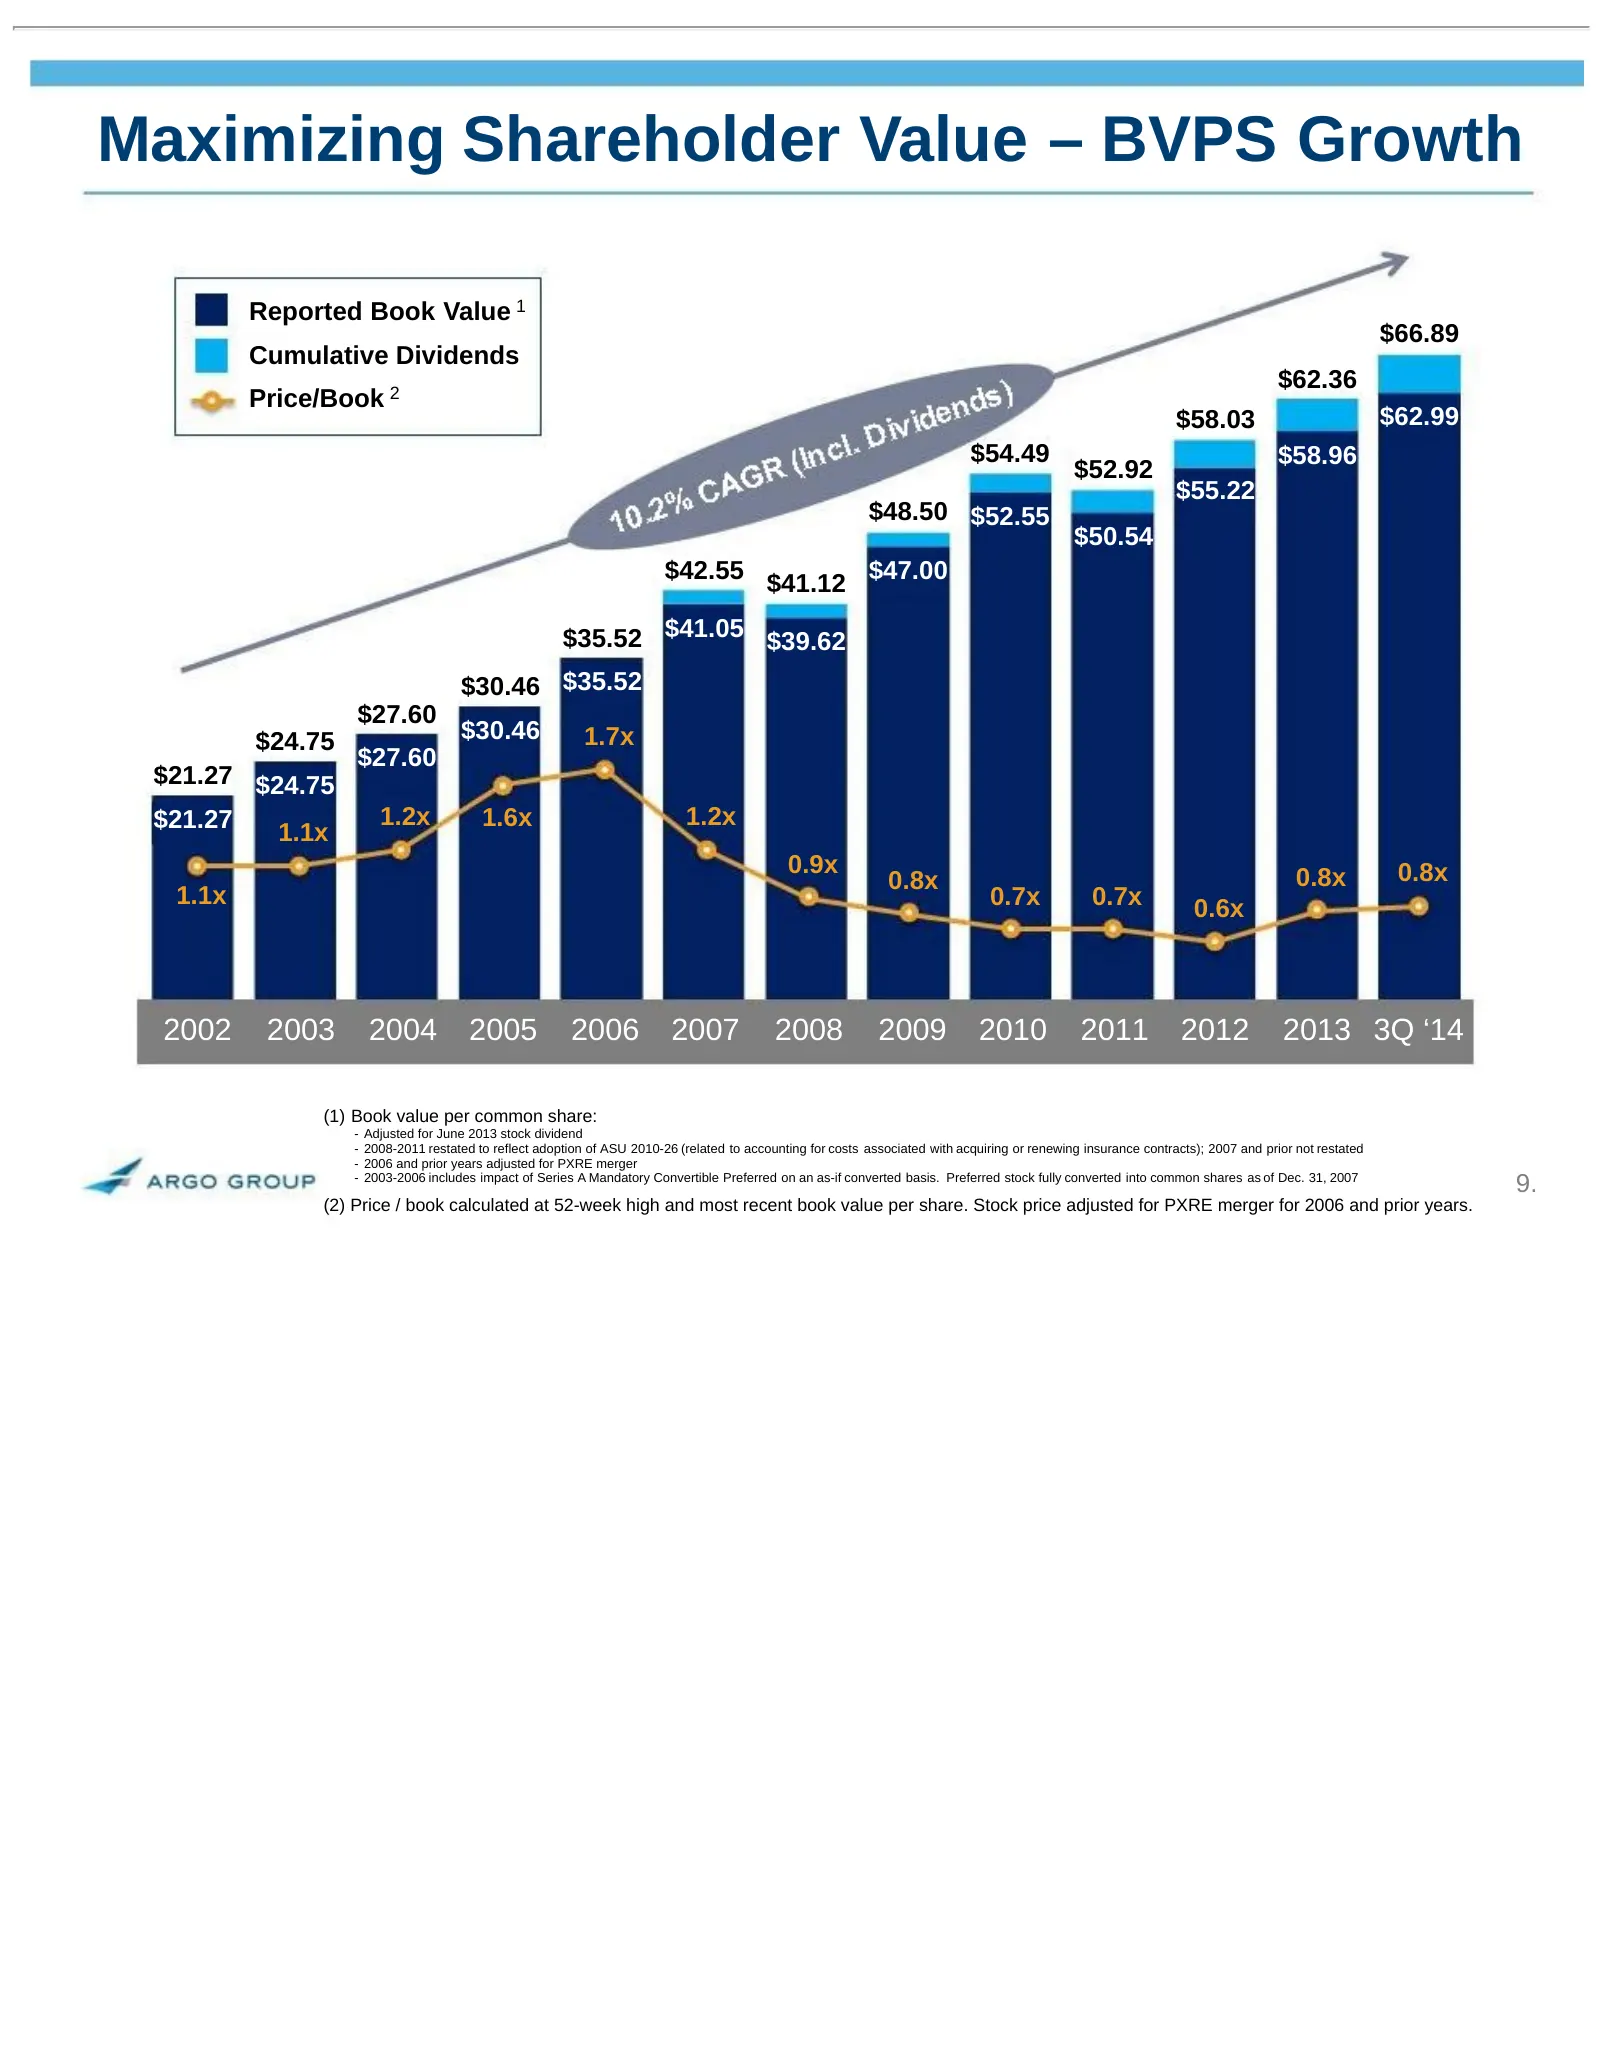
Slide 9: Maximizing Shareholder Value – BVPS Growth
Maximizing Shareholder Value – BVPS Growth Reported Book Value 1 $66.89 Cumulative Dividends $62.36 Price/Book 2 $58.03 $62.99 $54.49 $58.96 $52.92 $55.22 $48.50 $52.55 $50.54 $42.55 $47.00 $41.12 $35.52 $41.05 $39.62 $30.46 $35.52 $27.60 $24.75 $30.46 1.7x $27.60 $21.27 $24.75 $21.27 1.2x 1.6x 1.2x
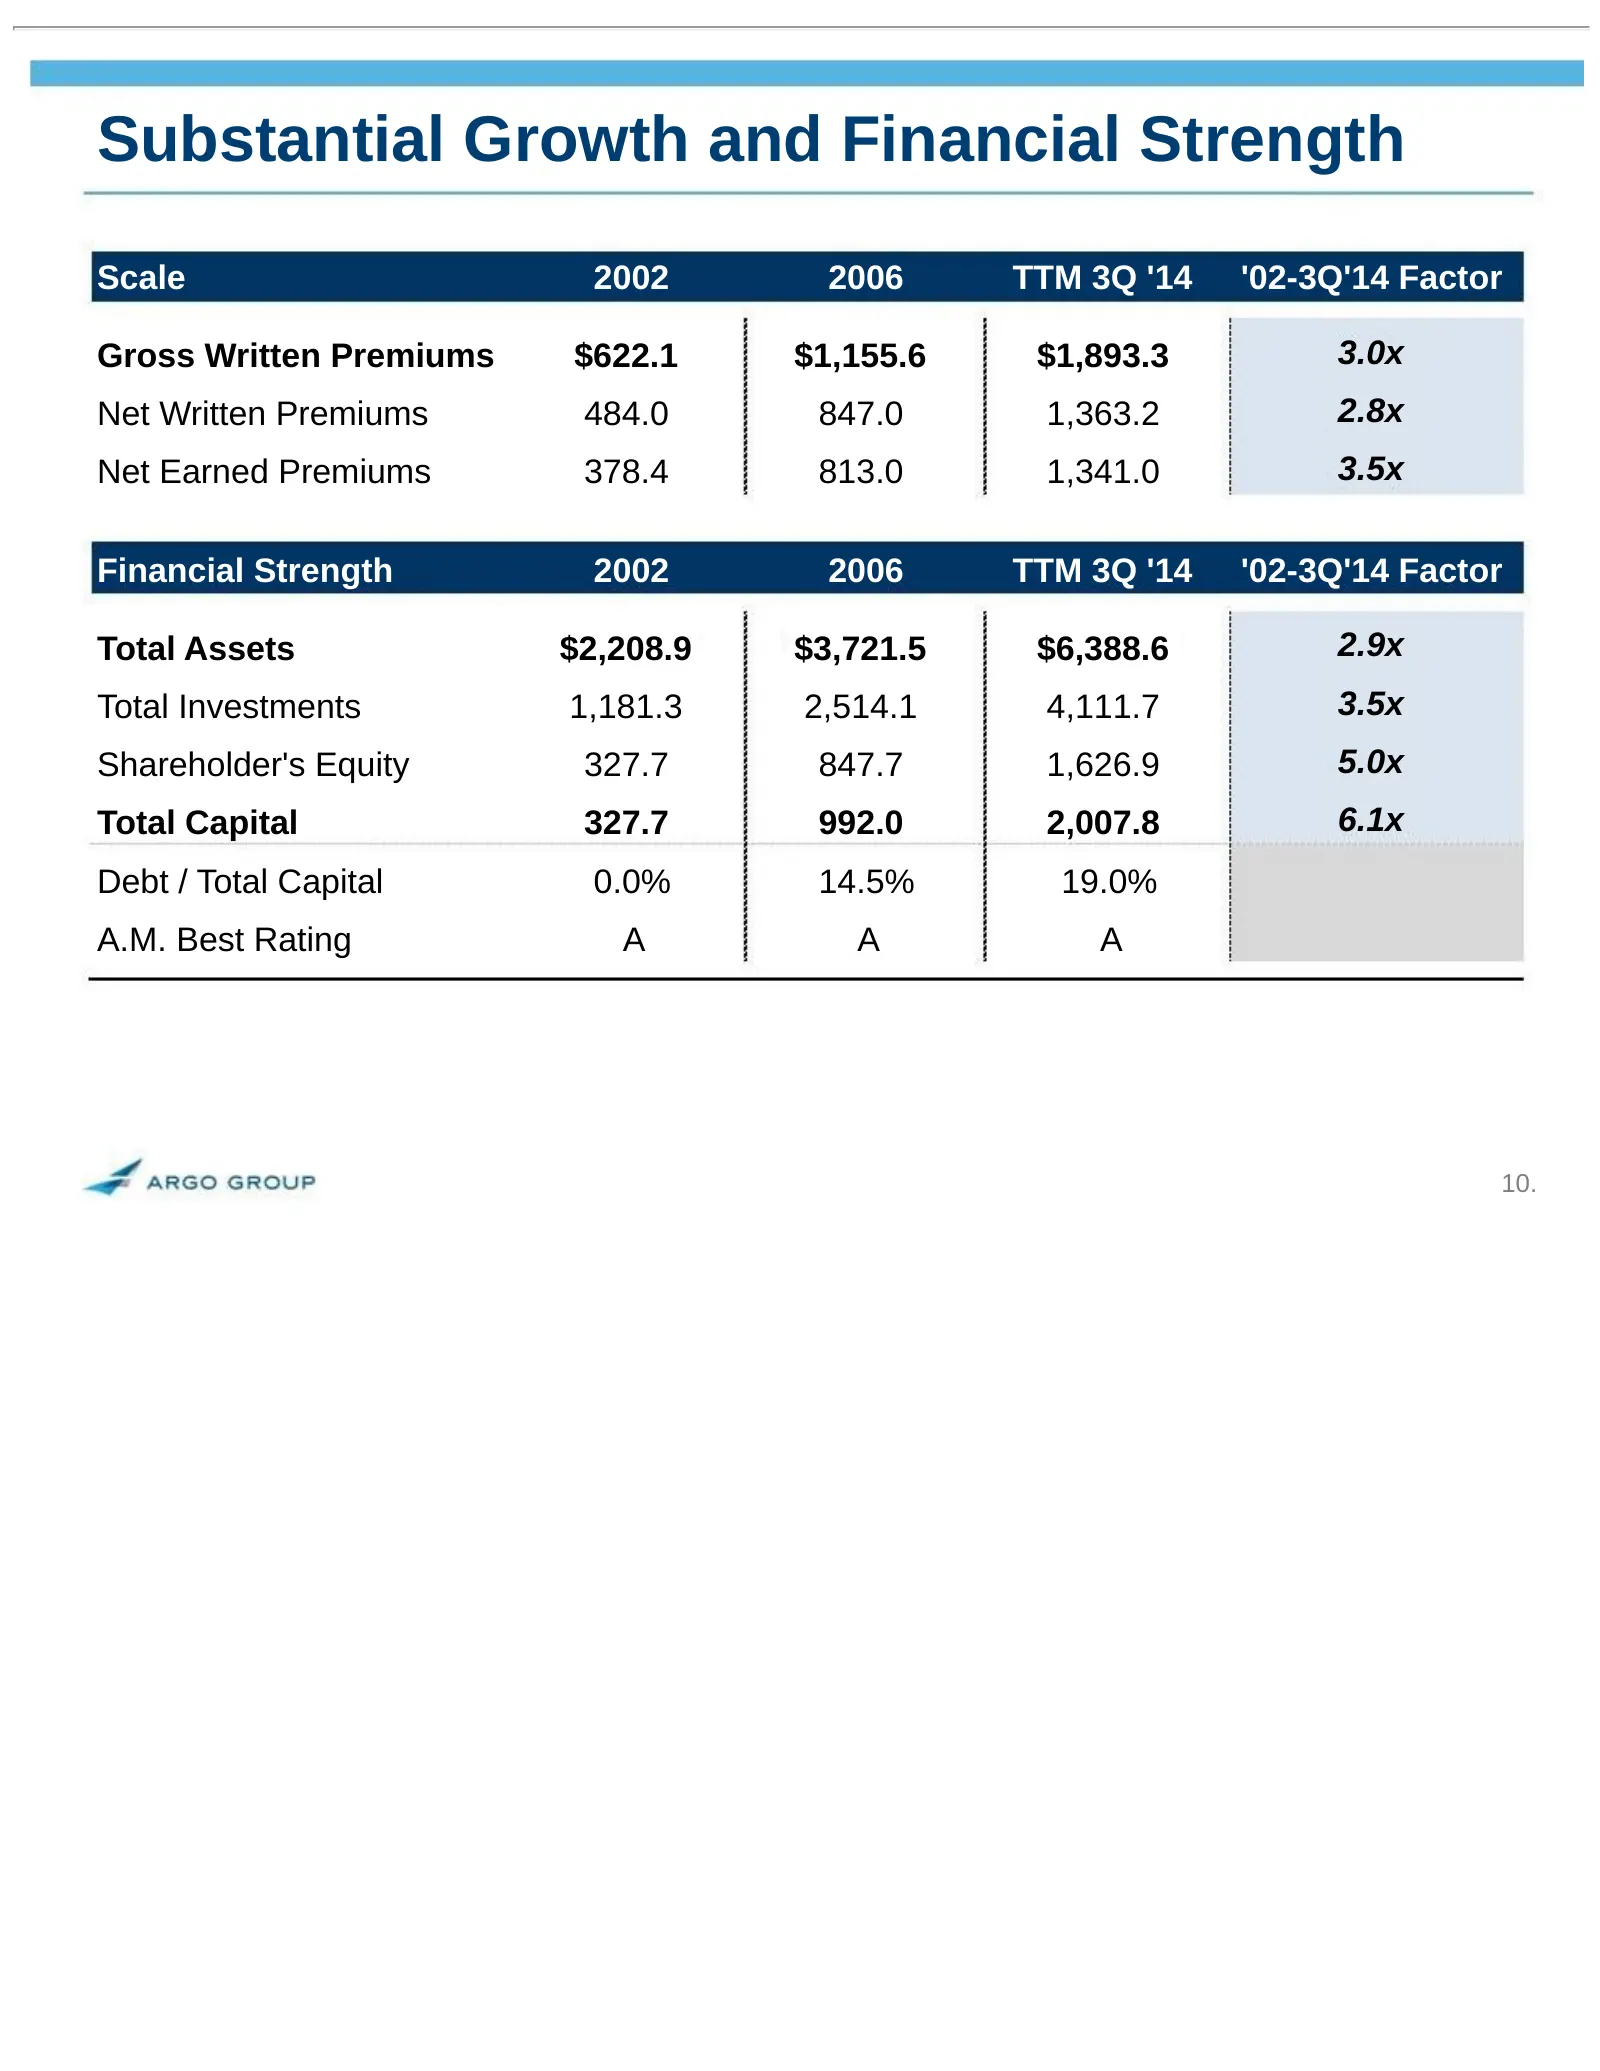
Slide 10: Substantial Growth and Financial Strength
Substantial Growth and Financial Strength Scale 2002 2006 TTM 3Q '14 '02-3Q'14 Factor Gross Written Premiums $622.1 $1,155.6 $1,893.3 3.0x Net Written Premiums 484.0 847.0 1,363.2 2.8x Net Earned Premiums 378.4 813.0 1,341.0 3.5x Financial Strength 2002 2006 TTM 3Q '14 '02-3Q'14 Factor Total Assets
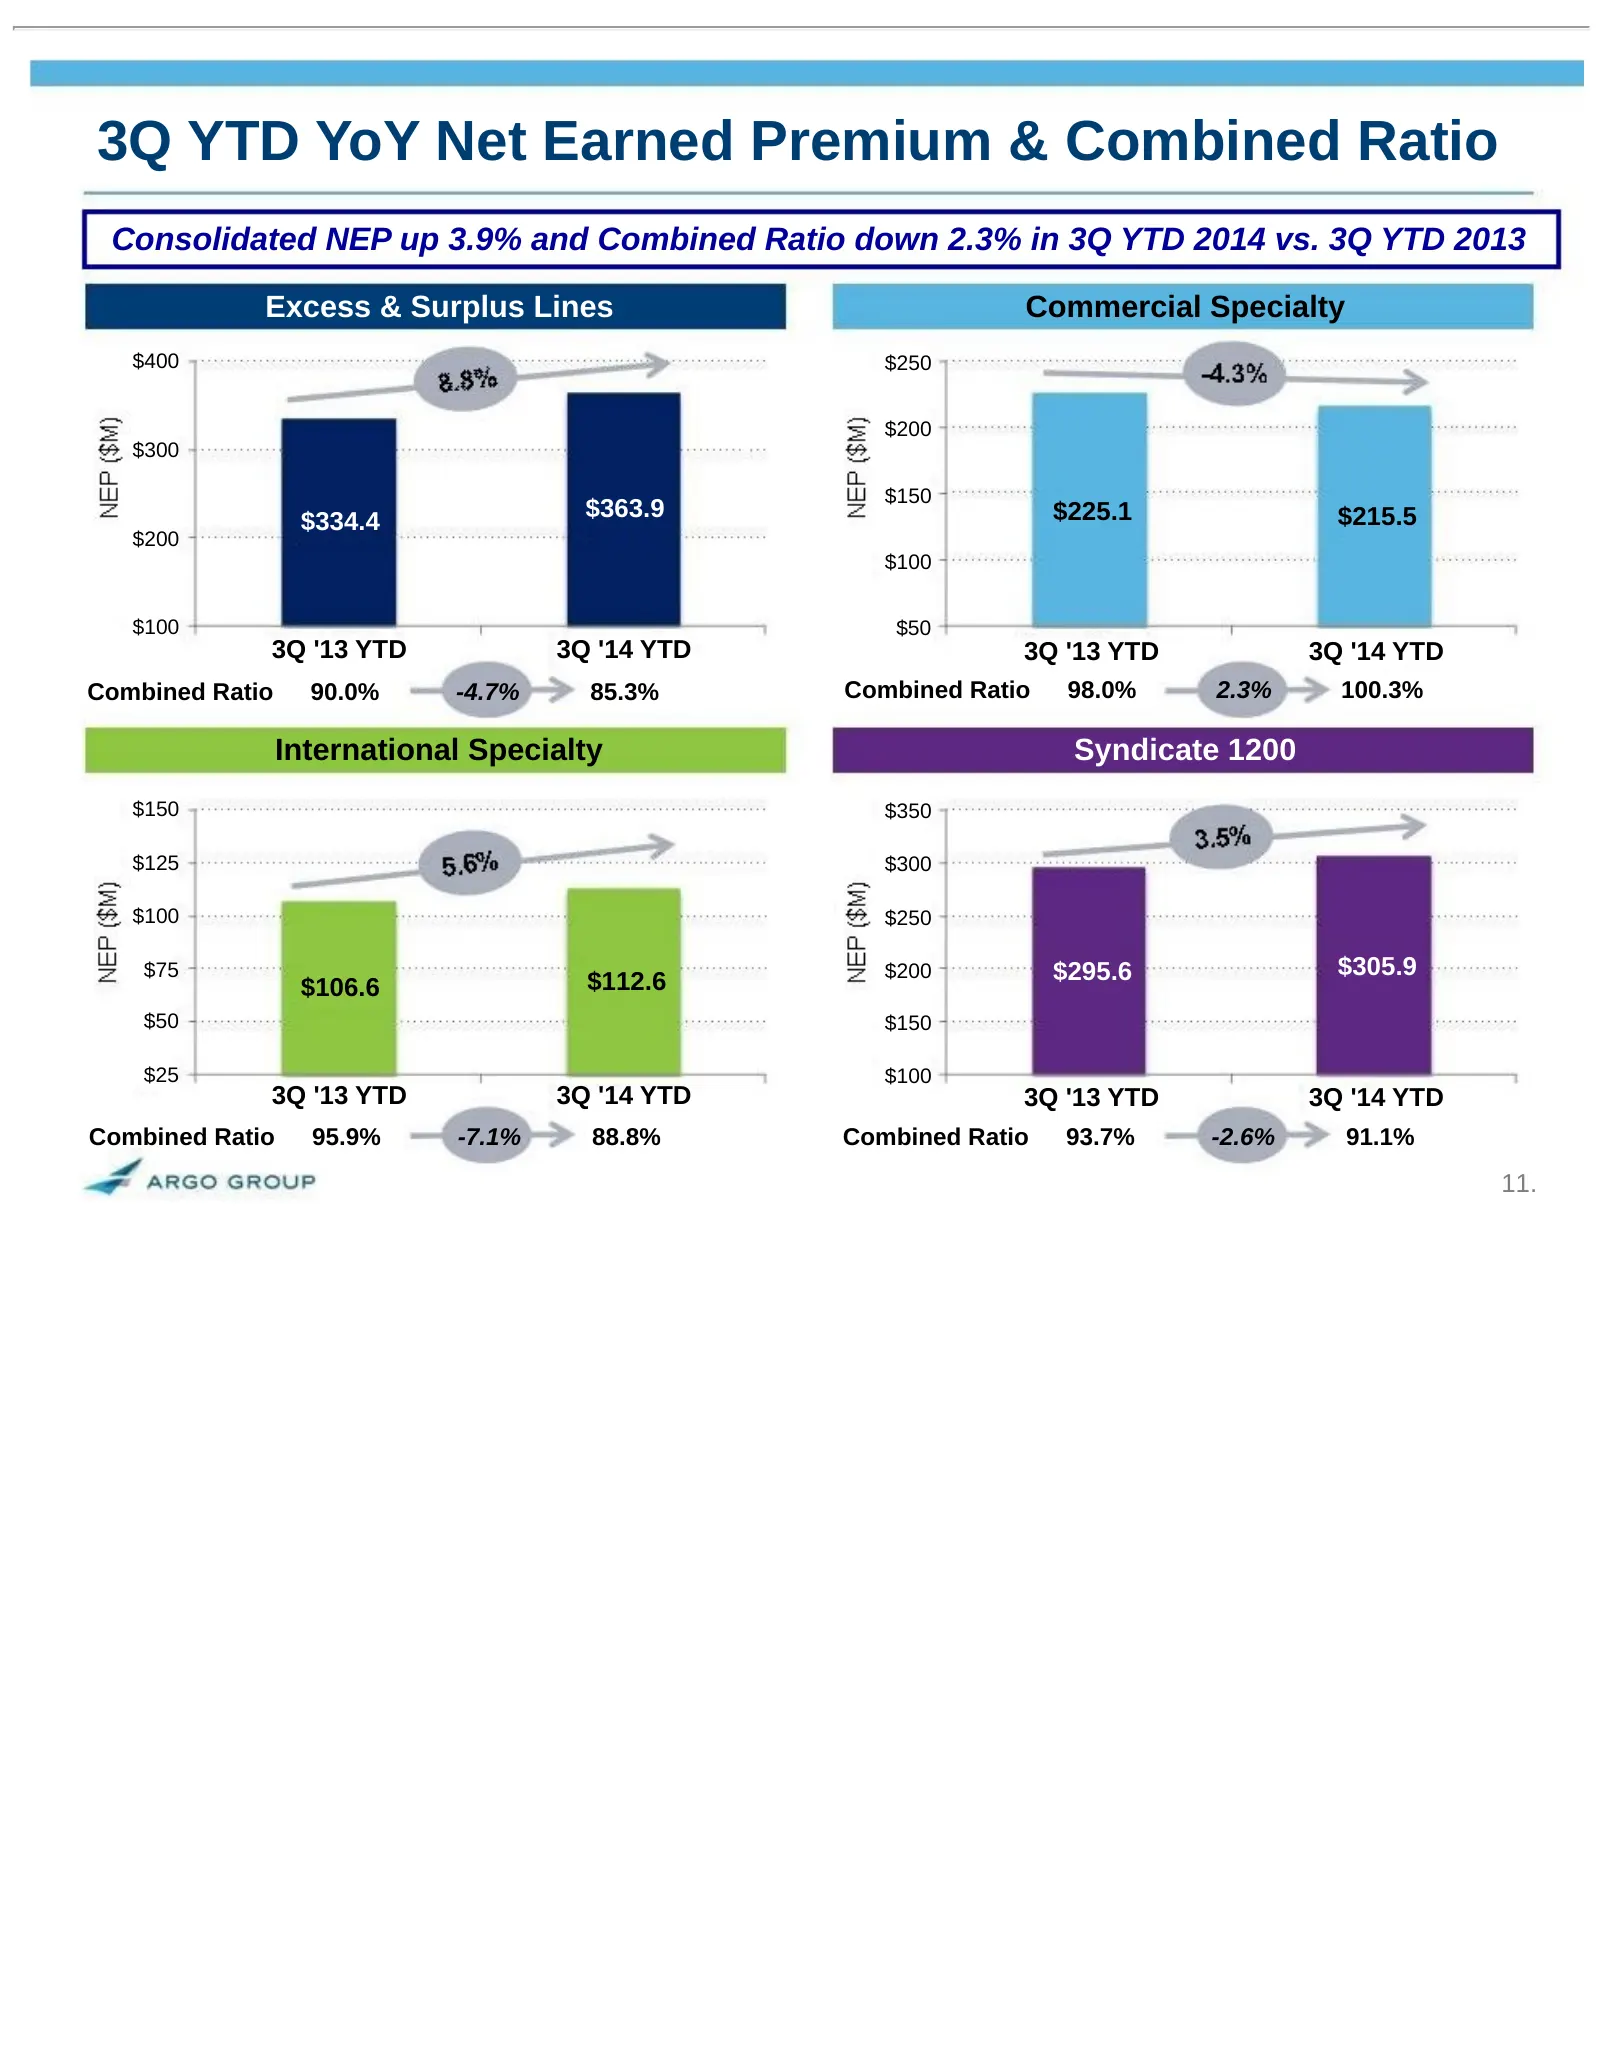
Slide 11: 3Q YTD YoY Net Earned Premium & Combined Ratio
3Q YTD YoY Net Earned Premium & Combined Ratio Consolidated NEP up 3.9% and Combined Ratio down 2.3% in 3Q YTD 2014 vs. 3Q YTD 2013 Excess & Surplus Lines Commercial Specialty $400 $250 $200 $300 $150 $334.4 $363.9 $225.1 $215.5 $200 $100 $100 $50 3Q '13 YTD 3Q '14 YTD 3Q '13 YTD 3Q '14 YTD Combined
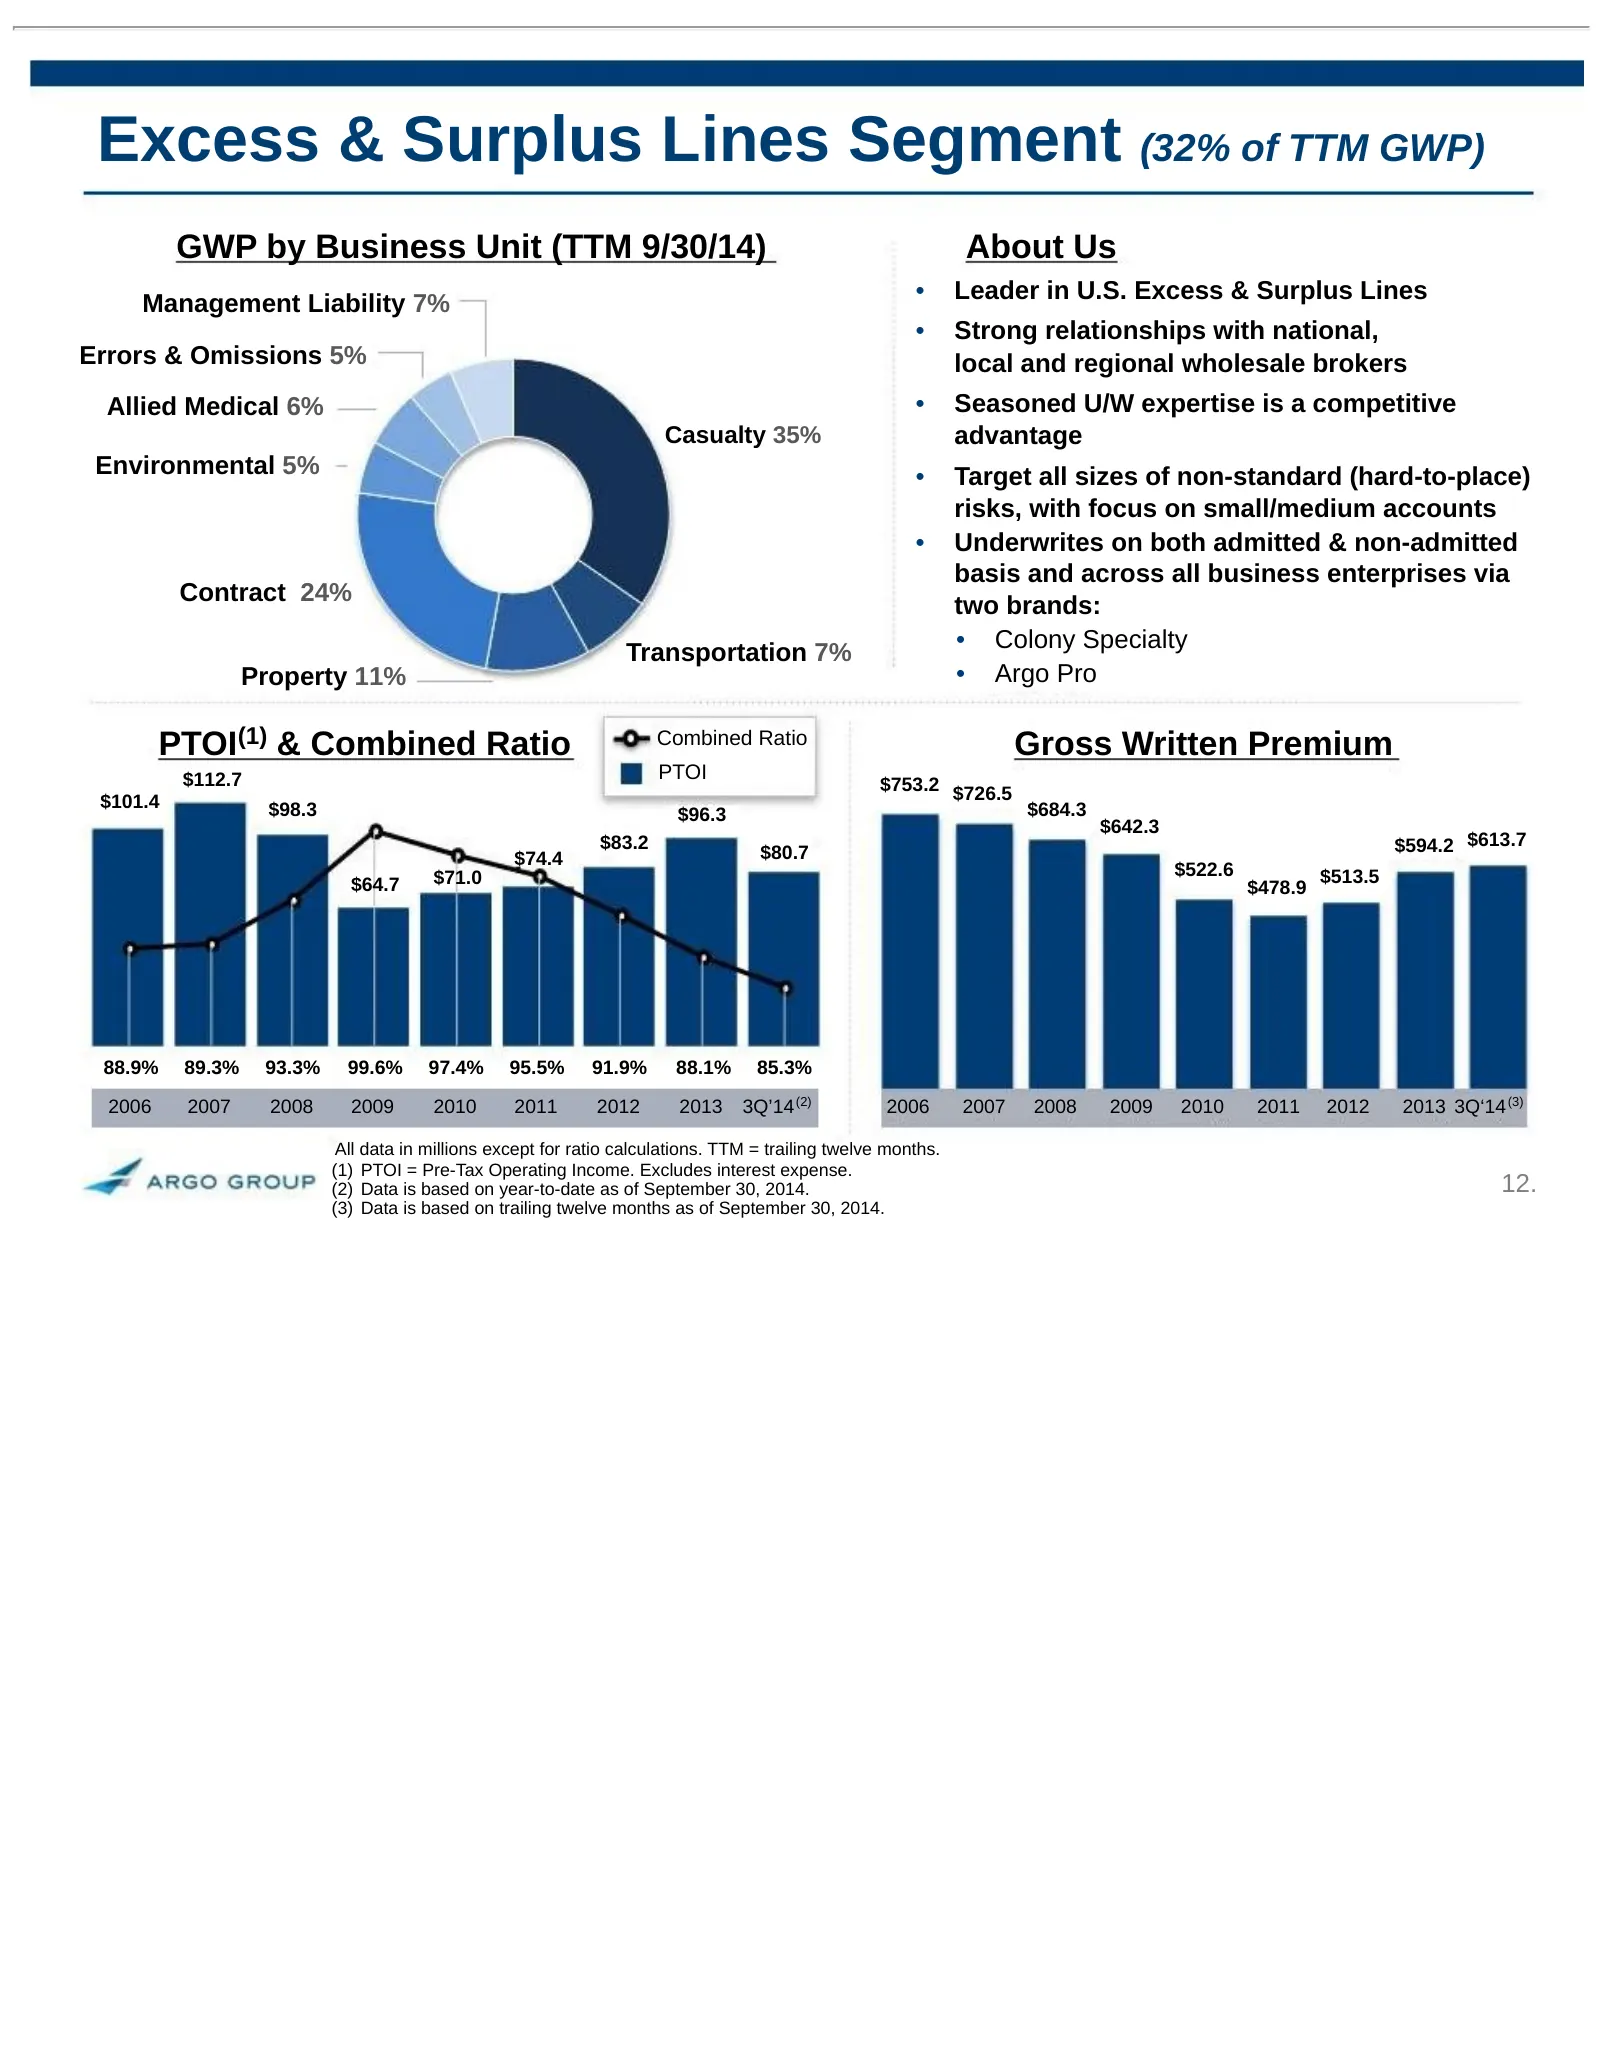
Slide 12: Excess & Surplus Lines Segment (32% of TTM GWP)
Excess & Surplus Lines Segment (32% of TTM GWP) GWP by Business Unit (TTM 9/30/14) About Us • Leader in U.S. Excess & Surplus Lines Management Liability 7% • Strong relationships with national, Errors & Omissions 5% local and regional wholesale brokers Allied Medical 6% • Seasoned U/W expertise is a
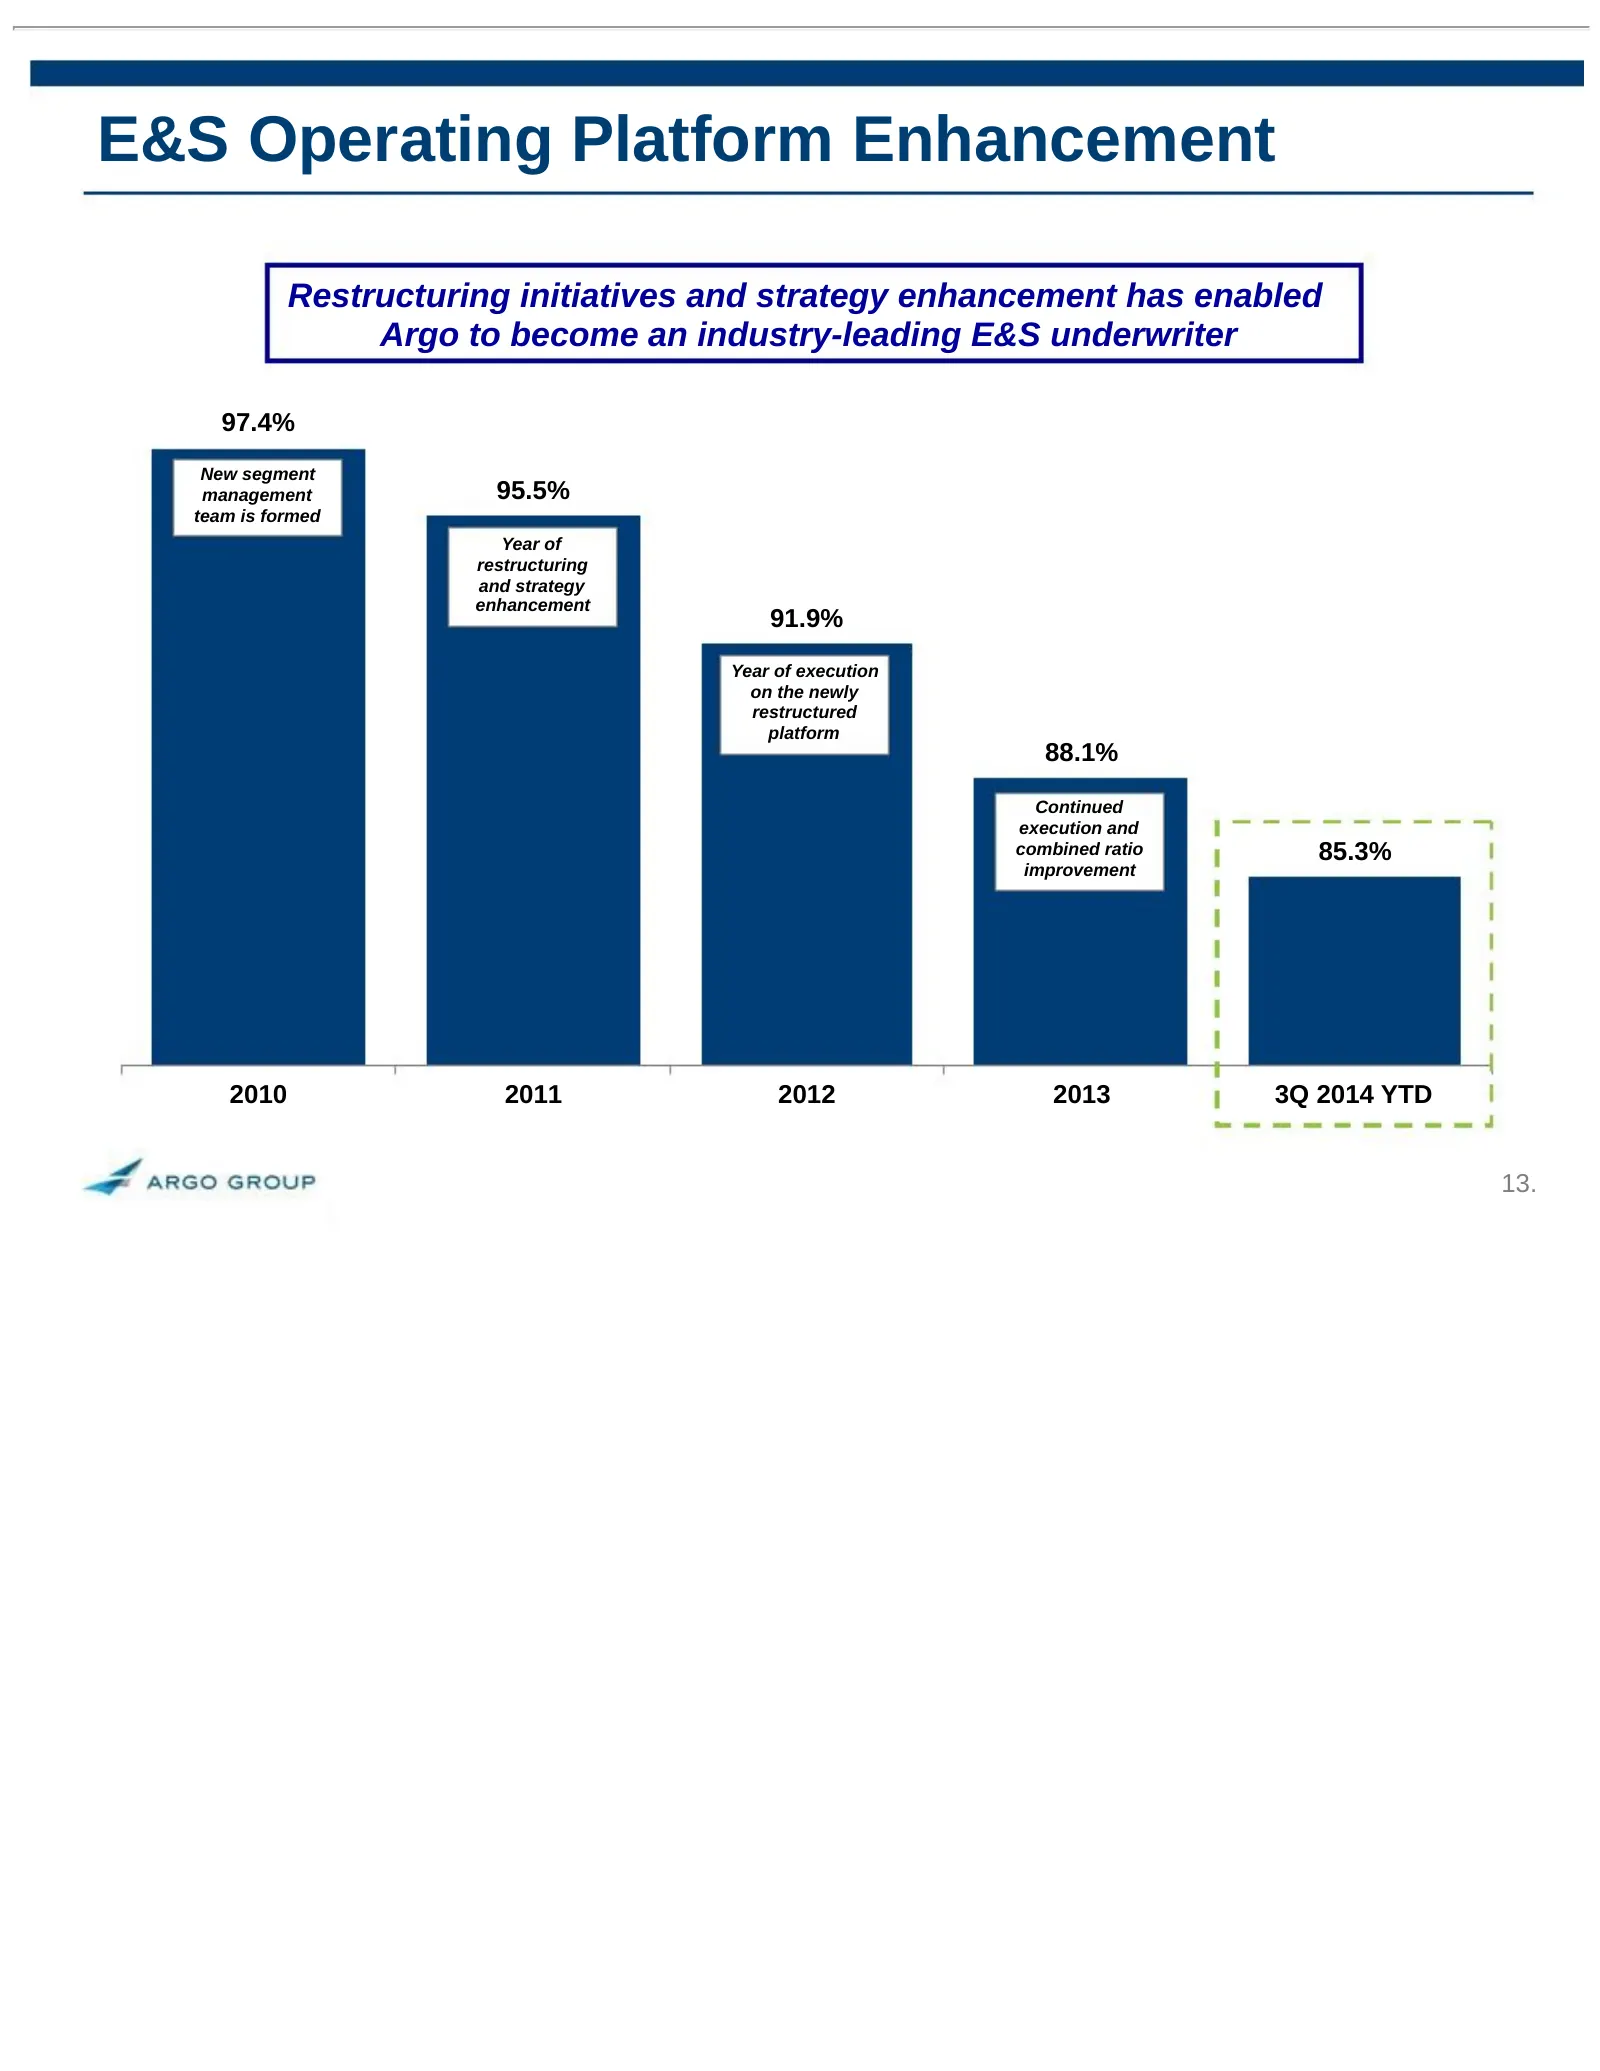
Slide 13: E&S Operating Platform Enhancement
E&S Operating Platform Enhancement Restructuring initiatives and strategy enhancement has enabled Argo to become an industry-leading E&S underwriter 97.4% New segment management 95.5% team is formed Year of restructuring and strategy enhancement 91.9% Year of execution on the newly restructured plat
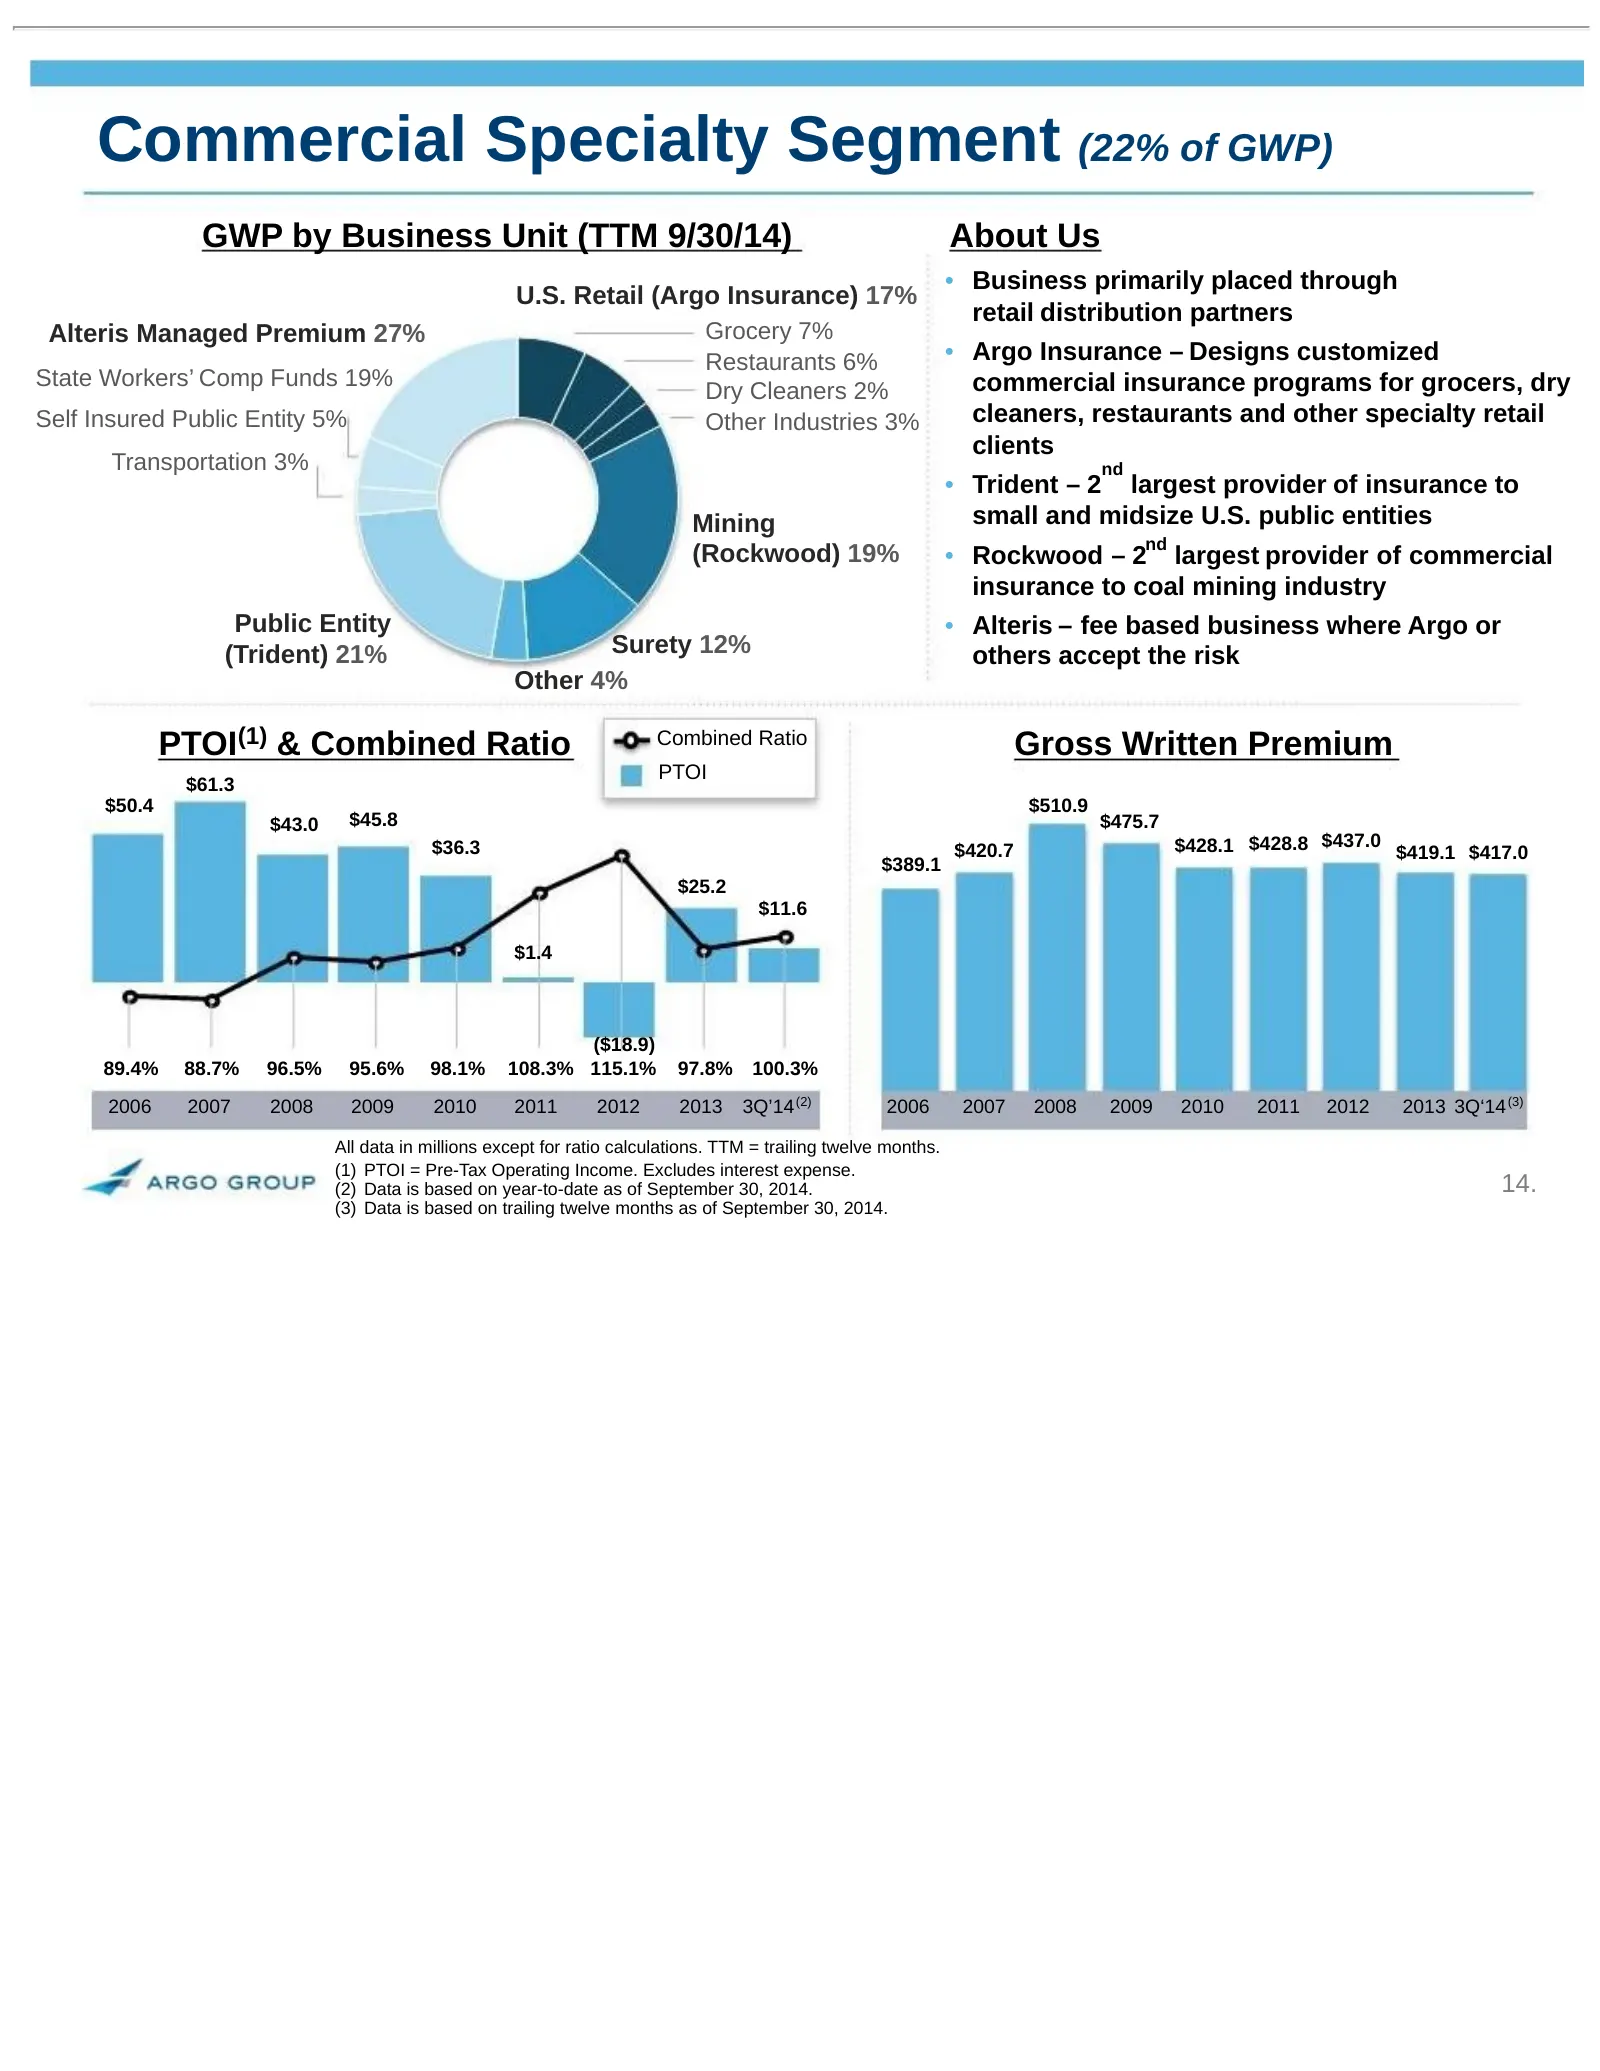
Slide 14: Commercial Specialty Segment (22% of GWP)
Commercial Specialty Segment (22% of GWP) GWP by Business Unit (TTM 9/30/14) About Us • Business primarily placed through U.S. Retail (Argo Insurance) 17% retail distribution partners Alteris Managed Premium 27% Grocery 7% Restaurants 6% • Argo Insurance – Designs customized State Workers’ Comp Fund
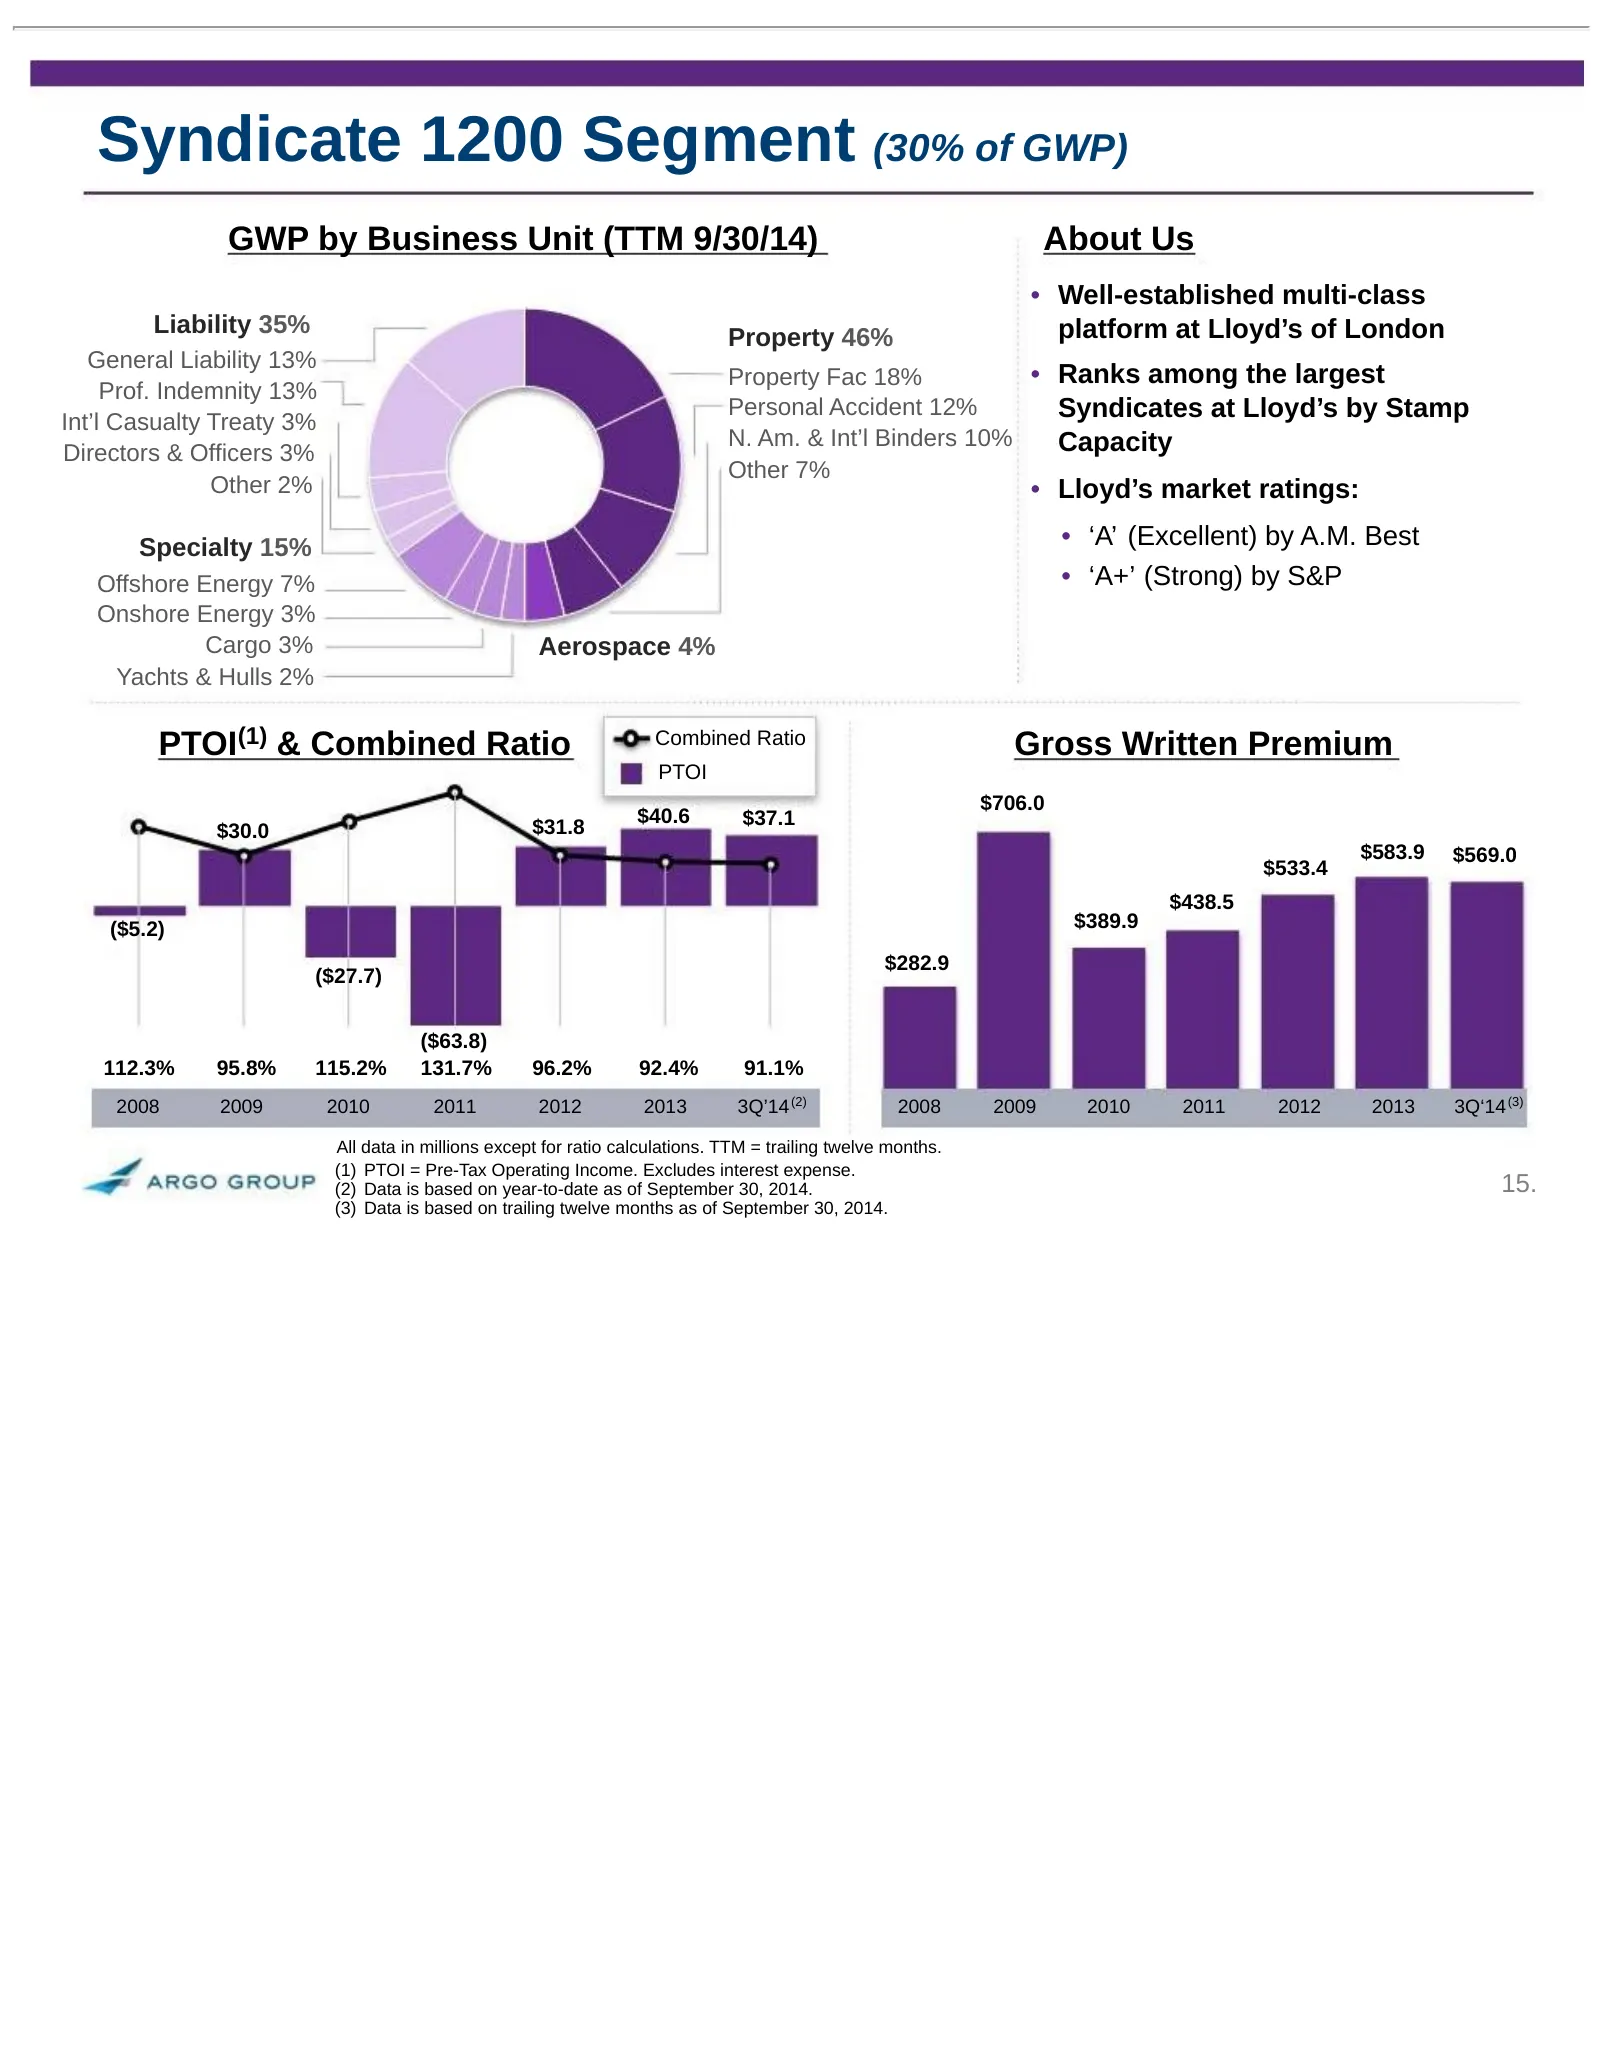
Slide 15: Syndicate 1200 Segment (30% of GWP)
Syndicate 1200 Segment (30% of GWP) GWP by Business Unit (TTM 9/30/14) About Us • Well-established multi-class Liability 35% Property 46% platform at Lloyd’s of London General Liability 13% Property Fac 18% • Ranks among the largest Prof. Indemnity 13% Int’l Casualty Treaty 3% Personal Accident 12%
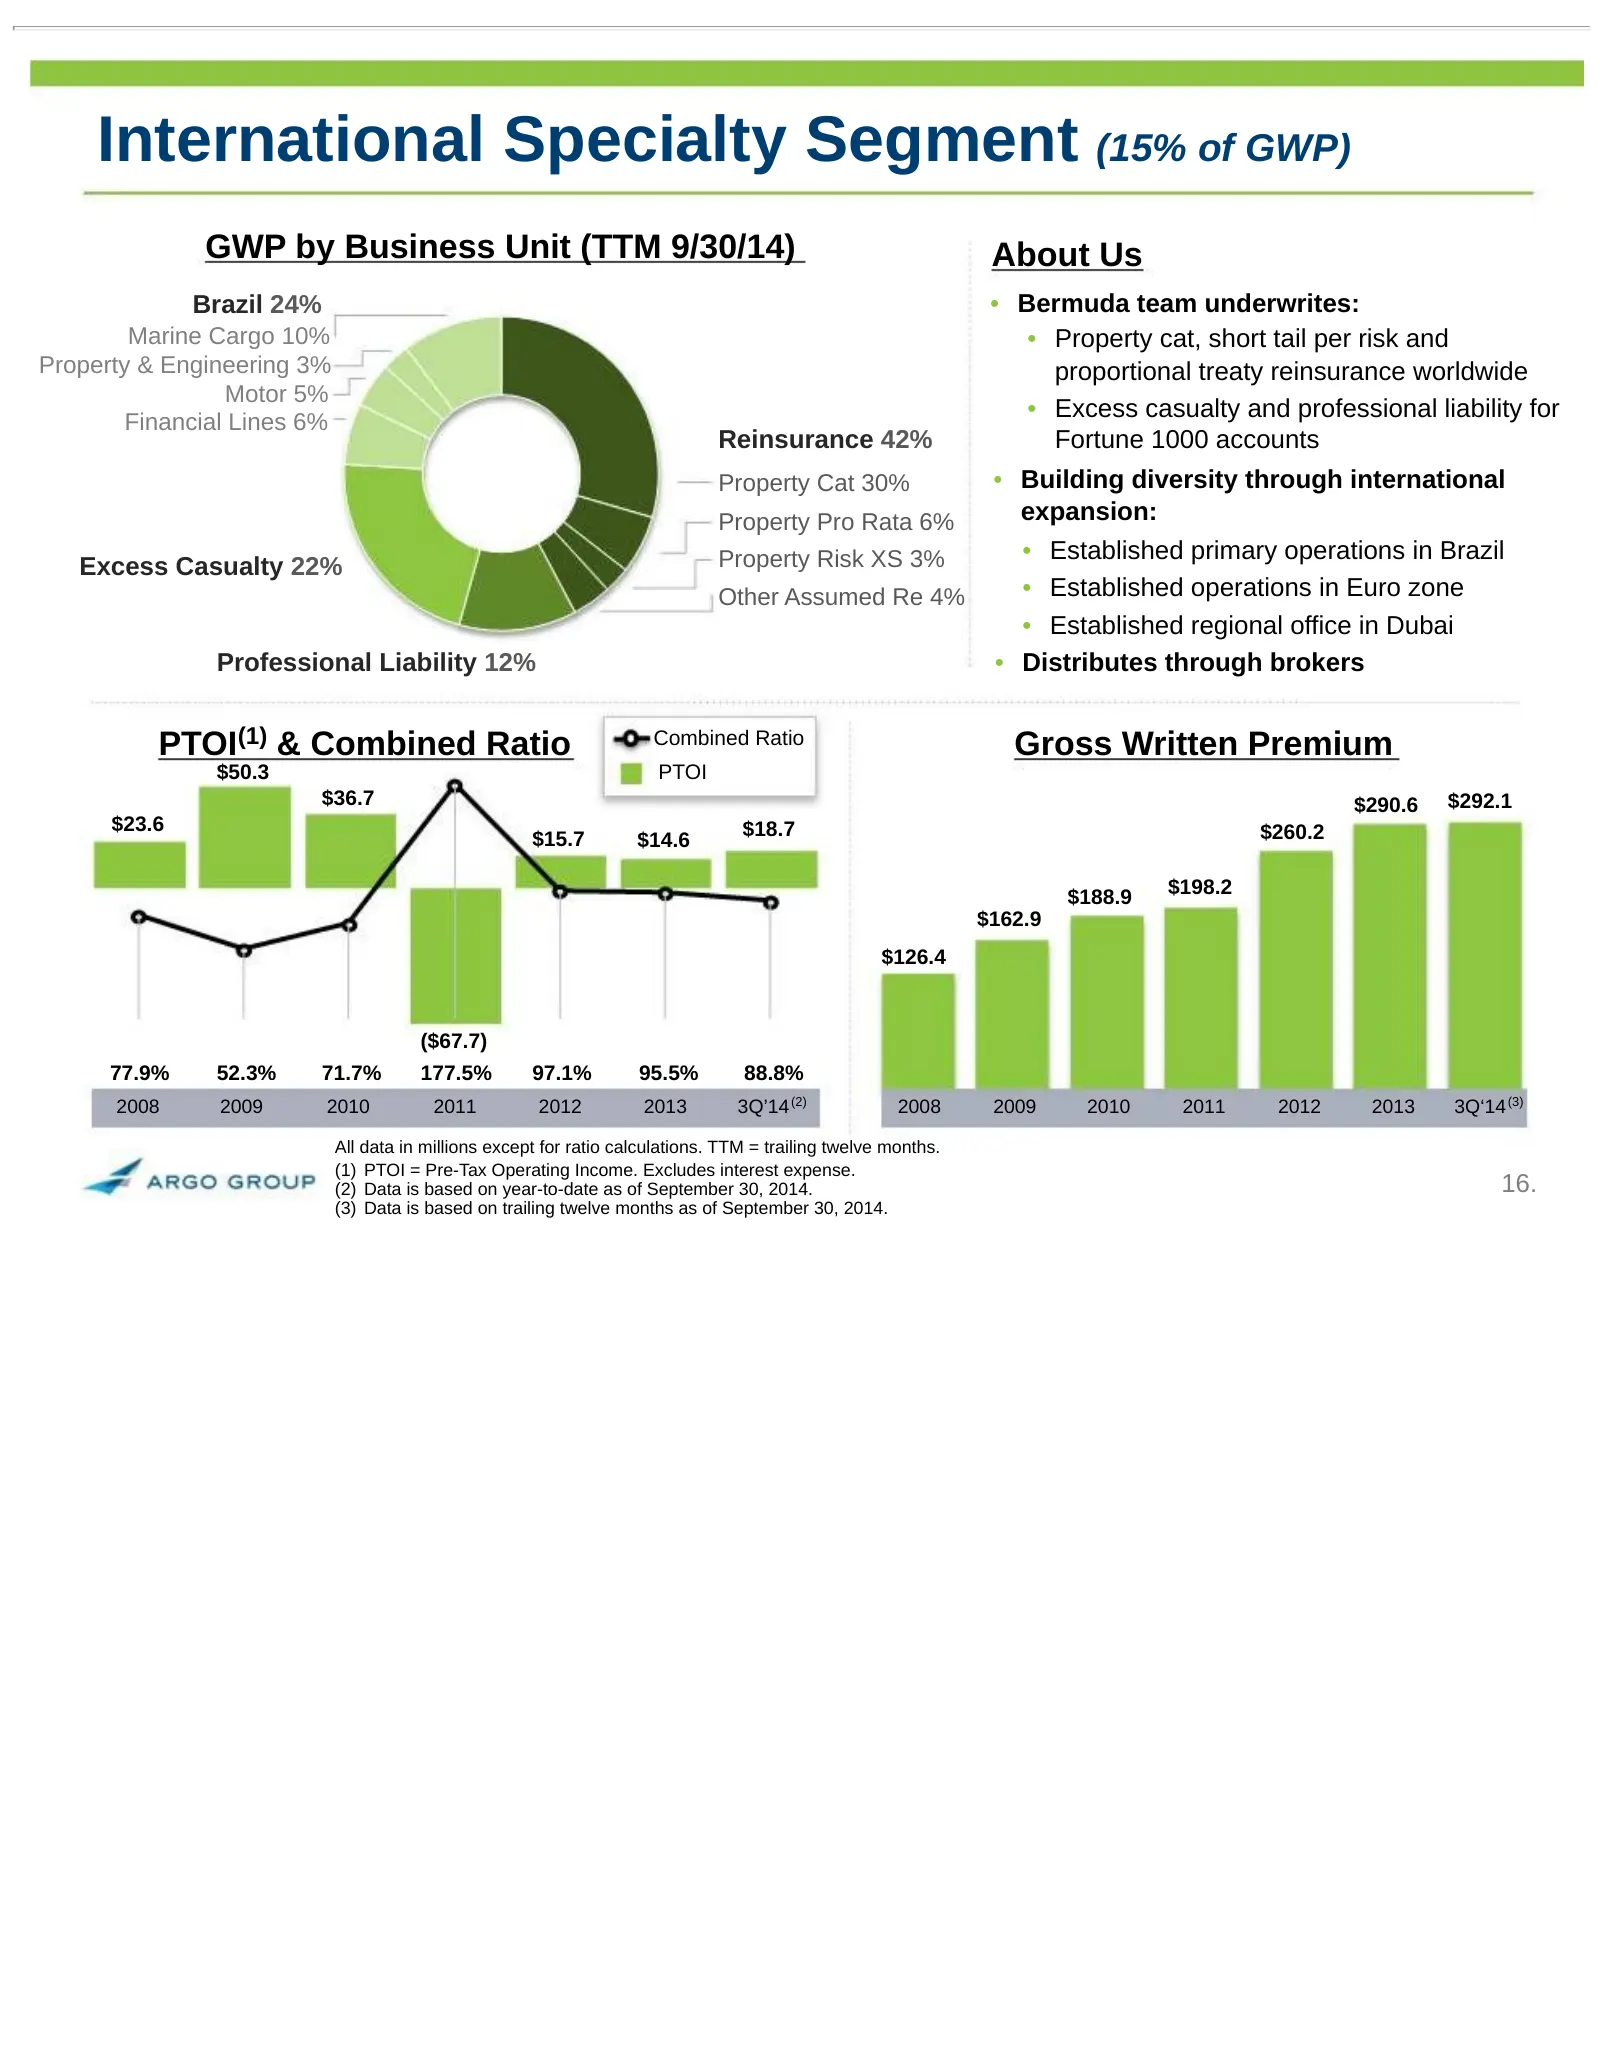
Slide 16: International Specialty Segment (15% of GWP)
International Specialty Segment (15% of GWP) GWP by Business Unit (TTM 9/30/14) About Us Brazil 24% • Bermuda team underwrites: Marine Cargo 10% • Property cat, short tail per risk and Property & Engineering 3% proportional treaty reinsurance worldwide Motor 5% Financial Lines 6% • Excess casualty a
Slide 17: 3Q 2014 Operating Results
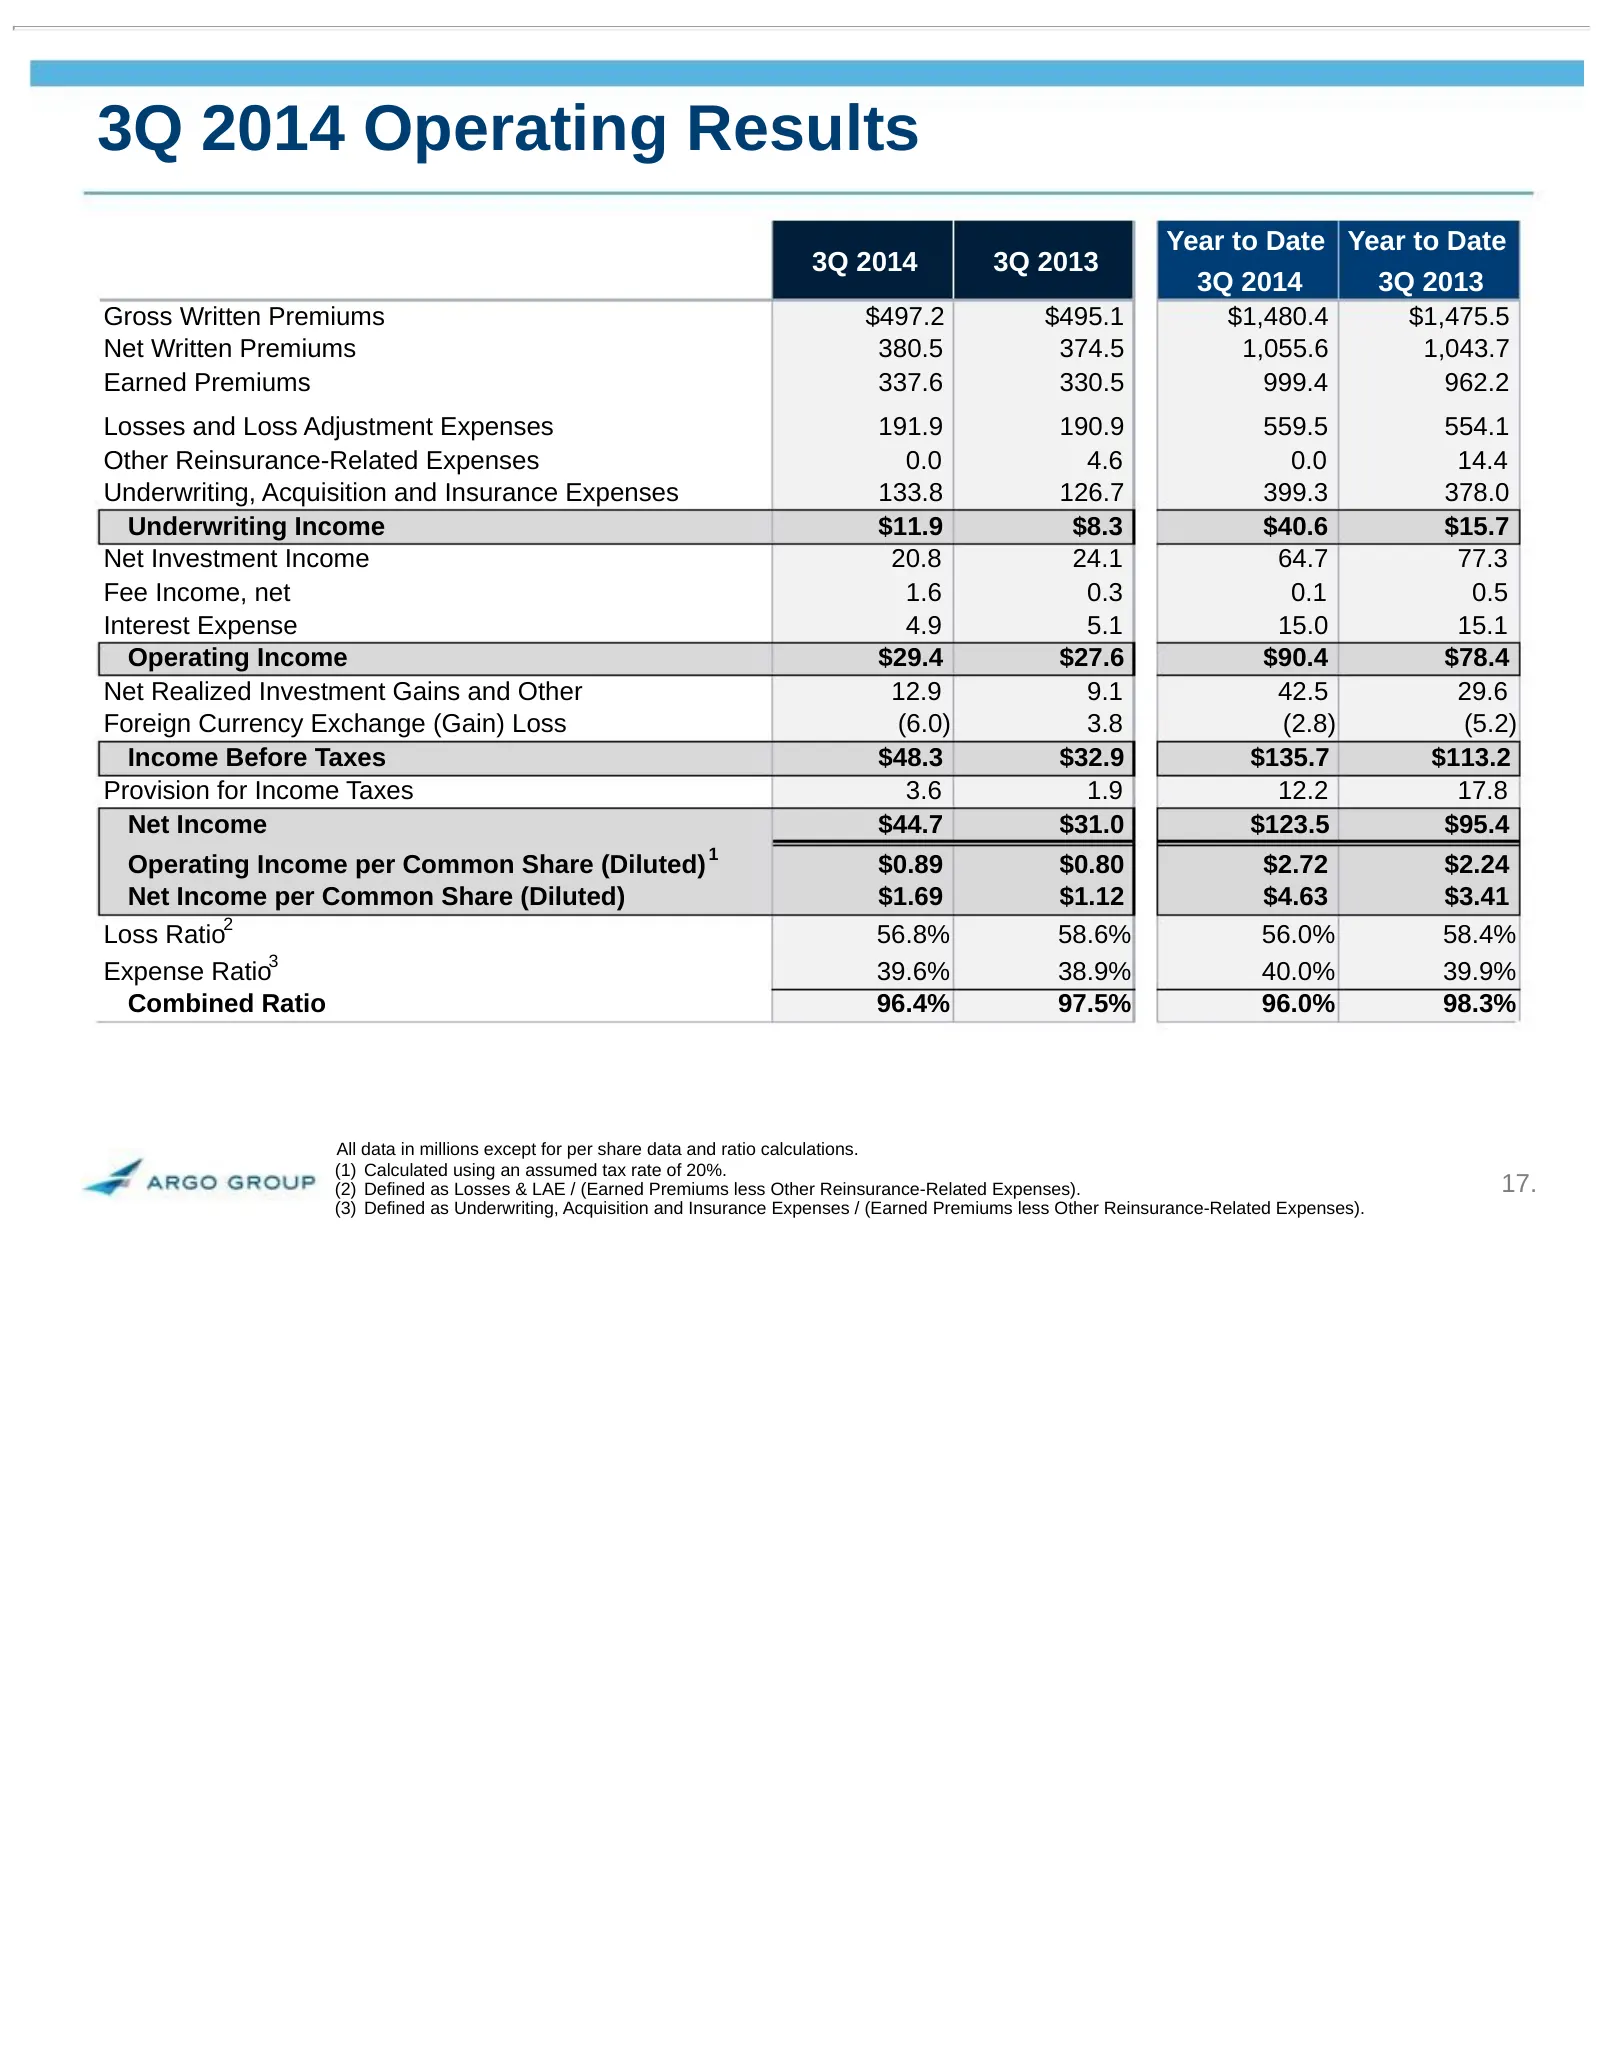
3Q 2014 Operating Results Year to Date Year to Date 3Q 2014 3Q 2013 3Q 2014 3Q 2013 Gross Written Premiums $497.2 $495.1 $1,480.4 $1,475.5 Net Written Premiums 380.5 374.5 1,055.6 1,043.7 Earned Premiums 337.6 330.5 999.4 962.2 Losses and Loss Adjustment Expenses 191.9 190.9 559.5 554.1 Other Reinsu
Slide 18: Conservative Investment Strategy
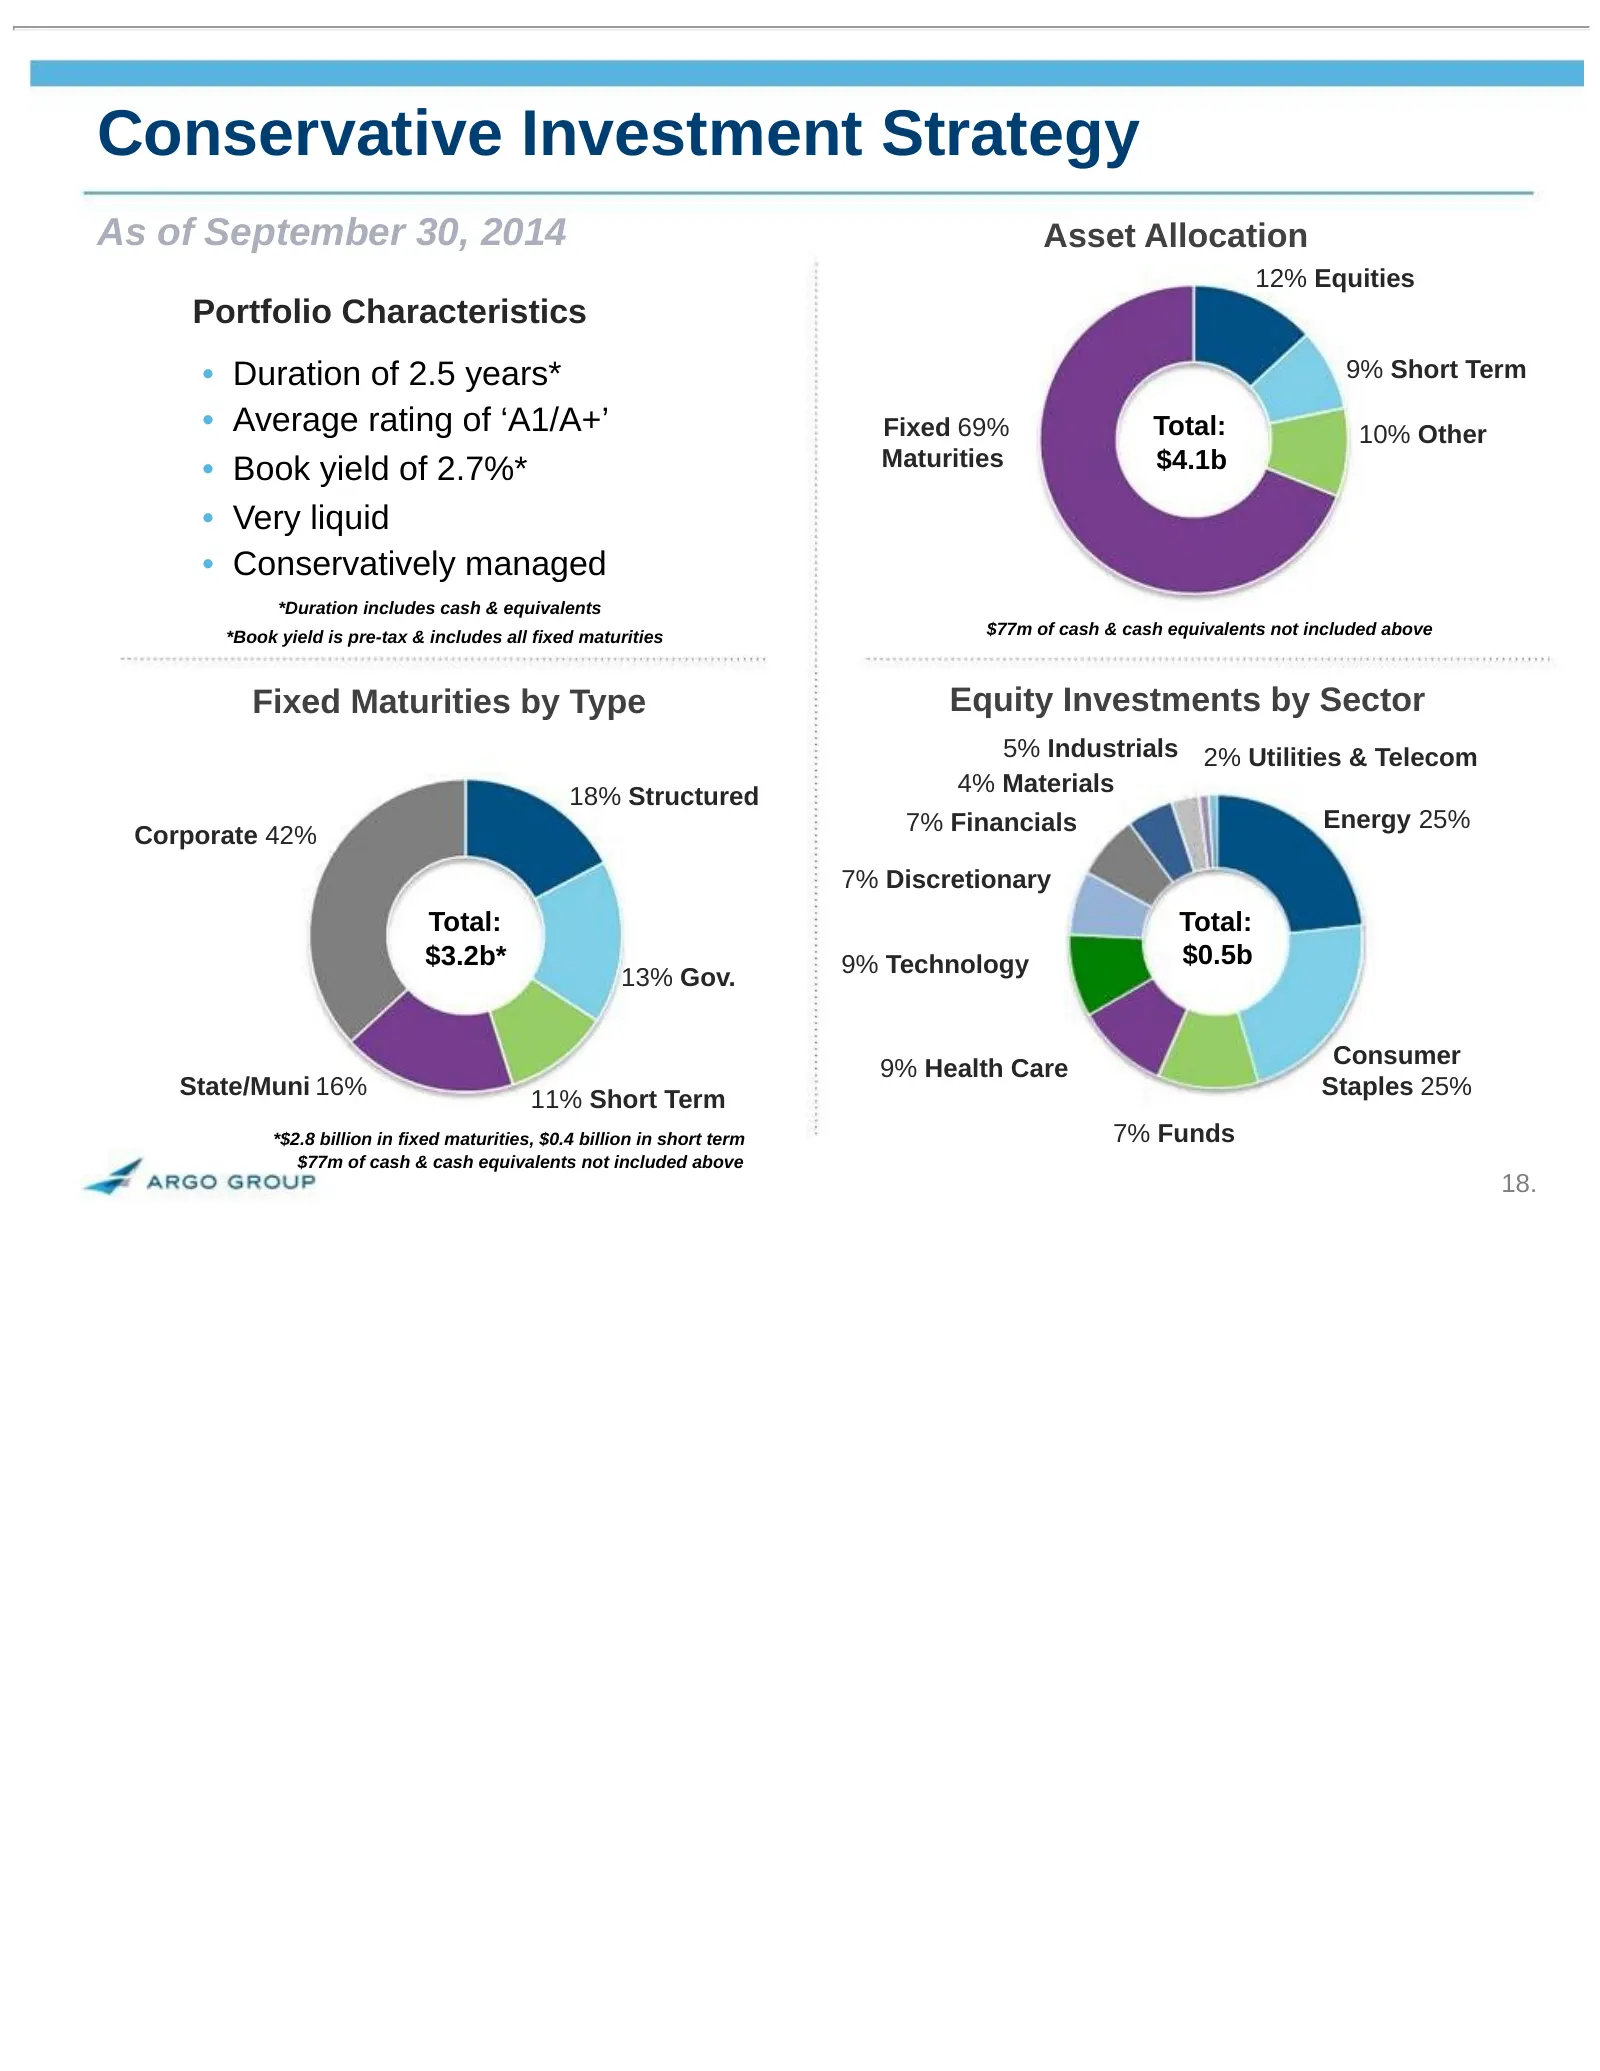
Conservative Investment Strategy As of September 30, 2014 Asset Allocation 12% Equities Portfolio Characteristics • Duration of 2.5 years* 9% Short Term • Average rating of 17% ‘A1/A+’ Fixed 69% Total: 10% Other Maturities. $4.1b • Book yield of 2.7%* • Very liquid • Conservatively managed *Duration
Slide 19: Active Capital Management
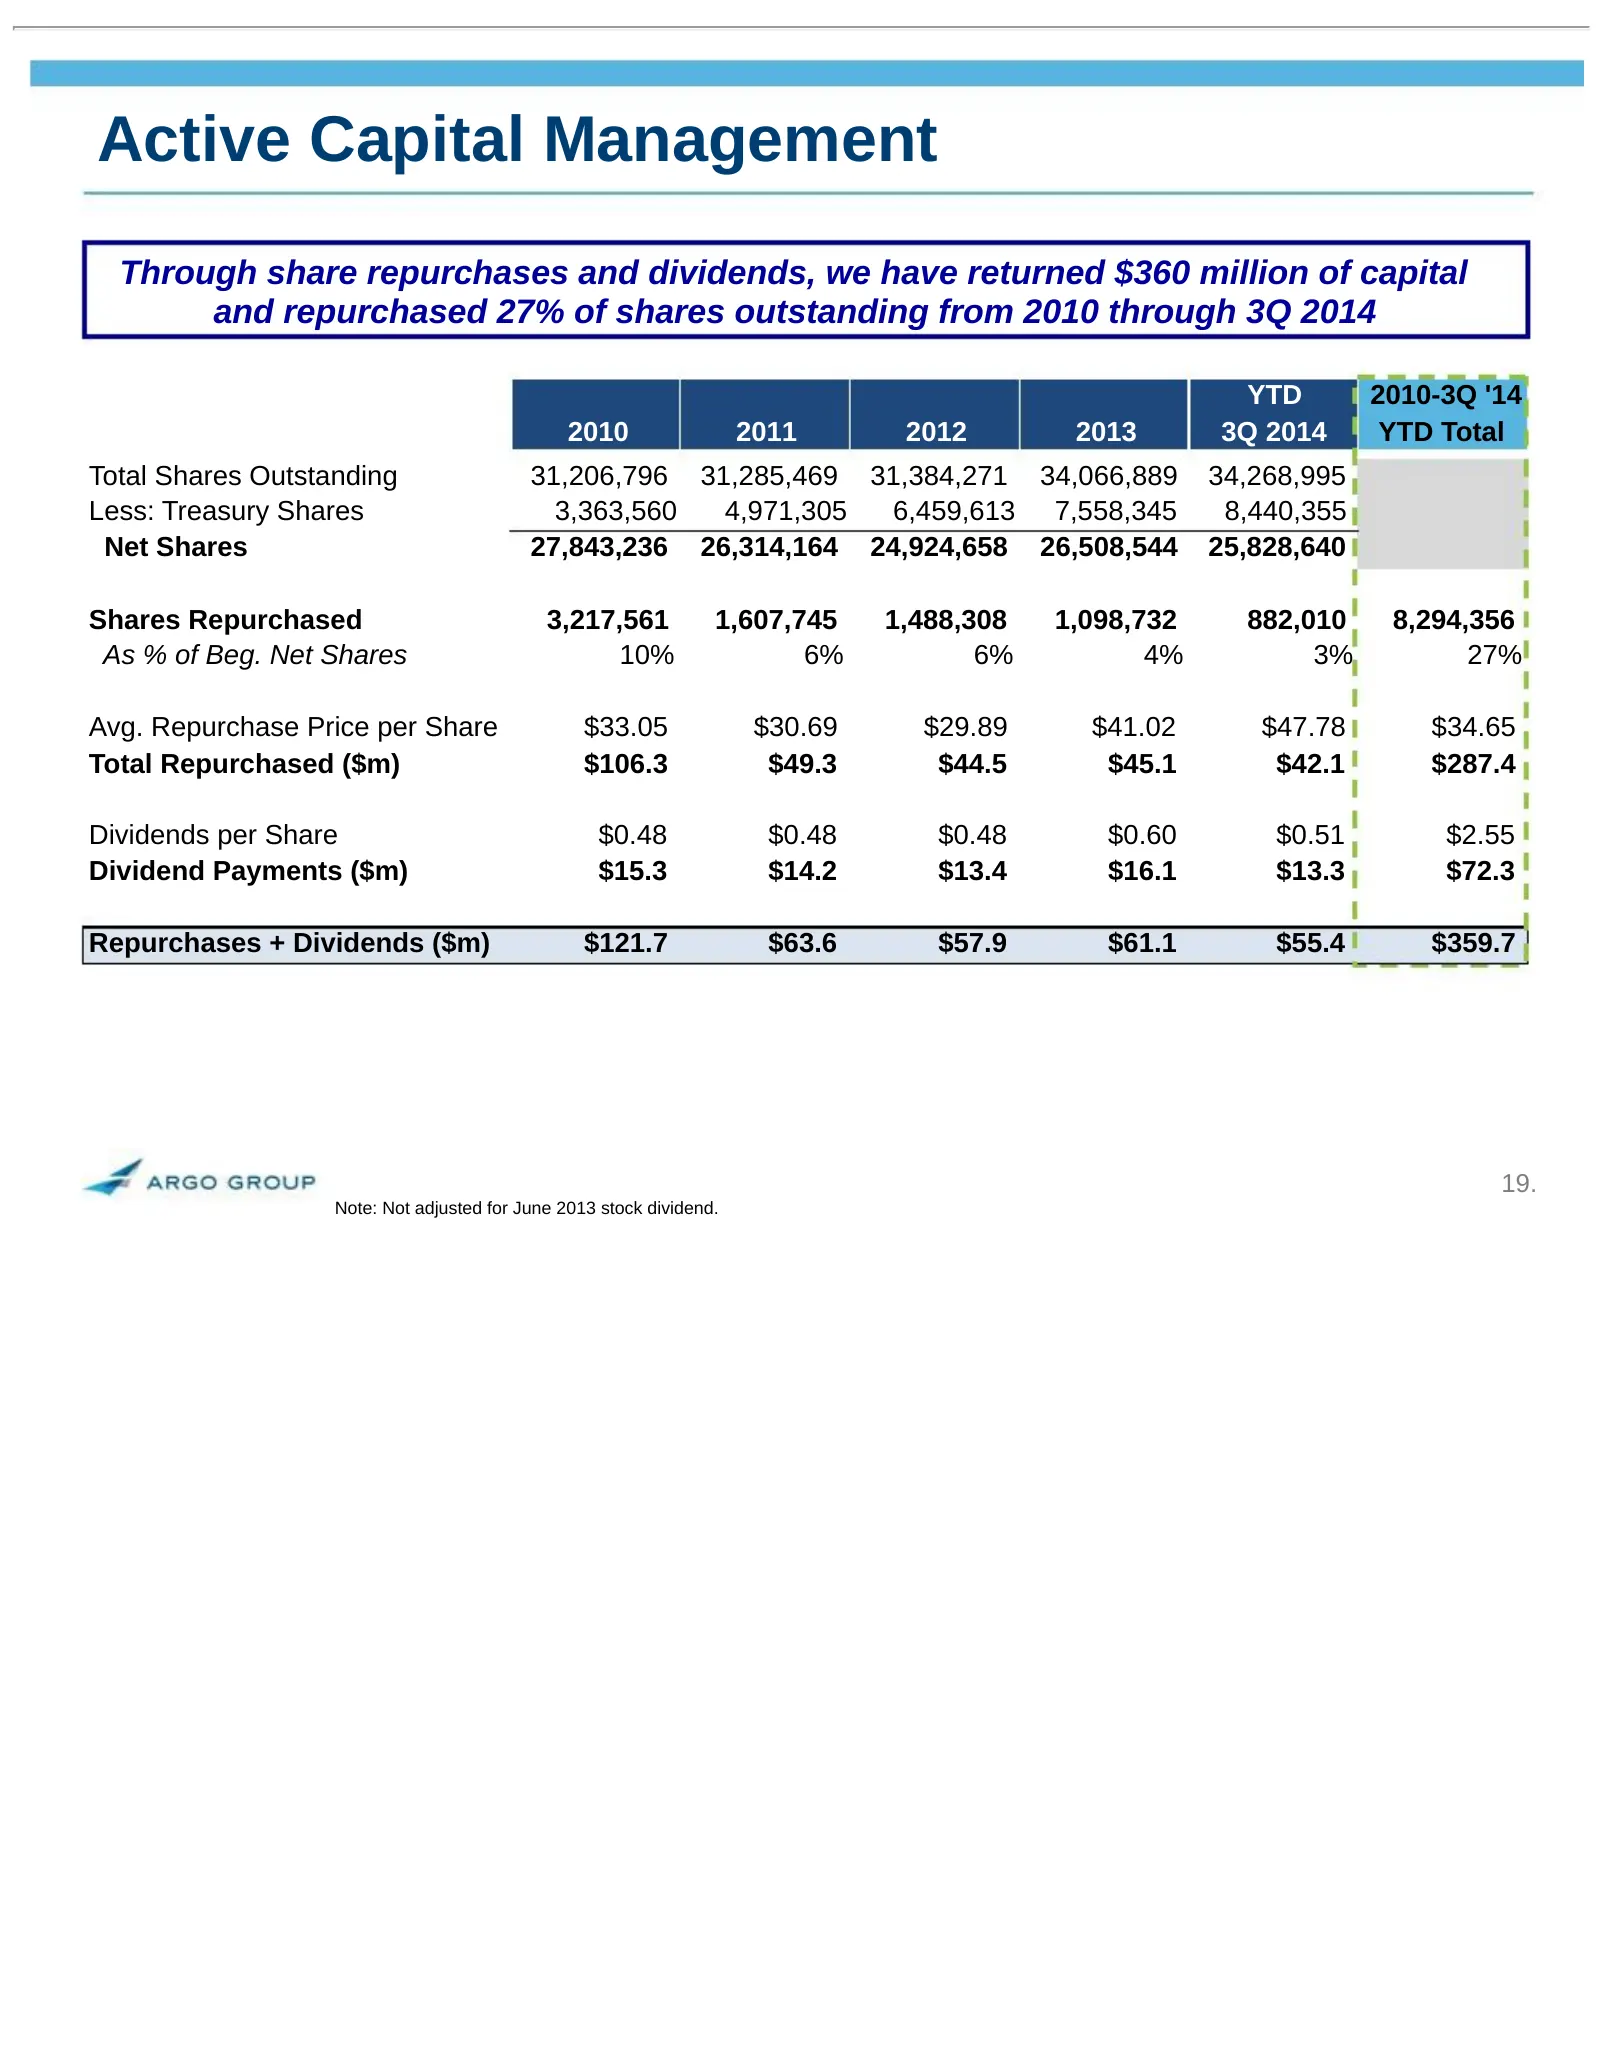
Active Capital Management Through share repurchases and dividends, we have returned $360 million of capital and repurchased 27% of shares outstanding from 2010 through 3Q 2014 YTD 2010-3Q '14 2010 2011 2012 2013 3Q 2014 YTD Total Total Shares Outstanding 31,206,796 31,285,469 31,384,271 34,066,889 3
Slide 20: Stock Price Performance – Last 2 Years
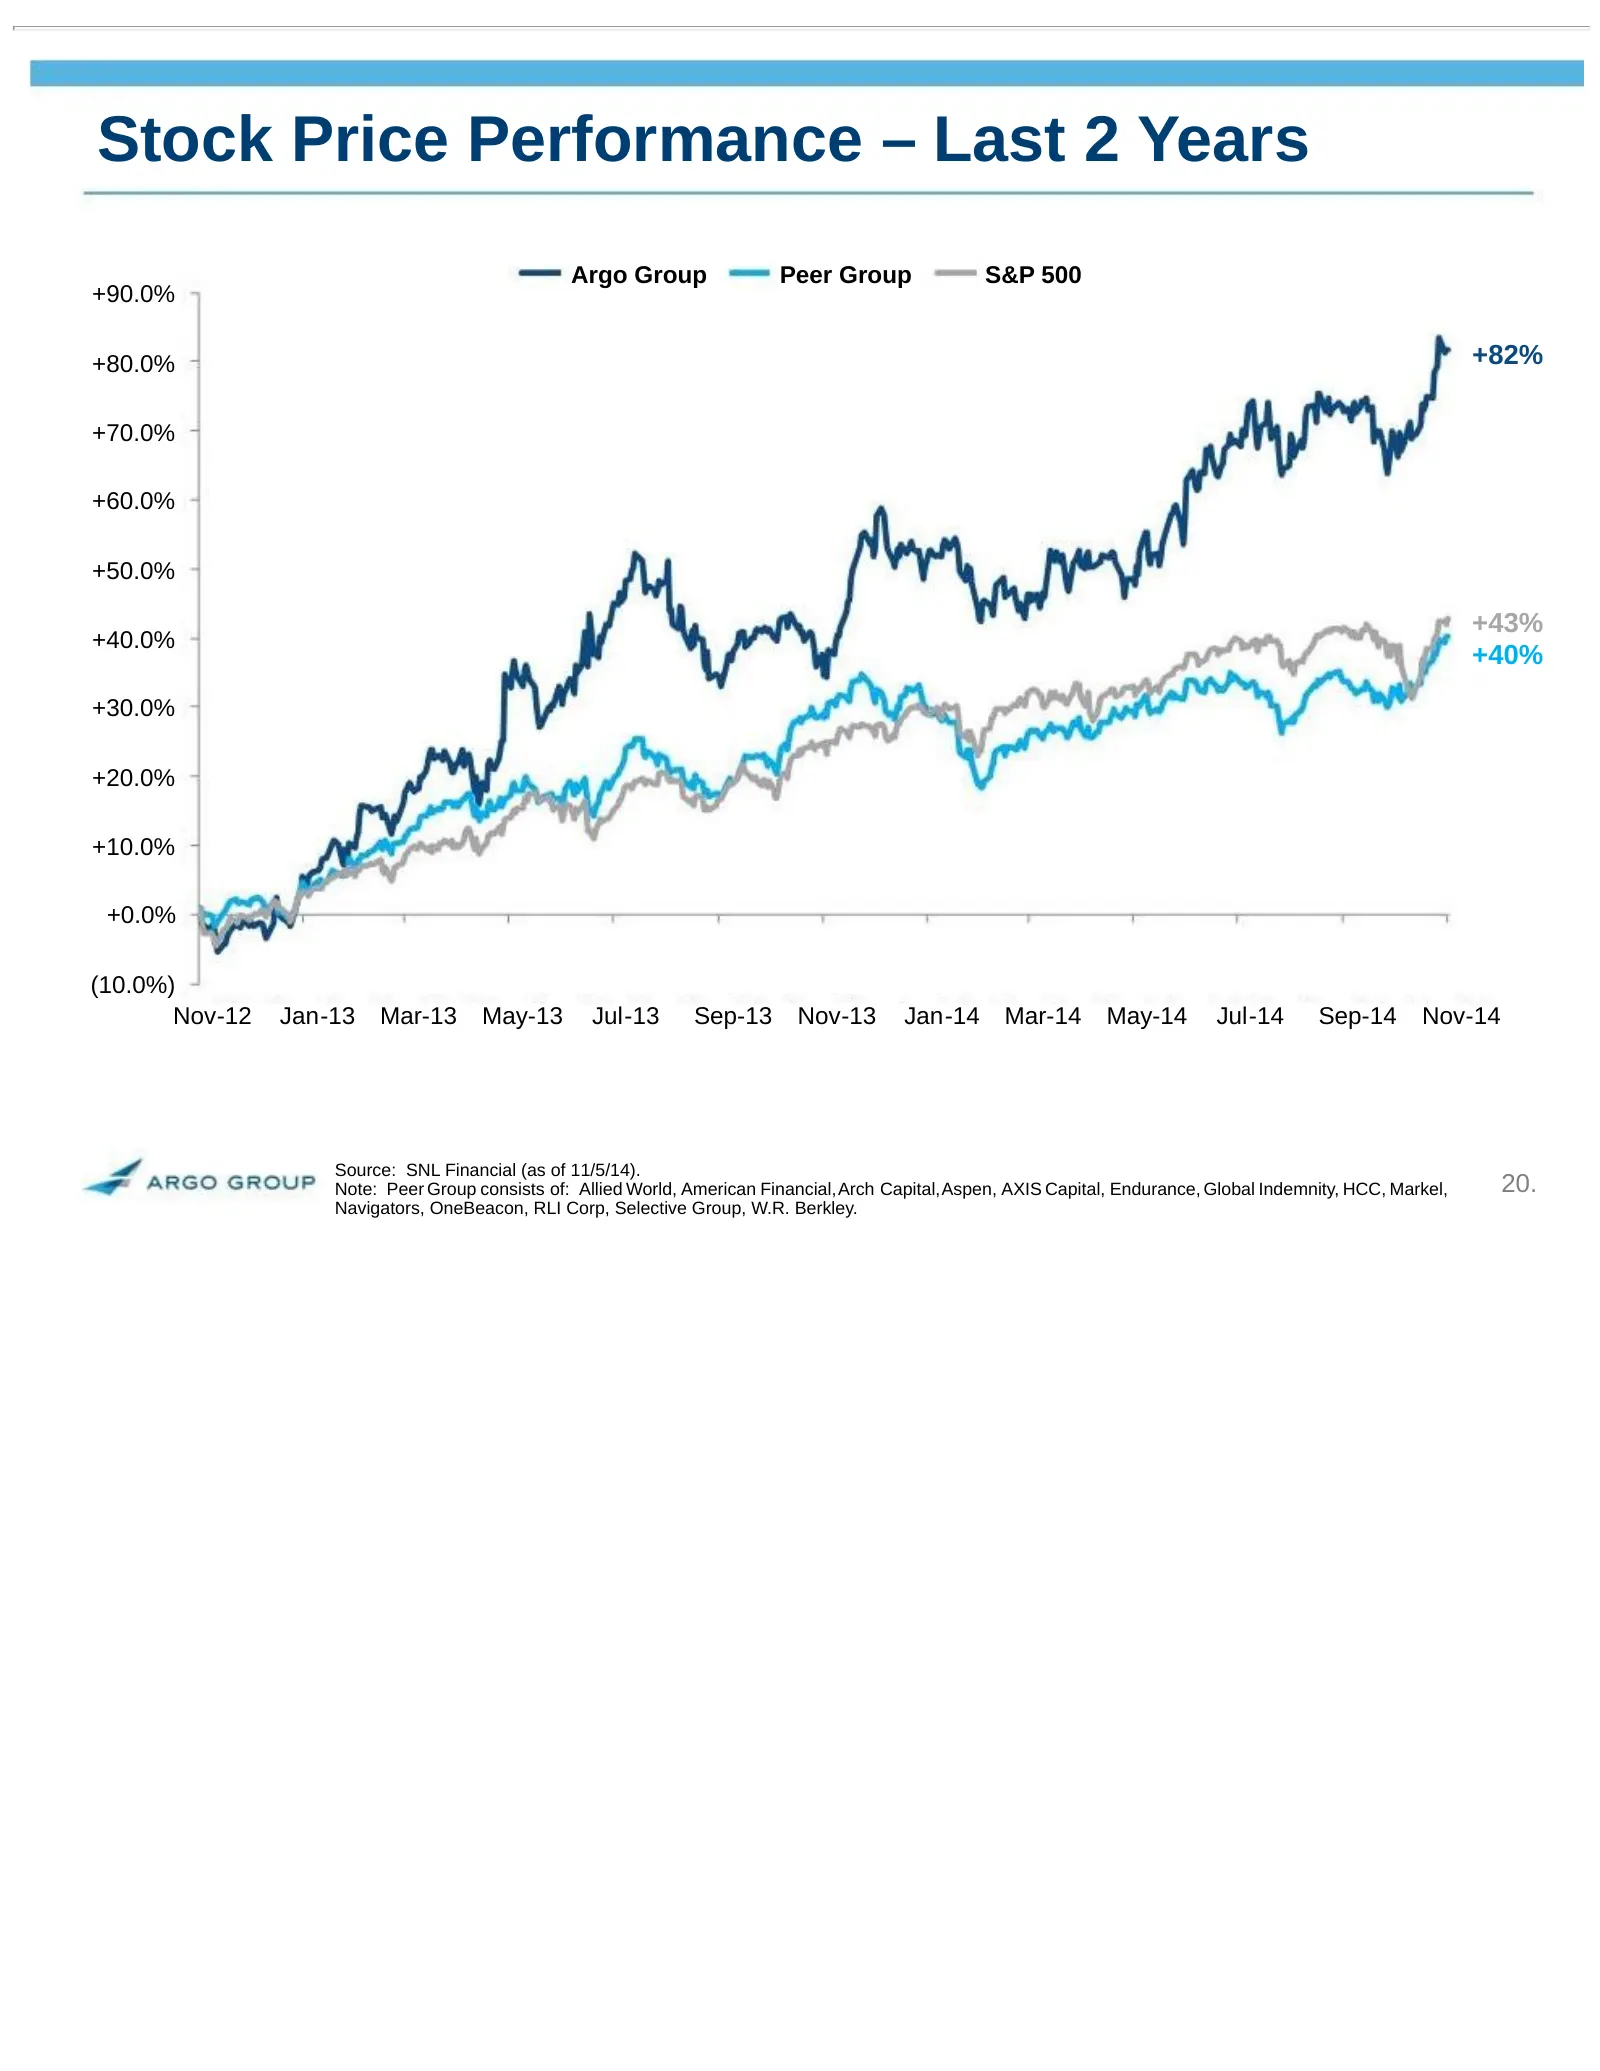
Stock Price Performance – Last 2 Years Argo Group Peer Group S&P 500 +90.0% +80.0% +82% +70.0% +60.0% +50.0% +43% +40.0% +40% +30.0% +20.0% +10.0% +0.0% (10.0%) Nov-12 Jan-13 Mar-13 May-13 Jul-13 Sep-13 Nov-13 Jan-14 Mar-14 May-14 Jul-14 Sep-14 Nov-14 Source: SNL Financial (as of 11/5/14). Note: Pee
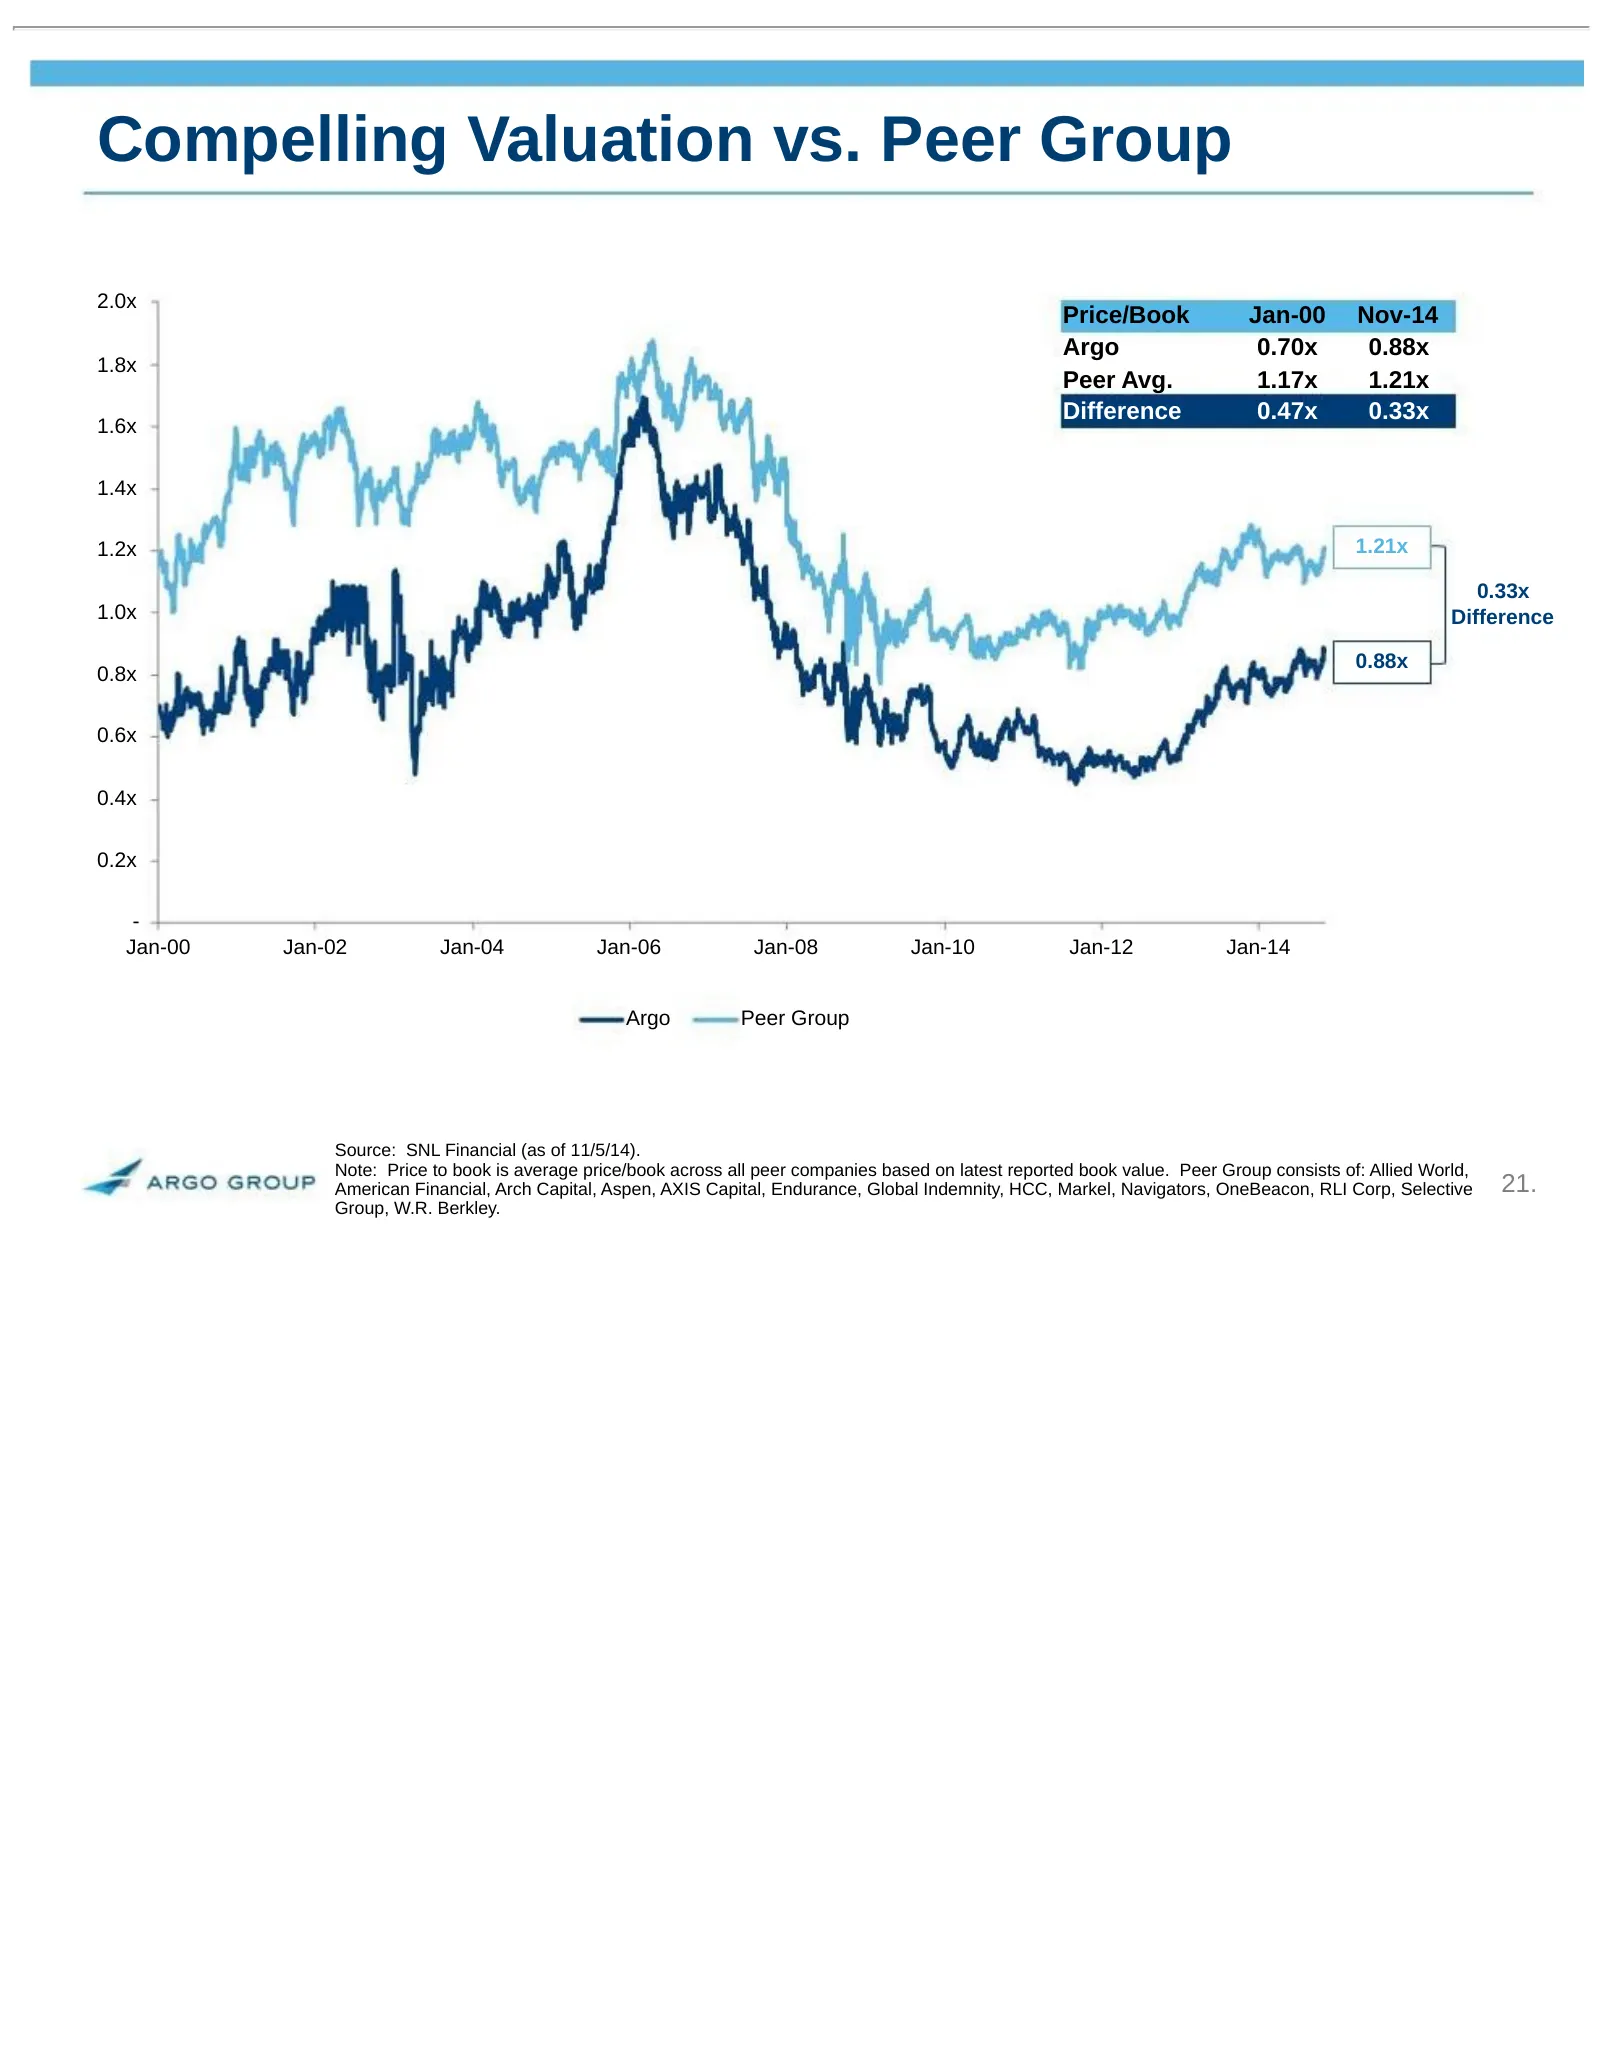
Slide 21: Compelling Valuation vs. Peer Group
Compelling Valuation vs. Peer Group 2.0x Price/Book Jan-00 Nov-14 Argo 0.70x 0.88x 1.8x Peer Avg. 1.17x 1.21x Difference 0.47x 0.33x 1.6x 1.4x 1.2x 1.21x 0.33x 1.0x Difference 0.88x 0.8x 0.6x 0.4x 0.2x - Jan-00 Jan-02 Jan-04 Jan-06 Jan-08 Jan-10 Jan-12 Jan-14 Argo Peer Group Source: SNL Financial (a
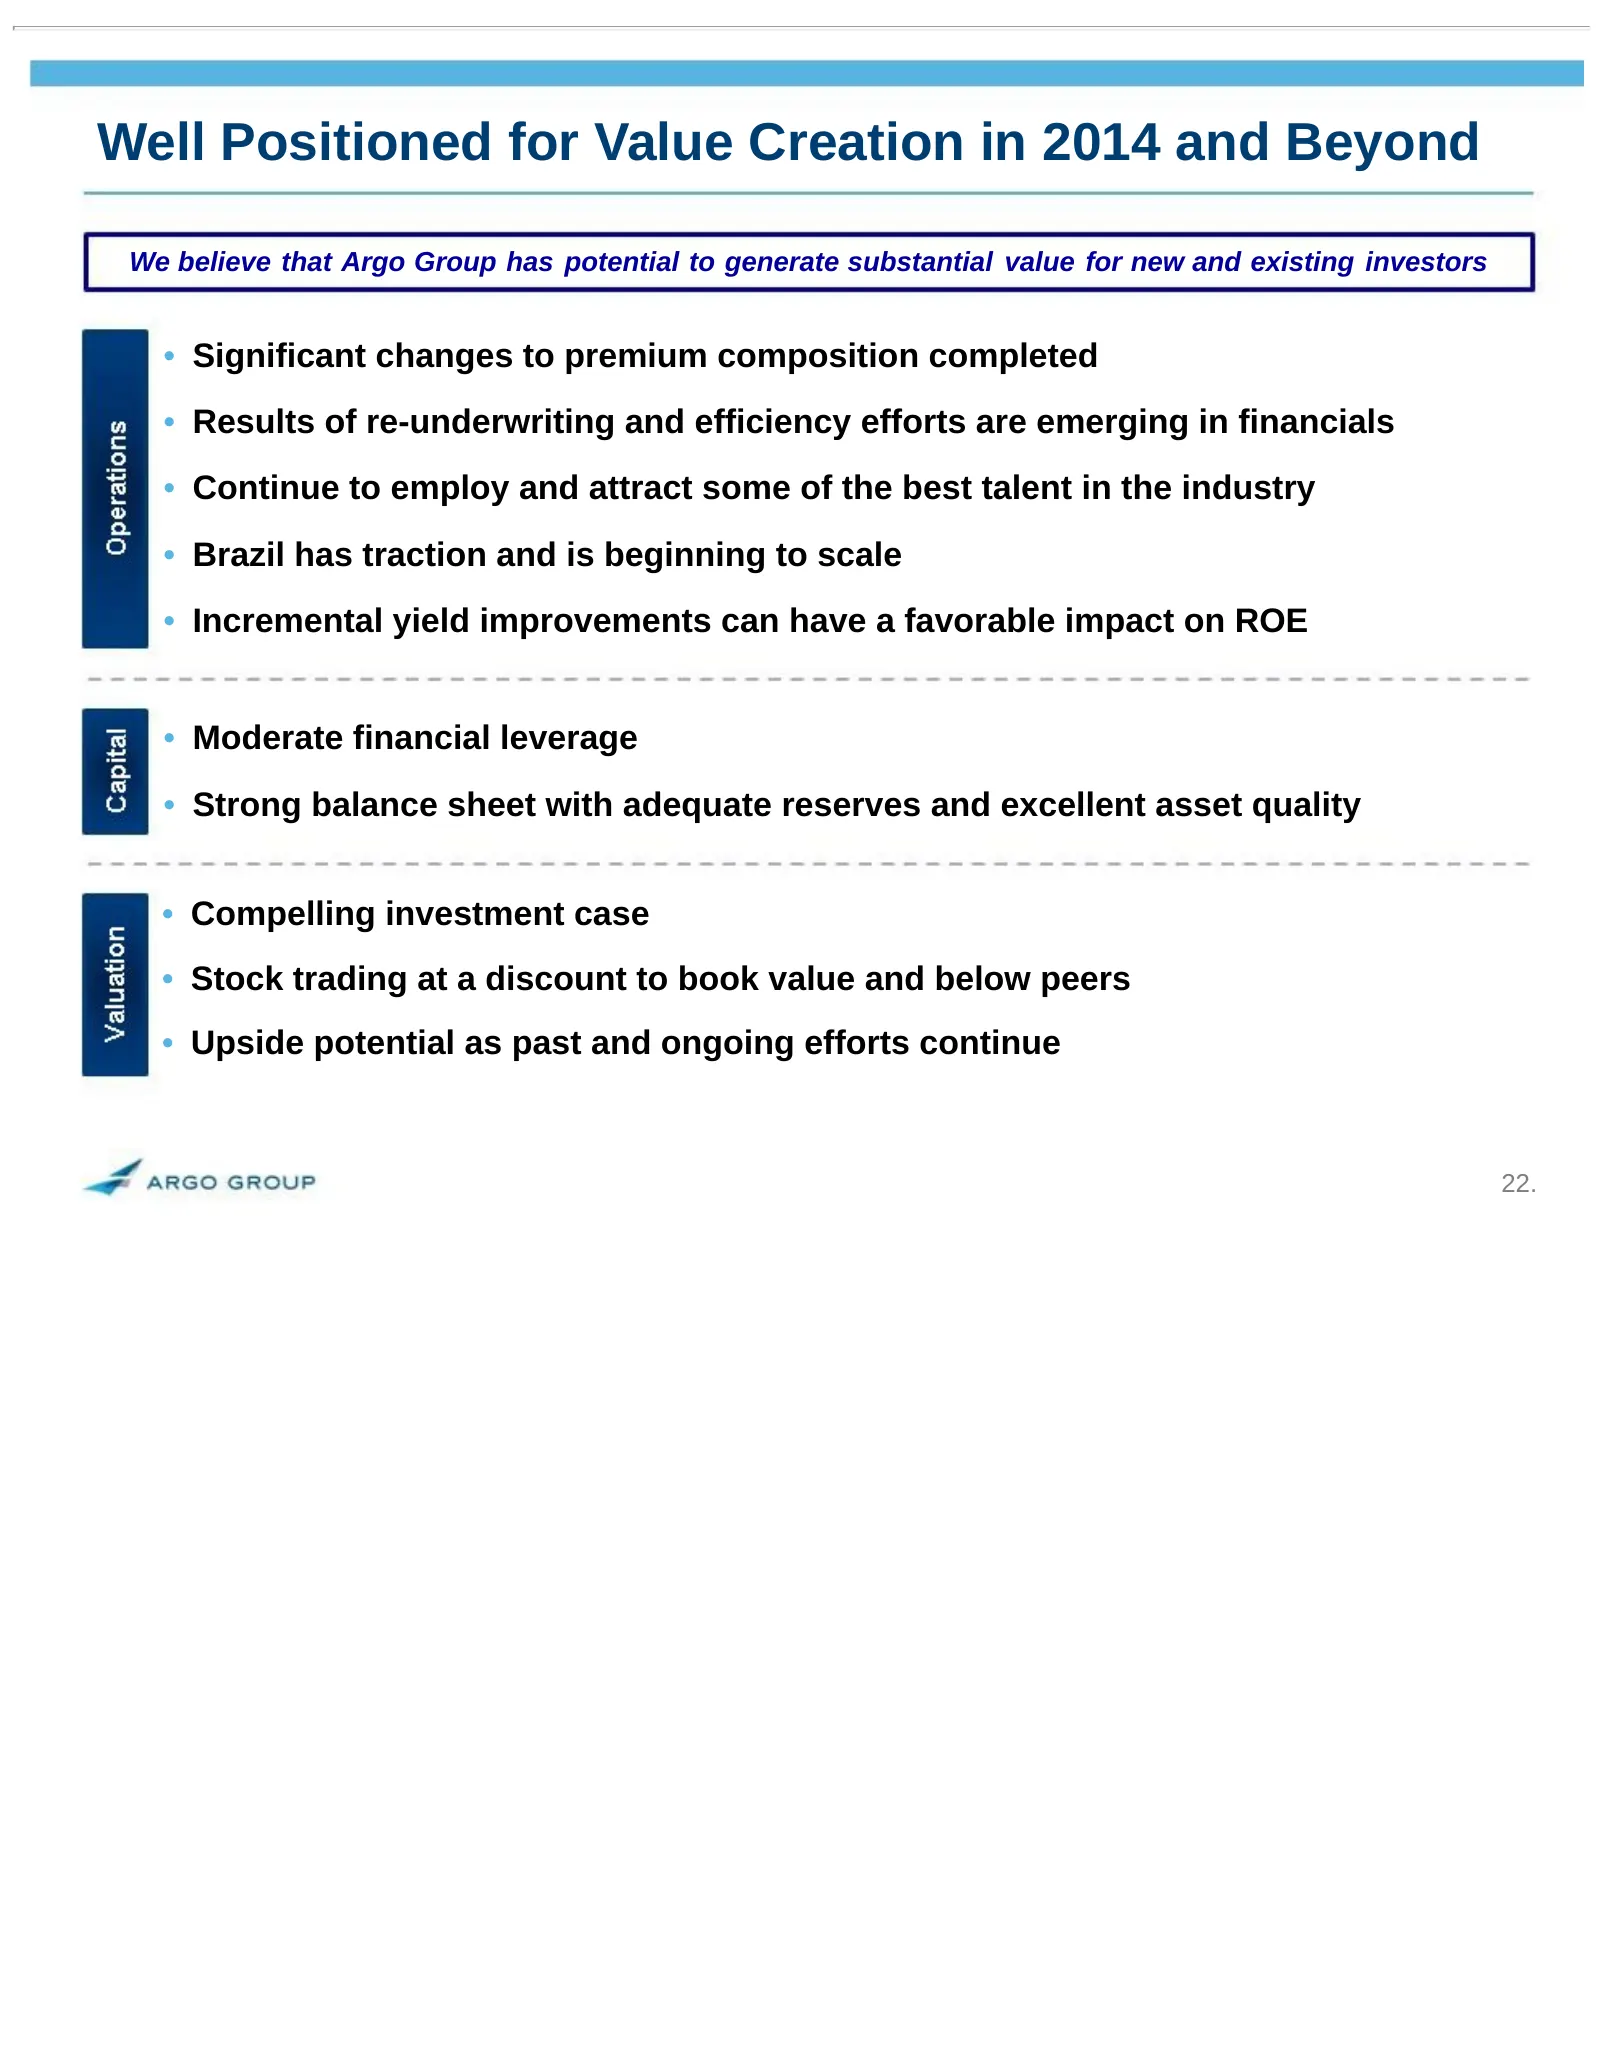
Slide 22: Well Positioned for Value Creation in 2014 and Beyond
Well Positioned for Value Creation in 2014 and Beyond We believe that Argo Group has potential to generate substantial value for new and existing investors • Significant changes to premium composition completed • Results of re-underwriting and efficiency efforts are emerging in financials • Continue
Source: SEC EDGAR · 8-K filed Nov 17, 2014
More decks from Argo Group International Holdings Ltd
 Proxy Contest (November 2022)39 slides · Nov 18, 2022
 Corporate Update (September 2022)23 slides · Sep 8, 2022
 Investor Presentation (February 2022)24 slides · Feb 23, 2022
 Q3 2021 Earnings Presentation7 slides · Nov 3, 2021
 Investor Day (March 2021)59 slides · Mar 12, 2021
 Investor Presentation (November 2020)17 slides · Nov 10, 2020