Snap One — Investor Day (September 2022)
65 slides from Snap One's investor day presentation, Sep 14, 2022
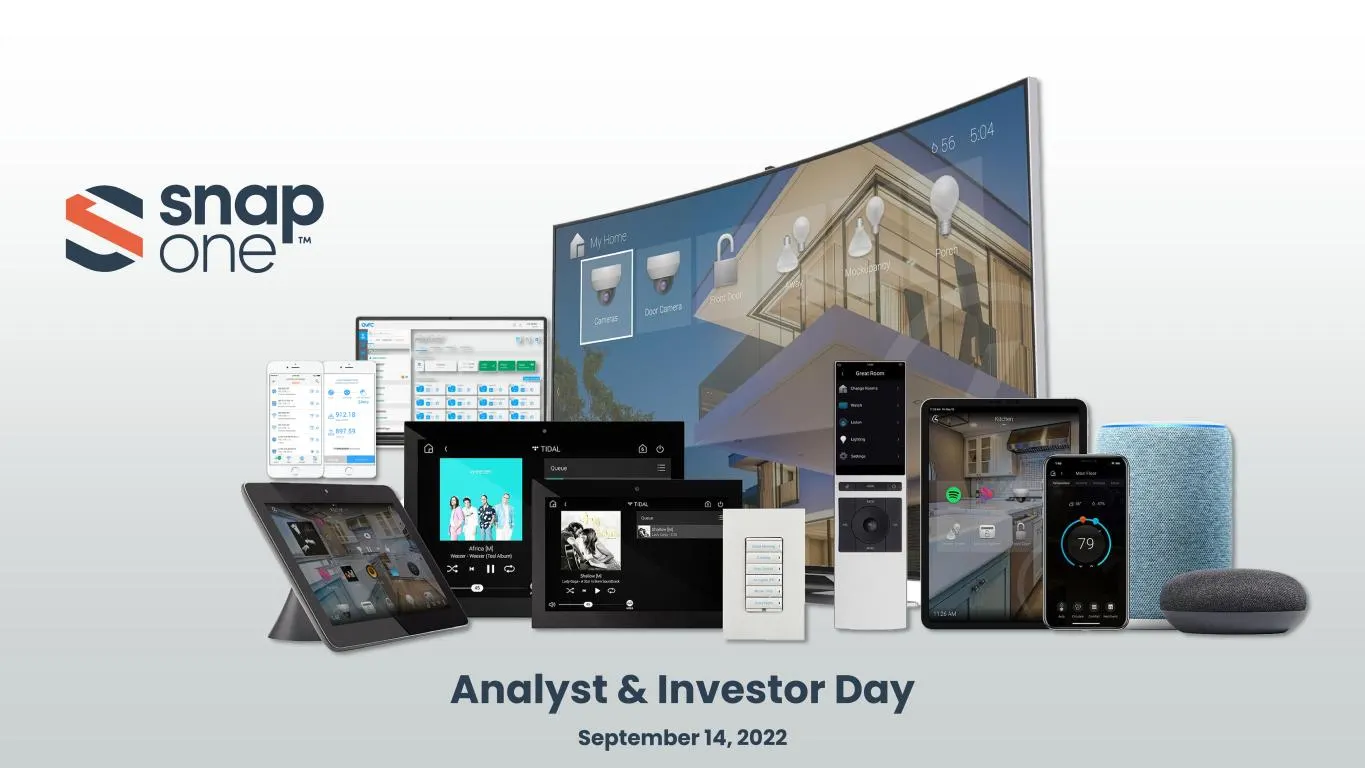
Slide 1: Analyst & Investor Day September 14, 2022
Analyst & Investor Day September 14, 2022
Slide 2: Disclaimer / Safe Harbor
Disclaimer / Safe Harbor This material includes certain historical performance information and "forward-looking statements" regarding estimations, forecasts, targets and plans in relation to the results of operations, financial conditions and other overall management of the Snap One Holdings Corp. (
Slide 3: Disclaimer Summary
Disclaimer Summary Page | 3 ▪ Our presentation contains forward-looking statements, and we may make additional forward-looking statements in response to your questions, including but not limited to statements of expectations, future events, or future financial performance ▪ These statements are base
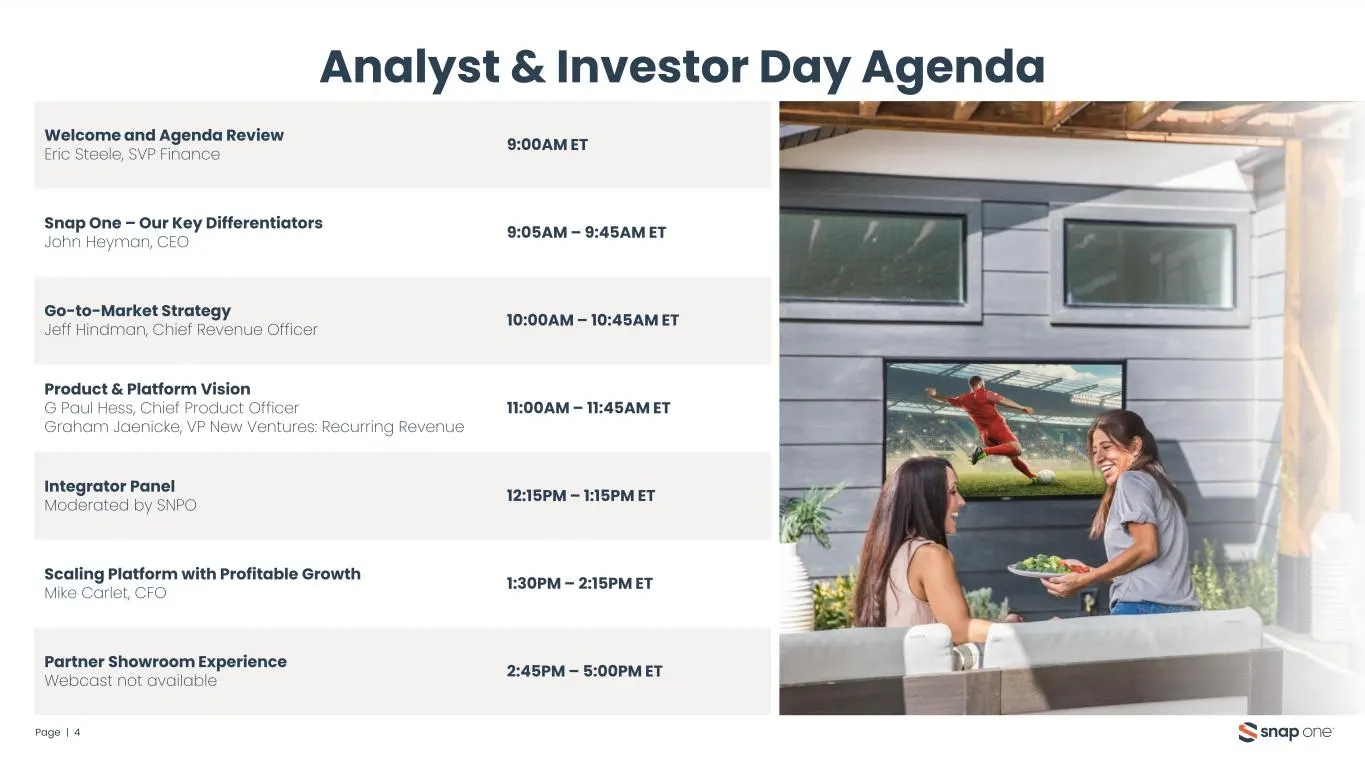
Slide 4: Welcome and Agenda Review
Welcome and Agenda Review Eric Steele, SVP Finance 9:00AM ET Snap One – Our Key Differentiators John Heyman, CEO 9:05AM – 9:45AM ET Go-to-Market Strategy Jeff Hindman, Chief Revenue Officer 10:00AM – 10:45AM ET Product & Platform Vision G Paul Hess, Chief Product Officer Graham Jaenicke, VP New Vent

Slide 5: Snap One – Our Key Differentiators
Snap One – Our Key Differentiators
Slide 6: What You Will Hear Today: Our Investment Highlights
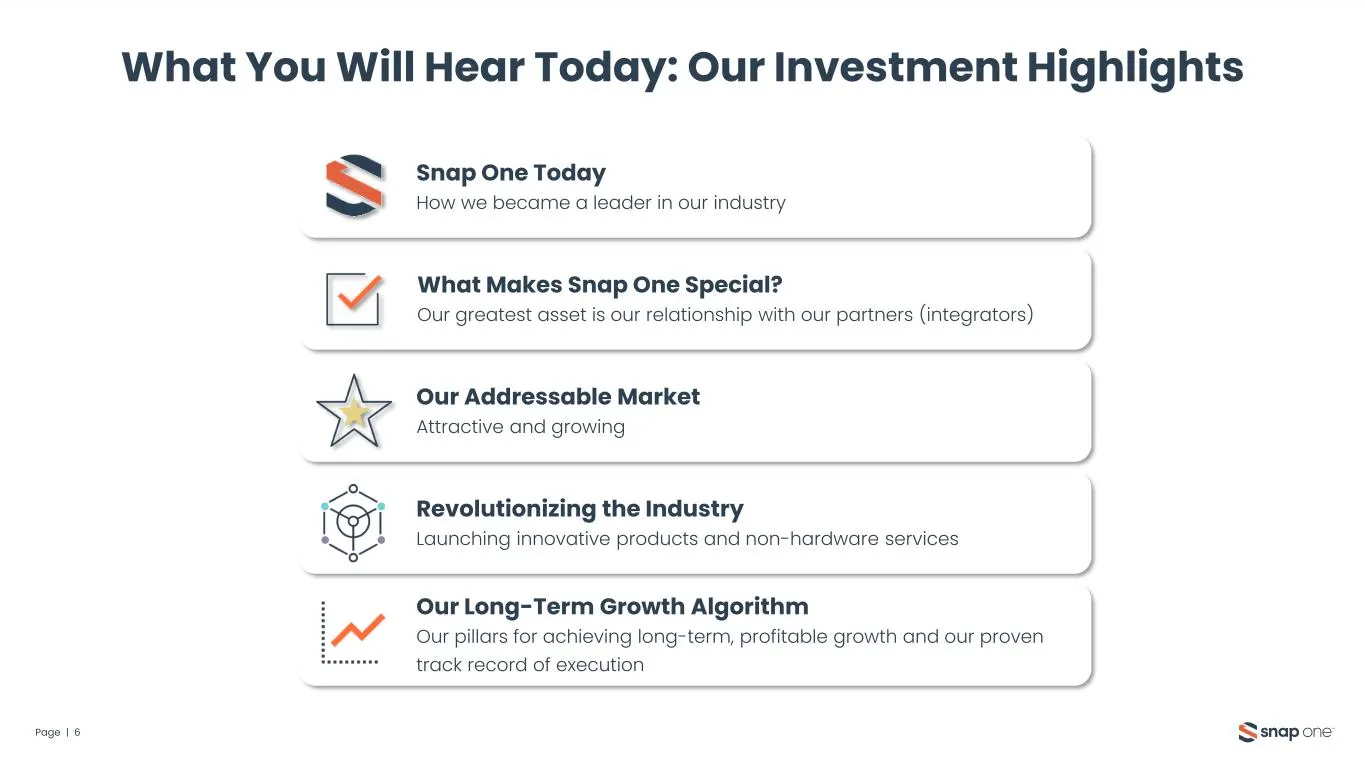
Page | 6 What You Will Hear Today: Our Investment Highlights Snap One Today How we became a leader in our industry What Makes Snap One Special? Our greatest asset is our relationship with our partners (integrators) Our Addressable Market Attractive and growing Our Long-Term Growth Algorithm Our pill
Slide 7: A Look Back at How We Became Snap One
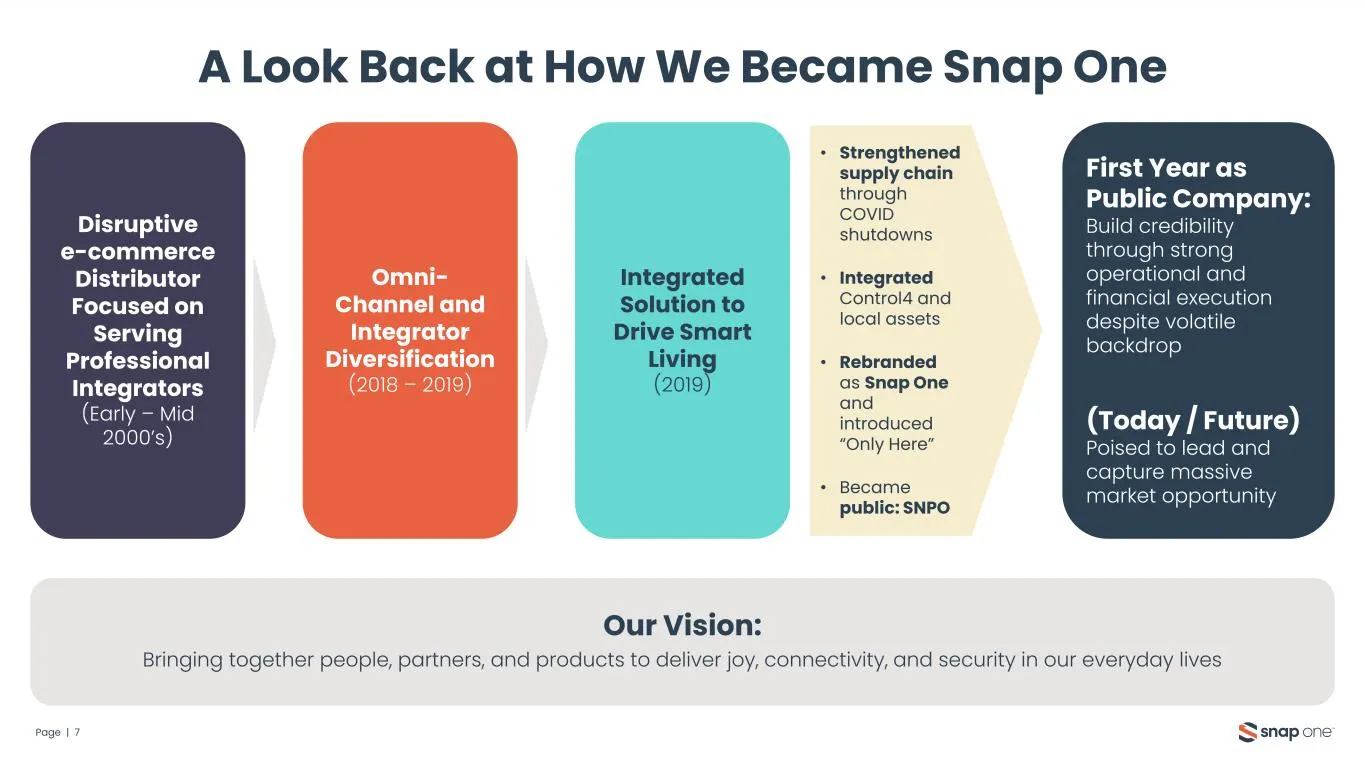
A Look Back at How We Became Snap One Page | 7 Disruptive e-commerce Distributor Focused on Serving Professional Integrators (Early – Mid 2000’s) Omni- Channel and Integrator Diversification (2018 – 2019) Integrated Solution to Drive Smart Living (2019) First Year as Public Company: Build credibilit
Slide 8: What is Our Business Model?
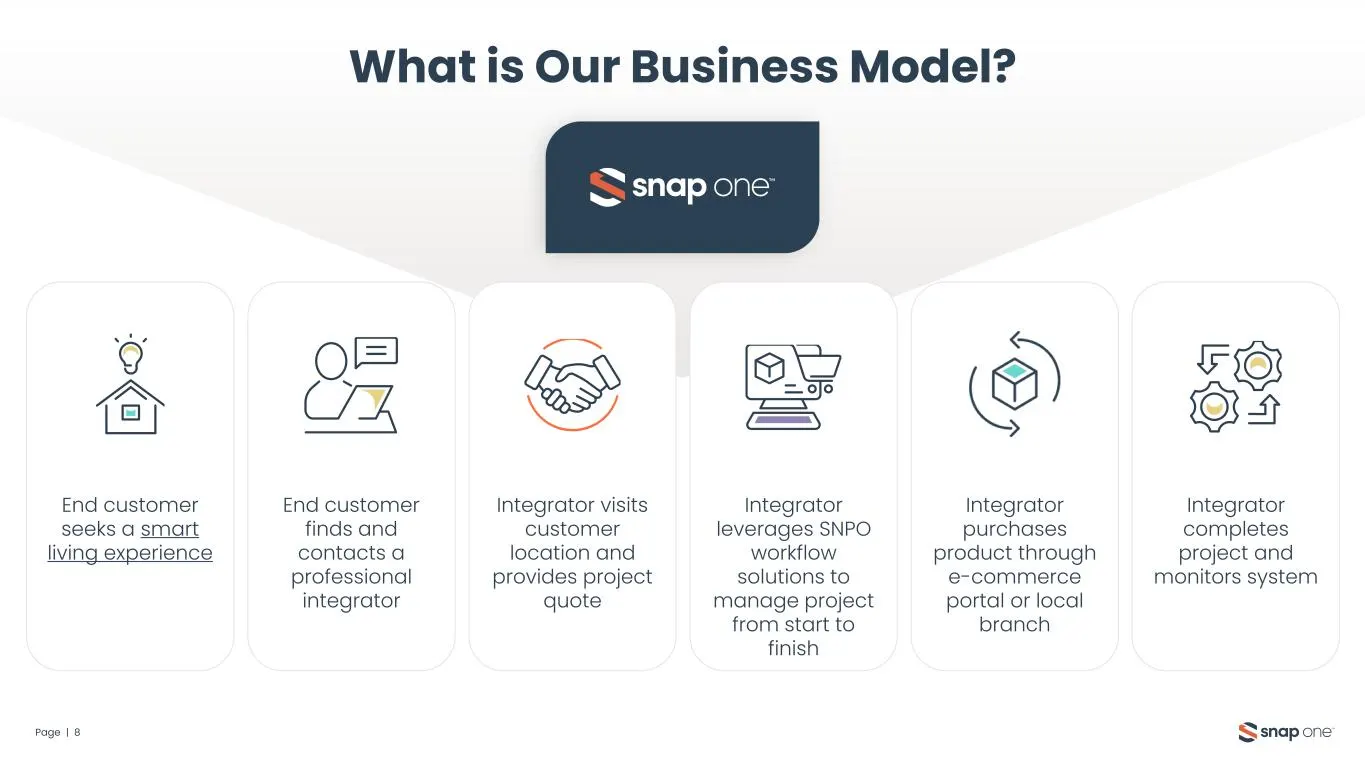
What is Our Business Model? Page | 8 End customer seeks a smart living experience End customer finds and contacts a professional integrator Integrator visits customer location and provides project quote Integrator purchases product through e-commerce portal or local branch Integrator completes proje
Slide 9: Defining 'Smart Living' Experiences
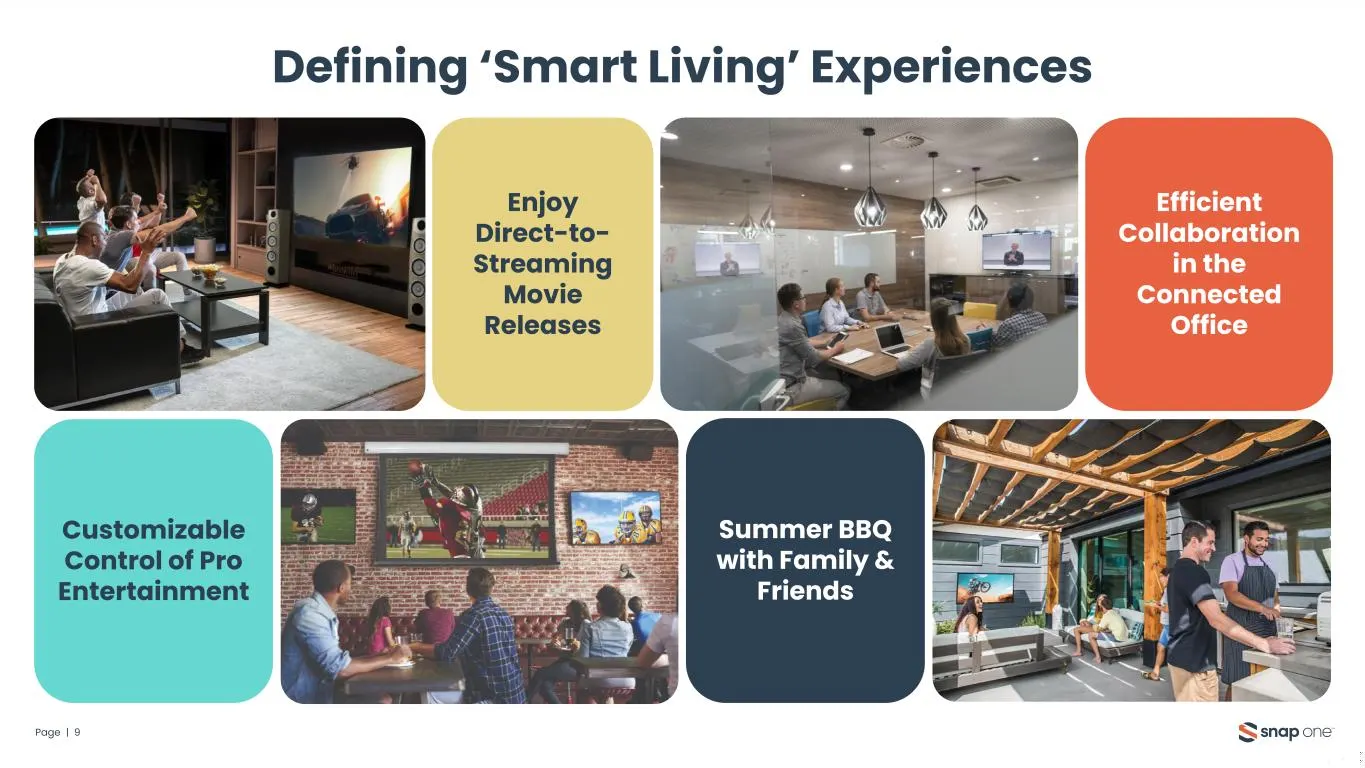
Defining ‘Smart Living’ Experiences Page | 9 Enjoy Direct-to- Streaming Movie Releases Efficient Collaboration in the Connected Office Customizable Control of Pro Entertainment Summer BBQ with Family & Friends
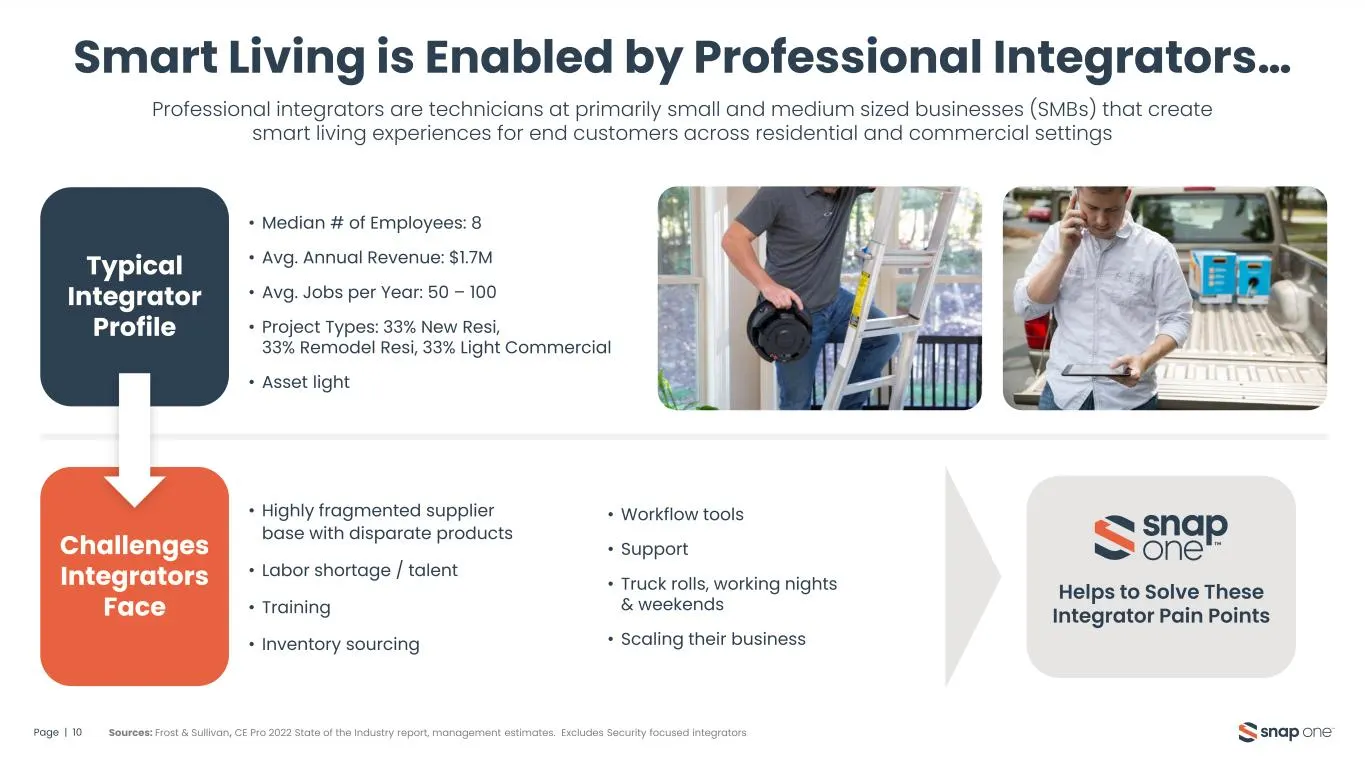
Slide 10: Smart Living is Enabled by Professional Integrators
Smart Living is Enabled by Professional Integrators… Page | 10 Professional integrators are technicians at primarily small and medium sized businesses (SMBs) that create smart living experiences for end customers across residential and commercial settings • Median # of Employees: 8 • Avg. Annual Rev
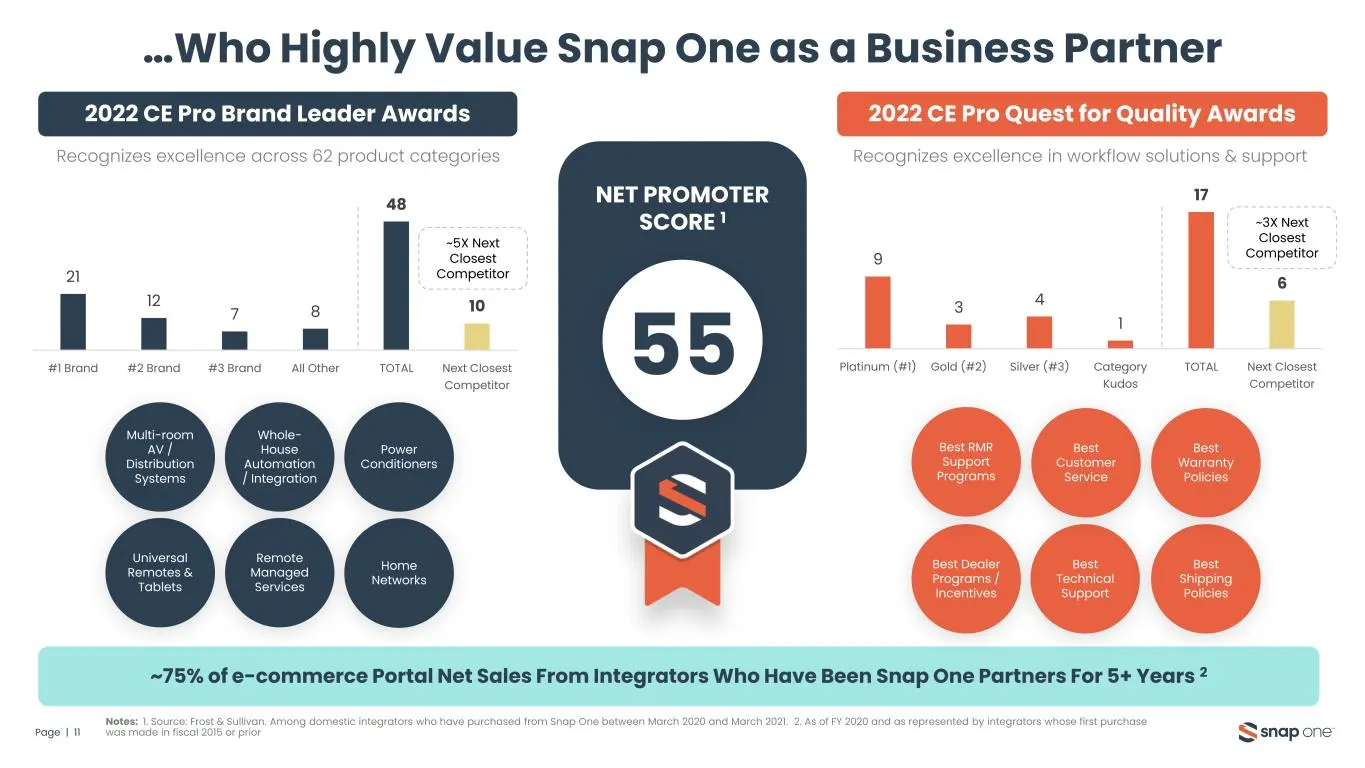
Slide 11: Who Highly Value Snap One as a Business Partner
…Who Highly Value Snap One as a Business Partner Page | 11 NET PROMOTER SCORE 1 55 ~75% of e-commerce Portal Net Sales From Integrators Who Have Been Snap One Partners For 5+ Years 2 Notes: 1. Source: Frost & Sullivan. Among domestic integrators who have purchased from Snap One between March 2020 an
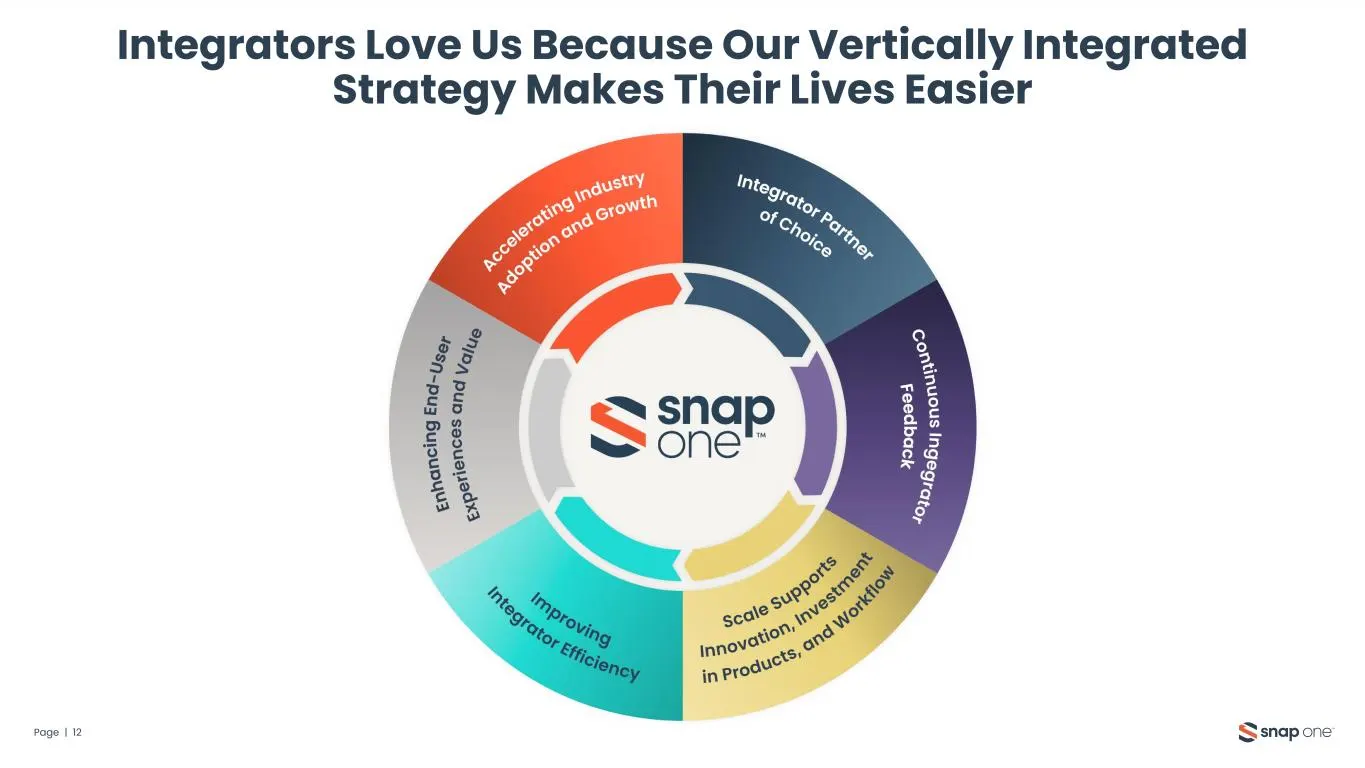
Slide 12: Integrators Love Us Because Our Vertically Integrated Strategy Makes Their Lives Easier
Integrators Love Us Because Our Vertically Integrated Strategy Makes Their Lives Easier Page | 12
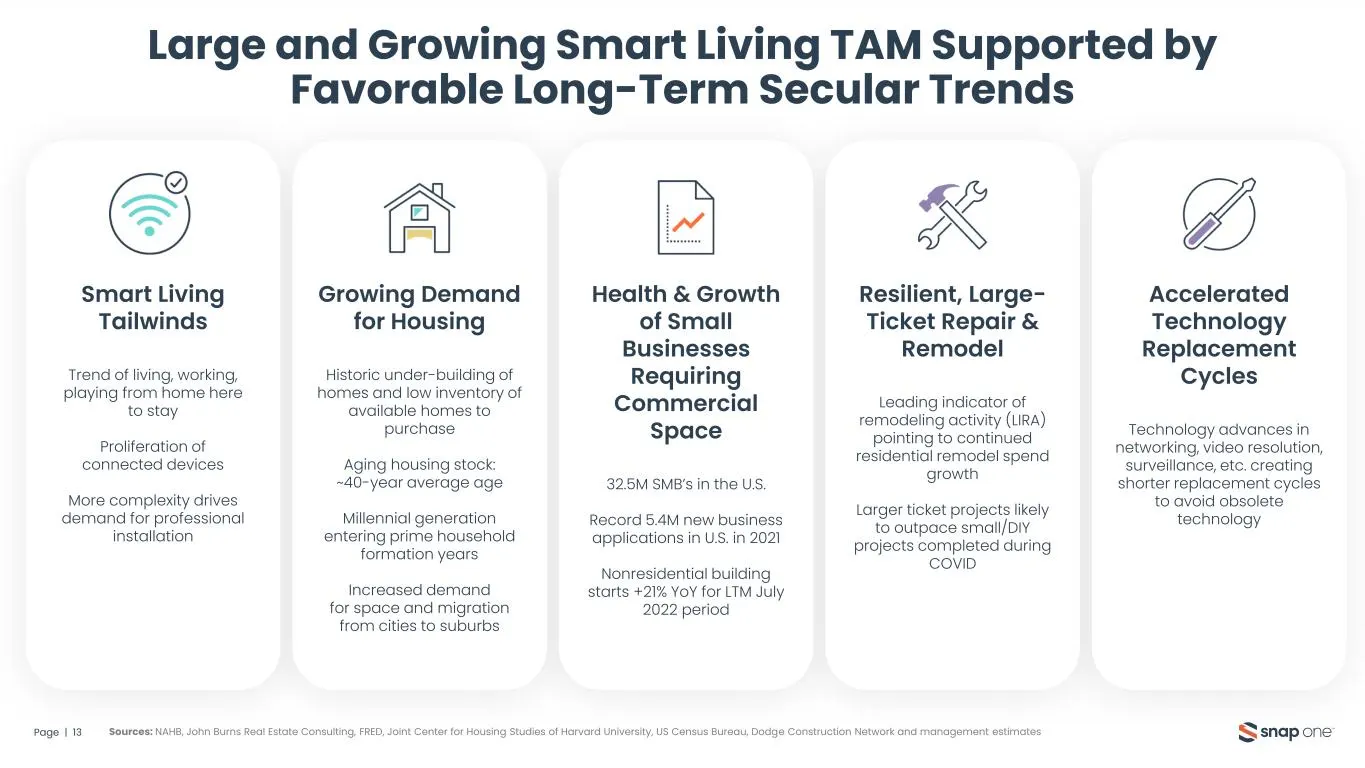
Slide 13: Smart Living Tailwinds
Smart Living Tailwinds Trend of living, working, playing from home here to stay Proliferation of connected devices More complexity drives demand for professional installation Growing Demand for Housing Historic under-building of homes and low inventory of available homes to purchase Aging housing st
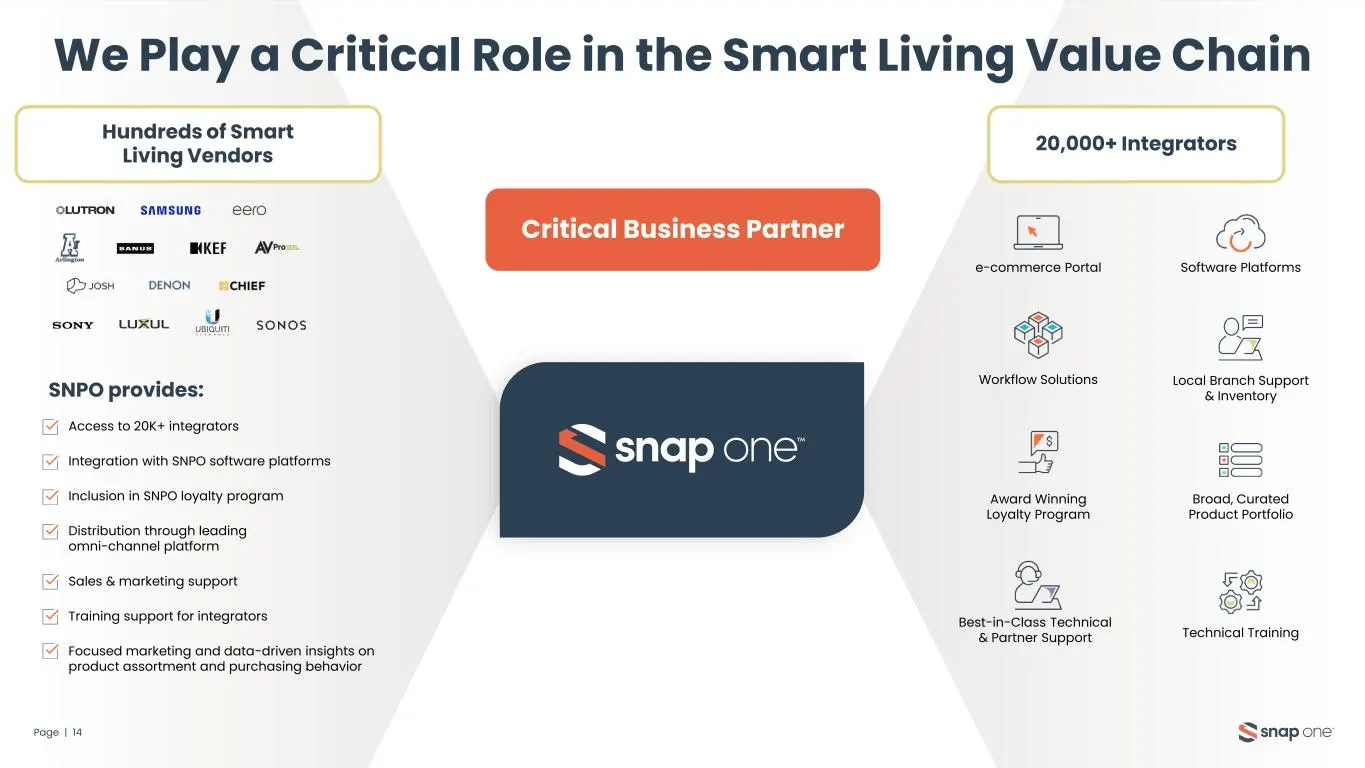
Slide 14: We Play a Critical Role in the Smart Living Value Chain
We Play a Critical Role in the Smart Living Value Chain Page | 14 Critical Business Partner Hundreds of Smart Living Vendors 20,000+ Integrators e-commerce Portal Local Branch Support & Inventory Broad, Curated Product Portfolio Workflow Solutions Award Winning Loyalty Program Technical Training Bes
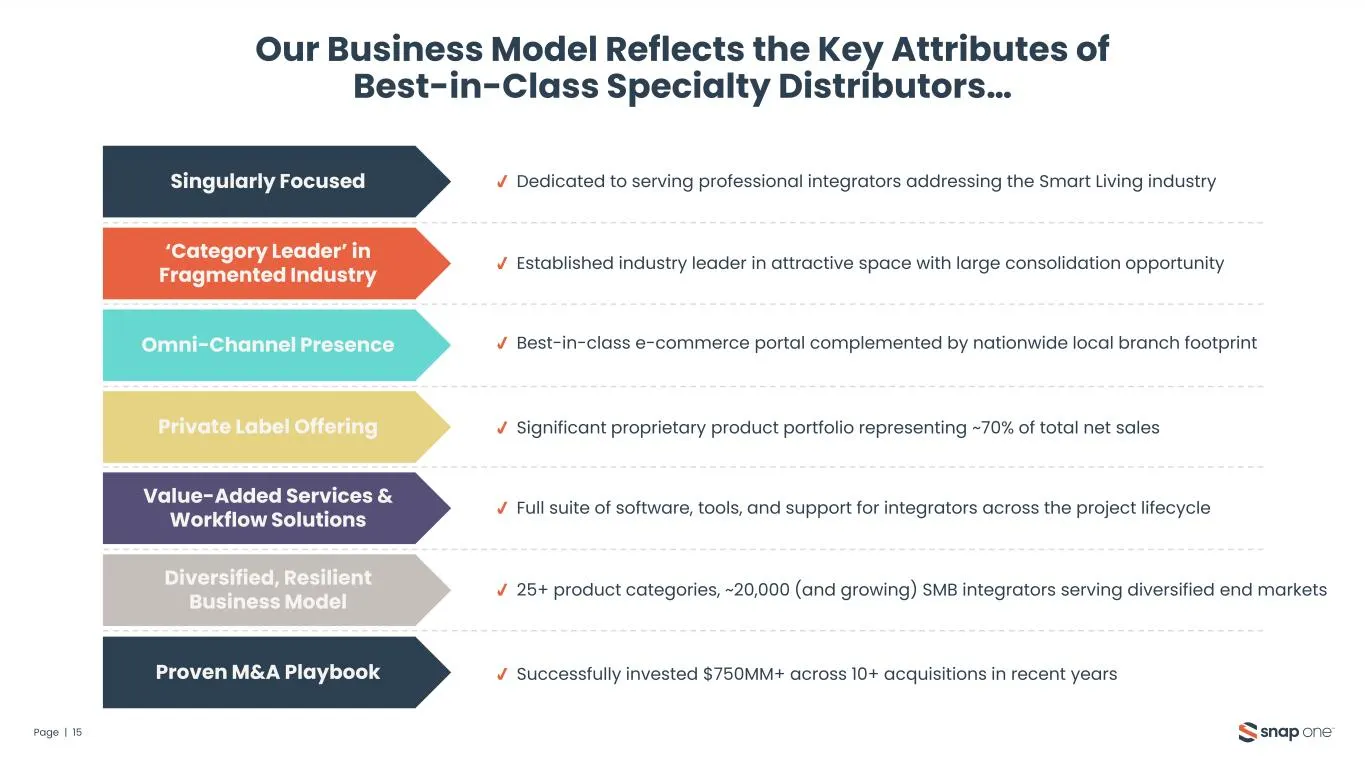
Slide 15: Our Business Model Reflects Key Attributes of Best-in-Class Specialty Distributors
Our Business Model Reflects the Key Attributes of Best-in-Class Specialty Distributors… Page | 15 Singularly Focused ‘Category Leader’ in Fragmented Industry Omni-Channel Presence Private Label Offering Proven M&A Playbook Value-Added Services & Workflow Solutions Diversified, Resilient Business Mod
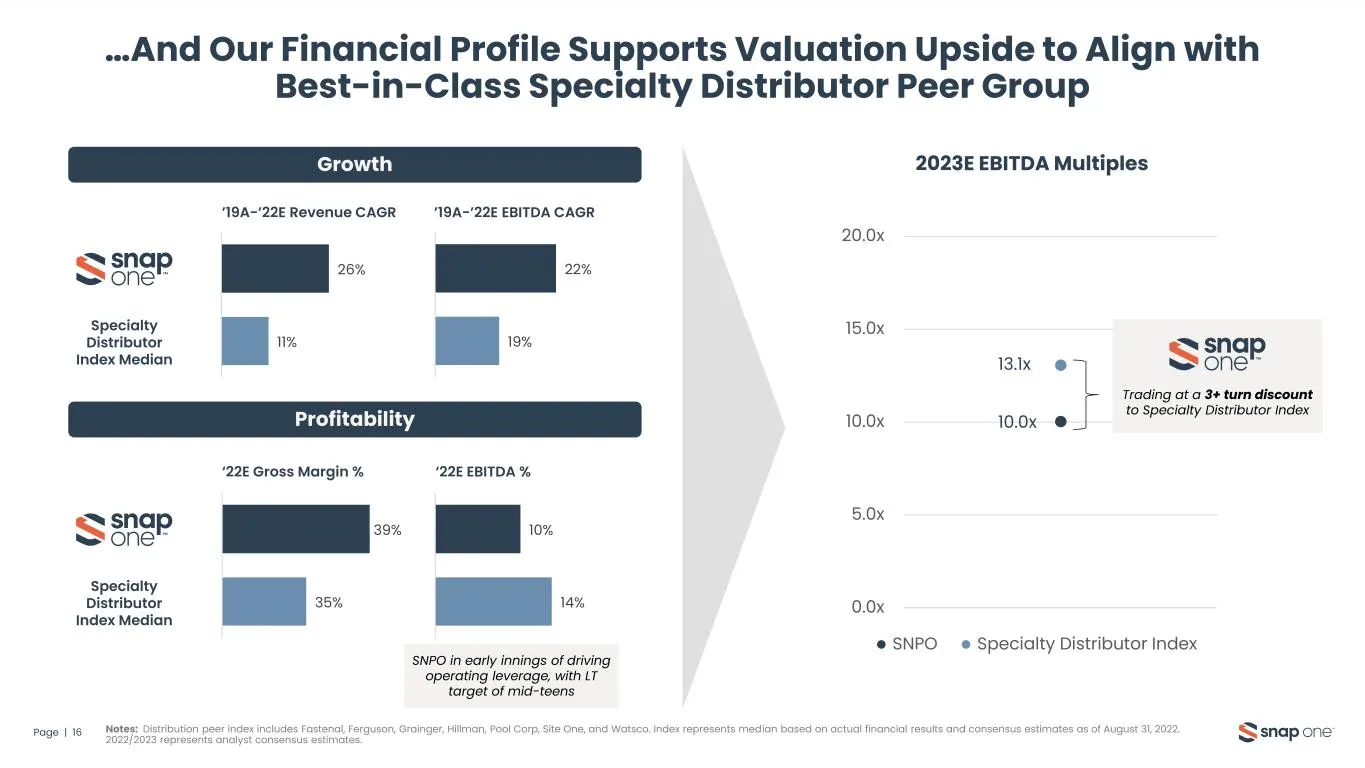
Slide 16: Financial Profile Supports Valuation Upside vs. Peer Group
…And Our Financial Profile Supports Valuation Upside to Align with Best-in-Class Specialty Distributor Peer Group Page | 16 Growth Profitability ’19A-’22E Revenue CAGR ’19A-’22E EBITDA CAGR 11% 26% 19% 22% Specialty Distributor Index Median ‘22E Gross Margin % ‘22E EBITDA % 35% 39% 14% 10% Specialty
Slide 17: Go-to-Market Strategy
Go-to- Market Strategy
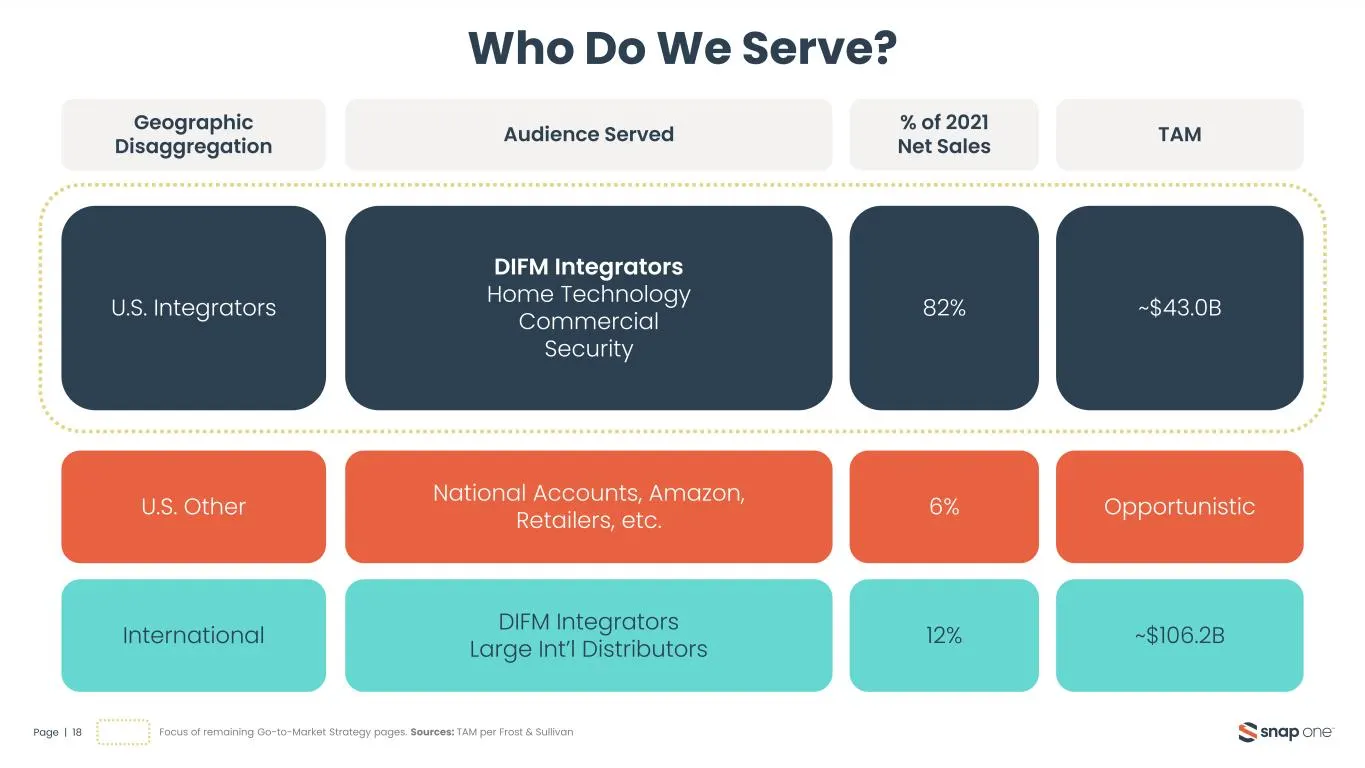
Slide 18: Who Do We Serve?
Who Do We Serve? Page | 18 Focus of remaining Go-to-Market Strategy pages. Sources: TAM per Frost & Sullivan U.S. Integrators Geographic Disaggregation U.S. Other International Audience Served DIFM Integrators Home Technology Commercial Security National Accounts, Amazon, Retailers, etc. DIFM Integr
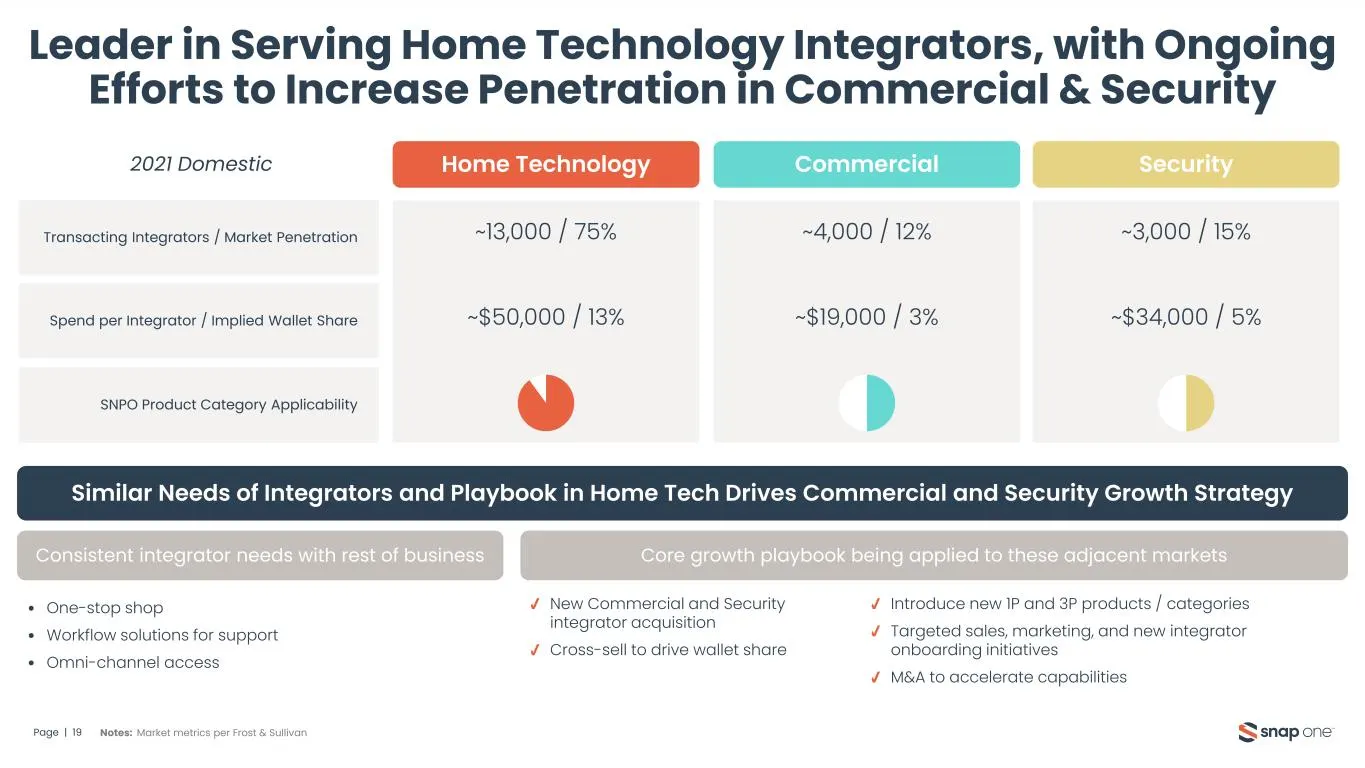
Slide 19: Leader in Home Technology, Increasing Penetration in Commercial & Security
Leader in Serving Home Technology Integrators, with Ongoing Efforts to Increase Penetration in Commercial & Security Page | 19 Similar Needs of Integrators and Playbook in Home Tech Drives Commercial and Security Growth Strategy Consistent integrator needs with rest of business Core growth playbook
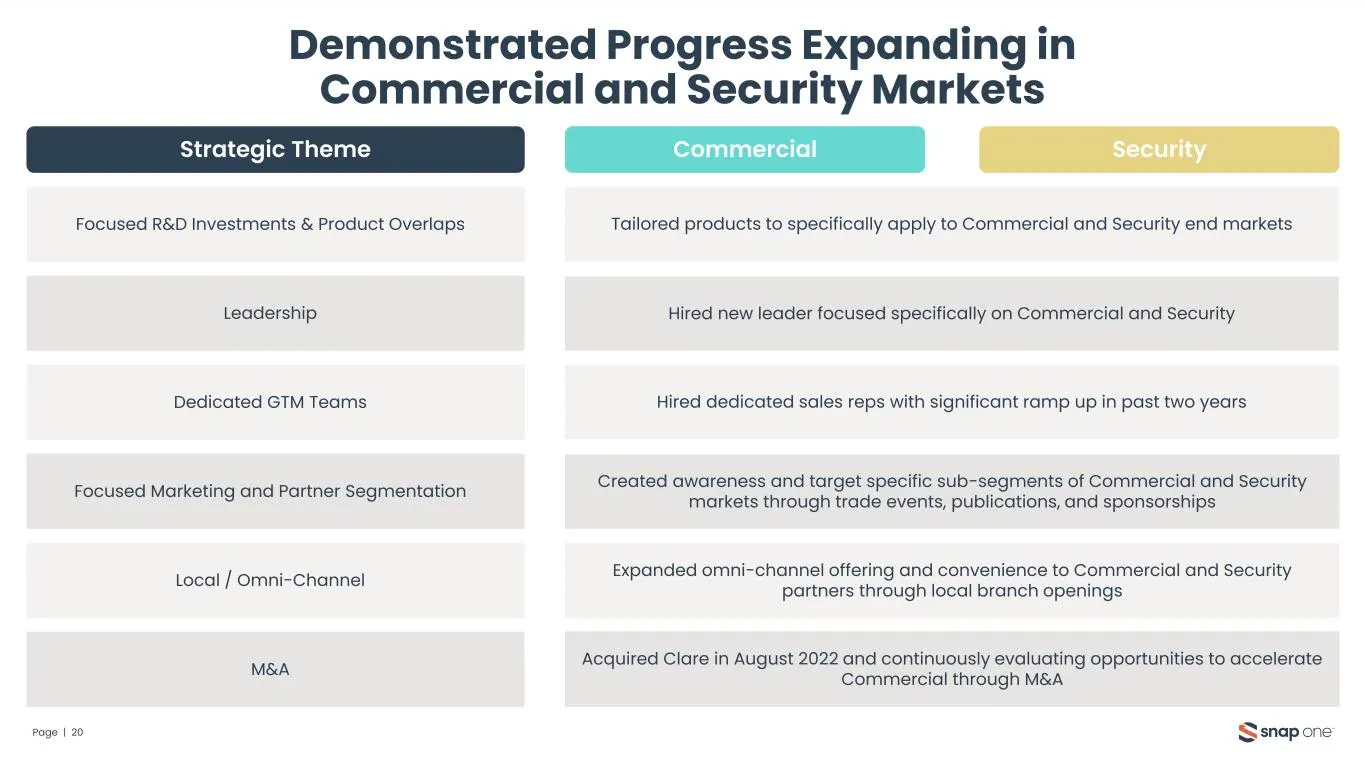
Slide 20: Demonstrated Progress Expanding in Commercial and Security Markets
Demonstrated Progress Expanding in Commercial and Security Markets Page | 20 Commercial Security Focused R&D Investments & Product Overlaps Strategic Theme Hired new leader focused specifically on Commercial and SecurityLeadership Dedicated GTM Teams Created awareness and target specific sub-segment
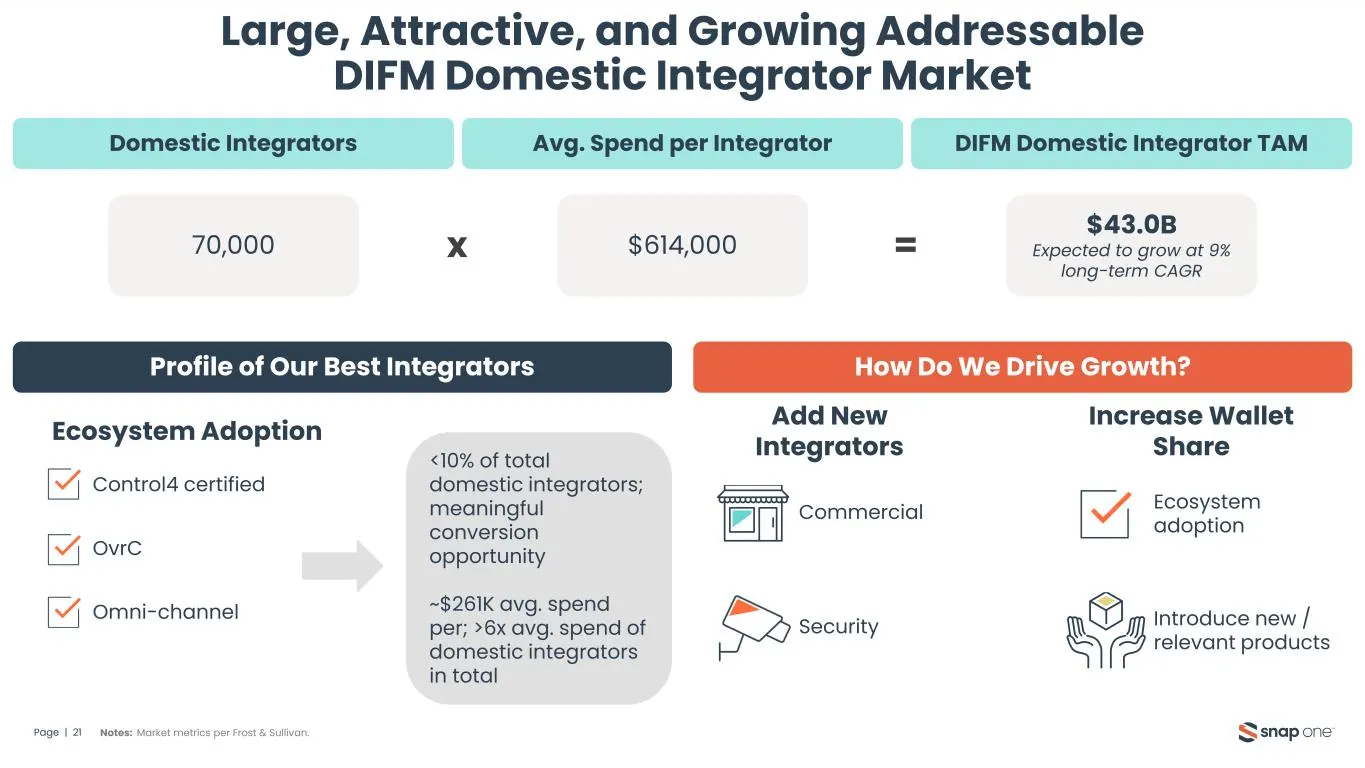
Slide 21: Large, Attractive, and Growing Addressable DIFM Domestic Integrator Market
Large, Attractive, and Growing Addressable DIFM Domestic Integrator Market Page | 21 Domestic Integrators Avg. Spend per Integrator DIFM Domestic Integrator TAM Profile of Our Best Integrators How Do We Drive Growth? Ecosystem Adoption Control4 certified OvrC Omni-channel x = Add New Integrators Inc
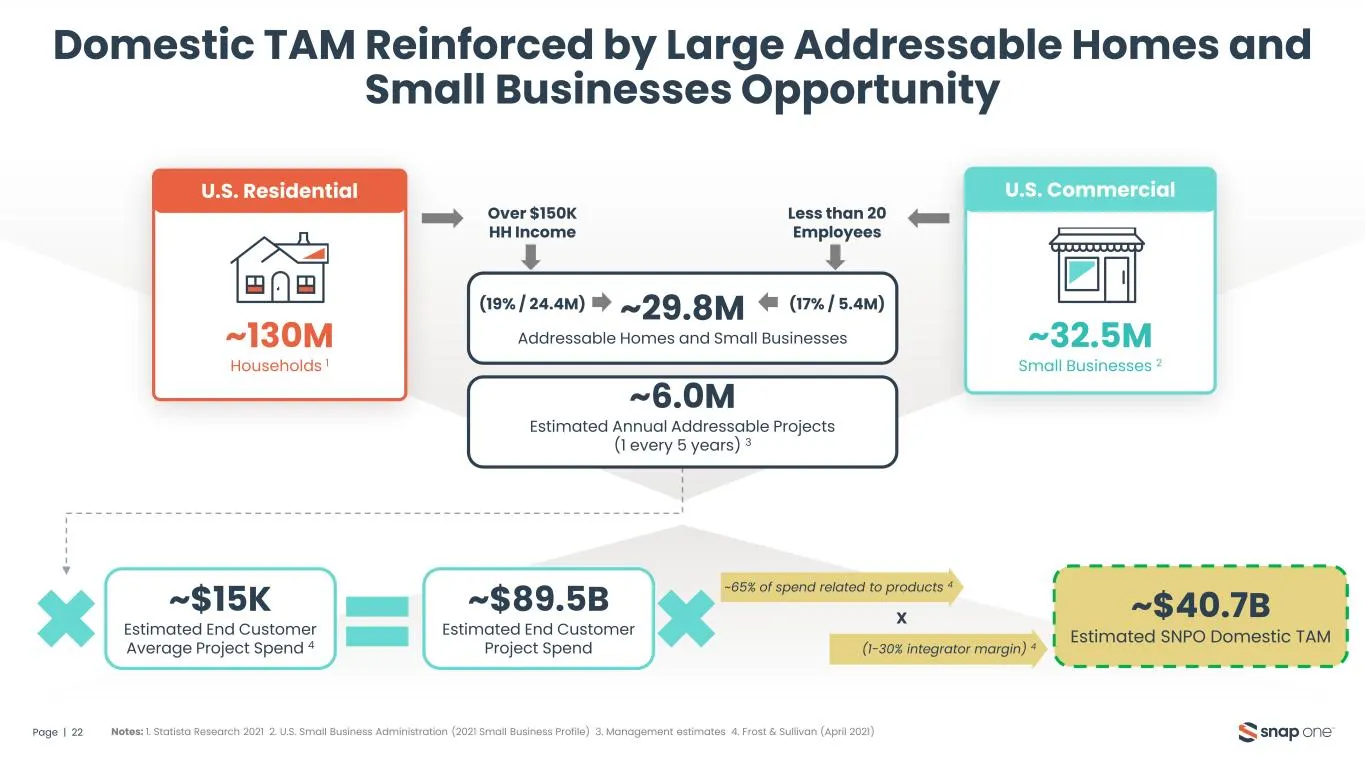
Slide 22: Domestic TAM Reinforced by Large Addressable Homes and Small Businesses
~6.0M Estimated Annual Addressable Projects (1 every 5 years) 3 Domestic TAM Reinforced by Large Addressable Homes and Small Businesses Opportunity Page | 22 ~29.8M Addressable Homes and Small Businesses Notes: 1. Statista Research 2021 2. U.S. Small Business Administration (2021 Small Business Prof
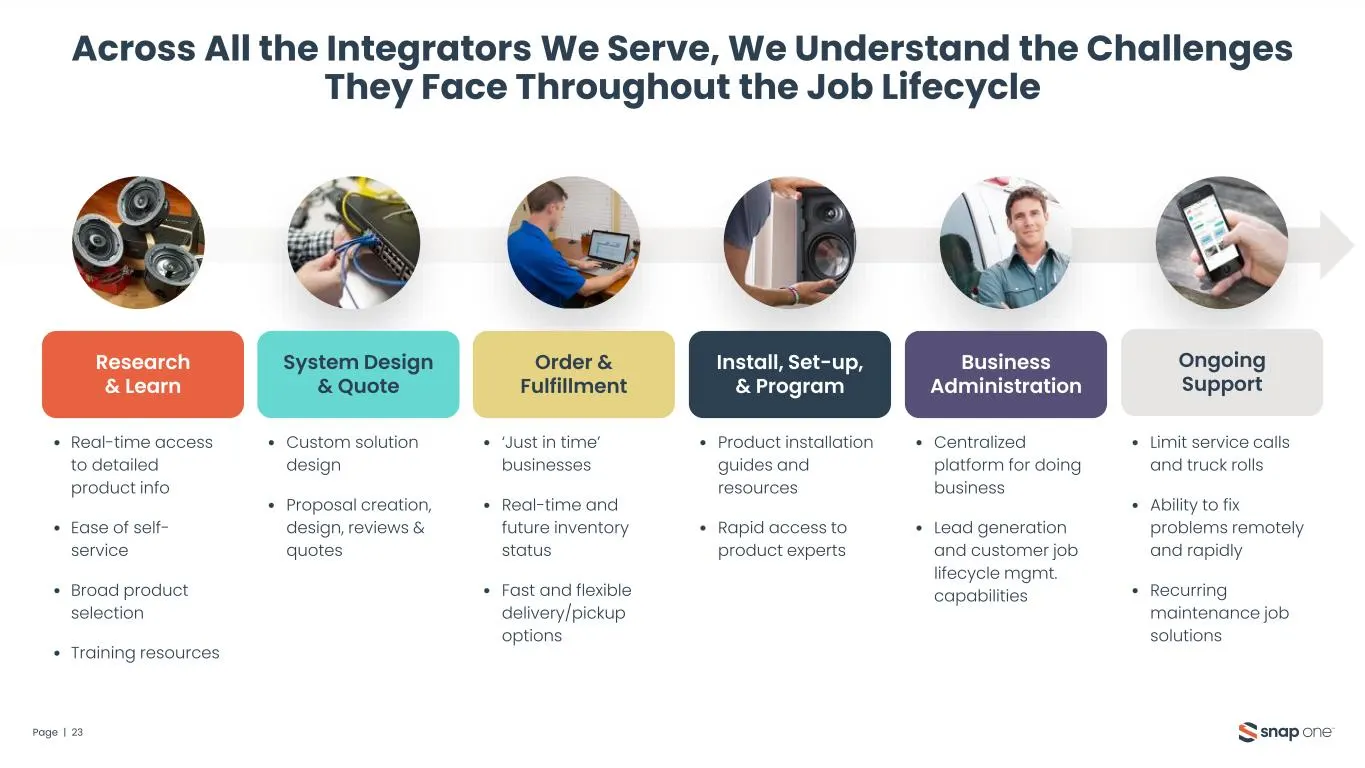
Slide 23: We Understand Integrator Challenges Throughout the Job Lifecycle
Across All the Integrators We Serve, We Understand the Challenges They Face Throughout the Job Lifecycle Page | 23 Research & Learn System Design & Quote Order & Fulfillment Install, Set-up, & Program Business Administration Ongoing Support • Real-time access to detailed product info • Ease of self-
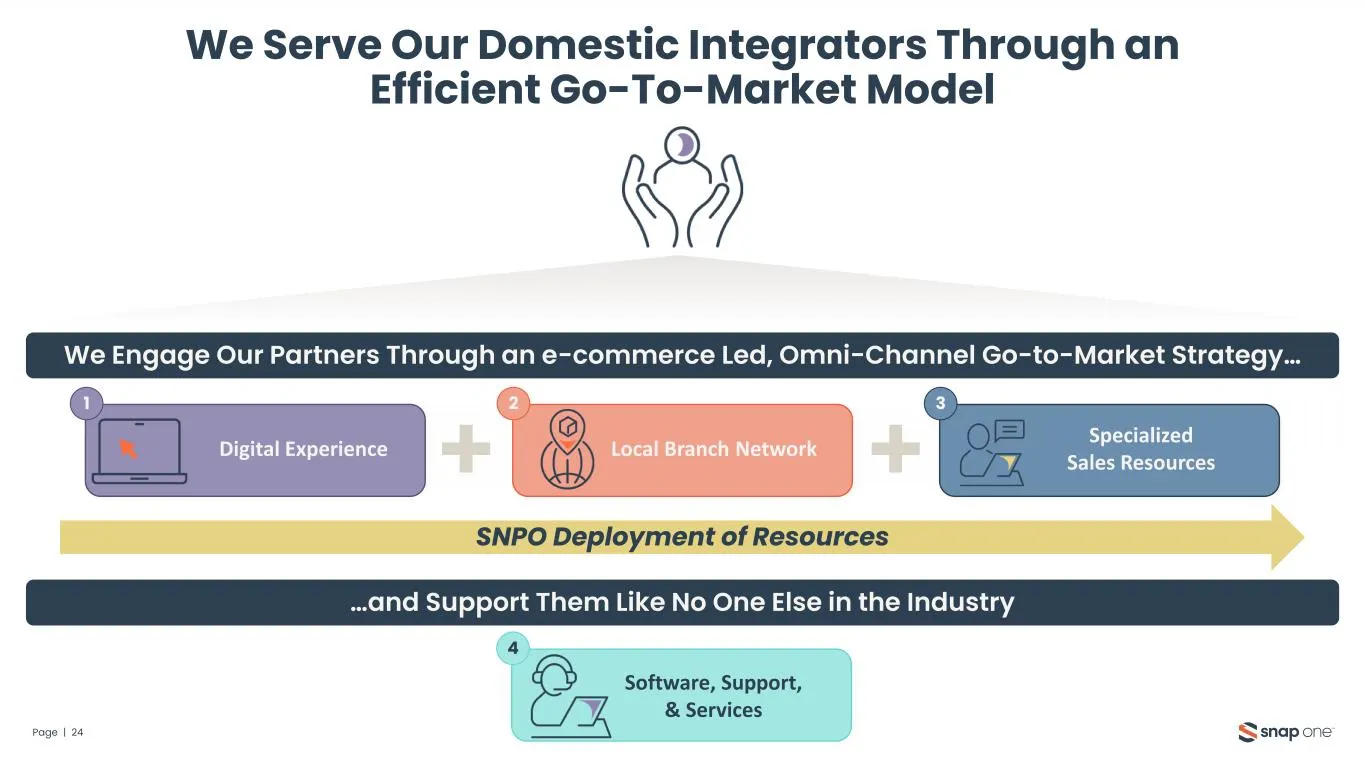
Slide 24: Efficient Go-To-Market Model for Domestic Integrators
We Serve Our Domestic Integrators Through an Efficient Go-To-Market Model Page | 24 Digital Experience 1 Local Branch Network 2 Software, Support, & Services 4 Specialized Sales Resources 3 SNPO Deployment of Resources We Engage Our Partners Through an e-commerce Led, Omni-Channel Go-to-Market Strat
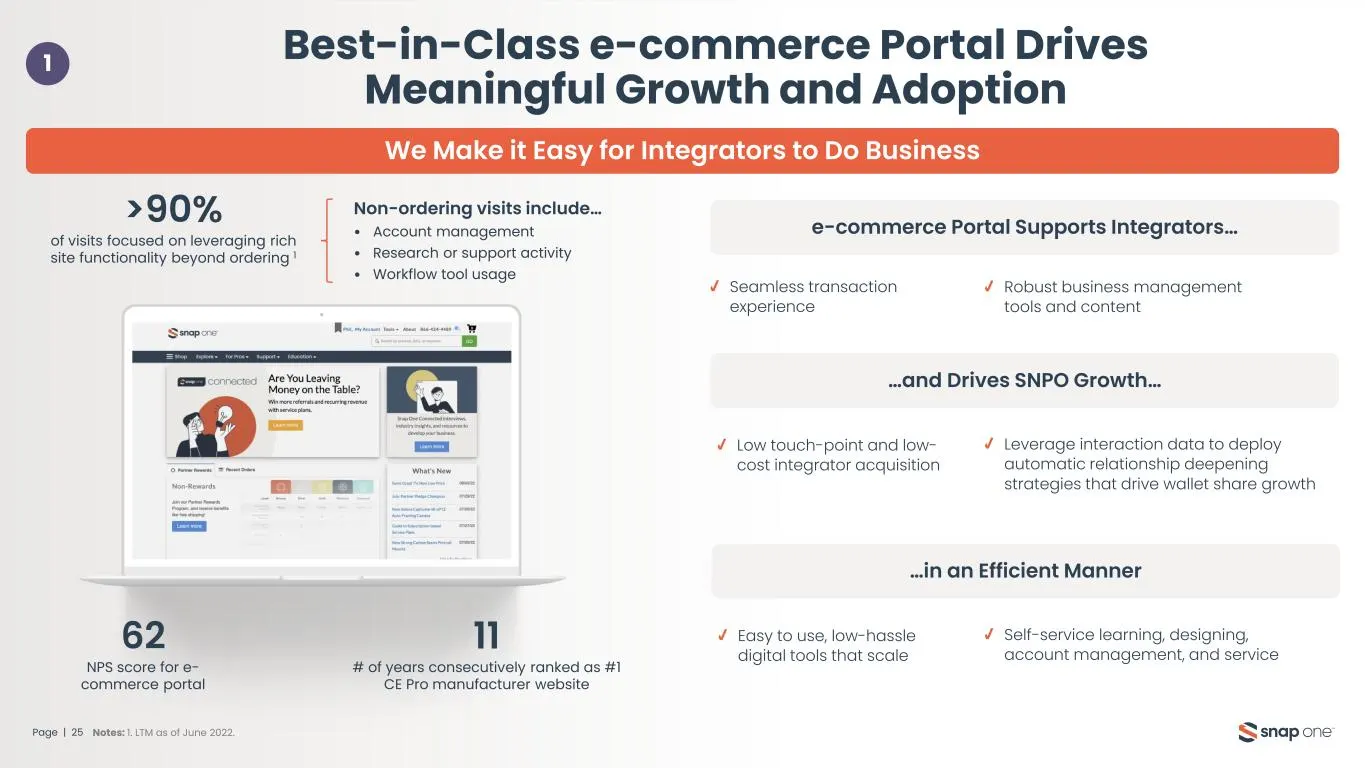
Slide 25: Best-in-Class e-commerce Portal Drives Growth and Adoption
Best-in-Class e-commerce Portal Drives Meaningful Growth and Adoption Page | 25 e-commerce Portal Supports Integrators… …and Drives SNPO Growth… Seamless transaction experience 1 We Make it Easy for Integrators to Do Business >90% of visits focused on leveraging rich site functionality beyond orderi
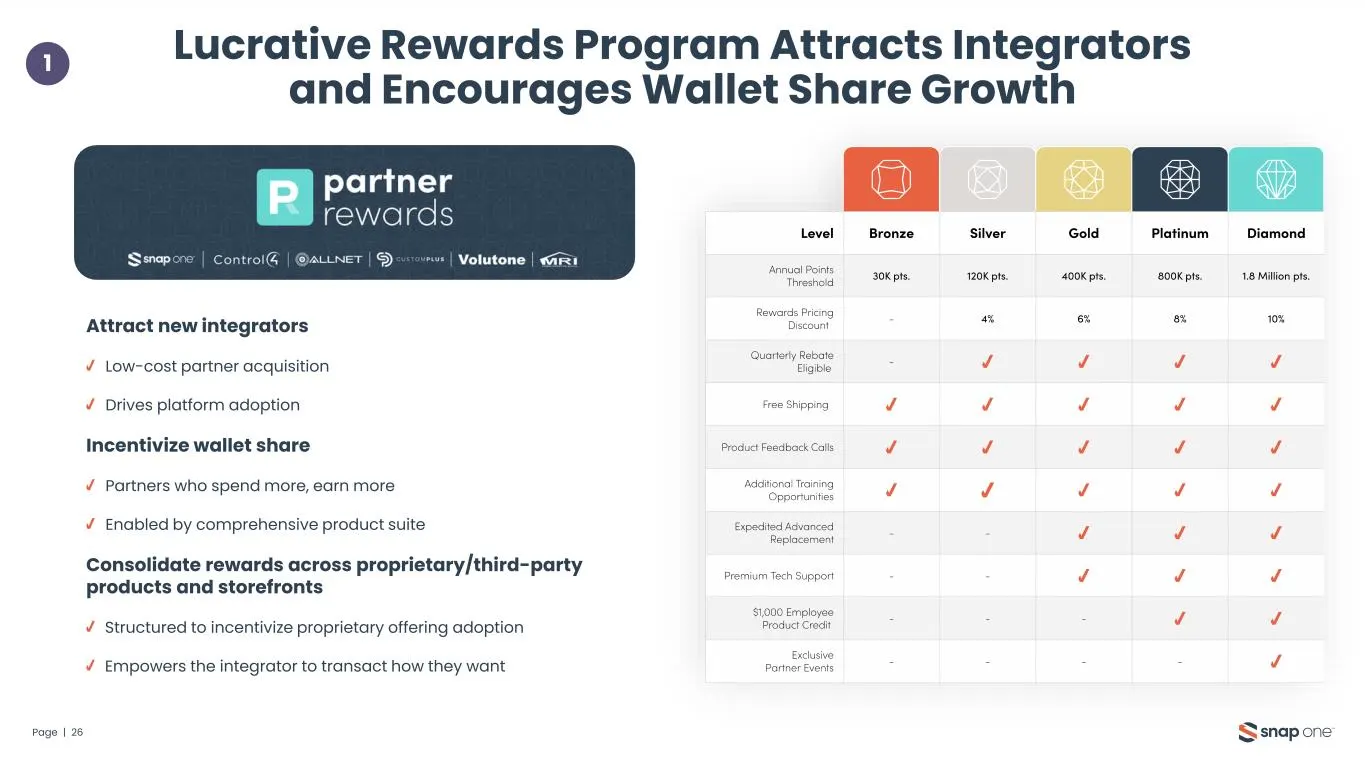
Slide 26: Lucrative Rewards Program Attracts Integrators
Lucrative Rewards Program Attracts Integrators and Encourages Wallet Share Growth Page | 26 Attract new integrators Low-cost partner acquisition Drives platform adoption Incentivize wallet share Partners who spend more, earn more Enabled by comprehensive product suite Consolidate rewards across prop
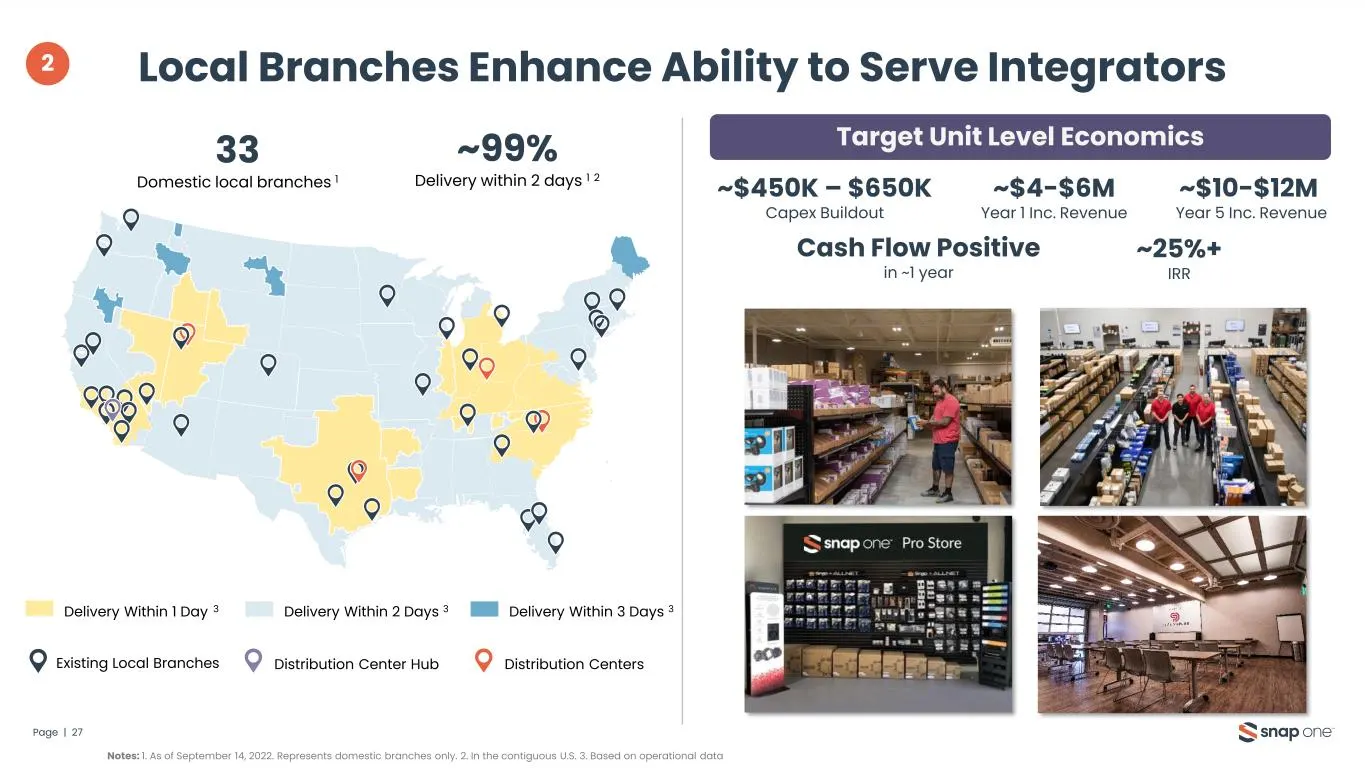
Slide 27: Local Branches Enhance Ability to Serve Integrators
Local Branches Enhance Ability to Serve Integrators Page | 27 33 Domestic local branches 1 ~99% Delivery within 2 days 1 2 Delivery Within 1 Day 3 Delivery Within 2 Days 3 Delivery Within 3 Days 3 Distribution CentersDistribution Center HubExisting Local Branches Notes: 1. As of September 14, 2022.
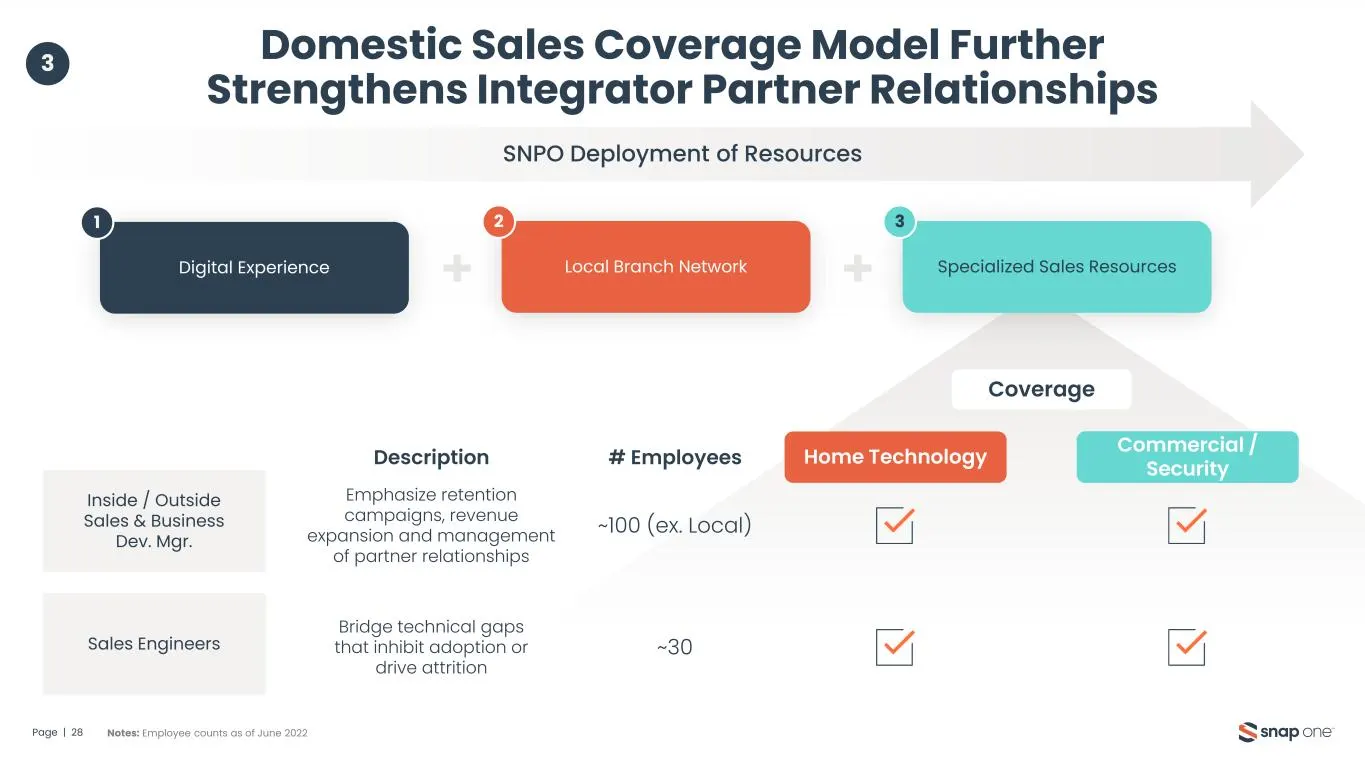
Slide 28: Domestic Sales Coverage Model
Domestic Sales Coverage Model Further Strengthens Integrator Partner Relationships Page | 28 Description # Employees Home Technology Commercial / Security Coverage Emphasize retention campaigns, revenue expansion and management of partner relationships ~100 (ex. Local) Bridge technical gaps that inh
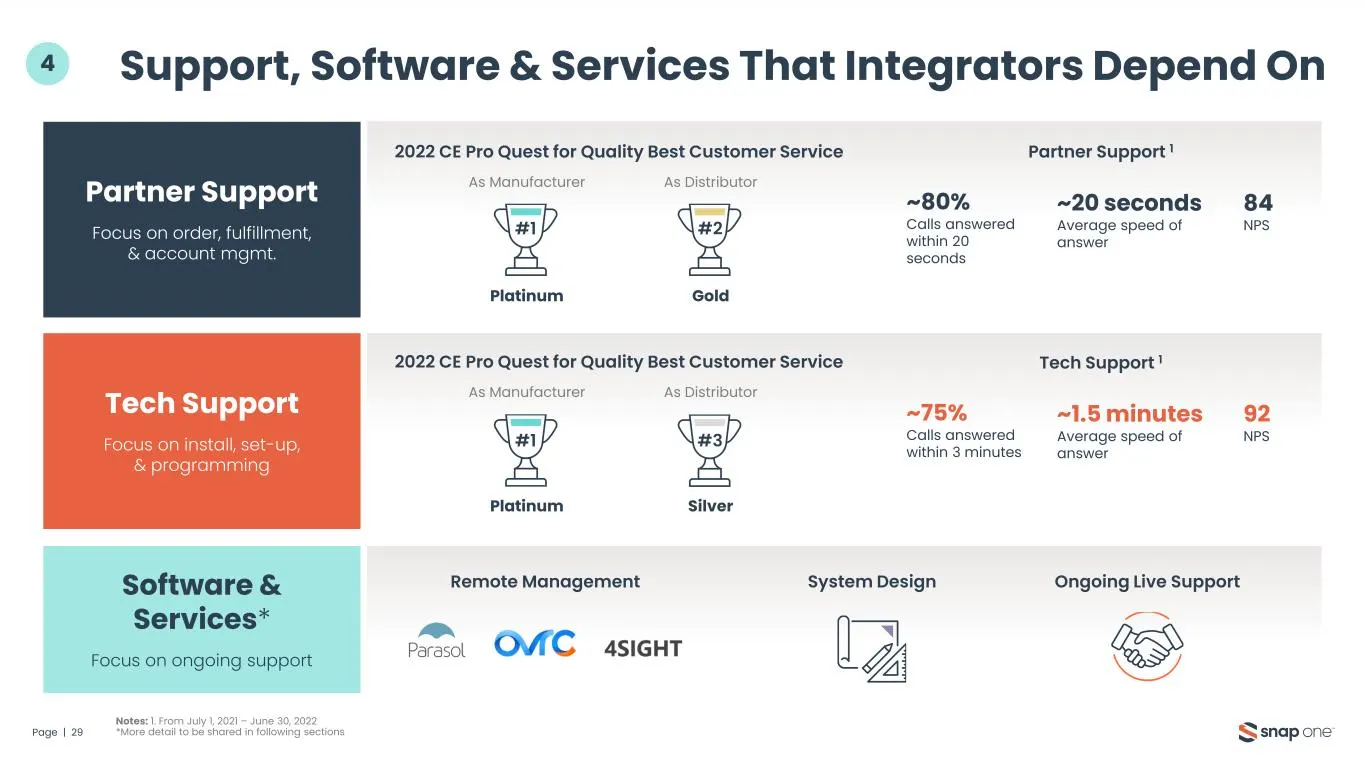
Slide 29: Support, Software & Services That Integrators Depend On
Tech Support Focus on install, set-up, & programming Support, Software & Services That Integrators Depend On Page | 29 ~80% Calls answered within 20 seconds ~20 seconds Average speed of answer 2022 CE Pro Quest for Quality Best Customer Service Notes: 1. From July 1, 2021 – June 30, 2022 *More detai
Slide 30: Product & Platform Vision
Product & Platform Vision
Slide 31: Smart Living Continues to Evolve
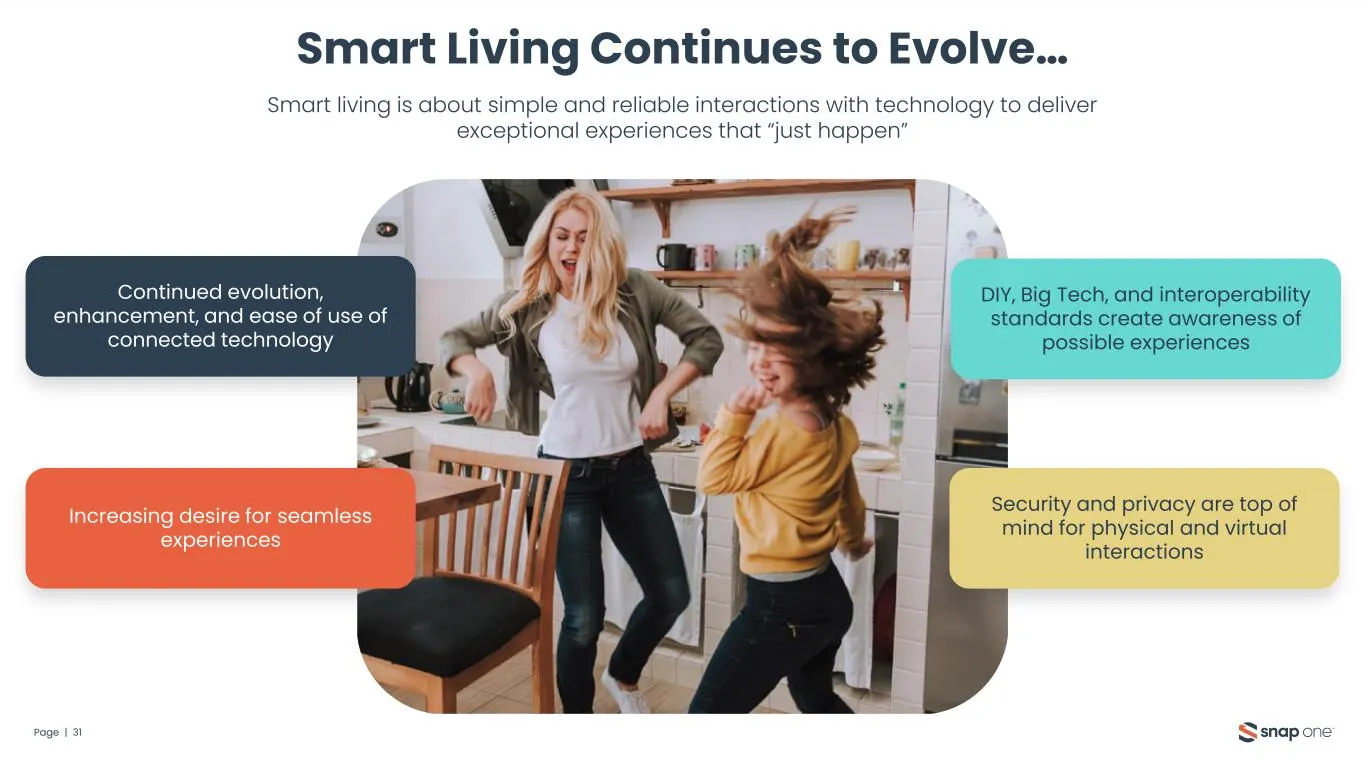
Page | 31 Smart Living Continues to Evolve… Smart living is about simple and reliable interactions with technology to deliver exceptional experiences that “just happen” Continued evolution, enhancement, and ease of use of connected technology Increasing desire for seamless experiences DIY, Big Tech,
Slide 32: Elevated Experiences Delivered by Professional-Grade Products and Integrators
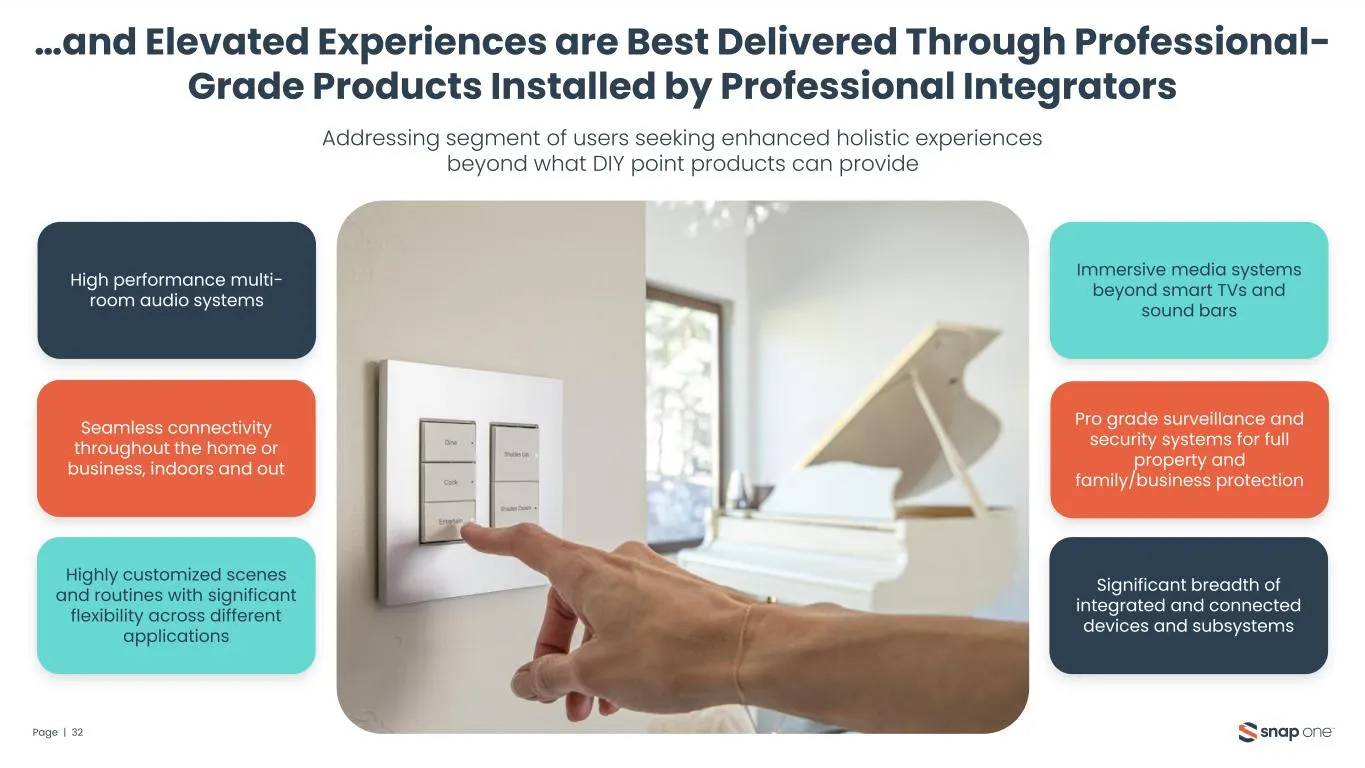
Page | 32 …and Elevated Experiences are Best Delivered Through Professional- Grade Products Installed by Professional Integrators Addressing segment of users seeking enhanced holistic experiences beyond what DIY point products can provide High performance multi- room audio systems Seamless connectiv
Slide 33: Platform & Product Ecosystem Built for Integrators & End Customers
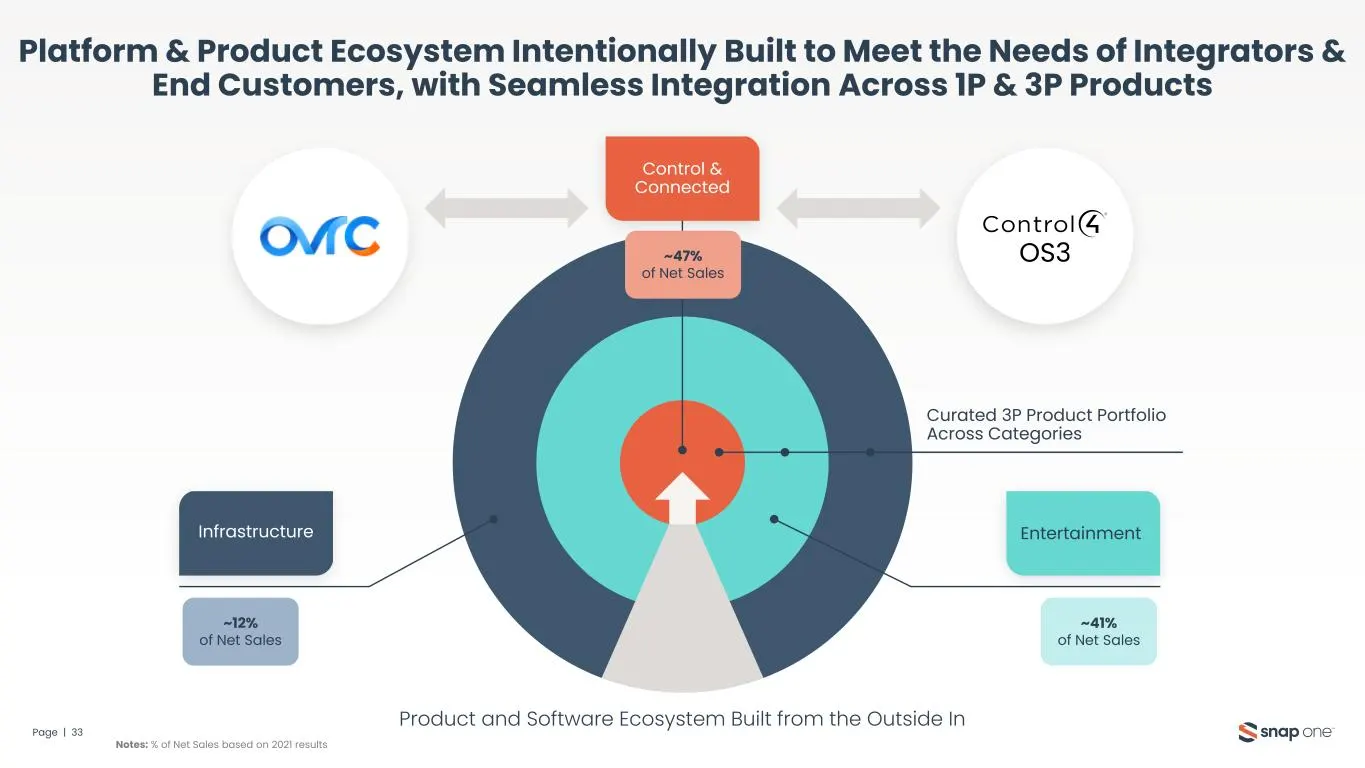
Platform & Product Ecosystem Intentionally Built to Meet the Needs of Integrators & End Customers, with Seamless Integration Across 1P & 3P Products Page | 33 Product and Software Ecosystem Built from the Outside In ~47% of Net Sales Curated 3P Product Portfolio Across Categories ~12% of Net Sales ~
Slide 34: The Snap One Platform Enables Seamless Smart Living Experiences
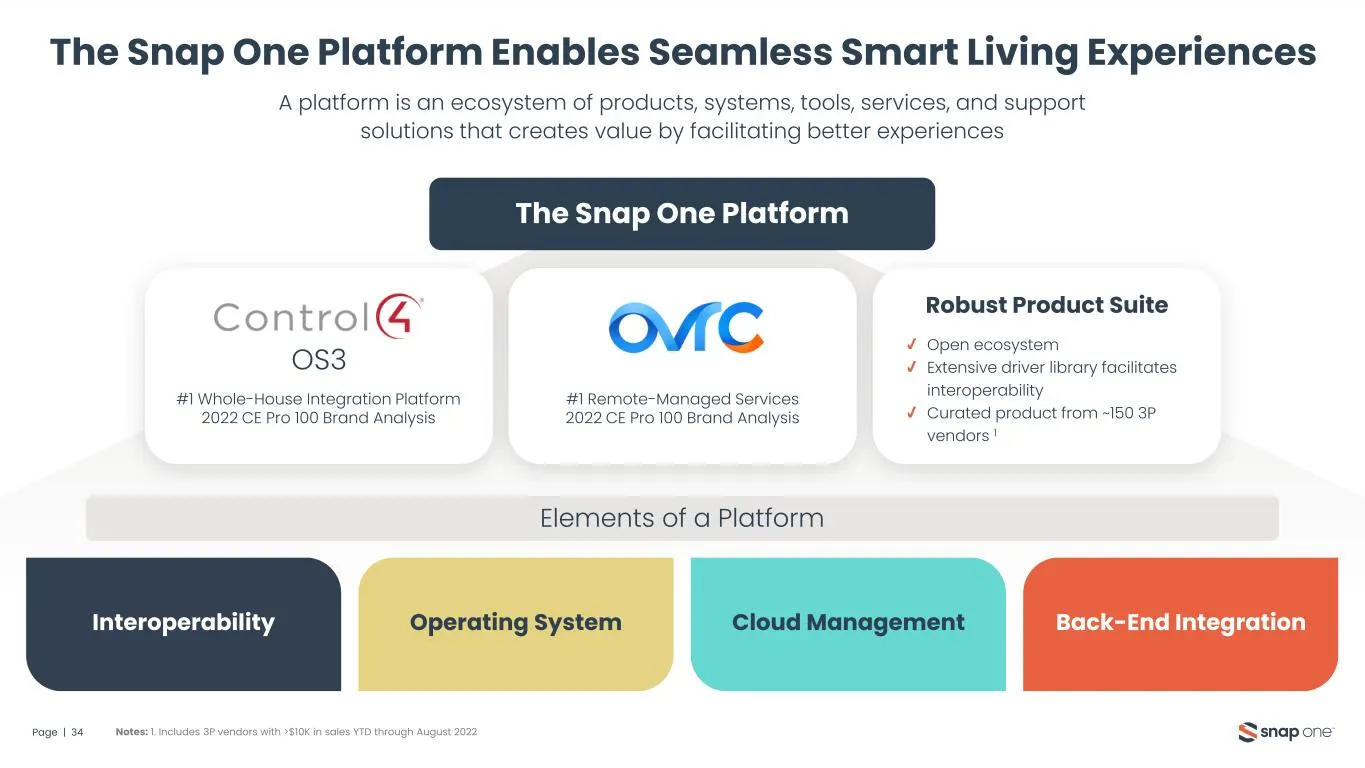
The Snap One Platform Enables Seamless Smart Living Experiences Page | 34 A platform is an ecosystem of products, systems, tools, services, and support solutions that creates value by facilitating better experiences Elements of a Platform The Snap One Platform OS3 #1 Whole-House Integration Platform
Slide 35: World Class Product Development Organization
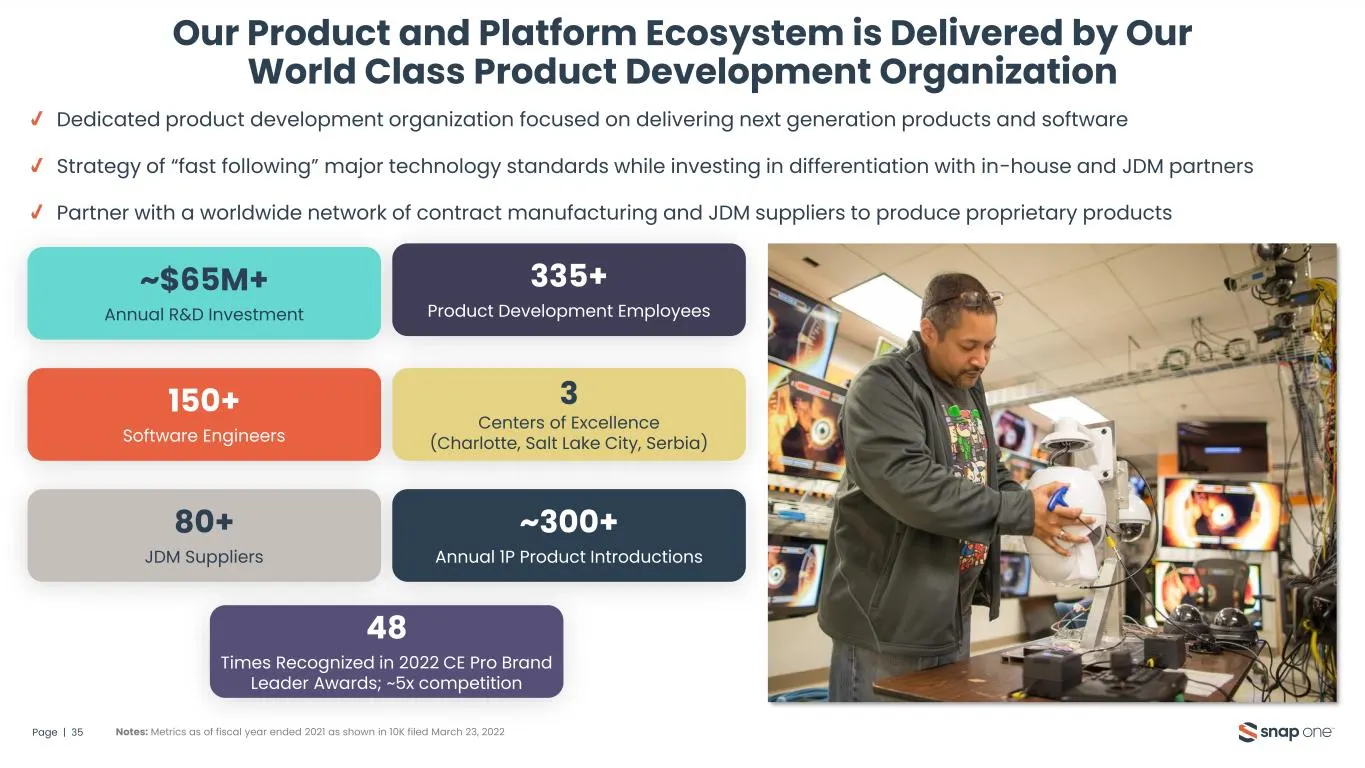
Our Product and Platform Ecosystem is Delivered by Our World Class Product Development Organization Page | 35 Notes: Metrics as of fiscal year ended 2021 as shown in 10K filed March 23, 2022 Dedicated product development organization focused on delivering next generation products and software Strate
Slide 36: From a Period of Integration to a Period of Innovation
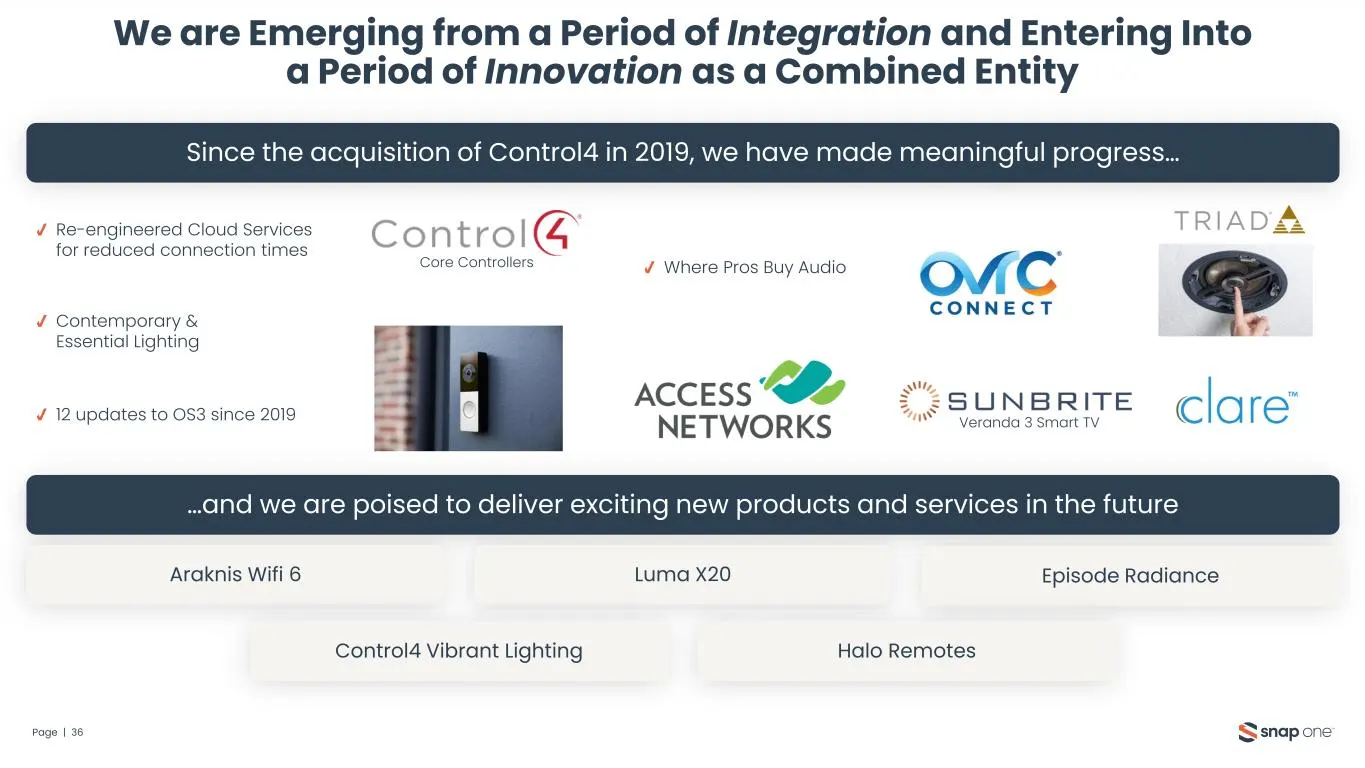
We are Emerging from a Period of Integration and Entering Into a Period of Innovation as a Combined Entity Page | 36 Since the acquisition of Control4 in 2019, we have made meaningful progress… …and we are poised to deliver exciting new products and services in the future 12 updates to OS3 since 201
Slide 37: Customers and Partners Want More From the Smart Living Industry
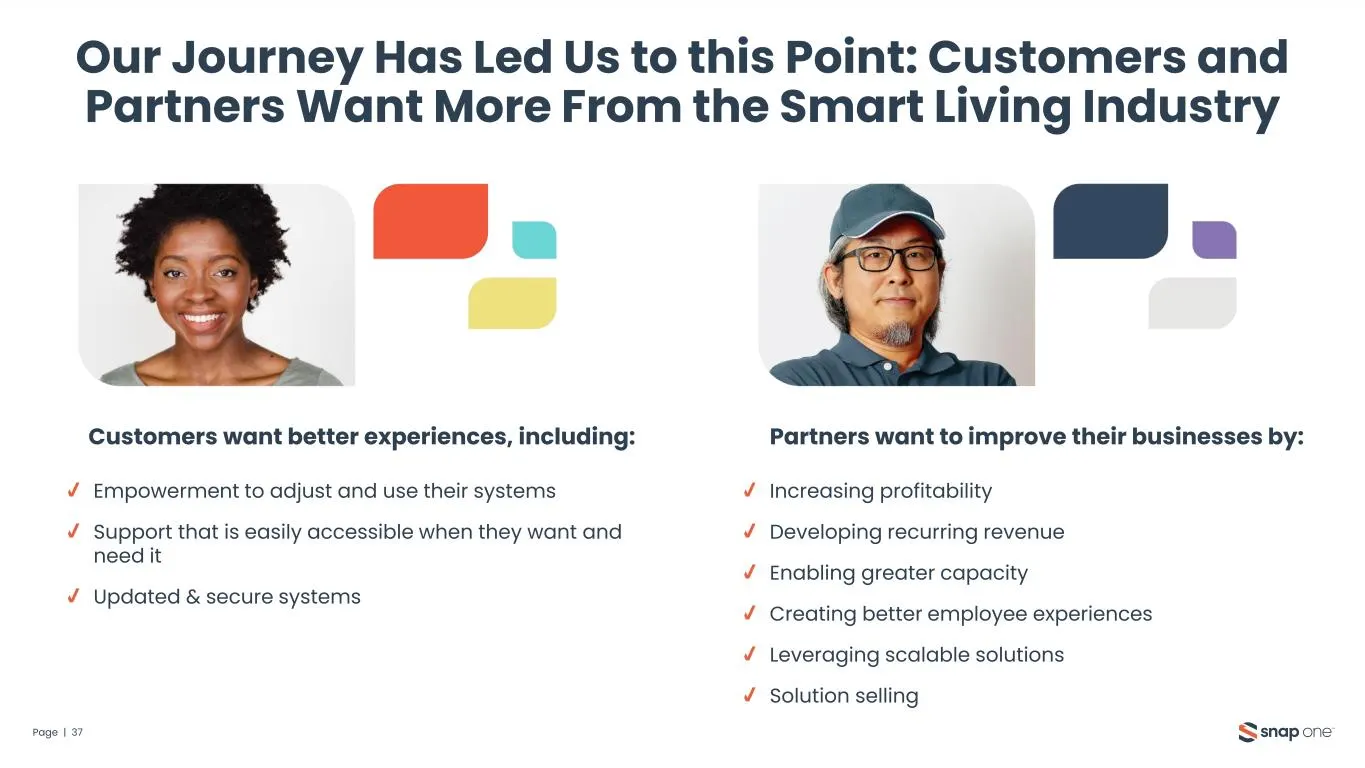
Our Journey Has Led Us to this Point: Customers and Partners Want More From the Smart Living Industry Page | 37 Empowerment to adjust and use their systems Support that is easily accessible when they want and need it Updated & secure systems Increasing profitability Developing recurring revenue Enab
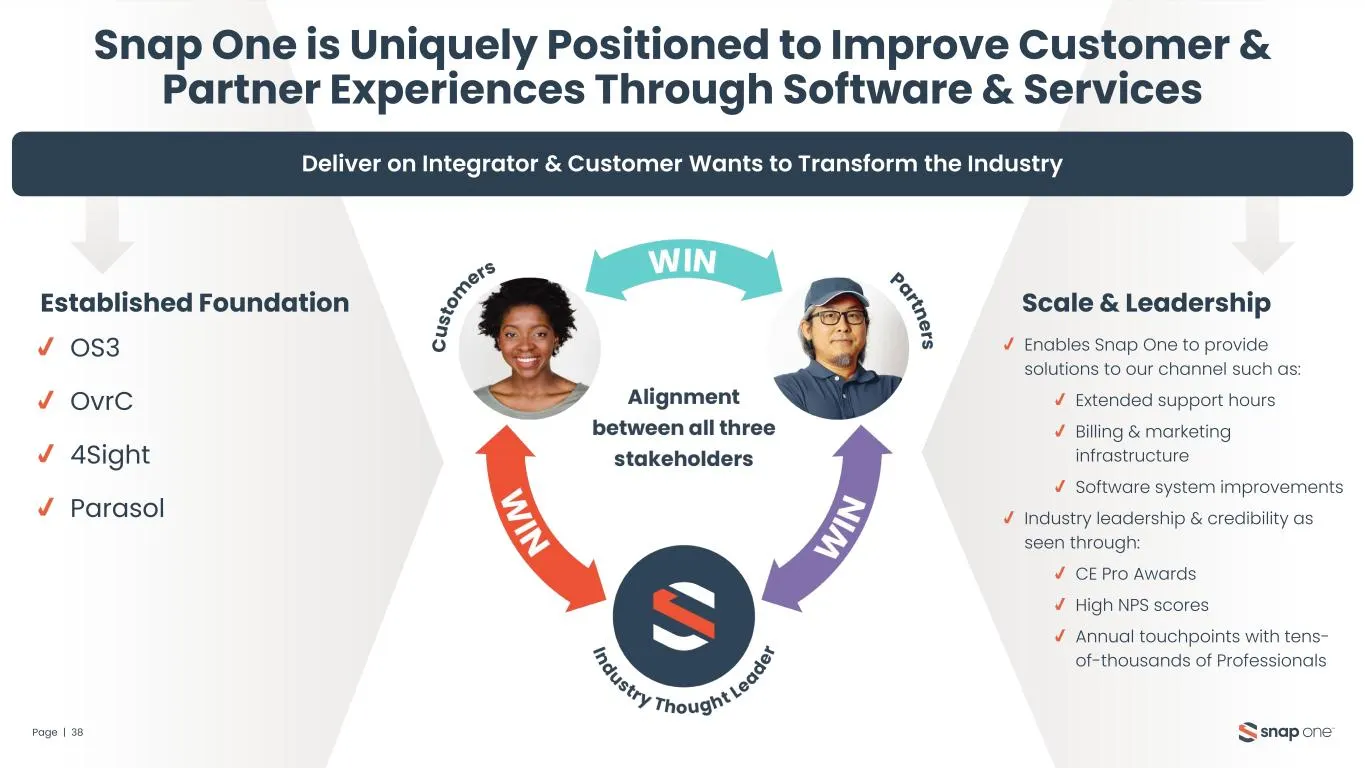
Slide 38: Uniquely Positioned to Improve Experiences Through Software & Services
Snap One is Uniquely Positioned to Improve Customer & Partner Experiences Through Software & Services Page | 38 Deliver on Integrator & Customer Wants to Transform the Industry Established Foundation OS3 OvrC 4Sight Parasol Enables Snap One to provide solutions to our channel such as: Extended suppo
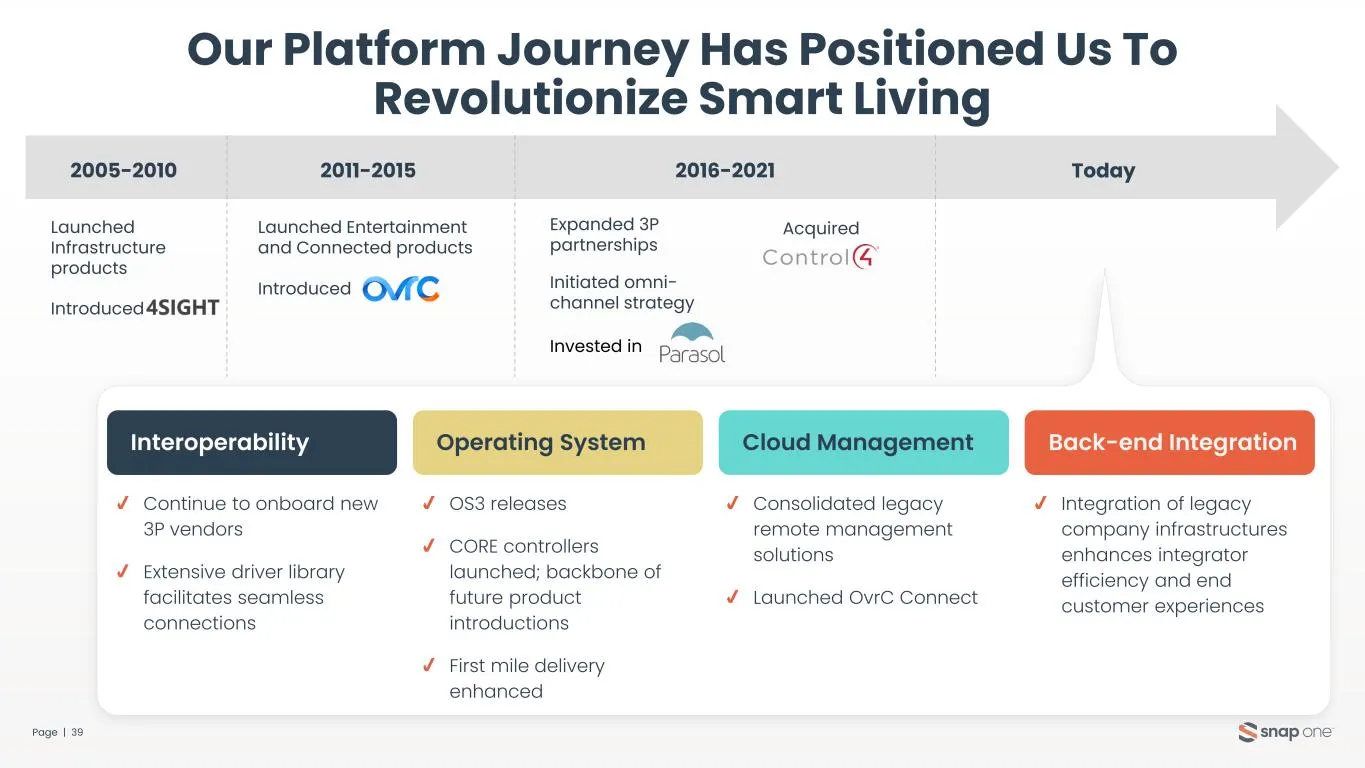
Slide 39: Our Platform Journey Has Positioned Us To Revolutionize Smart Living
Our Platform Journey Has Positioned Us To Revolutionize Smart Living Page | 39 2005-2010 Launched Infrastructure products 2011-2015 Launched Entertainment and Connected products Introduced 2016-2021 Expanded 3P partnerships Acquired Today Interoperability Operating System Cloud Management Continue t
Slide 40: Integrator Panel
Integrator Panel
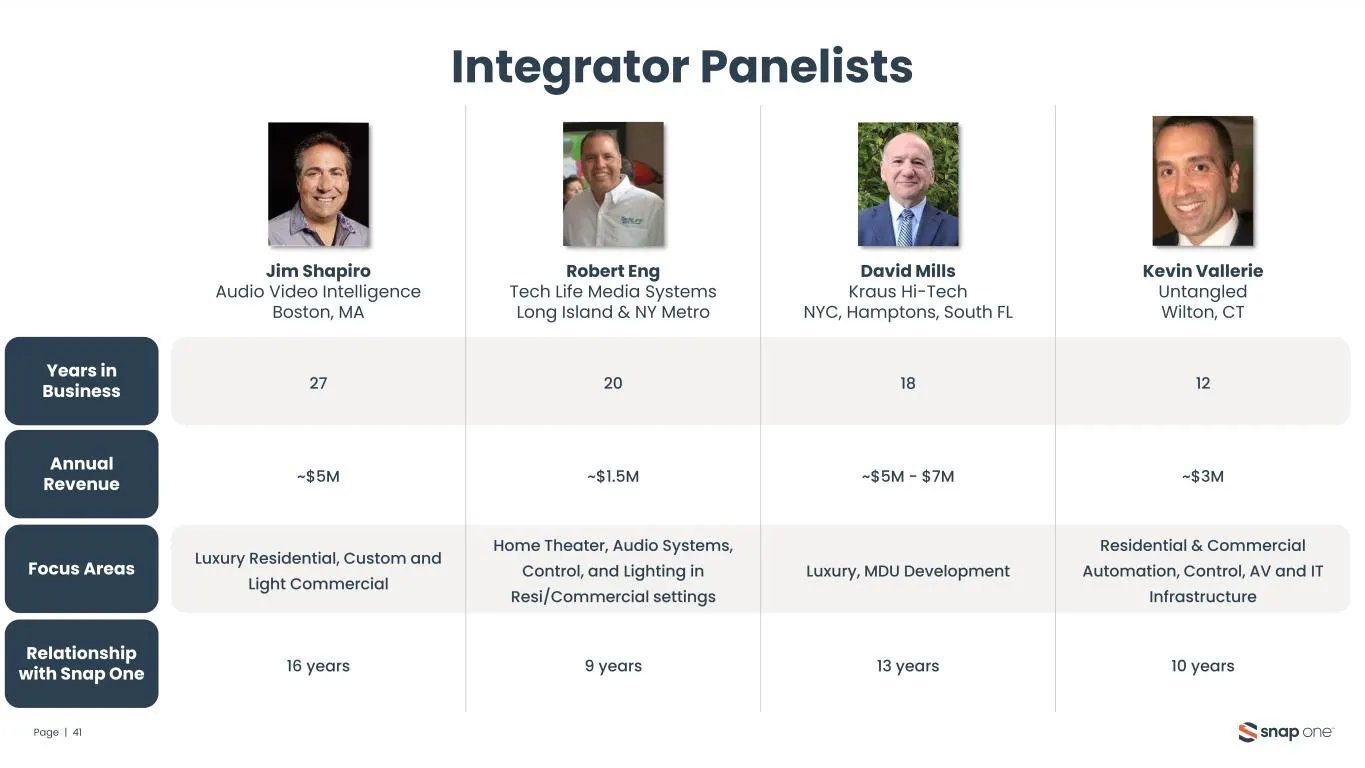
Slide 41: Integrator Panelists
Integrator Panelists Page | 41 27 Jim Shapiro Audio Video Intelligence Boston, MA Years in Business Robert Eng Tech Life Media Systems Long Island & NY Metro David Mills Kraus Hi-Tech NYC, Hamptons, South FL Kevin Vallerie Untangled Wilton, CT Annual Revenue Focus Areas 20 18 12 ~$5M ~$1.5M ~$5M - $
Slide 42: Scaling Platform with Profitable Growth
Scaling Platform with Profitable Growth
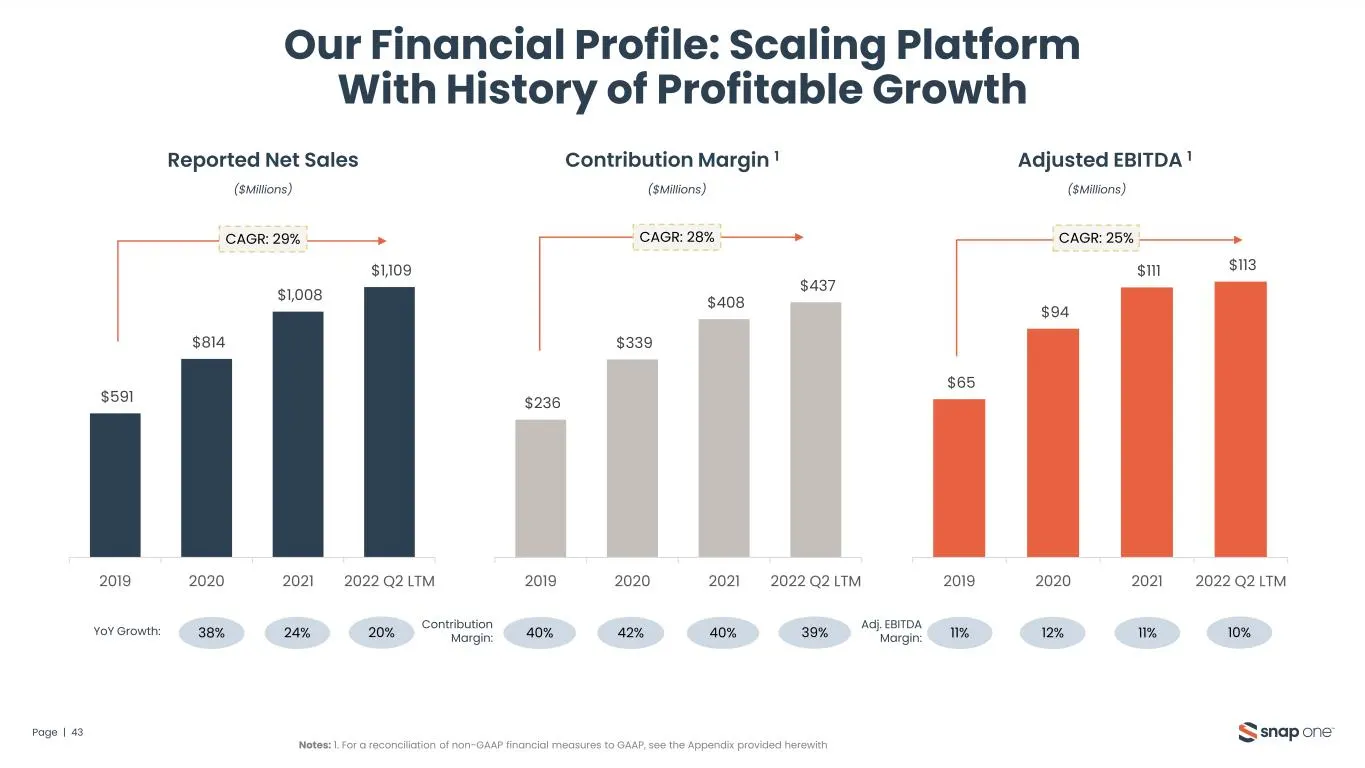
Slide 43: Our Financial Profile: Scaling Platform With History of Profitable Growth
$591 $814 $1,008 $1,109 2019 2020 2021 2022 Q2 LTM $236 $339 $408 $437 2019 2020 2021 2022 Q2 LTM $65 $94 $111 $113 2019 2020 2021 2022 Q2 LTM Notes: 1. For a reconciliation of non-GAAP financial measures to GAAP, see the Appendix provided herewith 11% 12%Adj. EBITDA Margin:40% 40%Contribution Margi
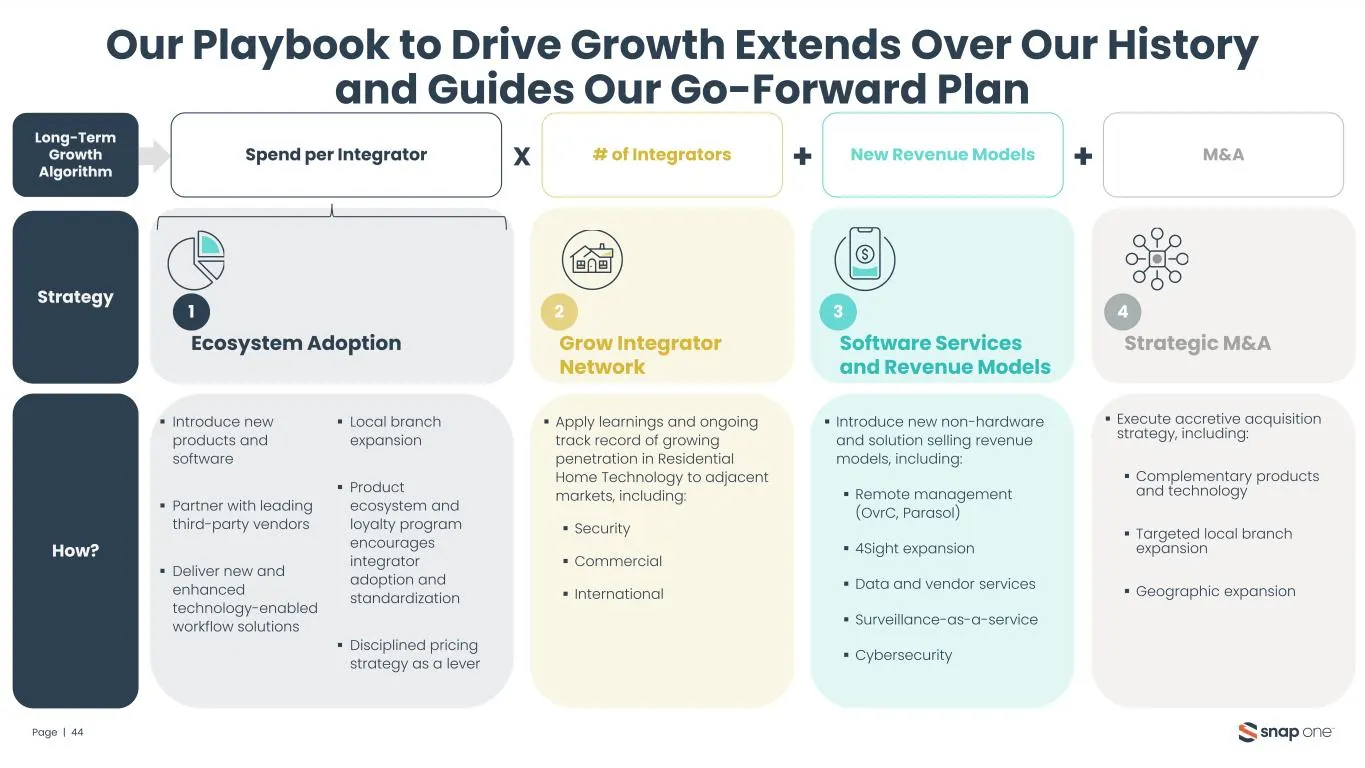
Slide 44: Our Playbook to Drive Growth
Our Playbook to Drive Growth Extends Over Our History and Guides Our Go-Forward Plan Page | 44 Ecosystem Adoption ▪ Introduce new products and software ▪ Partner with leading third-party vendors ▪ Deliver new and enhanced technology-enabled workflow solutions ▪ Local branch expansion ▪ Product ecosy
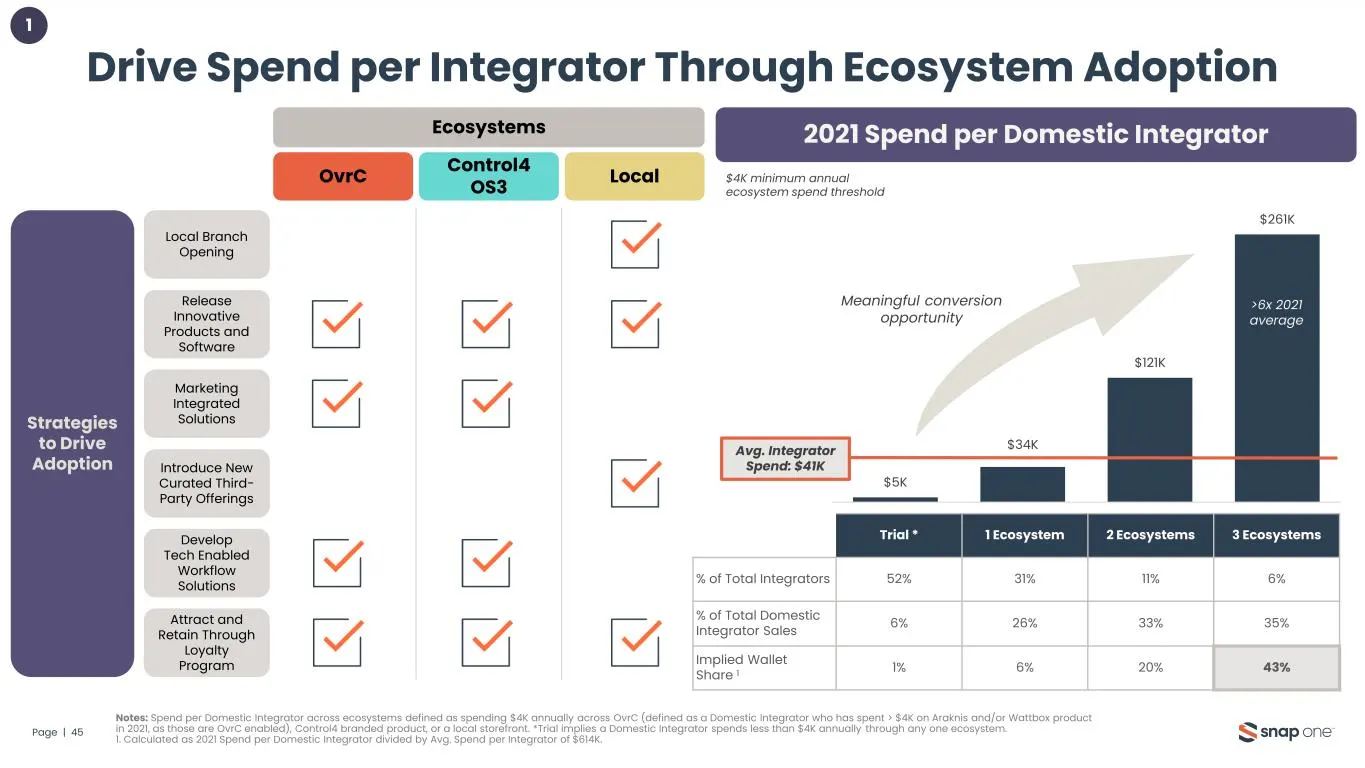
Slide 45: Drive Spend per Integrator Through Ecosystem Adoption
$5K $34K $121K $261K Trial 1 Ecosystem 2 Ecosystems 3 Ecosystems Drive Spend per Integrator Through Ecosystem Adoption Page | 45 1 OvrC Control4 OS3 Local Local Branch Opening Release Innovative Products and Software Introduce New Curated Third- Party Offerings Develop Tech Enabled Workflow Solution
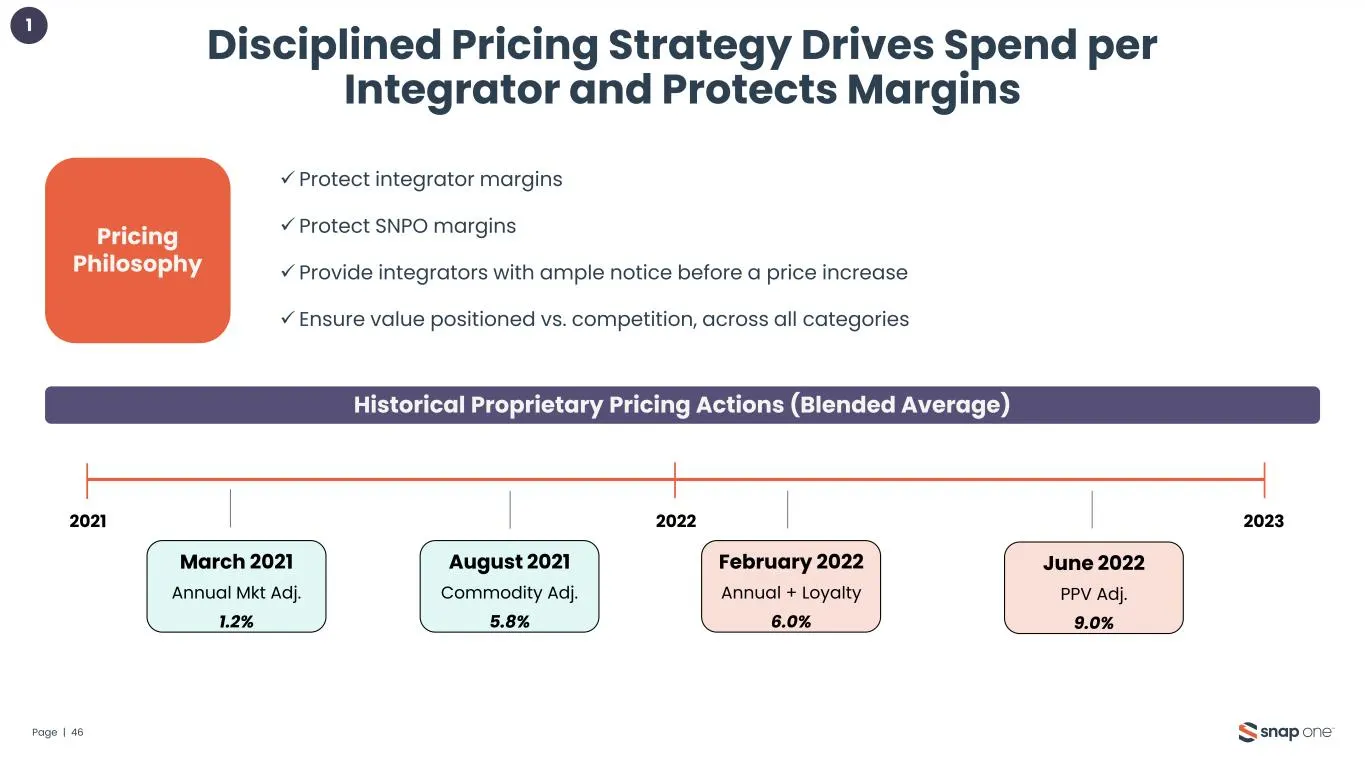
Slide 46: Disciplined Pricing Strategy Drives Spend per Integrator and Protects Margins
Disciplined Pricing Strategy Drives Spend per Integrator and Protects Margins Page | 46 1 2021 2023 March 2021 Annual Mkt Adj. 1.2% August 2021 Commodity Adj. 5.8% February 2022 Annual + Loyalty 6.0% June 2022 PPV Adj. 9.0% Pricing Philosophy ✓ Protect integrator margins ✓ Protect SNPO margins ✓ Pro
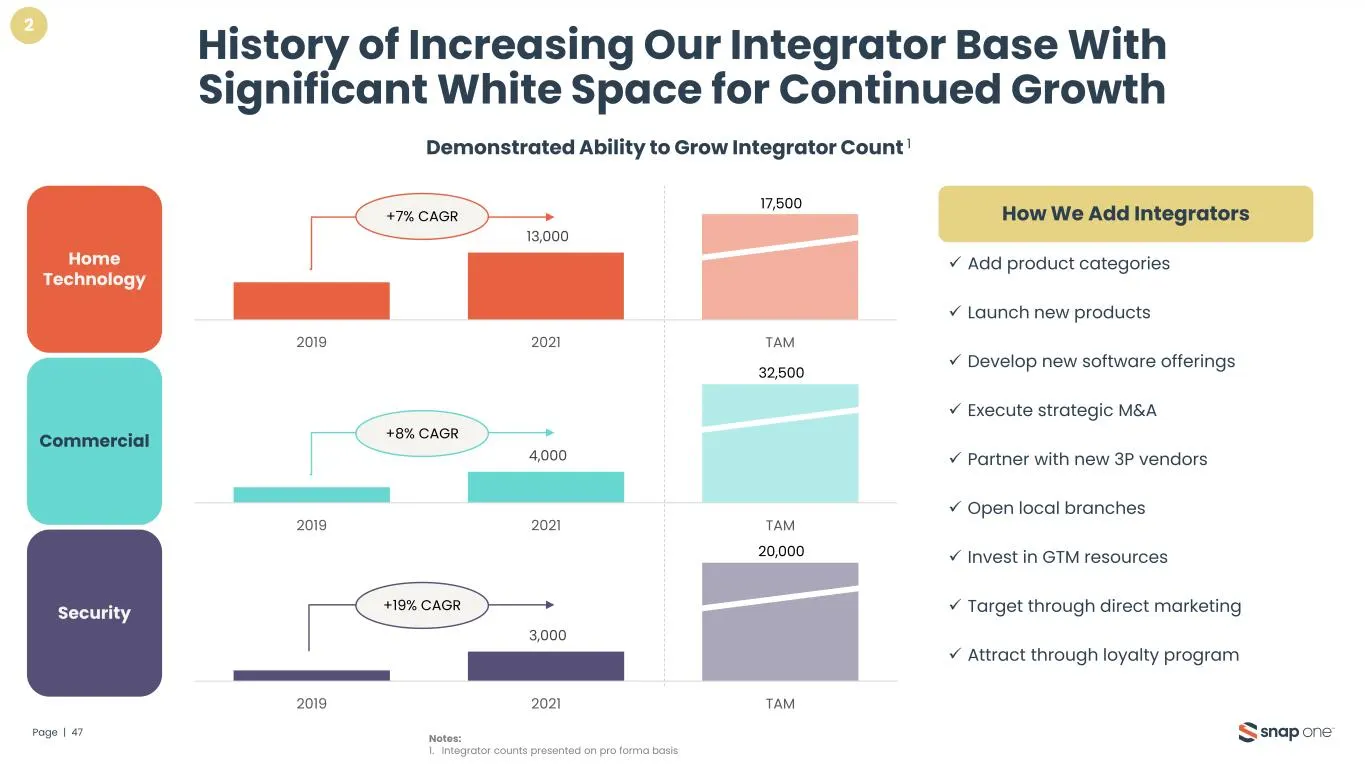
Slide 47: History of Increasing Integrator Base With Significant White Space
2 History of Increasing Our Integrator Base With Significant White Space for Continued Growth Page | 47 Notes: 1. Integrator counts presented on pro forma basis Demonstrated Ability to Grow Integrator Count 1 Home Technology Commercial Security ✓ Add product categories ✓ Launch new products ✓ Develo
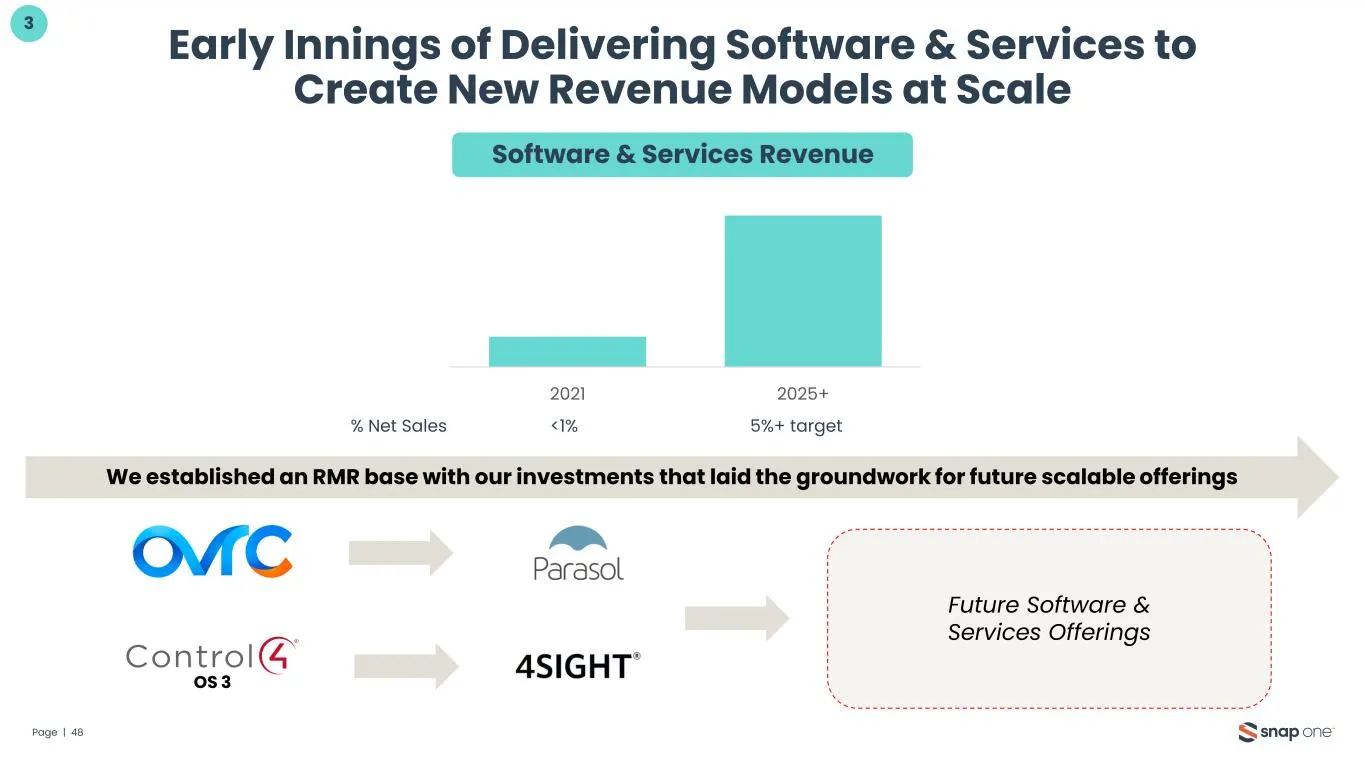
Slide 48: Early Innings of Delivering Software & Services to Create New Revenue Models
3 Early Innings of Delivering Software & Services to Create New Revenue Models at Scale Page | 48 OS 3 2021 2025+ Software & Services Revenue % Net Sales <1% 5%+ target We established an RMR base with our investments that laid the groundwork for future scalable offerings Future Software & Services O
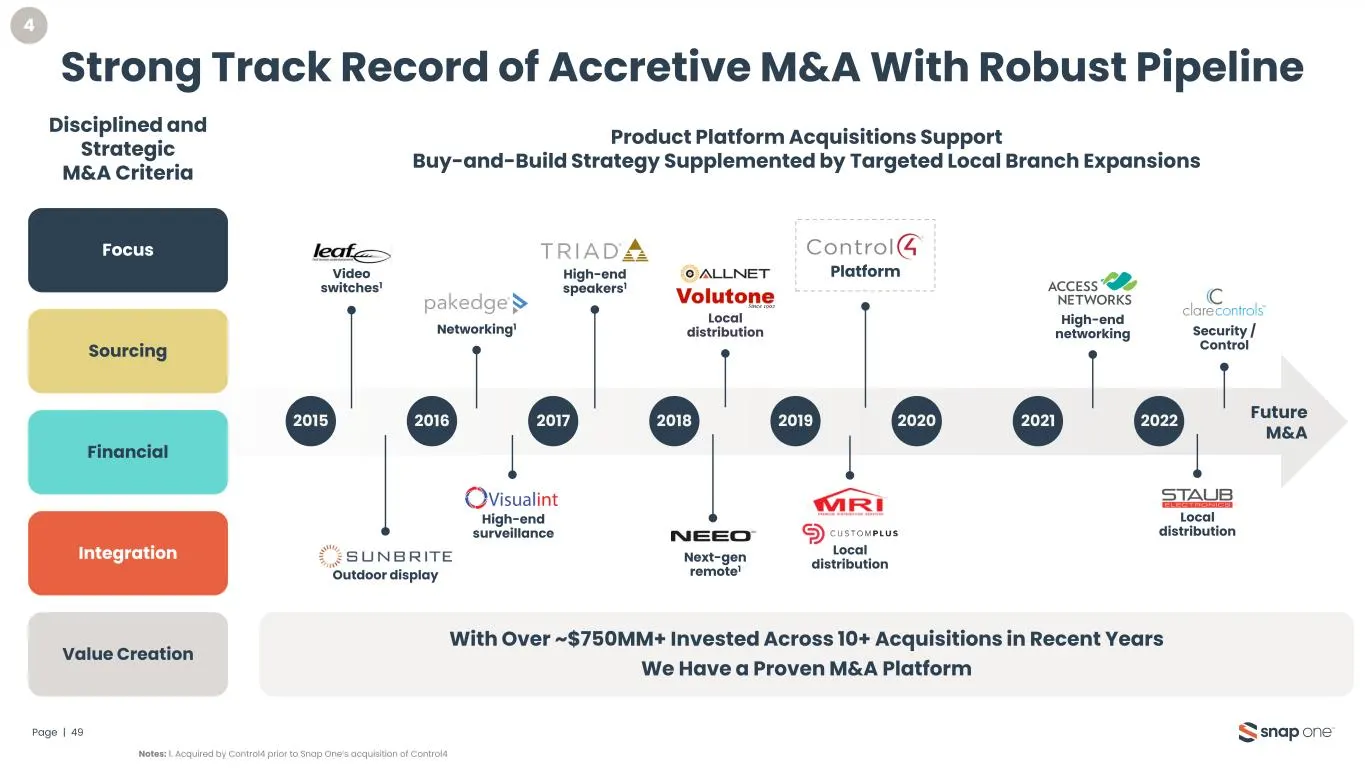
Slide 49: Strong Track Record of Accretive M&A With Robust Pipeline
Strong Track Record of Accretive M&A With Robust Pipeline Page | 49 4 Notes: 1. Acquired by Control4 prior to Snap One’s acquisition of Control4 With Over ~$750MM+ Invested Across 10+ Acquisitions in Recent Years We Have a Proven M&A Platform Focus Sourcing Financial Integration Value Creation Platf
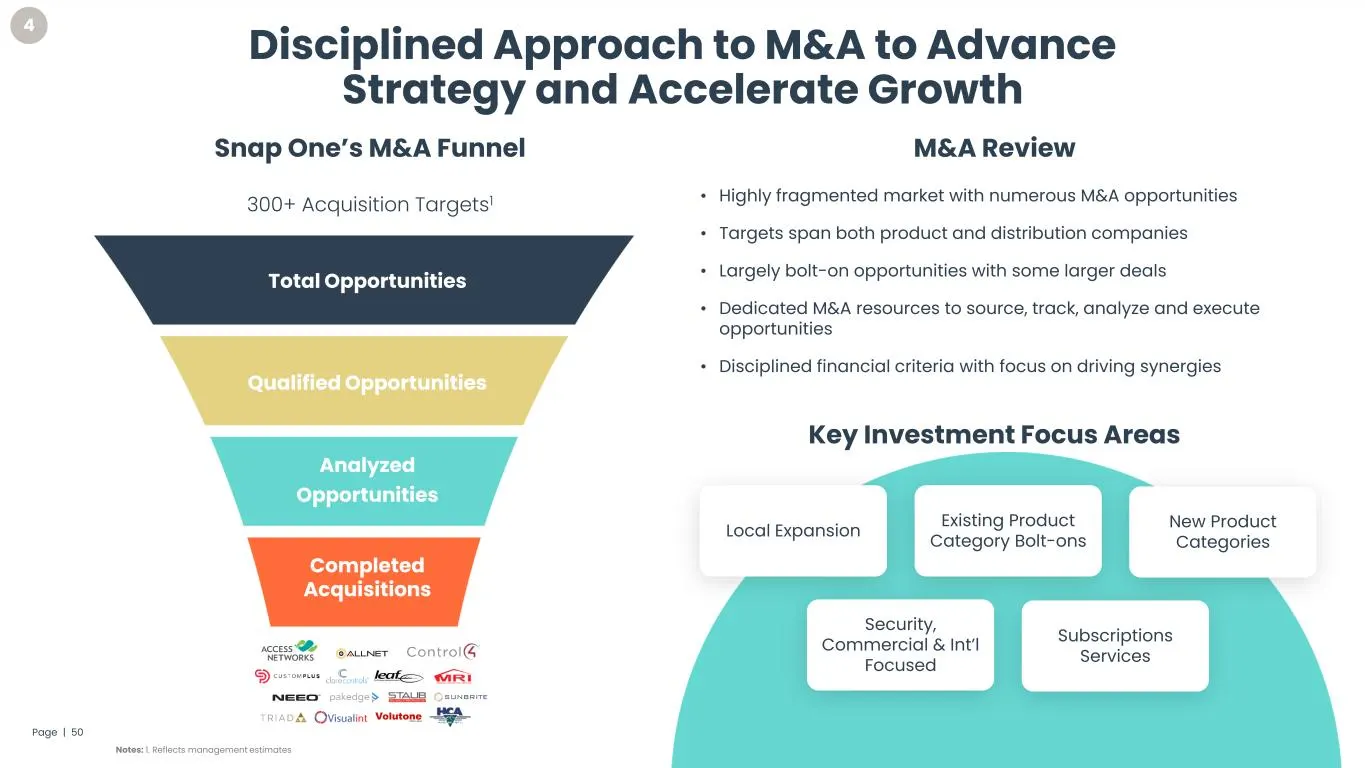
Slide 50: Disciplined Approach to M&A
Notes: 1. Reflects management estimates Disciplined Approach to M&A to Advance Strategy and Accelerate Growth Page | 50 300+ Acquisition Targets1 • Highly fragmented market with numerous M&A opportunities • Targets span both product and distribution companies • Largely bolt-on opportunities with som
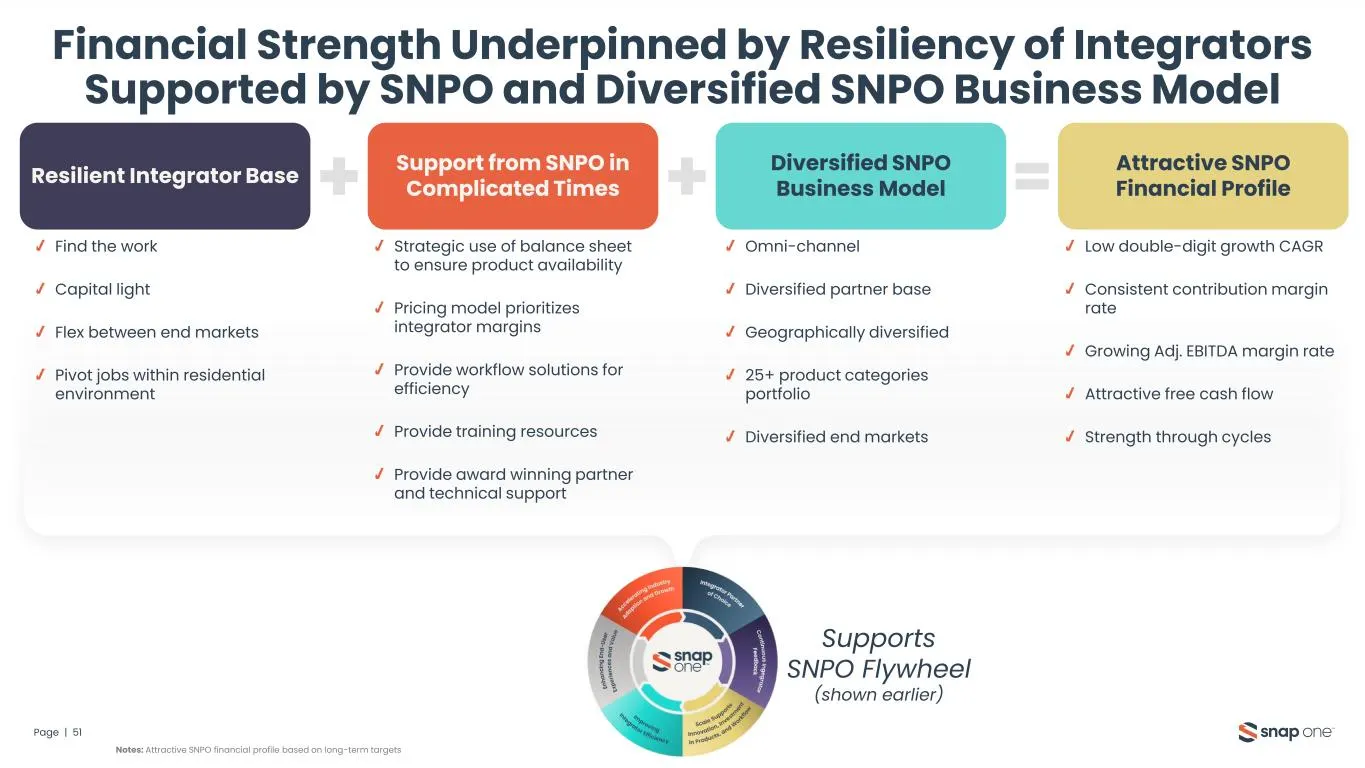
Slide 51: Financial Strength Underpinned by Resiliency of Integrators
Financial Strength Underpinned by Resiliency of Integrators Supported by SNPO and Diversified SNPO Business Model Page | 51 Resilient Integrator Base Support from SNPO in Complicated Times Diversified SNPO Business Model Attractive SNPO Financial Profile Find the work Capital light Flex between end
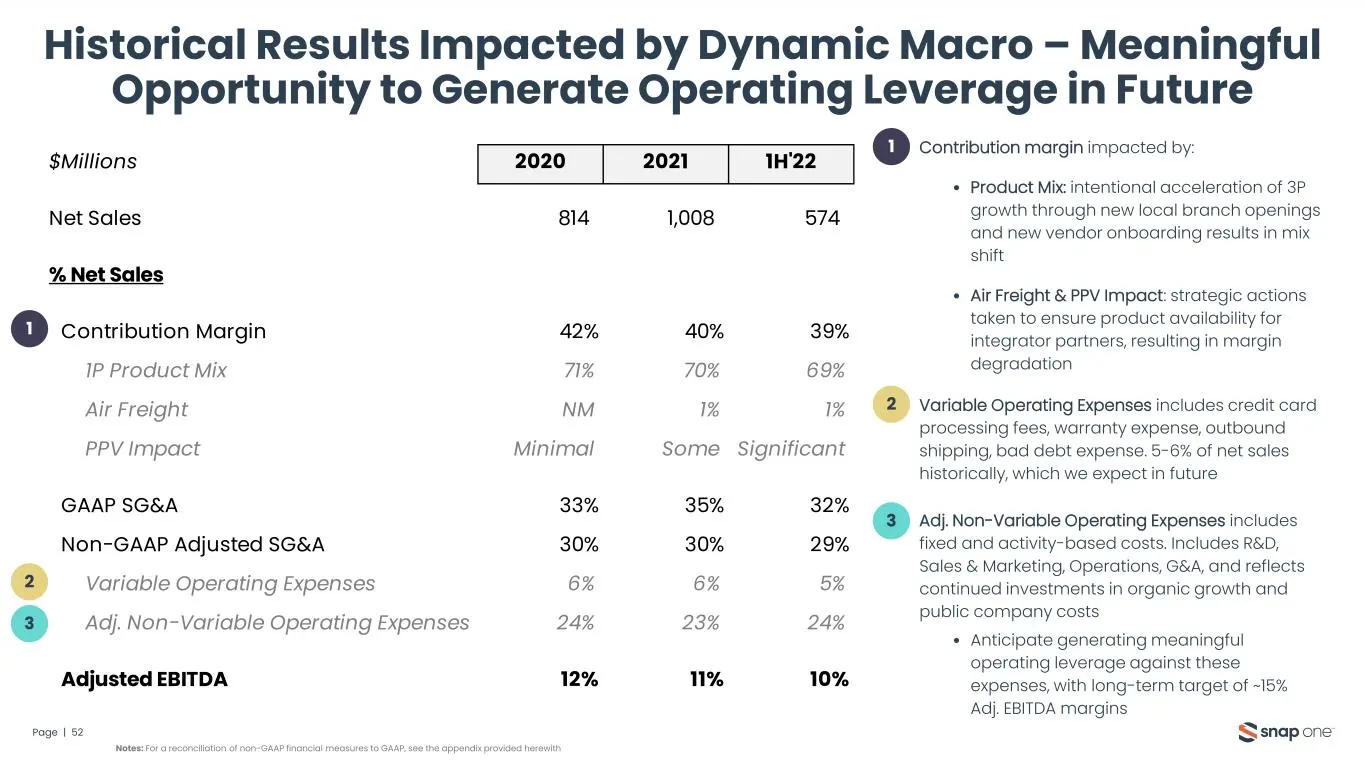
Slide 52: Historical Results Impacted by Dynamic Macro
$Millions 2020 2021 1H'22 Net Sales 814 1,008 574 % Net Sales Contribution Margin 42% 40% 39% 1P Product Mix 71% 70% 69% Air Freight NM 1% 1% PPV Impact Minimal Some Significant GAAP SG&A 33% 35% 32% Non-GAAP Adjusted SG&A 30% 30% 29% Variable Operating Expenses 6% 6% 5% Adj. Non-Variable Operating
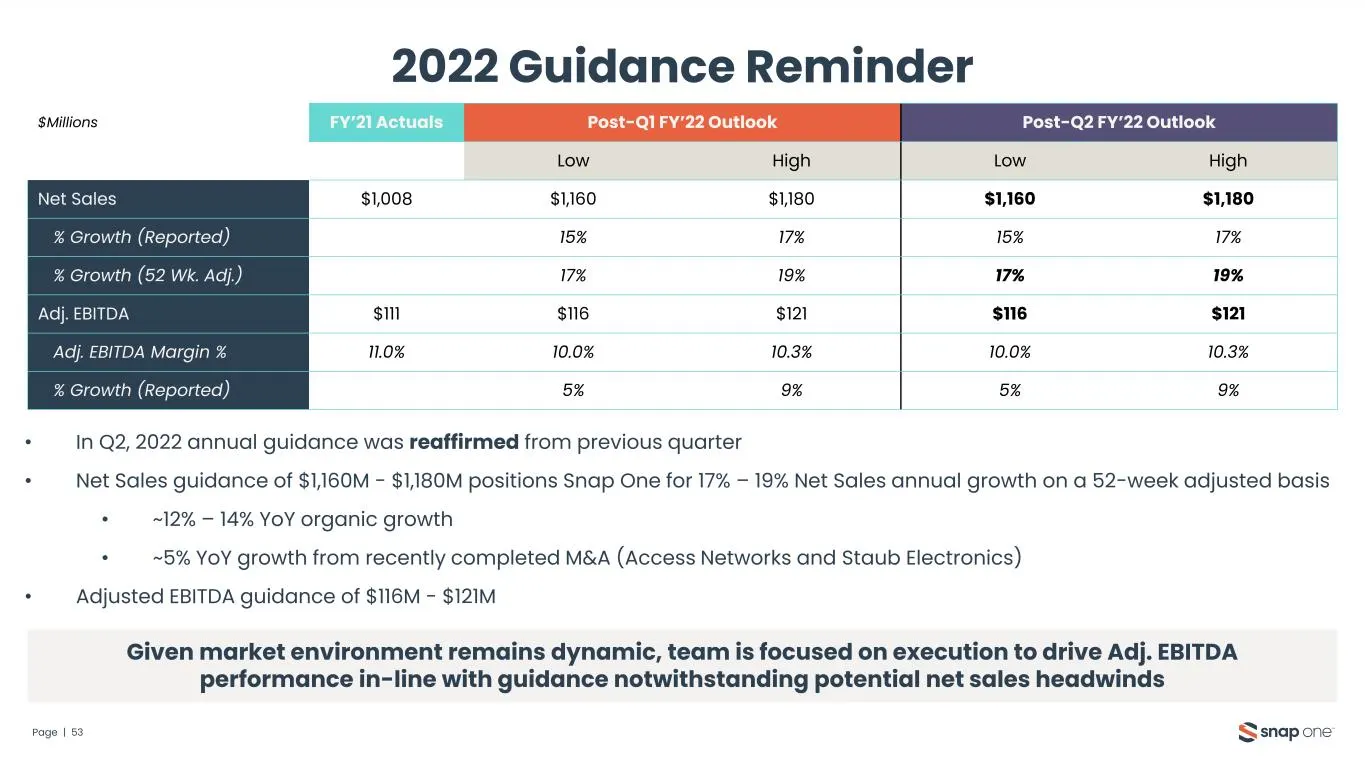
Slide 53: 2022 Guidance Reminder
2022 Guidance Reminder Page | 53 • In Q2, 2022 annual guidance was reaffirmed from previous quarter • Net Sales guidance of $1,160M - $1,180M positions Snap One for 17% – 19% Net Sales annual growth on a 52-week adjusted basis • ~12% – 14% YoY organic growth • ~5% YoY growth from recently completed
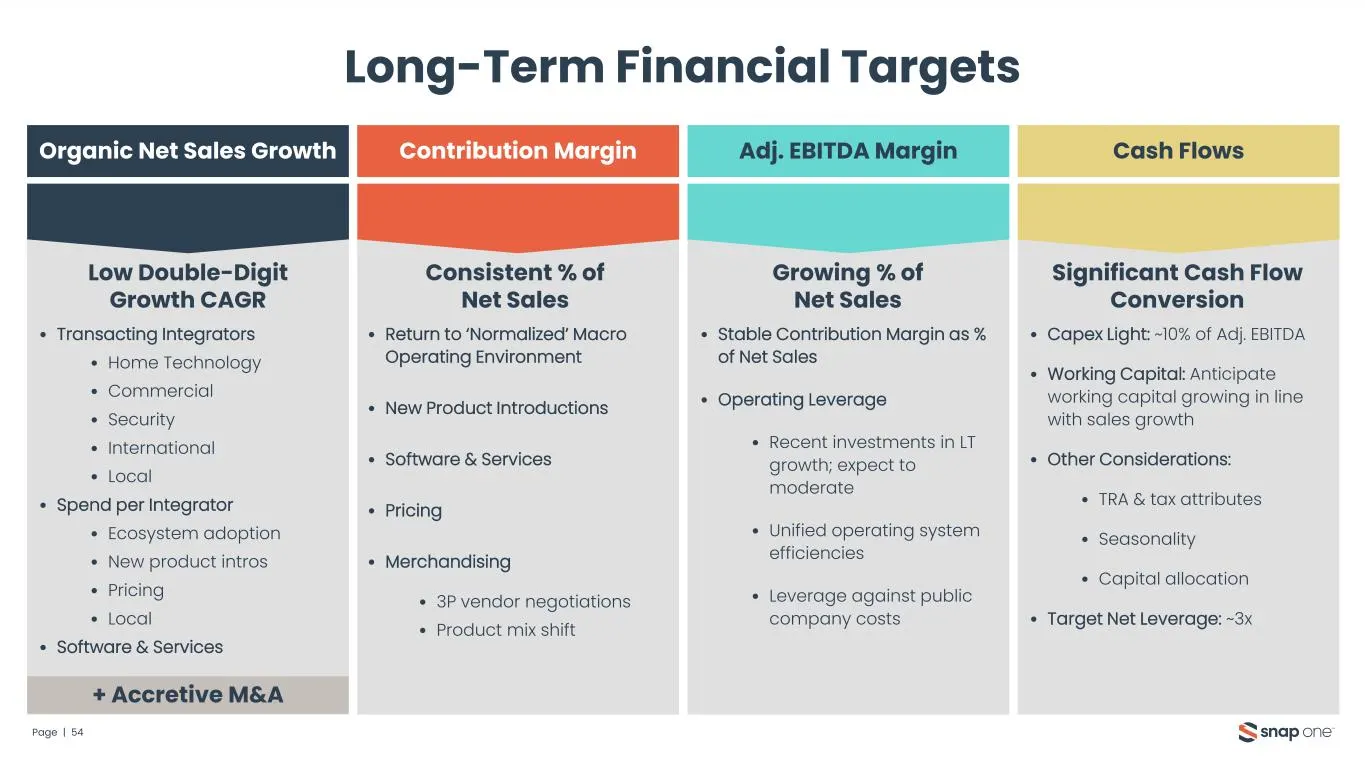
Slide 54: Long-Term Financial Targets
Long-Term Financial Targets Page | 54 Organic Net Sales Growth Contribution Margin Adj. EBITDA Margin Cash Flows • Transacting Integrators • Home Technology • Commercial • Security • International • Local • Spend per Integrator • Ecosystem adoption • New product intros • Pricing • Local • Software &
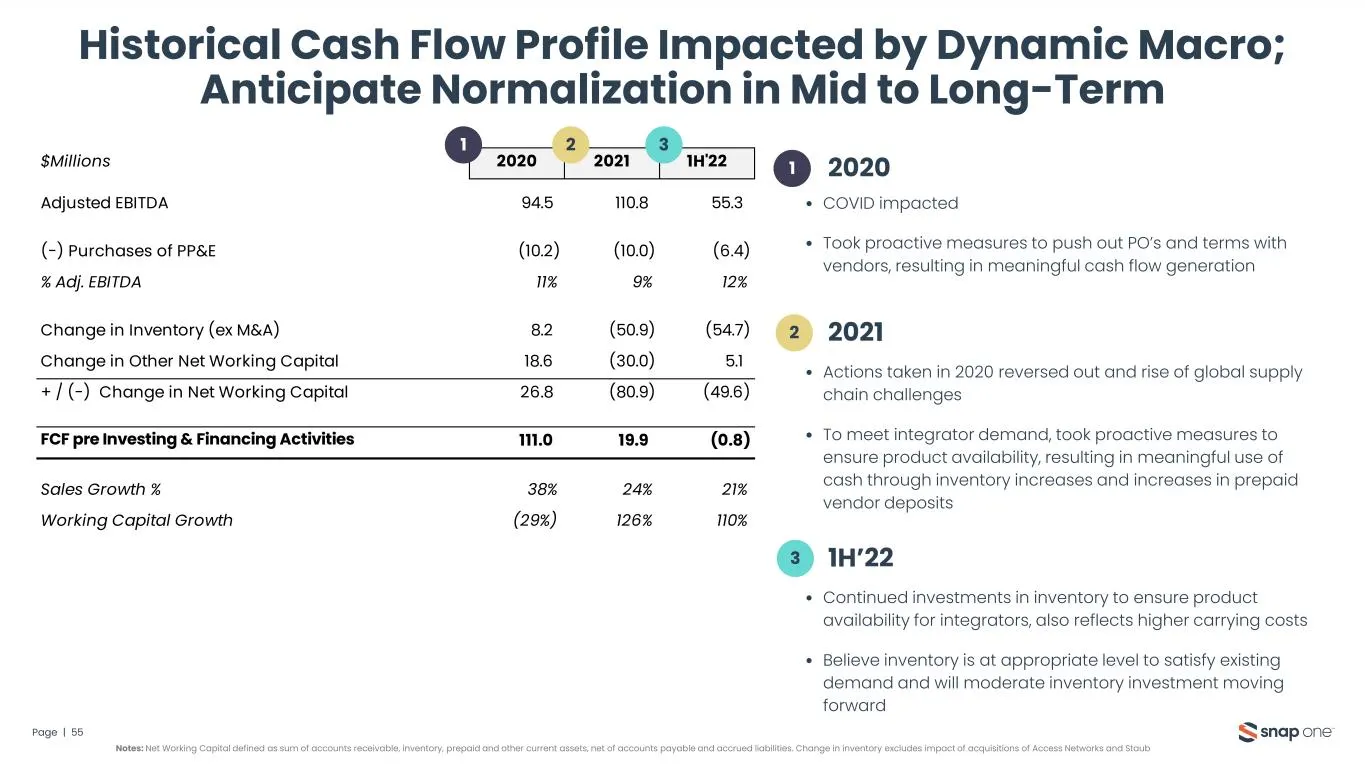
Slide 55: Historical Cash Flow Profile Impacted by Dynamic Macro
$Millions 2020 2021 1H'22 Adjusted EBITDA 94.5 110.8 55.3 (-) Purchases of PP&E (10.2) (10.0) (6.4) % Adj. EBITDA 11% 9% 12% Change in Inventory (ex M&A) 8.2 (50.9) (54.7) Change in Other Net Working Capital 18.6 (30.0) 5.1 + / (-) Change in Net Working Capital 26.8 (80.9) (49.6) FCF pre Investing &
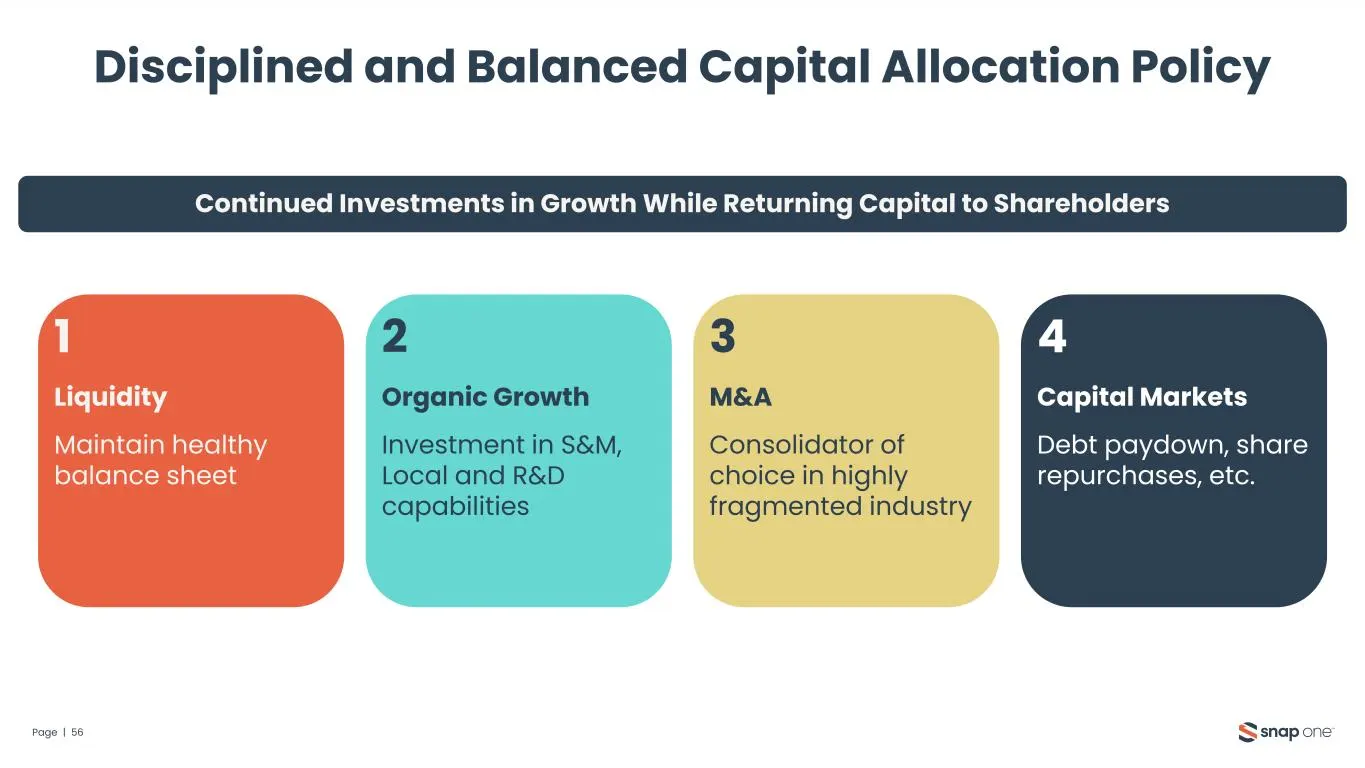
Slide 56: Disciplined and Balanced Capital Allocation Policy
Disciplined and Balanced Capital Allocation Policy Page | 56 2 Organic Growth Investment in S&M, Local and R&D capabilities 3 M&A Consolidator of choice in highly fragmented industry 1 Liquidity Maintain healthy balance sheet 4 Capital Markets Debt paydown, share repurchases, etc. Continued Investme
Slide 57: Closing Remarks
Closing Remarks
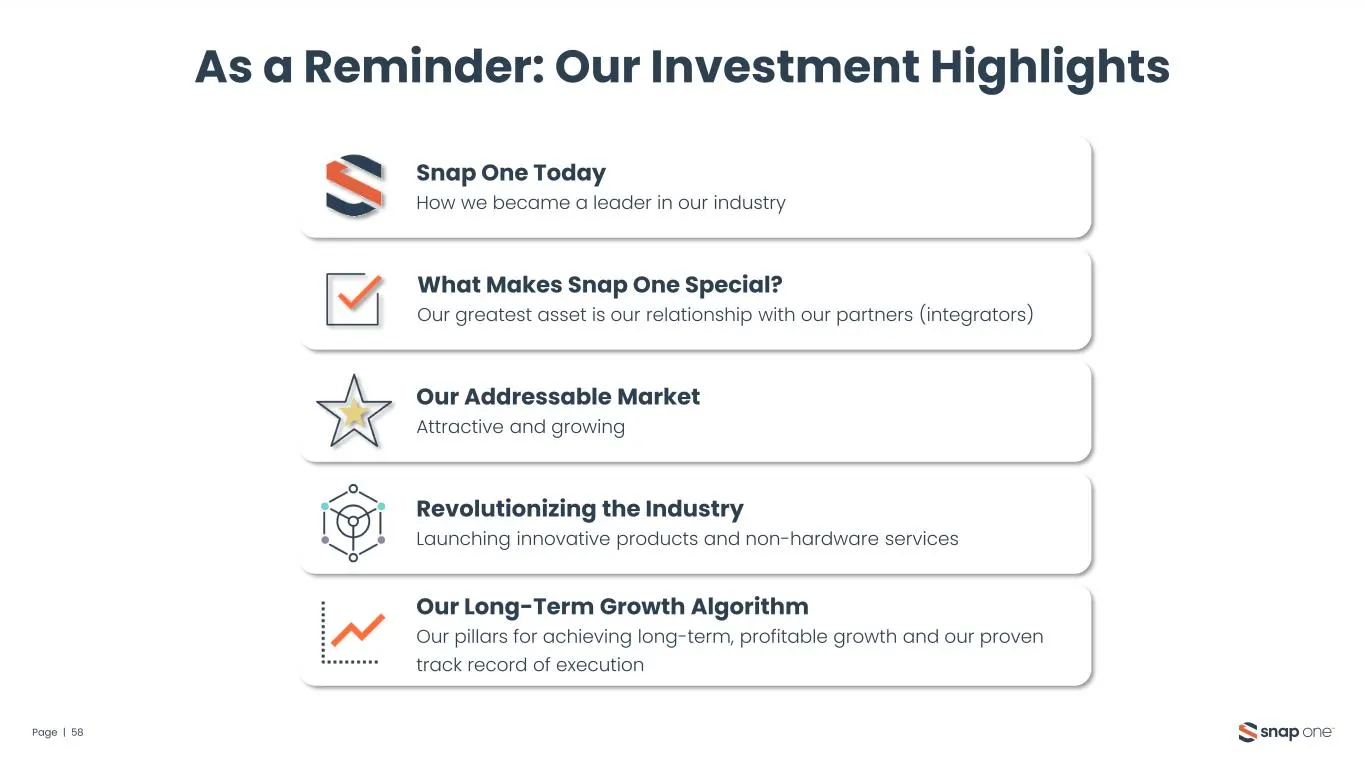
Slide 58: As a Reminder: Our Investment Highlights
Page | 58 As a Reminder: Our Investment Highlights Snap One Today How we became a leader in our industry What Makes Snap One Special? Our greatest asset is our relationship with our partners (integrators) Our Addressable Market Attractive and growing Our Long-Term Growth Algorithm Our pillars for ac
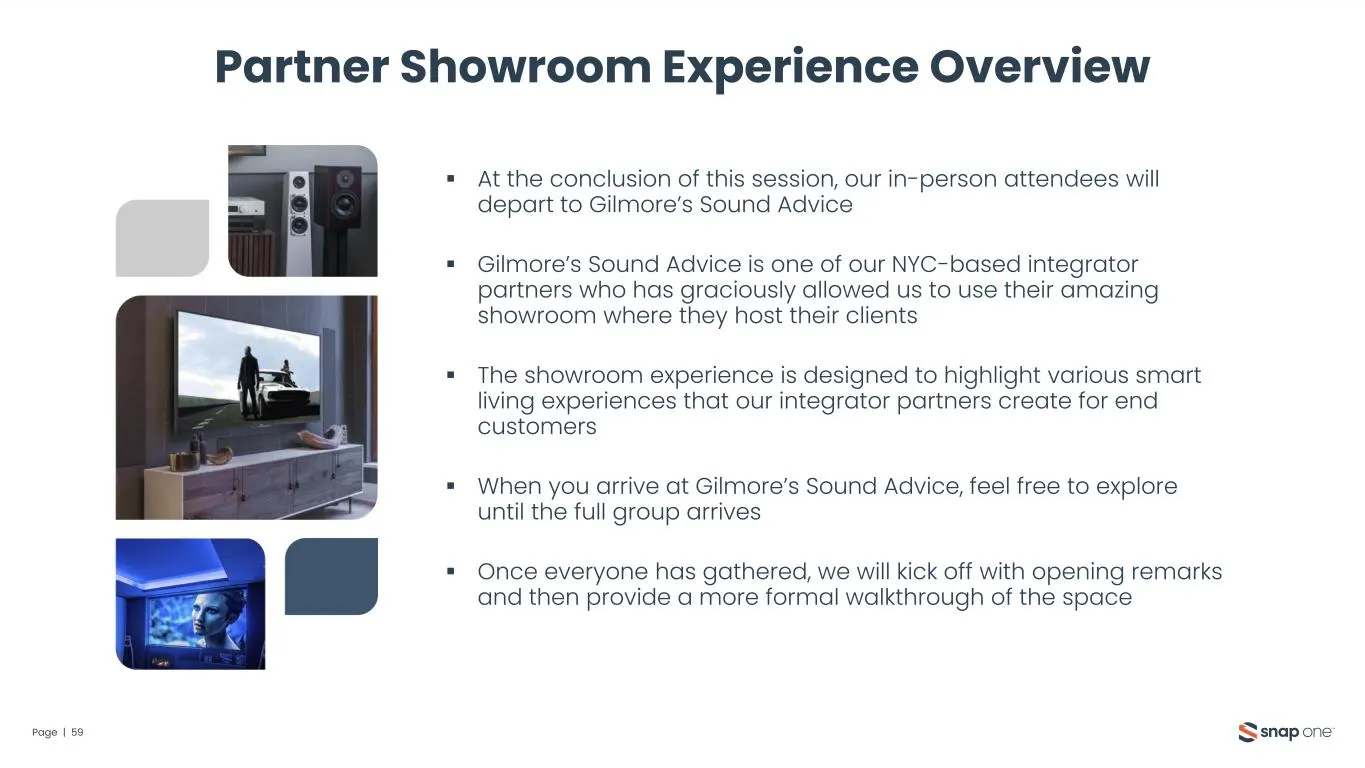
Slide 59: Partner Showroom Experience Overview
Partner Showroom Experience Overview Page | 59 ▪ At the conclusion of this session, our in-person attendees will depart to Gilmore’s Sound Advice ▪ Gilmore’s Sound Advice is one of our NYC-based integrator partners who has graciously allowed us to use their amazing showroom where they host their cli
Slide 60: Appendix
iWin Appendix ee i Se
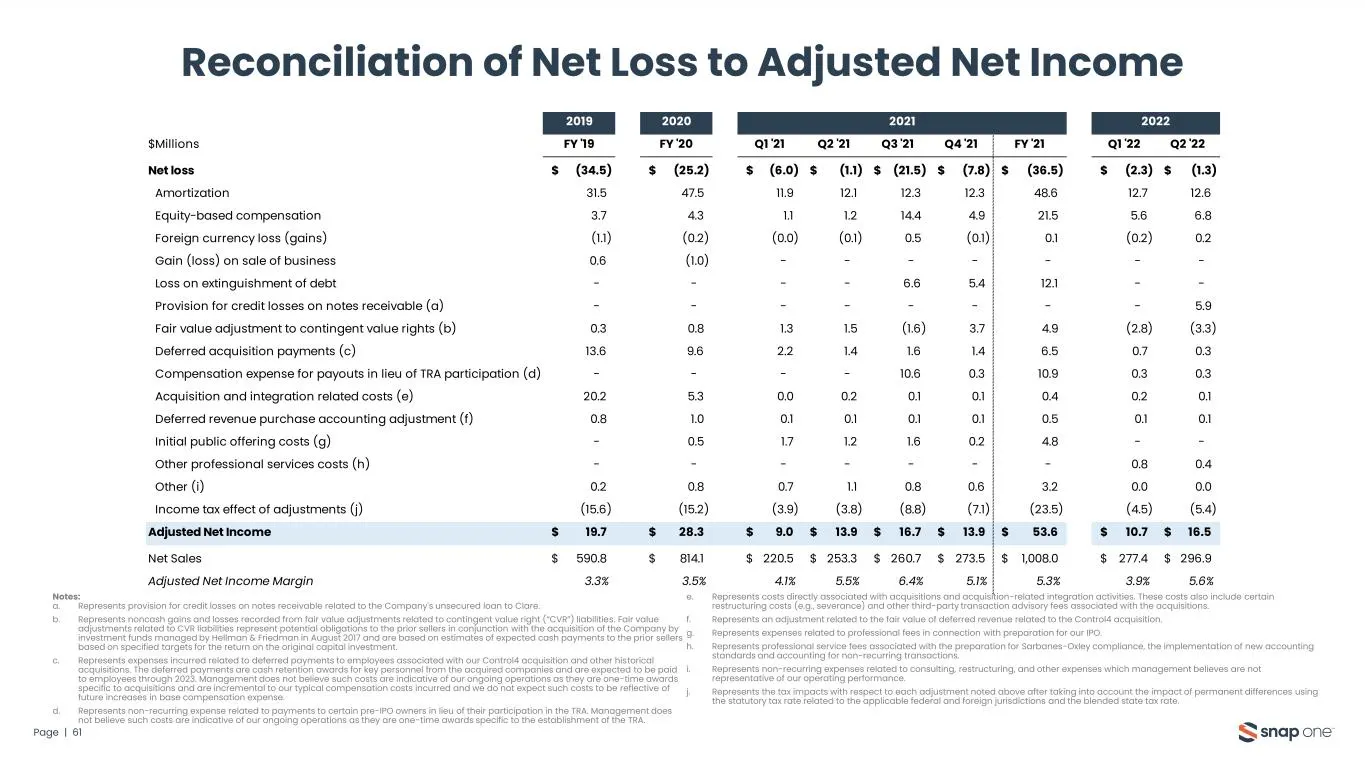
Slide 61: Reconciliation of Net Loss to Adjusted Net Income
Page | 61 Reconciliation of Net Loss to Adjusted Net Income Notes: a. Represents provision for credit losses on notes receivable related to the Company's unsecured loan to Clare. b. Represents noncash gains and losses recorded from fair value adjustments related to contingent value right (“CVR”) lia
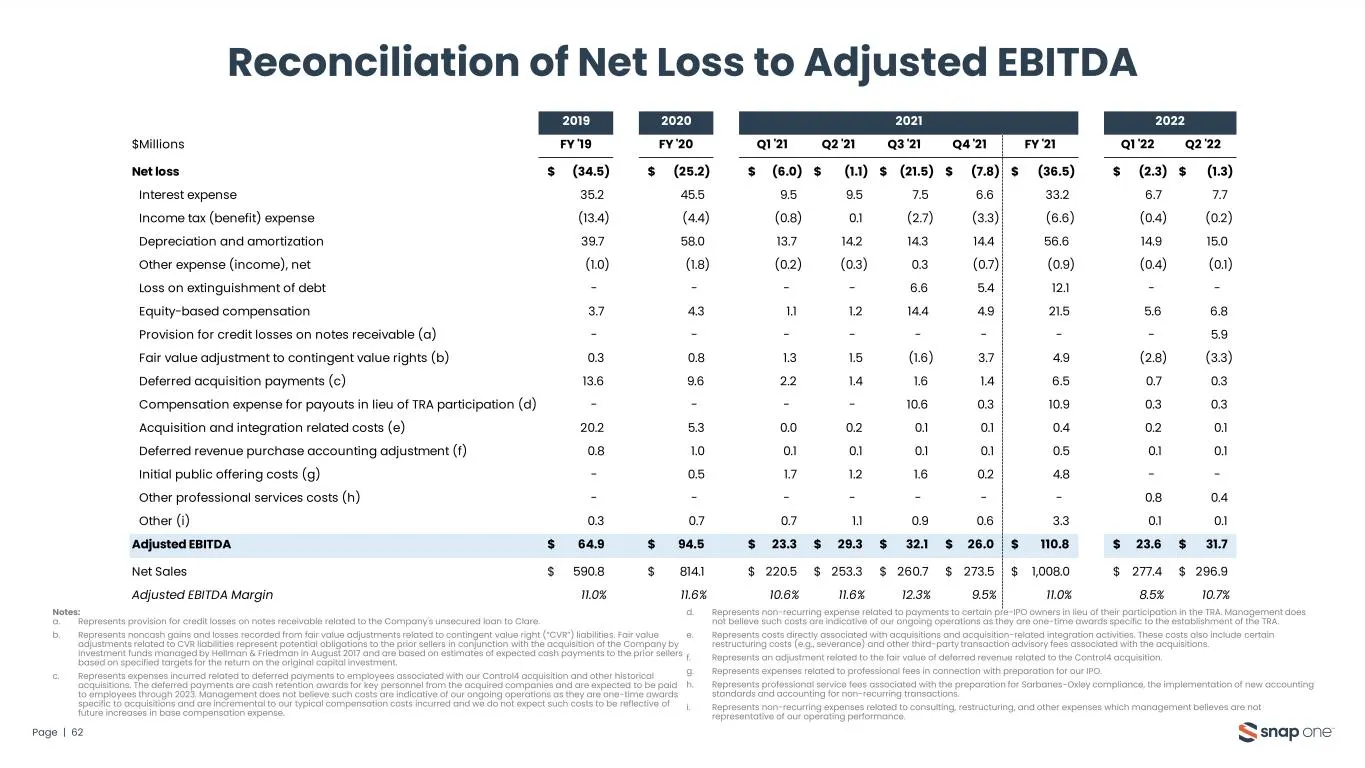
Slide 62: Reconciliation of Net Loss to Adjusted EBITDA
Page | 62 Reconciliation of Net Loss to Adjusted EBITDA Notes: a. Represents provision for credit losses on notes receivable related to the Company's unsecured loan to Clare. b. Represents noncash gains and losses recorded from fair value adjustments related to contingent value right (“CVR”) liabili
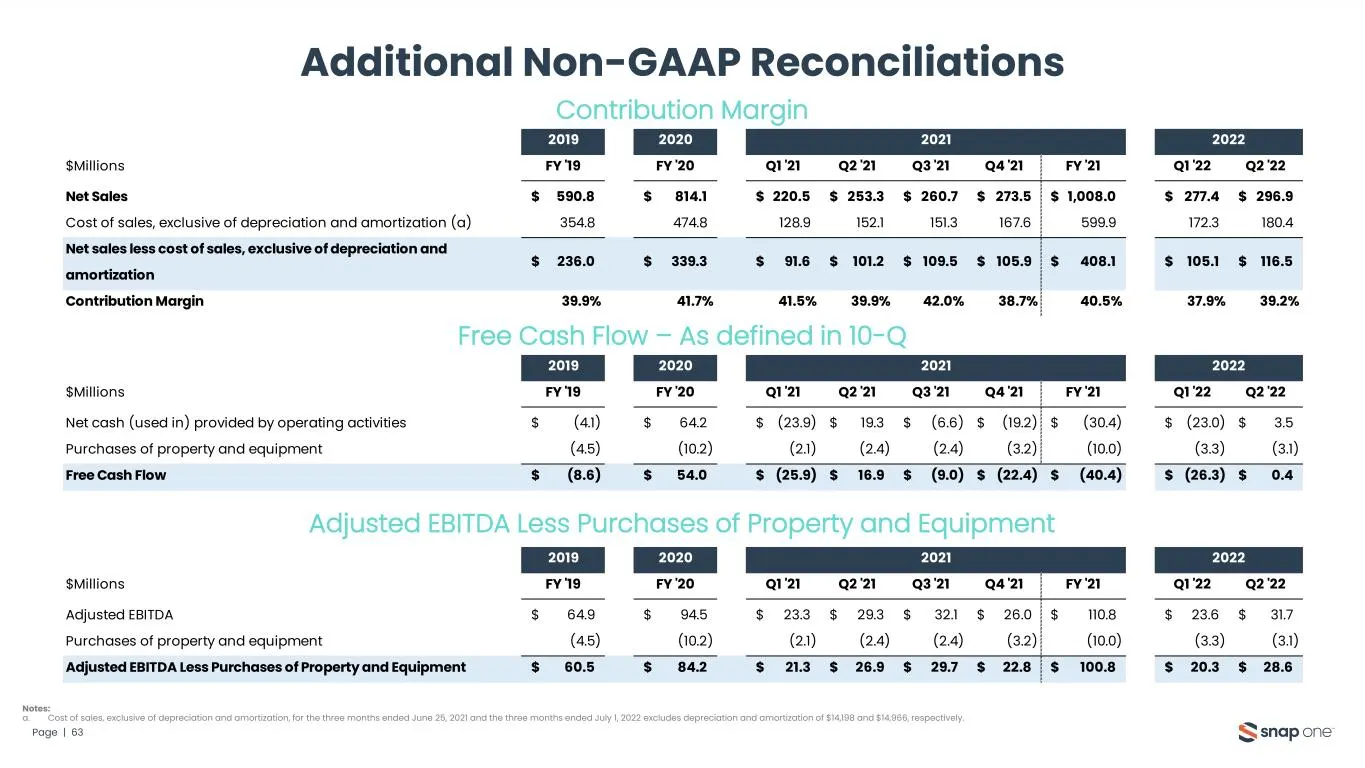
Slide 63: Additional Non-GAAP Reconciliations
Page | 63 Additional Non-GAAP Reconciliations Contribution Margin Free Cash Flow – As defined in 10-Q Notes: a. Cost of sales, exclusive of depreciation and amortization, for the three months ended June 25, 2021 and the three months ended July 1, 2022 excludes depreciation and amortization of $14,19
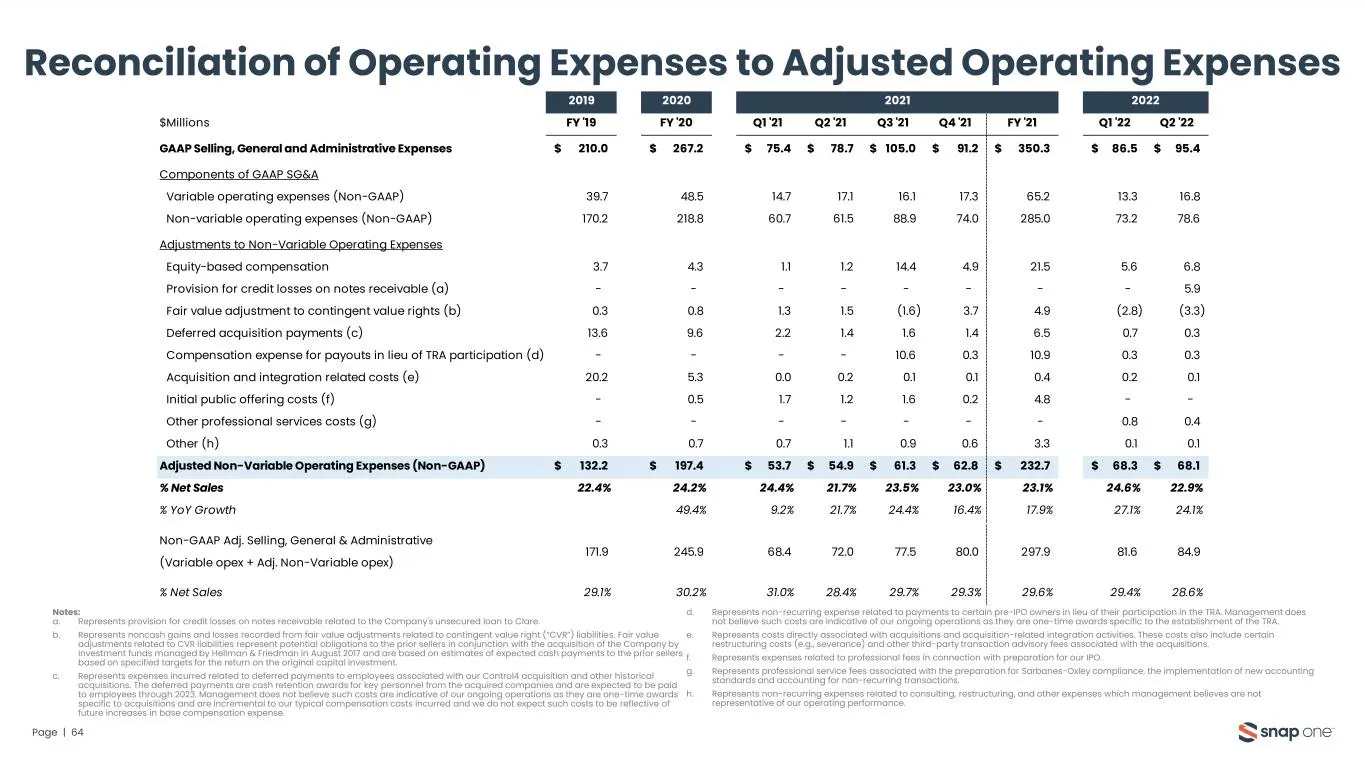
Slide 64: Reconciliation of Operating Expenses to Adjusted Operating Expenses
Page | 64 Reconciliation of Operating Expenses to Adjusted Operating Expenses Notes: a. Represents provision for credit losses on notes receivable related to the Company's unsecured loan to Clare. b. Represents noncash gains and losses recorded from fair value adjustments related to contingent value
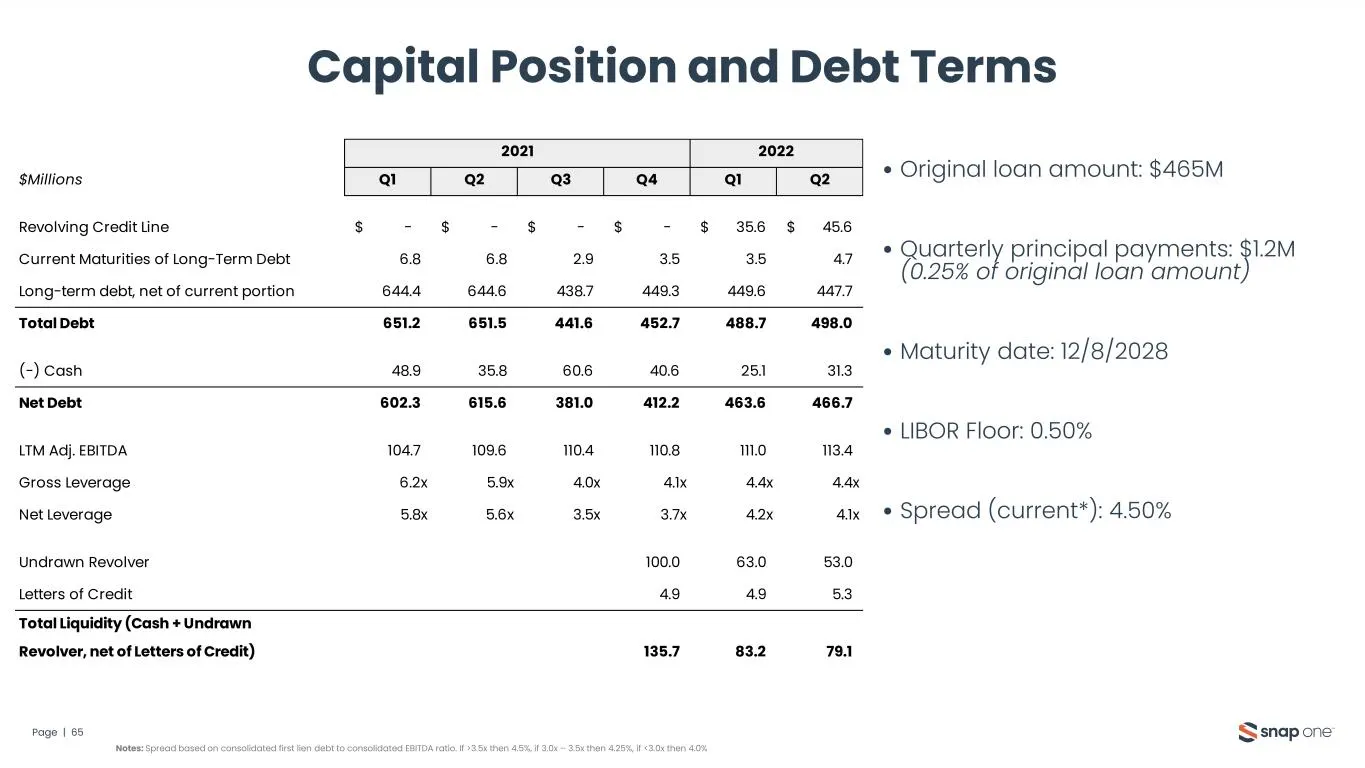
Slide 65: Capital Position and Debt Terms
Capital Position and Debt Terms Page | 65 • Original loan amount: $465M • Quarterly principal payments: $1.2M (0.25% of original loan amount) • Maturity date: 12/8/2028 • LIBOR Floor: 0.50% • Spread (current*): 4.50% Notes: Spread based on consolidated first lien debt to consolidated EBITDA ratio. I
Source: SEC EDGAR · 8-K filed Sep 14, 2022